1. Introduction
The significant interest in smart TiNi materials owes to the unique combination of their functional, strength, and plastic properties beneficial for engineering and medicine [
1,
2,
3,
4,
5,
6,
7,
8,
9,
10,
11,
12]. Their superelasticity (SE) and shape memory effect (SME) are provided by thermoelastic martensite transformations (MT) from a cubic B2 phase to a rhombohedral R or a monoclinic B19′ phase. When cooled and heated free of load or at low internal stress, such materials remain macroscopically invariant as their thermoelastic transformations result in a polyvariant system of self-accommodated martensite domains [
4], but when exposed to external or oriented internal stresses, they display superelasticity and shape memory. Shape memory allows a material to accumulate reversible inelastic strains at T
d < M
f (where T
d is the deformation temperature and M
f is the martensite finish temperature on cooling) and to recover them at above A
f (which is the austenite finish temperature on heating). Superelasticity allows a material to change its macroscopic shape or linear dimensions through direct B2 → B19′ or B2 → R → B19′ transformations under external stress (tension, torsion, bending) at T > A
f and to take it back through inelastic strain recovery under subsequent isothermal unloading (because no martensite free of load can exist at this temperature). In both cases, the reversible inelastic strain can reach 6–8%. The inelastic strain, whether from SE or SME, depends largely on the crystallography limit of the recoverable strain whose value in TiNi-based alloys measures, on average, 11% [
13,
14,
15].
However, reversible inelastic strains 1.5–2 times higher than the above limit have been found in TiNi-based alloys [
16,
17,
18,
19,
20,
21,
22,
23] after bending [
15,
16,
17,
18,
20], torsion [
20,
21,
22,
23], and tension [
19], with the total strain comprising an inelastic and a plastic component. For example, a reversible inelastic strain of up to 18% is attainable in Ti
49.3Ni
50.7 (at%) after torsion at T < M
f against a high (12%) plastic strain [
23]. Its recovery is stepwise: via SE under unloading at T
d and via SME under further heating above the finish temperature of B19′ → B2 MT.
In one of the cited studies [
16], Ti
49.3Ni
50.7 (at%) specimens differing in structure were bent to a total strain of 15% and were then kept constrained at 310 K (to prevent shape recovery), cooled to 77 K with keeping at this temperature for 30 s, and unloaded with further heating to room temperature. In nanocrystalline Ti
49.3Ni
50.7 (at%) (grain size 30–70 nm), the total strain was recovered completely so that 7.5% fell on SE and 7.5% on SME. In Ti
49.3Ni
50.7 (at%) with a mixed structure (nanocrystalline, subgrain), the strain recovery via SME was 14.8% against 0.2% of plastic strain, and in its specimens with microcrystalline structure (maximum grain size 10 µm), the SME value was 10% against up to 5% of plastic strain and zero SE.
In another study [
17], Ti
50Ni
50 (at%) specimens annealed after cold drawing were bent at 5 K above A
f with further keeping at this temperature for 30 s, cooling in their constrained state to 273 K, and keeping at this temperature for 30 s. Thereafter, estimates of their strain recovery were taken under unloading (SE, including small elastic strain) and under further heating to 373 K (SME). The plastic strain is the residual one at 373 K. In Ti
50Ni
50 (at%) with a polygonized B2 substructure (annealing at 623 K for 1 h, subgrain size ≤ 200 nm), the strain recovery via SE and SME at a total strain of 18% measured 10.3% and 7.6%, respectively, against 0.1% of plastic strain; the total inelastic strain was 17.9%. In Ti
50Ni
50 (at%) with a polygonized B2 substructure comprising individual recrystallized grains of up to 3 μm (annealing at 723 K for 1 h), the strain recovery via SE and SME at the same total strain measured 7.2% and 8%, respectively, against 2.8% of plastic strain; the total inelastic strain reached 15.2%.
Thus, it is still unclear what conditions can bring the reversible inelastic strain in TiNi materials to above their theoretical limit. Clarifying this issue needs additional studies of TiNi alloys differing in chemical composition, structure (grain-subgrain size), and phase state. Here, we analyze the behavior of inelastic and plastic strains in coarse-grained Ti49.3Ni50.7 (at%) deformed at Td > Af.
2. Materials and Methods
The test material was Ti49.3Ni50.7 (at%) supplied as hot-swaged bars of diameter 30 mm (Matek-Sma Ltd., Moscow, Russia). The bars were spark cut into specimens (cross-sectional area ~1 mm2, gage length ~10 mm), rinsed in ethanol, grinded with an abrasive and diamond paste, and electrolytically polished with plane stainless steel electrodes in a cold CH3COOH/HClO4 solution (75/25 vol%) at a voltage of 12–17 V for 10–15 s. For further structural analysis, they were chemically etched in a HNO3/HF/H2O mixture (14/4/82 vol%) for 15 s.
Their structure and phase state were analyzed on a DRON-7 diffractometer in Co-Kα radiation (Bourevestnik JSC, Saint-Petersburg, Russia) and on an AXIOVERT-200 MAT optical microscope (Carl Zeiss AG, Oberkochen, Germany). According to the analysis, the specimens at room temperature were in the state of a high-temperature B2 phase (CsCl superstructure) with less than 5 vol% of Ti4Ni2(O,N,C,H)x. The average grain size was 53 ± 11 μm. The deformation-induced surface microrelief after torsion were studied by scanning electron microscopy LEO EVO 50XVP (Carl Zeiss AG, Oberkochen, Germany). These studies were conducted using the equipment of Nanotech shared Use Center of ISPMS SB RAS.
The temperatures and sequence of martensite transformations were determined by temperature resistometry (ρ(T) measurements). On cooling and heating, the specimens experienced martensite transformations B2 ↔ B19′. The start and finish temperatures of B2 → B19′ MT are MS = 252 K, Mf = 223 K. The start and finish temperatures of B19′ → B2 MT are AS = 258 K, Af = 273 K.
The inelastic and plastic strains in the material were studied on an inverted torsion pendulum with an operating temperature of 573–120 K. The τ–γ dependences in isothermal loading–unloading cycles, and the inelastic strain recovery on further heating to 500 K (227 K above Af) of unloaded specimens were obtained. In each cycle, the total strain γt was successively increased up to fracture. The temperature of loading–unloading cycles was 281, 299, 309, 315, and 339 K, i.e., Td was above Af and specimens were in the B2 state.
All components of the total strain γ
t were determined. The total strain is the sum of inelastic and plastic strains: γ
t = γ
SID + γ
pl. The total inelastic strain is γ
SID = γ
SE + γ
SME, where the summands stand for inelastic strains recovered via superelasticity, γ
SE, under isothermal unloading (including a small Hook strain of ~1.5%) and via shape memory, γ
SME, under further heating to complete shape recovery (via B19′ → B2 transformation). In more detail, the total inelastic strain has the form:
where γ
r is the residual strain after isothermal unloading (295 K), and γ
t, γ
r, and γ
pl are equal to arctgS
t, arctgS
r, and arctgS
pl, with S
t = (rφ
t)/l; S
r = (rφ
r)/l; and S
pl = (rφ
pl)/l; having r and l for the specimen cross-section radius and gage length and φ
t, φ
r, and φ
pl for the torsion angles in radians after loading, unloading, and heating to 500 K, respectively. The plastic strain γ
pl is equal to the residual strain at 500 K. The γ
t, γ
r, γ
pl, γ
SE and γ
SME strains are presented in
Figure 1. The measurement error for the quantities depended on the total strain, and at γ
t = 36.6%, it was Δγ
t = 0.3%, Δγ
SE = 0.4%, Δγ
SME = 0.4%, and Δγ
pl = 0.2%.
3. Results
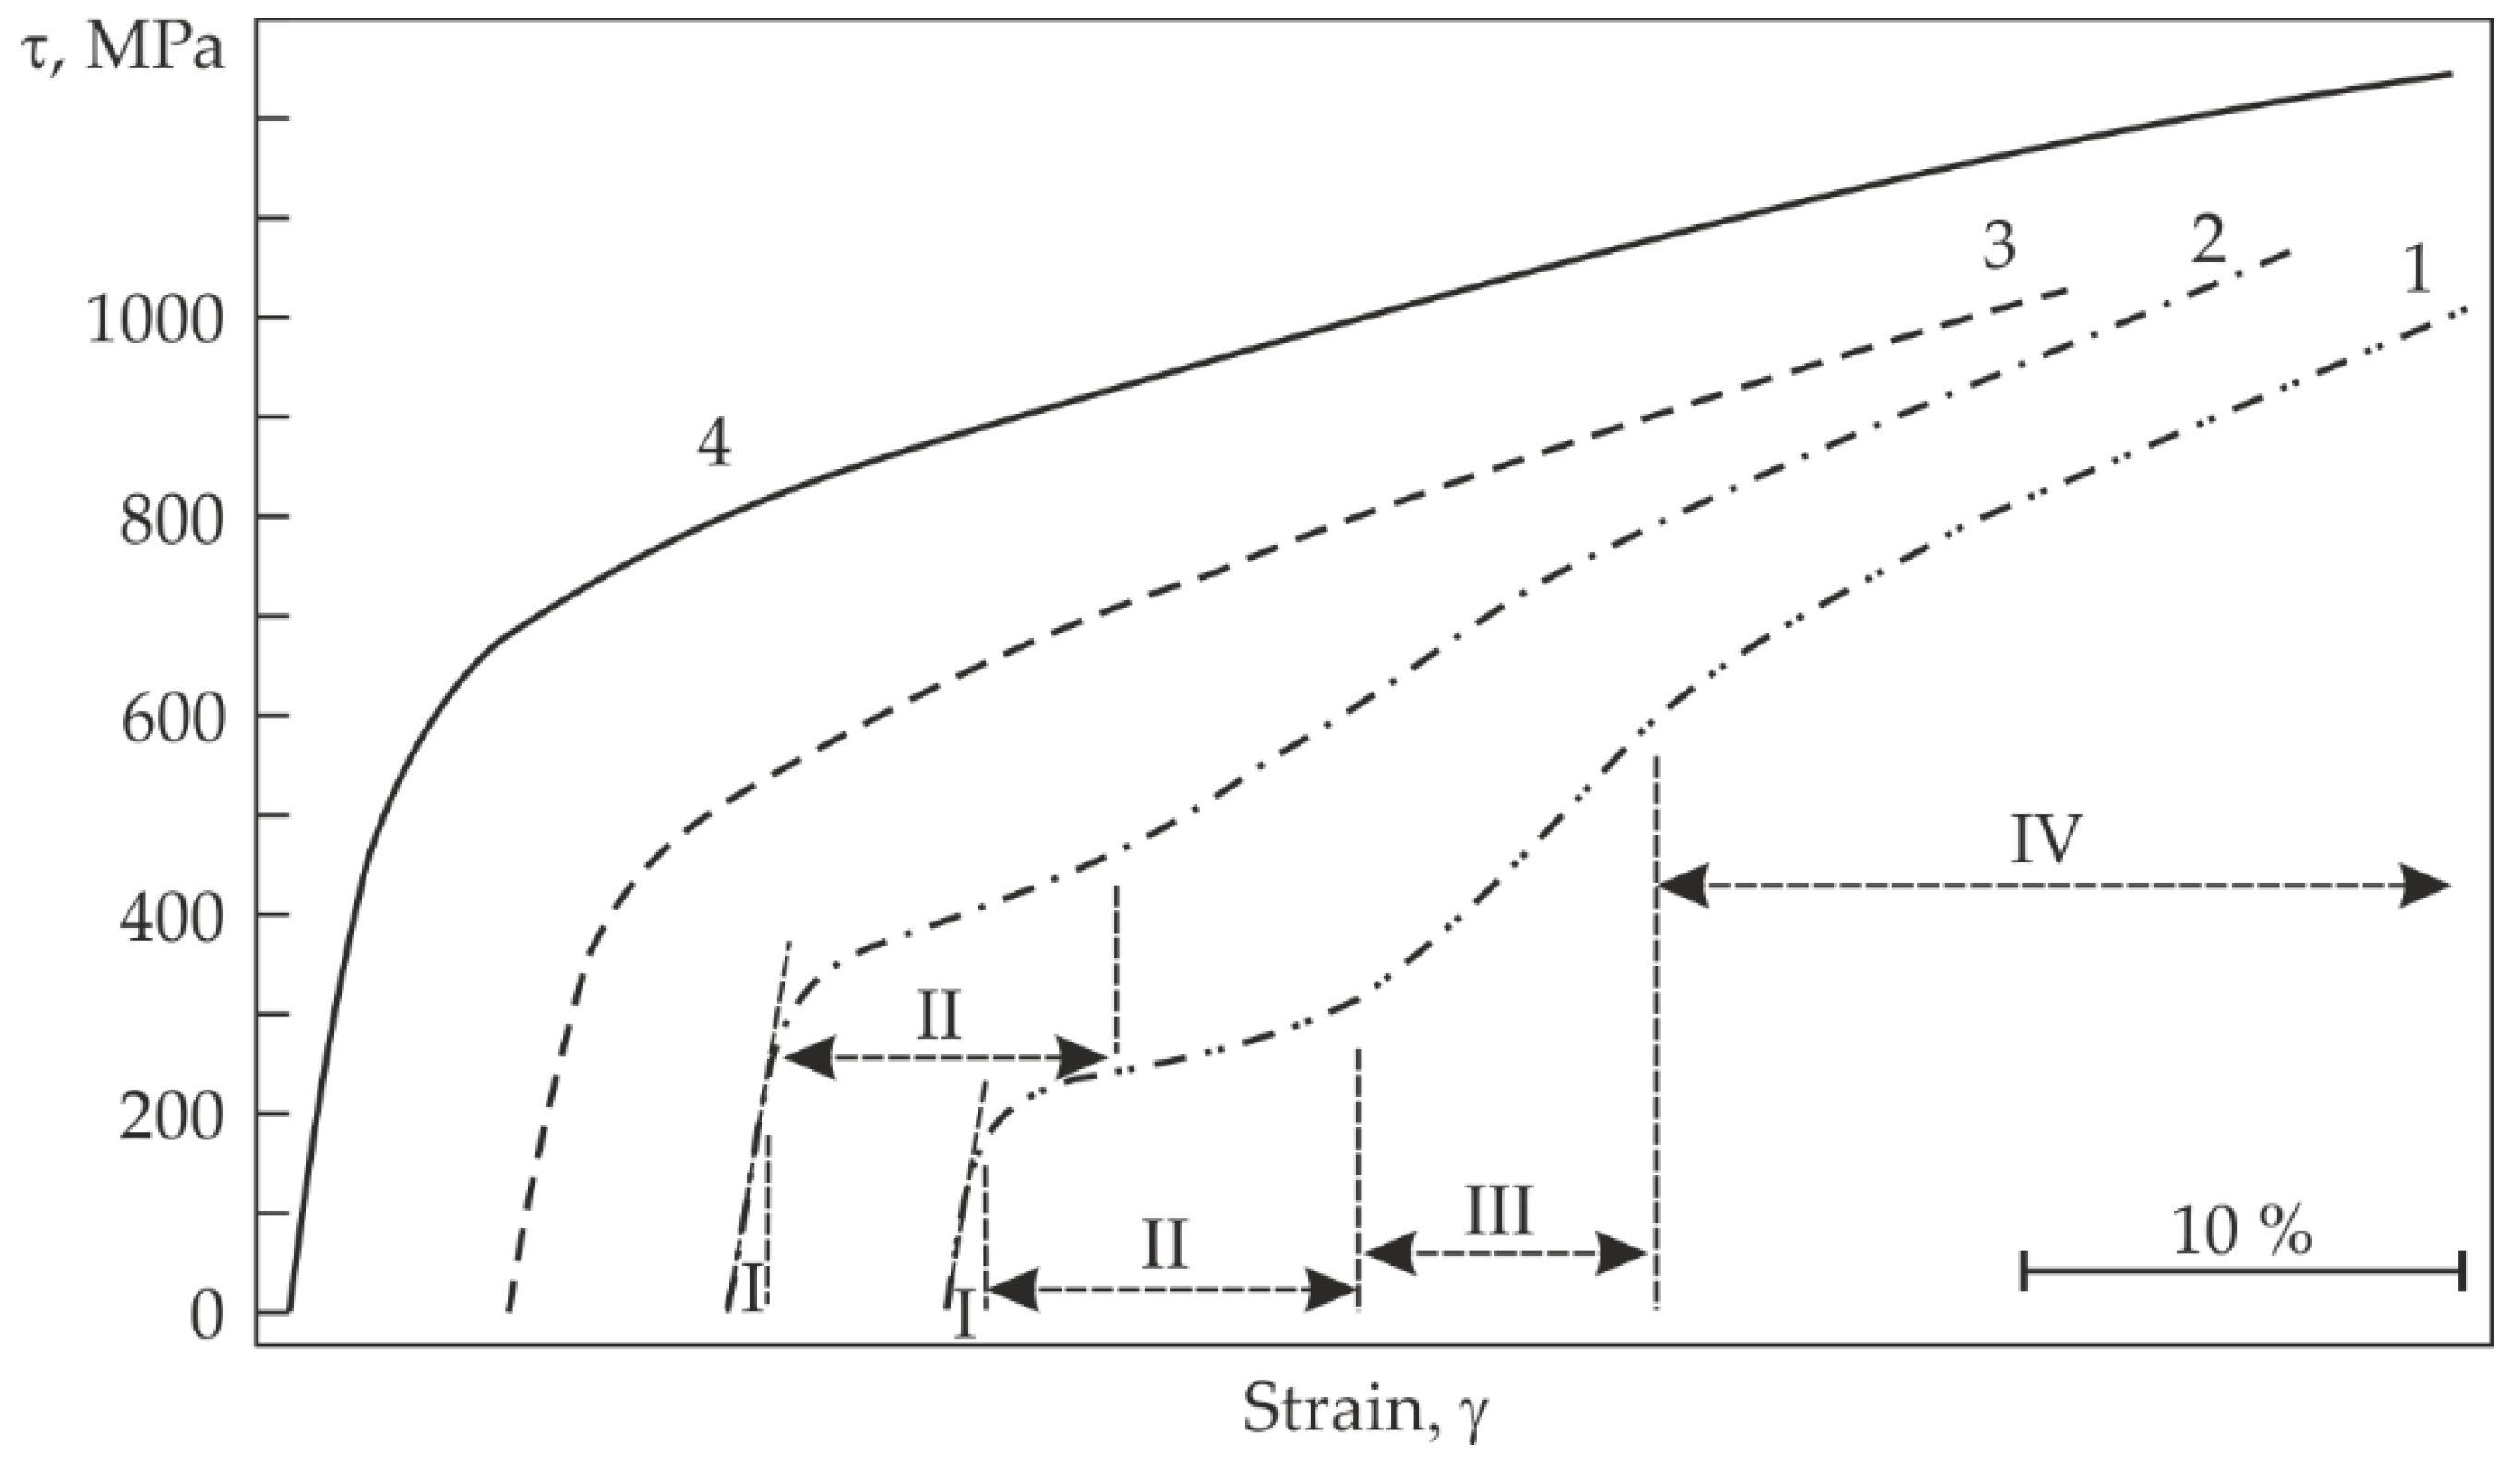
Figure 2 shows the τ–γ dependences of Ti
49.3Ni
50.7 (at%) in loading-unloading cycles at 281, 299, 309, and 339 K. As can be seen, the dependences at 281 and 299 K reveal four deformation stages. Stage I is quasi-elastic and its strain increases linearly as the applied stress is increased. At τ = τ
m (martensite shear stress), stage I passes into stage II, at which the strain increment is large while the external stress build-up is comparatively small. Stage II represents a so-called pseudo-yield plateau which ends, in our case, at about γ
t = 8%. Obviously, at 281 and 299 K (
Figure 2, curves 1, 2), the pseudo-yield plateau results from the generation of B19′ martensite under loading [
4,
13]. Stage II is followed by stage III, at which γ
t increases almost linearly from 8% to 18–20% as τ is increased from ~450 to 800 MPa. Stage III represents strain hardening, which passes into active plastic flow at stage IV. From
Figure 2, it is seen that when deformed at 309 K (curve 3) and 339 K (curve 4), the material shows no pseudo-yield plateau and its quasi-elastic stage passes directly into parabolic flow.
Figure 3 and
Figure 4 show the τ−γ dependences of Ti
49.3Ni
50.7·(at%) in loading–unloading cycles with successively increasing γ
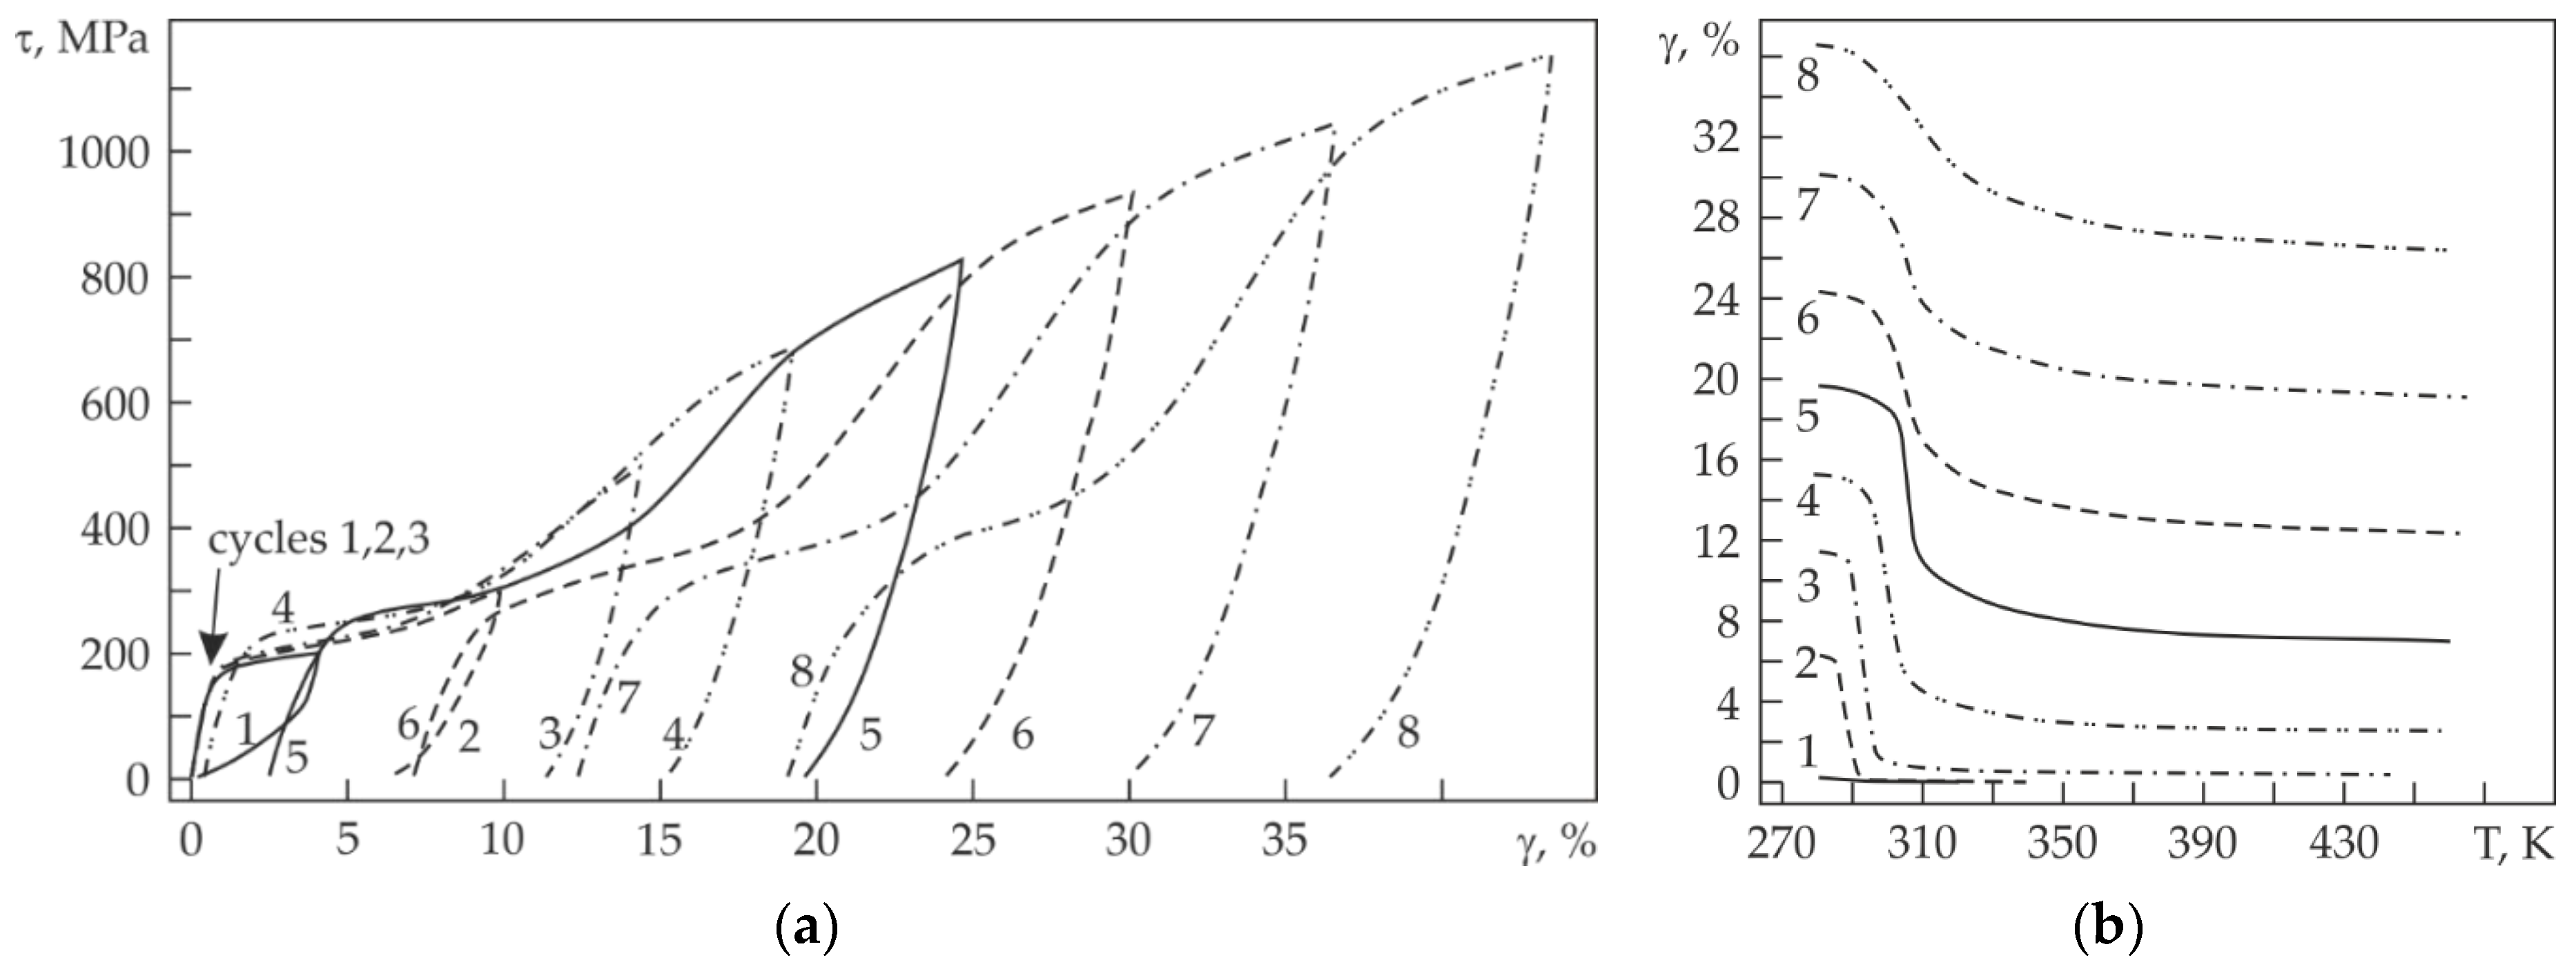
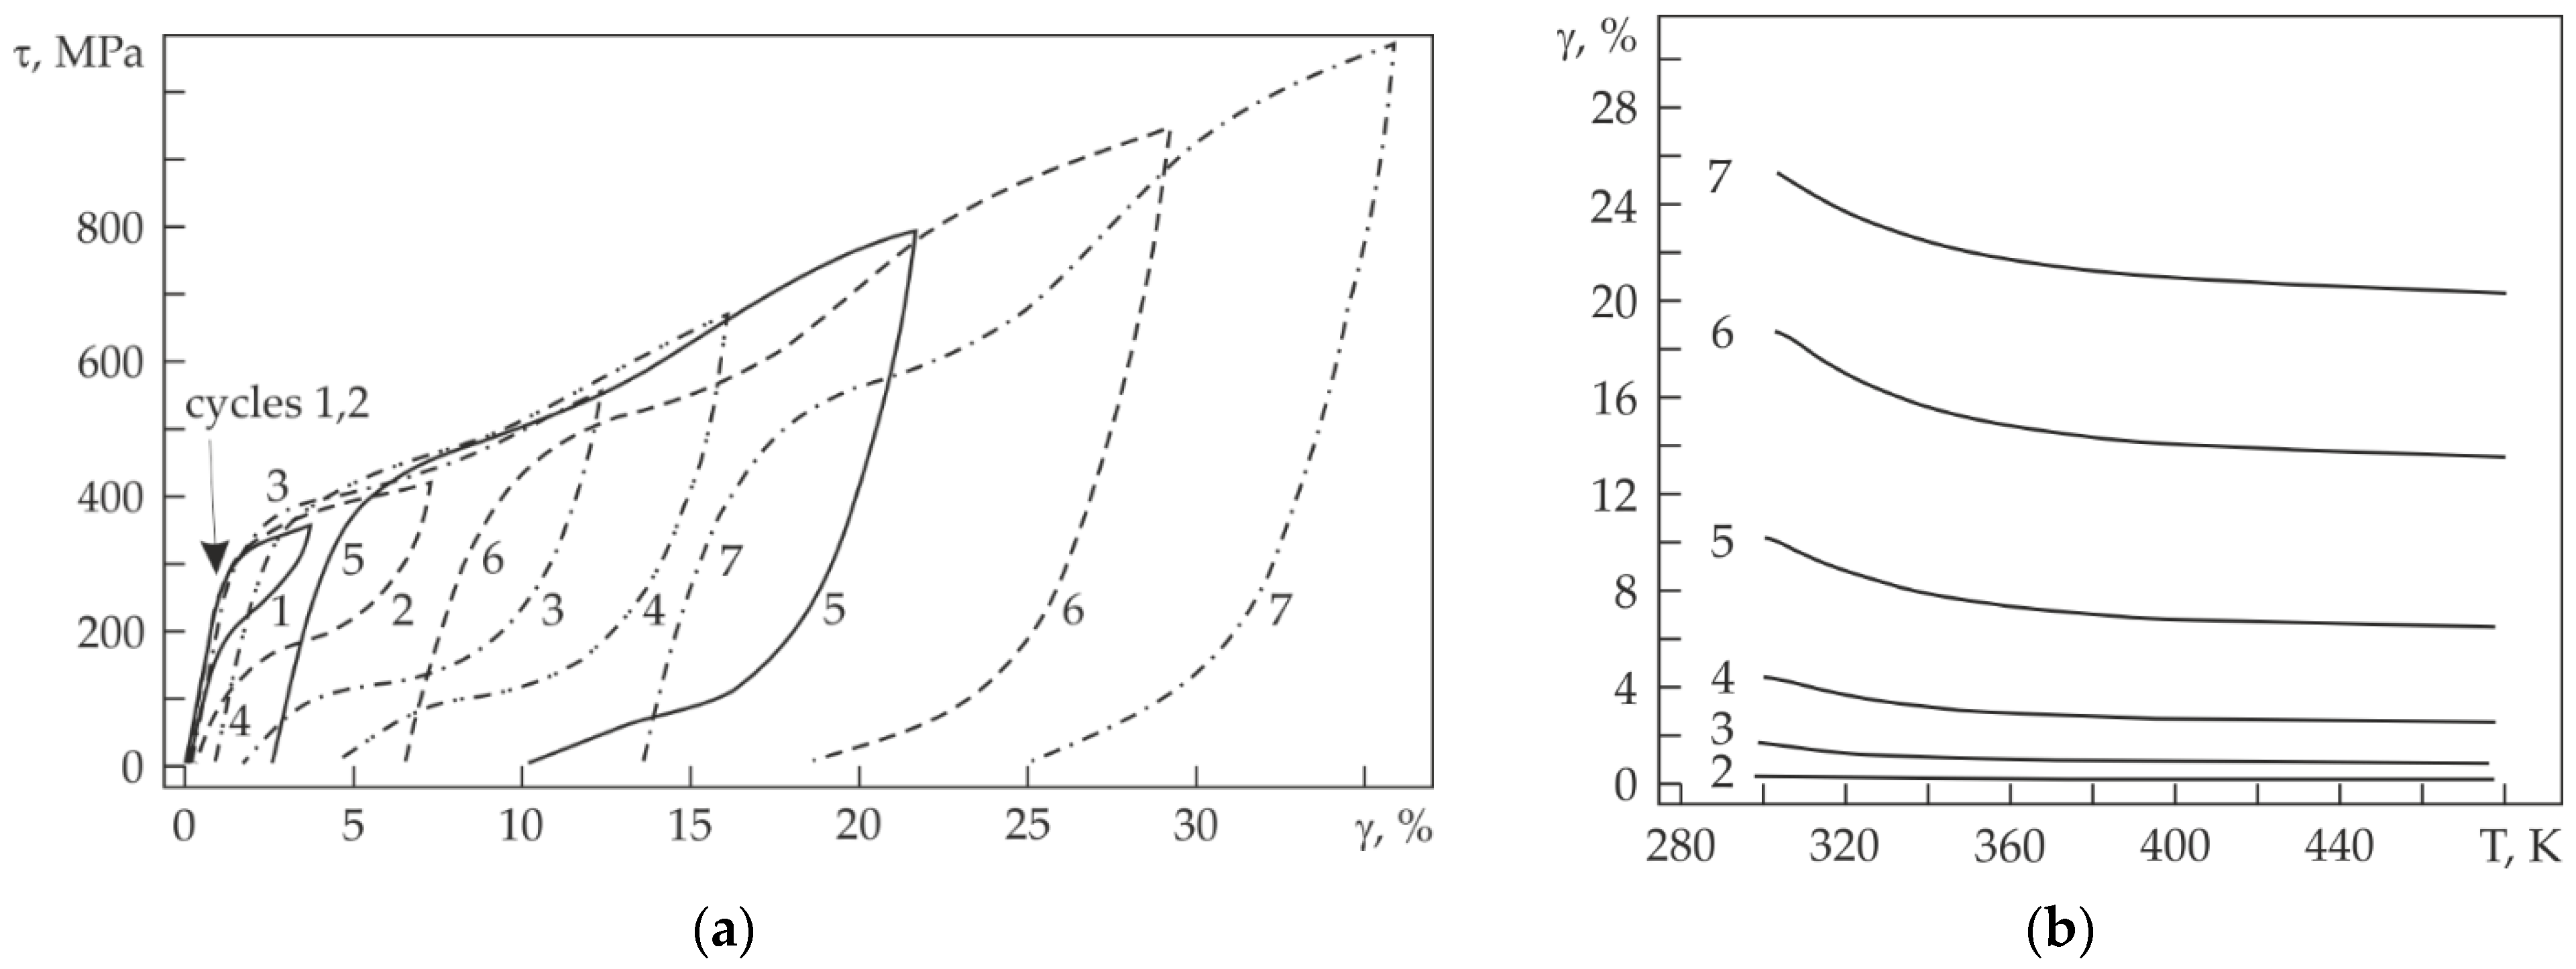
t and its inelastic strain recovery on further heating at different test temperatures. From
Figure 3a, it is seen that as the number of loading–unloading cycles with T
d = 281 K is increased, the martensite shear stress τ
m grows and the extent of the pseudo-yield plateau first increases, then decreases (after the fifth cycle). It should be noted that the martensite shear stress τ
m increases from 180 MPa in the first loading–unloading cycle to 380 MPa in the seventh one. After the first loading–unloading cycle with γ
t = 4.1%, the strain recovery via superelasticity (under unloading) was 3.9%, and via shape memory (at heating), it was 0.2%. Although T
d was higher than A
f by about 8 K, the SE value in the next isothermal τ−γ cycles was low compared to γ
t. Even after the second cycle with γ
t = 9.9%, the SE value was γ
SE = 3.6% against γ
SME = 6.3% (
Figure 3a), and no plastic component was detected within the measurement error. After the third cycle with γ
t = 14.4%, the SE and SME values were γ
SE = 3.0% and γ
SME = 11.0% against γ
pl = 0.4% (
Figure 3b). As the number of loading–unloading–heating cycles was further increased, γ
SE increased monotonically. The γ
SME value first increased and then decreased, and γ
pl became larger (
Figure 3b).
From
Figure 4a it is seen that at T
d = 299 K (26 K above A
f), the first two loading–unloading cycles with increasing γ
t result in flag-shaped τ−γ dependences characteristic of superelasticity so that the total strain is fully recovered after unloading. It should be noted that all loading–unloading cycles at this temperature are dominated by the SE effect. After the first cycle with γ
t = 3.7%, γ
SE = 3.6%, and after the second cycle with γ
t = 7.3%, its value is γ
SE = 6.9%, i.e., almost the whole strain is recovered under unloading. After the third cycle, γ
SE is equal to about 10.6%, but some strain remains unrecovered under unloading. As the number of loading–unloading cycles as well as the total strain is further increased, γ
SE varies little. It should be noted that at T
d = 299 K, compared to T
d = 281 K, the SE effect is much more pronounced and the SME value γ
SME on heating is small (
Figure 4b). It should also be noted that after the third loading–unloading cycle with up to γ
t = 12.3%, the strain is mostly inelastic and almost completely recovered via SE and SME under unloading and heating, respectively. However, in the next cycles, the plastic strain component steeply increases. Noteworthy also is that the pseudo-yield plateau at T
d = 299 K is poorly detectable in all loading–unloading cycles (
Figure 4a).
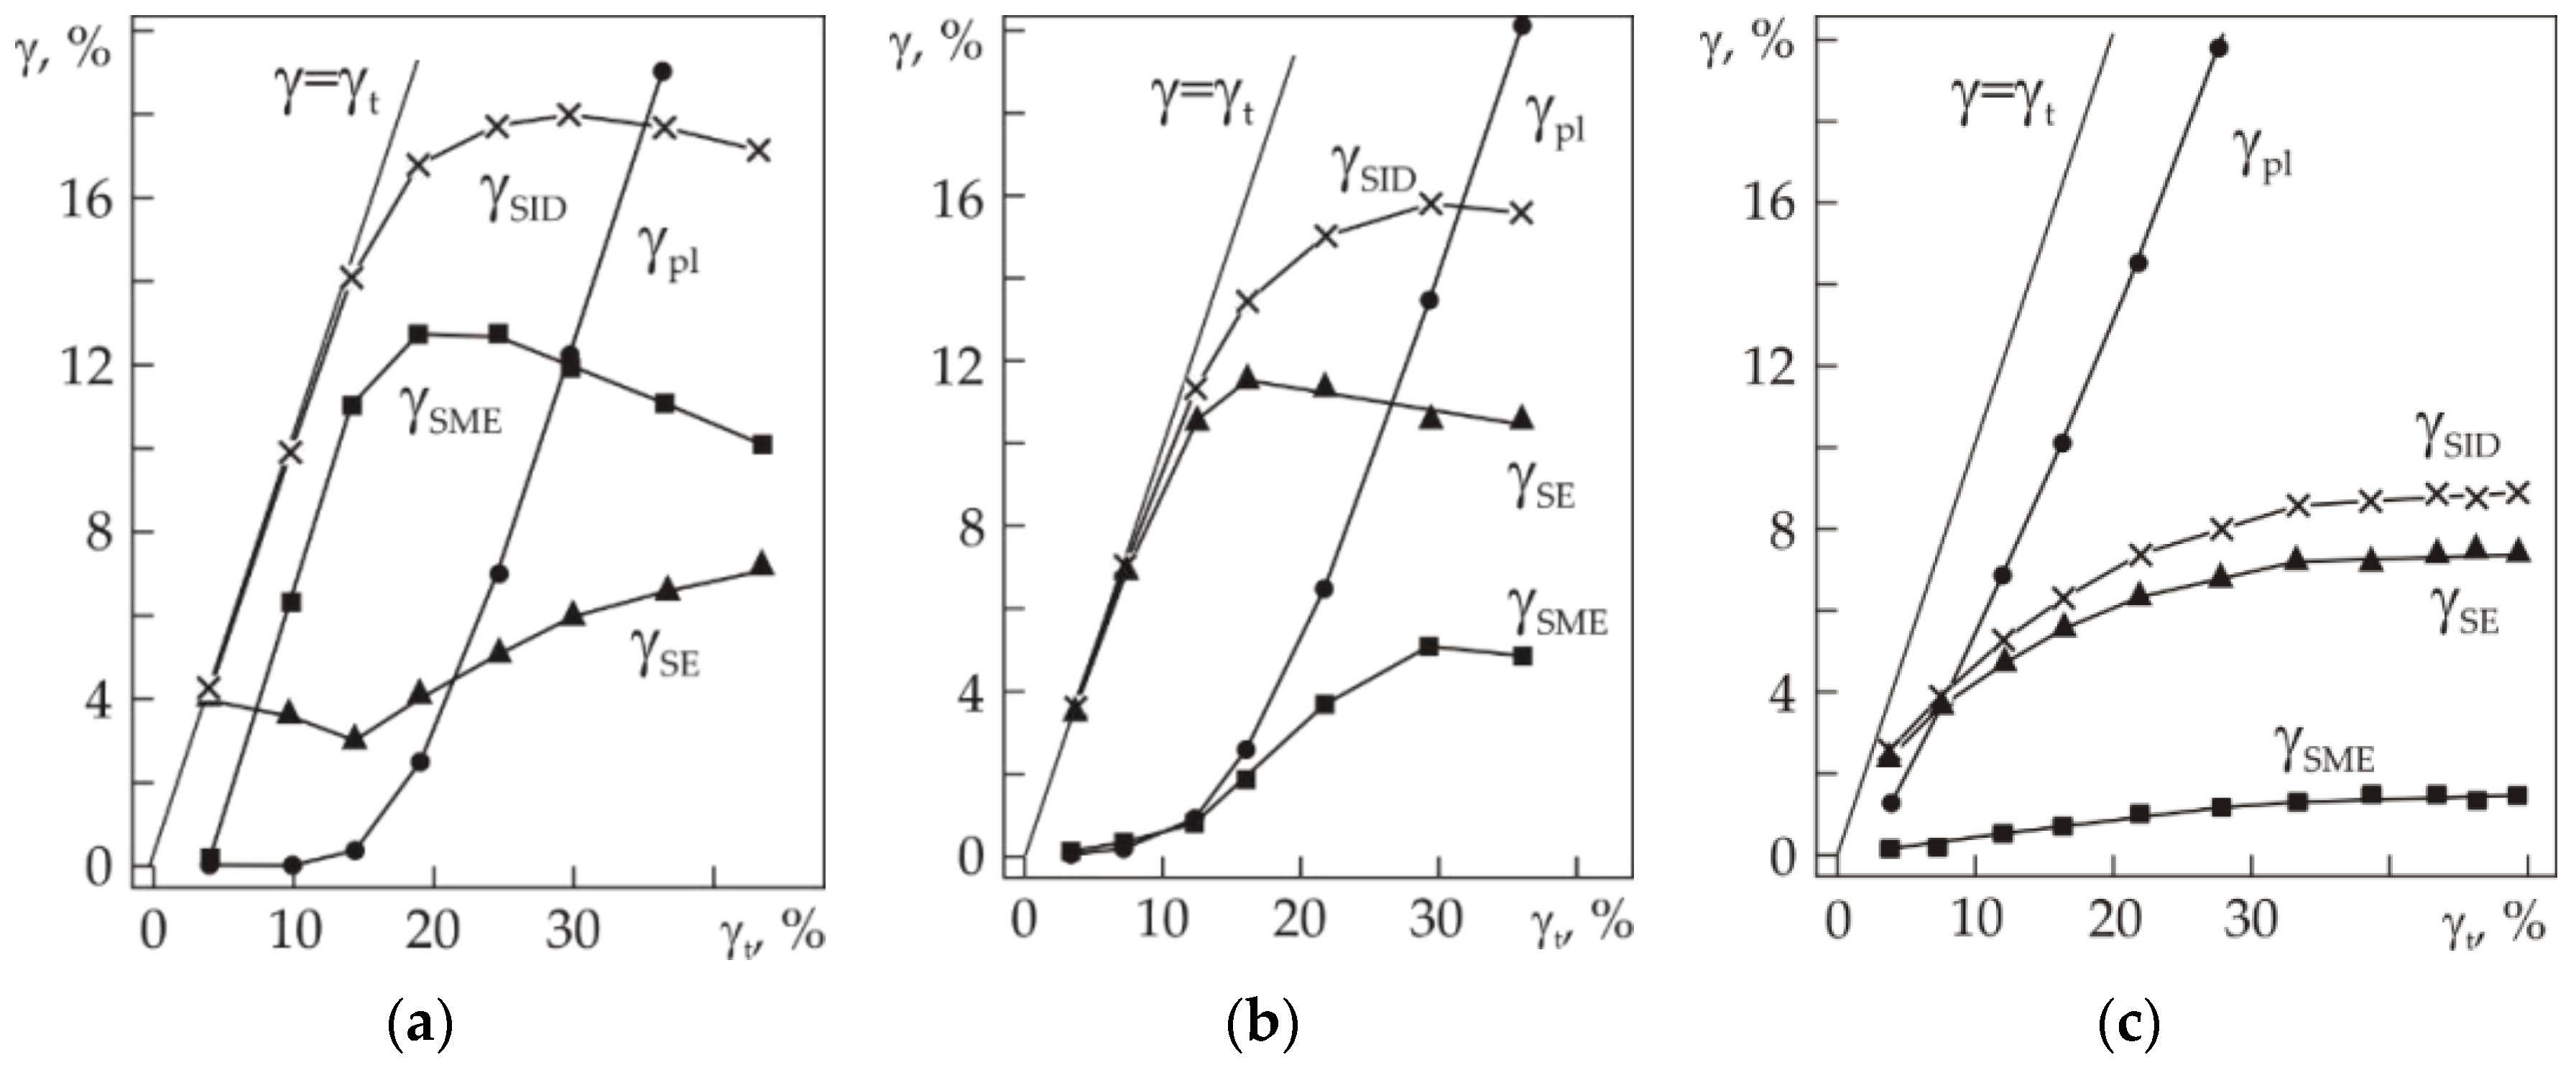
Figure 5 shows the γ
t dependences of γ
SID, γ
SE, and γ
SME at different temperatures of isothermal τ−γ cycles. It is seen that at 281 K, γ
SME reaches 12.7% (
Figure 5a). At the same time, the temperature interval of shape recovery is narrow on heating, spanning from 285 to 310 K (
Figure 3b). Note that at all temperatures of isothermal loading–unloading cycles, except for T
d = 281 K, the γ
t dependences of γ
SID, γ
SE, and γ
SME are qualitatively similar: as γ
t is increased, these quantities first reach a maximum and then decrease. The γ
t strains at which γ
SID, γ
SE, and γ
SME reach their maximum values differ but fall on the stage of active plastic strain accumulation (
Figure 5).
4. Discussion
Certainly, at first glance, it is rather strange that the total strain measuring about a mere 4.1% at 281 K (8 K above A
f) results in an SME of 0.2% (
Figure 3b). With such a small total strain at 281 K, one would expect its complete recovery via SE after unloading [
24]. Moreover, after the second loading–unloading cycle with γ
t = 9.9%, the SE value decreases to 3.6% against 3.9% after the first cycle, whereas the SME value increases from 0.2% in the first cycle to 6.3% in the second one (
Figure 3b). Although no plastic strain is found in the second loading–unloading cycle, the rise of SME after the first and second cycles at 8 K above A
f is most likely due to the generation of dislocations at the interfaces of B2 and B19′ phases under internal stress, which results from their lattice misfit [
25]. It has been known that as the temperature of TiNi-based alloys is decreased and brought to about M
S, their elastic constants C′ and C
44 decrease greatly [
26,
27,
28], and the decrease in the elastic constants should decrease the martensite shear stress in this temperature range. It should be noted that at T
d > A
f in the temperature range of decreased elastic constants, the recovery of inelastic strains via SE at comparatively low external stresses can be incomplete due to the rise of small plastic strains lying within 0.3%. The stabilization of martensite B19′ caused by the development of plastic microdeformations as a result of the appearance of dislocations at small, specified strains in binary alloys with ~50 and 50.8 at% Ni was observed in [
29,
30,
31]. The generation of lattice defects and, primarily, dislocations during plastic deformation and martensite transformations impedes the recovery of inelastic strains via SE and can even block this process. On heating after unloading, the recovery is contributed to by SME. Thus, it is reasonable to suggest that the rise of SME in the test material after the first and second loading–unloading cycles at 281 K, which is 8 K higher than A
f, is due to dislocation generation at comparatively low stresses. When the temperature is increased to 299 K, the strain recovery after the second cycle with γ
t = 7.2% measures 6.9% via SE and only 0.1% via SME against 0.2% of plastic strain (
Figure 4 and
Figure 5b). In addition, the analysis of experimental data shows that increasing T
d from 309 to 339 K leads to a decrease in γ
SE from 6% to 4% in isothermal cycles τ–γ with γ
t ≈ 7%. At the same time, the residual deformation increases from 1% to 3% after isothermal unloading of samples. Hence, the temperature interval of manifestation of superelasticity (4–7% and practically without residual deformation) is very narrow and localized from 281 K (A
f + 8 K) to 299 K (A
f + 26 K).
The fact that in loading–unloading cycles at T
d ≥ 309 K, the SE and the SME value decreases and the plastic component steeply increases, is explained by the deformation temperature approaching M
d, at which no B2 → B19′ transformation is possible in the material under applied stress. The higher the temperature of isothermal loading–unloading cycles, the lower the total inelastic strain γ
SID and the higher the plastic component γ
pl (
Figure 5). In this work, we did not investigate the nature of the development of reversible and plastic strains during torsion of the samples (nonhomogeneous or homogeneous [
32]). At the same time, it was shown in [
31] that the plastic strain develops by dislocation sliding and twinning in an alloy of close composition (50.8 at% Ni) with an average grain size of 500 nm.
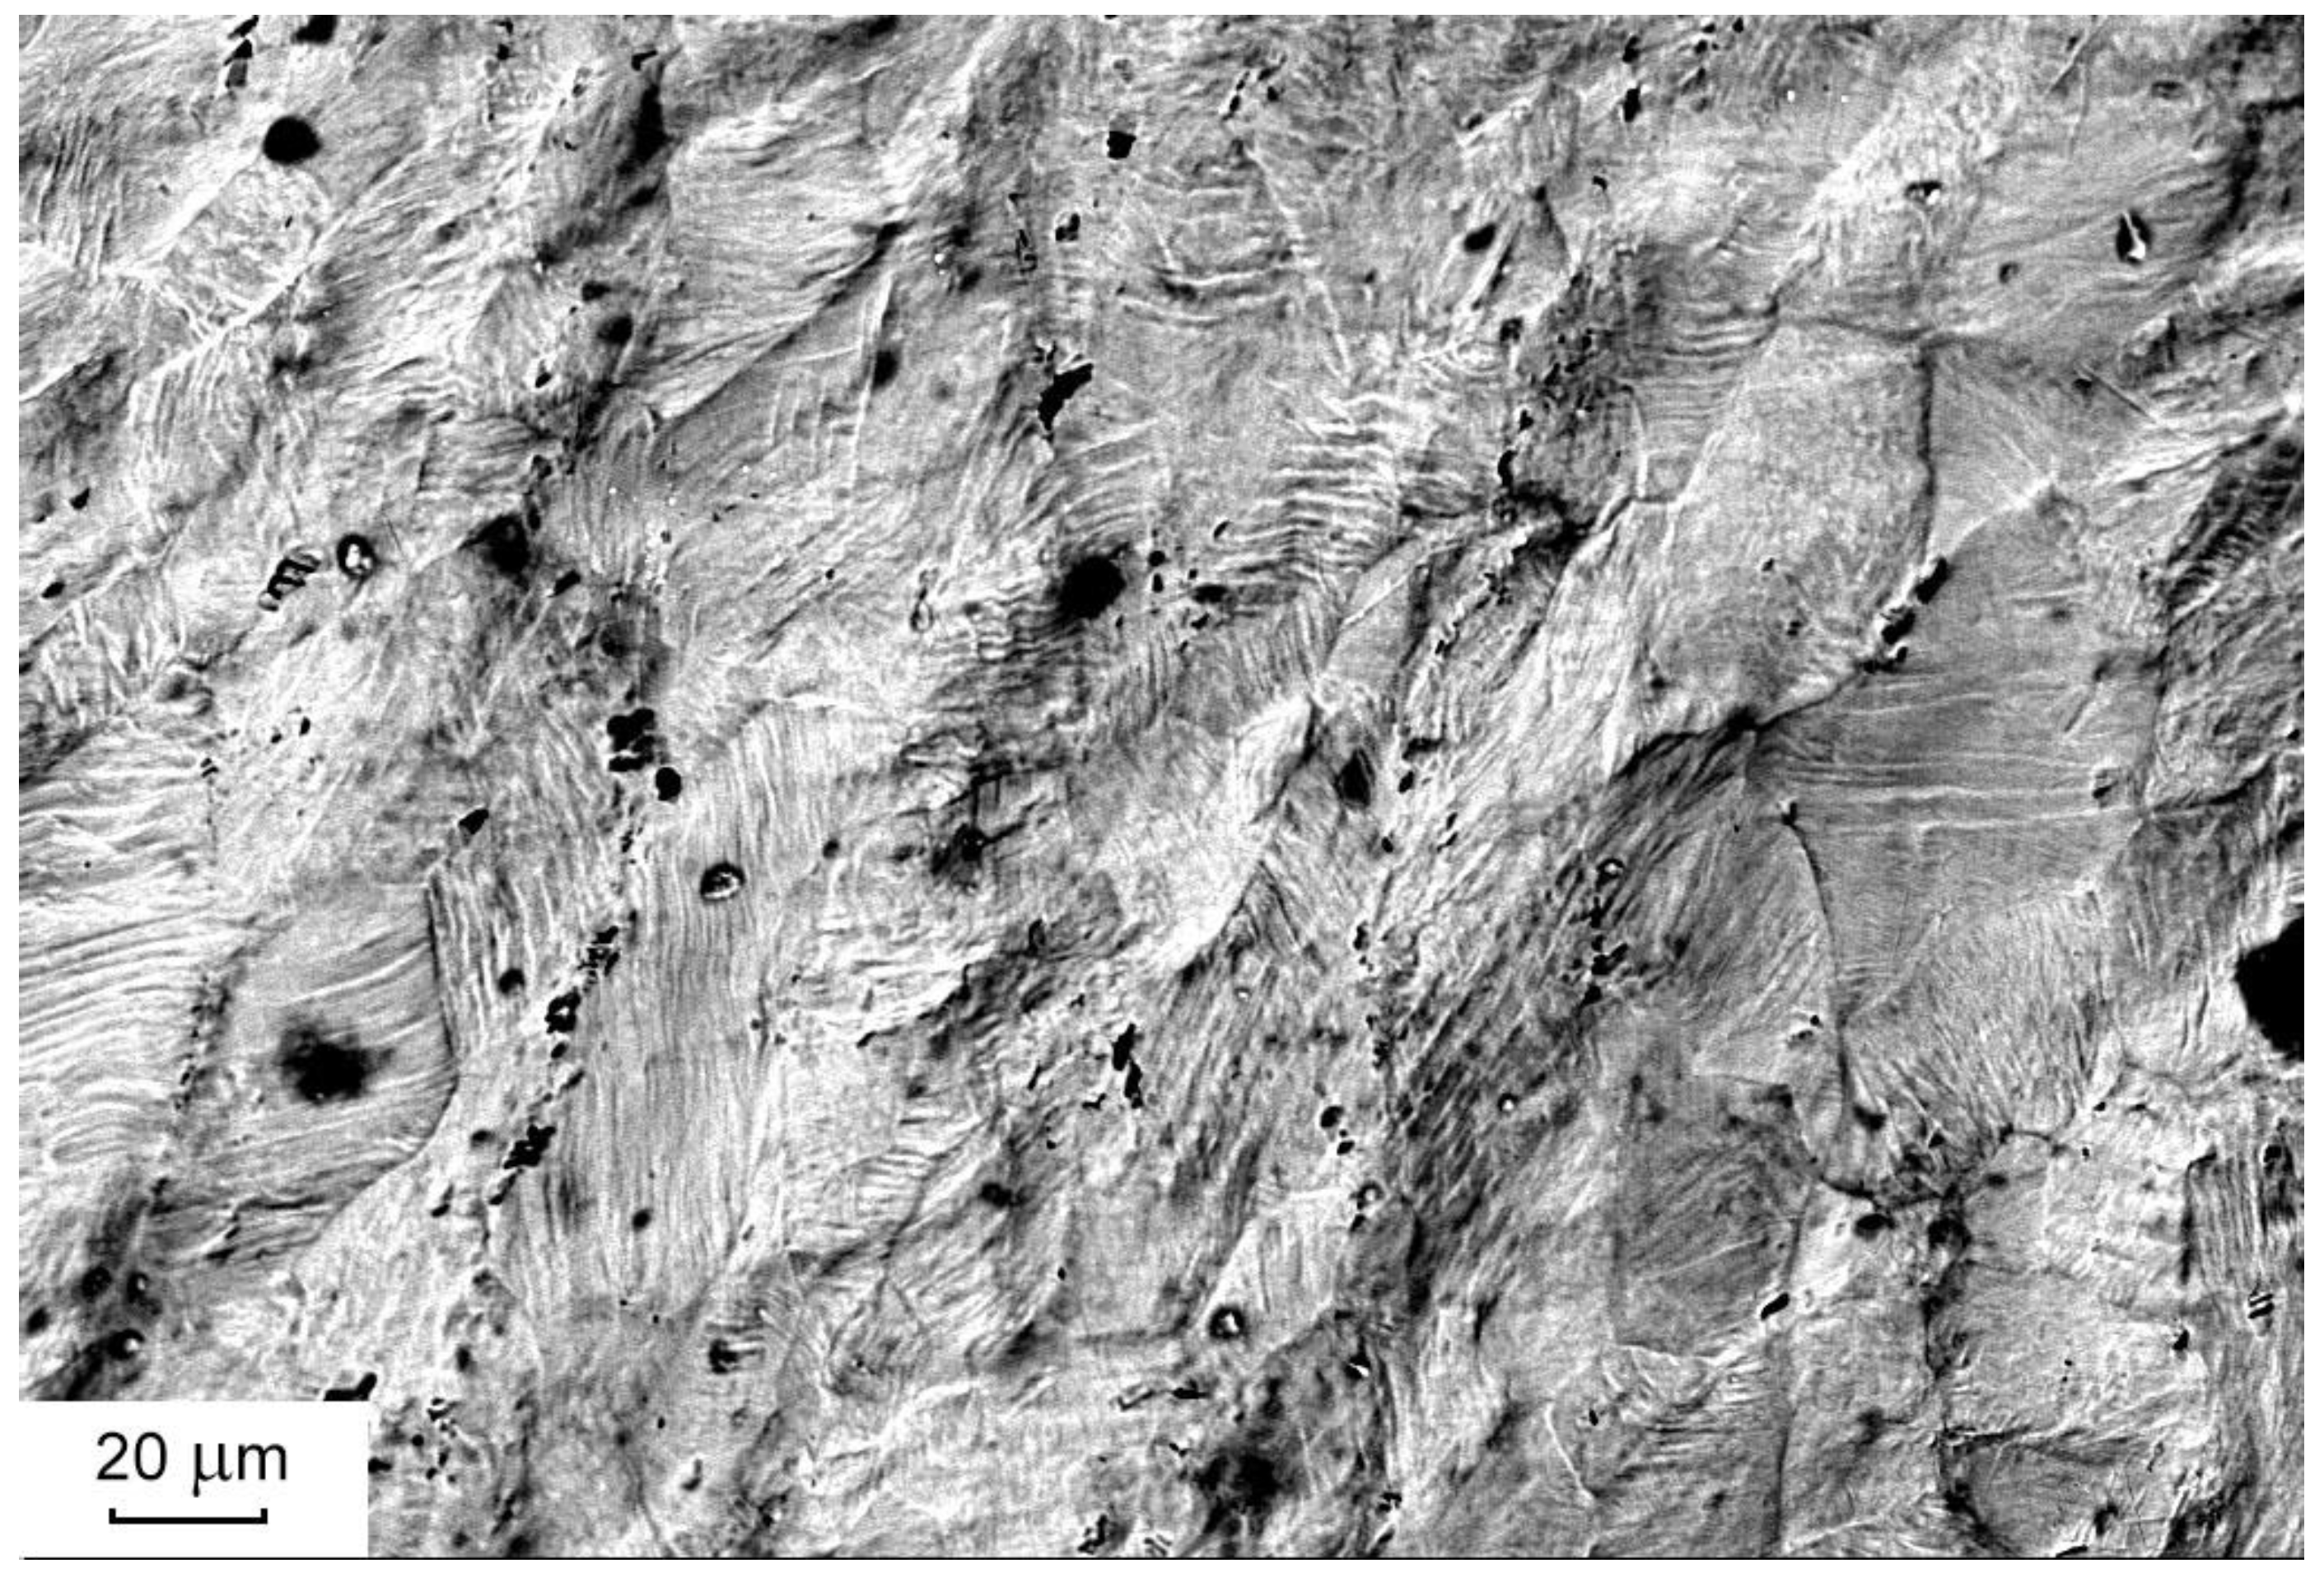
Plastic deformation accumulated during torsion causes the appearance of deformation microrelief on the original polished surface of the samples.
Figure 6 shows the specimen surface microrelief after torsion at 299 K. Dependences of inelastic deformations γ
SE, γ
SME, γ
SID and plastic deformation γ
pl on a total γ
pl were presented in
Figure 6. The surface microrelief image was obtained after the final cycle τ–γ with γ
t = 38%, heating the unloaded sample to 500 K and subsequent cooling to 299 K. The sample after cooling had a B2 phase structure. Plastic deformation γ
pl ≈ 20%,
Figure 5c.
Figure 6 clearly shows large deformation fragments with an intense microband structure within them. The average size of the large fragments, estimated from three similar images, is 46 ± 5 μm. This value correlates well with the average size of the original grains (53 ± 11 μm). Similar deformation fragments with sizes equal to those of the original grains arise as a result of mutual reversals and displacements of neighboring grains relative to each other during tensile plastic deformation of various materials not undergoing martensitic transformations: for example, aluminum-based alloy (Al 1100-0 [
33], Al-Mg [
34], AA-6022 [
35]), AISI 1010 [
36] steel, and others. At the same time, the formation of a fine microband structure within the fragments is due to the development of intra-grain plastic deformation processes by the mechanisms of dislocation sliding [
29,
31].
The maximum total reversible inelastic strain in torsion is γ
SID = 18% and is attained at 281 K (8 K higher than A
f) with γ
pl· = 12% against γ
t ≈ 30%. Interestingly, the same result is reported for Ti
49.3Ni
50.7 (at%) after torsion at T < M
f [
23]: γ
SID = 18% with γ
pl = 12%. We think that this coincidence is not by chance but results from a certain common mechanism.
In conclusion, it should be noted that a direct comparison of inelastic and plastic strains obtained under torsion with similar strains obtained under compression, tension, or bending, and with the crystallography limit of martensitic strains at B19′ ↔ B2 MT, which is determined by compression-tension of the initial phase crystal lattice, is impossible. This is due to the difference in the deformation modes and the determination of the corresponding strains. In the first approximation, for a correct comparison of the total inelastic strain and plastic strain obtained in torsion with the results of studies of similar strains obtained in tension and bending and the crystallography limit of martensitic strain at B2 ↔ B19′ MT, equal to ~10% for the polycrystalline Ti
49.3Ni
50.7 (at%) alloy [
14], it was the concept of equivalent true strain at different loading modes, used earlier in [
20]. True tensile strain
, where
ε is the relative elongation. True torsional strain
, where S = tgγ is the accumulated shear strain. Tensile strains ε
t, ε
r, ε
pl, corresponding to torsional strains γ
t, γ
r, γ
pl, can be obtained from the relation e
1 = e
2. Using these values of ε
t, ε
r, and ε
pl, the inelastic strains recovered by the realization of SE, ε
SE, and SME, ε
SME, and the total inelastic strain ε
SID can be determined. The tensile strains corresponding to torsion strains after loading at 281K (γ
SID· = 18%, γ
pl = 12%, γ
t· = 30%) are: ε
t = 19.6%, ε
SID· = 12.4%, ε
pl· = 7.2%. To take into account that both γ
SID and ε
SID include Hooke’s elastic strain, it can be concluded that the maximum reversible inelastic strain γ
SID during torsion approximately corresponds to the known crystallography limit of martensitic strain at B2 ↔ B19′ MT in our coarse-grained alloy samples with 50.7 at% Ni. This result corresponds to the data of [
16,
31]. When bending samples of alloy Ti
49.3Ni
50.7 (at%) with microcrystalline structure (grain size ≤ 10 μm), the maximum inelastic strain equal also to 10% was obtained [
16]. It was shown in [
31] that the maximum total recoverable inelastic strain ε
SID in σ-ε cycles during tension and the subsequent heating of unloaded binary alloy samples with 50.9 at% Ni and an average grain size of 500 nm is 13%, which is close to the maximum total inelastic strain in our coarse-grained alloy with 50.7 at% Ni. Thus, abnormally high inelastic strains (~18% [
23] and ~15% [
16] obtained under the bending of ultrafine-grained TiNi-based binary alloys) are not observed in the coarse-grained samples of binary alloy with 50.7 at% Ni.

