
A Comparative Study of Energy Efficiency in Tumbling Mills with the Use of Relo Grinding Media


Abstract
:1. Introduction
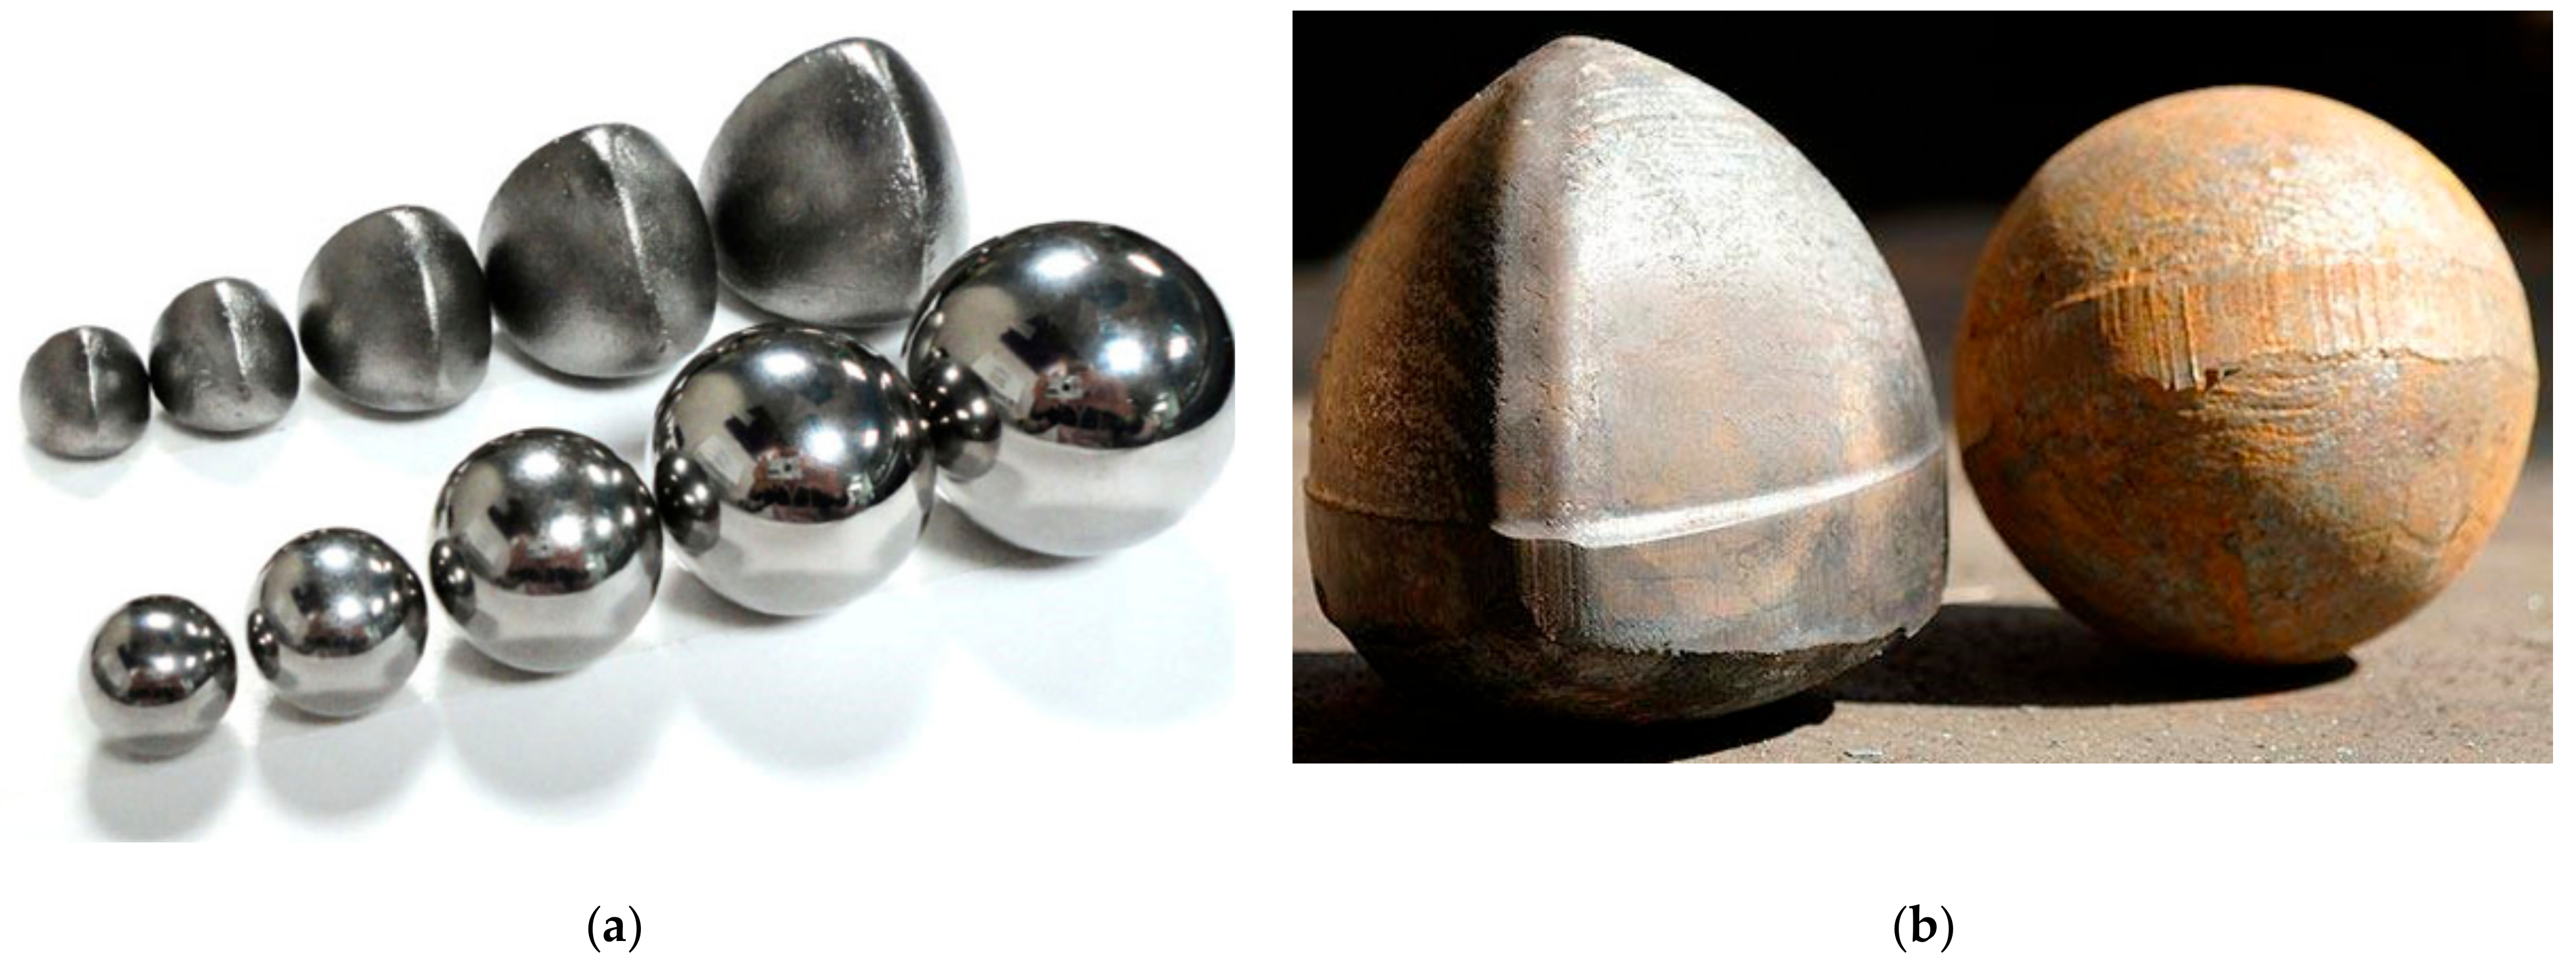
2. Physical Properties of Relo Grinding Media
3. Materials and Methods
3.1. Media Charge Conditions
- -
- Media mass,
- -
- Media surface area, and
- -
- Media size distributions.
3.2. Ore Sample
3.3. Power Draw Measurement
3.4. Test Procedure
4. Results and Discussion
4.1. Power Draw Measurements
4.2. Test Series 1
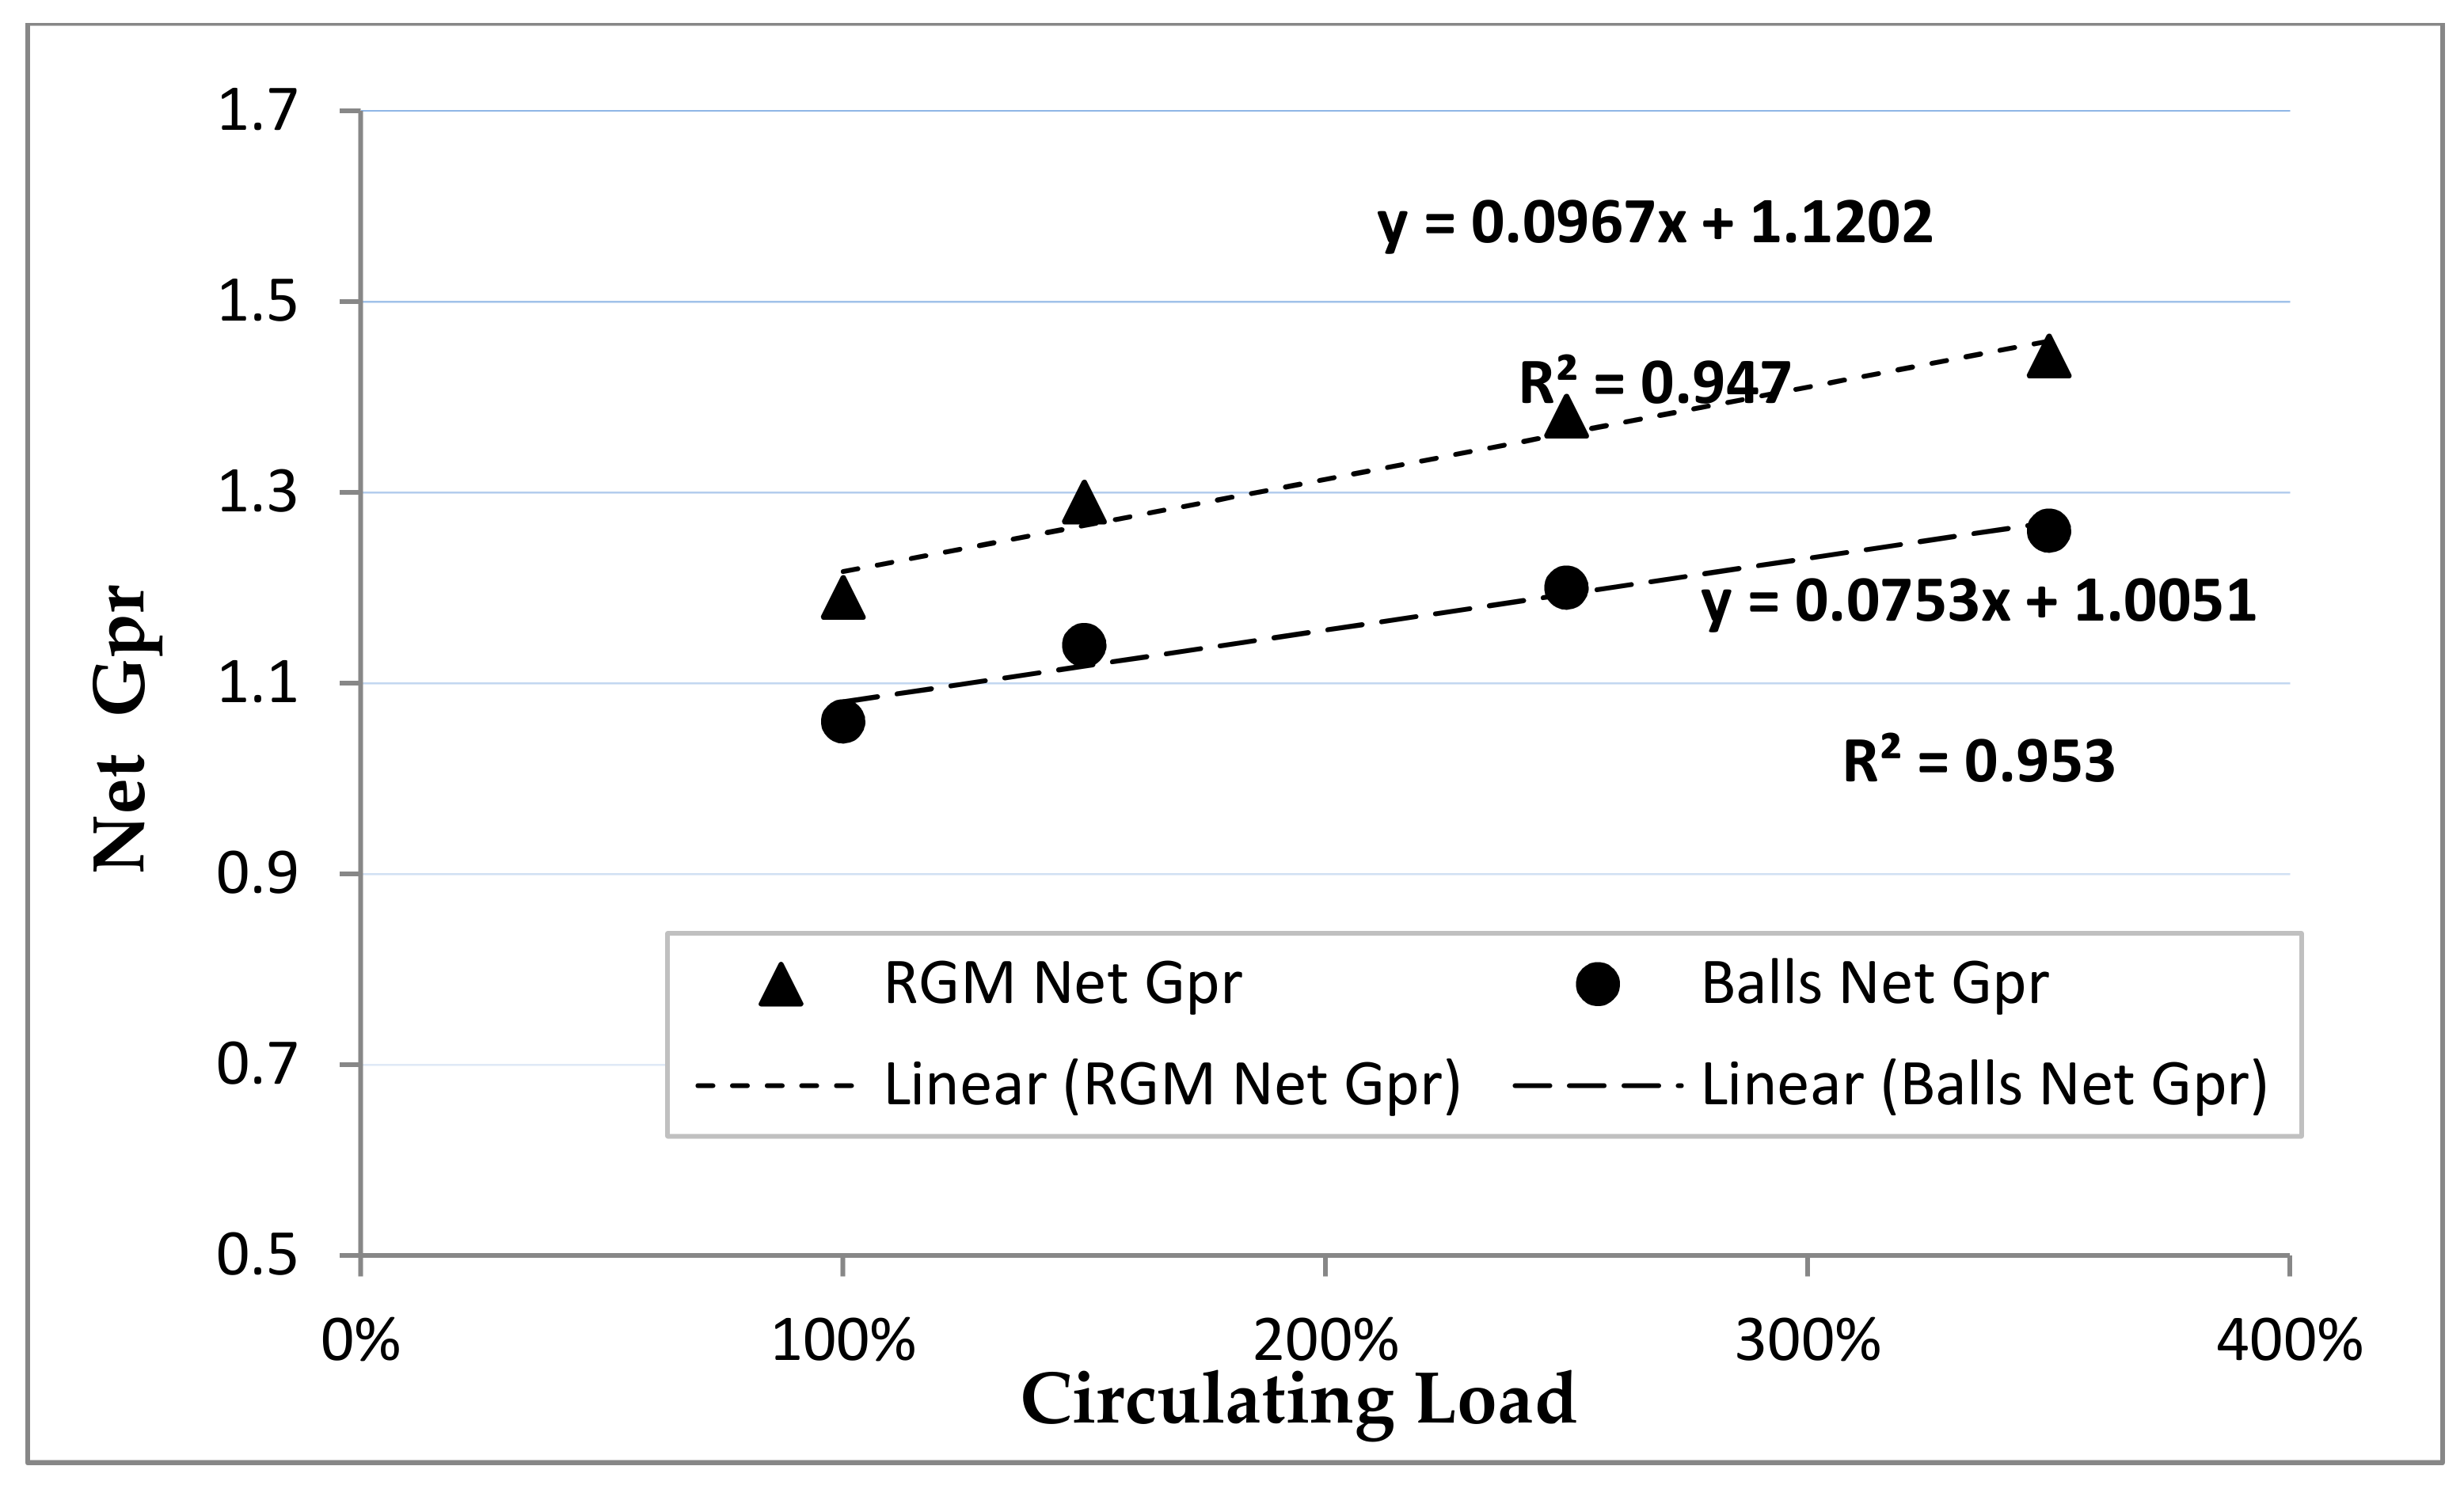
4.3. Test Series 2
4.4. Optimum Economic Circulating Ratio (Trade-Off between RGM and Balls at Circulating Loads)
4.5. Correction Coefficients for Bond WI Using RGM
- -
- By maintaining current throughput with a smaller grinding size (i.e., when the liberation size decreases);
- -
- By increasing throughput, maintaining the grinding size;
- -
- By reducing the filling ratio of the ball mill, thus lowering power and grinding media consumption.
5. Conclusions
- Power measurement tests evidenced differences in RGM and ball energy performance. Further research should be carried out to define a coefficient to obtain an RGM work index from standard Bond tests.
- Standard Bond tests did not show a clear improvement in the energy efficiency of the RGM charge compared to balls. The Bond ball work index using the RGM charge was 2% lower, while the repeatability error for the standard Bond test is estimated to be below 3.5%.
- Grinding tests at various CLRs and the same grinding time at each other circulating load test revealed that the grinding rate of the RGM charge at 100% circulating load is the same as the grinding rate of balls at 250% of circulating load.
- Linear regression calculations suggested that, at a low number of mill revolutions (equal to high circulating load conditions), RGM need 50% less grinding time than balls to produce the same amount of undersize. It showed that, working at coarser feed (high circulating loads), RGM could be more efficient than balls, thus lowering the power consumption of tumbling mills. The mass of undersize products from these tests was 14% higher on average when the RGM charge was used.
- The trade-off carried out between RGM and balls at circulating loads showed a significant improvement in energy efficiency if using RGM when facing a throughput increase, mainly due to the reduction in operating costs.
Author Contributions
Funding
Institutional Review Board Statement
Informed Consent Statement
Data Availability Statement
Acknowledgments
Conflicts of Interest
References
- Jankovic, A.; Valery, W.; La Rosa, D. Fine Grinding in the Australian Mining Industry. In Proceedings of the 3rd International Conference on Recent Advances in Materials, Minerals and Environment (RAMM 2003), Nibong Tebal, Malaysia, January 2003; Universiti Sains Malaysia: Penang, Malaysia. [Google Scholar]
- Bond, F.C. Crushing and Grinding Calculations Parts 1 and 2. Br. Chem. Eng. 1961, 6, 378–385, 543–548. [Google Scholar]
- Pedrayes, F.; Norniella, J.G.; Melero, M.G.; Menéndez-Aguado, J.M.; del Coz-Díaz, J.J. Frequency domain characterization of torque in tumbling ball mills using DEM modelling: Application to filling level monitoring. Powder Technol. 2018, 323, 433–444. [Google Scholar] [CrossRef]
- Osorio, A.M.; Menéndez-Aguado, J.M.; Bustamante, O.; Restrepo, G.M. Fine grinding size distribution analysis using the Swebrec function. Powder Technol. 2014, 258, 206–208. [Google Scholar] [CrossRef]
- Rodríguez, B.Á.; García, G.G.; Coello-Velázquez, A.L.; Menéndez-Aguado, J.M. Product size distribution function influence on interpolation calculations in the Bond ball mill grindability test. Int. J. Miner. Process. 2016, 157, 16–20. [Google Scholar] [CrossRef]
- Ciribeni, V.; Bertero, R.; Tello, A.; Puerta, M.; Avellá, E.; Paez, M.; Menéndez Aguado, J.M. Application of the Cumulative Kinetic Model in the Comminution of Critical Metal Ores. Metals 2020, 10, 925. [Google Scholar] [CrossRef]
- Ballantyne, G.R.; Powell, M.S.; Tiang, M. Proportion of Energy Attributable to Comminution. In Proceedings of the 11th AusIMM Mill Operator’s Conference, Hobart, Australia, 29–31 October 2012. [Google Scholar]
- Radziszewski, P. Energy recovery potential in comminution processes. Miner. Eng. 2013, 46–47, 83–88. [Google Scholar] [CrossRef]
- Bouchard, J.; LeBlanc, G.; Levesque, M.; Radziszewski, P.; Georges-Filteau, D. Breaking Down Energy Consumption in Industry Grinding Mills. In Proceedings of the 49th Annual Canadian Minerals Processors Conference, Ottawa, ON, Canada, 17–19 January 2017; Muinonen, J., Cameron, R., Zinck, J., Eds.; Canadian Institute of Mining, Metallurgy and Petroleum (CIM): Westmount, QC, Canada, 2017; pp. 25–35. [Google Scholar]
- Hassanzadeh, A. The Effect of Make-Up Ball Size Regime on Grinding Efficiency of Full-Scale Ball Mill. In Proceedings of the XVII Balkan Mineral Processing Congress, Antaliya, Turkey, 1–3 November 2017; Volume 1, pp. 117–124. [Google Scholar]
- Simba, K.P.; Moys, M. Effects of mixtures of grinding media of different shapes on milling kinetics. Miner. Eng. 2014, 61, 40–46. [Google Scholar] [CrossRef]
- Norris, G.C. Some grinding tests with spheres and other shapes. Trans. Inst. Miner. Metall. 1954, 63, 197–209. [Google Scholar]
- Kelsall, D.F.; Stewart, P.S.B.; Weller, K.R. Continuous grinding in a small wet ball mill Part 5. A study of the influence of media shape. Powder Technol. 1973, 8, 77–83. [Google Scholar] [CrossRef]
- Cloos, U. Cylpebs: An alternative to balls as grinding media. World Min. 1983, 36, 59. [Google Scholar]
- Herbst, J.A.; Lo, Y.C. Grinding efficiency with balls or cones as media. Int. J. Miner. Process. 1989, 26, 141–151. [Google Scholar] [CrossRef]
- Shi, F. Comparison of grinding media-Cylpebs versus balls. Miner. Eng. 2004, 17, 1259–1268. [Google Scholar] [CrossRef]
- Lameck, N.N.S. Effects of Grinding Media Shapes on Ball Mill Performance. Master’s Thesis, Faculty of Engineering and The Built Environment, University of the Witwatersrand, Johannesburg, South Africa, 2006. [Google Scholar]
- Ipek, H. Effects of grinding media shapes on breakage parameters. Part. Part. Syst. Charact. 2007, 24, 229–235. [Google Scholar] [CrossRef]
- Cuhadaroglu, D.; Samanli, S.; Kizgut, S. The effect of grinding media shape on the specific rate of breakage. Part. Part. Syst. Charact. 2008, 25, 465–473. [Google Scholar] [CrossRef]
- Simba, K.P. Effects of Mixture of Grinding Media of Different Shapes on Milling Kinetics. Ph.D. Thesis, Faculty of Engineering and the Built Environment, University of the Witwatersrand, Johannesburg, South Africa, 2010. Available online: https://core.ac.uk/download/pdf/39669573.pdf (accessed on 20 April 2021).
- Bodurov, P.; Genchev, V. Industrial tests with innovative energy saving grinding bodies. J. Multidiscip. Eng. Sci. Technol. JMEST 2017, 4, 6498–6503. [Google Scholar]
- Penchev, T.; Bodurov, P. Comparative Analysis of the Parameters of Spherical and Relo Body Balls for Drum Mills. In Proceedings of the International Conference on Mining, Material and Metallurgical Engineering, Prague, Czech Republic, 11–12 August 2014. Paper No. 144. [Google Scholar]
- Coello Velázquez, A.L.; Menéndez-Aguado, J.M.; Brown, R.L. Grindability of lateritic nickel ores in Cuba. Powder Technol. 2008, 182, 113–115. [Google Scholar] [CrossRef]
- Genchev, V.; Bodurov, P.; Kolev, N.; Leroux, D.P. Assessing the Response of Tumbling Mills to the Replacement of Balls by Relo Grinding Media (RGM)—Part 1. Comparative Bench-Scale Experiments and Demonstration Full-Scale Test. In Proceedings of the 52nd Annual Canadian Mineral Processors Operators Conference, Ottawa, ON, Canada, 21–23 January 2020. [Google Scholar]
- McIvor, R.E. Why do we need such a high recirculating load on our ball mill? Metcomtech Grinding Bulletin Issue 4, February 2013. Available online: https://www.metcomtech.com/grindingbulletin4.php (accessed on 20 April 2021).
- McIvor, R.E. Plant performance improvements using grinding circuit Classification system efficiency. Min. Eng. 2014, 66, 67–71. [Google Scholar]
- Morrell, S. A new autogenous and semi-autogenous mill model for scale-up, design and optimisation. Miner. Eng. 2004, 17, 437–445. [Google Scholar] [CrossRef]
- Yu, P. A Generic Dynamic Model Structure for Tumbling Mills. Ph.D. Thesis, The University of Queensland, Queensland, Australia, 2014. [Google Scholar]


| RGM (γ = 7.85 g/cm3) | Balls (γ = 7.85 g/cm3) | ||||||||
|---|---|---|---|---|---|---|---|---|---|
| Edge Arc (mm) | Mass (g) | Surface Area (cm2) | Specific Surface (cm2/g) | Bulk Density (t/m3) | Diameter (mm) | Mass (g) | Surface Area (cm2) | Specific Surface (cm2/g) | Bulk Density (t/m3) |
| 41.4 | 235 | 51 | 0.22 | 5.2 | |||||
| 40.2 | 212 | 48.1 | 0.23 | 5.2 | 38.1 | 224 | 45.6 | 0.20 | 4.6 |
| 33.5 | 112 | 33.4 | 0.28 | 5.2 | 31.8 | 128 | 31.8 | 0.25 | 4.6 |
| 26.7 | 61.5 | 21.1 | 0.35 | 5.2 | 25.4 | 65.5 | 20 | 0.31 | 4.6 |
| 23.8 | 43 | 16.9 | 0.39 | 5.2 | 22.2 | 43.5 | 15.5 | 0.36 | 4.6 |
| 20.1 | 25.8 | 12.1 | 0.47 | 5.2 | 19.1 | 27.3 | 11.5 | 0.42 | 4.6 |
| Ball Diameter/Relo Edge Arc, [mm] | 38.10/40.2 | 31.8/33.4 | 25.4/26.7 | 22.2/23.8 | 19.05/20.1 | Total Number | Total Mass, g |
|---|---|---|---|---|---|---|---|
| Ball Charge—number of balls | 25 | 39 | 62 | 69 | 90 | 285 | 20,115 |
| RGM Charge—number of relos | 25 | 39 | 62 | 69 | 90 | 285 | 19,149 |
| Ball Diameter/Relo Edge Arc [mm] | 40/41.4 | 38.10/40.2 | 31.8/33.4 | 25.4/26.7 | 22.2/23.8 | 19.05/20.1 | Total Number | Total Mass [g] |
|---|---|---|---|---|---|---|---|---|
| Number of balls | 0 | 25 | 39 | 62 | 69 | 90 | 285 | 20,115 |
| Number of RGM | 6 | 25 | 39 | 56 | 69 | 90 | 285 | 20,165 |
| Element | SiO2 | Al2O3 | Na2O | Li2O | K2O | Fe2O3 | CaO | L.O.I. |
|---|---|---|---|---|---|---|---|---|
| (%) | 72.16 | 17.68 | 6.56 | 1.20 | 0.92 | 0.50 | 0.09 | 0.89 |
| Size (µm) | 3350 | 2000 | 1500 | 1000 | 800 | 600 | 400 | 300 | 200 | 150 | 100 | 75 |
|---|---|---|---|---|---|---|---|---|---|---|---|---|
| Cum. Passing (%) | 100.00 | 98.69 | 88.42 | 66.93 | 49.66 | 38.19 | 28.12 | 20.77 | 14.37 | 9.44 | 4.66 | 1.14 |
| Bond Mill Charge | Power Draw without Ore Sample [W] | Power Draw at 35% of Voids within the Ball Charge [W] | Power Draw, at 100% of Voids within the Ball Charge [W] |
|---|---|---|---|
| No load | 309 | - | - |
| Standard ball charge (20.1 kg) | 402 | 437 | 462 |
| RGM charge (20.1 kg) | 424 | 440 | 445 |
| Test Parameter | Unit | Balls | RGM |
|---|---|---|---|
| Weight of media charge | (kg) | 20.123 | 19.145 |
| P100 | (microns) | 106 | 106 |
| Gpr | (g/rev) | 1.201 | 1.190 |
| F80 | (microns) | 2044 | 2044 |
| P80 | (microns) | 84 | 81 |
| Result | Unit | Balls | RGM |
| wi | (kWh/t) | 16.62 | 16.30 |
| Media | Mill Throughput [tph] | CLR [%] | Relative Grinding Costs [%] | Relative Pumping/Classification Costs [%] | Total [%] |
|---|---|---|---|---|---|
| Base case | |||||
| Balls | 100 | 245 | 92 | 8 | 100 |
| Relo | 100 | 100 | 92 | 4 | 96 |
| Increased by 14% | |||||
| Balls | 114 | 558 | 84 | 16 | 100 |
| Relo | 114 | 245 | 84 | 8 | 92 |
Publisher’s Note: MDPI stays neutral with regard to jurisdictional claims in published maps and institutional affiliations. |
© 2021 by the authors. Licensee MDPI, Basel, Switzerland. This article is an open access article distributed under the terms and conditions of the Creative Commons Attribution (CC BY) license (https://creativecommons.org/licenses/by/4.0/).
Share and Cite
Kolev, N.; Bodurov, P.; Genchev, V.; Simpson, B.; Melero, M.G.; Menéndez-Aguado, J.M. A Comparative Study of Energy Efficiency in Tumbling Mills with the Use of Relo Grinding Media. Metals 2021, 11, 735. https://doi.org/10.3390/met11050735
Kolev N, Bodurov P, Genchev V, Simpson B, Melero MG, Menéndez-Aguado JM. A Comparative Study of Energy Efficiency in Tumbling Mills with the Use of Relo Grinding Media. Metals. 2021; 11(5):735. https://doi.org/10.3390/met11050735
Chicago/Turabian StyleKolev, Nikolay, Petar Bodurov, Vassil Genchev, Ben Simpson, Manuel G. Melero, and Juan M. Menéndez-Aguado. 2021. "A Comparative Study of Energy Efficiency in Tumbling Mills with the Use of Relo Grinding Media" Metals 11, no. 5: 735. https://doi.org/10.3390/met11050735
APA StyleKolev, N., Bodurov, P., Genchev, V., Simpson, B., Melero, M. G., & Menéndez-Aguado, J. M. (2021). A Comparative Study of Energy Efficiency in Tumbling Mills with the Use of Relo Grinding Media. Metals, 11(5), 735. https://doi.org/10.3390/met11050735