Abstract
The European Commission (EC) maintains the consideration of tungsten as a critical raw material for the European industry, being the comminution stage of tungsten-bearing minerals an essential step in the tungsten concentration process. Comminution operations involve approximately 3–4% of worldwide energy consumption; therefore, grinding optimization should be a priority. In this study, the grinding behavior of tungsten ore from Barruecopardo Mine (Salamanca, Spain) is analyzed. A protocol based on Austin’s methodology and PBM is developed in order to study the influence of operational and geometallurgical variables on grinding kinetics. In addition to the kinetic parameters, the breakage probability (Si) and breakage function (Bij) is determined. The selection function was formulated for the Barruecopardo Mine with respect to the mill speed.
1. Introduction
The European Union has recently published the updated list of critical raw materials, in which tungsten (W) is included. This critical condition is defined by both the supply risk to the EU and the economic importance developed on the industrial value chains of the European Union [1].
Tungsten presents strategic applications on high strength alloys for machining tools, automotive and mobile phone sectors, among others [2]. Currently, there are several tungsten mines in Europe, some active and others on the exploration stage [3]. This is the case of the Barruecopardo mine in Salamanca (Spain), owned by Ormonde Mining PLC and currently administered by Saloro S.L., which is estimated to provide 11% of the non-Chinese global supply of tungsten [4]. The main minerals present in Barruecopardo are scheelite (CaWO4) and wolframite ((Fe, Mn)WO4), which constitute the ore. Arsenopyrite (FeAsS), pyrite (FeS2), chalcopyrite (CuFeS2), and ilmenite (FeTiO3) are also present as primary minerals of the gangue [5,6].
Regarding mineral benefit, the comminution stage represents 3–4% of the energy consumption worldwide and 40–70% of the energy consumed in a mineral processing plant [7,8]. In fact, ball-mill grinding is one of the most energy-consuming techniques. Therefore, setting the optimal values of the operational and mineralogical parameters both for the initial design and the process adaptation to ore variations [9].
Several researchers have investigated the influence exerted on kinetic conditions by operational parameters such as mill speed [10,11] and filling volume [12,13]. Other researchers devoted their work to study geometallurgical variables such as grain size, shape and roughness, specific surface area, orientation, hardness, fracture strength, feed particle size distribution, and mineralogy [14,15,16,17,18,19,20] using optical microscopy or more advanced techniques, such as Quantitative Microstructural Analysis (QMA) [21]. Consequently, a small improvement in machinery efficiency and an optimal design in the grinding system, taking into account the optimization of the above-mentioned parameters, would greatly cut down plant operational costs, impacting environmental issues and resource management [22,23].
This work aims to characterize the grinding kinetic behavior at a lab-scale of tungsten ore, due to its importance as a critical raw material to the EU, by determining the kinetic parameters following the Austin model. A second objective is to assess the influence of mill speed on the kinetic and geometallurgical parameters, being mill speed the more easily adjustable operational parameter at an industrial scale.
2. Theoretical Background
The population balance model (PBM) has been widely used in ball mills since its proposal by Austin [24]. This model is based on determining the particle size distribution grouped in size classes. A mass balance for the class i in a well-mixed grinding process is done by employing Equation (1), where a first-order kinetic fragmentation is assumed.
where wi(t) is the remnant mass fraction of particle size class i at grinding time t. The first term of the right-hand side is the mass fraction of the monosize i particles that break and thus no longer belong to that monosize, being Si the probability of fracture. The second term represents the contribution of all monosizes coarser than i that break to produce particles of monosize i. The fracture rate of a monosize material can be expressed by Equation (2):
where Si is the probability of fracture or specific fracture rate, whose unit is t−1. Assuming that Si does not change with time, the integral results in Equation (3).
where wi is the weight fraction of mineral feed into the mill having a size 1 for time t, and Si is the probability of fracture. According to the methodology proposed by Austin et al. [25], once Si values have been obtained through slope determination, they are plotted to the particle size, and Equation (4) is proposed to study the behavior of the probability of fracture Si.
where Xi is the upper size limit of the interval in mm, and and α are model parameters that depend on the material properties and the grinding conditions. To find the second term of Equation (1), the fracture function bii is defined. This function represents the particle fraction that belongs initially to interval j, after fracture falls in interval i. It is recommended to represent this value in cumulative form Bij, whose calculation is done with Equation (5).
That is, Bij is the sum of the mineral fractions finer than the upper limit of interval i as a result of the primary break of the size interval j. Austin et al. [25] showed that Bij values could be estimated from a size analysis of the products over short grinding times of an initial feed chiefly of size j through the method BII [25,26,27]. With the parameters of fracture function, Bij can be determined graphically through an empirical function like Equation (6).
where , γ and β are parameters that depend on the material properties. The critical speed, Nc, is calculated using Equation (7).
where D is the mill diameter and d is the ball diameter [m]. Ball mill filling volume is calculated using Equation (8).
On the other side, Austin and Brame [28] calculated the sorting function in a general way through Equation (9).
where νc is the mill speed expressed as a fraction of the critical speed. Finally, according to [29], the Froude number expresses the ratio of centrifugal acceleration to gravity acceleration at the perimeter of the mill chamber (Equation (10)). This number can be used to characterize the charge motion in the mill and the ball regime. Thus, in laboratory ball mills, it is recommended to define work conditions with centrifugal acceleration at the shell equalling ½ of the acceleration due to gravity (Fr = 0.5), corresponding to νc = 70.7% [29].
3. Materials and Methods
3.1. Sample Preparation and Feed Characterization
The sample mineralogy was extensively characterized by Alfonso et al. [6]. A representative sample from an old waste dump of the Barruecopardo mine was prepared in a 4 mm jaw crusher. After homogenization and quartering using a riffle splitter, sieving provided an adequate quantity of the following size intervals, which will be considered as monosizes in this work: 5000/4000, 4000/3350, 3000/2000, 2000/1000, 1000/500, 500/250, 250/125, 125/75, 75/45 µm.
A representative sample was characterized chemically through XRF, using a Bruker XRF S-4 Pioneer Advance, with sample preparation in a Claisse Perler, model M-4.
3.2. Calculation of Critical Speed and Initial Conditions for the Grinding Kinetic Tests
Mill critical speed was calculated using Equation (7). Table 1 shows the three milling speeds used in the tests.

Table 1.
Mill rotation speeds used in the grinding kinetic tests.
Grinding kinetic tests were run in a laboratory mill, 17.8 cm in diameter and 4500 cm3 in capacity. Feed was of 900 cm3, and milling load consisted of 6.6 kg of steel balls with the following ball size distribution: 45 balls 19 mm in diameter, 23 balls 29.7 mm in diameter, and 17 balls 36.8 mm in diameter. Fill fraction was calculated using Equation (8). The feed consisted of samples of the 9 monosizes selected (5000/4000, 4000/3000, 3000/2000, 2000/1000, 1000/500, 500/250, 250/125, 125/75, 75/45 µm). Grinding times were 0.5, 1, 1.5, 3.5, 6.5, and 10.5 min. Each sample was dumped and, after performing a grain size analysis, W content was measured to assess the evolution of the W grade with respect to the kinetic parameters.
3.3. Determination of Fracture Probability (Si), Fracture Function (Bij), and the Kinetic Parameters (αT, α, , γ, and β)
3.3.1. Fracture Probability (Si) and Kinetic Parameters (αT, and α)
After obtaining the oversize weights for each grinding time, and plotting the time function log (wi(t)/wi(0)) for each monosize, the equation for each curve, and consequently, the Si value, were calculated through the linear fitting using Equation (3). Then, Si, values for each monosize were plotted, and the parameters (αT and α) were calculated using Equation (4) for each mill speed condition to study the influence of this operational variable on the probability of fracture and on the kinetic parameters αT and α. The selection function αT, obtained through Equation (9) was calculated using an equation designed for this particular ore, as detailed in Section 4.2.
3.3.2. Determination of the Fracture Function (Bij) and the Kinetic Parameters (, γ and β)
These calculations were done for each feed monosize, i, at each mill speed condition and after the grinding time. Product particle size analysis was done by sieving with mesh sizes i to j−n. Weight of oversizes i and Sj−n was determined, and fracture function values bij and cumulative value Bij, were obtained using Equation (5). Finally, Bij data were plotted to relative size j/i for each monosize and mill speed conditions. The rest of the kinetic parameters were calculated through Equation (6).
3.4. Study of P80 and the Ratio of Reduction Rr
The evolution of some relevant parameters of the product was represented. These parameters were P80 and the ratio of reduction, Rr, after a 0.5 min grinding time at several mill speeds for each feed monosize. Likewise, the evolution of the probability of fracture, Si, and Rr with mill speed was studied, for each feed monosize.
3.5. Chemical Characterisation of the Product
Milling products were chemically characterized with the equipment specified in Section 3.1.
4. Results and Discussion
4.1. Feed Characterzsation
The sample mechanically prepared displays a particle size distribution (PSD), as shown in Figure 1.
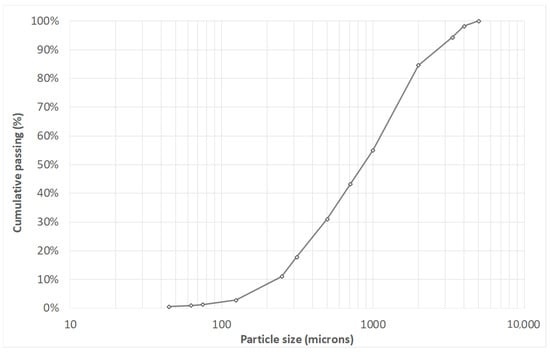
Figure 1.
PSD for the Barruecopardo ore head samples.
F80 for the Barruecopardo sample is 1690 µm. Table 2 shows W contents obtained from a mineralogical study for each size interval.
Table 2.
Fractional results of XRF (ND = not detected).
W contents shown in Table 2 reflect that the sample comes from a waste dump of the Barruecopardo mine, and therefore from an area with low W contents.
The probability of fracture (Si) and the kinetic parameters (α, αT), a size of 80% of product undersize (P80), and the reduction ratio were obtained from this procedure (Rr):
Figure 2 shows the values (Si) plotted to the particle size according to the mill speed.
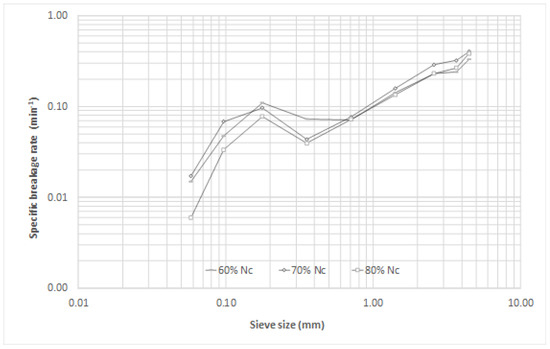
Figure 2.
Evolution of the probability of fracture (Si) with particle size, in relation to mill speed.
Figure 2 shows that comparing the three speeds tested, the highest probability of fracture occurred at 70% critical speed, agreeing with Gupta amd Sharma [9], Gupta [10], and Herbst and Fuerstenau [30], who did their experiments at lab scale, with several materials, simulations, and finally upscaling. This also verified the Steiner [29] recommendation of a configuration with Fr value close to 0.5. For intermediate and coarse grain sizes, a rather linear trend was observed using a logarithmic scale. This coincided with Deniz [22] for this grain size interval.
Noteworthy was a sharp break in slope that occurred at around 250 µm for the three tested speeds, coinciding with the size fractions more enriched in W, as shown in Table 2. Moreover, the results backed Gupta and Sharma’s [9] statements, pointing to the probability of fracture Si being one of the mill operational conditions more influenced by the mineralogical variability among monosize fractions.
On the other side, the evolution of Si, P80, and Rr for each feed monosize was studied at different mill speeds as summarized in Table 3. The reduction ratio was the result of dividing the d80 in the feed size (F80) by the d80 in the product size (P80).
Table 3.
Si, Rr, and P80 values as a function of working speed for each monosize.
It must be highlighted in Table 3 that once the total grinding time was reached, a finer P80 and a higher Rr, were obtained at 70% working speed for most of the monosizes. This confirmed that the mill speed affected the grinding product [11,31].
The kinetic parameters (α, αT) obtained after linearization of Equation (4) are summarized in Table 4 and the selection function is represented in Figure 3.
Table 4.
Values of the kinetic parameters α, αT for different mill speeds.
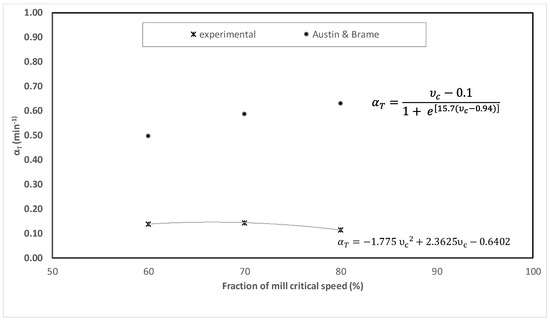
Figure 3.
Variation of αT with the working speed fraction.
Table 4 shows that the parameter α is coherent with what Austin et al. [25] reported. These authors pointed out that it usually ranges between 0.5 and 1.5 and that it depends only on the mineral. On the other side, Table 4 and Figure 3 show that the value of the selection function αT does not vary significantly despite the increasing speed, because the mill geometry remains unchanged. Figure 4 displays αT values calculated from Equation (9), as proposed by Austin and Brame [28]. It can be seen that this expression does not fit this case. This led to a polynomial adjustment using the experiment values, as it was shown in Equation (11) that it fitted better with the studied sample.
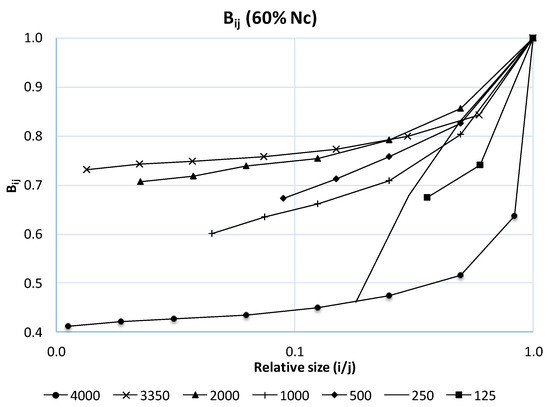
Figure 4.
Behavior of the fracture function (Bij), with respect to particle size. 60% working speed Nc (Barruecopardo ore).
4.2. Fracture Function, Kinetic Parameters (, γ and β)
The values of fracture function Bij in relation to the particle size for each monosize as the mill speed varied were determined through Equation (5) and are shown in Figure 4, Figure 5 and Figure 6 for 60%, 70%, and 80% mill speed, respectively.
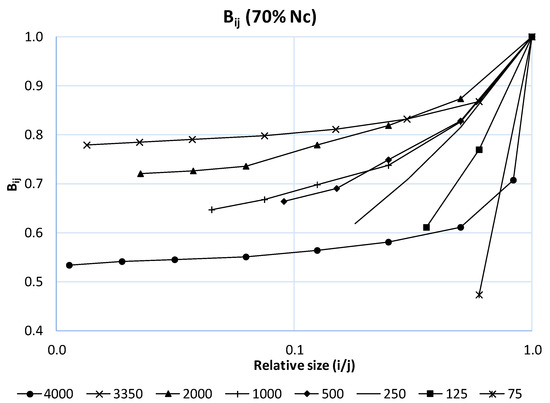
Figure 5.
Behavior of the fracture function (Bij), with respect to particle size. 70% working speed Nc (Barruecopardo ore).
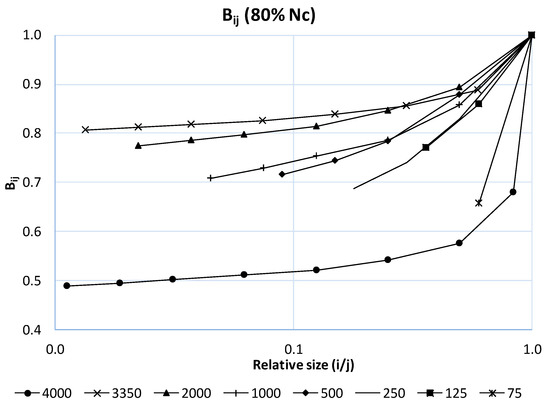
Figure 6.
Behavior of the fracture function (Bij), with respect to particle size. 80% working speed Nc (Barruecopardo ore).
The kinetic parameters of fracture function (, γ, and β) are shown in Table 5. According to Austin et al. (1984), and β are parameters that depend on the material. Regarding γ and β, these authors propose that their values were usually in the range of 0.5–1.5 and 2.5–5.0, respectively.
Table 5.
Values of the kinetic parameters (φj, γ, β) for each monosize and for different mill speed conditions.
Figure 4, Figure 5 and Figure 6 and Table 5 show that Bij depends on the feed grain size for parameters of 60%, 70%, and 80% of critical speed. The influence that mill speed exerts on Bij, can also be noticed by comparing the different monosizes: a greater difference existed for coarser sizes, whereas it was lesser for finer sizes. This was due to the fact that coarse sizes not only possessed a higher Si, but also were more prone to yield new finer particles (progeny). That meant that Bij depended on the feed particle size, as Ipek and Goktepe [32] observed, which was also influenced by the mill speed, and concurred with results by Deniz [22]. Nevertheless, this variation was not as significant as reported by Austin et al. [25].
Table 5 shows parameter γ, which represents the fineness factor. In Figure 7, the γ values are plotted against mill speed for two feed particle sizes (4000 and 500 µm, respectively).
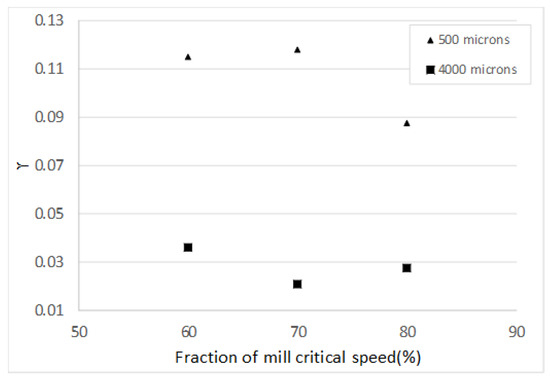
Figure 7.
Variation of γ with mill speed.
Figure 7 depicts that γ values are influenced by both mill speed and feed particle size. Smaller γ values were related to coarse particles (4000 µm), which meant that more fine particles were generated. Conversely, finer particles (500 µm) generated a lesser proportion of fine particles, agreeing well with results by Ipek and Goktepe [32] and Austin et al. [25].
4.3. Chemical Characterization of the Grinding Products
Figure 8, Figure 9 and Figure 10 illustrate the evolution of W content in the product in relation to the feed monosizes and their grain size fractions for each mill speed.
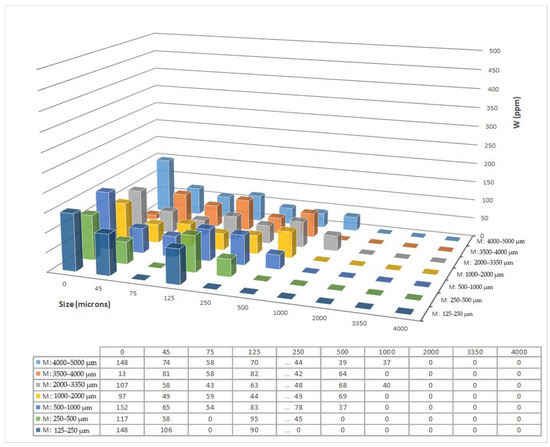
Figure 8.
Evolution of the W grade in the product with respect to the monosizes and their grain size fractions for 60% Nc.
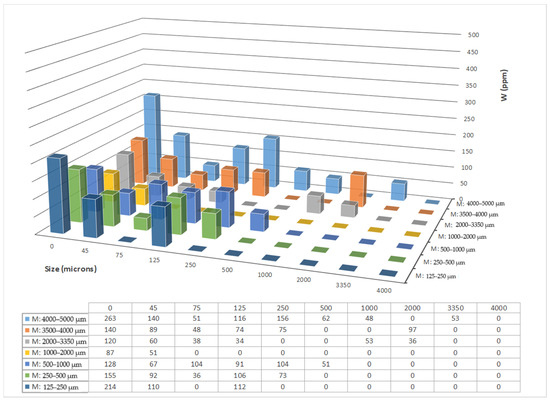
Figure 9.
Evolution of the W grade in the product with respect to the monosizes and their grain size fractions for 70% Nc.
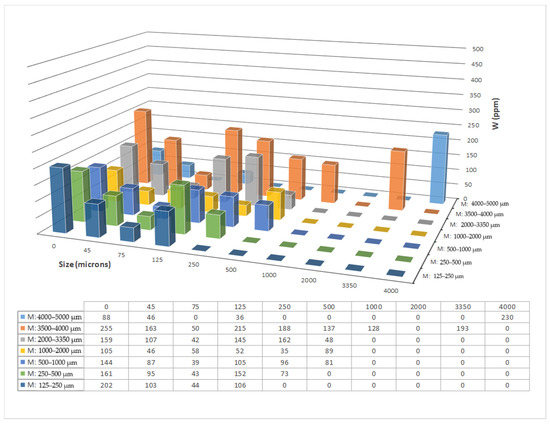
Figure 10.
Evolution of the W grade in the product with respect to the monosizes and their grain size fractions for 80% Nc.
As can be seen in Figure 8, Figure 9 and Figure 10, for most monosizes, W content increased with decreasing particle size. This could be partly explained because feed grain sizes around 250 µm already yielded higher W content, as shown in Table 2. Nevertheless, maximum values after grinding were 6–7 times higher than original values pointing undoubtedly to a differential grinding effect leading to W mineral grains mainly falling in the 250–125 µm interval. The accumulation of these W-enriched particles, which were more difficult to grind, supports the mineralogical explanation of the aforementioned breakage probability reduction at 250 µm size. In addition, this interval always presented Si values higher than the coarser and finer intervals. This would suggest that particles of this size would have a higher probability of fracture compared to the adjacent size intervals. Indeed, in all cases, a decrease in W content could be observed down to 75 µm size, followed by an increase of further finer particles. It must be highlighted that the highest W content was yielded for grinding at 70% Nc. This could be explained because, under these grinding conditions, the mill performance was more efficient due to a more adequate charge regime (Fr close to 0.5), leading to better grinding kinetics.
5. Conclusions
The experimental work here presented and its further analysis permits to draw the following conclusions:
- Austin’s methodology has allowed us to characterize the kinetic behavior of tungsten ore by determining the kinetic parameters (α, αT, φj, γ, β), concluding that the values Si and Bij do not vary significantly with time.
- The probability of fracture, Si, is highest at 70% critical speed. Fracture function Bij, does not vary significantly with mill speed. Nevertheless, it is affected by the feed particle size, becoming higher for coarser sizes.
- Equation (10) is proposed as the best αT fit, specifically for the studied ore.
- Values of parameter γ are influenced by both mill speed and feed particle size. Coarser particles yield smaller γ values, i.e., they produce more fines, whereas finer particles produce lesser quantities. The parameters ϕj and β depend on the features of the ore.
- The chemical characterization and the study of the evolution of the relevant grinding parameters, such as P80 and Rr, to the grinding time have demonstrated that, first, the highest probability of fracture occurs at 70% of the critical speed and; second, the effect of differential grinding is evidenced between the W-bearing species and the gangue. The latter results in an increase of the W grade in the monosize 250/125 µm.
Author Contributions
Conceptualization and execution of experiments, J.V.N. and J.M.M.-A.; methodology and investigation, J.V.N. and A.L.C.-V.; formal analysis and data curation, J.V.N. and J.M.M.-A.; writing–original draft preparation, J.V.N.; writing–review and editing, J.V.N. and J.M.M.-A.; supervision, J.M.M.-A. and A.L.C.-V.; project administration and funding acquisition, J.M.M.-A. All authors have read and agreed to the submitted version of the manuscript.
Funding
This work is part of the OPTIMORE project funded by the European Union Horizon 2020 Research and Innovation Programme under grant agreement No 642201.
Institutional Review Board Statement
Not applicable.
Informed Consent Statement
Not applicable.
Data Availability Statement
No new data were created or analyzed in this study. Data sharing is not applicable to this article.
Conflicts of Interest
The authors declare no conflict of interest.
References
- European Commission. Study on the EU’s List of Critical Raw Materials. 2020. Available online: https://ec.europa.eu/commission/presscorner/detail/en/ip_20_1542 (accessed on 25 November 2020).
- Roskill. Tungsten. Market Report. 2020. Available online: https://roskill.com/market-report/tungsten/ (accessed on 25 November 2020).
- Schmidt, S. From Deposit to Concentrate: The Basics of Tungsten Mining Part 2: Operational Practices and Challenges; International Tungsten Industry Association: London, UK, 2012; pp. 1–20. Available online: http://www.itia.info/assets/files/newsletters/Newsletter_2012_06.pdf (accessed on 25 November 2020).
- Ormonde Mining PLC. Annual Report & Accounts 2018; Issue 256353; Ormonde Mining PLC Co.: Meath, Ireland, 2018. [Google Scholar]
- Murciego, A.; Álvarez-Ayuso, E.; Pellitero, E.; Rodríguez, M.A.; García-Sánchez, A.; Tamayo, A.; Rubio, J.; Rubio, F.; Rubin, J. Study of arsenopyrite weathering products in mine wastes from abandoned tungsten and tin exploitations. J. Hazard. Mater. 2011, 186, 590–601. [Google Scholar] [CrossRef] [PubMed]
- Alfonso, P.; Castro, D.; Garcia-Valles, M.; Tarragó, M.; Tomasa, O.; Martínez, S. Recycling of tailings from the Barruecopardo tungsten deposit for the production of glass. J. Therm. Anal. Calorim. 2016, 125, 681–687. [Google Scholar] [CrossRef]
- Fuerstenau, D.W.; Lutch, A.D.J.J. The effect of ball size on the energy efficiency of hybrid high-pressure roll mill/ball mill grinding. Powder Technol. 1999, 105, 199–204. [Google Scholar] [CrossRef]
- Menéndez-Aguado, J.M.; Velázquez, A.L.C.; Tijonov, O.N.; Díaz, M.A.R. Implementation of energy sustainability concepts during the comminution process of the Punta Gorda nickel ore plant (Cuba). Powder Technol. 2006, 170, 153–157. [Google Scholar] [CrossRef]
- Gupta, V.K.; Sharma, S. Analysis of ball mill grinding operation using mill power specific kinetic parameters. Adv. Powder Technol. 2014, 25, 625–634. [Google Scholar] [CrossRef]
- Gupta, V.K. Determination of the specific breakage rate parameters using the top-size-fraction method: Preparation of the feed charge and design of experiments. Adv. Powder Technol. 2016, 27, 1710–1718. [Google Scholar] [CrossRef]
- Öksüzoglu, B.; Uçurum, M. An experimental study on the ultra-fine grinding of gypsum ore in a dry ball mill. Powder Technol. 2016, 291, 186–192. [Google Scholar] [CrossRef]
- Pedrayes, F.; Norniella, J.G.; Melero, M.G.; Menéndez-Aguado, J.M.; del Coz-Díaz, J.J. Frequency domain characterization of torque in tumbling ball mills using DEM modelling: Application to filling level monitoring. Powder Technol. 2018, 323, 433–444. [Google Scholar] [CrossRef]
- Deniz, V. Influence of interstitial filling on breakage kinetics of gypsum in ball mill. Adv. Powder Technol. 2011, 22, 512–517. [Google Scholar] [CrossRef]
- Chimwani, N.; Glasser, D.; Hildebrandt, D.; Metzger, M.J.; Mulenga, F.K. Determination of the milling parameters of a platinum group minerals ore to optimize product size distribution for flotation purposes. Miner. Eng. 2013, 43–44, 67–78. [Google Scholar] [CrossRef]
- Lund, C.; Lamberg, P. Geometallurgy-A tool for better resource efficiency. Met. Miner. 2014, 37, 39–43. [Google Scholar]
- Mwanga, A.-R. Development of a Geometallurgical Testing Framework for Ore Grinding and Liberation Properties. Ph.D. Thesis, Lulea University of Technology, Lulea, Sweden, 2016. [Google Scholar]
- Mwanga, A.; Parian, M.; Lamberg, P.; Rosenkranz, J. Comminution modeling using mineralogical properties of iron ores. Miner. Eng. 2017, 111, 182–197. [Google Scholar] [CrossRef]
- Little, L.; Mainza, A.N.; Becker, M.; Wiese, J. Fine grinding: How mill type affects particle shape characteristics and mineral liberation. Miner. Eng. 2017, 111, 148–157. [Google Scholar] [CrossRef]
- Gupta, V.K. Effect of size distribution of the particulate material on the specific breakage rate of particles in dry ball milling. Powder Technol. 2017, 305, 714–722. [Google Scholar] [CrossRef]
- Ciribeni, V.; Bertero, R.; Tello, A.; Puerta, M.; Avellá, E.; Paez, M.; Aguado, J.M.M. Application of the Cumulative Kinetic Model in the Comminution of Critical Metal Ores. Metals 2020, 10, 925. [Google Scholar] [CrossRef]
- Hesse, M.; Popov, O.; Lieberwirth, H. Increasing efficiency by selective comminution. Miner. Eng. 2017, 103–104, 112–126. [Google Scholar] [CrossRef]
- Deniz, V. The effect of mill speed on kinetic breakage parameters of clinker and limestone. Cem. Concr. Res. 2004, 34, 1365–1371. [Google Scholar] [CrossRef]
- Petrakis, E.; Komnitsas, K. Improved Modeling of the Grinding Process through the Combined Use of Matrix and Population Balance Models. Minerals 2017, 7, 67. [Google Scholar] [CrossRef]
- Austin, L. A Review—Introduction to the mathematical description of grinding as a rate process. Powder Technol. 1972, 5, 1–17. [Google Scholar] [CrossRef]
- Austin, L.G.; Klimpel, R.R.; Luckie, P.T. Process Engineering of Size Reduction: Ball Milling; SME—AIME: New York, NY, USA, 1984. [Google Scholar]
- Wang, X.; Gui, W.; Yang, C.; Wang, Y. Wet grindability of an industrial ore and its breakage parameters estimation using population balances. Int. J. Miner. Process. 2011, 98, 113–117. [Google Scholar] [CrossRef]
- Petrakis, E.; Stamboliadis, E.; Komnitsas, K. Identification of Optimal Mill Operating Parameters during Grinding of Quartz with the Use of Population Balance Modeling. KONA Powder Part. J. 2017, 34, 213–223. [Google Scholar] [CrossRef]
- Austin, L.G.; Brame, K. A comparison of the Bond method for sizing wet tumbling ball mills with a size—mass balance simulation model. Powder Technol. 1983, 34, 261–274. [Google Scholar] [CrossRef]
- Steiner. Characterization of laboratory-scale tumbling mills. Int. J. Miner. Process. 1996, 44–45, 373–382. [Google Scholar]
- Herbst, J.A.; Fuerstenau, D.W. Mathematical simulation of dry ball milling using specific power information. Trans. AIME 1973, 254, 343–348. [Google Scholar]
- Cayirli, S. Influences of operating parameters on dry ball mill performance. Physicochem. Probl. Miner. Process. 2018, 54, 751–762. [Google Scholar]
- Ipek, H.; Goktepe, F. Determination of grindability characteristics of zeolite. Physicochem. Probl. Miner. Process. 2011, 47, 183–192. [Google Scholar]


Publisher’s Note: MDPI stays neutral with regard to jurisdictional claims in published maps and institutional affiliations. |
© 2020 by the authors. Licensee MDPI, Basel, Switzerland. This article is an open access article distributed under the terms and conditions of the Creative Commons Attribution (CC BY) license (http://creativecommons.org/licenses/by/4.0/).