Abstract
Electrodeposition and characterization of novel ceria-doped Zn-Co composite coatings was the main goal of this research. Electrodeposited composite coatings were compared to pure Zn-Co coatings obtained under the same conditions. The effect of two ceria sources, powder and home-made sol, on the morphology and corrosion resistance of the composite coatings was determined. During the electrodeposition process the plating solution was successfully agitated in an ultrasound bath. The source of the particles was found to influence the stability and dispersity of plating solutions. The application of ceria sol resulted in an increase of the ceria content in the resulting coating and favored the refinement from cauliflower-like morphology (Zn-Co) to uniform and compact coral-like structure (Zn-Co-CeO2 sol). The corrosion resistance of the composite coatings was enhanced compared to bare Zn-Co as evidenced by electrochemical impedance spectroscopy and scanning Kelvin probe results. Zn-Co doped with ceria particles originating from ceria sol exhibited superior corrosion resistance compared to Zn-Co-CeO2 (powder) coatings. The self-healing rate of artificial defect was calculated based on measured Volta potential difference for which Zn-Co-CeO2 (sol) coatings exhibited a self-healing rate of 73.28% in a chloride-rich environment.
1. Introduction
Zinc-based protective coatings are widely applied in different fields of industries for steel protection. In order to achieve prolonged service life, zinc coating is usually alloyed with Ni [1,2], Fe [3,4] or Co [5,6,7]. The constant demands imposed by industry for thinner, more efficient and long-term steel protection have led to more intensive research on different composite coatings. Co-deposition of TiO2 [8], YSZ (yttria-stabilized zirconia) [9], Al2O3 [10], SiO2 [11], SiC [12] particles into zinc matrixes has enhanced a wide range of coatings properties, like hardness, corrosion resistance, wear properties, etc. Due to their superior characteristics (exceptional corrosion resistance, low thermal conductivity, high ionic conductivity, antioxidant property, high oxygen storage capacity, etc.), rare-earth-based materials, especially ceria (CeO2) particles, have found application in different fields, such as material science, catalysis (very effective photocatalyst), fuel cells, biomaterials, ceramics, cosmetics and medicine [13]. Ceria particles are also proved as very efficient corrosion inhibitors [14] and are often an essential part of self-healing materials [15]. Self-healing materials are classified as part of smart materials able to repair the damage at the microscopic level without any external influence [16]. Nevertheless, in order to achieve all these advanced properties of the composite coatings, many challenges need to be overstepped. The low dispersity of the plating solution containing particles is the first on the list. Namely, due to the high surface energy (especially for nanosized particles) and high ionic strength of the plating solution the metal oxide particles tend to agglomerate. The use of ultrasound prior to and during electrodeposition was found to be very effective in suppressing agglomeration and increasing particle content in the deposit [17,18,19]. Also, the ultrasound applied during electrodeposition was found to be beneficial to the deposition process itself (i.e., mass transfer enhancement and current efficiency) and to the final coating properties such as refinement of grain size, decreasing of porosity, increasing the particle content, etc. [19]. The main goal of this research is to develop Zn-Co-CeO2 composite coating under ultrasonic agitation and to compare their properties to those exhibited by Zn-Co alloy coatings deposited under the same conditions. To overcome the main challenges in the electrodeposition of composite coatings, i.e., to increase the dispersity and stability of the plating solution in addition to ultrasound, a stable ceria sol was synthesized and used as particle source as an alternative to commonly used commercial ceria powder. The synergistic effect of the ceria presence and ultrasound applied during electrodeposition on the morphology and corrosion resistance of the Zn-Co coatings is studied.
2. Materials and Methods
The Zn-Co alloy coatings and Zn-Co-CeO2 composite coatings were electrodeposited galvanostatically at constant current density of 2 A dm−2 and compared in terms of morphology and corrosion resistance. The composition of the plating solution for deposition of the Zn-Co alloy was: 0.1 mol dm−3 ZnCl2; 0.8 mol dm−3 H3BO3; 3 mol dm−3 KCl and 0.03 mol dm−3 CoCl2·6H2O; pH of the solution was fixed at 3.Chemicals were analytical grade produced by Sigma-Aldrich. The composite coatings were deposited from the same plating solutions with addition of 2 g dm−3 CeO2 (sol or powder) at pH 3. When ceria was added as commercial powder (Sigma-Aldrich, Saint Louis, MO, USA, No. 700,290 purity 99.95%, particles size < 50 nm (BET)), all chemicals were dissolved in double distilled water. The other type of ceria source used was stable aqueous colloidal dispersion (2 g dm−3 solid content) and in this case all chemicals were dissolved in prepared sol. In this study, an optimized ceria concentration, ensuring stability of the plating electrolyte and best coating performance in terms of morphology and corrosion resistance, was employed (unpublished results).
Zetasizer NS (Malvern, UK) was used to determine zeta (ζ) potential (surface charge) of ceria particles, based on measured electrophoretic mobility of the particles. The particle size distribution (PSD) was determined by dynamic light scattering method using the same instrument. Prior to the measurements, the samples were subjected to 20 min ultrasound treatment. Deposition time was calculated to obtain 7 µm thick coatings. The 200 mL plating cell was placed in the center of the ultrasonic bath, schematically presented in Figure 1. Temperature of the plating solution was monitored, controlled, and kept constant during deposition at 24 ± 1 °C. Low-carbon steel (AISI-1010, 8 cm2) was used as cathode and pure zinc as anode. Before electrodeposition the cathode was polished to a smooth surface with different grits of emery paper (600–2000), degreased in a saturated solution of sodium hydroxide in ethanol and etched in 10% HCl solution. The distilled water wash was applied after every step. The anode was activated by dipping in 10% HCl solution followed by water wash.
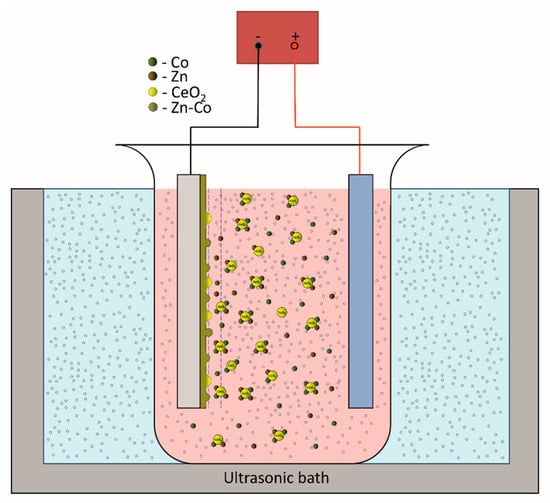
Figure 1.
Schematic presentation of the deposition set-up.
The ultrasound power density generated by ultrasonic bath (Bandelin electronics, frequency 35 kHz) was 38.7 W cm3, calculated calorimetrically [20]. The morphology and composition of the deposited coatings were determined by scanning electron microscopy equipped with energy dispersive X-ray spectroscopy (Ultra Plus, Carl-Zeiss, Oberkochen, Germany). Surface roughness was determined by 3D optical microscope Leica DCM3D (Leica Microsystems, Wetzlar, Germany). Coating crystallography was analyzed by Bruker D8 Advance (Billerica, MA, USA) using the Cu Kα radiation in the Bragg Brentano configuration. The corrosion properties of the coatings were studied by potentiodynamic polarization tests, electrochemical impedance spectroscopy (EIS) and scanning Kelvin probe (SKP). The polarization measurements were performed in potential range ±250 mV with the scan rate of 0.25 mV s−1. EIS was performed using a Reference 600 potentiostat/galvanostat/ZRA (Gamry Instruments, Warminster, PA, USA). The impedance spectra were recorded at open circuit potential after establishing constant open circuit potential (30 min) in the frequency range 100 kHz–10 mHz, with 7 points per decade and 10 mV amplitude. Experiments were carried out in 3 wt.% NaCl solution in a three-electrode cell placed inside a Faraday cage. Deposited Zn-Co and composite Zn-Co-CeO2 coatings were used as working electrodes (exposed area 1.0 cm2), a platinum grid was used as a counter electrode and saturated calomel electrode as a reference electrode. SKP (SKP-EC1, Wicinski-Wicinski) was used in situ to detect the Volta potential of the deposited samples both with and without artificial defects, in order to study self-healing properties of the coatings. SKP technique is non-destructive electrochemical technique that allows determining the localized in-situ potential changes on the coating surface, which is impossible to determine by classical electrochemical techniques like a polarization test and EIS. SKP measures the Volta potential difference between the working electrode (examined coating) and reference electrode (SKP probe). Measured Volta potential difference changes linearly with corrosion potential () [21]. The SKP tip is made of Ni-Cr alloy. Before every scan the tip was cleaned and calibrated in saturated CuSO4 solution. The surface potential scan of the coatings without defect was performed during 24h in the device chamber on the 2000 × 2000 µm area (schematically showed in Figure 2a). The x and y steps were 50 µm and Δh 0.1 µm. The composite coatings with artificial defect were monitored by SKP line scan on a 4000 µm area (schematically presented at Figure 2b) before and after immersion in 3 wt.% NaCl. The experiments were obtained in the device chamber with controlled and stable environment, i.e., temperature (22 °C) and humidity (85%). The device chamber was kept closed during the whole measurement time in order to avoid the change of the measurement conditions. Every experiment was repeated at least three times.
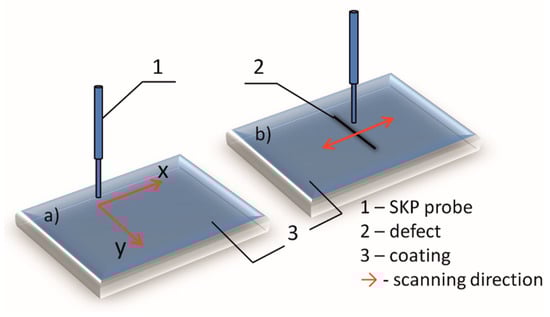
Figure 2.
Schematic presentation of SKP measurements: (a) surface scanning on unbounded coatings and (b) line scanning over artificial defect.
3. Results and Discussion
3.1. Characterization of Plating Solutions
The stability of aqueous ceria sol and ceria powder particles dispersed in water was studied in terms of zeta potential (ξ) and particle size distribution (PSD). Since it is important to get information on the stability of the overall plating solutions containing CeO2 particles, the study was extended to their stability when incorporated in the electrolytic bath with other constituents. The PSD of examined solutions is presented in Figure 3.
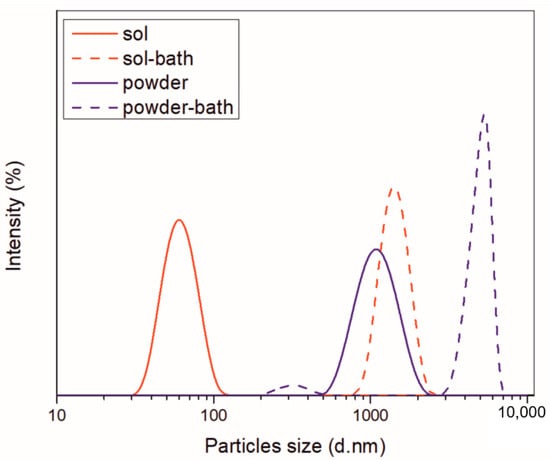
Figure 3.
PSD of ceria sol and ceria powder before and after incorporation in deposition bath.
The presence of one Gaussian peak revealed that the aqueous ceria sol was monomodal, composed of nanosized particles in the range 32.7–122.4 nm, with the average size of hydrodynamic diameters, Zav = 59.1 nm. Stability of particles was ensured by high positive surface electrostatic charge (ξ = 47.5 mV), as ζ potential of ca. 30 mV (positive or negative) is normally required to achieve a reasonably stable dispersion. The incorporation of other constituents into the electrolytic bath affected remarkably the PSD. The increase in ionic strength (from 0.479 to 233 mS cm−1) caused a drastic drop in ξ values (2.61 mV). When added into the electrolyte, the particles showed a higher tendency to agglomerate, as documented by a sharp shift toward much bigger diameters. The most abundant size of particles aggregates was at 1435 nm.
In the case of ceria powder in aqueous solution, although composed of nanometric primary units, as confirmed by SEM analysis (Figure 4), it was agglomerated. The use of ultrasound agitation failed at effectively de-agglomerating the particle clusters. The size of particle diameters was in the 531–1990 nm range, with Zav = 1316 nm. When adding the ceria powder into the electrolyte, the high ionic strength of the bath (260 mS cm−1) caused a decrease in ξ-values (from initial 49 to near 0 mV), provoking an intense destabilization of the dispersed particles. Particles started to aggregate rapidly, forming huge clusters. The 94.9% abundance of 4979 nm fraction along with only 5.1% of smaller-sized ones at 325.7 nm was recorded. Although the measurements could not be performed under the US agitation, they provided a comparison of the aggregation phenomena occurring in the plating solution when using sol and powder.
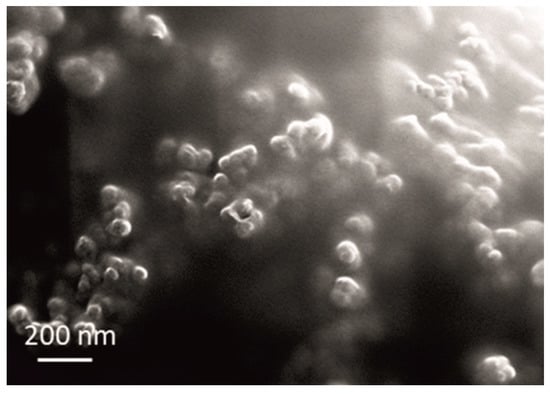
Figure 4.
SEM micrograph of the used commercial CeO2 powder.
3.2. Morphology and Composition of Zn-Co and Zn-Co-CeO2 Coatings
The cauliflower-like agglomerates of alloy grains were obtained by Zn-Co electrodeposition (Figure 5). The size of these agglomerates was very different, reaching 30 µm (Figure 5a). The cauliflower-like agglomerates of Zn-Co alloy grains were formed of small compact agglomerates, without a clear boundary among grains inside them (Figure 5b).
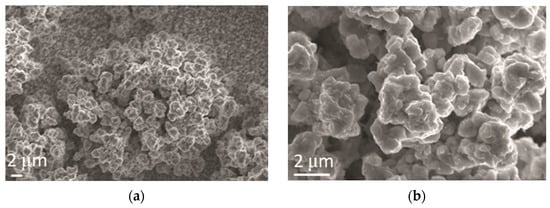
Figure 5.
Morphology of Zn-Co alloy obtained by electrodeposition at a current density of 2 A dm−2. Magnification: (a) ×5000 and (b) ×20,000.
After the addition of CeO2 in powder form, cauliflower-like agglomerates remained the dominant morphological form of the alloy electrodeposits. However, it can be observed (Figure 6) that the distribution of the agglomerates was more uniform and finer, decreasing the agglomerate size down to 2 µm.
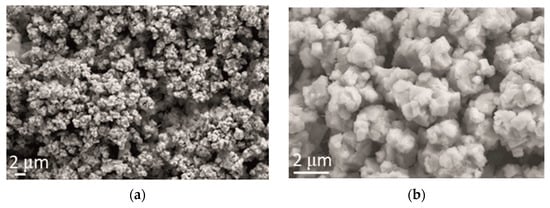
Figure 6.
Morphology of Zn-Co-CeO2 coating obtained by electrodeposition at a current density of 2 A dm−2 from the electrolyte with an addition of CeO2 in the form of powder. Magnification: (a) ×5000 and (b) ×20,000.
The addition of ceria sol had a pronounced effect on the coatings’ morphology, as shown in Figure 7, and apparently a more compact and uniform structure was obtained, composed of round-shaped grains (Figure 7a). These round shapes consisted of small coral-like forms (Figure 7b), of about 500 nm size (Figure 7c). An addition of the ceria sol caused a transformation of the Zn-Co coating morphology from that with the cauliflower-like forms obtained without and with an addition of ceria powder to that composed of coral-like forms. Similar findings were reported by Ghaziof [22], the cauliflower-like structure was missed when a higher concentration of Al2O3 sol was used as alumina source in Zn-Ni-Al2O3 composite coatings deposition. This kind of coral-like structure can provide beneficial effects, for instance, Hu [23] showed that superior thermoelectric performance could be achieved, and Tao [24] found that CeO2/GNs composites with 3D coral-like structure possess superior specific capacitance, high rate performance and long service life.
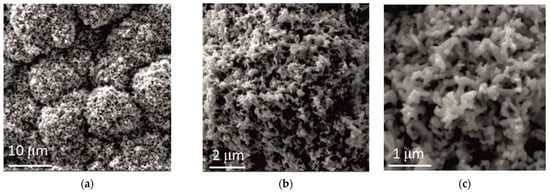
Figure 7.
Morphology of Zn-Co-CeO2 coating obtained by electrodeposition at a current density of 2 A dm−2 from the electrolyte with an addition of CeO2 in the form of sol. Magnification: (a) ×5000, (b) ×20,000 and (c) ×50,000.
The source of the CeO2 particles showed a large influence on the ceria content in the coatings, as determined by EDAX (Table 1). Twice higher amount of cerium was registered when ceria sol was used.

Table 1.
The chemical composition of the Zn-Co and Zn-Co-CeO2 composite coatings.
In order to achieve good properties of the final product, the distribution of the particles in the electrodeposited coatings should be homogeneous. The mappings of all elements in the Zn-Co alloy coating and Zn-Co-CeO2 composite coatings are shown in Figure 8. A favorable effect of utilizing ceria sol on ceria distribution could be seen. In addition, based on the cross-section images (inserts in Figure 8), the beneficial effect of ceria sol on compactness and regular growth of the coating was indisputable.
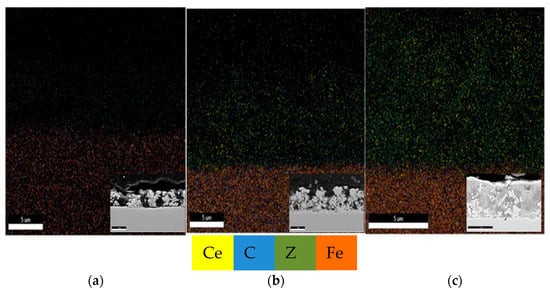
Figure 8.
Element mapping of (a) Zn-Co, (b) Zn-Co-CeO2 (CeO2 powder) and (c) Zn-Co-CeO2 (CeO2 sol) cross sections.
3.3. Surface Roughness Determination
In order to analyze the surface finish of the coatings the surface roughness was measured, and roughness parameters are presented in Table 2. According to the ISO 25178, Sz is maximum height and Sa is arithmetical mean height. Based on the measured Sa and Sz parameters it can be concluded that incorporation of the ceria particles led to the decrease of the surface roughness compared to matrix (pure Zn-Co alloy coating). It is also obvious that samples obtained from solution containing ceria sol had lower values of both roughness parameters compared to the composite coating obtained from solution with commercial ceria powder. This measurement confirmed the beneficial effect of ceria sol as particle source on the surface finish of the composite coating. These results are in good correlation with results gained by SEM-EDAX analyses.
Table 2.
Comparison of surface roughness parameters (Sz-maximum height (µm); Sa-arithmetical mean height (µm)) of examined coatings.
3.4. X-ray Diffraction Analyses
Figure 9 shows the XRD patterns obtained for the Zn-Co alloy coatings obtained without and with an addition of CeO2 in the form of powder and sol. It can be noticed that the diffractograms obtained with the addition of CeO2 were mutually similar, and to a certain extent different from that for Zn-Co coating. Comparing the obtained diffractograms with the corresponding JCPDS standards, it followed that all marked diffraction peaks could be attributed to a hexagonal close-packed crystal structure of zinc (JCPDS no. 03-065-3358). When the amount of cobalt is less than 5 wt.% it totally dissolved in zinc lattice and formed the solid solution with zinc, thus, the peaks corresponding to alloy phases were not detected. The ceria peak was missing due to the small amount and size of the incorporated particles. The incorporation of ceria particles into the matrix caused the increase of intensity of peaks corresponding to (002), (100), (102), (103) and (110) planes. The intensity of (101) plane remained the highest suggesting pyramidal growth of deposit.
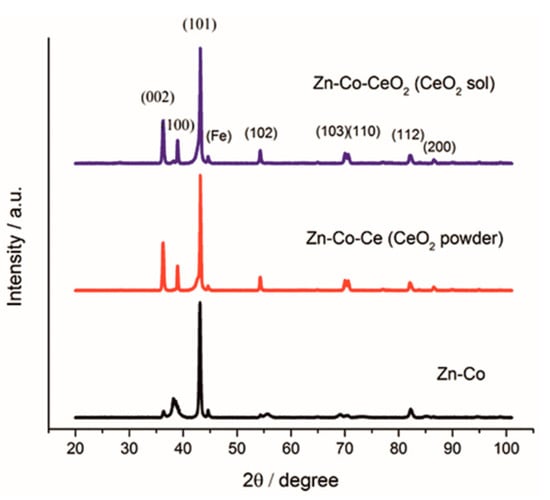
Figure 9.
XRD pattern of Zn-Co, Zn-Co-CeO2 (CeO2 powder) and Zn-Co-CeO2 (CeO2 sol) coatings.
3.5. Polarization Tests and Electrochemical Impedance Spectroscopy
Corrosion behavior was analyzed first by polarization measurements in a NaCl solution, and obtained E–log j dependences are shown in Figure 10. The beneficial effect of CeO2 could be clearly seen, shifting the anodic currents, representing active dissolution, to smaller values. The values of corrosion potential and corrosion current density, determined from the E–log j curves are shown in Table 3. The more negative corrosion potential of composite coatings indicated the barrier effect provided by ceria incorporation. Both composite coatings showed considerably smaller corrosion current density, confirming that CeO2 particles provided a good barrier, slowing down the ingress of corrosive media. The smallest corrosion rate was determined for sol-derived composite coating.
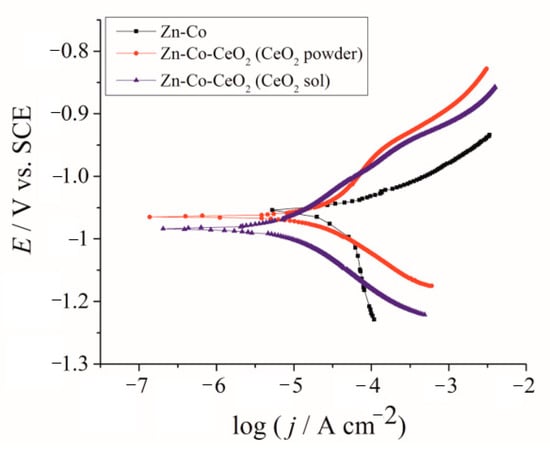
Figure 10.
Tafel polarization plots of Zn-Co; Zn-Co-CeO2 (CeO2 powder) and Zn-Co-CeO2 (CeO2 sol) composite coatings.
Table 3.
The values of corrosion potential, Ecorr, and corrosion current density, jcorr, for different coatings in 3% NaCl.
The EIS diagrams provided deeper insight into the role of ceria in the corrosion behavior of Zn-Co alloy coatings. To determine the influence of CeO2 particles, as well as their source, in a shorter time, thin coatings (7 µm) were analyzed. The EIS was followed for samples continuously exposed to NaCl solution and results are presented in Figure 11, Figure 12, Figure 13 and Figure 14.
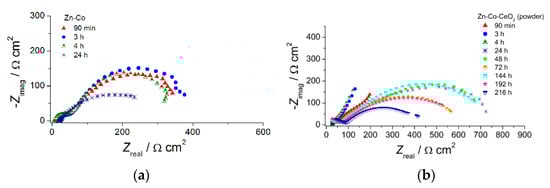
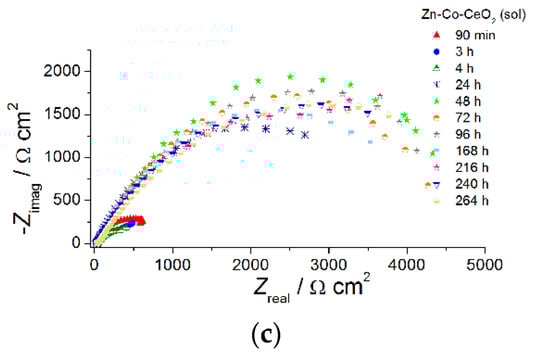
Figure 11.
The Nyquist plots of (a) Zn-Co, (b) Zn-Co-CeO2 (CeO2 powder) and (c) Zn-Co-CeO2 (CeO2 sol) composite coatings.
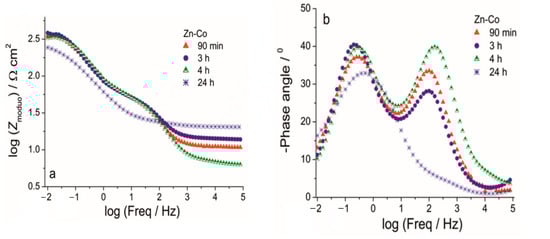
Figure 12.
The Bode (a) modulus and (b) phase angle plots for Zn-Co coating during exposure to NaCl solution.
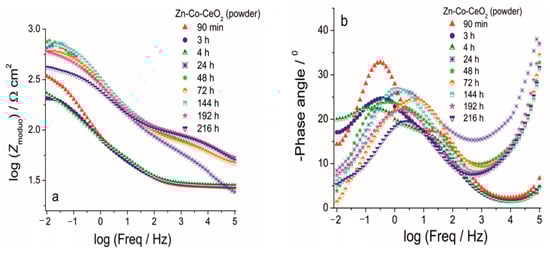
Figure 13.
The Bode (a) modulus and (b) phase angle plots for Zn-Co-CeO2 (CeO2 powder) coating during exposure to NaCl solution.
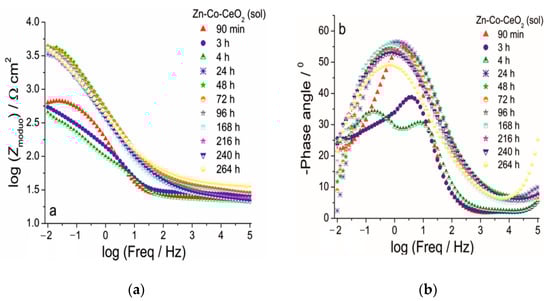
Figure 14.
The Bode (a) modulus and (b) phase angle plots for Zn-Co-CeO2 (CeO2 sol) coating during exposure to NaCl solution.
The Nyquist plots for all examined coatings are presented in Figure 11. The plots mainly comprised two time constants in the investigated frequency range. It can be seen from Figure 11a that for Zn-Co coating impedance slightly increased after 3 h while longer immersion times led to a decrease in semicircle diameters, suggesting deterioration of protective properties this coating. The opposite behavior was observed for the composite coatings (Figure 11b,c). The dominant semicircle, related to the charge–transfer process, increased during immersion time, which could be a consequence of the formation of a pseudo-passive layer of corrosion products on the metal surface in contact with electrolyte. However, since this behavior was maintained during prolonged exposure, it indicated the presence of a small solubility product, i.e., ceria layer. This kind of behavior was more pronounced for the composite coating deposited from solution containing ceria sol where the radius of depressed semicircle retained high values during 264h in corrosion media. Differences among the samples and their behavior during immersion time could be better seen from Bode plots, shown in Figure 12, Figure 13 and Figure 14. The impedance modulus of the Zn-Co alloy coating (Figure 12a) decreased after 24h, suggesting a degradation of this coating. Two time constants are clearly visible (Figure 12b) from the early exposure to NaCl solution. The one at medium frequencies may be ascribed to the layer of corrosion products of the Zn-Co alloy coating [25]. The phase angle maximum at lower frequencies was associated to electrochemical processes occurring at the galvanic couple of Zn-Co alloy coating and steel substrate [25]. After 24 h there was only a shoulder of the time constant at medium frequencies, due to the breakdown of the corrosion product layer, and the phase angle plot was dominated by the time constant at low frequencies, indicating the advancement of corrosion.
The improvement achieved by CeO2 incorporation is shown in Figure 13 and Figure 14. The phase angle plots in Figure 13 and Figure 14 again possess two maxima, where the one at a higher frequency was related to the corrosion product layer at the Zn-Co alloy and it disappeared during the first 24 h of immersion, the same as was observed for the CeO2-free coating. Impedance values were up to two times higher in the case of the composite coating containing CeO2 powder (Figure 13a) as compared to the Zn-Co alloy. The greater impedance modulus recorded after 90 min exposure to NaCl solution was probably the result of the barrier that CeO2 particles provided to the ingress of electrolyte. However, due to the porous coating morphology this kind of protection was only temporarily provided. Electrolyte penetrated the coating with further exposure and after 3h the modulus was considerably decreased to 210 Ω cm2, showing similar values as those obtained for the Zn-Co alloy coating. The second time constant was hardly visible after 3h immersion, and after 24h immersion phase angle was a single one again (Figure 13b), positioned at intermediate frequencies, between the frequencies of the original two time constants. This kind of response was typical for self-healing action, in this case provided by CeO2 particles. The self-healing was confirmed with further exposure time, with the increase of impedance and retaining high impedance modulus values in the range of 575–760 Ω cm2. As the electrolyte kept penetrating the composite coating, ceria powder particles diffused through the coating and upon contact with corroding steel substrate they precipitated on the surface. Bearing in mind the very small ceria solubility constant [26,27], the high values of impedance modulus at small frequencies could be expected. The improved resistivity achieved was maintained during the test period of one week, and it decreased after 9 days of exposure to corrosive agents.
The use of ceria sol provided better protection ability, in comparison to the use of commercial ceria powder, in the presence of the corrosive media, as shown in Figure 14. Higher initial impedance modulus values of ~630 Ω cm2 were recorded for this composite coating after 90 min exposure, suggesting a good barrier provided by well-dispersed ceria.
Composite coating resistivity also decreased after further exposure time, as a consequence of electrolyte penetration throughout the coating and two well-resolved time constants were developed after 4 h. An interesting feature occurred after further exposure time. Namely, impedance moduli at small frequencies considerably increased after 24 h, reaching 3310 Ω cm2, and their values oscillated among 3150–4450 Ω cm2 during following next 11 days (Figure 14a). The evolution of phase angle plots during exposure to NaCl solution is shown in Figure 14b. There was one phase angle peak at medium frequencies (~2 Hz) after 90 min, an uncompleted peak after 3 days and two well-developed phase angle peaks emerged after 4 days. After 24 h there was only one broad phase angle peak positioned at low frequencies, which remained almost unchanged throughout all the time. Both phenomena, the impedance modulus increase at the lowest frequency and a phase angle peak broadening, indicated active protection achieved by sol-derived composite coating, which was most likely a result of the self-healing effect provided by ceria. Better resistivity provided by Zn-Co-CeO2 (CeO2 sol) composite coating compared to that based on powder CeO2 particles, also providing self-healing, was due to the more compact coral-like morphology, which was, in turn, the result of the more homogenously distributed particles that did not form large agglomerates.
The values of the low frequency impedance modulus of the Zn-Co-CeO2 sol-derived coating were higher than for other samples throughout the test time, being almost six times higher than the values determined for composite-powder-based coating and over 11 times higher than for the pure Zn-Co alloy coating. The high modulus values of this sample were maintained throughout the entire period of evaluation.
The activity at the metal substrate could be presented by values of charge–transfer resistance, Rct, derived from fitting of the EIS data by commonly used equivalent electrical circuits for coatings comprising one or two time constants [6,14]. The small initial decrease of Rct for all coatings (Figure 15) was related to contact of the electrolyte with the metal substrate. It was followed with a Rct increase for composite coatings, whereas for the Zn-Co alloy coating Rct values kept decreasing, indicating that a greater area of metal substrate was in contact with the corrosive agent. The plateau of Rct values corresponded to the formation of a passive layer on the metal surface, preventing further electrochemical activity of the substrate. Significantly greater Rct values for sol-derived composite coating compared to the one originating from powdered ceria, confirmed it improved protective properties.
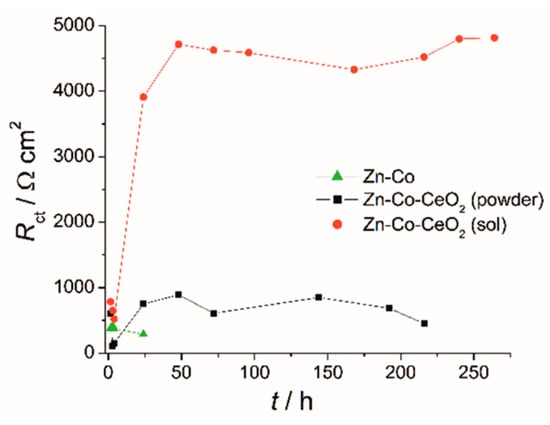
Figure 15.
Time dependence of charge–transfer resistance for Zn-Co and Zn-Co-CeO2 coatings during exposure to 3 wt % NaCl.
3.6. Scanning Kelvin Probe (SKP) Surface Scan of Coatings
Electrochemical impedance spectroscopy is a very common and useful technique for studying corrosion behavior of different coatings systems. The insufficiency of this method is that results are associated with overall macroscopic, i.e., average response of the electrode. As a consequence, local electrochemical processes in microdefects cannot be separately investigated. The scanning Kelvin probe technique allows in-situ determination of localized potential changes on the coating surface [21,28,29]. SKP measures the Volta potential between the device’s tip and working electrode (coating). The determined Volta potential is proportional to the corrosion potential [21]. The Volta potential surface distribution of the Zn-Co, Zn-Co-CeO2 (CeO2 powder) and Zn-Co-CeO2 (CeO2 sol) coatings during 24 h in the device chamber is presented in Figure 16, Figure 17 and Figure 18, respectively.
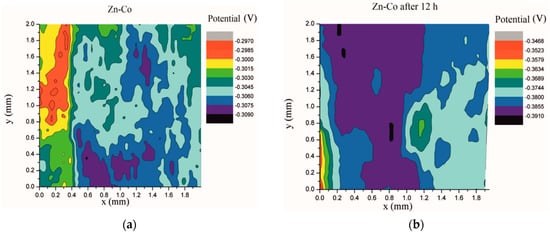
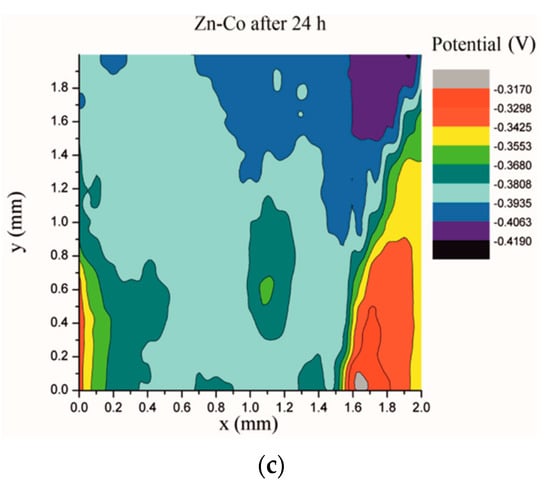
Figure 16.
Volta potential difference surface scan of Zn-Co coating: (a) initial distribution, (b) after 12 h and (c) after 24 h in device chamber.
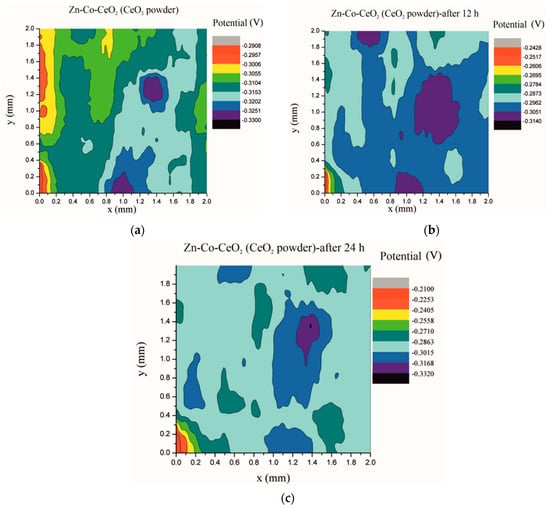
Figure 17.
Volta potential surface scan of Zn-Co-CeO2 (CeO2 powder) coating: (a) initial distribution, (b) after 12 h and (c) after 24 h in device chamber.
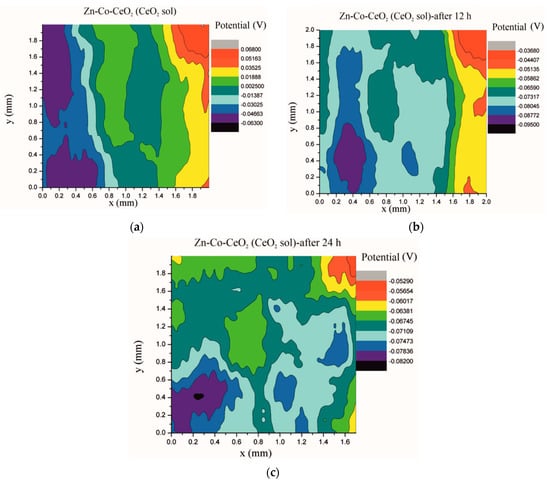
Figure 18.
Volta potential surface scan of Zn-Co-CeO2 (CeO2 sol) coating: (a) initial distribution, (b) after 12 h and (c) after 24 h in device chamber.
The higher the Volta potential difference (ΔV), the greater the driving force for the localized corrosion, so a larger number of anodic and cathodic sites develop on the surface, resulting in intensive microgalvanic corrosion. The Volta potential distribution on the pure Zn-Co surface (Figure 16) ranged from –0.2970 V to –0.3090 V, i.e., ΔV value for the initial mapping of the Zn-Co coating was 0.012 V, which was a small value and indicated that there were no pronounced microgalvanic couplings on this alloy coating. After 12 h, the Volta potential was in the range of –0.3468 V to –0.3910 V (∆V = 0.0442 V) and after 24 h it considerably increased to ∆V = 0.102 V (between −0.3170 V and –0.4190 V). Thus, the Volta potential difference showed progressively higher values during the monitored period, indicating advancement of corrosion processes. Figure 17 shows that the initial Volta potential distribution for the composite coatings obtained from the plating solution with ceria powder (Zn-Co-CeO2 (CeO2 powder)) was ∆V = 0.0872 V, after 12 h ∆V it changed to 0.0712 V, and after 24 h the ∆V reached 0.122 V. The initial Volta potential difference on the Zn-Co-CeO2 (CeO2 sol) composite coating surface was ∆V = 0.131 V, after 12 h the ∆V value decreased to 0.0582 V, and after 24 h it reached the significantly lower value (∆V = 0.0291 V) as compared to the initial one (Figure 18). It could be noticed that the Volta potential difference of the Zn-Co-CeO2 (CeO2 sol) composite coating was significantly more positive compared to both Zn-Co-CeO2 (CeO2 powder) composite coating and Zn-Co alloy. The Volta potential change was smaller after 24 h than after 12 h, indicating that the Zn-Co-CeO2 (CeO2 sol) coating provided a certain corrosion resistance under the stated conditions. This was most likely due to the higher content of small and well-distributed ceria particles in this composite coating, compared to Zn-Co-CeO2 (CeO2 powder), which can play a role as nanofillers of the pores leading to the reduction of diffusion paths of the electrolyte through the coating. Also, ceria is a well-known corrosion inhibitor, and the shift of the Volta potential to more positive values during this time could be due to precipitation of ceria on the active sites, manifesting a healing effect [30,31,32]. These results were in a good agreement with EIS results.
3.7. SKP Line Scans of Coating with Artificial Defect
To further analyze the self-healing behavior of the Zn-Co-CeO2 (CeO2 sol) composite coating, an artificial defect was made on the surface of this coating, and the SKP method was used to measure the Volta potential over coating and defect area. These localized measurements could be very useful in determining the inhibition ability of different nanoparticles in localized defects [13]. The Volta potential was monitored before immersion and after different immersion time (10 min, 1 h and 2 h) in a chloride-rich environment (3 wt.% NaCl). From the SKP line scan before immersion in NaCl (black line), shown in Figure 19, a drop of the Volta potential can be seen when the tip is placed over defect area. The ∆V value in this case was 0.146 V, indicating the high corrosion driving force. After 10 min (red line) in NaCl the Volta potential in the defect decreased to ∆V = 0.054 V and shifted toward positive values, suggesting the suppression of corrosion propagation in artificial defect. After 1 h (blue line) in corrosion media the ∆V value was lower, 0.046 V, and after 2 h was reduced to 0.039 V (pink line). After 2 h the Volta potential in the defect reached the potential of the surrounding undamaged coating. This result proved the self-healing ability of the ceria particles present in the composite coatings. We assume that different scenarios are possible. The ceria particles migrated and precipitated on the active corrosion sites at the defect. In addition, reduction of CeO2 to Ce2O3 occurred in the corrosion media, so that Ce2O3 as a soluble compound could release the Ce3+ ions into the solution [30] providing a self-healing action. The Raman study performed in our previous work showed that Ce3+ ions are present in synthesized ceria sol nanosized particles [33]. Due to diffusion the Ce3+ ions reached the defect area and formed thermodynamically favorable cerium-hydroxide (Ce(OH)4) and oxide (CeO2·2H2O) [30]. The reduction of oxygen generated OH– ions on the defect surface, increasing the local pH and, according to the Pourbaix diagram, accelerated the formation of Ce(OH)4 and CeO2·2H2O [30]. The ceria precipitations along with other corrosion products in the coating defect, i.e., corroding sites, could reconstruct the protective film during time, consequently, slowing down the advancement of corrosion. The percentage of the self-healing rate (%SHtime) after a different immersion time in NaCl can be calculated based on the ∆V value in the defect according to equation:
where ∆Vbefore is the Volta potential difference in the defect before immersion in NaCl, the ∆Vafter is the Volta potential difference in the defect after a certain time in the corrosive solution. Thus, after 10 min in a chloride environment the %SH10min was 62.80%, after 1 h %SH1h = 68.49% and after 2 h in NaCl %SH2h = 73.28%. Thus, the self-healing ability of the examined composite coating was expressed after only 2 h in a chloride-rich environment. The SKP results correlated well with EIS results.
%SHtime=(∆Vbefore − ∆Vafter)/(∆Vbefore)
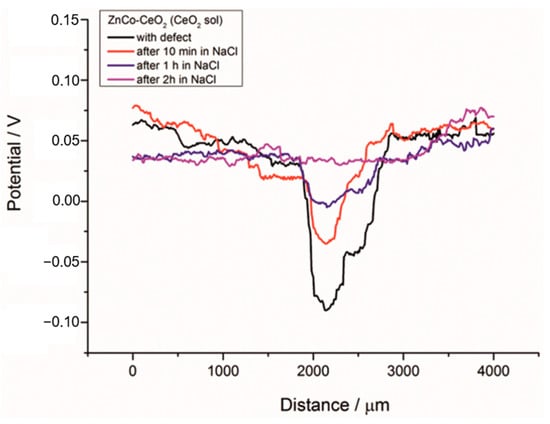
Figure 19.
SKP line scan of the Zn-Co-CeO2 (CeO2 sol) composite coatings with artificial defect before and after immersion in 3 wt.% sodium chloride.
4. Conclusions
The novel Zn-Co-CeO2 composite coatings were successfully deposited galvanostatically under ultrasound agitation and compared to pure Zn-Co composite coatings deposited under the same conditions. Two different particle sources were used and compared, ceria powder and synthesized ceria sol. After analysis of all results gathered by different methods the following could be concluded:
- −
- The ceria sol proved to be superior as a particle source in the plating solution compared to commonly used commercial powder, in terms of dispersity and stability of the plating solution.
- −
- The use of ultrasound agitation failed at effectively de-agglomerating the commercial powder particle clusters. The size of the particle diameter (94.9% abundance) was 4979 nm.
- −
- The ceria particles incorporated into the Zn-Co matrix caused morphological changes and refinement of grain sizes. The changes in morphology were more obvious when ceria sol was used; the cauliflower-like structures were replaced by more uniform and compact coral-like structures. The size of cauliflower-like agglomerates of alloy grains was reduced from 30 µm to 2 µm when ceria powder was incorporated into the matrix. When ceria sol was used as a particle source, coral-like forms with a size of about 500 nm were obtained. The incorporated particles were distributed homogeneously throughout the coating, as confirmed by mapping. The electrodeposition from the solution containing ceria sol was beneficial for ceria content, homogeneous distribution of particles in the deposit and finer surface finish (lower roughness and better compactness) of the coating.
- −
- The performed electrochemical tests, i.e., polarization tests, EIS and SKP, showed that Zn-Co coatings doped with ceria particles during ultrasound-assisted electrodeposition possess protective properties either in terms of barrier or self-healing activity.
- −
- The Zn-Co-CeO2 (CeO2 sol) composite coating showed superior protective properties compared to Zn-Co-CeO2 (CeO2powder) coating as a result of compact and uniform morphology as well as higher ceria content that proved to be an efficient self-healing agent. The corrosion current density of Zn-Co-CeO2 (CeO2 sol) composite coating was lower and the Rct value four times higher compared to Zn-Co-CeO2 (CeO2 powder) coating.
- −
- The SKP surface scan showed a shift of potential to more positive values after 24 h in 3 wt% NaCl for Zn-Co-CeO2 (CeO2 sol) composite coating, indicating advanced protection of steel due to the self-healing effect of ceria particles. SKP results allowed calculating the percentage of the self-healing rate of the artificial defect, found to be 73.28% after 2 h in a chloride-rich environment.
- −
- The combination of traditional electrochemical techniques (polarization tests and EIS) and SKP highlighted a variety of results hardly to be accomplished if such methods were simply used alone.
Author Contributions
Conceptualization M.R. and J.B.B.; investigation M.R., J.B.B., L.S.Ž. and A.S.-P.; Writing—original draft preparation M.R.; writing—review and editing, N.D.N., J.B.B., L.S.Ž., A.S.-P. and E.G.-L.; validation A.S.-P., J.B.B., N.D.N., E.G.-L. and L.S.Ž.; resources, E.G.-L. and J.B.B.; visualization, M.R. All authors have read and agreed to the published version of the manuscript.
Funding
This research was funded by the Ministry of Education, Science and Technological Development of the Republic of Serbia (Contract Nos.451-03-9/2021-14/200135, 451-03-9/2021-14/200026 and 451-03-9/2021-14/200017). This work was partially supported by the Ministerio de Ciencia e Innovación of the Spanish Government (EXP-00137314/CER-20191003).
Institutional Review Board Statement
Not applicable.
Informed Consent Statement
Not applicable.
Data Availability Statement
The data presented in this study are available on request from the corresponding author or co-authors. The data are not publicly available.
Acknowledgments
The authors are thankful to Larraitz Ganborena for all help during scanning Kelvin probe experiments. The COST Action MP1407 is gratefully acknowledged for networking support.
Conflicts of Interest
The authors declare no conflict of interest.
References
- Bajat, J.; Kačarević-Popović, Z.; Mišković-Stanković, V.; Maksimović, M. Corrosion behaviour of epoxy coatings electrodeposited on galvanized steel and steel modified by Zn–Ni alloys. Prog. Org. Coat. 2000, 39, 127–135. [Google Scholar] [CrossRef]
- Anwar, S.; Khan, F.; Zhang, Y. Corrosion behaviour of Zn-Ni alloy and Zn-Ni-nano-TiO2 composite coatings electrodeposited from ammonium citrate baths. Process Saf. Environ. 2020, 141, 366–379. [Google Scholar] [CrossRef]
- Bajat, J.; Mišković-Stanković, V.; Kačarević-Popović, Z. The influence of steel surface modification by electrodeposited Zn–Fe alloys on the protective behaviour of an epoxy coating. Prog. Org. Coat. 2003, 47, 49–54. [Google Scholar] [CrossRef]
- Rashmi, D.; Pavithra, G.P.; Praveen, B.M. Electrodeposition and Corrosion Analysis of Zn-Fe Alloy Coatings. IJAEML 2019, 3, 38–44. [Google Scholar] [CrossRef]
- Pandiyarajan, S.; Ganesan, M.; Liao, A.H.; Manickaraj, S.S.M.; Huang, S.T.; Chuang, H.C. Ultrasonic-assisted supercritical-CO2 electrodeposition of Zn-Co film for high-performance corrosion inhibition: A greener approach. Ultrason. Sonochem. 2021, 72, 105463. [Google Scholar] [CrossRef]
- Riđošić, M.; García-Lecina, E.; Salicio-Paz, A.; Bajat, J. The advantage of ultrasound during electrodeposition on morphology and corrosion stability of Zn-Co alloy coatings. Trans. IMF 2020, 98, 114–120. [Google Scholar] [CrossRef]
- Bhat, R.S.; Shet, V.B. Development and characterization of Zn–Ni, Zn–Co and Zn–Ni–Co coatings. Surf. Eng. 2020, 36, 429–437. [Google Scholar] [CrossRef]
- Mokabber, T.; Rastegari, S.; Razavizadeh, H. Effect of electroplating parameters on properties of Zn–nano-TiO2 composite coatings. Surf. Eng. 2013, 29, 41–45. [Google Scholar] [CrossRef]
- Xia, X.; Zhitomirsky, I.; McDermid, J.R. Electrodeposition of zinc and composite zinc-yttria stabilized zirconia coatings. J. Mater. Process Technol. 2009, 209, 2632–2640. [Google Scholar] [CrossRef]
- García-Lecina, E.; García-Urrutia, I.; Díez, J.A.; Morgiel, J.; Indyka, P. A comparative study of the effect of mechanical and ultrasound agitation on the properties of electrodeposited Ni/Al2O3 nanocomposite coatings. Surf. Coat. Technol. 2012, 206, 2998–3005. [Google Scholar] [CrossRef]
- Kondo, K.; Ohgishi, A.; Tanaka, Z. Electrodeposition of Zinc-SiO2 Composite. J. Electrochem. Soc. 2000, 147, 2611. [Google Scholar] [CrossRef][Green Version]
- Roventi, G.; Bellezze, T.; Fratesi, R. Electrodeposition of Zn–SiC nanocomposite coatings. J. Appl. Electrochem. 2013, 43, 839–846. [Google Scholar] [CrossRef]
- Montemor, M.F.; Pinto, R.; Ferreira, M.G.S. Chemical composition and corrosion protection of silane films modified with CeO2 nanoparticles. Electrochim. Acta 2009, 54, 5179–5189. [Google Scholar] [CrossRef]
- Fedel, M.; Ahniyaz, A.; Ecco, L.G.; Deflorian, F. Electrochemical investigation of the inhibition effect of CeO2 nanoparticles on the corrosion of mild steel. Electrochim. Acta 2014, 131, 71–78. [Google Scholar] [CrossRef]
- Calado, L.M.; Taryba, M.G.; Carmezim, M.J.; Montemor, M.F. Self-healing ceria-modified coating for corrosion protection of AZ31 magnesium alloy. Corr. Sci. 2018, 142, 12–21. [Google Scholar] [CrossRef]
- Selvakumar, K.; Jeyasubramanian, K.; Sharmila, R. Smart coating for corrosion protection by adopting nano particles. Prog. Org. Coat. 2012, 74, 461–469. [Google Scholar] [CrossRef]
- Camargo, M.K.; Tudela, I.; Schmidt, U.; Cobley, A.J.; Bund, A. Ultrasound assisted electrodeposition of Zn and Zn-TiO2 coatings. Electrochim. Acta 2016, 198, 287–295. [Google Scholar] [CrossRef]
- Katamipour, A.; Farzam, M.; Danaee, I. Effect of sonication on anticorrosion and mechanical properties of electrodeposited Ni-Zn-TiO2 nanocomposite coatings. Surf. Coat. Technol. 2014, 254, 358–363. [Google Scholar] [CrossRef]
- Tudela, I.; Yhang, Y.; Pal, M.; Kerr, I.; Cobley, A. Ultrasound-assisted electrodeposition of composite coatings with particles. Surf. Coat. Technol. 2014, 259, 363–373. [Google Scholar] [CrossRef]
- Kikuchi, T.; Uchida, T. Calorimetric method for measuring high ultrasonic power using water as a heating material. J. Phys. Conf. Ser. 2011, 279, 012012. [Google Scholar] [CrossRef]
- Liu, X.; Gu, C.; Ma, Z.; Ma, X.; Hou, B. pH responsive containers based on modified hollow TiO2 for active and passive protection of carbon steel. J. Electrochem. Soc. 2018, 165, C145–C154. [Google Scholar] [CrossRef]
- Ghaziof, S.; Gao, W. Zn-Ni-Al2O3 nano-composite coatings prepared by sol-enhanced electroplating. App. Surf. Sci. 2015, 351, 869–879. [Google Scholar] [CrossRef]
- Hu, X.; Chen, G.; Wang, X. An unusual coral-like morphology for composites of poly(3,4-ethylenedioxythiophene)/carbon nanotube and the enhanced thermoelectric performance. Compos. Sci. Technol. 2017, 144, 43–50. [Google Scholar] [CrossRef]
- Tao, Y.; Ruiyi, L.; Haiyan, Z.; Zaijun, L. Ceria nanoparticles uniformly decorated on graphene nanosheets with coral-like morphology for high-performance supercapacitors. Mat. Res. Bull. 2016, 78, 163–171. [Google Scholar] [CrossRef]
- Simões, A.M.; Torres, J.; Picciochi, R.; Fernandes, J.C.S. Corrosion inhibition at galvanized steel cut edges by phosphate pigments. Electrochim. Acta 2009, 54, 3857–3865. [Google Scholar] [CrossRef]
- Dahle, J.T.; Arai, Y. Environmental geochemistry of cerium: Applications and toxicology of cerium oxide nanoparticles. Int. J. Environ. Res. Public Health 2015, 12, 1253. [Google Scholar] [CrossRef] [PubMed]
- Plakhova, T.V.; Romanchuk, A.Y.; Yakunin, S.N.; Dumas, T.; Demir, S.; Wang, S.; Minasian, S.G.; Shuh, D.K.; Tyliszczak, T.; Shiryaev, A.A.; et al. Solubility of Nanocrystalline Cerium Dioxide: Experimental Data and Thermodynamic Modeling. J. Phys. Chem. C 2016, 120, 22615–22626. [Google Scholar] [CrossRef]
- Ganborena, L.; Vega, J.M.; Ozkaya, B.; Grande, H.J.; García-Lecina, E. AN SKP and EIS study of microporous nickel-chromium coatings in copper containing electrolytes. Electrochim. Acta 2019, 318, 683–694. [Google Scholar] [CrossRef]
- Fu, A.Q.; Cheng, Y.F. Characterization of corrosion of X65 pipeline steel under disbonded coating by scanning Kelvin probe. Corr. Sci. 2009, 51, 914–920. [Google Scholar] [CrossRef]
- Guergova, D.; Stoyanova, E.; Stoychev, D.; Avramova, I.; Stefanov, P. Self-healing effect of ceria electrodeposited thin films on stainless steel in aggressive 0.5 mol/L NaCl aqueous solution. J. Rare Earths 2015, 33, 1212–1227. [Google Scholar] [CrossRef]
- Zhou, C.; Li, Z.; Li, J.; Yuan, T.; Chen, B.; Ma, X.; Jiang, D.; Luo, X.; Chen, D.; Liu, Y. Epoxy composite coating with excellent anticorrosion and self-healing performances based on multifunctional zeoliticimidazolate framework derived nanocontainers. Chem. Eng. J. 2020, 385, 123835. [Google Scholar] [CrossRef]
- Dong, Y.; Li, S.; Zhou, Q. Self-healing capability of inhibitor-encapsulating polyvinyl alcohol/polyvinylidene fluoride coaxial nanofibers loaded in epoxy resin coatings. Prog. Org. Coat. 2018, 120, 49–57. [Google Scholar] [CrossRef]
- Stevanović, S.I.; Lekka, M.; Lanzutti, A.; Tasić, N.; Živković, L.S.; Fedrizzi, L.; Bajat, J.B. Real-Time AFM and Impedance Corrosion Monitoring of Environmentally Friendly Ceria Films on AA7075. J. Electrochem. Soc. 2020, 167, 101503. [Google Scholar] [CrossRef]


Publisher’s Note: MDPI stays neutral with regard to jurisdictional claims in published maps and institutional affiliations. |
© 2021 by the authors. Licensee MDPI, Basel, Switzerland. This article is an open access article distributed under the terms and conditions of the Creative Commons Attribution (CC BY) license (https://creativecommons.org/licenses/by/4.0/).