Review

Correlation of Morphology and Crystal Structure of Metal Powders Produced by Electrolysis Processes

by
Nebojša D. Nikolić
1,*,
Vesna M. Maksimović
2 and
Ljiljana Avramović
3
1
Department of Electrochemistry, Institute of Chemistry, Technology and Metallurgy, University of Belgrade, Njegoševa 12, 11000 Belgrade, Serbia
2
Vinča Institute of Nuclear Science, University of Belgrade, 11000 Belgrade, Serbia
3
Mining and Metallurgy Institute, Center for Technologies Development in Metallurgy, Zeleni Bulevar 35, 19210 Bor, Serbia
*
Author to whom correspondence should be addressed.
Metals 2021, 11(6), 859; https://doi.org/10.3390/met11060859
Submission received: 13 April 2021 / Revised: 10 May 2021 / Accepted: 18 May 2021 / Published: 24 May 2021
(This article belongs to the Special Issue Advances in Understanding Metal Electrolysis Processes)

Abstract

:
In this review paper, morphologies of metal powders produced by the constant (potentiostatic and galvanostatic) regimes of electrolysis from aqueous electrolytes are correlated with their crystal structure at the semiquantitative level. The main parameters affecting the shape of powder particles are the exchange current density (rate of electrochemical process) and overpotential for hydrogen evolution reaction. Depending on them, various shapes of dendrites (the needles, the two-dimensional (2D) fern-like, and the three-dimensional (3D) pine-like dendrites), and the particles formed under vigorous hydrogen evolution (cauliflower-like and spongy-like particles) are produced by these regimes of electrolysis. By decreasing the exchange current density value, the crystal structure of the powder particles is changed from the strong (111) preferred orientation obtained for the needle-like (silver) and the 2D (lead) dendrites to the randomly orientated crystallites in particles with the spherical morphology (the 3D dendrites and the cauliflower-like and the spongy-like particles). The formation of metal powders by molten salt electrolysis and by electrolysis in deep eutectic solvents (DESs) and the crystallographic aspects of dendritic growth are also mentioned in this review.

1. Introduction

Powder metallurgy (PM) is a branch of science including production, characterization, and conversion of metal powders into useful engineering components [1]. The first step in the overall PM is the production of metal powders. Although there is no unique classification of methods for powder production, all methods can be situated into one of the four groups: solid-state reduction, atomization, electrolysis, and chemical processes [2]. Some of the available submethods also include ultrasonic spray pyrolysis [3], solvothermal synthesis [4], cementation [5], pyrolysis [6], hydrometallurgy [7], melt spinning, rotating electrode process (REP), and mechanical processes [8,9]. Metal powders are characterized by their morphology and size of the particles. The shape and size of particles strongly depend on the method used for their preparation [1,10].
Electrolysis is an often-used method for the synthesis of metal powders [10]. This method achieves certain advantages over the other production methods, and the obtained conveniences can be summarized as follows: low equipment and product costs, one-step process, environmentally friendly process, and high purity of obtained products [11].
Metal powders can be obtained by electrolysis from aqueous electrolytes, melt, and deep eutectic solvents (DESs) applying both constant (galvanostatic and potentiostatic) and periodically changing (pulsating current (PC), reversing current (RC), and pulsating overpotential (PO)) regimes of electrolysis [1,10,12,13]. There is a strong correlation between the parameters and regime of electrolysis and the shape of powder particles as the final product of the electrolysis process. The main shapes of powder particles obtained by electrolysis are as follows: dendrites of various shape, spongy, needles, cauliflower, and fibrous [10]. The shape of particles depends on the kind and composition of the electrolyte, the temperature of electrolysis, the kind of cathode, electrolyte stirring, the addition of additives in an electrolyte, and the nature of metals [10].
The main classification of metals is done according to the exchange current density (j0), melting point (Tm), and overpotential for hydrogen evolution reaction [14,15]. Following these parameters, metals are classified into one of the three groups:
(a)
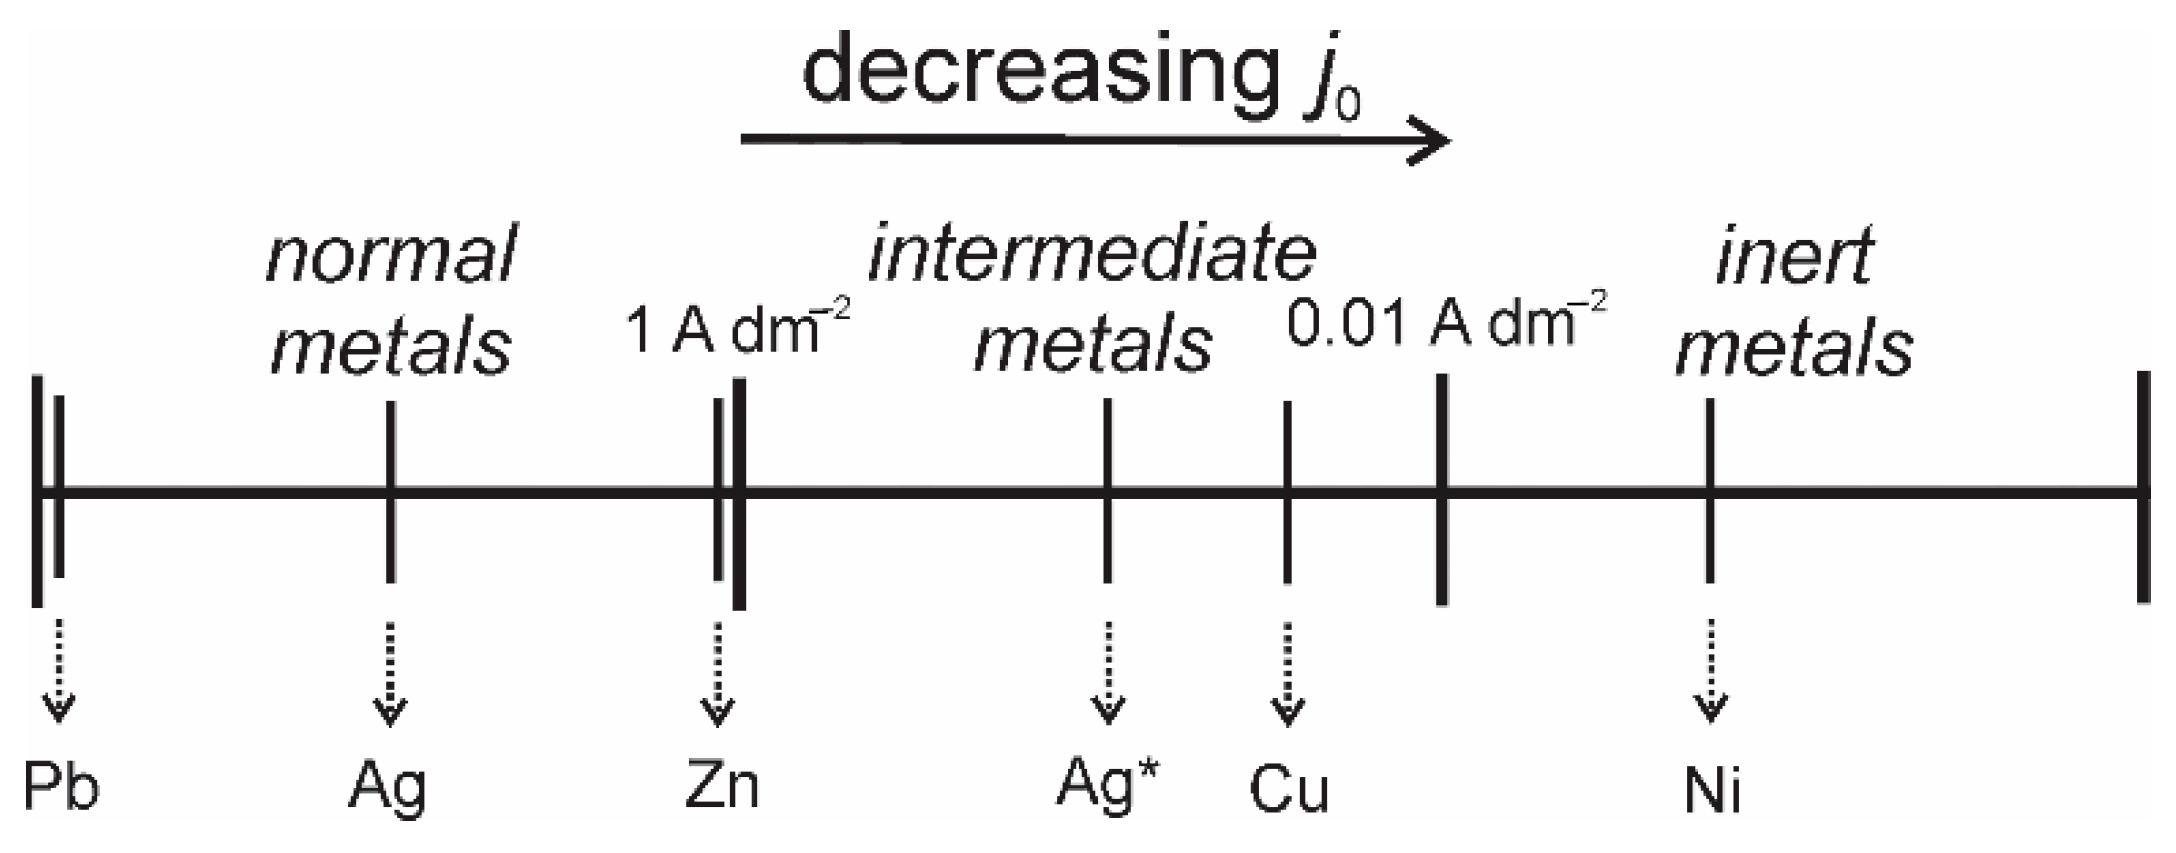
Normal metals: metals such as Pb, Cd, Ag (basic electrolytes), Sn, and Zn. These metals are characterized by high j0 values (j0 > 1 A dm−2), low Tm, and high overpotentials for hydrogen evolution reaction.
(b)
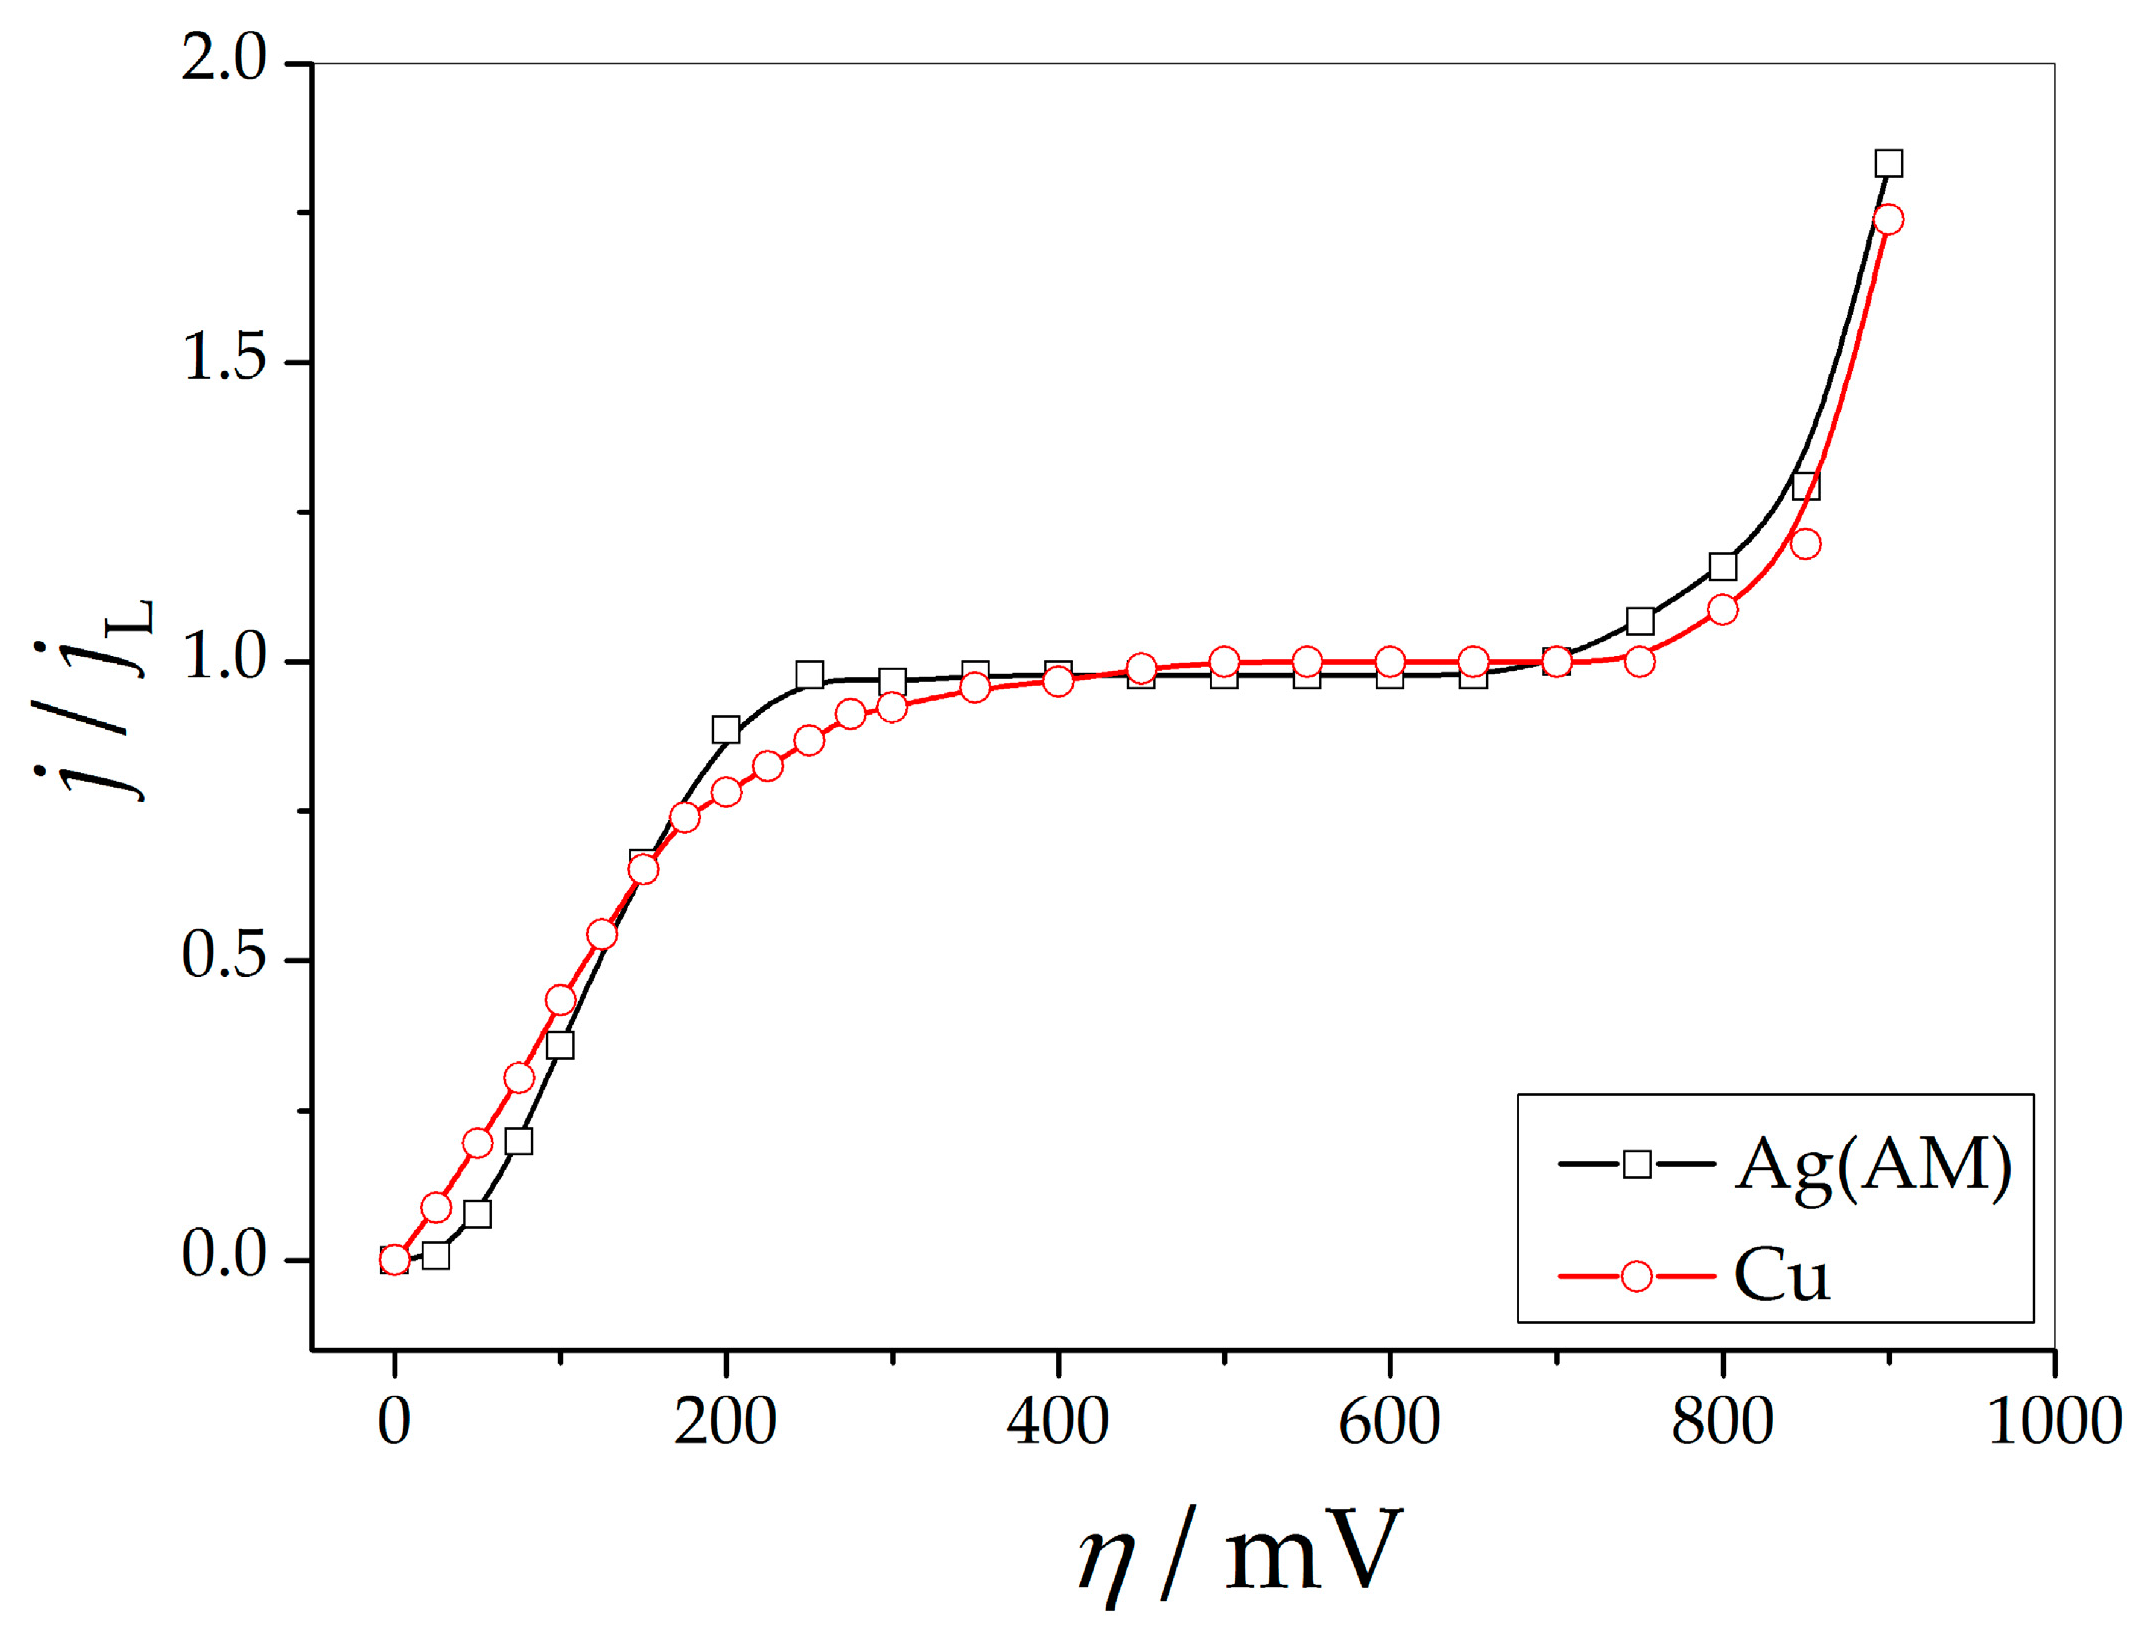
Intermediate metals: metals such as Cu, Ag (ammonium electrolyte), and Au. These metals are characterized by medium j0 values (10−2 < j0 < 1 A dm−2) and lower overpotentials for hydrogen evolution reaction than the normal metals.
(c)
Inert metals: metals such as Co, Ni, Pt and Fe. These metals are characterized by low j0 values, high Tm, and low overpotentials for hydrogen evolution reaction.
Figure 1 gives a schematic presentation of the position of the typical representatives of metals from each of these groups in a function of electrochemical process rate, i.e., the j0 value.
Regarding these parameters, the exchange current density and overpotential for hydrogen evolution reaction have a greater influence on the shape of powder particles than the melting point. The shape of dendrites, as the most important form of powder particles, strongly depends on the j0 value; thereby, the form of dendrites of metals from the group of the normal metals differs completely from those from the groups of the intermediate and inert metals [10]. The dendrites are formed during electrodeposition in a diffusion control, and in the potentiostatic regime, initiation of dendritic growth occurs at some overpotential belonging to the limiting diffusion current density plateau. In the galvanostatic regime of electrodeposition, for dendritic growth, an initial current density must be larger than the limiting diffusion current density [10].
Hydrogen evolution reaction as a parallel reaction during metal electrolysis can also achieve a significant effect on the shape of powder particles. The spongy-like and the cauliflower-like particles are formed under hydrogen evolution which is intensive enough to cause a stirring of the electrolyte and the change of hydrodynamic conditions in the near-electrode layer [10,16].
In this review paper, the correlation between crystallographic structure and morphology of powder particles will be presented. Typical metals from each of these three groups: (a) the normal metals: Pb and Ag (the basic electrolyte), (b) the intermediate metals: Ag (the ammonium electrolyte) and Cu, and (c) the inert metals: Ni will be analyzed.
The crystal lattices of Pb, Ag, Cu, and Ni belong to face-centered cubic (fcc) type, and the four main reflections ((111), (200), (220), and (311)) will be considered. The crystallographic structure, i.e., the preferred orientation of the powder particles, will be estimated at the semiquantitative level by application of methodology based on the determination of “Texture Coefficient” (TC(hkl)) and “Relative Texture Coefficient” (RTC(hkl)) [17,18,19,20]. The TC(hkl) coefficients larger than 1 indicate the presence of the preferred orientation in the particles. Since the four diffraction peaks corresponding to (111), (200), (220), and (311) crystal planes are analyzed, the RTC(hkl) values larger than 25% indicate the existence of the preferred orientation in the particles [17,18,19]. A detailed description of the determination of these coefficients is given in [18,19] and in Appendix A.

The Crystallographic and Electrochemical Definitions of a Dendrite

From the crystallographic point of view, a dendrite is a skeleton consisting of a stalk or trunk and branches, giving the dendrite the appearance of a tree [21]. The branches can be primary, secondary, etc. The primary branches are developed from the stalk, and the corresponding dendrite is denoted as a dendrite of “P” type. The secondary branches are developed from the primary branches, and the corresponding dendrite is denoted as a dendrite of “S” type. If the stalk and the branches are in the same plane, the dendrite belongs to the group of the 2D dendrites.
The electrochemical definition of a dendrite is established by application of the general theory of disperse deposit formation [10,22]. The origin of dendrites is of a surface irregularity or protrusion formed in the initial stage of electrodeposition and buried deep in the diffusion layer of the macroelectrode, around which the tip the spherical diffusion layer is formed. Then, the tip of such protrusion grows under the activation control, whereas electrodeposition on the flat part of the electrode surface is under the diffusion control [10,22,23].

2. Formation of Metal Powders by Electrolysis from Aqueous Electrolytes

2.1. The Normal Metals

With the values of j0 which tend to infinity [24], Pb electrodeposition processes belong to ultrafast electrochemical processes. The reported values of j0 for Ag in the 100–700 A dm−2 range were lower than those for Pb [25]. The common characteristic of all electrodeposition processes featured by the high j0 values is the reaching of full diffusion control, i.e., conditions for obtaining powdered (dendritic) deposits at relatively small overpotentials.
Various types of electrolytes based on nitrate [26,27,28,29], acetate [27], hydroxide ions [30,31], and tartaric acid [32] are used for Pb electrodeposition. The nitrate electrolytes belong to a group of the basic electrolytes, whereas the other electrolytes are from the group of complex electrolytes. The most often used basic type of electrolyte for Ag electrodeposition is based on nitrates [18,33,34].
The polarization curves normalized to the limiting diffusion current density values for Pb electrodeposition from the basic (nitrate) and the complex (acetate) electrolytes and for Ag from the basic (nitrate) electrolyte are presented in Figure 2. The plateaus of the limiting diffusion current density were in the ranges of 28.5–55 mV for the nitrate, 33–70 mV for the acetate electrolyte of Pb [27,35], and 70–110 mV for the nitrate electrolyte of Ag [18,34].

2.1.1. Lead

Different two-dimensional (2D) fern-like dendrites are produced by Pb electrodeposition from the nitrate (Figure 3a,b) and the acetate (Figure 3c,d) electrolytes at the overpotential outside the plateau of the limiting diffusion current density (η = 90 mV). The 2D dendrites obtained from the acetate electrolyte had a considerably more branchy morphology than those obtained from the nitrate electrolyte. Following the definition of a dendrite given by Wranglen [21], it is clear that the fern-like dendrites of Pb produced from the nitrate solution belong to the 2D(P) type, while those obtained from the acetate solution belong to the 2D(S) type. This change in the shape of dendrites can be attributed to complex formation between acetate and Pb(II) ions [27,35].
The X-ray diffraction (XRD) patterns of Pb particles produced under the same conditions, together with Pb standard (04-0686), are shown in Figure 4. The diffraction peaks at 2θ angles of 31.3, 36.3, 52.2, and 62.1° belong to (111), (200), (220), and (311) crystal planes, confirming the fcc crystal lattice of Pb [20]. In both types of particles, Pb crystallites were predominantly oriented in the (111) plane. The values of TC(hkl) and RTC(hkl) coefficients calculated with an aim of precise determination of the preferred orientation of Pb particles are given in Table 1.
The meaning of R in Table 1, as well as in later presented tables, is given in Appendix A. Both powders possess the strong (111) preferred orientation, but it is important to note the larger contribution of Pb crystallites oriented in the (200), (220), and (311) planes in the particles synthesized from the acetate than in those produced in the nitrate solution.

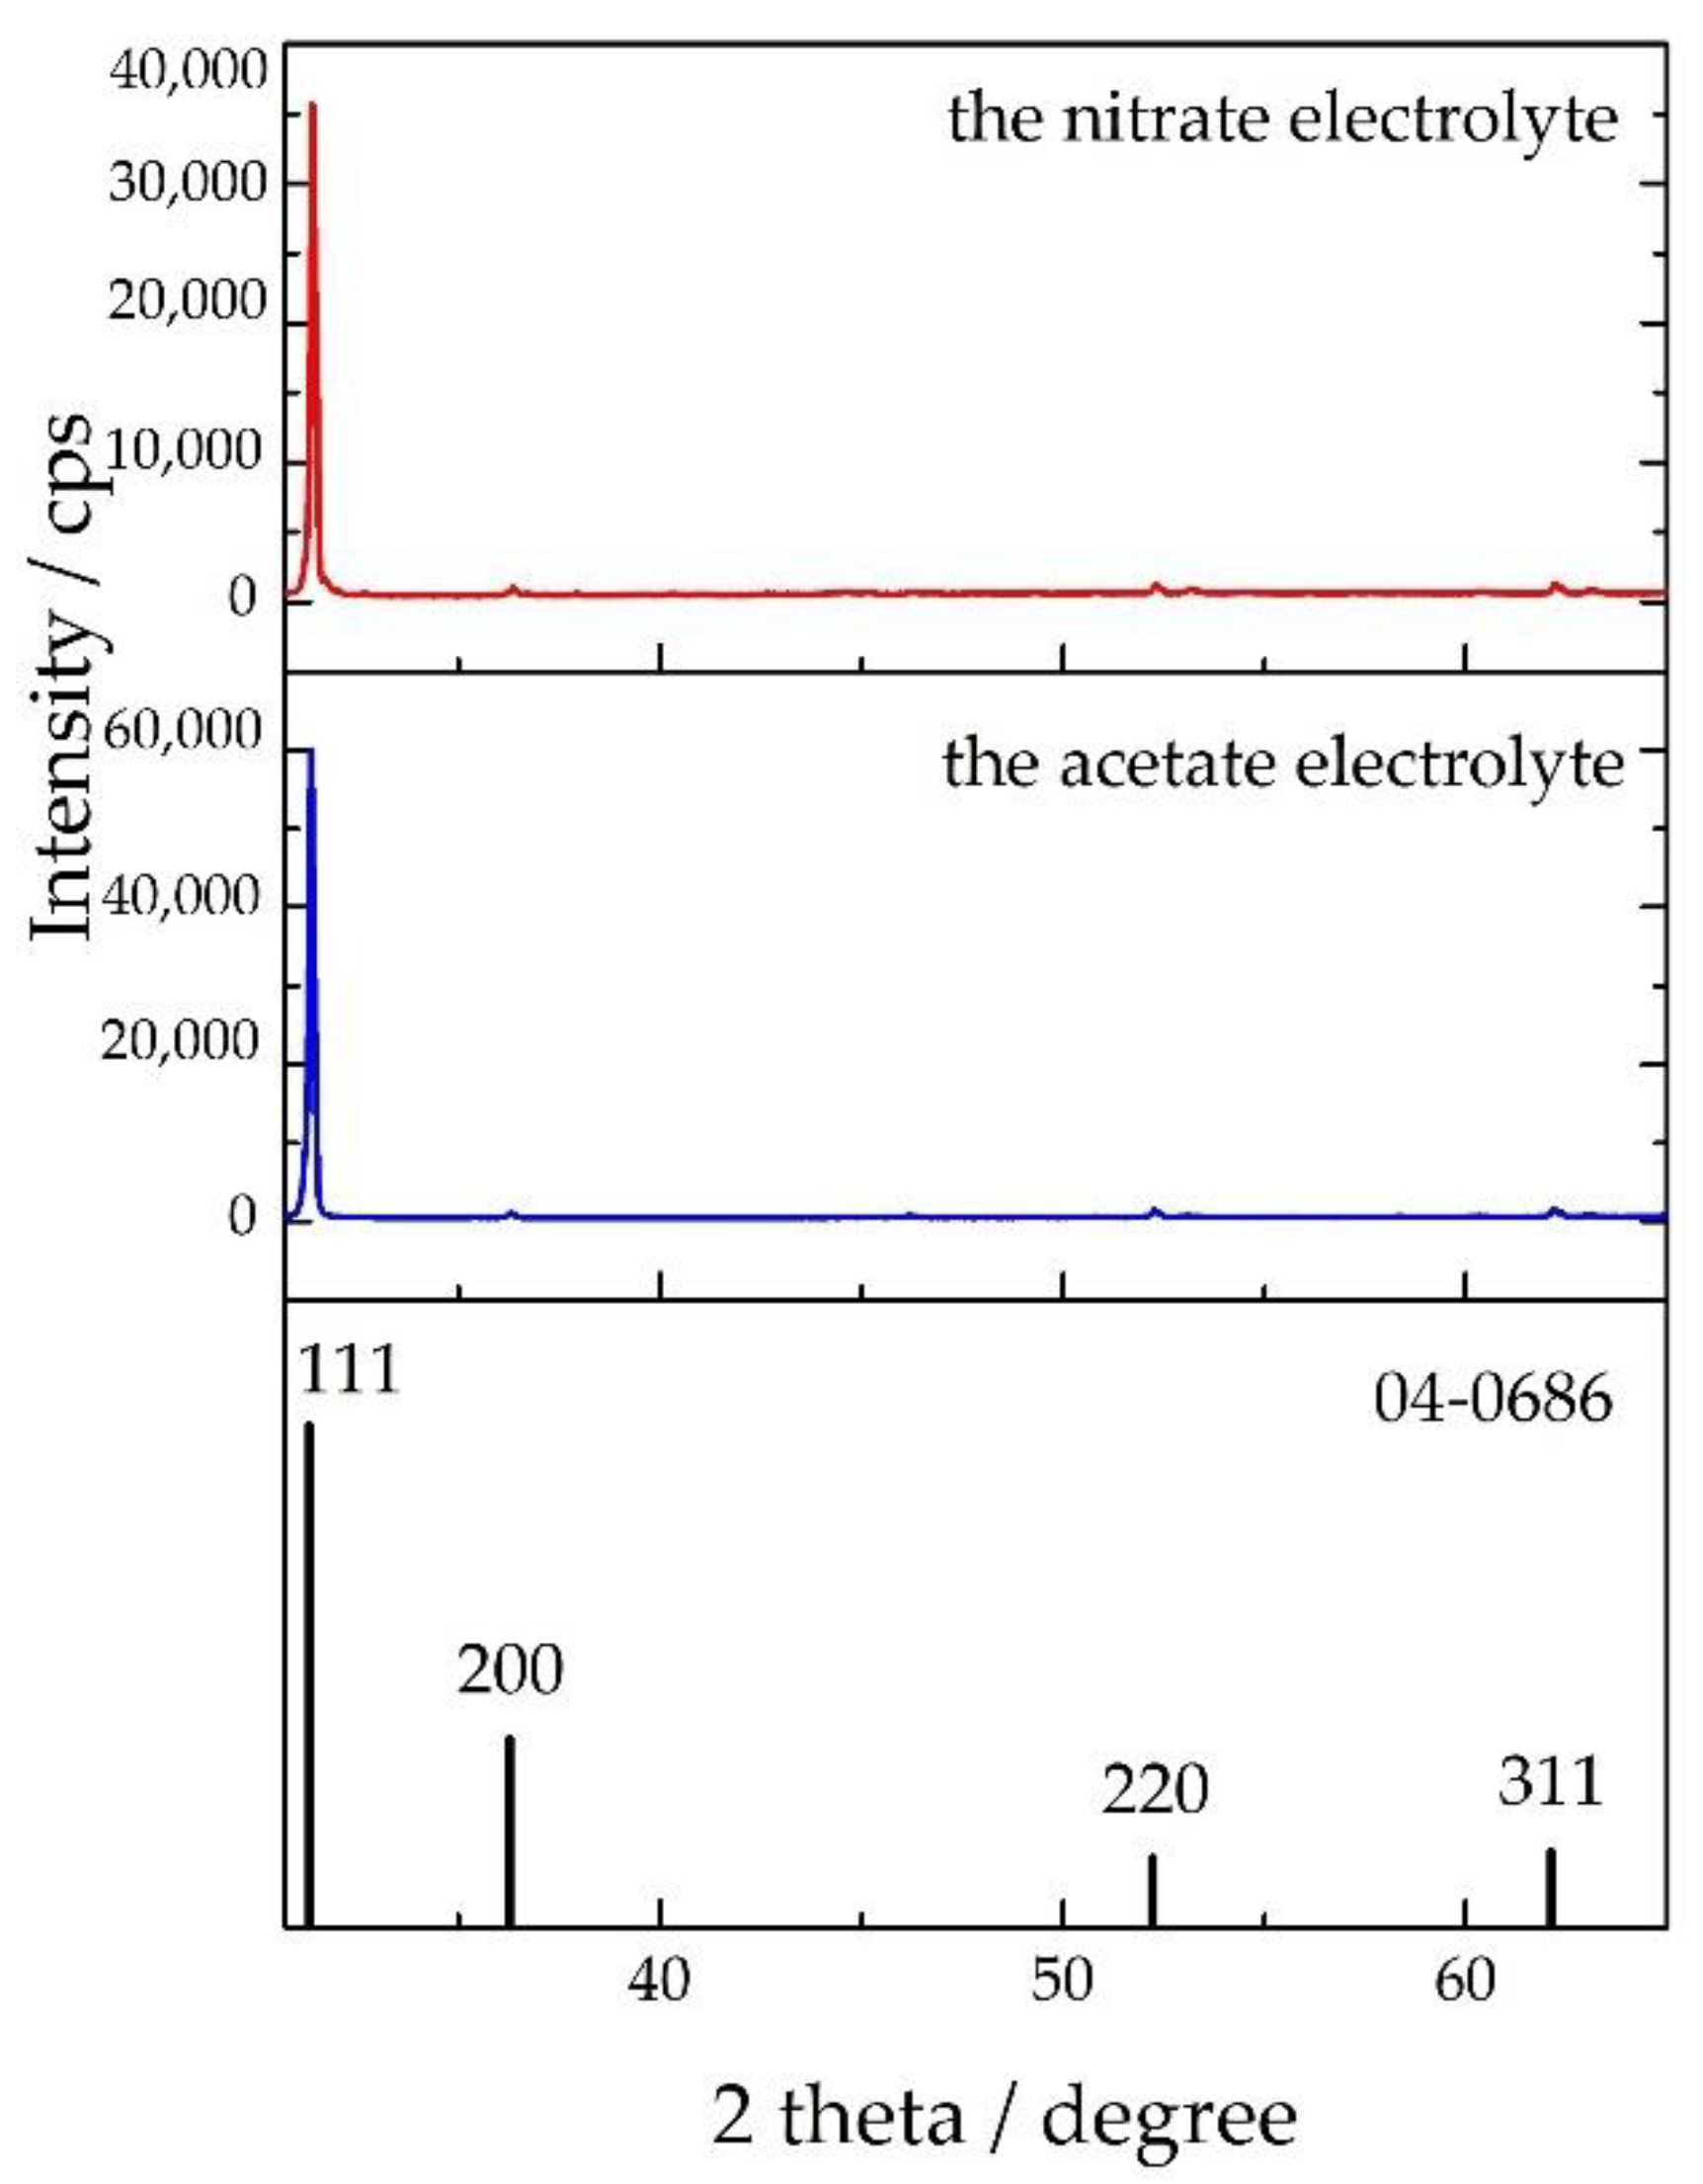
2.1.2. Silver (The Nitrate Electrolyte)

The shifting of the plateau of the limiting diffusion current density towards the higher overpotentials clearly proves that the Ag electrodeposition processes from the nitrate electrolyte are slower than those for Pb.
The needle-like dendrites together with granules of various shape are obtained at the overpotential inside the plateau (η = 90 mV; Figure 5a,b), whereas the very branchy 2D fern-like dendrites were obtained at the overpotential outside the plateau (η = 150 mV; Figure 5c,d) of the limiting diffusion current density [34]. Similar forms to those obtained at η of 90 mV (the mixture of the needle-like dendrites and granules (crystals) of regular and irregular shape) were also produced galvanostatically at a current density 1.5 times larger than the limiting diffusion current density (j = 14.4 mA cm−2; Figure 5e,f) [18].
The XRD patterns of these particles (Figure 6) showed the predominant orientation of Ag crystallites in the (111) plane. The diffraction maximum observed at 2θ angles of 38.1, 44.3, 64.4, and 77.5° corresponded to (111), (200), (220), and (311) crystal planes, confirming the fact that Ag crystallizes in fcc crystal lattice [18,34]. The calculated TC(hkl) and RTC(hkl) coefficients are given in Table 2.
The Ag particles produced at 90 mV (the dominant presence of the needle-like forms) possessed the strong (111) preferred orientation. Aside from the dominant orientation of Ag crystallites in this plane, the fern-like dendrites obtained at 150 mV also showed the weak (200) preferred orientation [34]. The (111) preferred orientation is also observed for galvanostatically synthesized particles at 14.4 mA cm−2.

2.2. The Intermediate Metals

Cu, Ag (if the ammonium electrolyte is used for electrodeposition), and Au are the typical representatives of the group of the intermediate metals. The j0 values are 0.025 A dm−2 for Ag [36] and 0.011–0.032 A dm−2 for Cu [10,37].
The polarization curves normalized to the limiting diffusion current densities for electrodeposition of Ag from the ammonium electrolyte and Cu are shown in Figure 7. The polarization curves are very similar to each other, with the plateaus of the limiting diffusion current density in the 250–700 mV range for the ammonium electrolyte of Ag and the 300–750 mV range for Cu.

2.2.1. Silver (The Ammonium Electrolyte)

The three-dimensional (3D) pine-like dendrites were obtained by electrodeposition from the ammonium solution at the overpotentials both inside (η = 625 mV; Figure 8a,b) and outside (η = 925 mV; Figure 8c,d) the plateau of the limiting diffusion current density [34]. The only difference was in the degree of their ramification; the 3D dendrites obtained at 925 mV were more ramified than those obtained at 625 mV. The 3D pine-like dendrites were also produced using a galvanostatic regime of electrolysis at a current density 1.5 times larger than the limiting diffusion current density (Figure 8e,f) [18]. This dendrite type was constructed from approximately spherical grains, the size of which decreased with the increase in overpotential of the electrodeposition with a tendency to approach nano dimensions. The tips of both stalk and branches of these dendrites were sharp.
The XRD patterns of the powder particles produced from the ammonium solution, together with Ag standard (04–0783), are presented in Figure 9. Similar to those produced from the nitrate electrolyte, the Ag crystallites were predominantly oriented in the (111) plane. However, at the first sight, the larger contribution of crystallites oriented in the (200), (220), and (311) planes in these particles than in those produced from the nitrate solution can be noticed. The values of TC(hkl) and RTC(hkl) coefficients for the particles produced in the ammonium solution are given in Table 3.
Analyzing the calculated values, it follows that the 3D pine-like dendrites synthesized at 625 mV showed the (111) preferred orientation. On the other hand, the values of these coefficients for the 3D pine-like dendrites obtained potentiostatically at 925 mV and galvanostatically at 13.05 mA cm−2 group themselves around 1 (TC(hkl)) and 25% (RTC(hkl)), indicating a random orientation of Ag crystallites in them.

2.2.2. Copper

The 3D pine-like dendrites built from stalk and branches like a corncob with sharp tips were obtained at the overpotential inside the plateau of the limiting diffusion current density (η = 625 mV; Figure 10a–c) [38]. The cauliflower-like particles are produced at an overpotential outside the plateau (η = 925 mV; Figure 10d). They were obtained by removing the electrodeposit from the honeycomb-like structure shown in Figure 10e. The honeycomb-like structure is obtained in conditions of vigorous hydrogen evolution and was built from holes originating from detached hydrogen bubbles and cauliflower-like grains agglomerates around them [10,16]. At the micro level, both the 3D pine-like dendrites and the cauliflower-like particles consist of small agglomerates of approximately spherical grains (Figure 10c,f), the size of which decreased with the increase in the overpotential. Hence, in spite of similar polarization curves for Ag and Cu (Figure 7), morphologies of Ag and Cu particles obtained at the overpotential outside the plateau of the limiting diffusion current density (η = 925 mV) were very different at the macro level. This difference was caused by vigorous hydrogen evolution as a parallel reaction in the case of copper.
The 3D dendrites obtained galvanostatically at a current density 1.5 times larger than the limiting diffusion current density (j = 14.4 mA cm−2; Figure 10g–i) were to a certain extent different from those obtained at 625 mV. Although they kept a pine-like form, the tips of trunk and branches, as well as corncob-like branches, were constructed from globules [19]. The size of globules having the shape of almost ideal spheres was from 3 to 5 µm in the branches to 10 μm at the tops of both trunk and branches.
The XRD patterns of the Cu particles produced by both potentiostatic and galvanostatic regimes of electrolysis, together with Cu standard (04-0836), are presented in Figure 11. Copper crystallizes in fcc crystal lattice, which is confirmed by diffraction peaks at 2θ angles of 43.3, 50.4, 74.1, and 89.9° corresponding to (111), (200), (220), and (311) crystal planes. The values of TC(hkl) and RTC(hkl) coefficients calculated by analysis of XRD data are summarized in Table 4. Analyzing the values given in this table, it can be concluded that the TC(hkl) coefficients are very close to 1, while RTC(hkl) coefficients are around 25%, indicating the random orientation of Cu crystallites in all types of the particles. The random orientation of Cu powder particles of various morphologies at the macro level can be attributed to their similar morphology at the micro level, i.e., approximately spherical Cu grains constructing all three types of the particles.

2.3. Inert Metals

Electrodeposition of metals belonging to the group of the inert metals, such as Ni, Co, Fe and Pt, occurs together with the reaction of hydrogen evolution at all current densities and cathodic potentials [10]. For that reason, it is not possible to record polarization curves without IR drop compensation [10,39,40].

Nickel

The spongy-like particles were produced by Ni electrodeposition at j of 1265 mA cm−2 (Figure 12). This type of the particles with the honeycomb-like structure (Figure 12a) [20] consists of holes obtained by the detachment of hydrogen bubbles surrounded by agglomerates of approximately spherical grains (Figure 12b).
The XRD pattern for the spongy-like Ni particles together with Ni standard (04-0850) is presented in Figure 13. The diffraction peaks recorded at 2θ angles of 44.5, 51.8, 76.4, and 92.9° corresponding to (111), (200), (220), and (311) crystal planes confirm the fcc crystal lattice of Ni. The values of the calculated TC(hkl) and RTC(hkl) coefficients (Table 5) clearly indicate the random orientation of Ni crystallites in the spongy-like particles.

2.4. Correlation between Morphology and Crystal Structure of the Powder Particles

Depending on the exchange current density and overpotential for hydrogen evolution reaction, two types of powder particles are obtained by electrolysis:
(a)
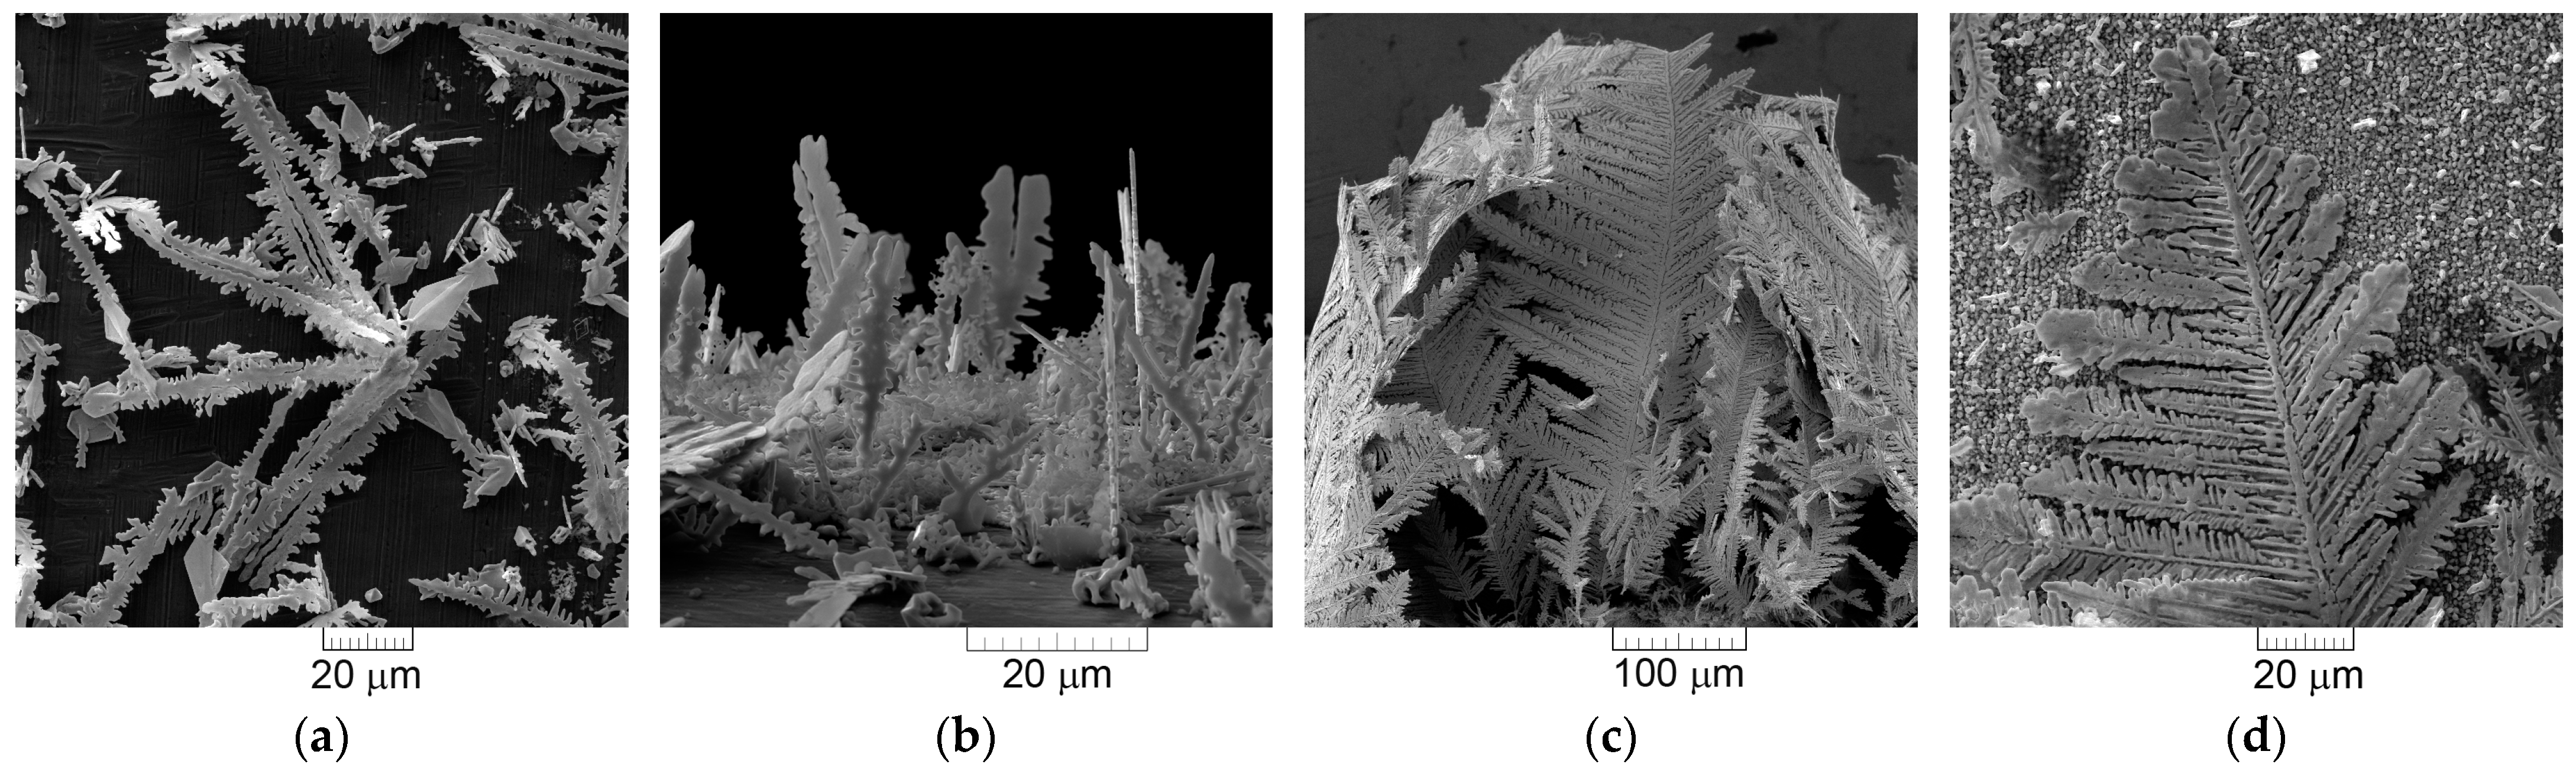
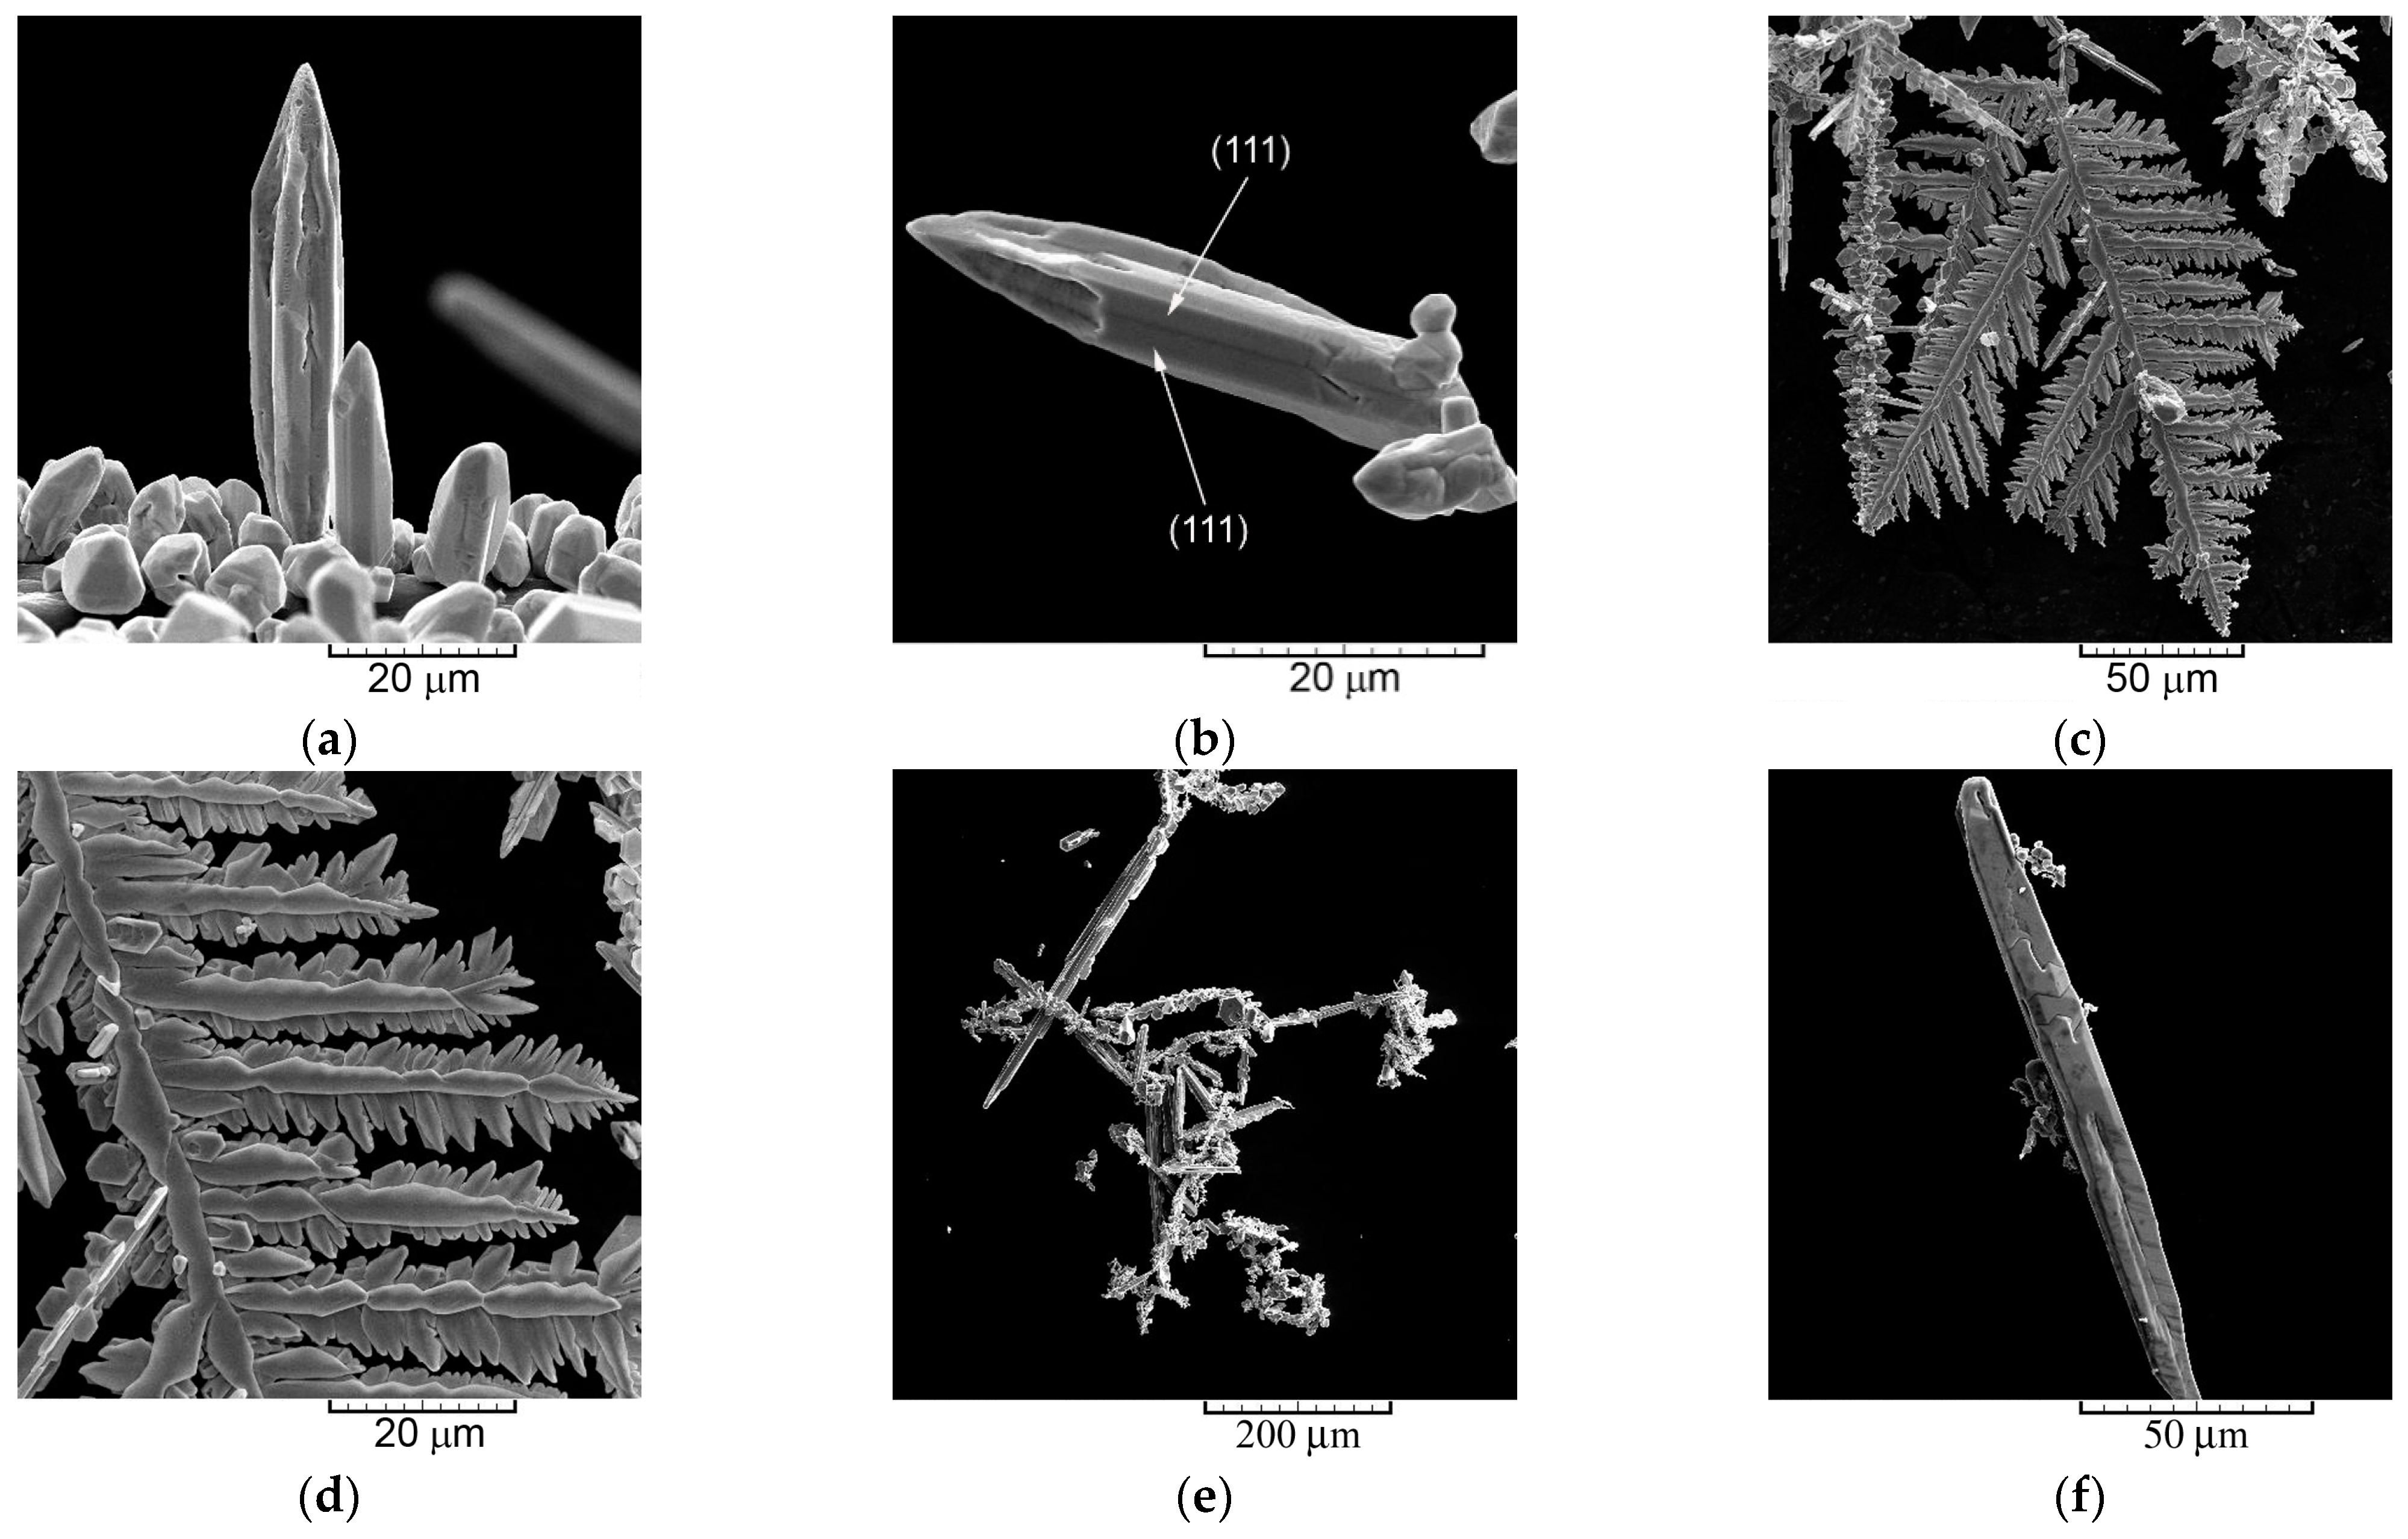
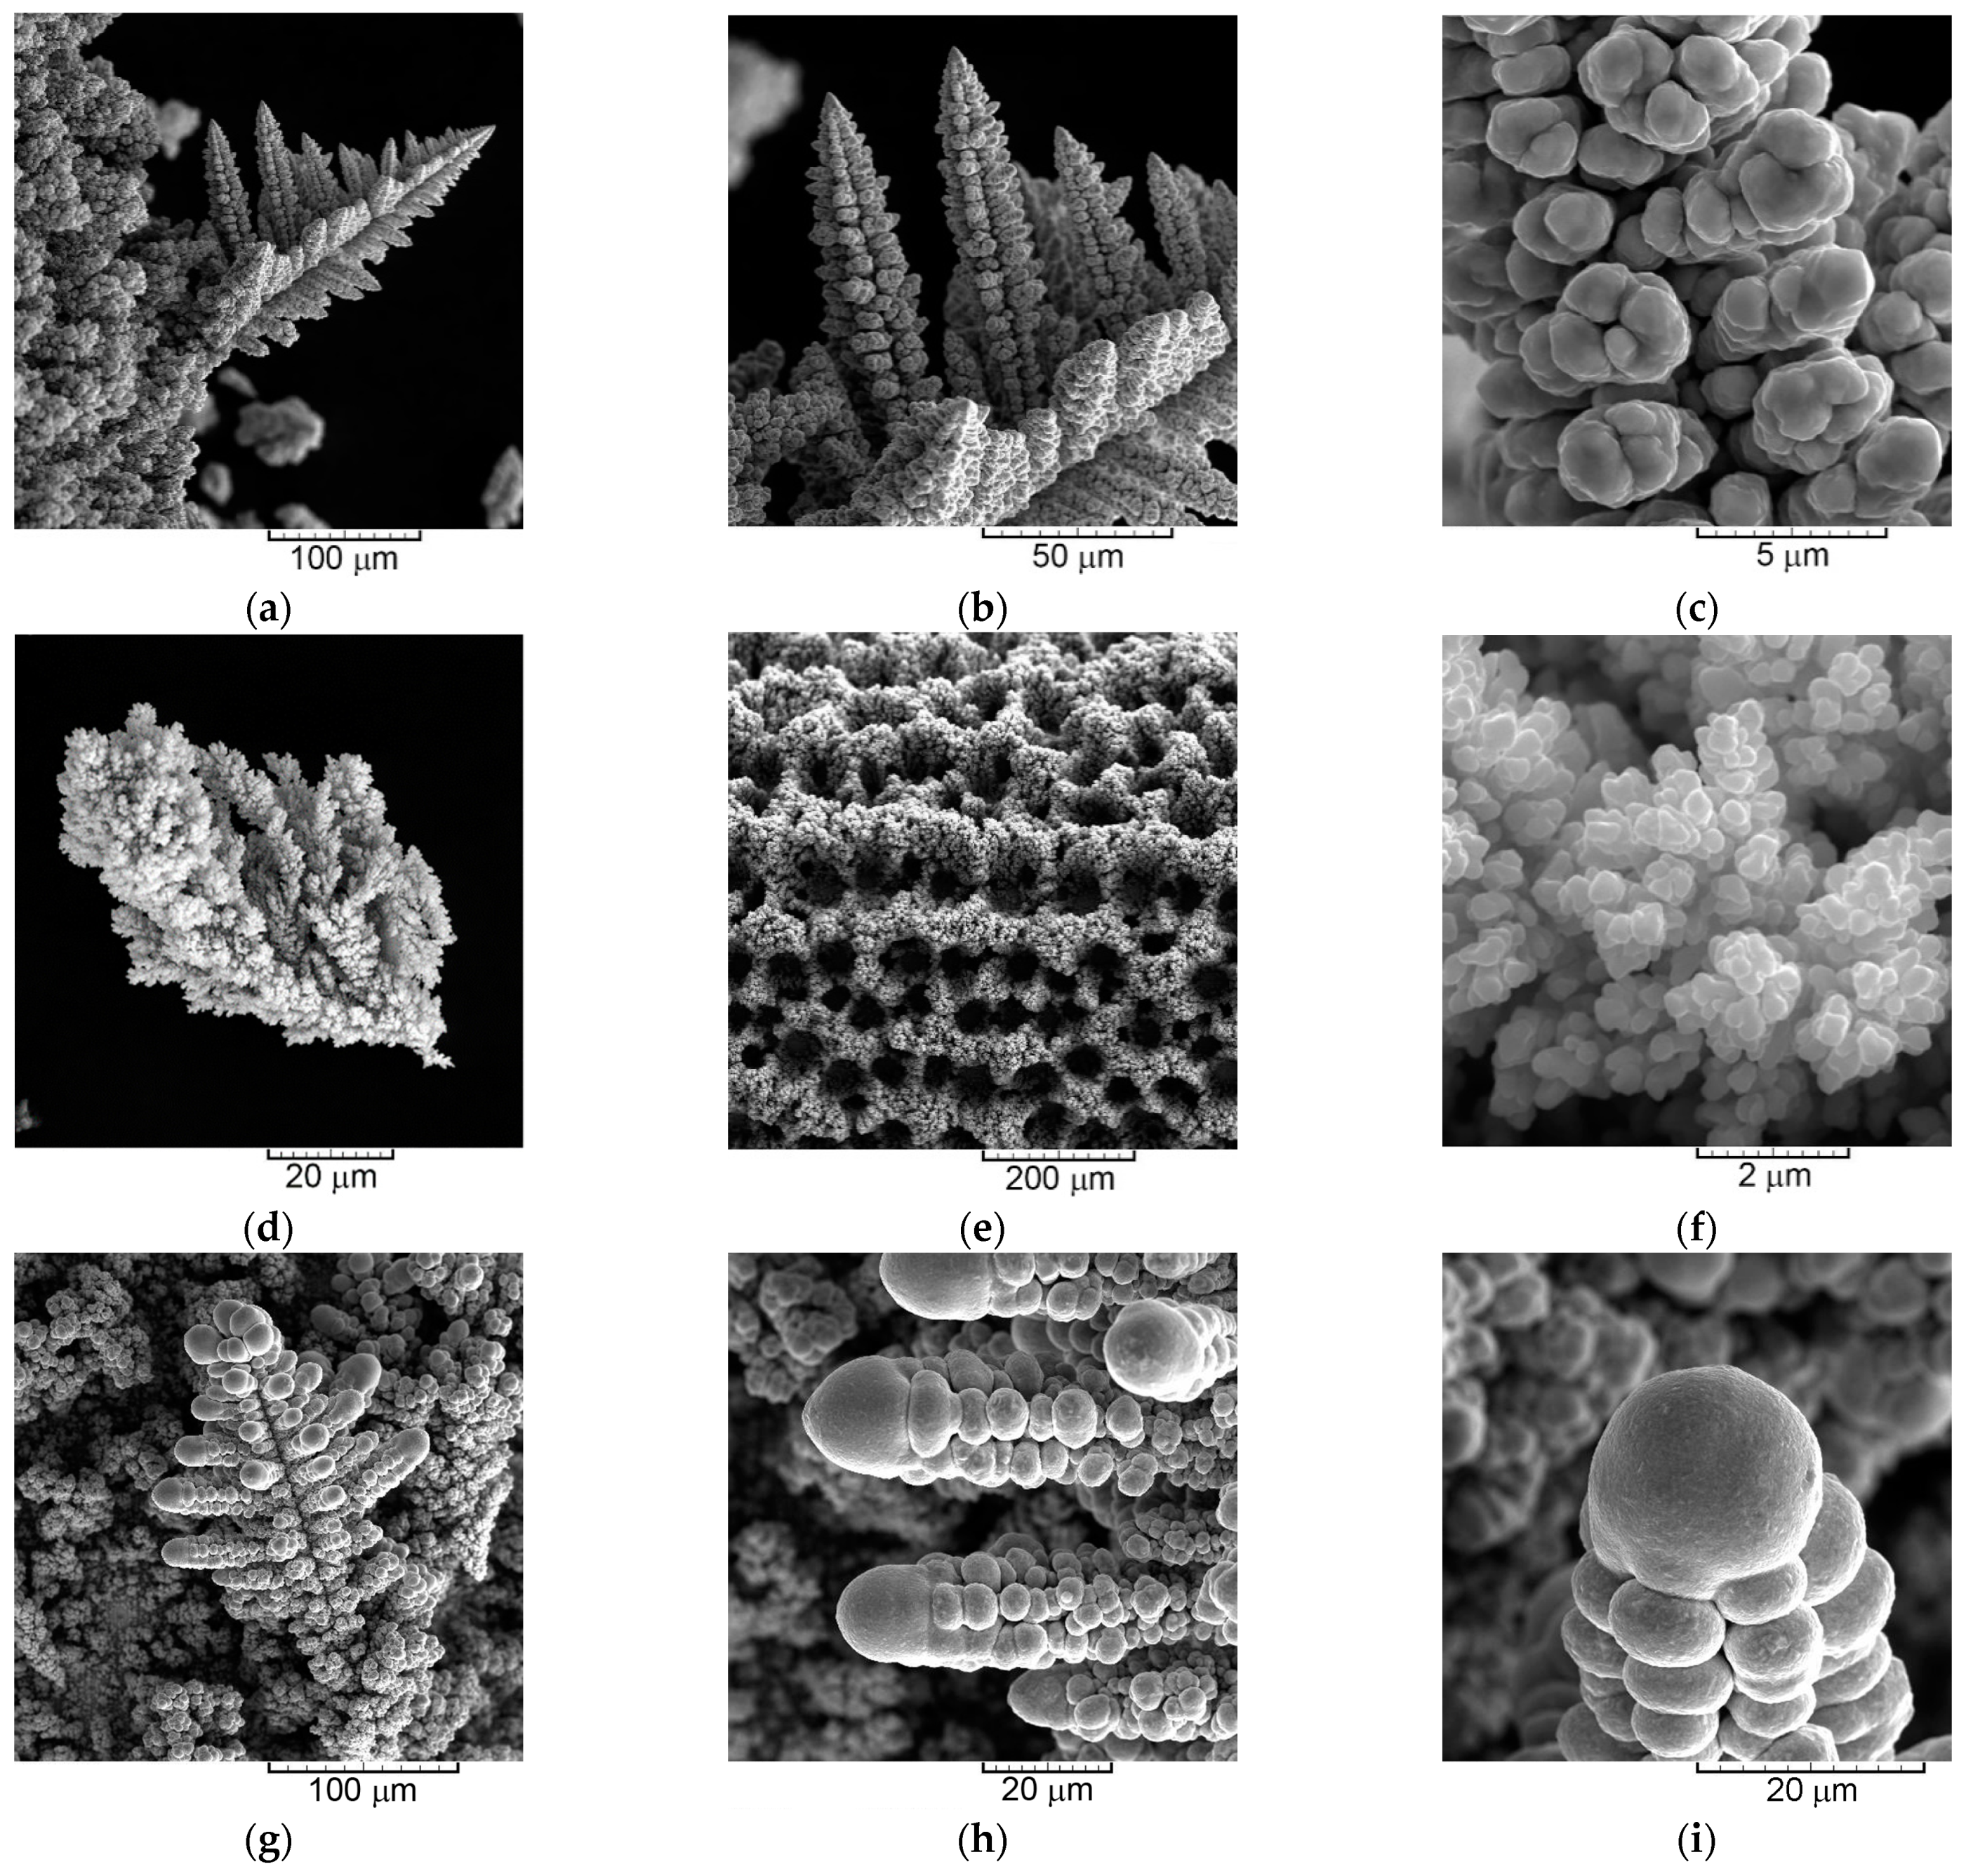
The dendrites of various shape—needle-like, 2D fern-like, and the 3D pine-like;
(b)
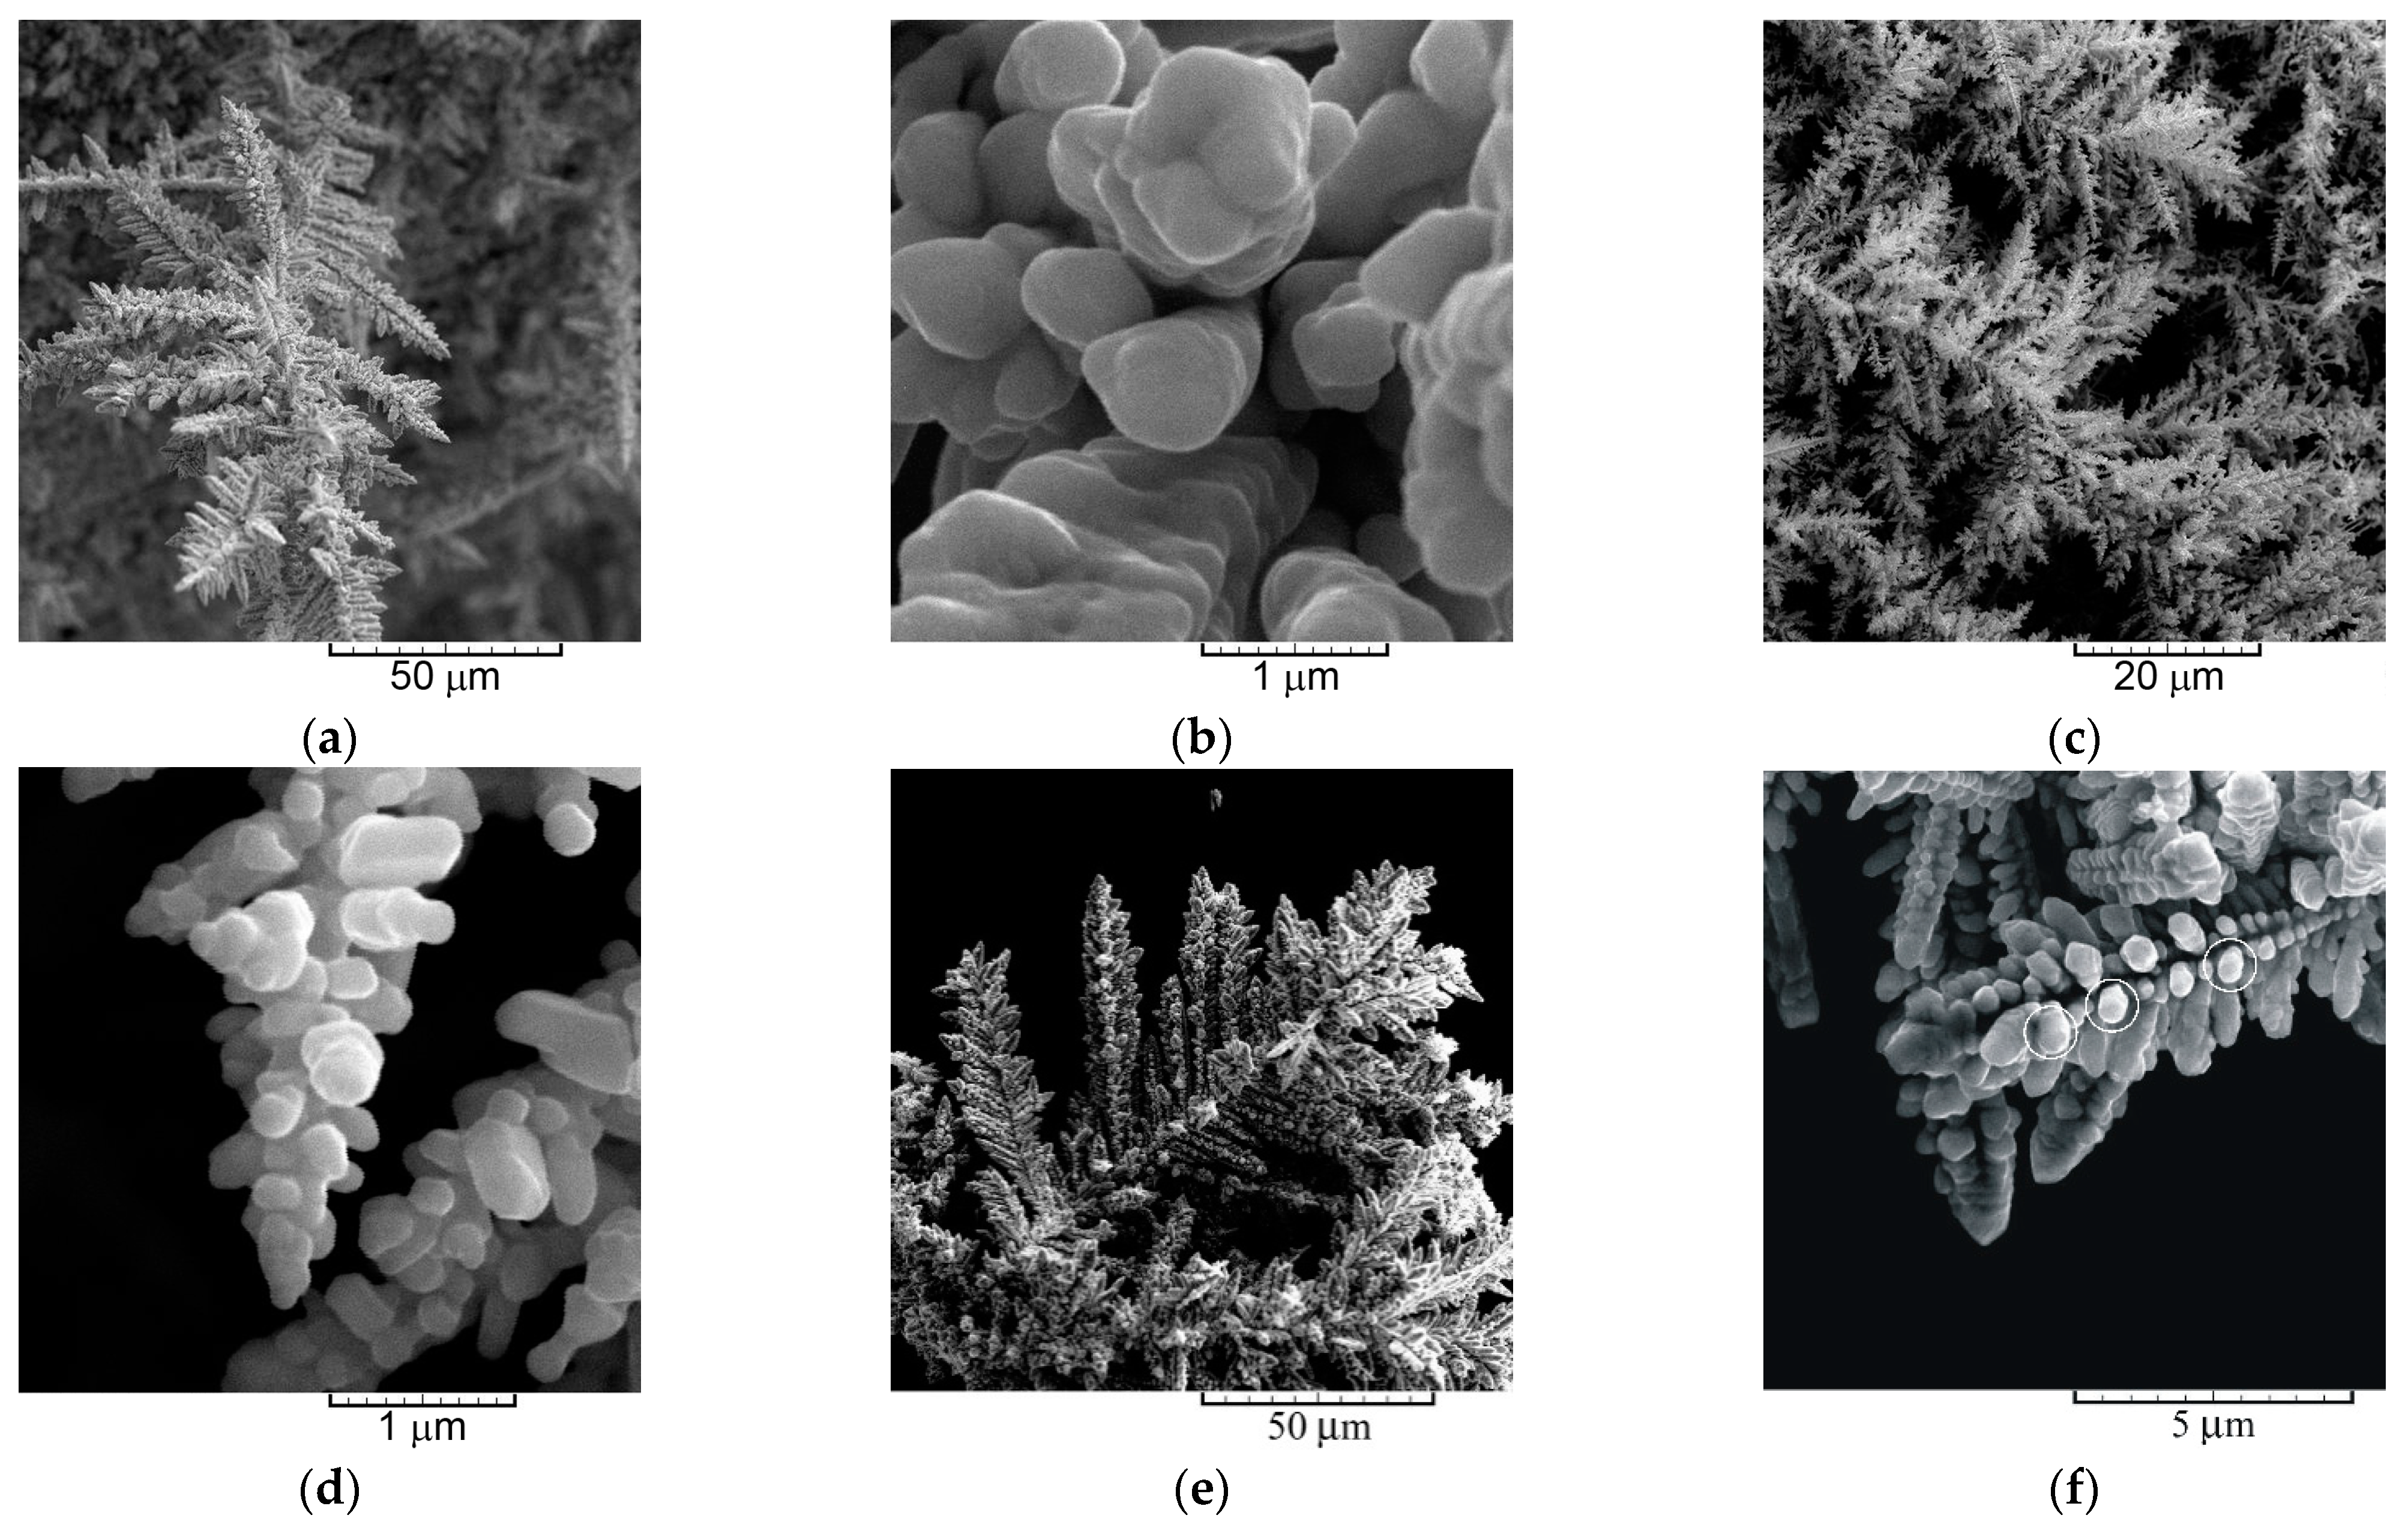
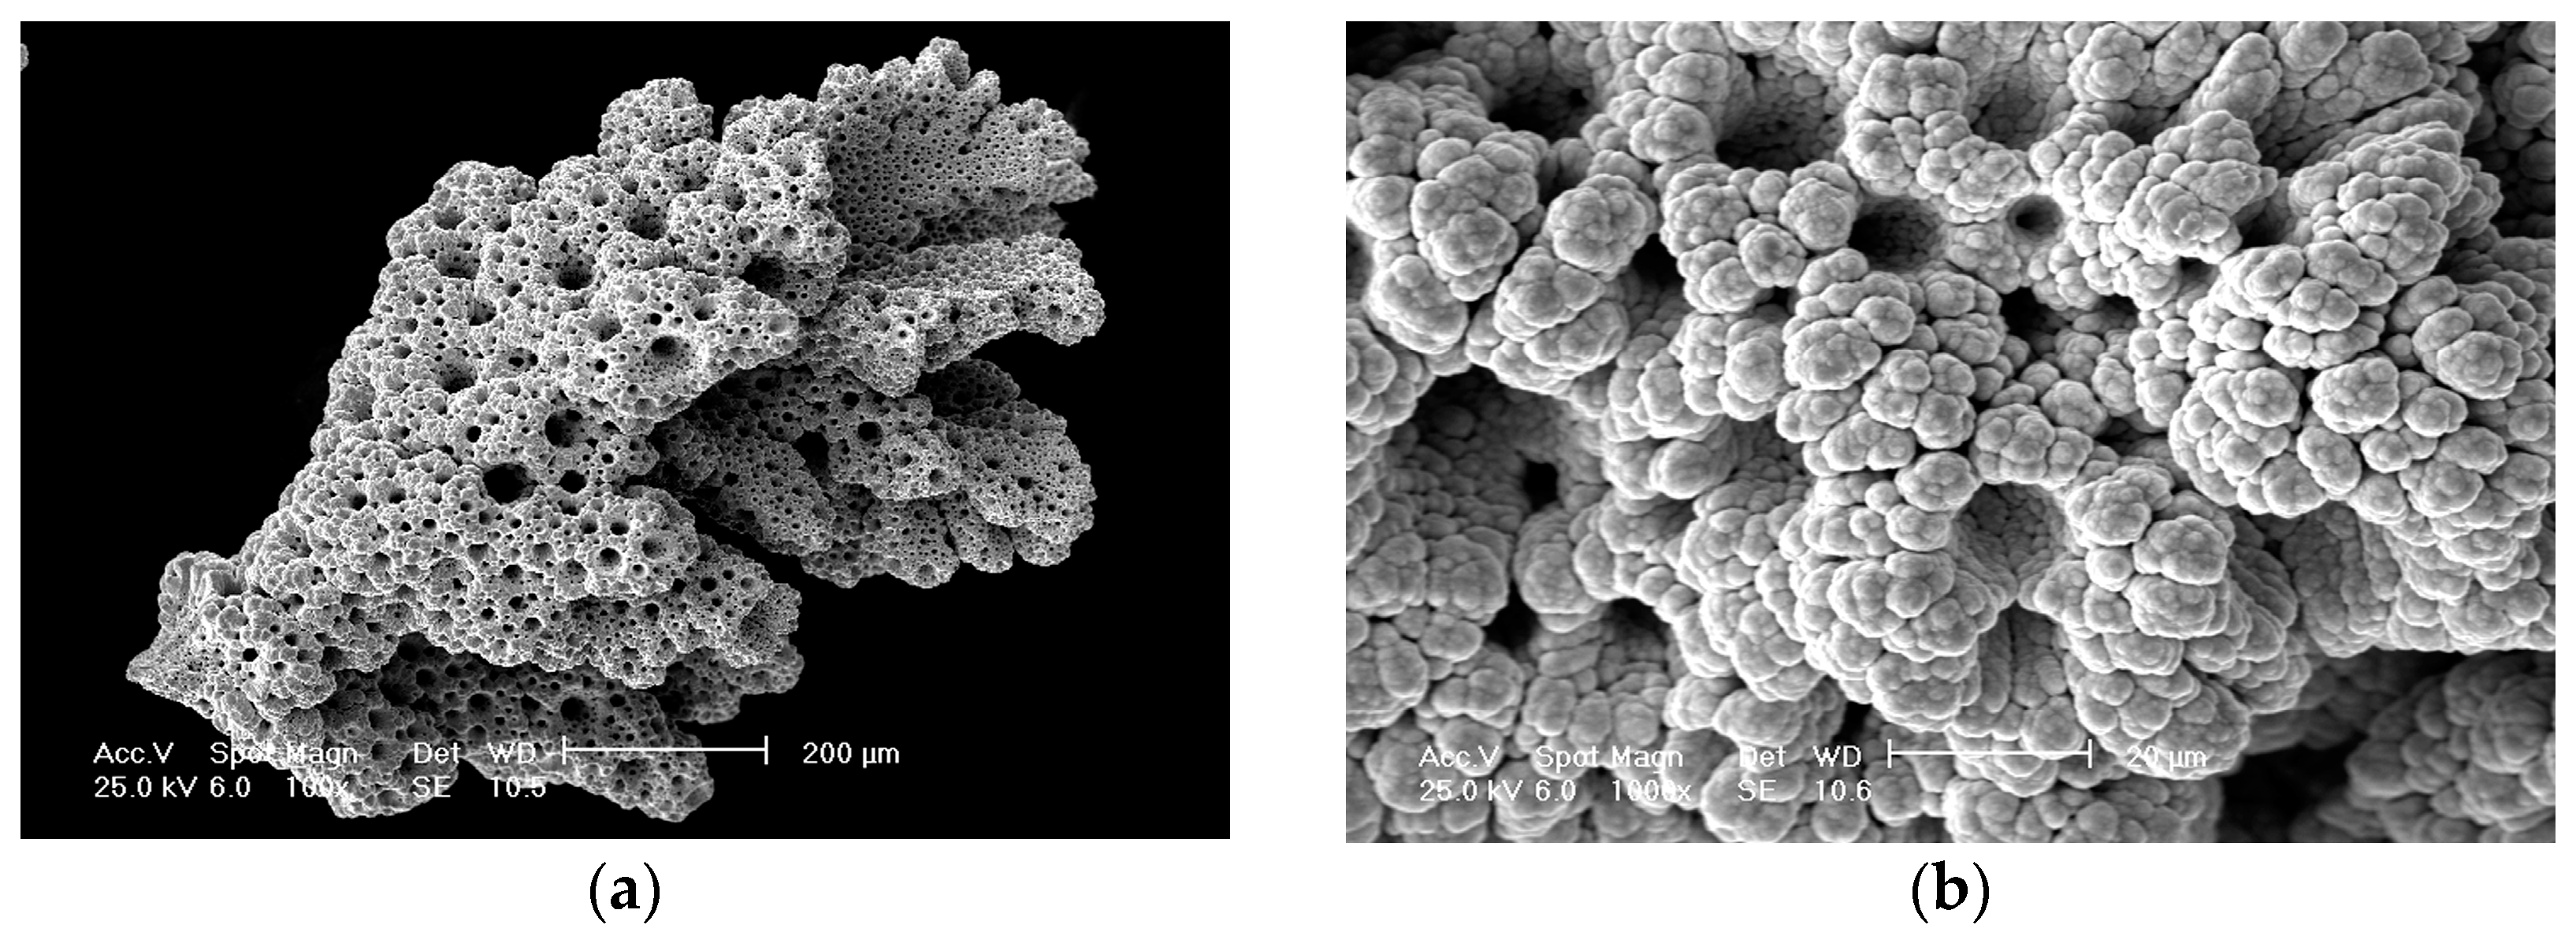
The cauliflower-like and the spongy-like particles.
With the decrease in j0 value, the preferred orientation of powder particles changed from the strong (111) obtained for the fern-like dendrites of Pb and the needle-like dendrites of Ag to the randomly oriented crystallites in all types of the particles with the spherical morphology (the 3D dendrites and the cauliflower-like particles of Cu and the spongy-like Ni particles).
The dendrites are obtained either without a parallel hydrogen evolution as the second reaction (Pb and Ag) [18,20,34] or with an amount of generated hydrogen that was not enough to achieve any influence on hydrodynamic conditions in the near-electrode layer (Cu) [19,35]. The cauliflower-like and the spongy-like particles are obtained under the strong effect of parallel hydrogen evolution reaction [16,41,42].
Although morphological features of the obtained dendrites were very different, all types (the needle-like, fern-like, and the pine-like dendrites of Ag and those of Cu synthesized potentiostatically) followed the electrochemical definition of a dendrite. For the dendrites of Pb and Ag, the fast growth of the current density after the end of the plateau of the limiting diffusion current density (Figure 2, Figure 3, Figure 5, Figure 7 and Figure 8) is caused by the activation controlled growth of the tips of both the trunk and the branches, which is followed by the strong increase in the real electrode surface area.
The 3D pine-like shape of Ag dendrites produced by the use of the ammonium electrolyte is a typical shape of dendrites obtained by electrolysis from the complex electrolytes of Ag. Similar shapes are also formed by the application of tungstosilicate [43] and citric [44] acids. These compounds form enough strong complexes with Ag(I) ions to cause a decrease in j0 for Ag and its transfer from the group of the normal metals into the group of the intermediate metals. The 3D pine-like dendrites of Cu with well-defined corncob-like branches represent the typical shape of Cu dendrites obtained by electrolysis processes [45,46,47,48].
The second subtype of the 3D Cu dendrites is obtained by the galvanostatic regime of electrolysis, and this subtype is constructed from globules (Figure 10g–i). The formation of globular particles, i.e., almost ideal spheres, is primarily a feature of some other methods of powder production, such as the ultrasonic spray pyrolysis [3] and the gas-atomizing process [49]. The spherical particles can be also produced by electrolysis in the presence of additional agents such as a combination of potassium ferrocyanide and 2,2′-dipyridine [50]. Without additives, the globules as a constitutive element of the 3D dendrites can be only obtained galvanostatically under the controlled conditions of electrolysis. They are obtained by the completion of the electrolysis process at the overpotential corresponding to a formation of globules in the potentiostatic mode of electrolysis [51]. In a galvanostatic regime of electrolysis, overpotential decreases with electrolysis time due to an increase in the electrode surface area which then causes a decrease in the real current density. In the potentiostatic mode of Cu electrodeposition, globules are formed at both the end of the mixed activation–diffusion control and at the beginning of the full diffusion control. The final overpotential corresponding to the formation of the 3D dendrites shown in Figure 10g–i is about 275 mV, and this overpotential corresponded to the end of the mixed activation–diffusion control [51].
As already mentioned, vigorous hydrogen evolution is responsible for obtaining the cauliflower-like and spongy-like particles. The intensive hydrogen evolution causes an electrolyte stirring in the near-electrode layer, leading to an increase in the limiting diffusion current density, a decrease in the thickness of the diffusion layer, and, hence, a decrease in the degree of the diffusion control [10,16]. There is a critical amount of generated hydrogen causing the change of hydrodynamic conditions in the near-electrode layer, and for Cu, this amount is estimated to correspond to the average current efficiency of hydrogen evolution (ηI,av(H2)) of 10% [10]. The Cu particles shown in Figure 10d–f were obtained with ηI,av(H2) of 36.6% [38]. The concept of “effective overpotential” is proposed to explain the obtaining of these particles. According to this concept, when hydrogen evolution is intensive enough to exceed a critical value for a change of hydrodynamic conditions in the near-electrode layer, the electrolysis process occurs at an overpotential that is effectively lower than the specified value, and this overpotential is then called “effective overpotential”. The formation of the cauliflower-like particles in the case of Cu and the spongy-like particles with the same structure in the case of Ni confirms that they are formed on the lower degree of the diffusion control relative to dendrite formation. In the case of copper, the fast growth in the current density after the end of the plateau of the limiting diffusion current density is caused by vigorous hydrogen evolution (Figure 7).
The change of preferred orientation from the strong (111) for the Pb and Ag particles to the random orientation in the particles with spherical morphology (the 3D Ag and Cu dendrites, the cauliflower-like Cu particles, and the spongy-like Ni particles) can be explained by various rates of growth on various crystal planes [52]. This is related to values of the surface energy of crystal faces, which for fcc crystal lattice follow a trend of γ(111) < γ(100) < γ(311) < γ(110) [53,54]. The electrodeposition rates on them follow an opposite trend from the γ values, i.e., (110) > (311) > (100) > (111). The (110), (311), and (100) belong to the fast-growing planes, and they disappear firstly in process of growth. The (111) plane is denoted by the slow-growing plane, and it survives the growth process. The origin of crystallites oriented in the (111) plane is from growth centers present in the interior of growing particles (“center type”), while those oriented in the other planes originate from centers present at the tips, edges, and corners of the growing particles (“edge” and “corner” types) [21,55]. For the very fast electrochemical processes characterized by the high j0 values, the fast-growing planes fast disappear, while the slow-growing (111) plane survives, constructing a stalk and branches of dendrites and consequently causing the (111) preferred orientation in the particles. With the decrease in j0 value, a ramification of dendrites followed by an increase in the number of tips, edges, and corners occurs, which increases the contribution of crystallites oriented in the fast-growing planes. The decrease in the j0 values also leads to the appearance of the spherical morphology in the particles, causing a distribution of crystallites in them close to that for the corresponding standard already established for randomly distributed spherical grains.

3. Formation of Powders by Molten Salt Electrolysis

The very thin needle-like dendrites often grouped in the flower-like aggregates were produced by electrolysis from magnesium nitrate hexahydrate melt (Figure 14a). There is no difference in the morphology of needles obtained by the application of potentiostatic and galvanostatic regimes of electrolysis [56,57]. Unlike electrolysis from the aqueous electrolytes, molten salt electrolysis offers a possibility of direct formation of MgO next to Mg(OH)2 (Figure 14b). The general theory of disperse deposit formation applied to explain the formation of dendrites from aqueous electrolytes is also valid for dendrite formation by molten salt electrolysis [22].

4. Formation of Metal Powders by Electrolysis in Deep Eutectic Solvents (DESs)

In the last decade, deep eutectic solvents (DESs), as a unique class of multicomponent solvent systems formed through hydrogen bond interactions, began to be used for the synthesis of metal powders such as Pb [13,58,59,60], Sn [61,62], and Sb [63].
All electrodeposition parameters affecting the shape of Pb particles during electrolysis from aqueous electrolytes also affect the particle shape obtained from this electrolyte type. Depending on a concentration of PbO (in choline chloride (ChCl)–urea DES), various forms of Pb powders, such as corals, rods, wires, needles, ferns, and dendritic forms, are obtained, with an increasing tendency of a change of morphology of the particles from coral-like to the 2D and the 3D dendrites with the increase in PbO concentration [58]. Simultaneously, with the increase in PbO concentration, the preferred orientation of the powders changes from those with crystallites predominantly oriented in the (111) plane to the strong (200) preferred orientation. Sub-micrometer lead wires of various lengths and diameters with crystallites predominantly oriented in the (200) plane were obtained at the various temperatures [13,59]. Coral-like particles of varied size and porosity, mainly composed of many overlapped sub-micrometer lead flakes, were obtained by use of various concentrations of galena (PbS) instead of PbO in the same ChCl–urea DES [60]. The Pb crystallites in them were predominantly oriented in (111) plane. All mechanisms explaining the formation of Pb powder particles from the aqueous solutions are also valid for the formation of Pb powders from this electrolyte type.
Tin (Sn) powder particles with pyramid chain and dendritic structures were dominantly obtained by electrolysis in choline chloride–ethylene glycol deep eutectic solvent (ChCl-EG DES) [61,62]. The morphology of the particles changed from irregular particles to both long straight pyramid chains and 3D dendrites with increasing current density. Aside from the 3D dendrites, the mixture of the needle-like and the 2D dendrites was also formed at the high current density. Simultaneously, the calculated TC(hkl) coefficients showed that this change of the particle morphology was accompanied by the change of the preferred orientation of the particles from (200) to (101) [61]. With an increase in the concentration of Sn(II) ions, the morphology of the powders changed from the needle-like and the 3D dendrites with well-defined stalk and branches to the particles with pyramid chain structure, the needle-like and the 3D dendrites, and those like coarse pyramids. At the high Sn(II) concentration, the strong (200) preferred orientation is observed, whereas at the low Sn(II) concentration, Sn crystallites were dominantly oriented in the (211) plane [61]. Temperature also had a strong effect on the shape of Sn powder particles electrolytically obtained in ChCl-EG DES. The change of particle morphology from dendrites to tower cone-shaped and pagoda-shaped particles was observed with the increasing reaction temperature [62].
Antimony (Sb) powders consisting of particles of various shapes were obtained by electrolysis in ChCl-EG DES [63]. Depending on the current density and the temperature applied, various forms of the powder particles such as pine cone, wheat grain, badminton, dendritic, and cluster-like were synthesized. In all types of particles, the Sb crystallites were dominantly oriented in the (012) plane.

5. Crystal Growth and Crystal Structure of Electrodeposited FCC Metals

As already mentioned, according to the exchange current density, the melting point, and overpotential for hydrogen discharge, metals can be classified into three groups. Further, based on the literature data for the stacking fault energy (SFE) values, it is possible to expand this classification for fcc metals with low, medium, and high SFEs. SFE represents the energy that is associated with the interruption of the normal stacking sequence of a crystal plane, which has a notable influence on the mobility of defects, defect clusters, and dislocations and thus influences the defect evolution and crystal growth. Ag and Pb have low stacking fault energies, about 16 [64] and 25 mJ m−2 [65], respectively. For Cu and Ni, different values of SFE can be found in the literature depending on the applied measurement methods. The value of SFE for Cu ranges from 45 [66] to 85 mJ m−2 [65], which classifies it as a medium metal. Finally, Ni has a very high SFE that is more than 300 mJ m−2 [65].
The shape of an electrodeposited crystal is usually determined by the relative rates of the advance of close-packed faces. Close-packed faces show a relatively slow growth since the only places where atoms can be added are kink sites, while high index faces show a more rapid growth. The total growth rate is determined by the growth of the close-packed faces because the rapid disappearance of the high index faces is a result of their high growth rate. At exceptionally low growth rates when the solution and the crystal are nearly in equilibrium, the shape of faces will be determined by the requirement that the total surface energy of crystals is minimized [67].
As Ag and Pb have low stacking fault energy, they are subject to profuse twinning and stacking fault formation. The 2D and 3D dendrites of Ag [18,34,64,68] and Pb [26,29,31] are twin crystals.
The 2D dendrites are of fern-like shape because they grow and branch in one plane (Figure 3 for Pb and Figure 5c,d for Ag). Branching in one plane only is directly related to the occurrence of growth twins, and at least one twinning boundary is parallel to the plane of the dendrite [34,69]. Two or more twin planes guarantee the presence of at least one reentrant edge that is a result of the emergence of a twin plane on a crystal surface, which is a repeatable growth defect in faceted crystals. The twin grooves in nuclei are sites of lower energy for further nucleation and growth than the faces [34,70]. The twinning plane in fcc crystal is (111), with stalk and all branches being parallel to the <211> direction growth. Dendrites also grow in thickness, using the layer growth mechanism while the faces appear on the main face of a dendrite. The growth in <211> and <111> directions causes the appearance of 3D dendrites (pine-like dendrites) (Figure 8) [34].
Although Cu has slightly higher stacking fault energy (medium), its growth is similar to 3D dendrites (pine-like) of Ag electrodeposited from the ammonium electrolyte [38,41]. Dendrites also grow by layer growth mechanism [34]. The dendrites likely branch in the <111> direction, so the main stem and primary branches make an angle of nearly 90° (Figure 10a,b). In this way, they have a 3D appearance.
Relative to Pb, Ag, and Cu, Ni as metal from the VIIIB group has smaller atomic volumes and higher effective electron numbers, Z, which results in a smaller critical dimension for nucleation. Ni possesses vast binding energy and thus favors the aggregation of atoms into small 3D clusters. The diffusion of electrodeposited atoms along the surface is inhibited by the high cohesive energy of this metal, which results in the nucleation, growth, and coalescence of many 3D grains during deposition [71]. Moreover, due to the high stacking fault energy, crystals of Ni are not inclined to twinning (Figure 12).

6. Conclusions

Correlation between morphology and crystal structure of metal powders produced by the constant regimes of electrolysis was presented at the semiquantitative level. Morphology of the powder particles was strongly affected by parameters such as the exchange current density (the rate of electrochemical process) and overpotential for hydrogen evolution reaction. It was shown:
  • The needle-like and the 2D fern-like dendrites were obtained by electrolysis of metals characterized by the high j0 values (silver and lead). The powders composed of these particles possessed either the strong (111) (the needle-like Ag and the 2D fern-like Pb dendrites) or the (111) (the 2D fern-like Ag dendrites) preferred orientation.
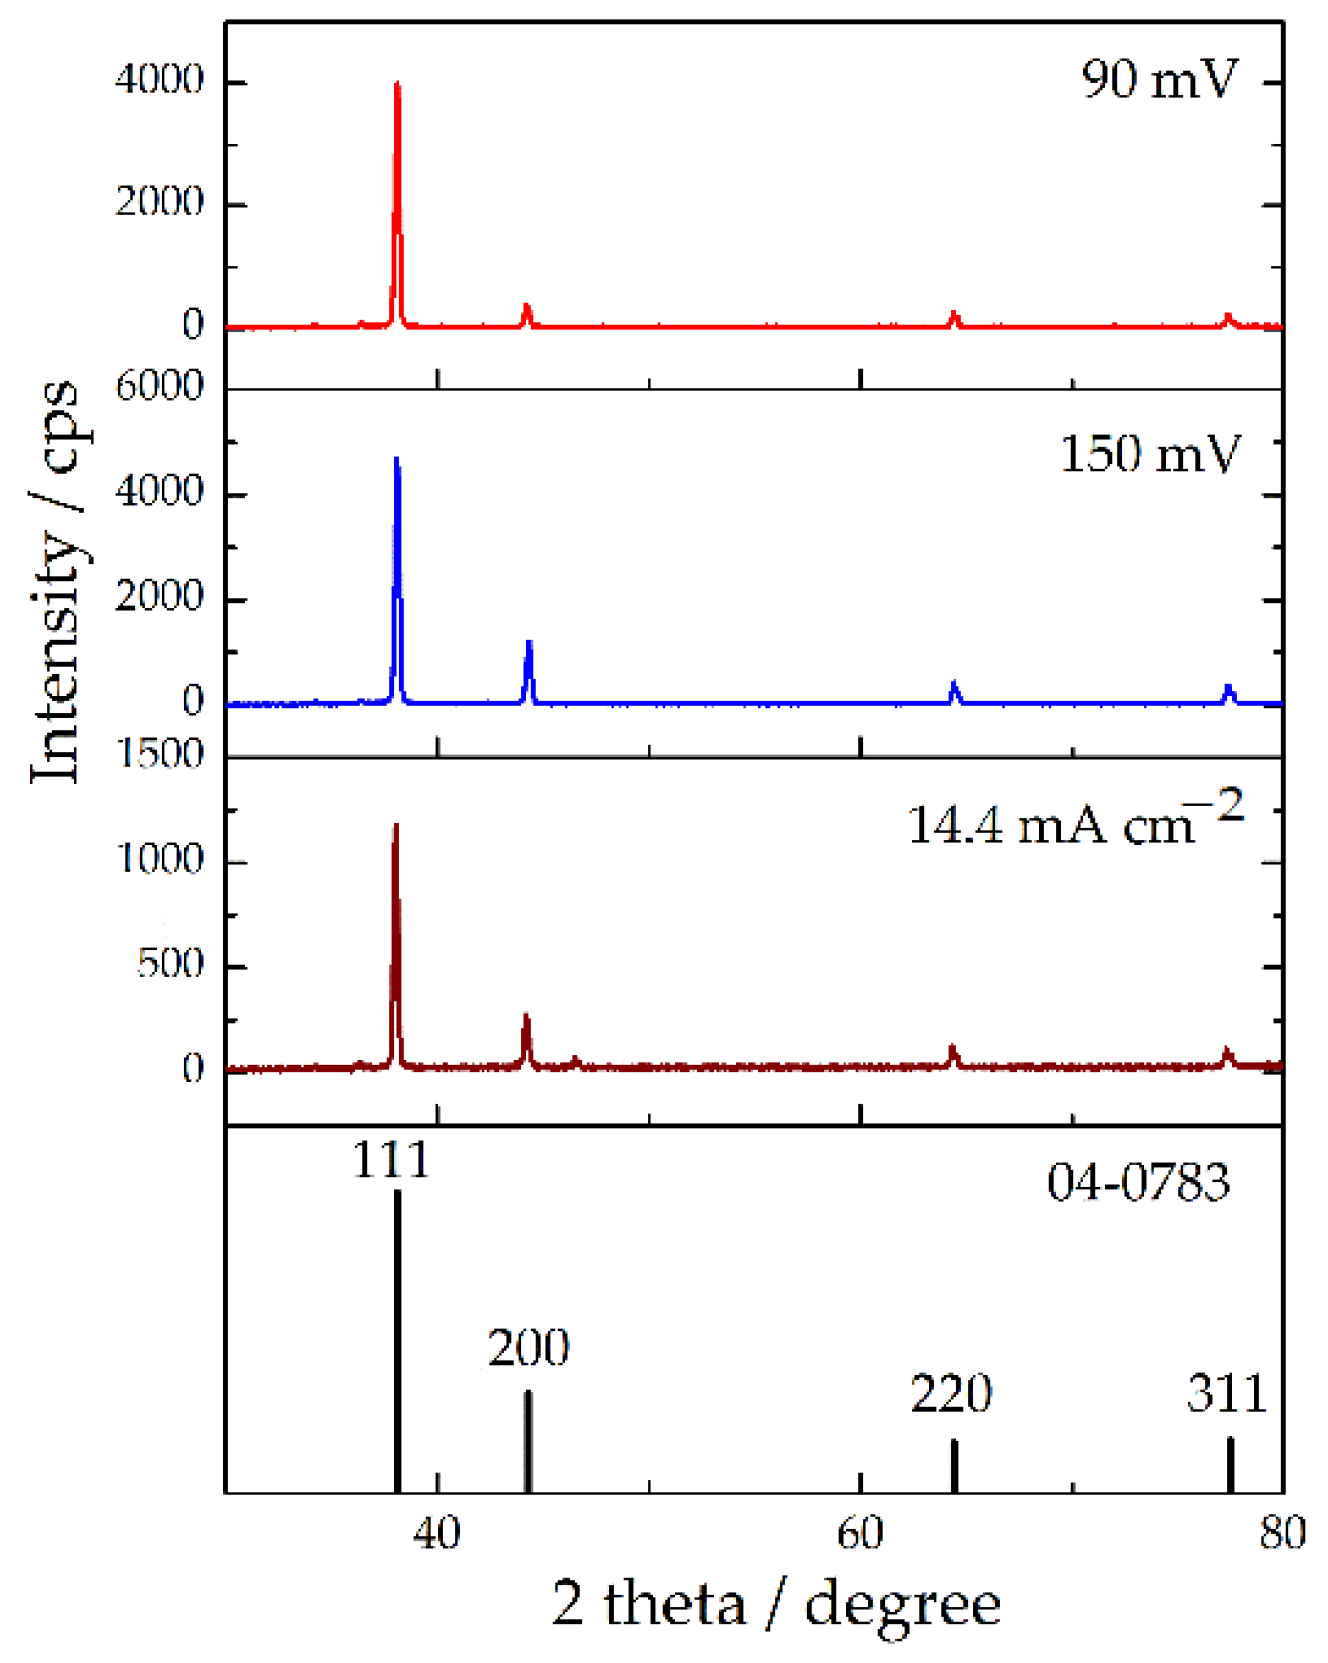
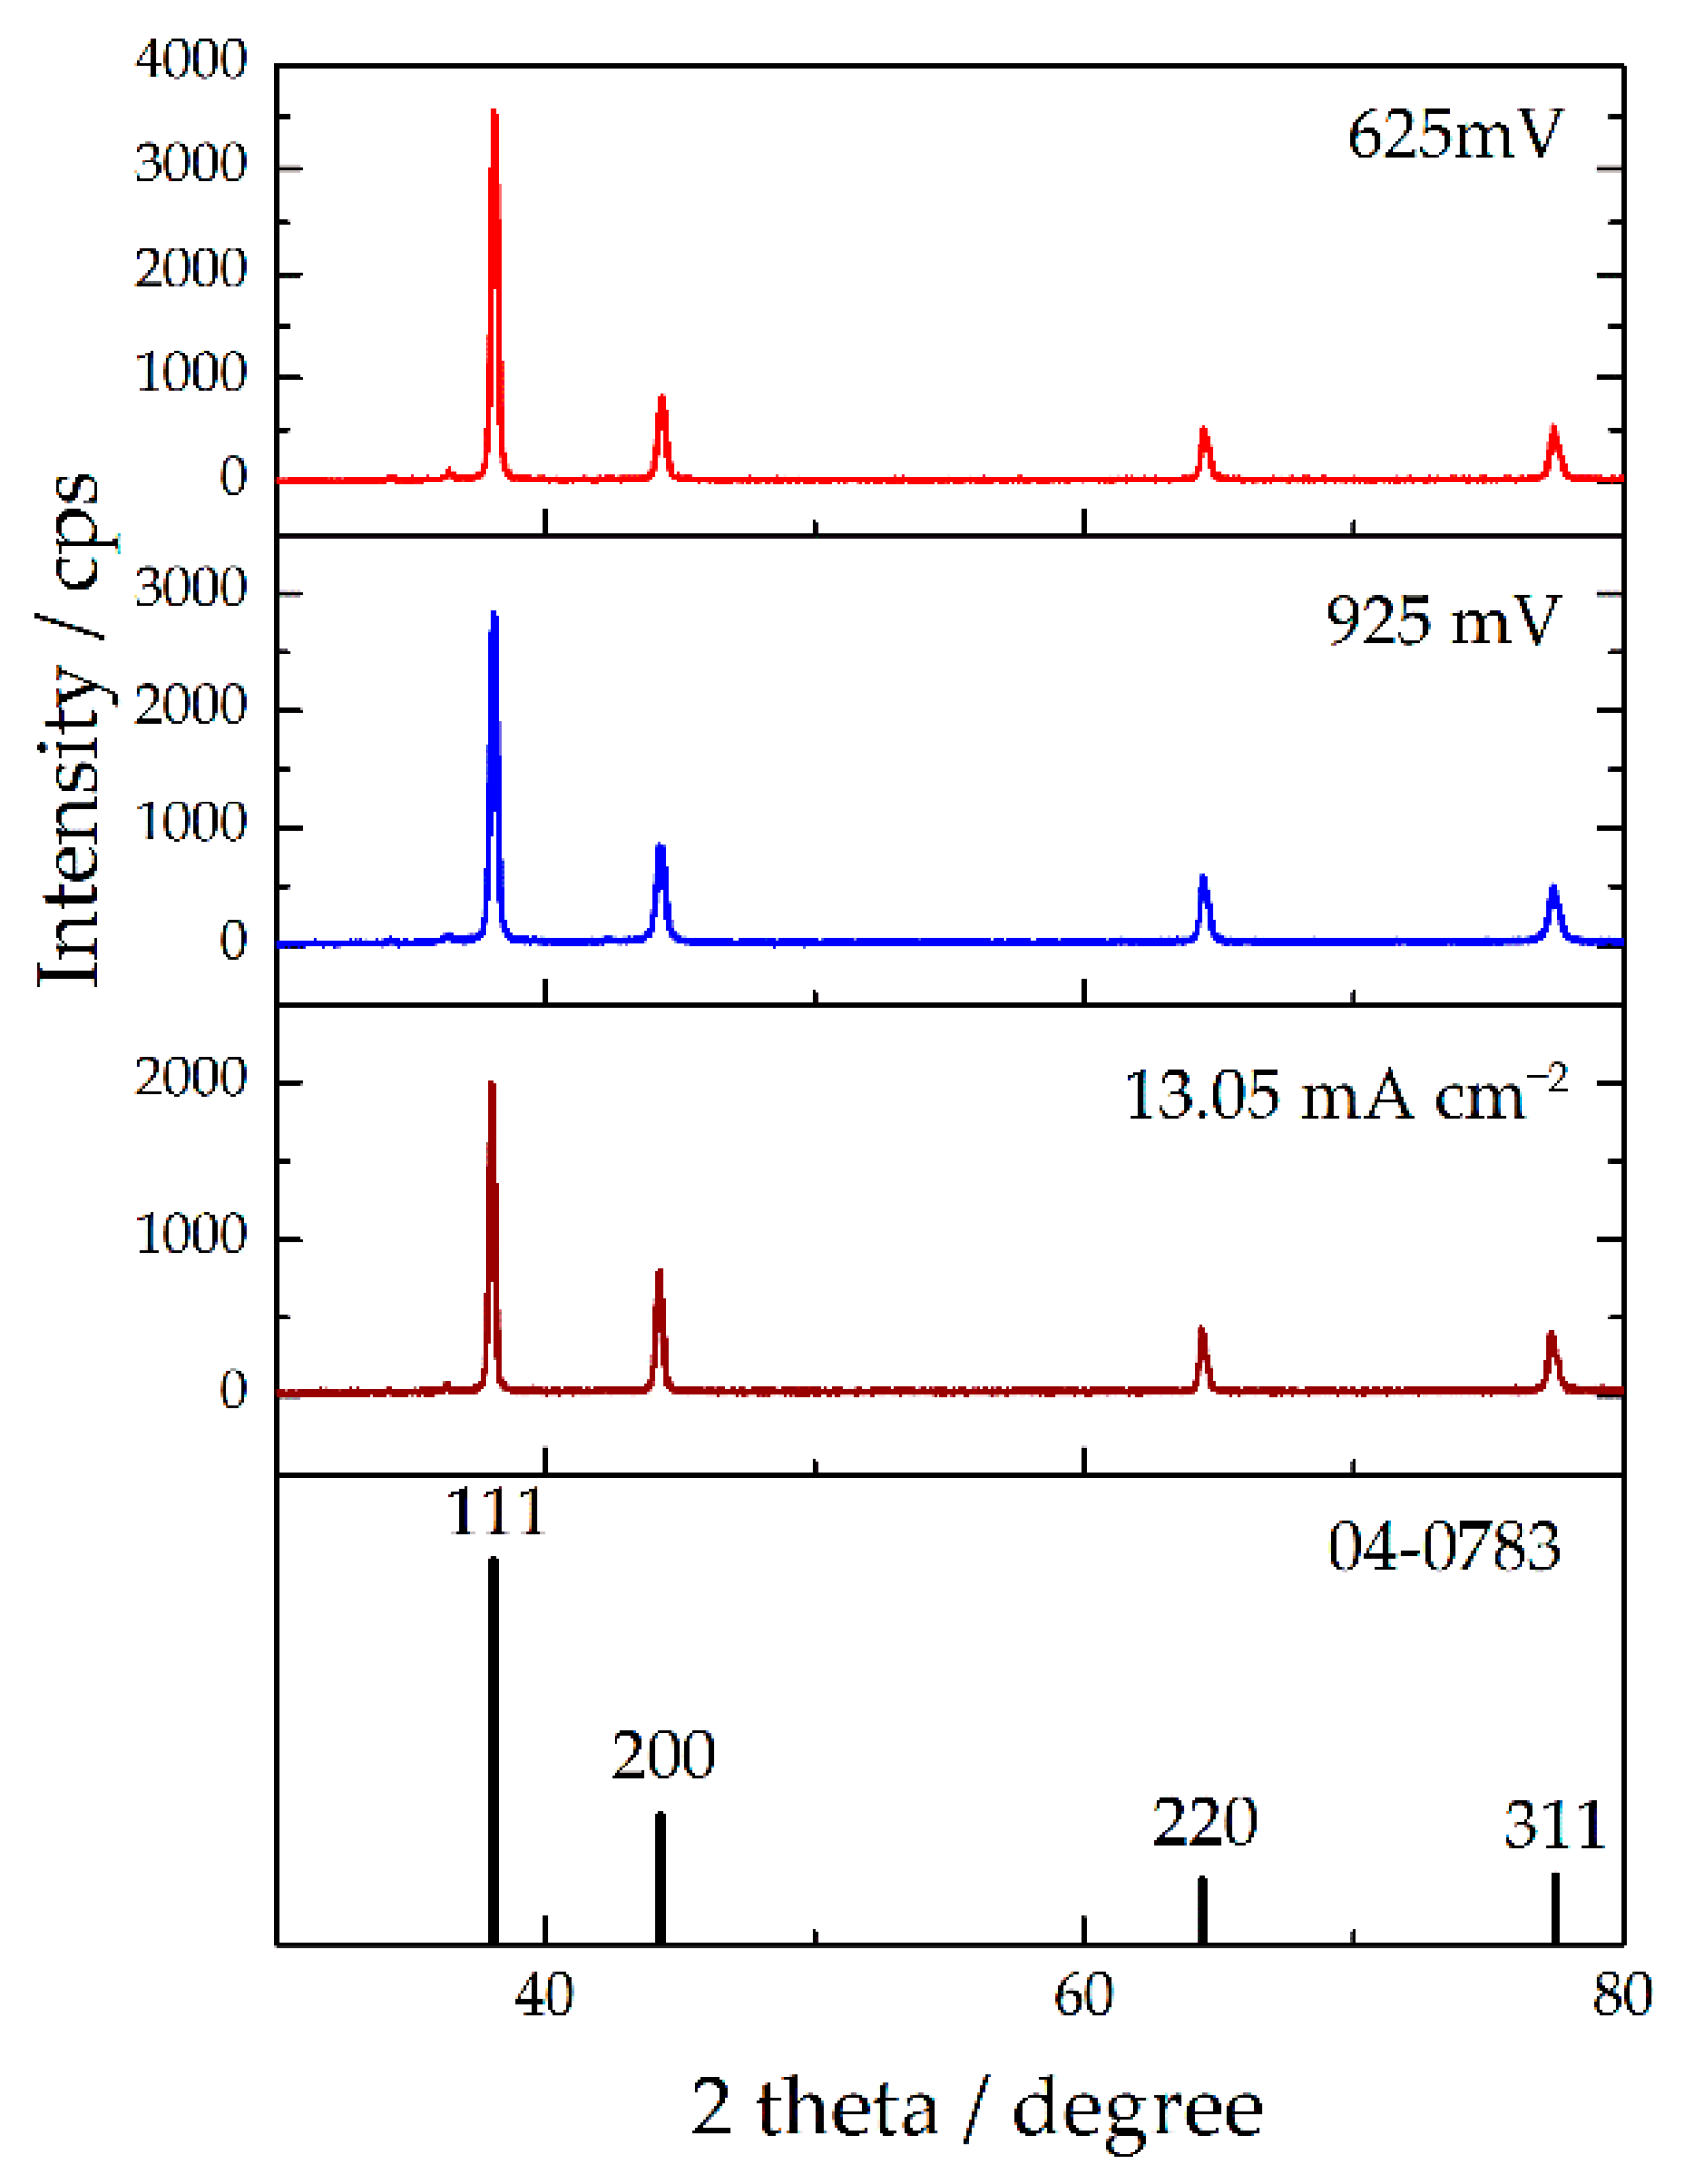
  • The 3D pine-like dendrites, including those built from globules, were produced by electrolysis of metals characterized by medium j0 values (Ag electrodeposited from the ammonium solution and Cu). The 3D pine-like dendrites were built from approximately spherical grains. The powders composed of these particles possessed a random orientation.
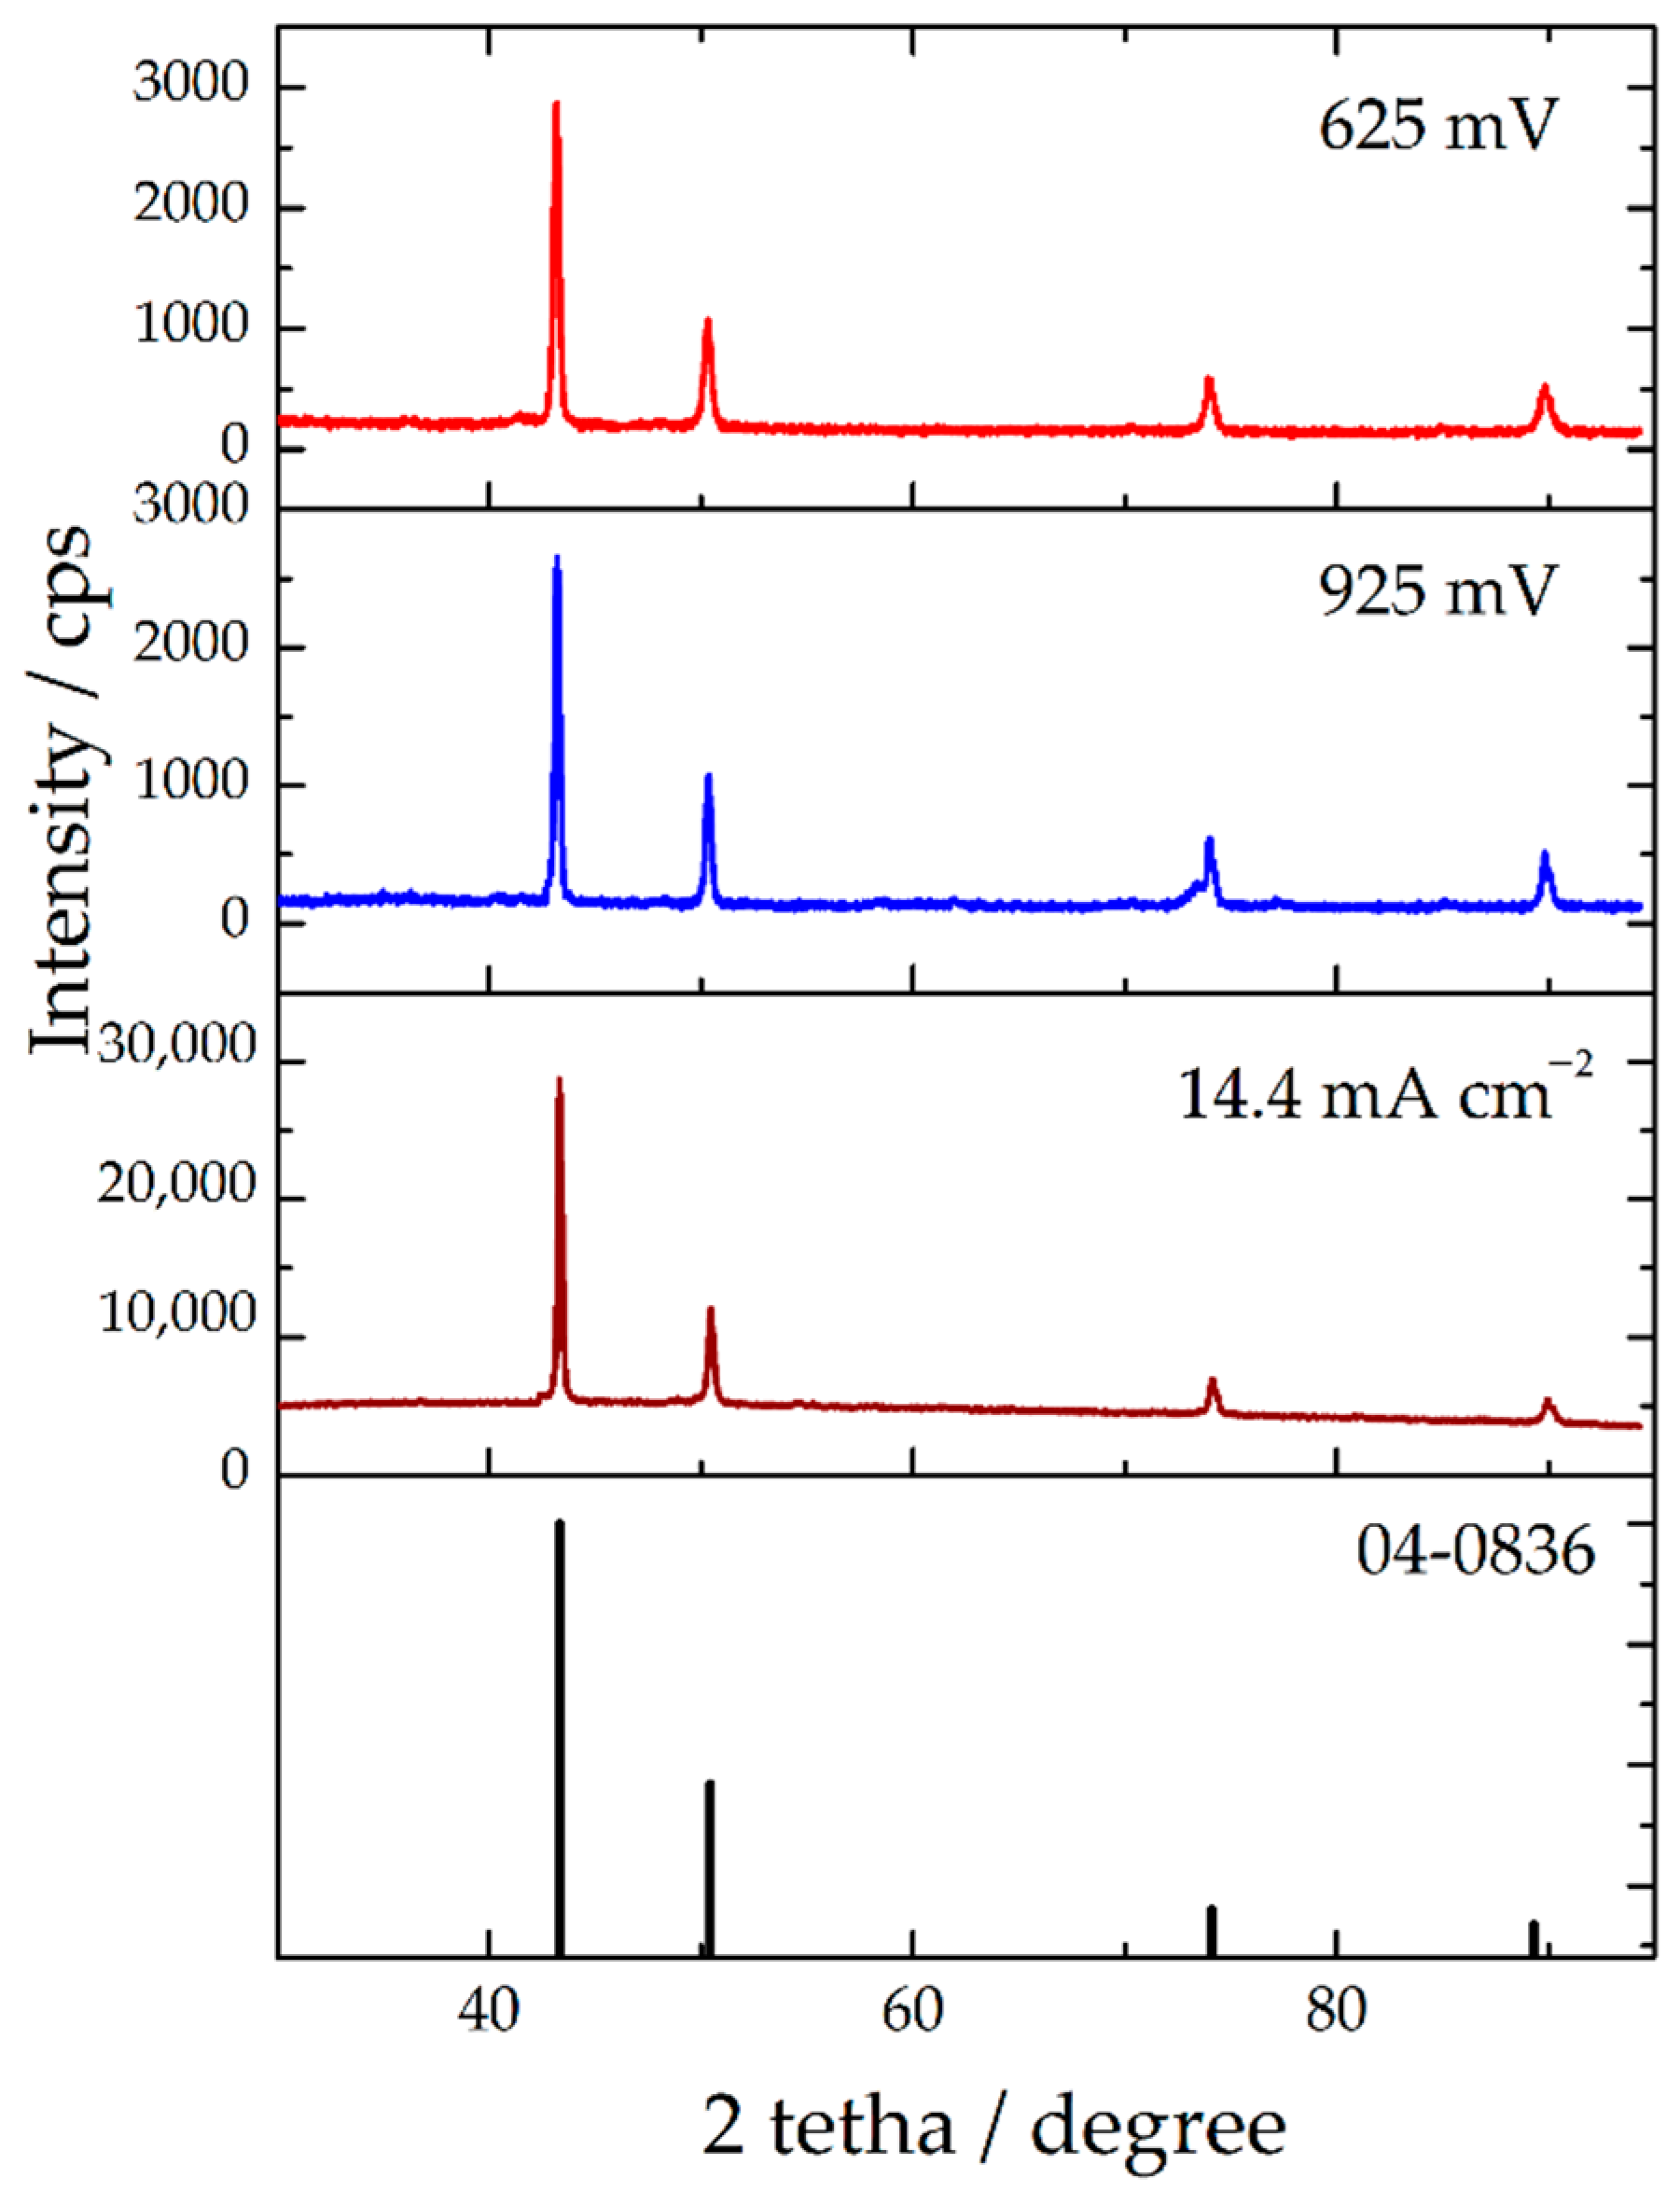
  • The intensive hydrogen evolution as the parallel reaction strongly affected the form of the powder particles. The cauliflower-like (Cu) and the spongy-like (Ni) particles were obtained under vigorous hydrogen evolution. Both types of particles were built from approximately spherical grains. The powders composed of these particles showed a random orientation.
  • Formation of metal powders by electrolysis from molten salt (Mg) and electrolysis in deep eutectic solvents (Pb, Sn, and Sb) was also presented. Special attention was given to the analysis of the morphology and crystal structure of powders obtained by these types of electrolysis.

Author Contributions

Conceptualization, N.D.N.; methodology, N.D.N. and V.M.M.; validation, N.D.N. and V.M.M.; investigation, N.D.N., L.A. and V.M.M.; writing—original draft preparation, N.D.N.; writing—review and editing, N.D.N., L.A. and V.M.M.; visualization, N.D.N.; supervision, N.D.N. All authors have read and agreed to the published version of the manuscript.

Funding

This research was funded by the Ministry of Education, Science and Technological Development of the Republic of Serbia, grant numbers 451-03-9/2021-14/200026, and 451-03-9/2021-14/200017.

Institutional Review Board Statement

Not applicable.

Informed Consent Statement

Not applicable.

Data Availability Statement

The data presented in this study are available on request from the corresponding author or co-authors. The data are not publicly available.

Conflicts of Interest

The authors declare no conflict of interest.

Appendix A

The “Texture Coefficient” TC(hkl) and the “Relative Texture Coefficient” RTC(hkl) were determined by analysis of the XRD data. The ratio of reflection intensity (hkl) to the sum of all intensities of the recorded reflections, R(hkl), (in%) is given by Equation (A1) [18,19]:
R ( h k l ) = ( I ( h k l ) / i 4 I ( h i k i l i ) ) × 100
where I (hkl) is a reflection intensity (hkl) plane, in cps, and i 4 I ( h k l ) is the sum of all intensities of the recorded reflections, in cps, for the powder being considered.
The “Texture Coefficient”, TC(hkl), for every (hkl) reflection is defined by Equation (A2):
T C ( h k l ) = R ( h k l ) R s   ( h k l )
where Rs(hkl) is defined in the same way as given by Equation (A2) but is related to the standard for metal under consideration. This coefficient gives accurate quantitative information about the absolute reflection intensity.
Finally, the “Relative Texture Coefficient”, RTC(hkl), is defined by Equation (A3):
R T C ( h k l ) = ( T C ( h k l ) / i 4 T C ( h i k i l i ) ) × 100
The RTC(hkl) coefficient defines the reflection intensity (hkl) relative to the standard (included in the TC values).

References

  1. Popov, K.I.; Pavlović, M.G. Metal Powder Production by Electrolysis. In Electrochemistry Encyclopedia; The Electrochemical Society: Pennington, NJ, USA, 2005; Available online: https://knowledge.electrochem.org/encycl/art-p04-metalpowder.htm. (accessed on 17 March 2021).
  2. Making Metal Powder. Available online: https://www.mpif.org/IntrotoPM/MakingMetalPowder.aspx. (accessed on 17 March 2021).
  3. Stopić, S.; Dvorak, P.; Friedrich, B. Synthesis of Spherical Nanosized Copper Powder by Ultrasonic Spray Pyrolysis. World Metall. 2005, 58, 195–201. [Google Scholar]
  4. Meshram, P.; Sinha, M.K.; Sahu, S.K.; Khan, P.; Pandey, B.D.; Mankhand, T.R. Solvothermal Synthesis of High Value Copper Powder from Copper Bleed Solution of an Indian Copper Smelter. Powder Technol. 2013, 233, 335–340. [Google Scholar] [CrossRef]
  5. Jhajharia, R.; Jain, D.; Sengar, A.; Goyal, A.; Soni, P.R. Synthesis of Copper Powder by Mechanically Activated Cementation. Powder Technol. 2016, 301, 10–15. [Google Scholar] [CrossRef]
  6. Rosenband, V.; Gany, A. Preparation of Nickel and Copper Submicrometer Particles by Pyrolysis of their Formats. J. Mater. Process. Technol. 2004, 153, 1058–1061. [Google Scholar] [CrossRef]
  7. Djokić, S.S. Production of Metallic Powders from Aqueous Solutions without an External Current Source. In Electrochemical Production of Metal Powders, Series: Modern Aspects of Electrochemistry; Djokić, S.S., Ed.; Springer: New York, NY, USA, 2012; Volume 54, pp. 369–398. [Google Scholar]
  8. Antony, L.V.M.; Reddy, R.G. Processes for Production of High-Purity Metal Powders. JOM 2003, 55, 14–18. [Google Scholar] [CrossRef]
  9. Chaubey, A.K.; Scudino, S.; Khoshkhoo, M.S.; Prashanth, K.G.; Mukhopadhyay, N.K.; Mishra, B.K.; Eckert, J. Synthesis and Characterization of Nanocrystalline Mg-7.4%Al Powders Produced by Mechanical Alloying. Metals 2013, 3, 58–68. [Google Scholar] [CrossRef] [Green Version]
  10. Popov, K.I.; Djokić, S.S.; Nikolić, N.D.; Jović, V.D. Morphology of Electrochemically and Chemically Deposited Metals; Springer: New York, NY, USA, 2016; pp. 1–368. [Google Scholar]
  11. Amiri, M.; Nouhi, S.; Azizian-Kalandaragh, Y. Facile Synthesis of Silver Nanostructures by Using Various Deposition Potential and Time: A Nonenzymatic Sensors for Hydrogen Peroxide. Mater. Chem. Phys. 2015, 155, 129–135. [Google Scholar] [CrossRef]
  12. Calusaru, A. Electrodeposition of Metal Powders; Elsevier: New York, NY, USA, 1979; pp. 1–544. [Google Scholar]
  13. Ru, J.; Hua, Y.; Xu, C.; Li, J.; Li, Y.; Wang, D.; Gong, K.; Zhou, Z. Preparation of Sub-micrometer Lead Wires from PbO by Electrodeposition in Choline Chloride-urea Deep Eutectic Solvent. Adv. Powder Technol. 2015, 26, 91–97. [Google Scholar] [CrossRef]
  14. Winand, R. Electrodeposition of Metals and Alloys–New Results and Perspectives. Electrochim. Acta 1994, 39, 1091–1105. [Google Scholar] [CrossRef]
  15. Nikolić, N.D. Influence of the Exchange Current Density and Overpotential for Hydrogen Evolution Reaction on the Shape of Electrolytically Produced Disperse Forms. J. Electrochem. Sci. Eng. 2020, 10, 111–126. [Google Scholar] [CrossRef]
  16. Nikolić, N.D.; Popov, K.I.; Pavlović, L.J.; Pavlović, M.G. The Effect of Hydrogen Codeposition on the Morphology of Copper Electrodeposits. I. The Concept of Effective Overpotential. J. Electroanal. Chem. 2006, 588, 88–98. [Google Scholar] [CrossRef]
  17. Berube, L.P.; Esperance, G.L. A Quantitative Method of Determining of the Degree of Texture of Zinc Electrodeposits. J. Electrochem. Soc. 1989, 136, 2314–2315. [Google Scholar] [CrossRef]
  18. Avramović, L.; Pavlović, M.M.; Maksimović, V.M.; Vuković, M.; Stevanović, J.S.; Bugarin, M.; Nikolić, N.D. Comparative Morphological and Crystallographic Analysis of Electrochemically- and Chemically-Produced Silver Powder Particles. Metals 2017, 7, 160. [Google Scholar] [CrossRef] [Green Version]
  19. Avramović, L.; Maksimović, V.M.; Baščarević, Z.; Ignjatović, N.; Bugarin, M.; Marković, R.; Nikolić, N.D. Influence of the Shape of Copper Powder Particles on the Crystal Structure and Some Decisive Characteristics of the Metal Powders. Metals 2019, 9, 56. [Google Scholar] [CrossRef] [Green Version]
  20. Nikolić, N.D.; Maksimović, V.M.; Branković, G.; Živković, P.M.; Pavlović, M.G. Correlation between Crystal Orientation and Morphology of Electrolytically Produced Powder Particles: Analysis of the Limiting Cases. Mater. Prot. 2018, 59, 256–264. [Google Scholar] [CrossRef]
  21. Wranglen, G. Dendrites and Growth Layers in the Electrocrystallization of Metals. Electrochim. Acta 1960, 2, 130–146. [Google Scholar] [CrossRef]
  22. Popov, K.I.; Nikolić, N.D. General Theory of Disperse Metal Electrodeposits Formation. In Electrochemical Production of Metal Powders, Series: Modern Aspects of Electrochemistry; Djokić, S.S., Ed.; Springer: New York, NY, USA, 2012; Volume 54, pp. 1–62. [Google Scholar]
  23. Diggle, J.W.; Despic, A.R.; Bockris, J.O.’M. The Mechanism of the Dendritic Electrocrystallization of Zinc. J. Electrochem. Soc. 1969, 116, 1503–1514. [Google Scholar] [CrossRef]
  24. Nikolić, N.D.; Živković, P.M.; Branković, G.; Pavlović, M.G. Estimation of the Exchange Current Density and Comparative Analysis of Morphology of Electrochemically Produced Lead and Zinc Deposits. J. Serb. Chem. Soc. 2017, 82, 539–550. [Google Scholar] [CrossRef]
  25. Fetter, K. Electrochemical Kinetics; Khimiya: Moscow, Russia, 1967. (In Russian) [Google Scholar]
  26. Nikolić, N.D.; Branković, G.; Lačnjevac, U. Formation of Two-dimensional (2D) Lead Dendrites by Application of Different Regimes of Electrolysis. J. Solid State Electrochem. 2012, 16, 2121–2126. [Google Scholar] [CrossRef]
  27. Nikolić, N.D.; Vaštag, D.D.; Živković, P.M.; Jokić, B.; Branković, G. Influence of the Complex Formation on the Morphology of Lead Powder Particles Produced by the Electrodeposition Processes. Adv. Powder Technol. 2013, 24, 674–682. [Google Scholar] [CrossRef]
  28. Nikolić, N.D.; Popov, K.I.; Živković, P.M.; Branković, G. A New Insight into the Mechanism of Lead Electrodeposition: Ohmic–diffusion Control of the Electrodeposition Process. J. Electroanal. Chem. 2013, 691, 66–76. [Google Scholar] [CrossRef]
  29. Nikolić, N.D.; Popov, K.I.; Ivanović, E.R.; Branković, G.; Stevanović, S.I.; Živković, P.M. The Potentiostatic Current Transients and the Role of Local Diffusion Fields in Formation of the 2D Lead Dendrites from the Concentrated Electrolyte. J. Electroanal. Chem. 2015, 739, 137–148. [Google Scholar] [CrossRef]
  30. Wong, S.M.; Abrantes, L.M. Lead Electrodeposition from Very Alkaline Media. Electrochim. Acta 2005, 51, 619–626. [Google Scholar] [CrossRef]
  31. Nikolić, N.D.; Vaštag, D.D.; Maksimović, V.M.; Branković, G. Morphological and Crystallographic Characteristics of Lead Powder Obtained by Electrodeposition from an Environmentally Friendly Electrolyte. Trans. Nonferrous Met. Soc. China 2014, 24, 884–892. [Google Scholar] [CrossRef]
  32. Ni, Y.; Zhang, Y.; Hong, J. Hierarchical Pb Microstructures: A Facile Electrochemical Synthesis, Shape Evolution and Influencing Factors. CrystEngComm 2011, 13, 934–940. [Google Scholar] [CrossRef]
  33. Sivasubramanian, R.; Sangaranarayanan, M.V. Electrodeposition of Silver Nanostructures: From Polygons to Dendrites. CrystEngComm 2013, 15, 2052–2056. [Google Scholar] [CrossRef]
  34. Avramović, L.; Ivanović, E.R.; Maksimović, V.M.; Pavlović, M.M.; Vuković, M.; Stevanović, J.S.; Nikolić, N.D. Correlation between Crystal Structure and Morphology of Potentiostatically Electrodeposited Silver Dendritic Nanostructures. Trans. Nonferrous Met. Soc. China 2018, 28, 1903–1912. [Google Scholar] [CrossRef]
  35. Nikolić, N.D.; Popov, K.I. A New Approach to the Understanding of the Mechanism of Lead Electrodeposition. In Electrodeposition and Surface Finishing; Series: Modern Aspects of Electrochemistry; Djokić, S.S., Ed.; Springer: New York, NY, USA, 2014; Volume 57, pp. 85–132. [Google Scholar]
  36. Popov, K.I.; Krstajić, N.V.; Popov, S.R. Fundamental Aspects of Plating Technology II: Morphological Aspects of Metal Electrodeposition from Complex Salt Solutions. Surf. Technol. 1983, 20, 203–208. [Google Scholar] [CrossRef]
  37. Popov, K.I.; Grgur, B.N.; Stojilković, E.R.; Pavlović, M.G.; Nikolić, N.D. The Effect of Deposition Process Exchange Current Density on the Thin Metal Film Formation on Inert Substrate. J. Serb. Chem. Soc. 1997, 62, 433–442. [Google Scholar]
  38. Nikolić, N.D.; Avramović, L.; Ivanović, E.R.; Maksimović, V.M.; Baščarević, Z.; Ignjatović, N. Comparative Morphological and Crystallographic Analysis of Copper Powders Obtained under Different Electrolysis Conditions. Trans. Nonferrous Met. Soc. China 2019, 29, 1275–1284. [Google Scholar] [CrossRef]
  39. Jović, V.D.; Jović, B.M.; Pavlović, M.G. Electrodeposition of Ni, Co and Ni-Co Alloy Powders. Electrochim. Acta 2006, 51, 5468–5477. [Google Scholar] [CrossRef]
  40. Jović, V.D.; Nikolić, N.D.; Lačnjevac, U.Č.; Jović, B.M.; Popov, K.I. Morphology of Different Electrodeposited Pure Metal Powders. In Electrochemical Production of Metal Powders; Series: Modern Aspects of Electrochemistry; Djokić, S.S., Ed.; Springer: New York, NY, USA, 2012; Volume 54, pp. 63–123. [Google Scholar]
  41. Nikolić, N.D.; Pavlović, L.J.; Pavlović, M.G.; Popov, K.I. Morphologies of Electrochemically Formed Copper Powder Particles and their Dependence on the Quantity of Evolved Hydrogen. Powder Technol. 2008, 185, 195–201. [Google Scholar] [CrossRef]
  42. Nikolić, N.D.; Branković, G.; Pavlović, M.G. Correlate Between Morphology of Powder Particles Obtained by the Different Regimes of Electrolysis and the Quantity of Evolved Hydrogen. Powder Technol. 2012, 221, 271–277. [Google Scholar] [CrossRef]
  43. Han, J.; Liu, J. Electrodeposition of Crystalline Dendritic Silver in 12-Tungstosilicate Acid System. J. Nanoeng. Nanomanuf. 2012, 2, 171–174. [Google Scholar] [CrossRef]
  44. Mandke, M.V.; Han, S.-H.; Pathan, H.M. Growth of Silver Dendritic Nanostructures via Electrochemical Route. CrystEngComm 2012, 14, 86–89. [Google Scholar] [CrossRef]
  45. Orhan, G.; Hapci, G. Effect of Electrolysis Parameters on the Morphologies of Copper Powder Obtained in a Rotating Cylinder Electrode Cell. Powder Technol. 2010, 201, 57–63. [Google Scholar] [CrossRef]
  46. Ostanina, T.N.; Rudoi, V.M.; Patrushev, A.V.; Darintseva, A.B.; Farlenkov, A.S. Modelling the Dynamic Growth of Copper and Zinc Dendritic Deposits under the Galvanostatic Electrolysis Conditions. J. Electroanal. Chem. 2015, 750, 9–18. [Google Scholar] [CrossRef]
  47. Nikitin, V.S.; Ostanina, T.N.; Rudoi, V.M.; Kuloshvili, T.S.; Darintseva, A.B. Features of Hydrogen Evolution during Electrodeposition of Loose Deposits of Copper, Nickel and Zinc. J. Electroanal. Chem. 2020, 870, 114230. [Google Scholar] [CrossRef]
  48. Nekouei, R.K.; Rashchi, F.; Ravanbakhsh, A. Copper Nanopowder Synthesis by Electrolysis Method in Nitrate and Sulfate Solutions. Powder Technol. 2013, 250, 91–96. [Google Scholar] [CrossRef]
  49. Copper Powder. Available online: http://www.cnpcpowder.com/products/copper/ (accessed on 17 March 2021).
  50. Lou, W.; Cai, W.; Li, P.; Su, J.; Zheng, S.; Zhang, Y.; Jin, W. Additives-assisted Electrodeposition of Fine Spherical Copper Powder from Sulfuric Acid Solution. Powder Technol. 2018, 326, 84–88. [Google Scholar] [CrossRef]
  51. Nikolić, N.D.; Živković, P.M.; Pavlović, M.G.; Baščarević, Z. Overpotential Controls a Morphology of Electrolytically Produced Copper Dendritic Forms. J. Serb. Chem. Soc. 2019, 84, 1209–1220. [Google Scholar] [CrossRef] [Green Version]
  52. Bockris, J.O.’M.; Reddy, A.K.N.; Gamboa-Aldeco, M.E. Modern Electrochemistry 2A, Fundamentals of Electrodics; Kluwer Academic/Plenum Publishers: New York, NY, USA; Springer: Boston, MA, USA, 2000; p. 1333. [Google Scholar]
  53. Zhang, J.M.; Ma, F.; Xu, K.W. Calculation of the Surface Energy of FCC Metals with Modified Embedded-atom Method. Appl. Surf. Sci. 2004, 229, 34–42. [Google Scholar] [CrossRef]
  54. Wang, S.G.; Tian, E.K.; Lung, C.W. Surface Energy of Arbitrary Crystal Plane of bcc and fcc Metals. J. Phys. Chem. Solids 2000, 61, 1295–1300. [Google Scholar] [CrossRef]
  55. Nikolić, N.D.; Maksimović, V.M.; Branković, G. Morphological and Crystallographic Characteristics of Electrodeposited Lead from the Concentrated Electrolyte. RSC Adv. 2013, 3, 7466–7471. [Google Scholar] [CrossRef] [Green Version]
  56. Cvetković, V.S.; Vukićević, N.M.; Nikolić, N.D.; Branković, G.; Barudžija, T.S.; Jovićević, J.N. Formation of Needle-like and Honeycomb-like Magnesium Oxide/Hydroxide Structures by Electrodeposition from Magnesium Nitrate Melts. Electrochim. Acta 2018, 268, 494–502. [Google Scholar] [CrossRef]
  57. Cvetković, V.S.; Vukićević, N.M.; Nikolić, N.D.; Baščarević, Z.; Barudžija, T.S.; Jovićević, J.N. A Possible Mechanism of Formation of Flower-like MgO/Mg(OH)2 Structures by Galvanostatic Molten Salt Electrolysis: The Concept of Local Diffusion Fields. J. Electroanal. Chem. 2019, 842, 168–175. [Google Scholar] [CrossRef]
  58. Ru, J.; Hua, Y.; Xu, C.; Li, J.; Li, Y.; Wang, D.; Qi, C.; Jie, Y. Morphology-controlled Preparation of Lead Powders by Electrodeposition from Different PbO-containing Choline Chloride-urea Deep Eutectic Solvent. Appl. Surf. Sci. 2015, 335, 153–159. [Google Scholar] [CrossRef]
  59. Ru, J.; Hua, Y.; Xu, C.; Li, J.; Li, Y.; Wang, D.; Qi, C.; Gong, K. Electrochemistry of Pb(II)/Pb during Preparation of Lead Wires from PbO in Choline Chloride–Urea Deep Eutectic Solvent. Russ. J. Electrochem. 2015, 51, 773–781. [Google Scholar] [CrossRef]
  60. Ru, J.; Bu, J.; Wang, Z.; Hua, Y.; Wang, D. Eco-friendly and Facile Electrochemical Synthesis of Sub-micrometer Lead Powders in Deep Eutectic Solvents Using Galena as a Raw Material. J. Appl. Electrochem. 2019, 49, 369–377. [Google Scholar] [CrossRef]
  61. Wang, Z.; Ru, J.; Hua, Y.; Bu, J.; Geng, X.; Zhang, W. Electrodeposition of Sn Powders with Pyramid Chain and Dendrite Structures in Deep Eutectic Solvent: Roles of Current Density and SnCl2 Concentration. J. Solid State Electrochem. 2021, 25, 1111–1120. [Google Scholar] [CrossRef]
  62. Wang, Z.; Ru, J.; Hua, Y.; Wang, D.; Bu, J. Morphology-Controlled Preparation of Sn Powders by Electrodeposition in Deep Eutectic Solvent as Anodes for Lithium Ion Batteries. J. Electrochem. Soc. 2020, 167, 082504. [Google Scholar] [CrossRef]
  63. Bu, J.; Ru, J.; Wang, Z.; Hua, Y.; Xu, C.; Zhang, Y.; Wang, Y. Controllable Preparation of Antimony Powders by Electrodeposition in Choline Chloride-ethylene Glycol. Adv. Powder Technol. 2019, 30, 2859–2867. [Google Scholar] [CrossRef]
  64. Radmilovic, V.V.; Kacher, J.; Ivanovic, E.R.; Minor, A.M.; Radmilovic, V.R. Multiple Twinning and Stacking Faults in Silver Dendrites. Cryst. Growth Des. 2016, 16, 467–474. [Google Scholar] [CrossRef]
  65. Smallman, R.; Dillamore, I.; Dobson, P. The Measurement of Stacking Fault Energy. J. Phys. Colloq. 1966, 27, C3-86–C3-93. [Google Scholar] [CrossRef]
  66. Liu, F.; Yuan, H.; Yin, J.; Wang, J.T. Influence of Stacking Fault Energy and Temperature on Microstructures and Mechanical Properties of fcc Pure Metals Processed by Equal-channel Angular Pressing. Mat. Sci. Eng. A Struct. 2016, 662, 578–587. [Google Scholar] [CrossRef]
  67. Cabrera, N.; Vermilyea, D.A. The Growth of Crystals from Solution. In Growth and Perfection of Crystals; Doremus, R.H., Roberts, B.W., Turnbull, D., Eds.; John Wiley & Sons: New York, NY, USA; Chapman & Hall: London, UK, 1958; pp. 393–410. [Google Scholar]
  68. Ivanović, E.R.; Nikolić, N.D.; Radmilović, V.R. Randomly Oriented Twin Domains in Electrodeposited Silver Dendrites. J. Serb. Chem. Soc. 2015, 80, 107–113. [Google Scholar] [CrossRef]
  69. Smit, J.; Ogburn, F.; Bechtoldt, C.J. Multiple Twin Structures in Electrodeposited Silver Dendrites. J. Electrochem. Soc. 1968, 115, 371–374. [Google Scholar] [CrossRef]
  70. Hamilton, D.R.; Seidensticker, R.G.J. Propagation Mechanism of Germanium Dendrites. Appl. Phys. 1960, 31, 1165–1168. [Google Scholar] [CrossRef]
  71. Tian, M.L.; Wang, J.G.; Kurtz, J.; Mallouk, T.E.; Chan, M.H.W. Electrochemical Growth of Single-Crystal Metal Nanowires via a Two-Dimensional Nucleation and Growth Mechanism. Nano Lett. 2003, 3, 919–923. [Google Scholar] [CrossRef]
Figure 1. A schematic position of metals on a scale of the exchange current density values. Ag * represents silver electrodeposited from the ammonium electrolyte [15].
Metals 11 00859 g001
Figure 2. The polarization curves normalized to the limiting diffusion current density values for electrodeposition of Pb from the nitrate (Pb(NIT)) and the acetate (Pb(AC)) electrolytes and for Ag electrodeposition from the nitrate electrolyte (Ag(NIT)).
Metals 11 00859 g002
Figure 3. Morphologies of Pb powder particles produced by electrodeposition from (a,b) the nitrate electrolyte (0.10 M Pb(NO3)2 + 2.0 M NaNO3) and (c,d) the acetate electrolyte (0.10 M Pb(CH3COO)2 + 1.5 M NaCH3COO + 0.15 M CH3COOH). Overpotential of electrodeposition (η): 90 mV [20].
Metals 11 00859 g003
Figure 4. The XRD (X-ray diffraction) patterns of Pb particles produced at an overpotential (η) of 90 mV from the nitrate and the acetate electrolytes and Pb standard (04-0686). Cps: counts per second.
Metals 11 00859 g004
Figure 5. Morphologies of Ag powder particles produced by electrodeposition from the nitrate electrolyte (0.10 M AgNO3 in 2.0 M NaNO3) at overpotentials of (a,b) η = 90 mV and (c,d) η = 150 mV and at a current density of (e,f) j = 14.4 mA cm−2 ([18] and reprinted from [34] with permission from Elsevier).
Metals 11 00859 g005
Figure 6. The XRD patterns of Ag particles obtained from the nitrate electrolyte at η of 90 and 150 mV and at j of 14.4 mA cm−2 and Ag standard (04-0783) ([18] and reprinted from [34] with permission from Elsevier).
Metals 11 00859 g006
Figure 7. The polarization curves normalized to the limiting diffusion current density values for electrodeposition of Ag from the ammonium (Ag(AM)) electrolyte and for Cu electrodeposition from the sulfate electrolyte.
Metals 11 00859 g007
Figure 8. The 3D pine-like dendrites produced by electrodeposition from the ammonium electrolyte (0.10 M AgNO3 in 0.50 M (NH4)2SO4 with the addition of NH3 in excess to dissolve silver sulfate precipitate) at overpotentials of (a,b) 625 mV and (c,d) 925 mV and at a current density of (e,f) 13.05 mA cm−2 ([18] and reprinted from [34] with permission from Elsevier).
Metals 11 00859 g008
Figure 9. The XRD patterns of Ag particles obtained from the ammonium electrolyte at overpotentials of 625 and 925 mV and at a current density of 13.05 mA cm−2 and Ag standard (04-0783) ([18] and reprinted from [34] with permission from Elsevier).
Metals 11 00859 g009
Figure 10. The powder particles produced by Cu electrodeposition from 0.10 M CuSO4 in 0.50 M H2SO4 at η of (ac) 625 mV and (df) 925 mV and at j of (gi) 14.4 mA cm−2 ([19] and reprinted from [38] with permission from Elsevier).
Metals 11 00859 g010
Figure 11. The XRD patterns of Cu particles obtained from the sulfate electrolyte at overpotentials of 625 and 925 mV and at a current density of 14.4 mA cm−2 and Cu standard (04-0836) ([19] and reprinted from [38] with permission from Elsevier).
Metals 11 00859 g011
Figure 12. (a) Morphology of the spongy-like particle obtained by Ni electrodeposition from 1 M NH4Cl + 0.7 M NH4OH + 0.1 M NiCl2 at j of 1265 mA cm−2, and (b) detail of the particle shown under (a) [20].
Metals 11 00859 g012
Figure 13. The XRD pattern of Ni particles produced from the chloride solution at j of 1265 mA cm−2 and Ni standard (04-0850) [20].
Metals 11 00859 g013
Figure 14. (a) The flower-like aggregate built from very thin needle-like MgO/Mg(OH)2 dendrites obtained by electrolysis of magnesium nitrate melt at a potential of −200 mV; (b) the XRD pattern of the particles shown in (a) (reprinted from [56] with permission from Elsevier).
Metals 11 00859 g014
Table 1. Texture calculations for Pb powders produced potentiostatically at η of 90 mV from the nitrate and the acetate electrolytes (TC: texture coefficient. RTC: relative texture coefficient. NIT: the nitrate electrolyte. AC: the acetate electrolyte. s: Pb standard).
PlaneR (in%)RsTCRTC (in%)
(hkl)RNITRAC(in%)TCNITTCACRTCNITRTCAC
(111)89.783.546.91.911.7875.563.8
(200)3.14.423.50.130.195.26.8
(220)3.65.814.60.250.409.914.3
(311)3.66.315.00.240.429.415.1
Table 2. Texture calculations for Ag powders produced potentiostatically at η of 90 and 150 mV and galvanostatically at j of 14.4 mA cm−2 (90—η = 90 mV; 150—η = 150 mV; 14.4—j = 14.4 mA cm−2; s—Ag standard) ([18] and reprinted from [34] with permission from Elsevier).
Plane (hkl)R (in%)Rs (in%)TCRTC (in%)
R90R150R14.4TC90TC150TC14.4RTC90RTC150RTC14.4
(111)82.270.169.452.41.571.341.3258.143.441.6
(200)7.718.116.320.90.370.870.7813.728.124.6
(220)5.26.37.413.10.400.480.5614.815.617.7
(311)4.95.56.913.60.360.400.5113.412.916.1
Table 3. Texture calculations for Ag powders produced potentiostatically at η of 625 and 925 mV and galvanostatically at j of 13.05 mA cm−2 (625—η = 625 mV; 925—η = 925 mV; 13.05—j = 13.05 mA cm−2; s—Ag standard) ([18] and reprinted from [34] with permission from Elsevier).
Plane (hkl)R (in%)Rs (in%)TCRTC (in%)
R625R925R13.05TC625TC925TC13.05RTC625RTC925RTC13.05
(111)65.959.254.952.41.261.131.0537.030.527.2
(200)15.117.821.920.90.720.851.0521.123.027.2
(220)9.412.211.913.10.720.930.9321.125.124.1
(311)9.610.811.313.60.710.790.8320.821.421.5
Table 4. Texture calculations for Cu powders produced potentiostatically at η of 625 and 925 mV and galvanostatically at j of 14.4 mA cm−2 (625—η = 625 mV; 925—η = 925 mV; 14.4—j = 14.4 mA cm−2; s—Cu standard) ([19] and reprinted from [38] with permission from Elsevier).
Plane (hkl)R (in%)Rs (in%)TCRTC (in%)
R625R925R14.4TC625TC925TC14.4RTC625RTC925RTC14.4
(111)56.954.754.154.61.041.000.9925.724.023.6
(200)21.222.022.525.10.8450.8760.9020.121.021.5
(220)11.612.713.110.91.061.161.2026.227.828.6
(311)10.310.610.39.41.101.131.1027.227.126.3
Table 5. The values of R, TC, and RTC calculated for Ni particles produced by electrodeposition from the chloride solution at j of 1265 mA cm−2 (s—Ni standard) [20].
Plane (hkl)R (in%)Rs (in%)TCRTC (in%)
(111)56.954.61.0426.1
(200)19.623.00.8521.3
(220)12.211.51.0626.5
(311)11.310.91.0426.1
Publisher’s Note: MDPI stays neutral with regard to jurisdictional claims in published maps and institutional affiliations.

