Article

Electrodeposition of Aluminium-Vanadium Alloys from Chloroaluminate Based Molten Salt Containing Vanadium Ions

by
Vesna S. Cvetković
1,*,
Nataša M. Vukićević
1,
Dominic Feldhaus
2,
Ksenija Milicevic-Neumann
2,
Tanja S. Barudžija
3,
Bernd Friedrich
2 and
Jovan N. Jovićević
1
1
Department of Electrochemistry, Institute of Chemistry, Technology and Metallurgy, National Institute, University of Belgrade, Njegoševa 12, 11000 Belgrade, Serbia
2
IME Process Metallurgy and Metal Recycling, Institute of RWTH Aachen University, Intzestrasse 3, 52056 Aachen, Germany
3
Institute for Nuclear Sciences Vinča, University of Belgrade, P.O. Box 522, 11001 Belgrade, Serbia
*
Author to whom correspondence should be addressed.
Metals 2021, 11(1), 123; https://doi.org/10.3390/met11010123
Submission received: 18 December 2020 / Revised: 5 January 2021 / Accepted: 7 January 2021 / Published: 10 January 2021
(This article belongs to the Special Issue Advances in Understanding Metal Electrolysis Processes)

Abstract

:
The Al-V alloys were synthetized by potentiostatic electrodeposition onto a glassy carbon electrode from equimolar AlCl3 + NaCl bath containing vanadium ions at 200 °C. The alloy deposits were characterized by X-ray diffraction, scanning electron microscopy, and energy dispersive spectroscopy. The deposits were identified as Al3V and AlV3 alloys. It was found that intermetallic alloys were synthetized during aluminium underpotential deposition onto vanadium metal that was previously deposited on the glassy carbon electrode by diffusion-controlled overpotential deposition. Alloys were the result of solid-state interdiffusion between the initially deposited vanadium and the subsequently deposited aluminium. As a source to secure a constant concentration of vanadium in the electrolyte during deposition, vanadium anodic dissolution, and VCl3 melt addition were studied. The effect of vanadium ion concentration in the electrolyte on the composition and the surface morphology of the obtained deposits was investigated. The results indicate that controlled vanadium and aluminium codeposition could be a further step to the successful development of an advanced technology for Al3V and AlV3 alloy synthesis.

1. Introduction

Trialuminides (Al3X) are alloys where X represents a transition metal, such as titanium, zirconium, iron, vanadium, niobium. They are found to be very promising materials in many areas of advanced technologies, particularly in aerospace industry [1,2,3,4,5]. Compared to Ni-based alloys that are extensively used in aircraft structures, trialuminides have 20–50% lower density. Combined with high strength and improved thermal stability, trialuminides offer a potential light-weight alternative [3,6]. Within the group of trialuminide intermetallics, vanadium trialuminide (Al3V) exhibits a high melting temperature (1360 °C), low density (3.34–3.68 g·cm−3) and excellent oxidation resistance which is presently of particular interest for high-temperature structural material applications [3,6]. However, Okamoto at al. indicates a segregation temperature of 1249 °C for the Al3V phase [7]. The solid-state diffusion of vanadium into aluminium is very slow and rarely exceeds more than about 1% atomic fraction [8,9]. Even at those levels, its presence in aluminium increases the tensile strength at room as well as elevated temperatures [6]. Al-V alloys are playing an essential role as a source of aluminium and vanadium for α + β-titanium alloys, like Ti–6Al–4V or metastable β-titanium alloys like Ti–15V–3Cr–3Al–3Sn [2,10].
Efforts were made to synthesize the AlV3 intermetallic, interesting because of its potential as a super-conducting material. An AlV3 alloy with hexagonal structure and lattice parameters a = 0.7070 and c = 0.9565 nm was synthetized by annealing the mixture of two powders (Al and V) in the stoichiometric ratio 3:1 at temperature above 1500 °C and high pressure of 30 kbar [11]. Tetragonal AlV3 with a lattice parameters a = 0.6167 and c = 0.9481, was obtained at lower temperature T ≤ 1300 °C and pressure [11]. Others have produced AlV3 by annealing at 100 °C in a quartz tube, but attempts to duplicate the results were unsuccessful [12]. At the end the authors came to the conclusion that annealing in the quartz tubes causes contamination by Si, and that only the bcc AlV3 phase is stable in the binary system [12].
Currently, methods used in the production of Al-V alloys are mechanical alloying process, aluminothermic reduction process, and rapid solidification. In the search for desirable material attributes more attention has been focused on the development of new, innovative, and unconventional manufacturing methods [1,2,6,13,14]. Electrochemical deposition provides a very suitable way for a controlled production of pure metals or alloys. By adjusting electrolysis parameters such as electrolyte composition, temperature of electrolysis, deposition potential, deposition current density, electrodeposition time, and type of working substrate, varying structure types and contents can be achieved.
Various molten salt electrolytes have been tested and proposed for Al-V alloy electrodeposition, including inorganic (halide [10,15,16,17,18] and chloroaluminate [8,9,19]) and organic (ionic liquids [20]) electrolytes. Recently, several studies were reported on the deposition of Al-V alloys from inorganic molten salts, mostly from halide-based electrolytes [10,16]. Meanwhile, electrodeposition of Al-V from chloroaluminates has been rarely investigated [8,9,19]. A number of publication devoted to the electrochemistry of vanadium species in halide melts showed that the valence of vanadium species in halide electrolytes depends greatly on the experimental conditions, such as the electrolyte temperature and the source of the vanadium ions being introduced into the electrolyte [10,15,16,17].
Attempts to electrodeposit Al‒V alloys from chloroaluminate molten salt AlCl3 + NaCl + KCl electrolyte containing different vanadium oxides (K2VO2F3 or V2O5) by controlled current density have been reported by Verdieck and Yntema [19]. The resulting deposit did not contain appreciable amounts of vanadium. Meanwhile, Jovićević et al. presented a study on Al‒V alloy formation as a result of aluminium electrodeposition from equimolar chloroaluminate AlCl3 + NaCl melts onto a vanadium substrate. The authors reported findings of three Al‒V intermetallics, including AlV3 (also referred to as A15 compound), being synthesized by aluminium underpotential deposition (UPD) onto a vanadium cathode [8].
The present study aims to be a next step towards developing a controllable process for the synthesis of prospective materials such as Al3V, AlV3, and other intermetallics. A further objective of the ongoing research is to develop an easier way to form Al‒V alloys by electrochemical codeposition of the constituents present in the electrolyte.

2. Materials and Methods

For all experiments, the basic electrolyte was made of an equimolar mixture of 0.19 mol AlCl3 (>99%, Sigma-Aldrich, St. Louis, MO, USA) and 0.19 mol NaCl (p.a., Sigma-Aldrich, St. Louis, MO, USA). The preparation of this electrolyte was described in detail in previous works [8,21,22].
Two different procedures were used to prepare the vanadium containing molten salt electrolyte: (1) a controlled anodic dissolution of vanadium metal in the equimolar melt, or (2) an addition of VCl3 (>97%, Acros Organics, Geel, Belgium) to the equimolar basic salt mixture prior to melting. All experimental and preparation procedures were performed in a glove box under an argon atmosphere to minimize contamination or moisture absorption. The electrochemical experiments were performed by Potentiostat/Galvanostat Model 263A, (Princeton Applied Research, Oak Ridge, TN, USA) and accompanying software (Princeton Applied Research, Oak Ridge, TN, USA). For the investigation of the vanadium anodic dissolution in the equimolar melt, the electrochemical cell set up was: vanadium (99.99%, Sigma-Aldrich, St. Louis, MO, USA) as a working (WE) and counter electrode (CE), and Al rod (3mm diameter, 99.999%, Alfa Aesar, Haverhill, MA, USA) as a reference electrode. The surface area of the working and counter electrodes that was in contact with the electrolyte was 4 cm2. Determination of a suitable dissolution potential for the metal vanadium was done by recording potentiodynamic polarization curves and cyclic voltammograms (CV) of the vanadium WE in the equimolar melt at 200 °C. Voltammograms with different scan rates were recorded from starting potential, EI, slightly more positive to the vanadium open circuit potential (OCP ≈ 1.130 V measured relative to the aluminium reference electrode) to:
(1)
Anodic end potential, EAF, and back to EI, or
(2)
To different anodic end potential, EAF, then toward different cathodic end potential, ECF, and back to the starting potential, EI.
Controlled dissolution of the V metal in the basic equimolar melt was carried out by applying a constant anodic overpotential at 200 °C selected on the basis of the obtained results.
For the electrochemical experiments involving aluminium and vanadium electrodeposition, a three-electrode cell, consisting of a glassy carbon working electrode, GC (99.99%, HTW SIGRADUR® G, Thierhaupten, Germany), a vanadium counter electrode, and an aluminium reference electrode (RE), was used. The GC working electrode was polished with 0.05 µm alumina powder (Merck) and cleaned by sonication in ethanol and Milli-Q water in several 3 min. intervals. The aluminium electrode RE, was etched in solutions made of 50 vol% HF + 15 vol% H2O and conc. NH4OH + 5 vol% H2O2 and cleaned with deionized water and absolute ethyl alcohol. Vanadium electrodes were etched in the solution made of 1:1 = 65% HNO3:H2O and cleaned with deionized water.
Cyclic voltammograms on the GC working electrode in equimolar AlCl3 + NaCl electrolyte with vanadium ions added by controlled anodic dissolution of V metal or by VCl3 addition, started from potential EI, usually 0.050–0.100 V more negative than the GC open circuit potential (measured against the aluminium reference electrode), to the cathodic potential limit, ECF, and returned to the initial potential, EI, using varied scan rates. CV were performed within the same potential range, with the scan interrupted at a chosen cathodic end potential, ECF. The potential was held there at varying intervals, before starting the return scan.
Potentiostatic deposition of vanadium and aluminium on the GC electrode at 200 °C was performed from the equimolar melts containing vanadium ions from both sources. In the electrolyte with vanadium ions added by anodic dissolution, electrodeposition was done at 0.020 V vs. Al. In the electrolyte with V ions added in the form of VCl3, electrodeposition was done at 0.050 V vs. Al. The deposition process started 5 min after insertion of the working electrode into the electrolyte in order to allow the system to achieve thermal equilibrium.
After potentiostatic deposition, the GC electrode was taken out of the cell, washed thoroughly with a mixture made of absolute ethanol and deionized water (C2H5OH; Zorka-Pharma, Šabac, Serbia) to remove any melt residue and then dried. The morphology and the composition of the deposits were analysed using scanning electron microscope (TESCAN Digital Microscope; model VEGA 3, Brno, Czech Republic), equipped with an energy dispersive spectrometer (EDS Oxford INCA 3.2, High Wycombe, UK). The deposits collected from GC WE were also analysed by X-ray diffraction (XRD) measurements on Philips PW 1050 powder diffractometer (Philips, Delft, The Netherlands) at room temperature with Ni filtered CuKα radiation (λ = 1.54178 Å), scintillation detector within 20–80° 2θ range in steps of 0.05°, and scanning time of 5 s per step. Phases formed during deposition were identified by a comparison of the standard reference X-ray powder diffraction patterns for phase identification, Joint Committee on Powder Diffraction Standards (JCPDS) database.

3. Results and Discussion

3.1. Vanadium Dissolution and Deposition in Equimolar AlCl3 + NaCl Melt

To analyse the anodic and cathodic processes taking part on the vanadium electrode in equimolar AlCl3 + NaCl melt, potentiodynamic polarization curve and cyclic voltammetry measurements were performed, Figure 1 and Figure 2.
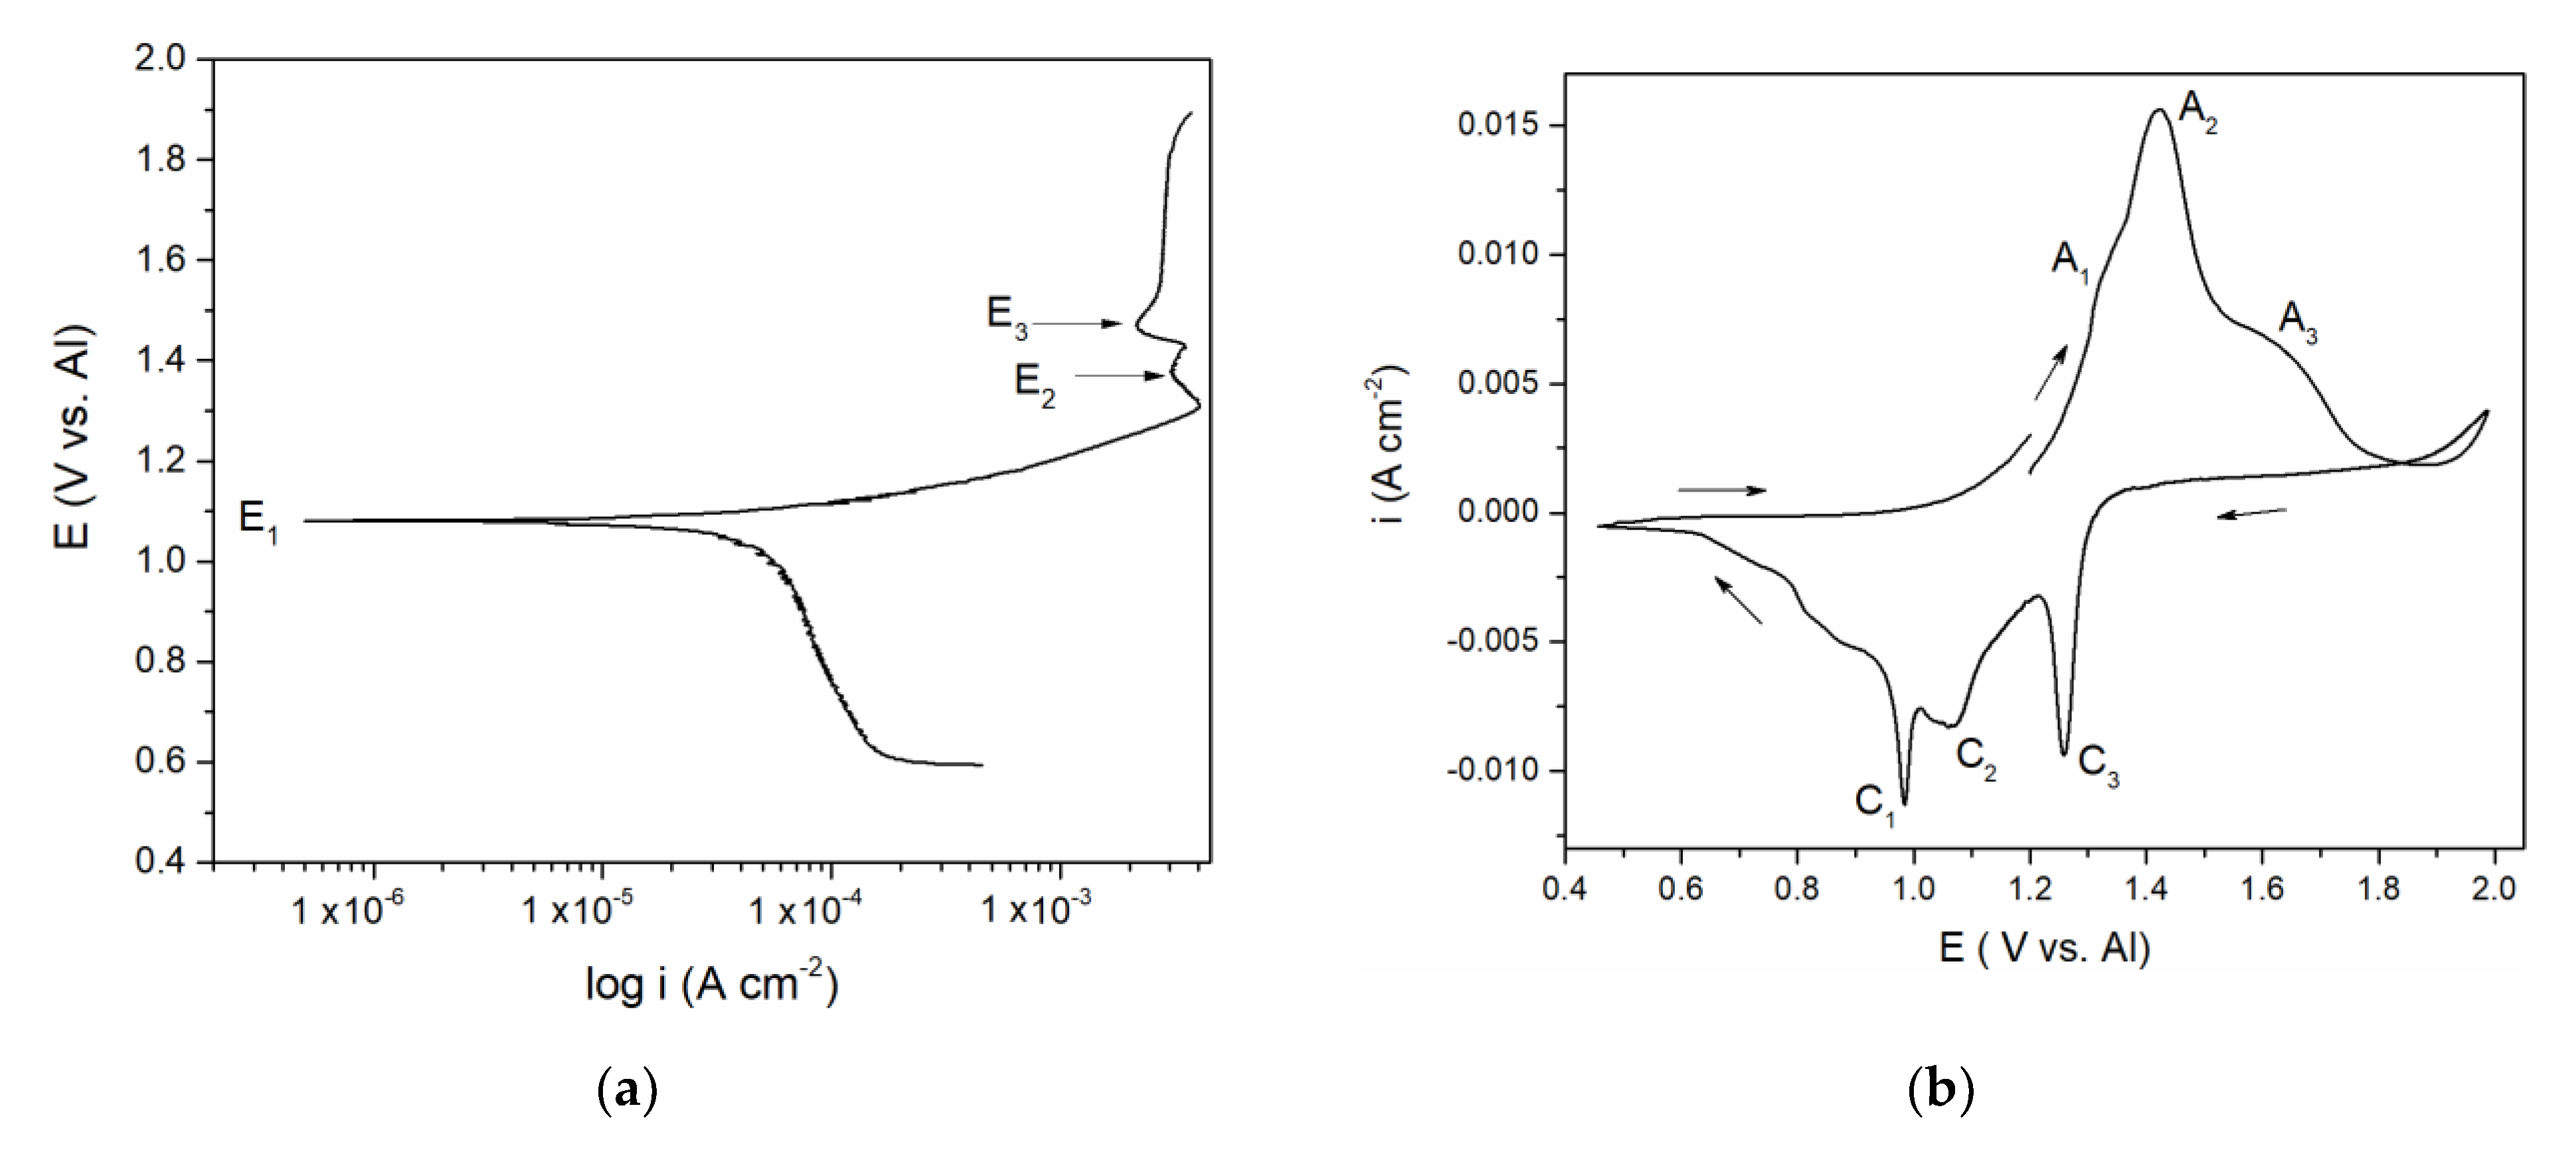
Polarization curve in Figure 1a suggests a well-defined potential E1 at 1.100 V vs. Al and less pronounced potentials E2 at ≈ 1.350 and E3 at ≈ 1.480 V vs. Al which correspond rather well with the “calculated equilibrium potentials” defined as a midpoint values between anodic and cathodic peak pairs (A1 + C1)/2 = 1.150 V, (A2 + C2)/2 = 1.350 V and (A3 + C3)/2 = 1.500 V vs. Al from Figure 1b. The recorded calculated and peak potentials were more than one volt anodic to the equilibrium potential of aluminium in the electrolyte used and therefore had to be attributed to the reversible reactions of the remaining constituents of the electrolyte. Chlorine evolution was found to start at potentials more positive than 2.000 V vs. Al and it is known that sodium equilibrium potential in chloride melts is substantially more negative than that of aluminium [15,16]. The recorded equilibrium and peak potentials, therefore, had to be attributed to vanadium species in metallic and ionized forms.
Vanadium ions were added to the equimolar electrolyte by dissolution of the vanadium working electrode. There are several studies on the vanadium ions being present in the chloride melts (NaCl + KCl at 690 to 860 °C) [15,16]. The equilibrium potentials of the reactions: V(II) ↔ V(0), V(III) ↔ V(II), Cl + 2e ↔ Cl2, were established [15,16]. In our study, the results suggested that in the presence of aluminium ions in equimolar chloroaluminate electrolyte (0.19 mol AlCl3 + 0.19 mol NaCl at 200 to 300 °C) vanadium behaved very similarly. This helped us to attribute the recorded potentials E1 ≈ 1.100 V, E2 ≈ 1.350 V and E3 ≈ 1.480 V vs. Al in Figure 1a to V(II) ↔ V(0), V(III) ↔ V(II), and V(IV) ↔ V(III) reactions, respectively. It was then possible to identify the processes reflected by the current waves in Figure 1b: current wave A1, should be related to the process of vanadium dissolution V(0) → V(II); A2 at more anodic potentials presents further oxidation reaction V(II) → V(III); current wave A3, at even more positive potentials, reflects the oxidation process of V(III) → V(IV), Figure 1b. In the reverse scan, C3 and C2 are reflecting the reduction processes of vanadium ions V(IV) → V(III), and V(III) → V(II), respectively. Current peak C1 reflects the reduction of V(II) ions to the metal vanadium and the deposition onto the vanadium working electrode.
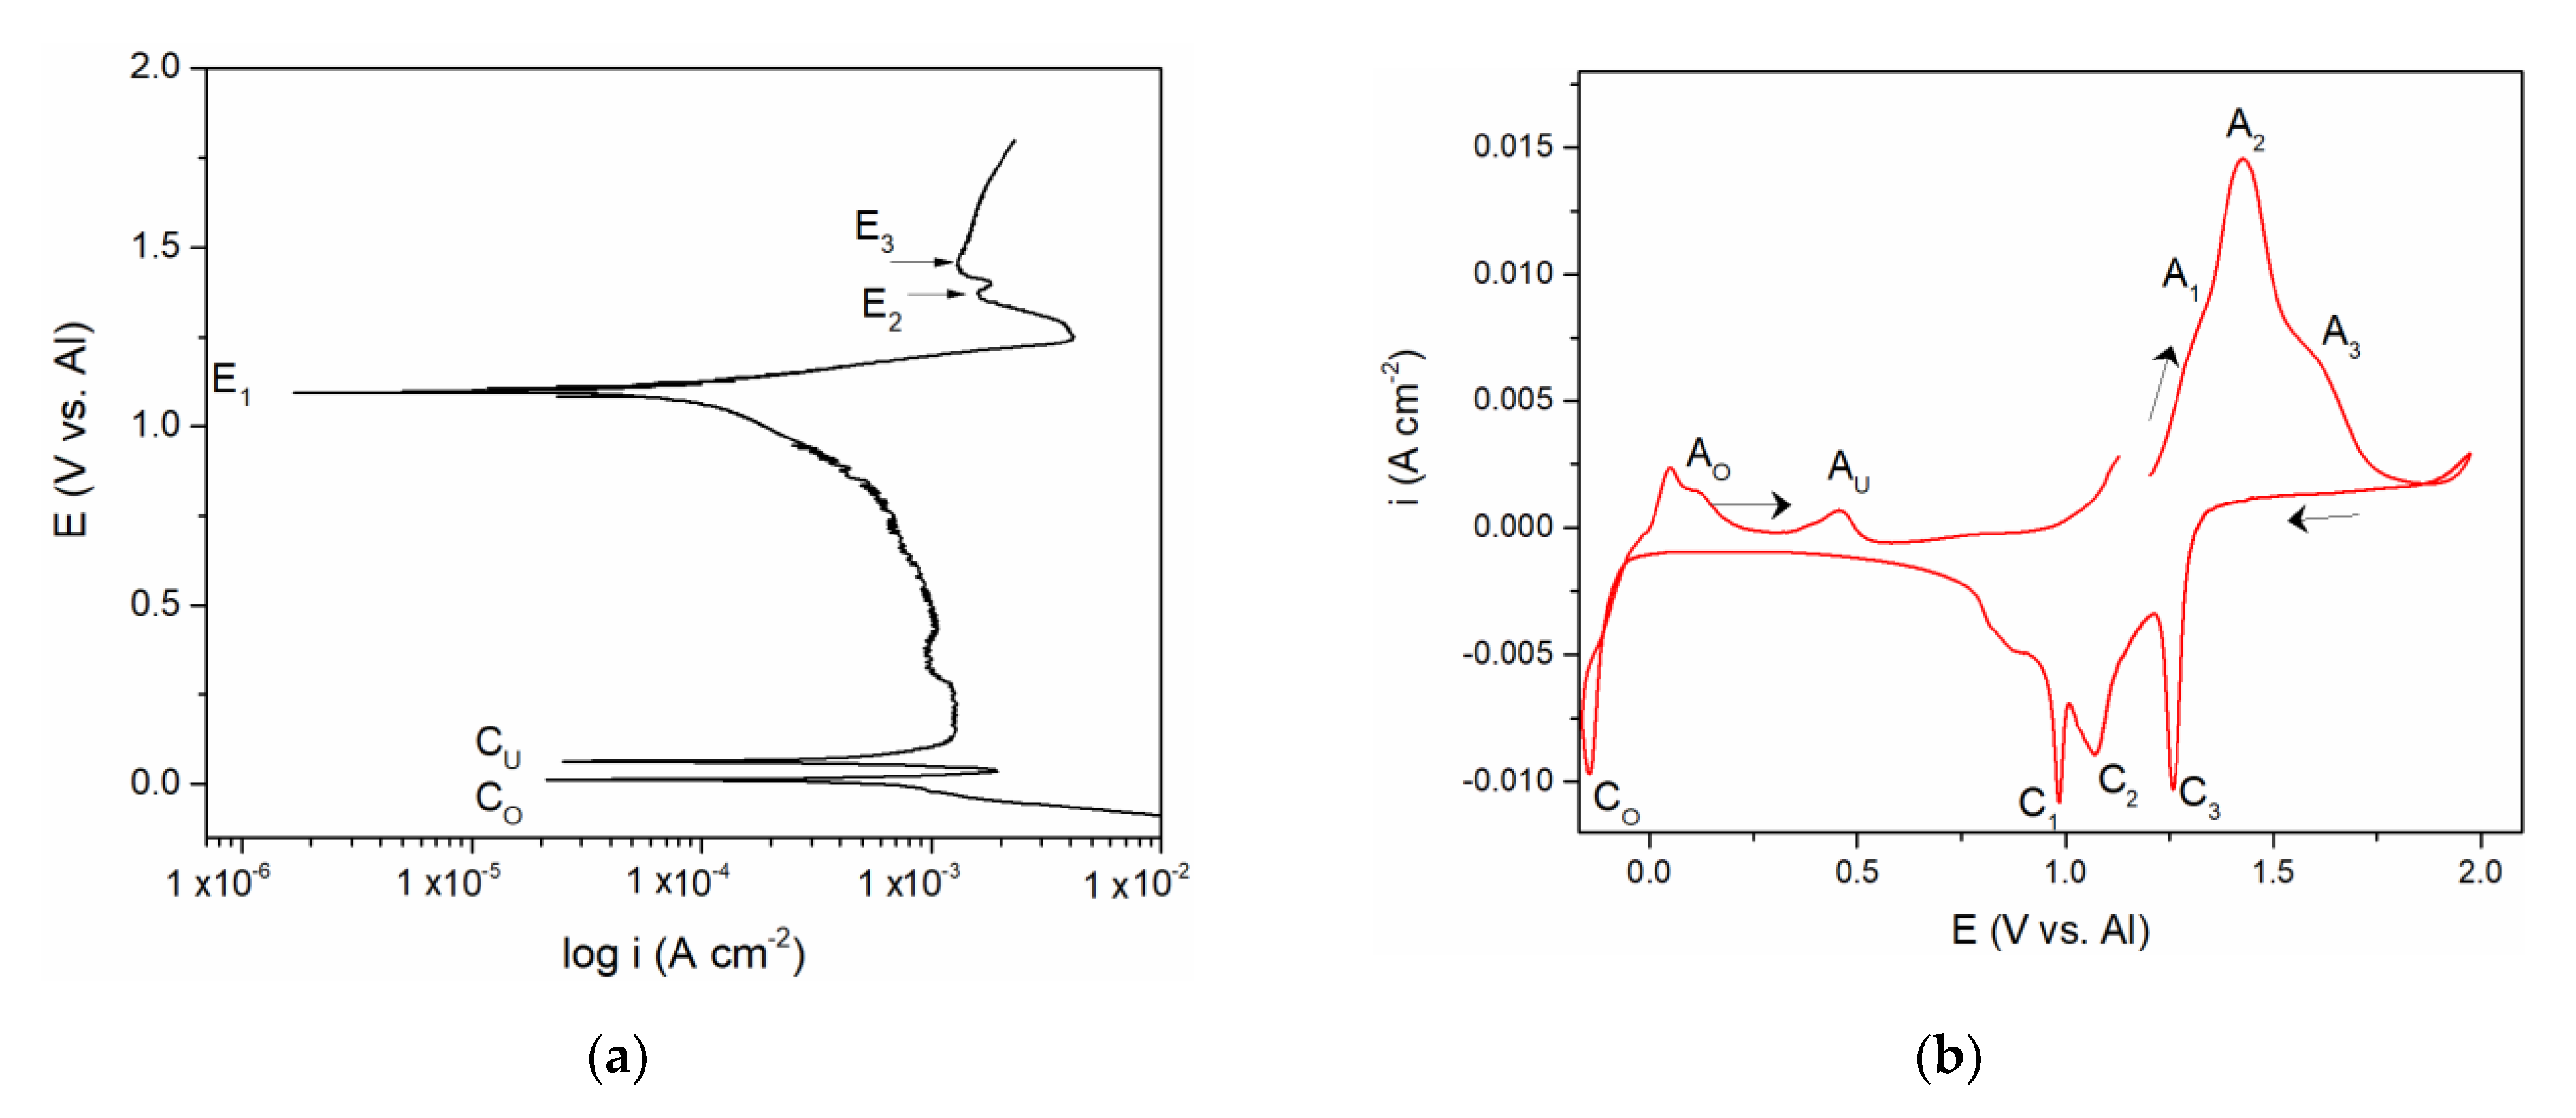
The polarization curve and cyclic voltammograms recorded on the vanadium working electrode which included aluminium deposition and dissolution in addition to the vanadium dissolution and deposition are presented in Figure 2a,b. Polarization curve, Figure 2a, starting from the potentials negative to aluminium equilibrium potential in the electrolyte used revealed two well-defined potentials, CO at ≈ 0.000 V and CU at ≈ 0.080 V vs. Al, and a poorly defined one at CUP ≈ 0.350 V vs. Al, followed by the potentials E1, E2, and E3. It was observed that the values of the three most positive potentials (E1, E2, and E3) are identical to those three recorded by polarization curve in Figure 1a and could be attributed to the same reactions of vanadium dissolution/deposition and vanadium ion oxidation/reduction.
CV measurements presented in Figure 2b, were done as follows:
-
Starting potential was 1.200 V vs. Al, the potential more positive to the vanadium equilibrium potential in the equimolar AlCl3 + NaCl electrolyte;
-
Potential was then changed to 2.000 V vs. Al, which is close enough to the chlorine evolution potential;
-
At 2.000 V vs. Al, the potential was then directed toward cathodic end value (ECF = –0.150 V vs. Al) which was cathodic to the Al equilibrium potential in the used electrolyte;
-
Potential was then returned to the starting value (1.200 V vs. Al).
Tracing the path of the system response recorded on the voltammogram, we first see three anodic current peaks (A1, A2, and A3) and their three cathodic counterparts (C1, C2, and C3) in the region which is defined between 0.600 and 2.000 V vs. Al in the graph. The values of the peak potentials were very similar to those presented in Figure 1b and attributed to the same processes of vanadium dissolution/deposition and oxidation/reduction of the vanadium ions.
The values of the peak potentials related to the current waves (A1, A2, A3, and C1, C2, C3) and their peaks, Figure 2b, were in very good accordance with the values of the three most anodic calculated equilibrium potentials presented by the potentiodynamic polarization curve of the vanadium working electrode, Figure 2a. These data were also in agreement with the conclusions obtained by Polovov at al. describing vanadium dissolution in sodium-potassium chloride melts, at temperatures above 680 °C [16].
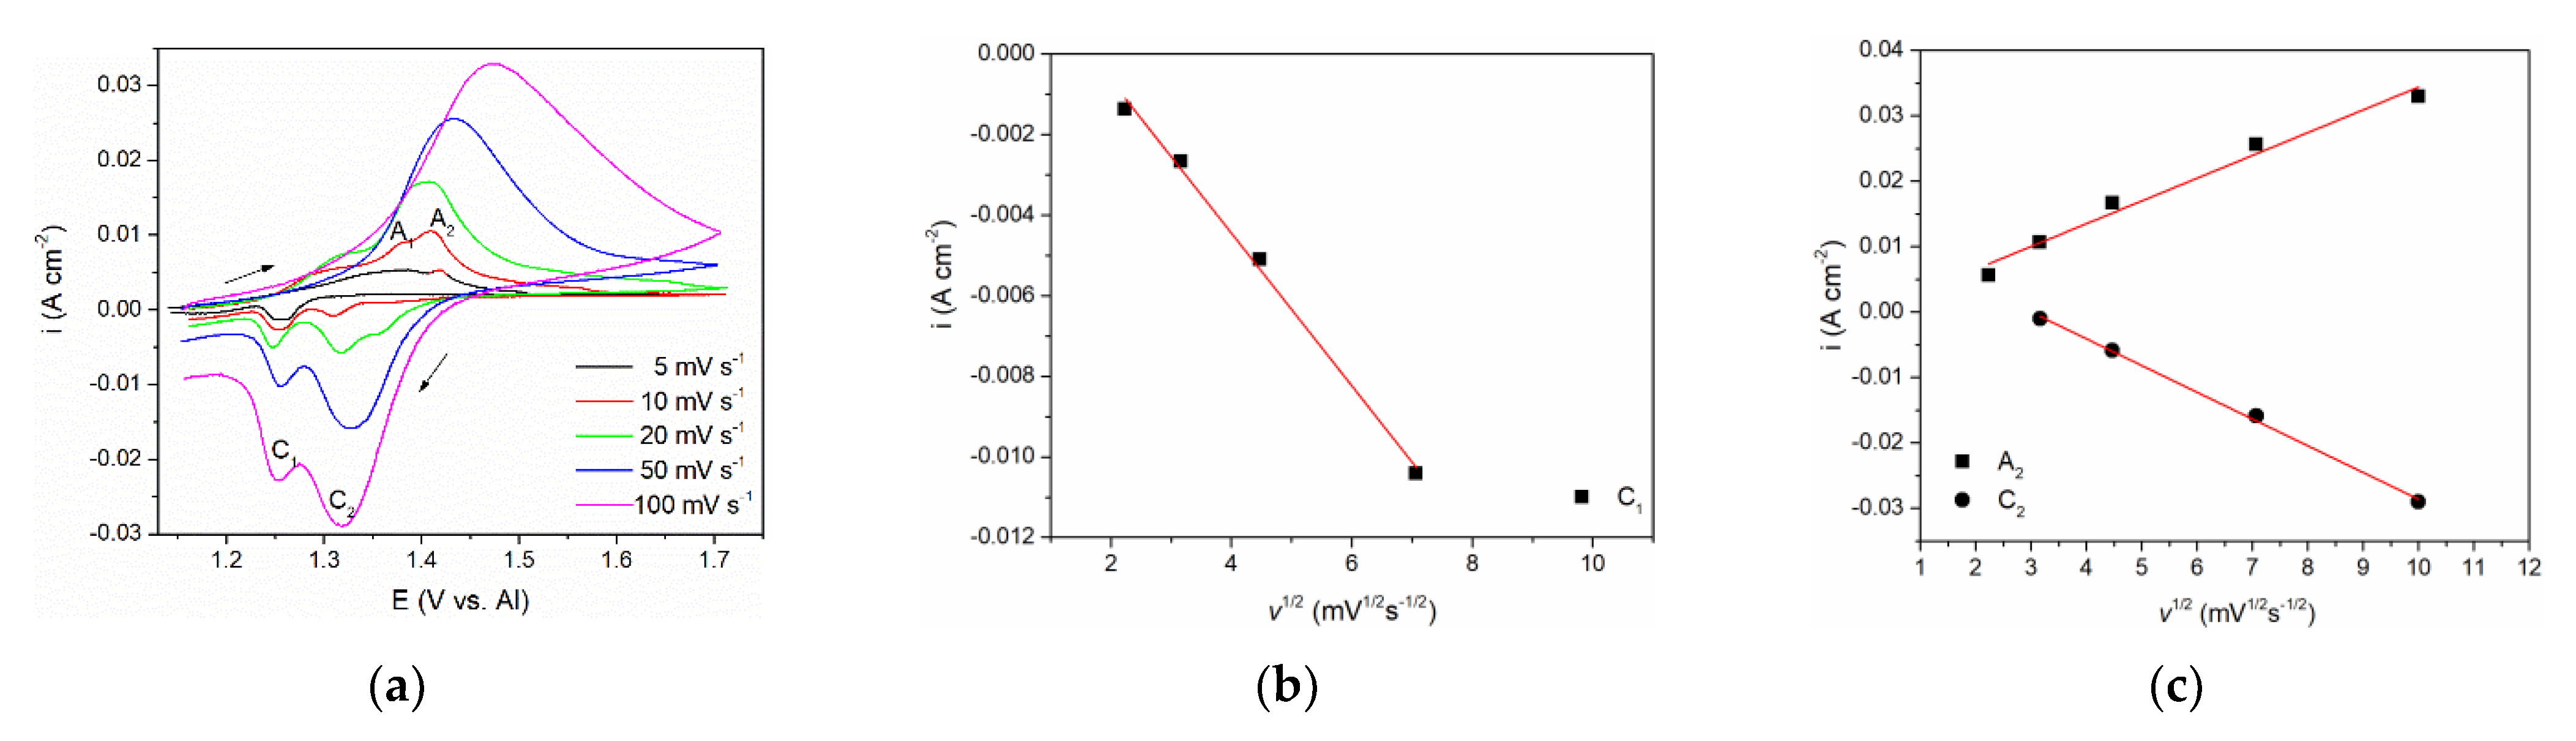
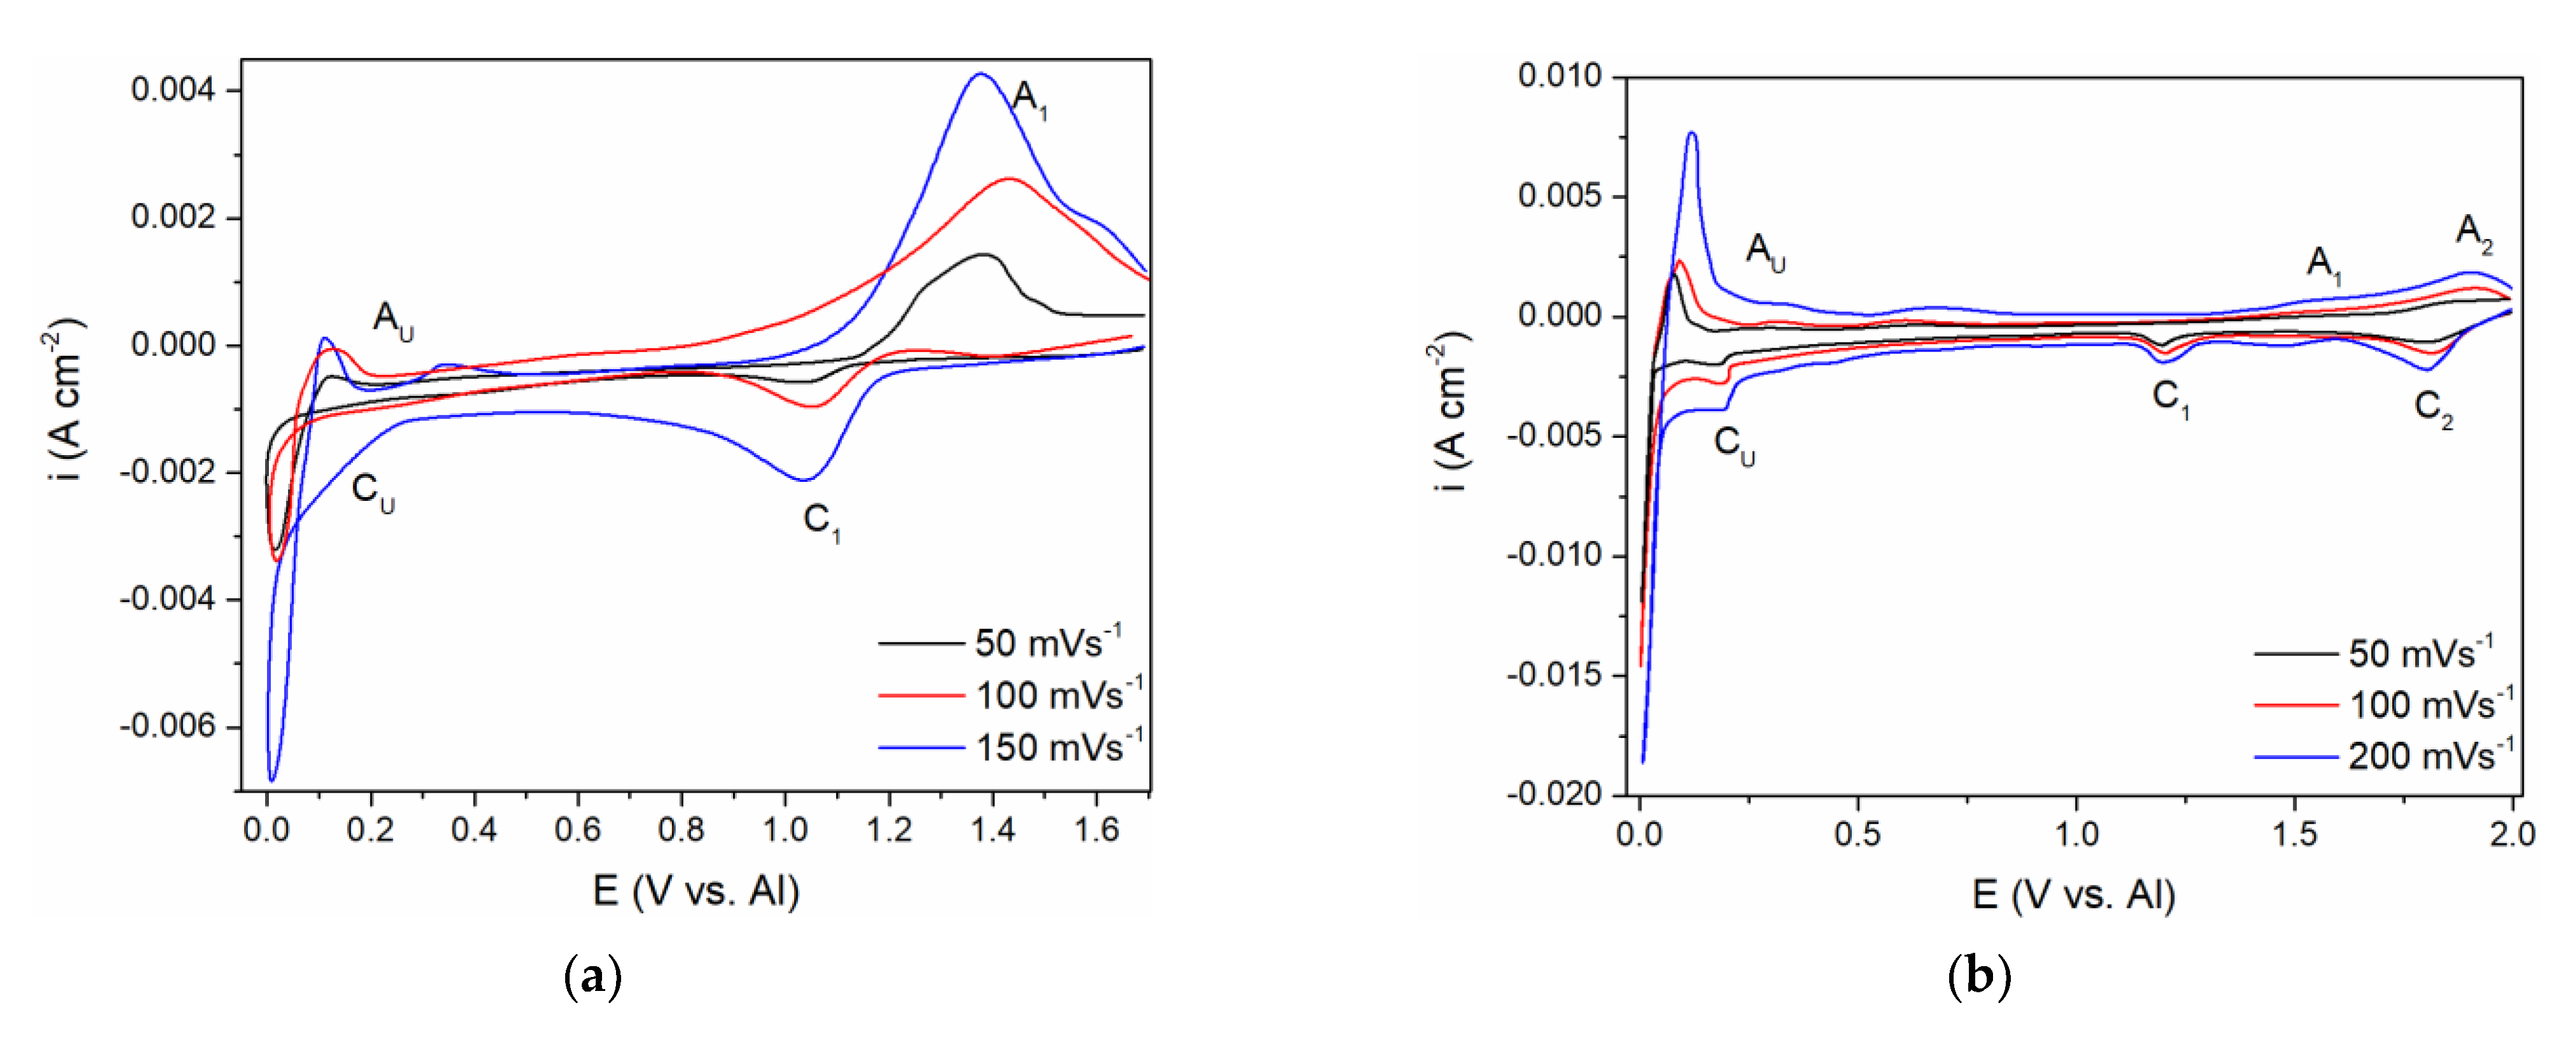
To investigate further the processes of vanadium dissolution/deposition and vanadium ion oxidation/reduction that are represented by A1/C1 and A2/C2 current waves in Figure 1 and Figure 2, a series of CVs spanning their potential range with scan rates from 5 mVs−1 to 100 mVs−1 were performed, see Figure 3a. The relationships between the peak maximum current densities and the square root of the scan rate applied are presented in Figure 3b,c.
The CVs representing lower scan rates (5 and 10 mVs−1) showed two distinct peak potentials A1 and A2 in the anodic section of the voltammograms. Peak A1 was attributed to the dissolution process of vanadium metal: V(0) → V(II), and peak A2 reflects further oxidation of divalent vanadium (II) i.e., V(II) → V(III). With increased scan rate, only one broader peak was observed, occupying the potential range of both A1 and A2. This behavior is typically a result of the next process (current wave A2) starting at an increasing rate while the previous process (current wave A1) rate is fading away [16]. Thus, the obtained one united current wave represents the sum of rates of both processes taking part in a partly shared potential span. Therefore, a proper analysis ipeak = f(v1/2) for A1 could not be made. However, analysis of its cathodic counterpart, the deposition current wave C1, was possible and showed that the peak current vs. square root of the scan rate is linear and does not pass through the origin. This implies that the V(II) ion reduction process V(II) → V(0) is under mixed control: by the diffusion rate of the complexed vanadium ions from the bulk of the molten equimolar AlCl3 + NaCl electrolyte toward the WE and by the rate of the charge transfer step [23]. Some other authors also came to the conclusion that both anodic dissolution of vanadium and vanadium deposition in sodium-potassium chloride melts are under the same mixed control [15,16,24].
With the scan rate increased, maximum current densities for both oxidation (A2) and reduction peaks (C2), were higher, but their peak potentials barely changed implying the reversibility of the redox process V(III) ↔ V(II). Analysis of the relationship ipeak = f(v1/2) for both A2 and C2 presented in Figure 3c revealed linear relationships suggesting that oxidation of V(II) ions into V(III) ions and the reverse reduction V(III) → V(II) processes are under mixed mass transport and charge transfer control, as suggested earlier in the literature in somewhat different electrolytes [15,16,24].
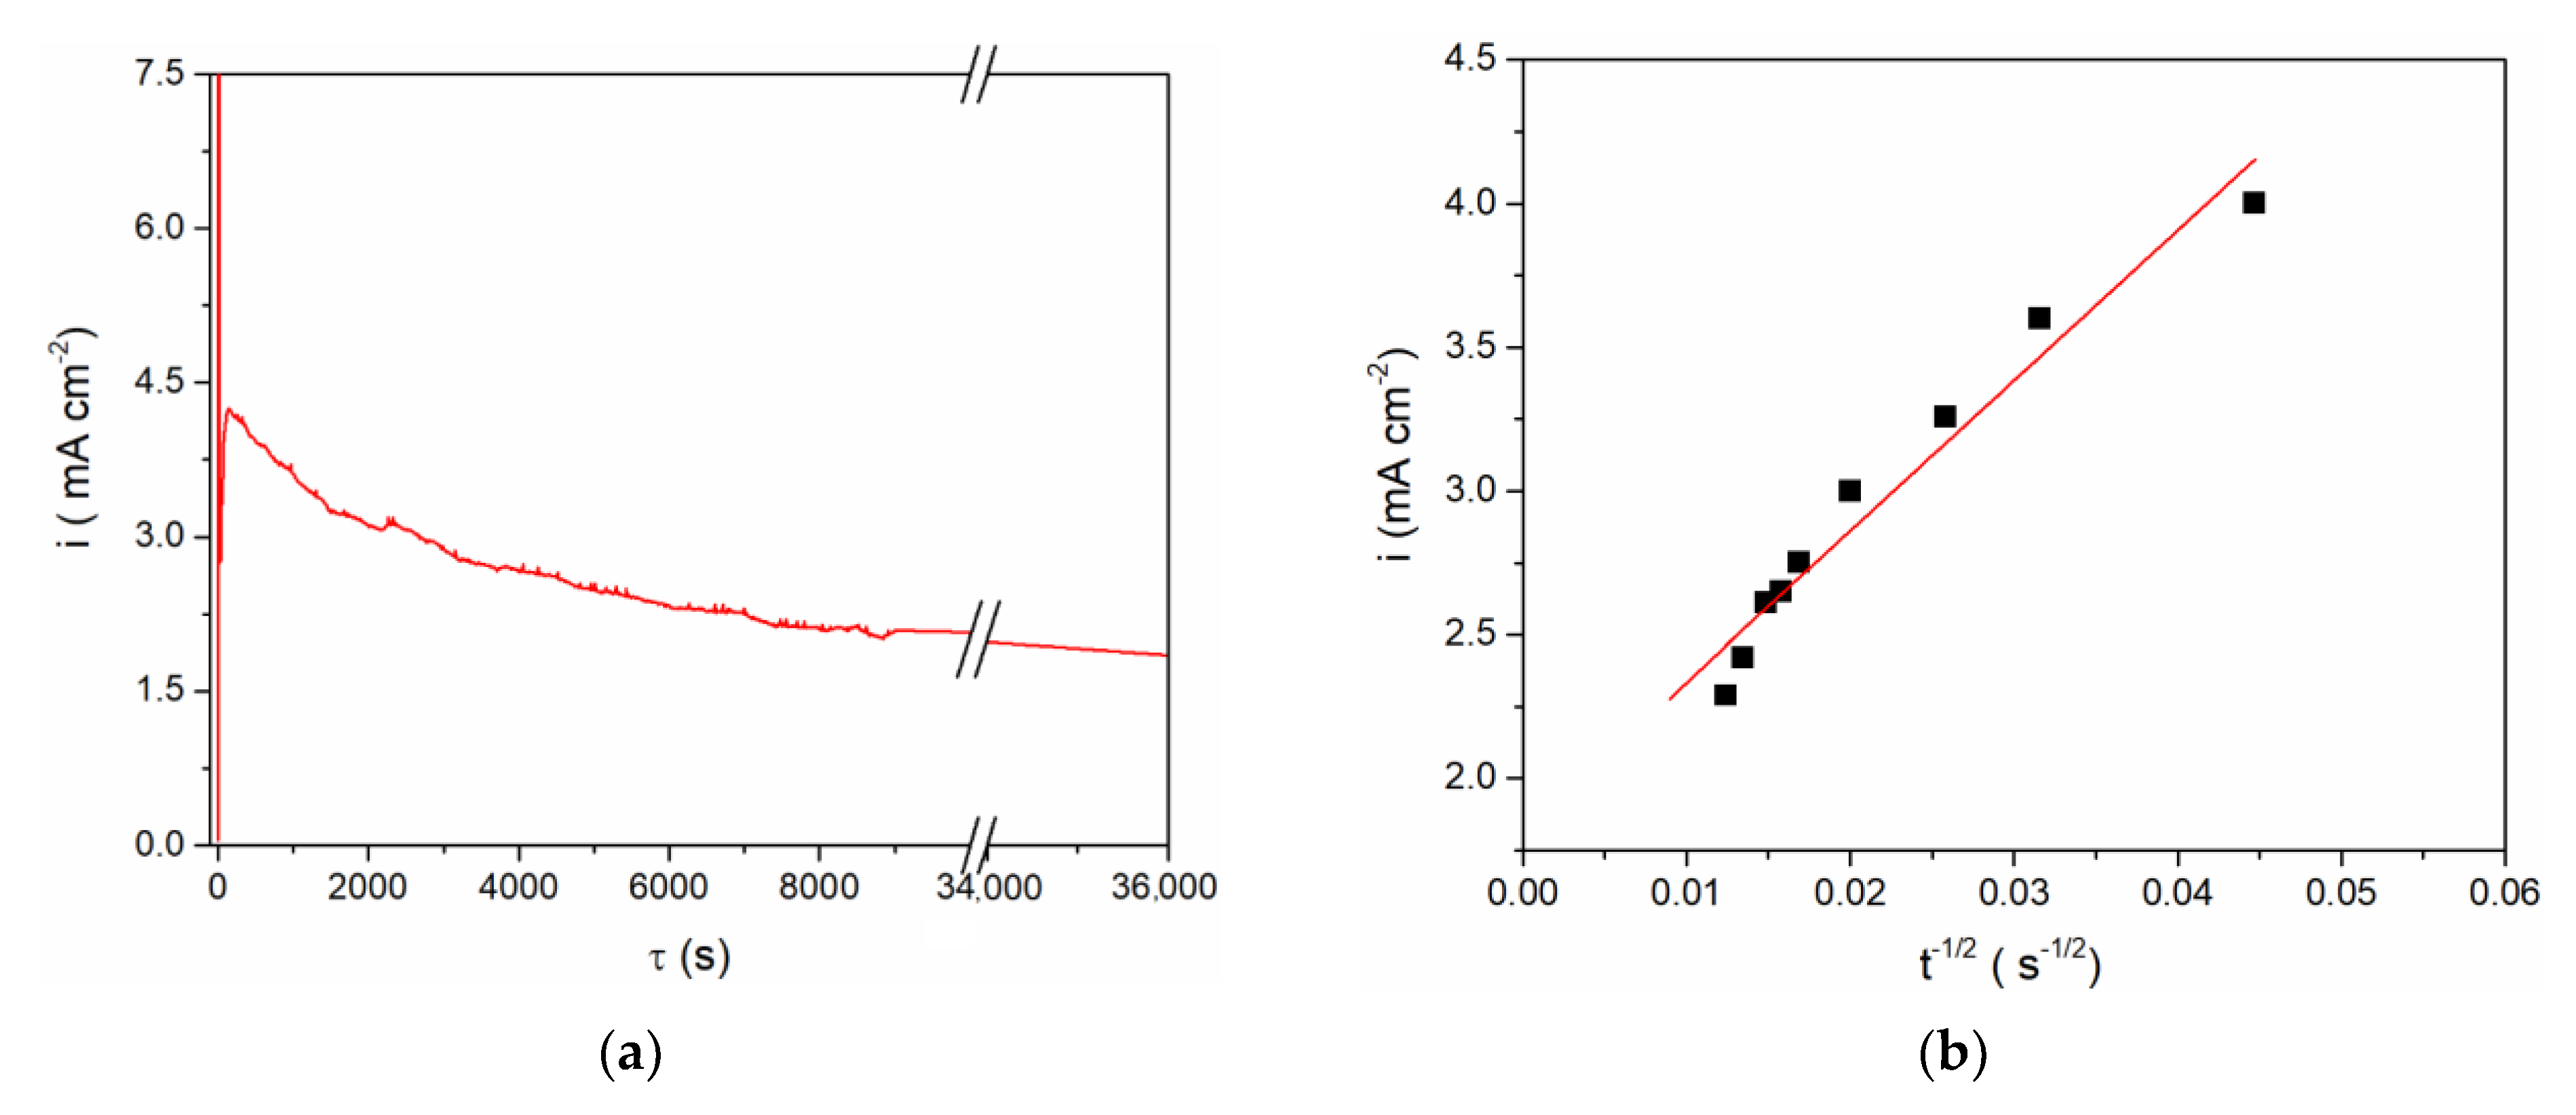
These findings were used in defining the regime for vanadium metal dissolution as a supply of vanadium ions to the equimolar AlCl3 + NaCl molten salt electrolyte. Taking into account the results obtained by CV on the vanadium WE in the equimolar electrolyte system (Figure 1, Figure 2 and Figure 3), controlled anodic dissolution of vanadium was done by applying a constant potential of 1.300 V vs. Al at 200 °C. The chosen potential was anodic to the vanadium OCP, Figure 4, and anodic enough to sustain vanadium metal dissolution. However, analysis of the current density-time diagram in Figure 4a expressed as the i = f(t−1/2) relationship appeared to be approximately linear, Figure 4b, thus identifying the dissolution as predominantly mass transfer controlled [23].
The final concentration of vanadium ions in the electrolyte obtained by anodic vanadium dissolution was determined in two ways: (1) from Faraday’s Law, using the number of exchanged electrons as n = 2 with respect to the oxidation process, V(0) → V(II), for example Figure 4a; and (2) from the vanadium working electrode mass lost during controlled potentiostatic dissolution. The results obtained by these two methods agreed well and showed that after controlled electro-dissolution the vanadium (II) ions concentration in the equimolar AlCl3 + NaCl electrolyte was ≈ 5 millimolar.

3.2. Vanadium and Aluminium Deposition from Equimolar AlCl3 + NaCl Melt Containing V Ions Introduced Either by Anodic Dissolution of V Metal or by Adding VCl3

A comparative study of the CV measurements was conducted with the GC working electrode in (a) the equimolar melt, which was 5 millimolar with respect to the vanadium ions introduced by vanadium anode dissolution, and (b) the equimolar melt, which was made to be 12.5 millimolar with respect to the vanadium ions by added VCl3. The WE potential was scanned from EI values positive to the vanadium equilibrium potential to ECF close to the aluminium equilibrium potential and back, enabling the recording of the ongoing electrochemical reactions related to the vanadium and aluminium in the chosen electrolytes, Figure 5a,b.
From the voltammogram obtained in the equimolar melt containing anodically dissolved V ions, the cathodic peak (C1) at around 1.000 V vs. Al in the scanned potential region is reflecting V(II) → V(0) ions reduction into vanadium metal, Figure 5a, and the equilibrium potential of V(II) ↔ V(0) was noted at ≈1.100 V vs. Al. The structure of the anodic and cathodic peaks appearing in the potential range from 1.000 V to 2.000 V vs. Al in both systems on GC presented in Figure 5a,b is not as detailed as on the V electrode (see Figure 1b, Figure 2b and Figure 3a). Recent studies in chloride melts indicated that anodic dissolution of vanadium metal produces V(II) species, and the presence of vanadium metal in the electrolyte system suppresses the disproportion of V(II) [16,25]. According to the results obtained in our study, (Figure 5), it seems that vanadium ions added to the equimolar AlCl3 + NaCl melt by controlled electrochemical dissolution behave in the same manner.
Current from the wave of vanadium deposition C1 in Figure 5a,b, towards more negative potentials, diminishes but remains at the value which can be recognized as equal or close to the diffusion controlled, vanadium deposition limiting current.
At potentials from 0.200 to 0.300 V positive to the aluminium equilibrium potential, reduction current rises again into a visible wave CU. Its value cannot possibly reflect just the vanadium diffusion limited deposition current any more but might reflect a sum of the underpotential deposition (UPD) of aluminium onto vanadium previously deposited on the original working electrode and the vanadium diffusion limited deposition current [8,9].
The voltammograms recorded in the equimolar melt with VCl3 added, under all other conditions kept the same, presented a different number of reduction current peaks in the potential range from 2.000 to 1.000 V vs. Al, Figure 5b. Two distinct cathodic peak potentials were recognized:
  • Peak C1 at ≈ 1.800 V vs. Al, which should reflect the reduction process of V(III) + e → V(II)
  • Peak C2 at ≈ 1.180 V vs. Al, which should depict the deposition process of V(II) + 2e → V(0).
The presence of the two reduction waves (C1 and C2) within the potential range from 2.000 to 1.000 V vs. Al is in accordance with the previous findings that VCl3 dissolved in chloride melts yields V(III) ions [15].
The appearance of the reduction current wave CU at around 0.200–0.300 V vs. Al as a follow-up to the vanadium diffusion-controlled deposition current in Figure 5b, indicates aluminium underpotential deposition (UPD) onto metal vanadium covering the surface of the original WE. This was recognized in our previous works, and recorded as CUP in Figure 2a [8,9]. Further increase in the current density, within the CU current wave should be the result of summing up of the vanadium mass controlled deposition current and aluminium underpotential deposition current growing with increased negativity of the WE potential, Figure 5a,b. It should be noted that the diffusion-controlled vanadium deposition current in the potential range between ≈ 1.100 V to ≈ 0.250 V vs. Al, in the electrolyte made with VCl3 (Figure 5b), is 2–3 times higher than in the electrolyte with anodic dissolution obtained vanadium ions (Figure 5a). It is to be expected because the V(II) concentration in the first electrolyte was 2.5 to 3 times higher than in the latter.
The current waves, A1 in Figure 5a; A1 and A2 in Figure 5b; A1, A2, A3 in Figure 2b, are oxidation counterparts to the cathodic reactions C1, C2, and C3. In all three electrolytes used, A1, as a response to C1, reflects vanadium dissolution while A2 and A3 reflect the oxidation part of the redox reaction between V(II), V(III), and V(IV) ions.
The second group of anodic current waves, a number of current waves marked as AU in Figure 5a,b and AO and AU in Figure 2b, are responses to the cathodic current waves, CU in Figure 5a,b and CO in Figure 2b, and can be ascribed to the partial stripping of the electrodeposited Al and Al-V alloys, having naturally different dissolution potentials. This is more apparent in the case of the voltammogram in Figure 2b, where the peaks AO probably reflect the dissolution of overpotentially deposited aluminium and some of the Al-V alloys formed concurrently and AU, which should reflect the dissolution of the Al-V alloy made during Al UPD onto vanadium working electrode, Figure 2b, and on the vanadium previously deposited onto GC working electrode, Figure 5a,b. The potentials of those peaks (AO and AU) are close to the equilibrium potentials (recorded by potentiodynamic polarization curve in Figure 2a marked as CO at 0.000 V and 0.080 V and CU ≈ 0.350 V vs. Al, respectively.
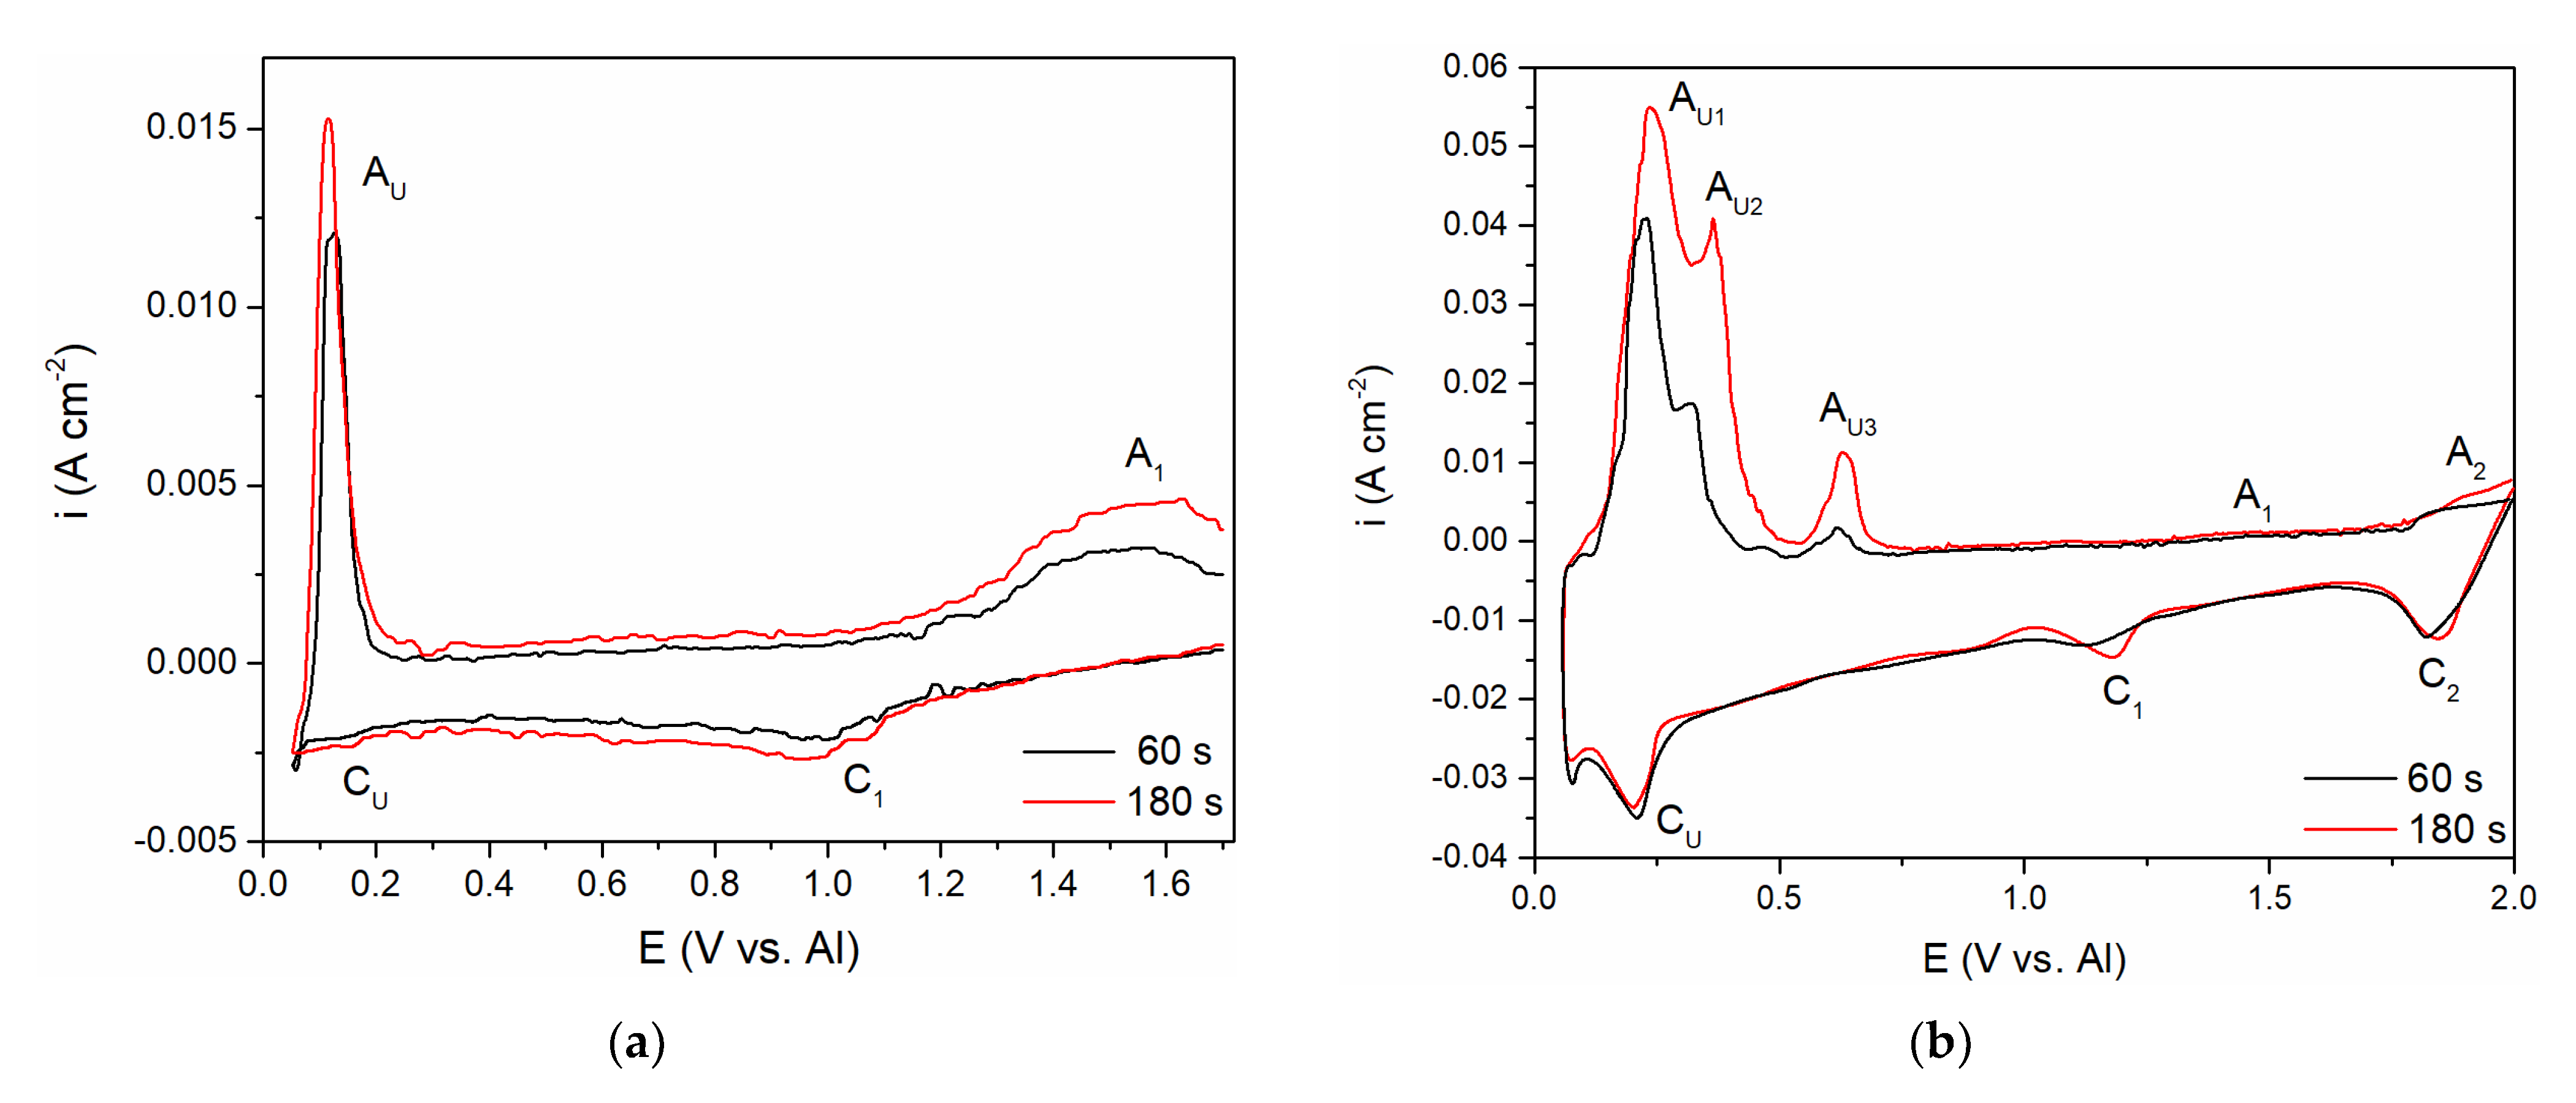
To follow up on the aluminium and vanadium deposition/dissolution processes noticed with CV on GC electrode in the equimolar AlCl3 + NaCl melt containing V ions added to the electrolyte either by vanadium anodic dissolution or by VCl3 addition, the voltammetry applying different holding times at chosen cathodic end potentials, ECF, before returning to the starting potential was recorded, Figure 6a,b. In both cases, the cathodic end potential was held at 0.050 V vs. Al. In these sets of experiments, where the cathodic end potential ECF was not negative to the aluminium equilibrium potential, the anodic current waves reflecting the dissolution processes appeared at the potentials very similar to the values recorded on CVs presented in Figure 2b and Figure 5. However, under the same experimental conditions, the cathodic and anodic peaks of the voltammograms recorded in the equimolar melt with VCl3 added, were more clearly defined (AU1, AU2, and AU3), and maxima of the anodic and cathodic peak currents were higher. Generally, the increased deposition time generated an increase in the maximum peak current and charge encompassed by the anodic current peaks. This suggests that with prolonged deposition time under the constant potential applied, quantity of vanadium and aluminium electrodeposited increases, and that Al-V intermetallics are formed between vanadium and underpotentially deposited aluminium. Actually, aluminium is deposited by underpotential deposition on the vanadium that was previously deposited in the quantity which dominates the GC surface [8].
Aluminium underpotential deposition with previously deposited vanadium enters into solid-state interdiffusion processes and first quantities of Al-V intermetallics are synthetized. Prolonged vanadium deposition and aluminium underpotential deposition provide additional material for more alloy formation. Obviously, there was not only one intermetallic synthetized, because there were several anodic dissolution peaks (AU1, AU2, AU3) reflecting different intermetallics having different dissolution potentials [8,9].

3.3. Characterization of Electrodeposited Al‒V Intermetallic

Surface morphologies of the Al-V alloys produced by potentiostatic aluminium underpotential and vanadium codeposition from equimolar AlCl3 + NaCl melt containing anodically dissolved vanadium at 0.020 V vs. Al, and from the equimolar AlCl3 + NaCl melt with vanadium added as VCl3 at 0.050 V vs. Al, are presented Figure 7 and Figure 8, respectively.
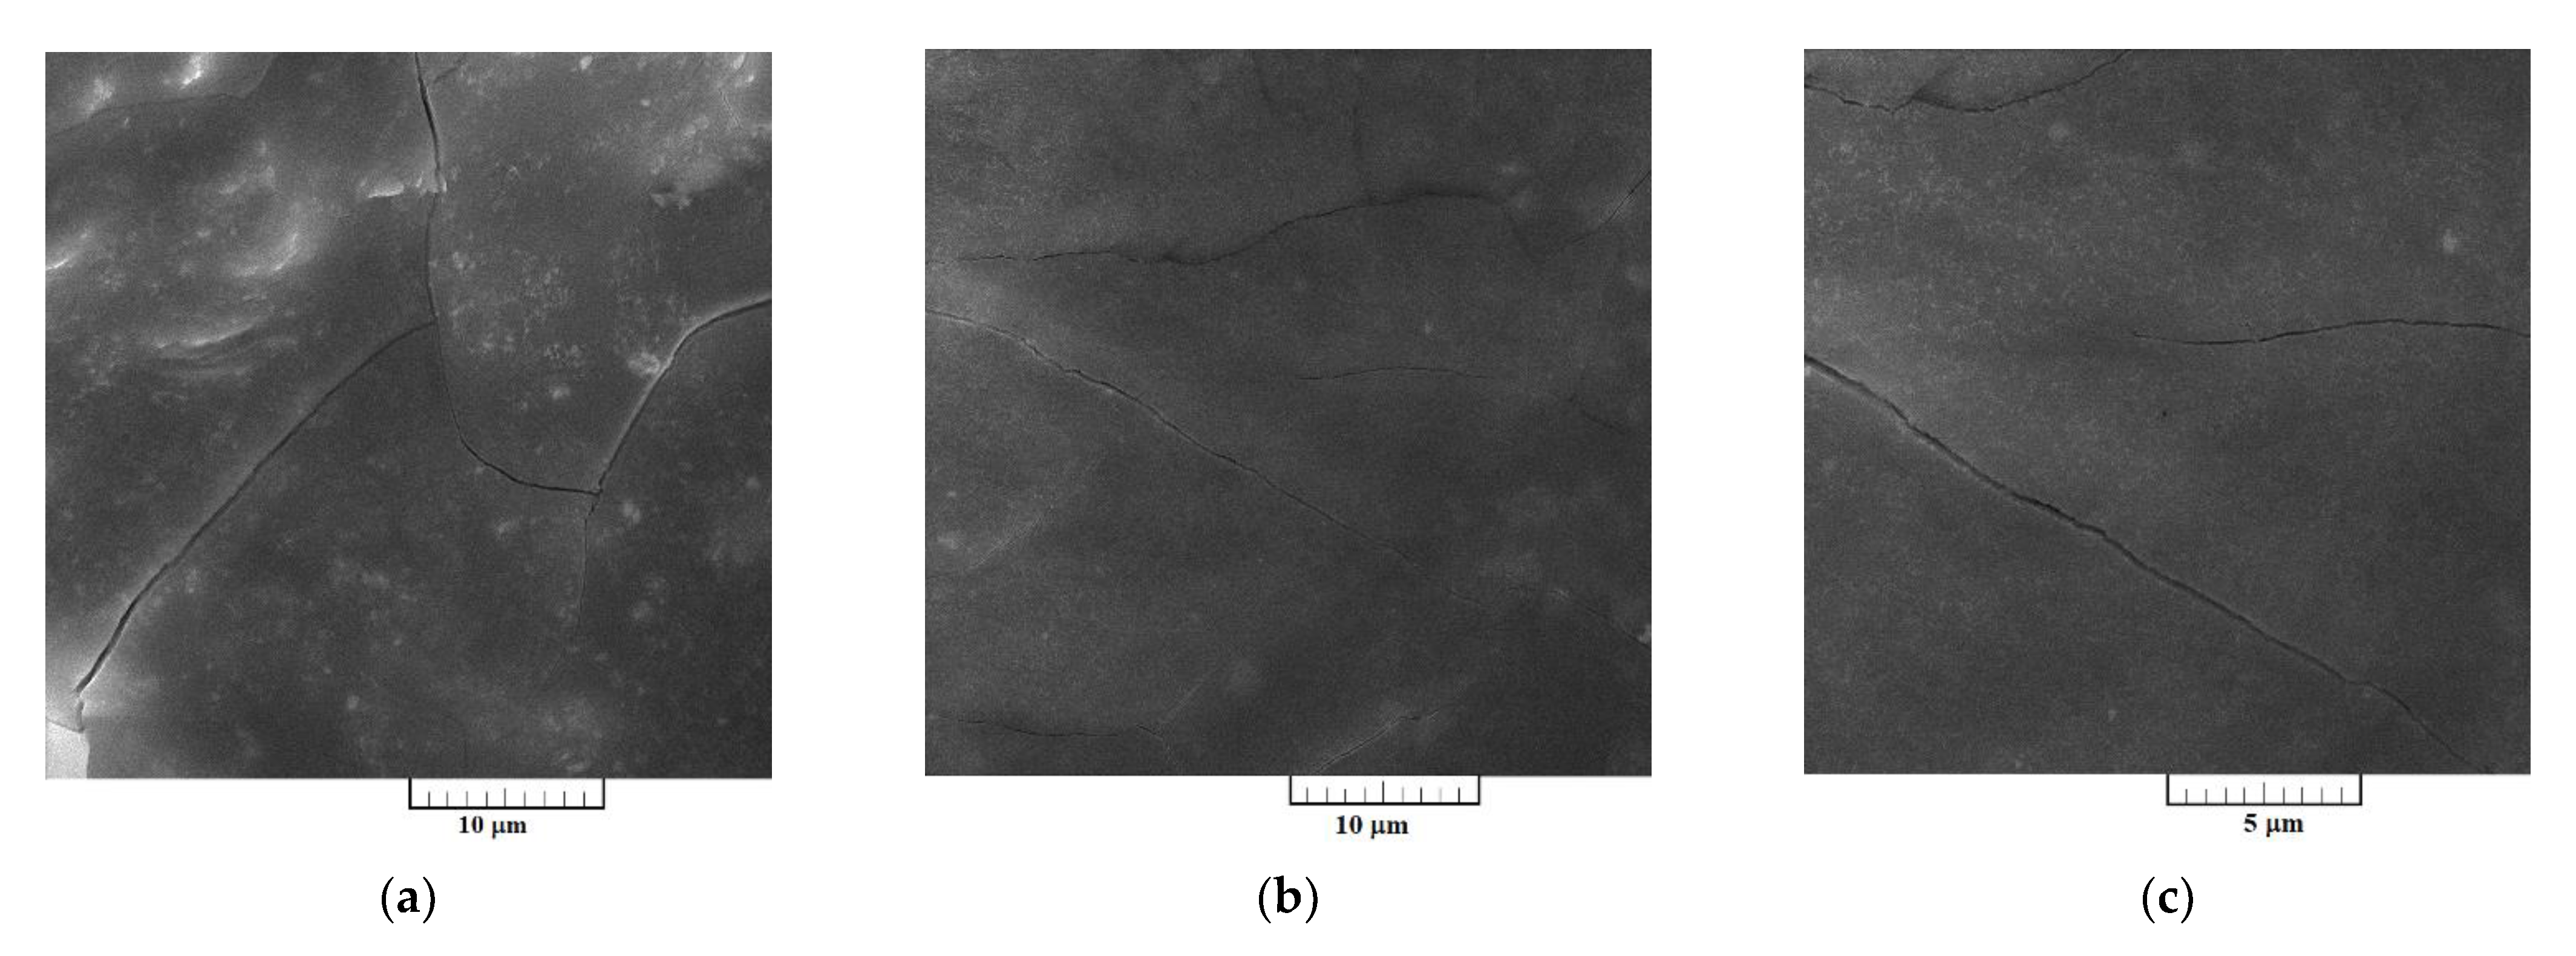
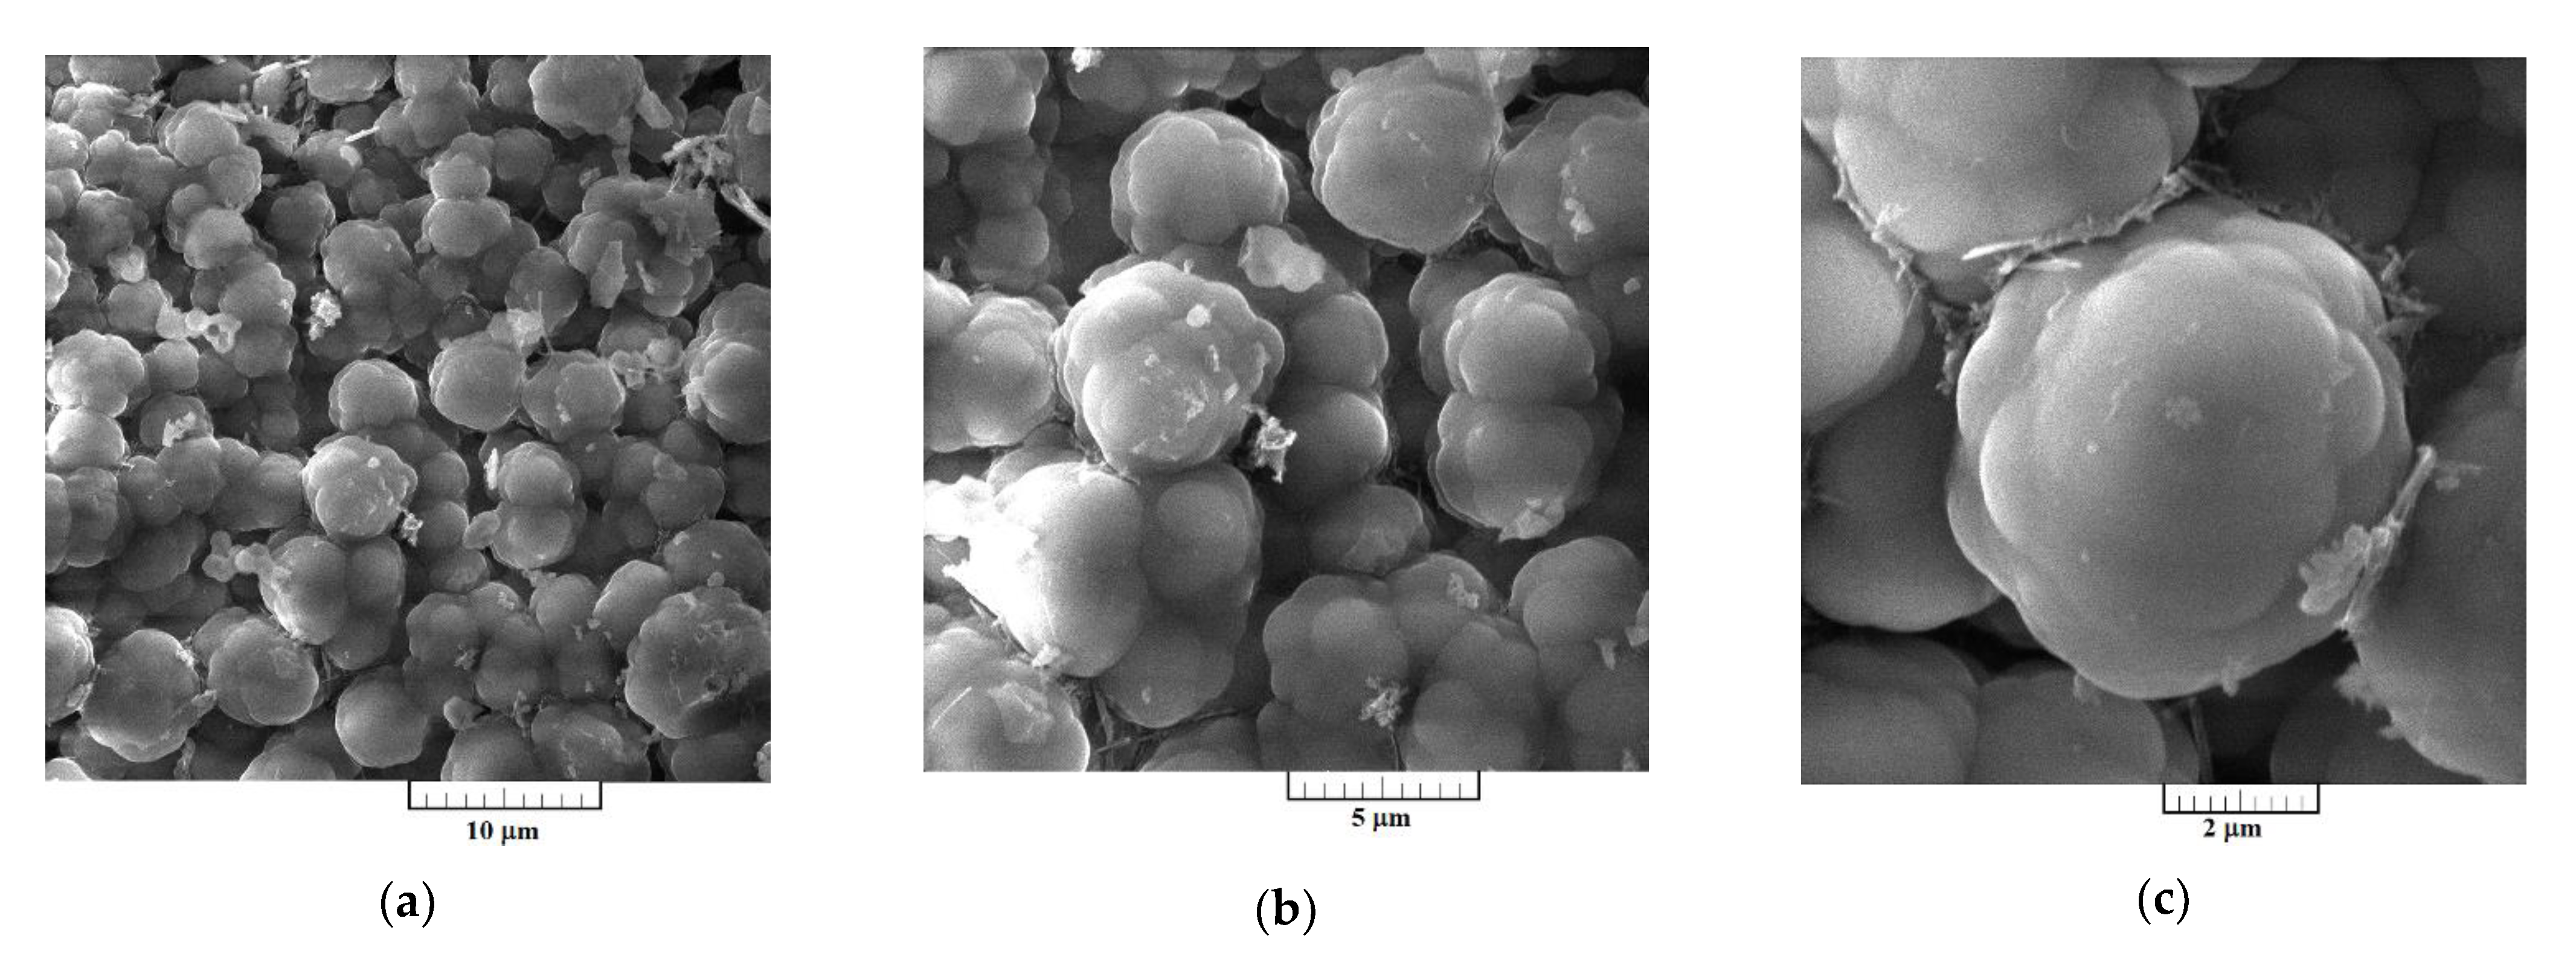
Presence of the aluminium and vanadium in the deposits were reported by EDS semi-quantitative analysis in the samples presented in Figure 7 and Figure 8. The deposit produced by potentiostatic electrodeposition from electrolyte containing anodically dissolved vanadium, besides oxygen, which was impossible to avoid during sample handling, has shown the content of aluminium at 38.55 at. % and vanadium of 23.15 at. %. Content of aluminium was 66.29 at. % and of vanadium 29.18 at. % in the sample obtained by electrodeposition from the electrolyte with vanadium added by VCl3. According to the EDS analysis, the deposits were free from chloride contamination. EDS data presented were collected from the entire surface given in Figure 7a and Figure 8a.
SEM photographs in Figure 7a–c represent a deposit obtained on GC electrode by potentiostatic aluminium underpotential deposition at 0.020 V vs. Al from the electrolyte containing anodically dissolved vanadium. The micrographs expose a relatively smooth and compact surface coating, well adhered to the working substrate. However, a deposit obtained on GC electrode by the deposition from the electrolyte with vanadium added by VCl3 at 0.050 V vs. Al, exhibited almost uniformly distributed 3D forms of the cauliflower-like structures, Figure 8a–c. Individual forms seem to be constructed from approximately spherical grains as the basic element, Figure 8c. From Figure 8a–c, it appears that they have been closely packed, with the average particles size around 5 µm, and completely covered the GC surface area.
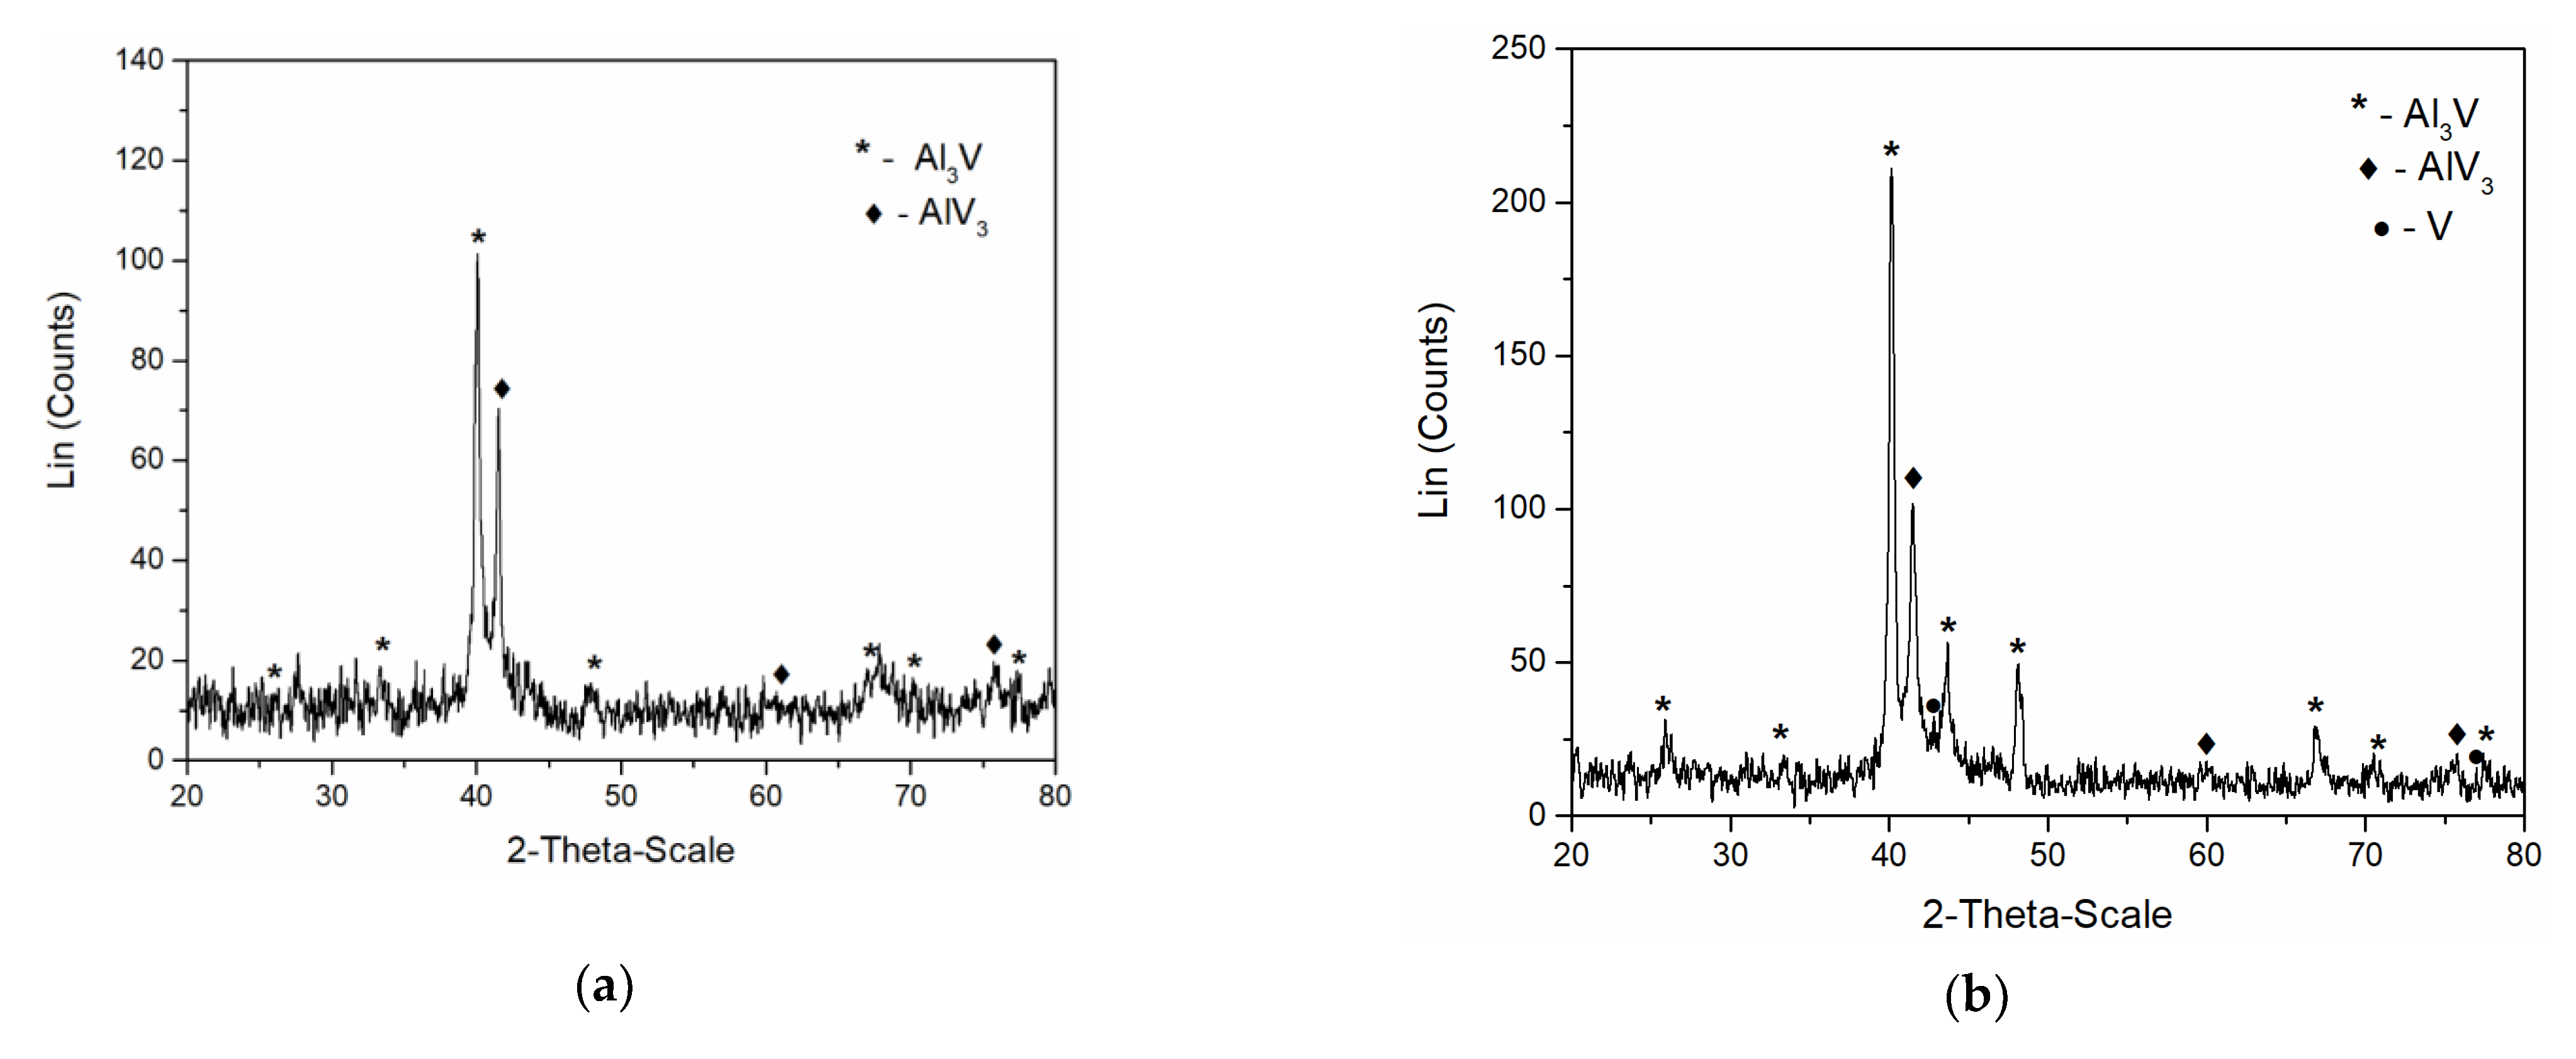
In order to identify the intermetallics synthetized during simultaneous vanadium deposition and aluminium underpotential deposition, XRD analysis of the deposit obtained on the GC working electrode at the potential of 0.020 V vs. Al applied for 5 h in the electrolyte containing anodically dissolved V was conducted. The analysis identified Al3V and AlV3 as present in the sample, Figure 9a. Peaks identified in the diffractogram at 2θ = 25.87°, 33.50°, 40.07°, 48.11°, 66.83°, 70.41°, and 77.47° can be indexed to (101), (110), (112), (200), (204), (220), and (116) reflections from body-centered tetragonal Al3V [JCPDS No. 03-065-2664]. The diffraction peaks at 2θ = 41.73°, 60.50°, 76.19° are indexed to (110), (200) and (211) reflections from body-centered cubic AlV3 [JCPDS No. 03-065-5142].
Very similar to these results were the XRD recordings of the deposit obtained on the GC working electrode at constant potential of 0.050 V vs. Al for 5 h, in the electrolyte where as a source of V ions, VCl3 was used, Figure 9b. Apart from the prominent peaks corresponding to Al3Vand AlV3 alloys, the XRD data indicated the traces of metallic V (2θ peaks at 42.28° and 77.20° [JCPDS No. 01-089-3059]) in the deposit.
Although the Al‒V intermetallics are well characterized, the Al‒V binary phase diagram still contains many uncertainties [7,8,12]. On the basis of binary Al‒V phase diagram, four intermetallics can be identified among Al-rich alloys: Al21V2, A145V7, A123V4, and Al3V, none of which can be formed at the temperatures below 600 °C. Al3V, an aluminium rich compound, should occur in Al‒V alloys containing 1–25 wt.% V with D022 structure prepared at temperature above 746 °C [12].
Literature reports on metallographic and microprobe analyses made on dilute alloys heat treatment for short times at temperatures between 500 °C and 740 °C, determined that Al3V phase is an equilibrium phase with a tetragonal structure. Recently, it was reported that the alloy Al3V was synthesized at temperatures from 1000 °C to 1400 °C from Al and relatively high vanadium content of 3–4wt.% [13,26]. At temperature from 1000 °C to 1100 °C and all the way up to 1400 °C the amount of Al3V increased.
As stated in a recent study [13], vanadium content in the melt was an important factor influencing the microstructure and controlling the types of V-containing phases formed in Al‒V alloys during rapid solidification process. Al3V alloy was not formed until vanadium content reached at least 3 wt.% in the Al-V alloy [13,27]. The dendritic Al3V alloy was formed at higher vanadium content in the system, with the boundaries of the Al3V phase spherical in shape.
In other words, alloys Al3V and AlV3 recorded in the analysis made on the deposit formed by the electrodeposition of vanadium and aluminium from the equimolar AlCl3 + NaCl melt containing vanadium ions onto GC, at applied temperature (200 °C) should not have been synthesized. However, it appears that in this case, potentiostatic electrodeposition is responsible for the controllable synthesis of the alloys. In our study, the deposits produced under all conditions being the same except the vanadium ion concentration in the electrolyte were identified as Al3V and AlV3. It appears that the vanadium concentrations in the electrolyte used were adequate for Al3V and AlV3 alloy formation. However, from the melt containing higher vanadium concentration in the electrolytes used, the deposit displayed a dendritic structure.
Our experiments have confirmed Al-V alloy generation by controlled aluminium and vanadium codeposition in the aluminium underpotential as well as overpotential region of the working potentials. The Al and V codeposition in the region of aluminium overpotentials will be a subject of another report. Nevertheless, it should be noted that the limiting factor in the Al and V codeposition in both aluminium overpotential and aluminium underpotential regions, is the vanadium ion concentration in the electrolyte used. The vanadium ion concentration in the electrolyte used dictates the largest vanadium deposition rate i.e., the mass transfer-controlled vanadium deposition current density. In the same time the vanadium dissolution in the chloride molten salts media is restricted to rather small values [15,16,25,28].

4. Conclusions

Al3V and AlV3 intermetallics have been successfully deposited by electrochemical aluminium and vanadium deposition onto glassy carbon electrode at 200 °C from the equimolar AlCl3 + NaCl electrolyte with vanadium ions added. The alloys were synthetized during aluminium underpotential deposition onto vanadium metal that was previously deposited on the glassy carbon electrode by diffusion-controlled overpotential deposition. Alloys were the result of solid-state interdiffusion between the initially deposited vanadium and the subsequently deposited aluminium. Although, the electrolyte system with V(III) ions (the result of VCl3 dissolution) is being favored because of the easiness in handling than the melt containing V(II) ion (the result of anodic V dissolution) a compact and adhering deposit was obtained on GC electrode from both electrolytes used.
Findings made in this study seem to be a good basis for an innovative research toward controllable electrochemical synthesis of a vanadium trialuminide (Al3V) and A15 alloy (AlV3) intermetallics.

Author Contributions

V.S.C. designed, managed the research and writing—original draft preparation; N.M.V. performed most of the experiments and participated in the manuscript preparation; D.F. and K.M.-N. performed some of the experiments; T.S.B. XRD data curation; B.F. and J.N.J. helped with the corrections of the manuscript and supervised; B.F. from RWTH Aachen University provided funding for publication. All authors discussed the results and commented on the manuscript. All authors have read and agreed to the published version of the manuscript.

Funding

Part of the research was supported by the funds of the bilateral research project (ID: 451-03-01971/2018-09/4) supported by the Ministry of Education, Science and Technological Development of the Republic of Serbia and German Academic Exchange Service (DAAD).

Institutional Review Board Statement

Not applicable.

Informed Consent Statement

Not applicable.

Data Availability Statement

Not applicable.

Acknowledgments

Vesna S. Cvetković and Nataša M. Vukićević acknowledge the financial support for the investigation received from the Ministry of Education, Science, and Technological Development of the Republic of Serbia (Grant No. 451-03-68/2020-14/200026).

Conflicts of Interest

The authors declare no conflict of interest.

References

  1. Xu, Y.; Jiao, H.; Wang, M.; Jiao, S. Direct preparation of V-Al alloy by molten salt electrolysis of soluble NaVO3 on a liquid Al cathode. J. Alloys Compd. 2019, 779, 22–29. [Google Scholar] [CrossRef]
  2. Wan, H.; Xu, B.; Li, L.; Yang, B.; Li, D.; Dai, Y. A Novel Method of Fabricating Al-V Intermetallic Alloy through Electrode Heating. Metals 2019, 9, 558. [Google Scholar] [CrossRef] [Green Version]
  3. Yazdian, N.; Karimzadeh, F.; Enayati, M.H. In-situ fabrication of Al3V/Al2O3 nanocomposite through mechanochemical synthesis and evaluation of its mechanism. Adv. Powder Technol. 2013, 24, 106–112. [Google Scholar] [CrossRef]
  4. Cvetkovic, V.; Jovicevic, N.; Vukicevic, N.; Jovicevic, J. Aluminium/zirconium alloys obtained by Al underpotential deposition onto Zr from low temperature AlCl3+NaCl molten salts. J. Serbian Chem. Soc. 2019, 84, 1329–1344. [Google Scholar] [CrossRef] [Green Version]
  5. Sircar, S.; Chattopadhyay, K.; Mazumder, J. Nonequilibrium synthesis of NbAl3 and Nb-Al-V. Metall. Trans. A 1992, 23, 2419–2429. [Google Scholar] [CrossRef]
  6. Anvari, S.Z.; Karimzadeh, F.; Enayati, M.H. Synthesis and characterisation of nanostructured Al–Al3V and Al–(Al3V–Al2O3) composites by powder metallurgy. Mater. Sci. Technol. 2018, 34, 179–190. [Google Scholar] [CrossRef]
  7. Okamoto, H. Al-V (Aluminum-Vanadium). J. Phase Equilibria Diffus. 2012, 33, 491. [Google Scholar] [CrossRef] [Green Version]
  8. Jovićević, N.; Cvetković, V.S.; Kamberović, Ž.; Barudžija, T.S. Aluminium underpotential deposition from AlCl3+NaCl melts and alloy formation with vanadium substrate. Int. J. Electrochem. Sci. 2015, 10, 8959–8972. [Google Scholar]
  9. Cvetković, V.S.; Vukićević, N.M.; Jovićević, J.N. Aluminium and Magnesium Alloy Synthesis by Means of Underpotential Deposition from Low Temperature Melts. In Metals and Metal-Based Electrocatalytic Materials for Alternative Energy Sources and Electronics; Stevanović, J., Ed.; Nova Science Publisher: New York, NY, USA, 2019; pp. 371–423. ISBN 6312317269. [Google Scholar]
  10. Gussone, J.; Vijay, C.R.Y.; Haubrich, J.; Milicevic, K.; Friedrich, B. Effect of vanadium ion valence state on the deposition behaviour in molten salt electrolysis. J. Appl. Electrochem. 2018, 48, 427–434. [Google Scholar] [CrossRef]
  11. Léger, J.M.; Hall, H.T. Pressure and temperature formation of A3B compounds I. Nb3Si and V3Al. J. Less-Common Met. 1973, 32, 181–187. [Google Scholar] [CrossRef]
  12. Murray, J.L. Al-V (aluminum-vanadium). Bull. Alloy. Phase Diagr. 1989, 10, 351–357. [Google Scholar] [CrossRef]
  13. Meng, Y.; Cui, J.; Zhao, Z.; Zuo, Y. Study on Microstructures of Al-4 wt pct V Master Alloys. Metall. Mater. Trans. A 2014, 45, 3741–3747. [Google Scholar] [CrossRef]
  14. Zhu, Q.; Meng, Y.; Kang, Y.; Kong, S.; Ou, Y.; Zuo, Y. Effect of cooling rate on morphology and type of vanadium-containing phases in Al-10V master alloy. China Foundry 2019, 16, 300–306. [Google Scholar] [CrossRef] [Green Version]
  15. Polovov, I.B.; Chernyshov, M.V.; Volkovich, V.A.; Vasin, B.D.; Griffiths, T.R. Vanadium Speciation in Fused Alkali Chlorides. J. Electrochem. Soc. 2017, 164, H5139–H5144. [Google Scholar] [CrossRef] [Green Version]
  16. Polovov, I.B.; Tray, M.E.; Chernyshov, M.V.; Volkovich, V.A.; Vasin, B.D.; Rebrin, O.I. Electrode Processes in Vanadium-Containing Chloride Melts. In Molten Salts Chemistry and Technology; John Wiley & Sons, Ltd: Chichester, UK, 2014; pp. 257–281. ISBN 9781118448847. [Google Scholar]
  17. Milicevic, K.; Friedrich, B.; Gussone, J.; Haubrich, J. Anodic dissolution of vanadium in molten LiCl–KCl–TiCl2. J. Appl. Electrochem. 2017, 47, 573–581. [Google Scholar] [CrossRef]
  18. Rebrin, O.I.; Scherbakov, R.Y.; Polovov, I.B.; Mihalev, S.M.; Volkovich, V.A.; Muhamadeev, A.S.; Vasin, B.D. Investigation of the Kinetics of Electrode Processes in Halide Melts Containing Beryllium, Vanadium, Niobium and Hafnium. ECS Proc. Vol. 2002, 19, 460–472. [Google Scholar] [CrossRef]
  19. Verdieck, R.G.; Yntema, L.F. The Electrochemistry of Baths of Fused Aluminum Halides. IV. J. Phys. Chem. 1944, 48, 268–279. [Google Scholar] [CrossRef]
  20. Tsuda, T.; Hussey, C.L. Electrochemistry of vanadium(II) and the electrodeposition of aluminum-vanadium alloys in the aluminum chloride-1-ethyl-3-methylimidazolium chloride molten salt. J. Min. Metall. Sect. B Metall. 2003, 39, 3–22. [Google Scholar] [CrossRef]
  21. Vukićević, N.M.; Cvetković, V.S.; Jovanović, L.; Stevanović, S.I.; Jovićević, J.N. Alloy Formation by Electrodeposition of Niobium and Aluminium on Gold from Chloroaluminate Melts. Int. J. Electrochem. Sci. 2017, 12, 1075–1093. [Google Scholar] [CrossRef]
  22. Radović, B.S.; Cvetković, V.S.; Edwards, R.A.H.; Jovićević, J.N. Al-Cu alloy formation by aluminium underpotential deposition from AlCl3+NaCl melts on copper substrate. Kov. Mater. 2010, 48, 159–171. [Google Scholar]
  23. Greef, R.; Peat, R.; Peter, L.M.; Pletcher, D.; Robinson, J. Instrumental Methods in Electrochemistry, 1st ed.; Kemp, T.J., Ed.; Ellis Horwood Limited: Chichester, UK, 1985; ISBN 0-85312-875-8. [Google Scholar]
  24. Polovov, I.B.; Chernyshov, M.V.; Volkovich, V.A.; Rebrin, O.I.; Rylov, A.N. Vanadium Electrorefining in NaCl–KCl–VCl2 Melts. ECS Trans. 2018, 86, 37–43. [Google Scholar] [CrossRef]
  25. Chernyshov, M.V.; Polovov, I.B.; Rebrin, O.I.; Volkovich, V.A.; Kamalov, R.V.; Griffiths, T.R. Processing of Vanadium and Niobium Electrodeposited from Alkali Chloride Melts. ECS Trans. 2010, 33, 297–302. [Google Scholar] [CrossRef] [Green Version]
  26. Grushko, B.; Velikanova, T.Y. Stable and metastable quasicrystals in Al-based alloy systems with transition metals. J. Alloys Compd. 2004, 367, 58–63. [Google Scholar] [CrossRef]
  27. Lei, K.P.V.; Sullivan, T.A. High-purity vanadium. J. Less Common Met. 1968, 14, 145–147. [Google Scholar] [CrossRef]
  28. Polovov, I.B.; Vasin, B.D.D.; Abakumov, A.V.V.; Rebrin, O.I.I.; Chernyshov, M.V.V.; Volkovich, V.A.; Griffiths, T.R.R. Thermodynamics of the Formation of Vanadium(II) Complexes in Chloride Melts. ECS Trans. 2019, 3, 589–597. [Google Scholar] [CrossRef]
Figure 1. (a) Potentiodynamic polarization curve of vanadium working electrode (WE) in equimolar melt AlCl3 + NaCl, T = 200 °C, potential range: EI = 0.600 V → EAF = 1.900 V vs. Al; v = 1 mVs−1; (b) Cyclic voltammogram of vanadium WE in equimolar AlCl3 + NaCl melt, T = 200 °C, potential change from EI = 1.200 V vs. Al to EAF = 2.000 V vs. Al, then to ECF = 0.500 V vs. Al and finally back to EI = 1.200 V vs. Al, v = 20 mVs−1.
Metals 11 00123 g001
Figure 2. (a) Potentiodynamic polarization curve of V working electrode in equimolar melt AlCl3 + NaCl, T = 200 °C, potential range: (a) EI = –0.100 V → EAF = 1.900 V vs. Al v = 1 mVs−1; (b) voltammogram of vanadium WE in equimolar AlCl3 + NaCl melt, T = 200 °C, potential change: from EI = 1.200 V to EAF = 2.000 V vs. Al, then to cathodic end potentials of ECF = –0.150 V vs. Al and back to EI, v = 20 mVs−1.
Metals 11 00123 g002
Figure 3. (a) Cyclic voltammograms of V WE in equimolar AlCl3 + NaCl melt, at 200 °C, potential range: EI = 1.100 V to EAF = 1.700 V vs. Al, recorded with different scan rates; (b) Plot of C1 peak current density vs. square root of the scan rates from Figure 3a; (c) Plots of A2 and C2 peak current density vs. square root of the scan rates from Figure 3a.
Metals 11 00123 g003
Figure 4. (a) Anodic dissolution of V working electrode at 1.300 V vs. Al for 10 h in equimolar melt AlCl3 + NaCl, T = 200 °C; (b) i = f(t−1/2) for the falling part of the transient obtained during vanadium dissolution process presented in (a).
Metals 11 00123 g004
Figure 5. Cyclic voltammograms recorded on glassy carbon (GC) WE with different scan rates: (a) in equimolar AlCl3 + NaCl + anodically dissolved V; T = 200 °C; (b) in equimolar AlCl3 + NaCl + vanadium(III)chloride, T = 200 °C.
Metals 11 00123 g005
Figure 6. Hold on GC working electrode at potential EC = 0.050 V vs. Al; T = 200 °C, v = 100 mVs−1; in: (a) the equimolar melt containing anodically dissolved vanadium; (b) the equimolar melt with vanadium added by VCl3.
Metals 11 00123 g006
Figure 7. SEM micrographs of electrochemically produced Al‒V alloys from the equimolar AlCl3 + NaCl melt containing anodically dissolved V at 0.020 V vs. Al, deposition time 5 h, at 200 °C; at: (a,b) low magnification and (c) higher magnification.
Metals 11 00123 g007
Figure 8. SEM micrographs of electrochemically produced Al-V alloys from the equimolar AlCl3 + NaCl with vanadium added by VCl3 at 0.050 V vs. Al, deposition time 5 h, at 200 °C; at: (a,b) low magnification, and (c) higher magnification.
Metals 11 00123 g008
Figure 9. XRD patterns of electrochemically produced deposit on GC working electrode at 200 °C; deposition time 5 h: (a) from the equimolar AlCl3 + NaCl melt containing anodically dissolved V at 0.020 V vs. Al; (b) from the equimolar AlCl3 + NaCl with vanadium added by VCl3 at 0.050 V vs. Al.
Metals 11 00123 g009
Publisher’s Note: MDPI stays neutral with regard to jurisdictional claims in published maps and institutional affiliations.

