Article

Frequency Analysis of Transients in Electrochemical Noise of Superalloys Waspaloy and Ultimet

by
Jesús Manuel Jáquez-Muñoz
1,
Citlalli Gaona-Tiburcio
1,*,
Jose Cabral-Miramontes
1,
Demetrio Nieves-Mendoza
2,
Erick Maldonado-Bandala
2,
Javier Olguín-Coca
3,
Francisco Estupinán-López
1,
Luis Daimir López-León
3,
José Chacón-Nava
4 and
Facundo Almeraya-Calderón
1,*
1
Universidad Autonoma de Nuevo Leon, FIME-Centro de Investigación e Innovación en Ingeniería Aeronáutica (CIIIA), Av. Universidad s/n, Ciudad Universitaria, 66455 San Nicolás de los Garza, Mexico
2
Universidad Veracruzana, Facultad de Ingeniería Civil, 91000 Xalapa, Mexico
3
Universidad Autónoma del Estado de Hidalgo, Área Académica de Ingeniería y Arquitectura, Carretera Pachuca-Tulancingo Km. 4.5., 42082 Hidalgo, Mexico
4
Centro de Investigación en Materiales Avanzados (CIMAV), Miguel de Cervantes 120, Complejo Industrial Chihuahua, 31136 Chihuahua, Mexico
*
Authors to whom correspondence should be addressed.
Metals 2021, 11(5), 702; https://doi.org/10.3390/met11050702
Submission received: 15 March 2021 / Revised: 14 April 2021 / Accepted: 21 April 2021 / Published: 25 April 2021
(This article belongs to the Special Issue Corrosion and Protection in Aeronautical Alloys)

Abstract

:
Nickel or Cobalt-based superalloys represent an important class of engineering materials, finding widespread application in critical components within the gas turbine engines used for jet propulsion and electricity generation. This research aimed at the frequency analysis of transients in electrochemical noise of Waspaloy and Ultimet superalloys, immersed in 3.5 wt.% in H2SO4 and NaCl solutions at two different temperatures, 25 and 60 °C. Localized corrosion behavior of superalloys was assessed using the electrochemical noise technique (EN) according to ASTM-G199 standard. Three different statistical methods filtered the EN signal, and the polynomial method was employed to obtain the noise resistance (Rn), the localization index (LI), skew and kurtosis, and the power spectral density analysis (PSD). Results indicate that the current and potential noise transients have a better behavior with better clarity when a polynomial is used to show a localized corrosion kurtosis for both superalloys.

Graphical Abstract

1. Introduction

The superalloys are high-temperature materials that display excellent resistance to mechanical and chemical degradation at temperatures close to their melting points [1,2].
Since they first emerged in the first half of the twentieth century, these alloys have had an extraordinary impact. Consider the aero-engines which power the modern civil aircraft. The superalloys are employed in the very hottest sections of the turbines, under the heaviest loads, with the utmost importance placed on assuring the integrity of the components fabricated from them. Indeed, the development of superalloys has been intrinsically linked to the history of the jet engine for which they were designed. A modern jet airplane could not fly without them. Further improvements in temperature capability are now actively sought, e.g., the engines can power the two-decked Airbus A380 and the Boeing 787 Dreamliner [1,3,4,5,6,7].
Materials used in hot parts of jet engines must retain high performances and structural stability for prolonged periods under service conditions involving high mechanical stresses and corrosive agents [1,4].
Superalloys are an essential group of high-temperature materials used to fabricate gas turbines, aircraft motors, rockets, and petroleum plants. They are suitable for demanding applications and conserve their resistance to high temperatures (1200–1400 °C) over long periods [1]. Nowadays, a widely accepted definition of superalloys refers to an austenitic group. Three types of superalloys exist, based Ni, Co, and Ni-Fe. Nickel-based superalloys have better relation temperature-strain what the other superalloys types. They are used for more demanding applications. Ni-Fe superalloys have good ductility and toughness. Cobalt-based superalloys have more resistance to high-temperature corrosion [2].
Nickel-based superalloys are face-centered cubic (FCC); Nickel only exhibits this crystalline structure from room temperature up to the melting point. The crystallographic structure of cobalt at room temperature and below is hexagonal close-packed (HCP). Upon heating, the structure changes martensitic alloy into the FCC-Co polymorph, stable up to the melting temperature. Nickel-based superalloys generally contain at least 50 wt.% of Ni, together with different combinations of Cr, Al, and Ti (all together summing up to 8 wt.%), and Co and refractory elements, like Mo, W, Nb, and Re, in lower concentrations. Ni-based superalloys can be produced in both wrought and cast forms. Cobalt-based superalloys usually contain more than 60 wt.% of cobalt. Nickel and Iron are present as stabilizers of the austenitic, high-temperature polymorph of cobalt. Chromium is usually present in the concentration range of 20–30%, while molybdenum, tungsten, and other refractory metals sum up to a maximum value of about 10%. In contrast, Carbon is present in concentrations not exceeding one wt.% approximately [1,2,3,7].
The Nickel-based superalloys matrix is a Ni solid solution with an austenitic structure. Its intrinsic strength and properties depend on the concentrations of alloying elements in the solution. Reinforcing phases is by the formation of ordered precipitates such γ′-Ni3 (Al, Ti) and γ′′-Ni3Nb. In polycrystalline alloys, carbides provide beneficial effects on the grain boundary stability. The carbides hinder recrystallization and grain boundary slip. In Cobalt-based superalloys, the carbide dispersion and solid solution are the main strengthening mechanisms. Together with the high-temperature corrosion requirements, the leading families of these alloys’ constituent elements are determined: γ (FCC)-phase stabilizers and strengtheners, surface stabilizers, and carbide formers. Nickel and Iron addition is used to stabilize the high-temperature FCC polymorph of cobalt down to room temperature [6,7,8,9,10,11,12,13].
Different conventional electrochemical techniques have been used to determine the corrosion kinetics and reaction mechanisms, such as potentiodynamic polarization (PP), electrochemical impedance spectroscopy (EIS), and linear polarization resistance (LPR). However, these techniques can alter the electrochemical system with external signals in electrochemical measurements [14,15,16,17,18,19]. The use of the electrochemical noise (EN) technique for investigation and corrosion monitoring has allowed many advances in recent years interesting for corrosion science. A particular advantage of EN measurements is detecting and analyzing the early stages of localized corrosion.
Electrochemical noise describes the spontaneous low-level potential and current fluctuations that occur during an electrochemical process. During the corrosion process, predominantly electrochemical cathodic and anodic reactions can cause small transients in electrical charges on the electrode. These transients manifest in potential and current noise exploited in a corrosion map [20,21,22]. Transients are linked to anodic and cathodic reactions as a result of stochastic processes (rupture and re-passivation of the passive film) and deterministic processes (formation and propagation of pitting) [23,24,25]. Potential and/or current transients in time series are associated with initiation and re-passivation of metastable pitting, which provides helpful information on localized corrosion initial process. Ma et al. [26,27] indicate that EN data is influenced by the measurement mode, the surface area of the working electrodes, the electrolytic resistance and the symmetry of the electrode system. Xia et al. [28] have reported distinct mathematical methods and the parameters are analyzed by using EN data to identify corrosion form and corrosion rates. They are classified into three groups: the time domain, the frequency domain, and the time-frequency domain. The statistical analysis includes parameters such as noise resistance (Rn), skewness, kurtosis, localization index (LI), chaos analysis, recurrence quantification analysis, and fractal analysis. The fast Fourier transform includes power spectral density, noise impedance, etc., and the time-frequency domains methods include the analysis of Hilbert–Huang transform, discrete wavelet transform, Stockwell transform, and others [26,27,28,29,30,31,32]. LI, skewness, and kurtosis values have been reported as values related to different corrosion types and values referring to the asymmetry of EN data’s distribution and shape [32,33,34,35,36,37].
Very few experiments with these conditions and with this electrochemical technique have been developed. L.O Osoba et al. [3] researched Ni-based superalloys using the potentiodynamic polarization technique in HCl at 1 M. The results showed a passivation trend. Moreover, the differences among corrosion rates in an acid environment for based-Ni superalloys depends on Cr and Mo content.
Electrochemical characterization of superalloys could find potential in the aeronautical industry applications, such as turbine blades and aircraft landing gears. The structural components of aircraft made with superalloys are exposed to different atmospheres: industrial (acid rain (H2SO4)) and marine (NaCl). Las superalloys may be susceptible to low temperature pitting corrosion when aircraft are on the ground.
This research aimed was Frequency Analysis of Transients in Electrochemical Noise of Waspaloy and Ultimet superalloys, immersed in 3.5 wt.% in H2SO4 and NaCl solutions at two different temperatures, 25 and 60 °C. The localized corrosion behavior of superalloys was studied using the electrochemical noise technique (EN) according to ASTM-G199 standard.

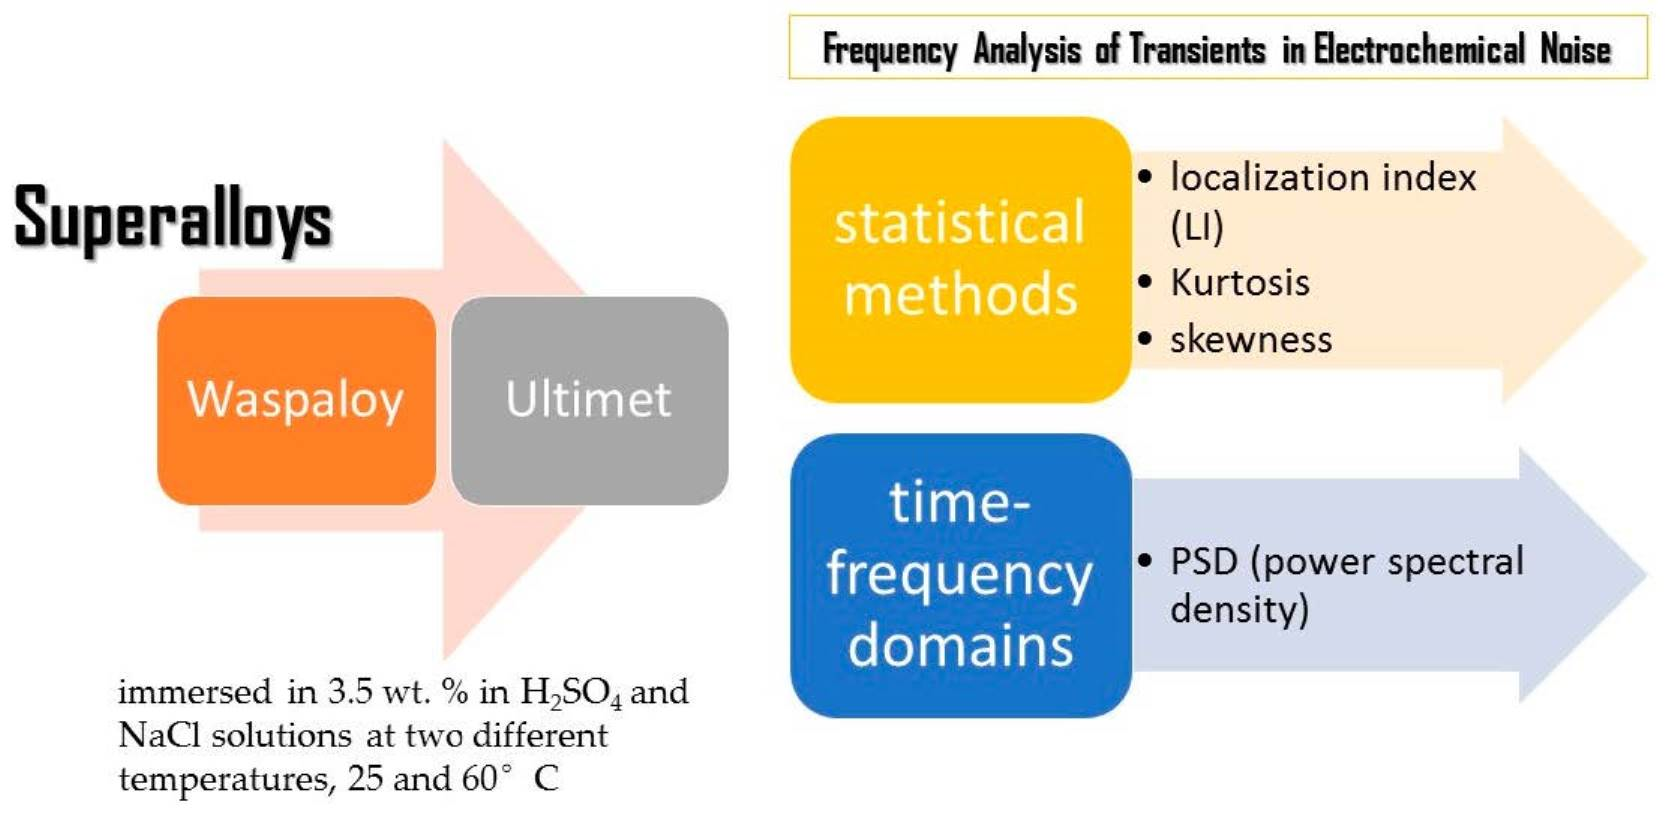
2. Materials and Methods

2.1. Materials

The materials used in this work were superalloys, Waspaloy (Nickel-based) and Ultimet (Cobalt-based), used in the received condition. The chemical composition of these superalloys was obtained by X-ray fluorescence (Olympus DELTA XRF. Richmond, TX, USA). Table 1 shows the chemical composition of each superalloy.

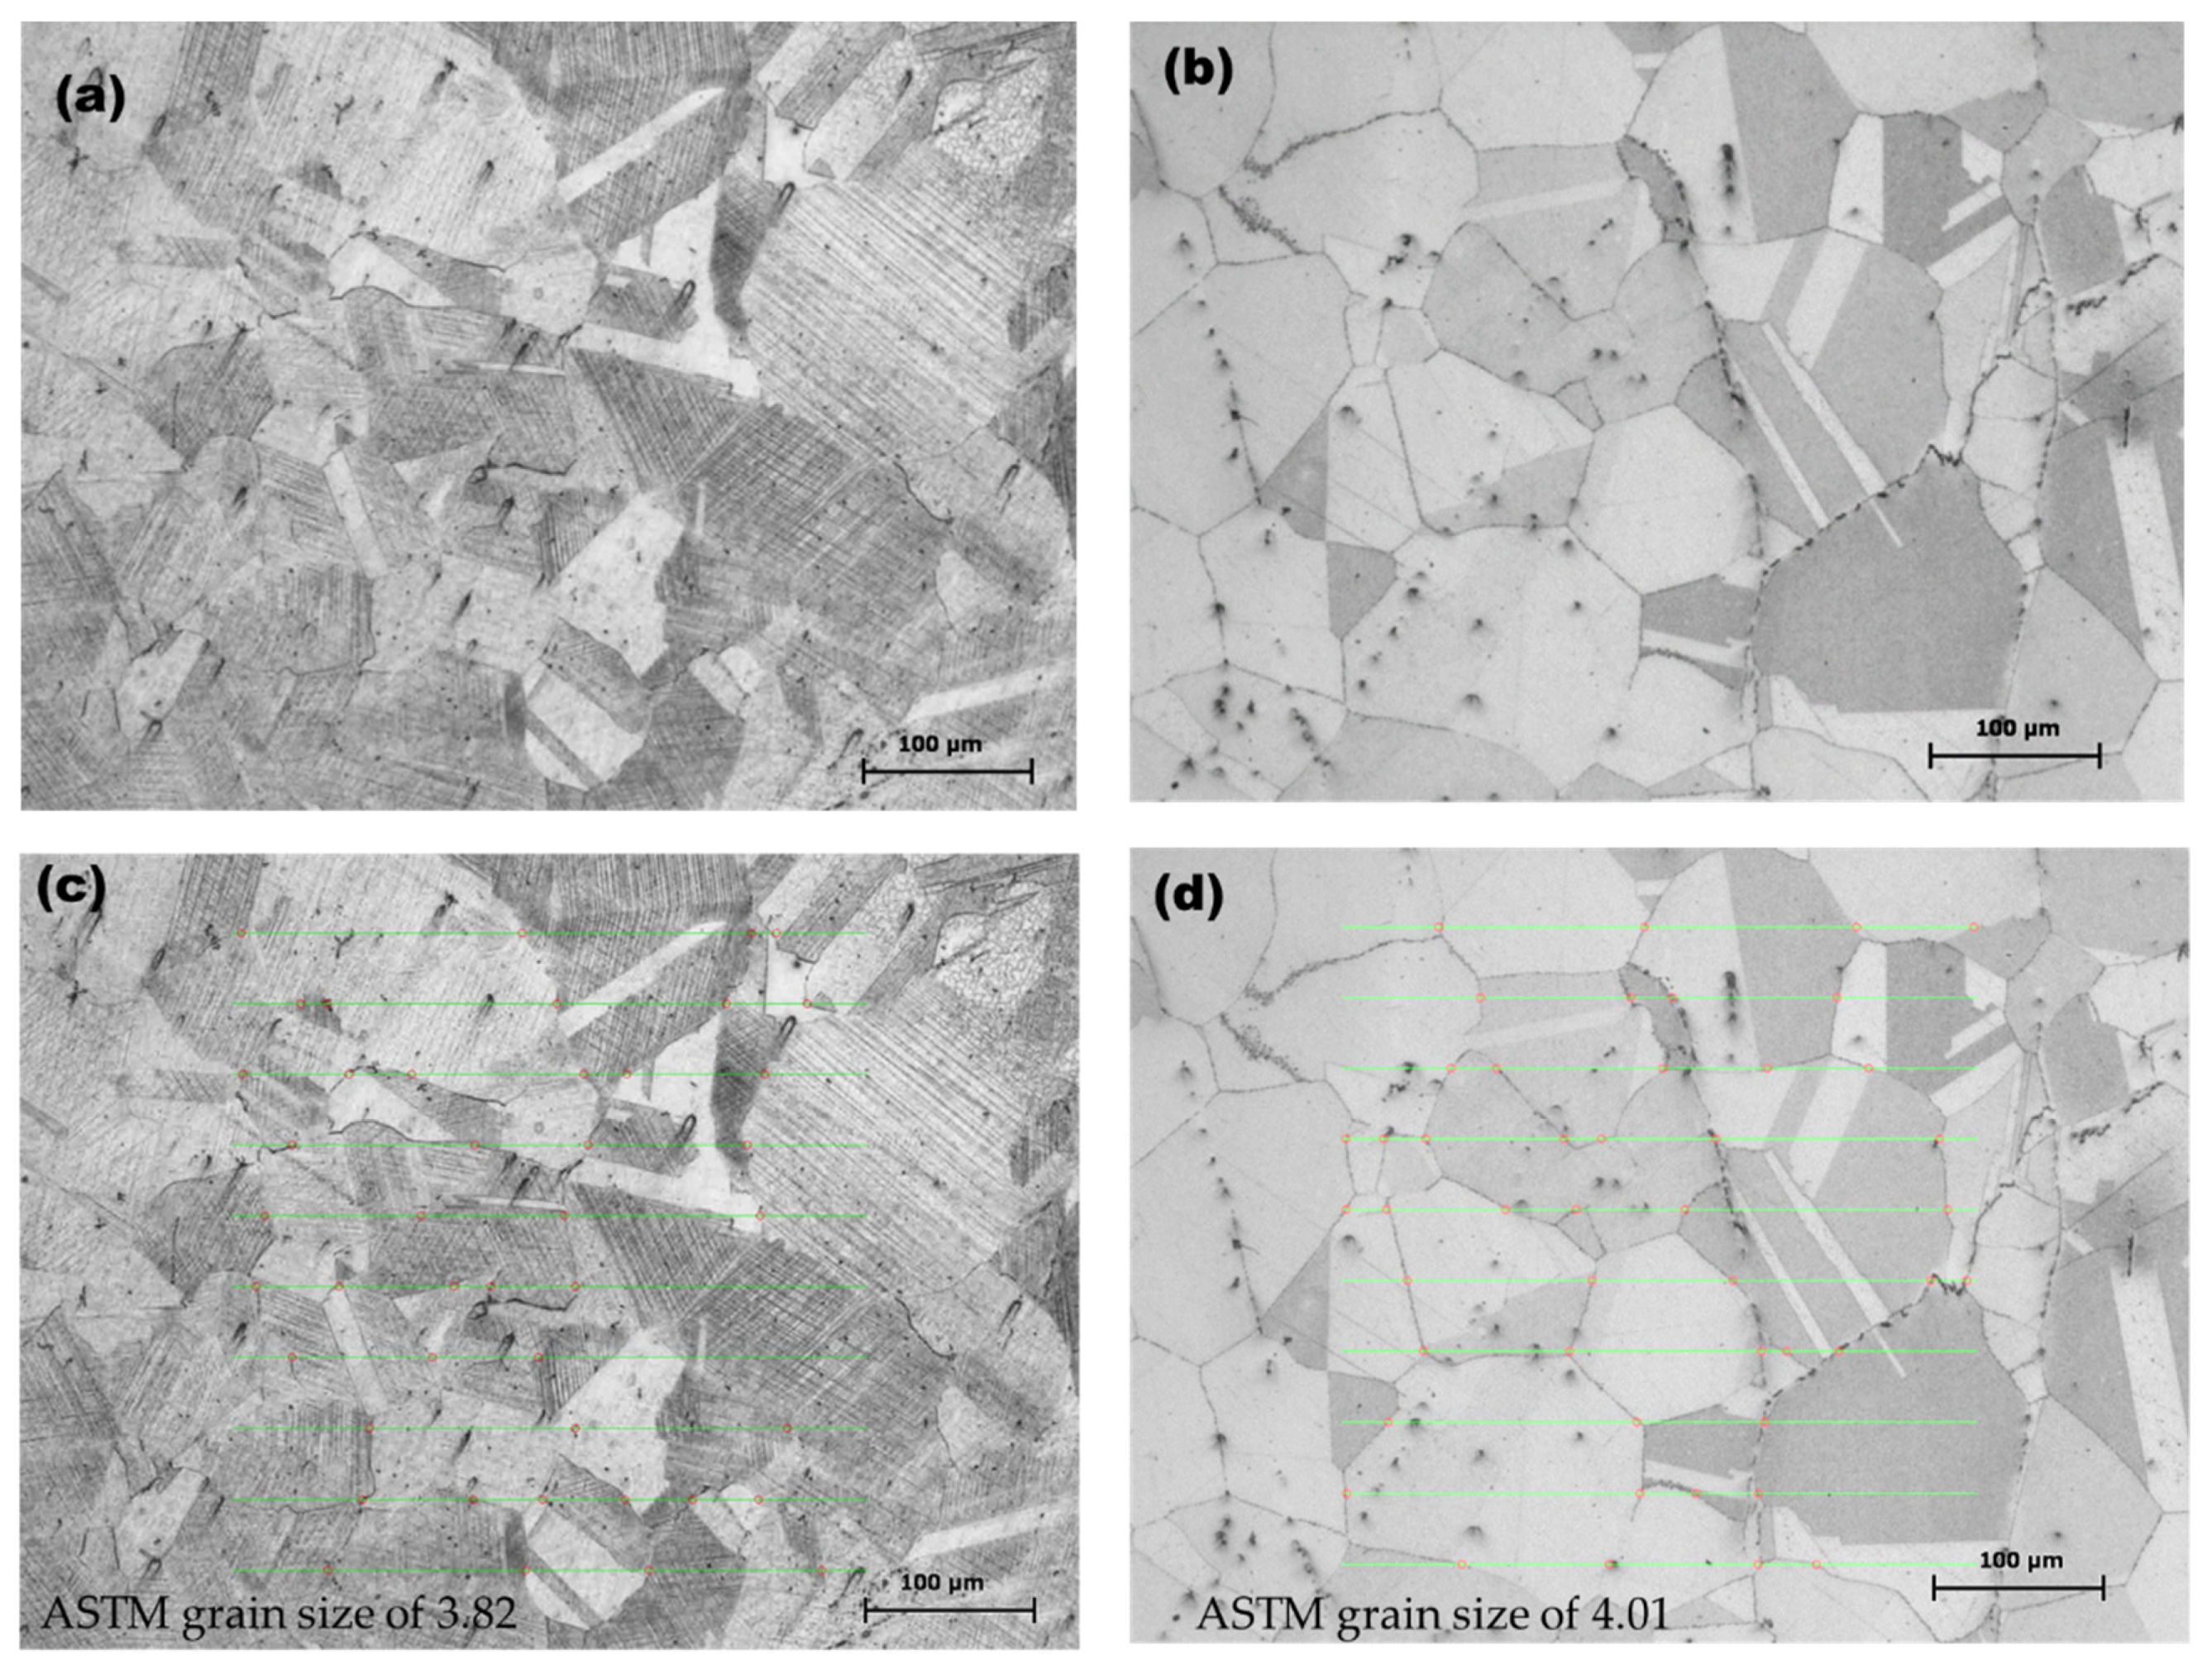
2.2. Microstructural Characterization

The specimens were polished using metallographic techniques. The polishing was done using different SiC grit papers until 4000 grades, followed by ultrasonic cleaning in ethanol (C2H5OH) and deionized water for 10 min each. Etching of polished samples was elaborated with a solution composed of HNO3 2.5 mL, FeCl3 32.5 g, and HCl 10 mL, according to ASTM E3 and E407 standards [38,39].
The microstructural analysis was carried out by optical microscopy (OM, Olympus, Hamburg, Germany) for identifying the microstructure of samples at a magnification of 100×.

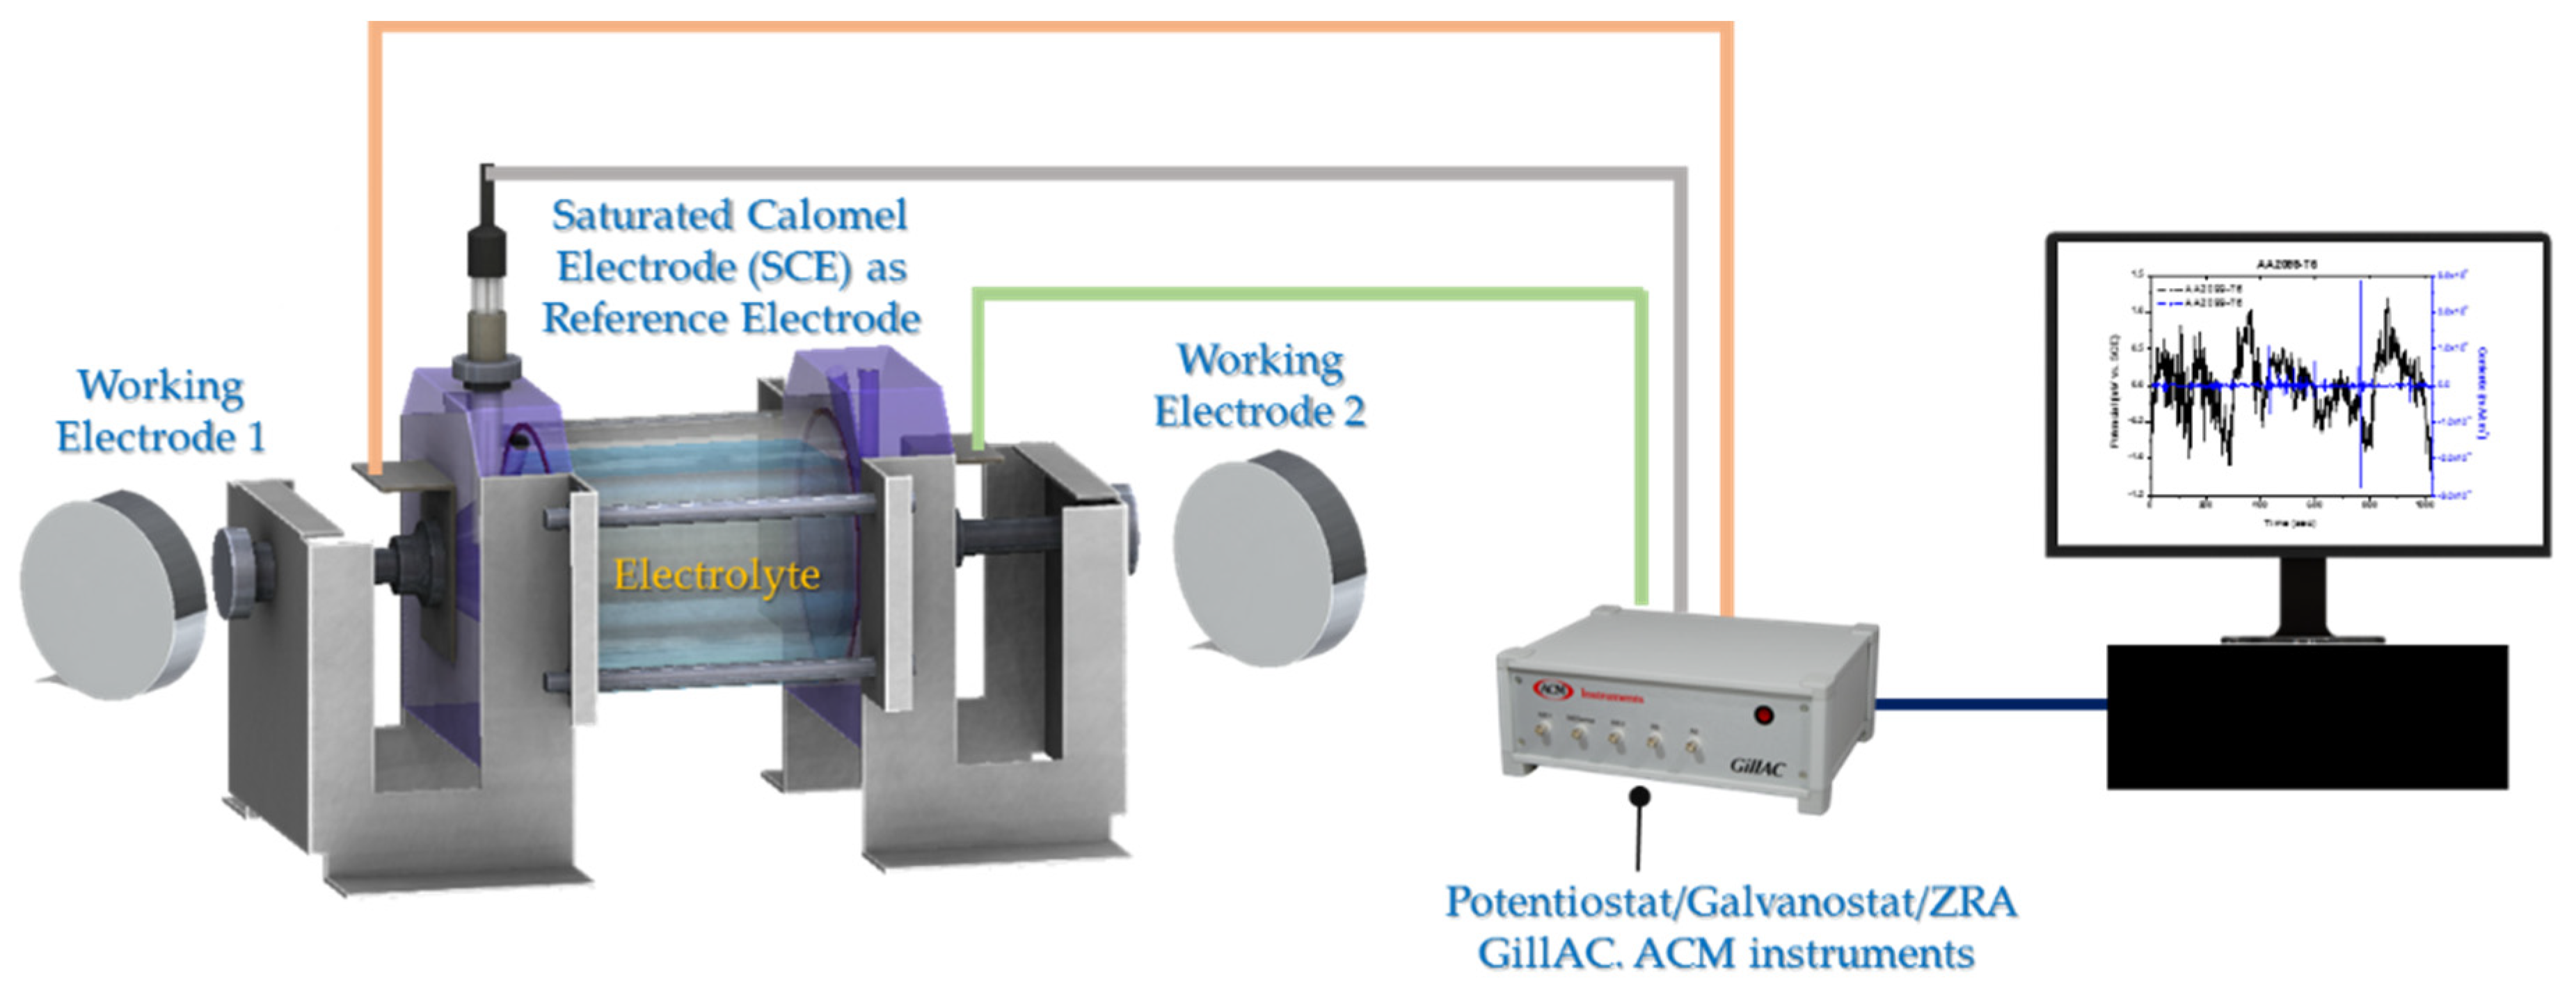
2.3. Electrochemical Techniques

The electrochemical noise (EN) technique was used to evaluate corrosion behavior of Waspaloy and Ultimet superalloys, immersed in 3.5 wt.% in H2SO4 and NaCl solutions at two different temperatures, 25 and 60 °C. Each test was carried out in duplicate (test 1 and 2). The electrochemical noise measurements were recorded simultaneously using a Gill-AC potentiostat/galvanostat/ZRA (Zero Resistance Ammeter) from ACM Instruments (Manchester, UK).
EN measurements were carried out according to ASTM G199-09 standard, which allows the noise resistance (Rn) and corrosion rate evaluation to be determined in distinctive corrosive media. For each experiment (Figure 1), two nominally identical specimens were used as the working electrodes (WE1 and WE2) and a saturated calomel electrode as the reference electrode (RE) [25]. Electrochemical current noise (ECN) was measured with a galvanic coupling current between two identical working electrodes. Simultaneously, electrochemical potential noise (EPN) was measured linking one of the working electrodes and a reference electrode. The current and potential electrochemical noise was monitored concerning each electrodes electrolyte combination under open circuit condition. For each EN measurement set, 1024 data points were obtained with a scanning rate of 1 datum/s. The current and potential time series were visually analyzed to interpret the signal transients and define the behavior of the frequency and amplitude of fluctuations as a function of time [40].
The DC trend signal was removed from the original EN signal by the polynomial method, and from signal without DC, statistical data (Rn, kurtosis, and skewness) were obtained. For PSD (power spectral density) data, a Hann window was applied before being transformed to the fast Fourier transform (FFT) frequency domain. Data analysis was processed with a program made in MATLAB 2018a software (Math Works, Natick, MA, USA).

3. Results

3.1. OM Microstructural Analysis

The initial samples microstructures were analyzed by optical microscope (OM). Ultimet® is a commercial alloy of Co-26Cr-9Ni wt.%. It has high tensile strength combined with excellent impact toughness, ductility, and resistance to wear and corrosion. HAYNES International, Inc. developed this superalloy.
Figure 2a shows the microstructure of Ultimet alloy in the as-received condition exhibited a single face-centered-cubic phase with relatively fine, uniform grains and annealing twins. As shown in Figure 2b, Waspaloy has a microstructure with a gamma (γ) austenitic matrix with a face-centered cubic (FCC) and twinned structure. There are also some gamma precipitates (γ′) coherent precipitation phase, as carbides located on the grain boundaries [41,42].
The grain size measurement was done using interception method in accordance with ASTM G112-13 standard [43]. The analysis of the interception method was using image analysis program (OLYMPUS STREAM ESSENTIALS version 1.9). In Figure 2c,d, the microstructures for Ultimet and Waspaloy according to ASTM show grain sizes of 3.82 and 4.01, respectively.
Careful control and optimization of the chemical composition permit developed microstructures with small and uniform grain limits to achieve maximum performance. Alloying elements affect the grain boundary as a function of manufacturing route or adopted heat treatment. This substantially implies the resulting microstructural array, and consequently attained properties, e.g., mechanical behavior, corrosion resistance, and other ones [44,45,46]. Grain boundary elements refer to carbides and borides, which form particles along the grain boundaries and cause strengthening [47].

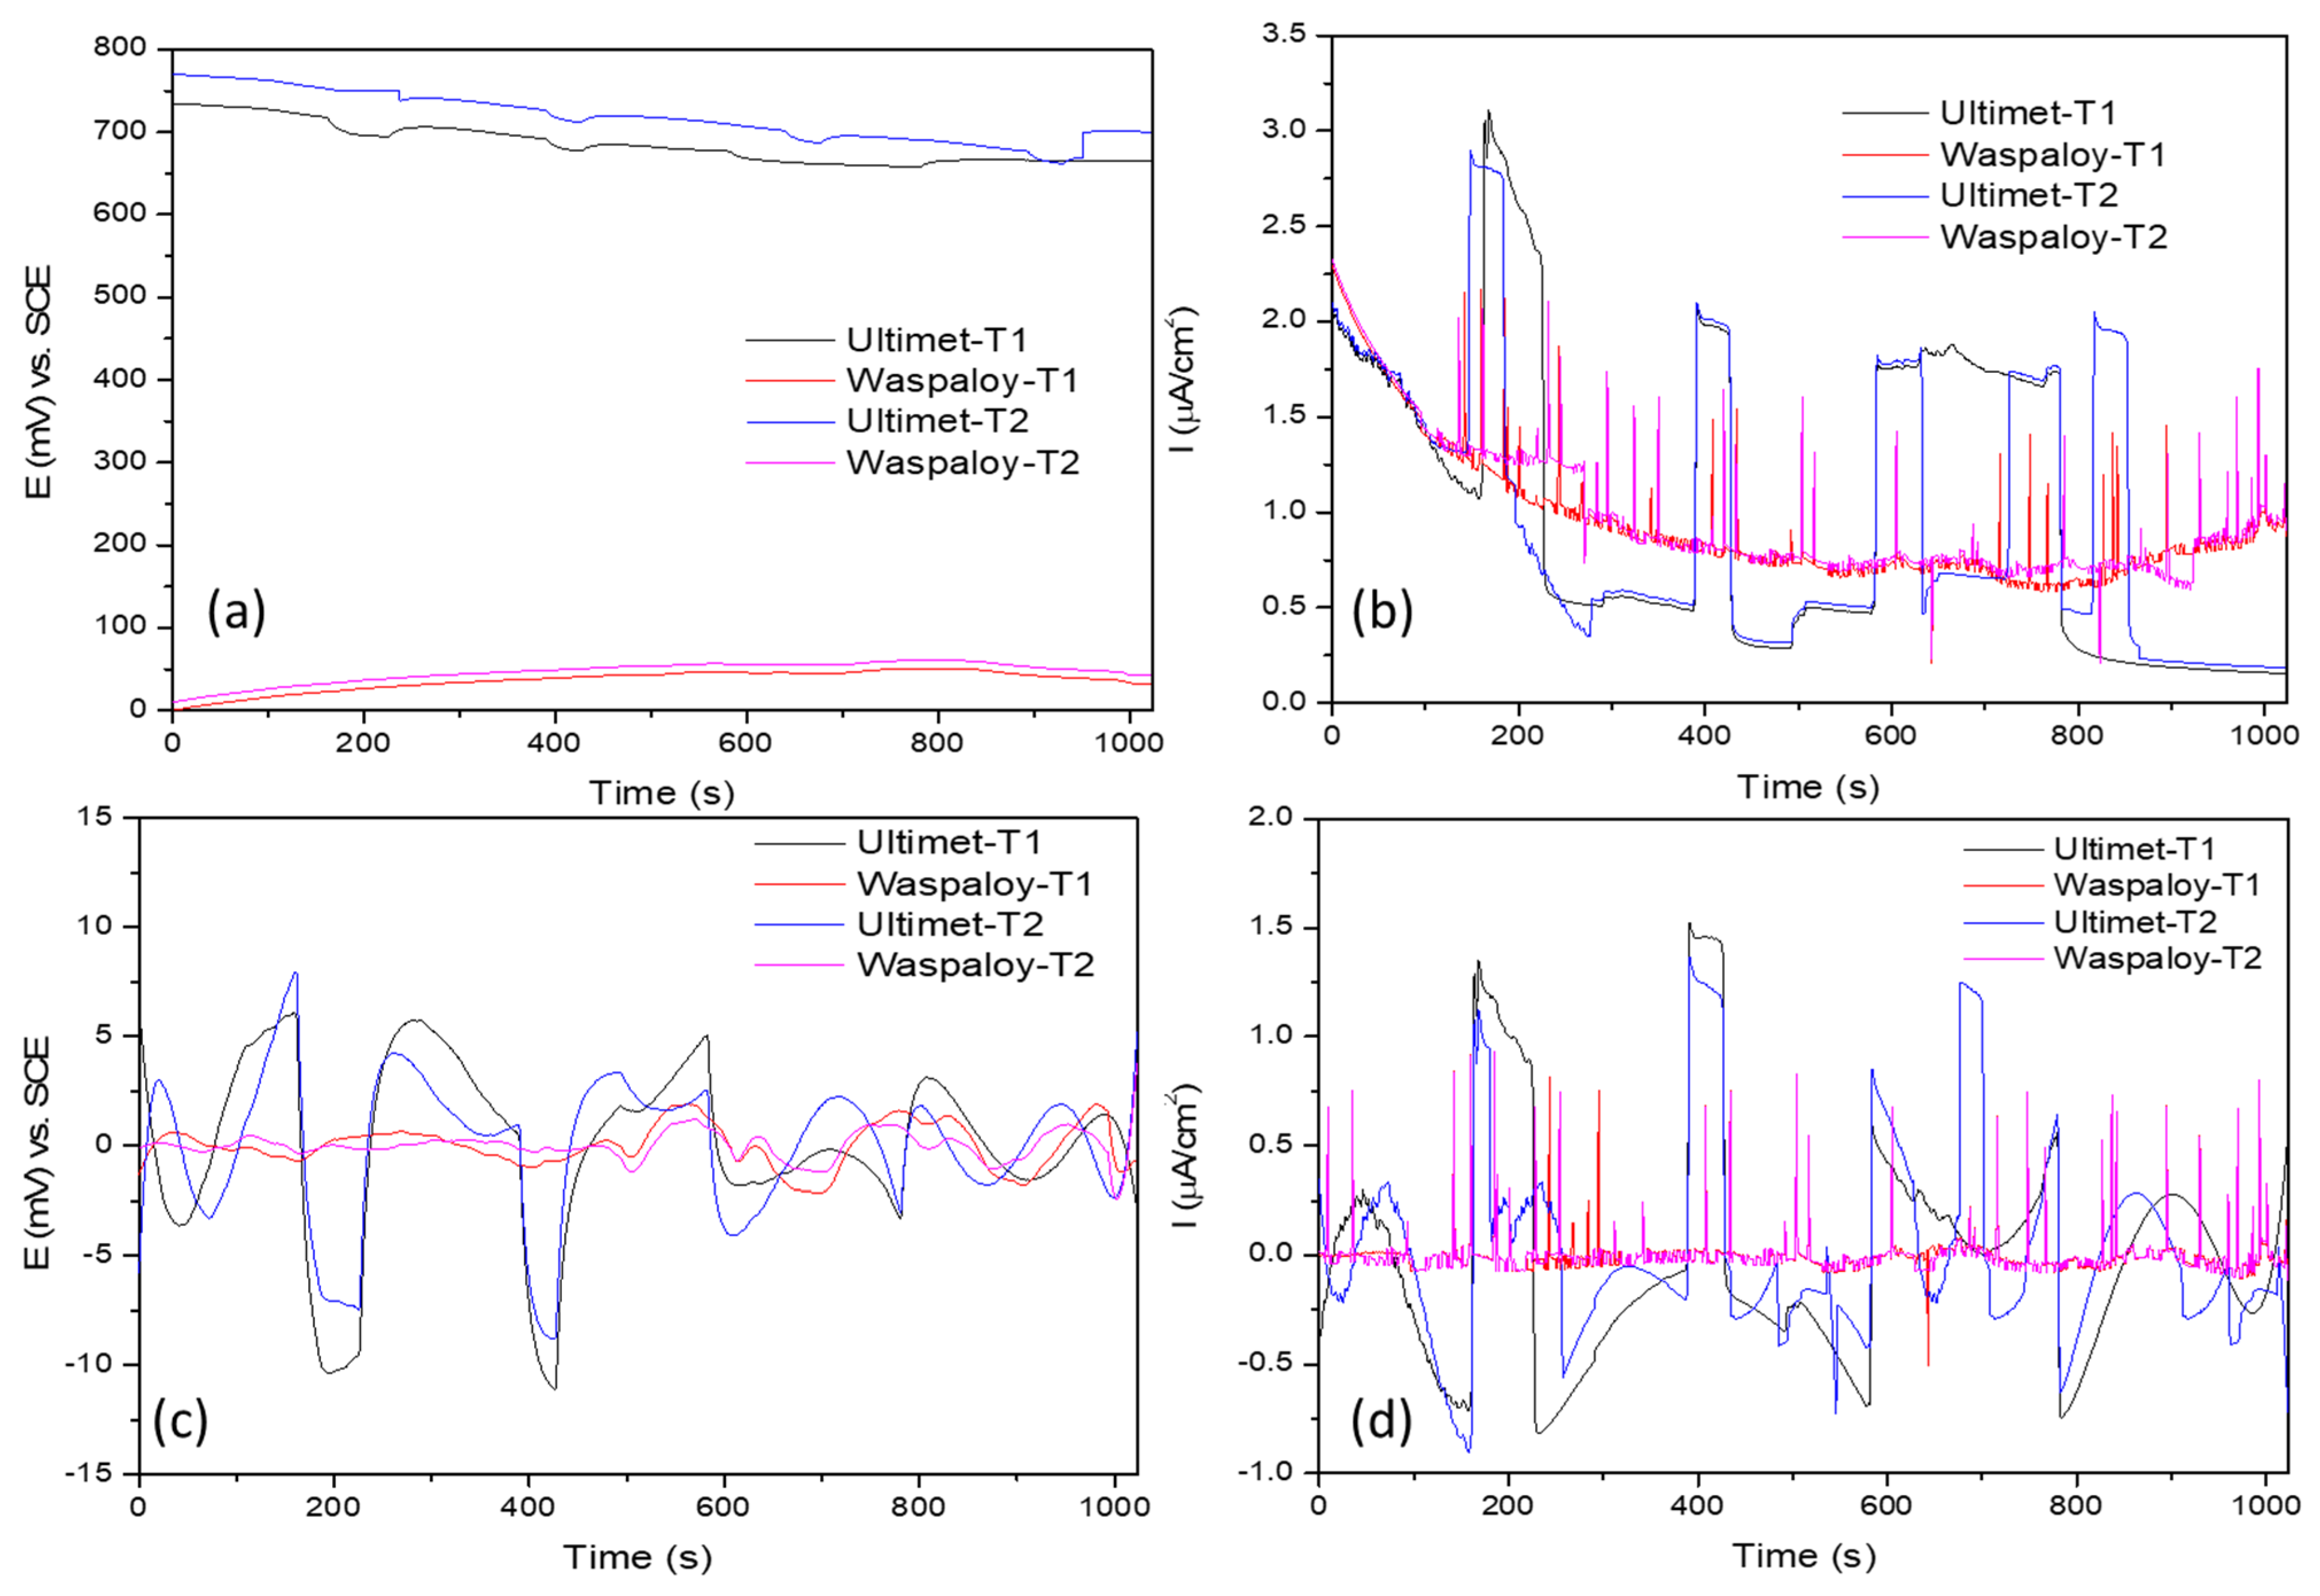
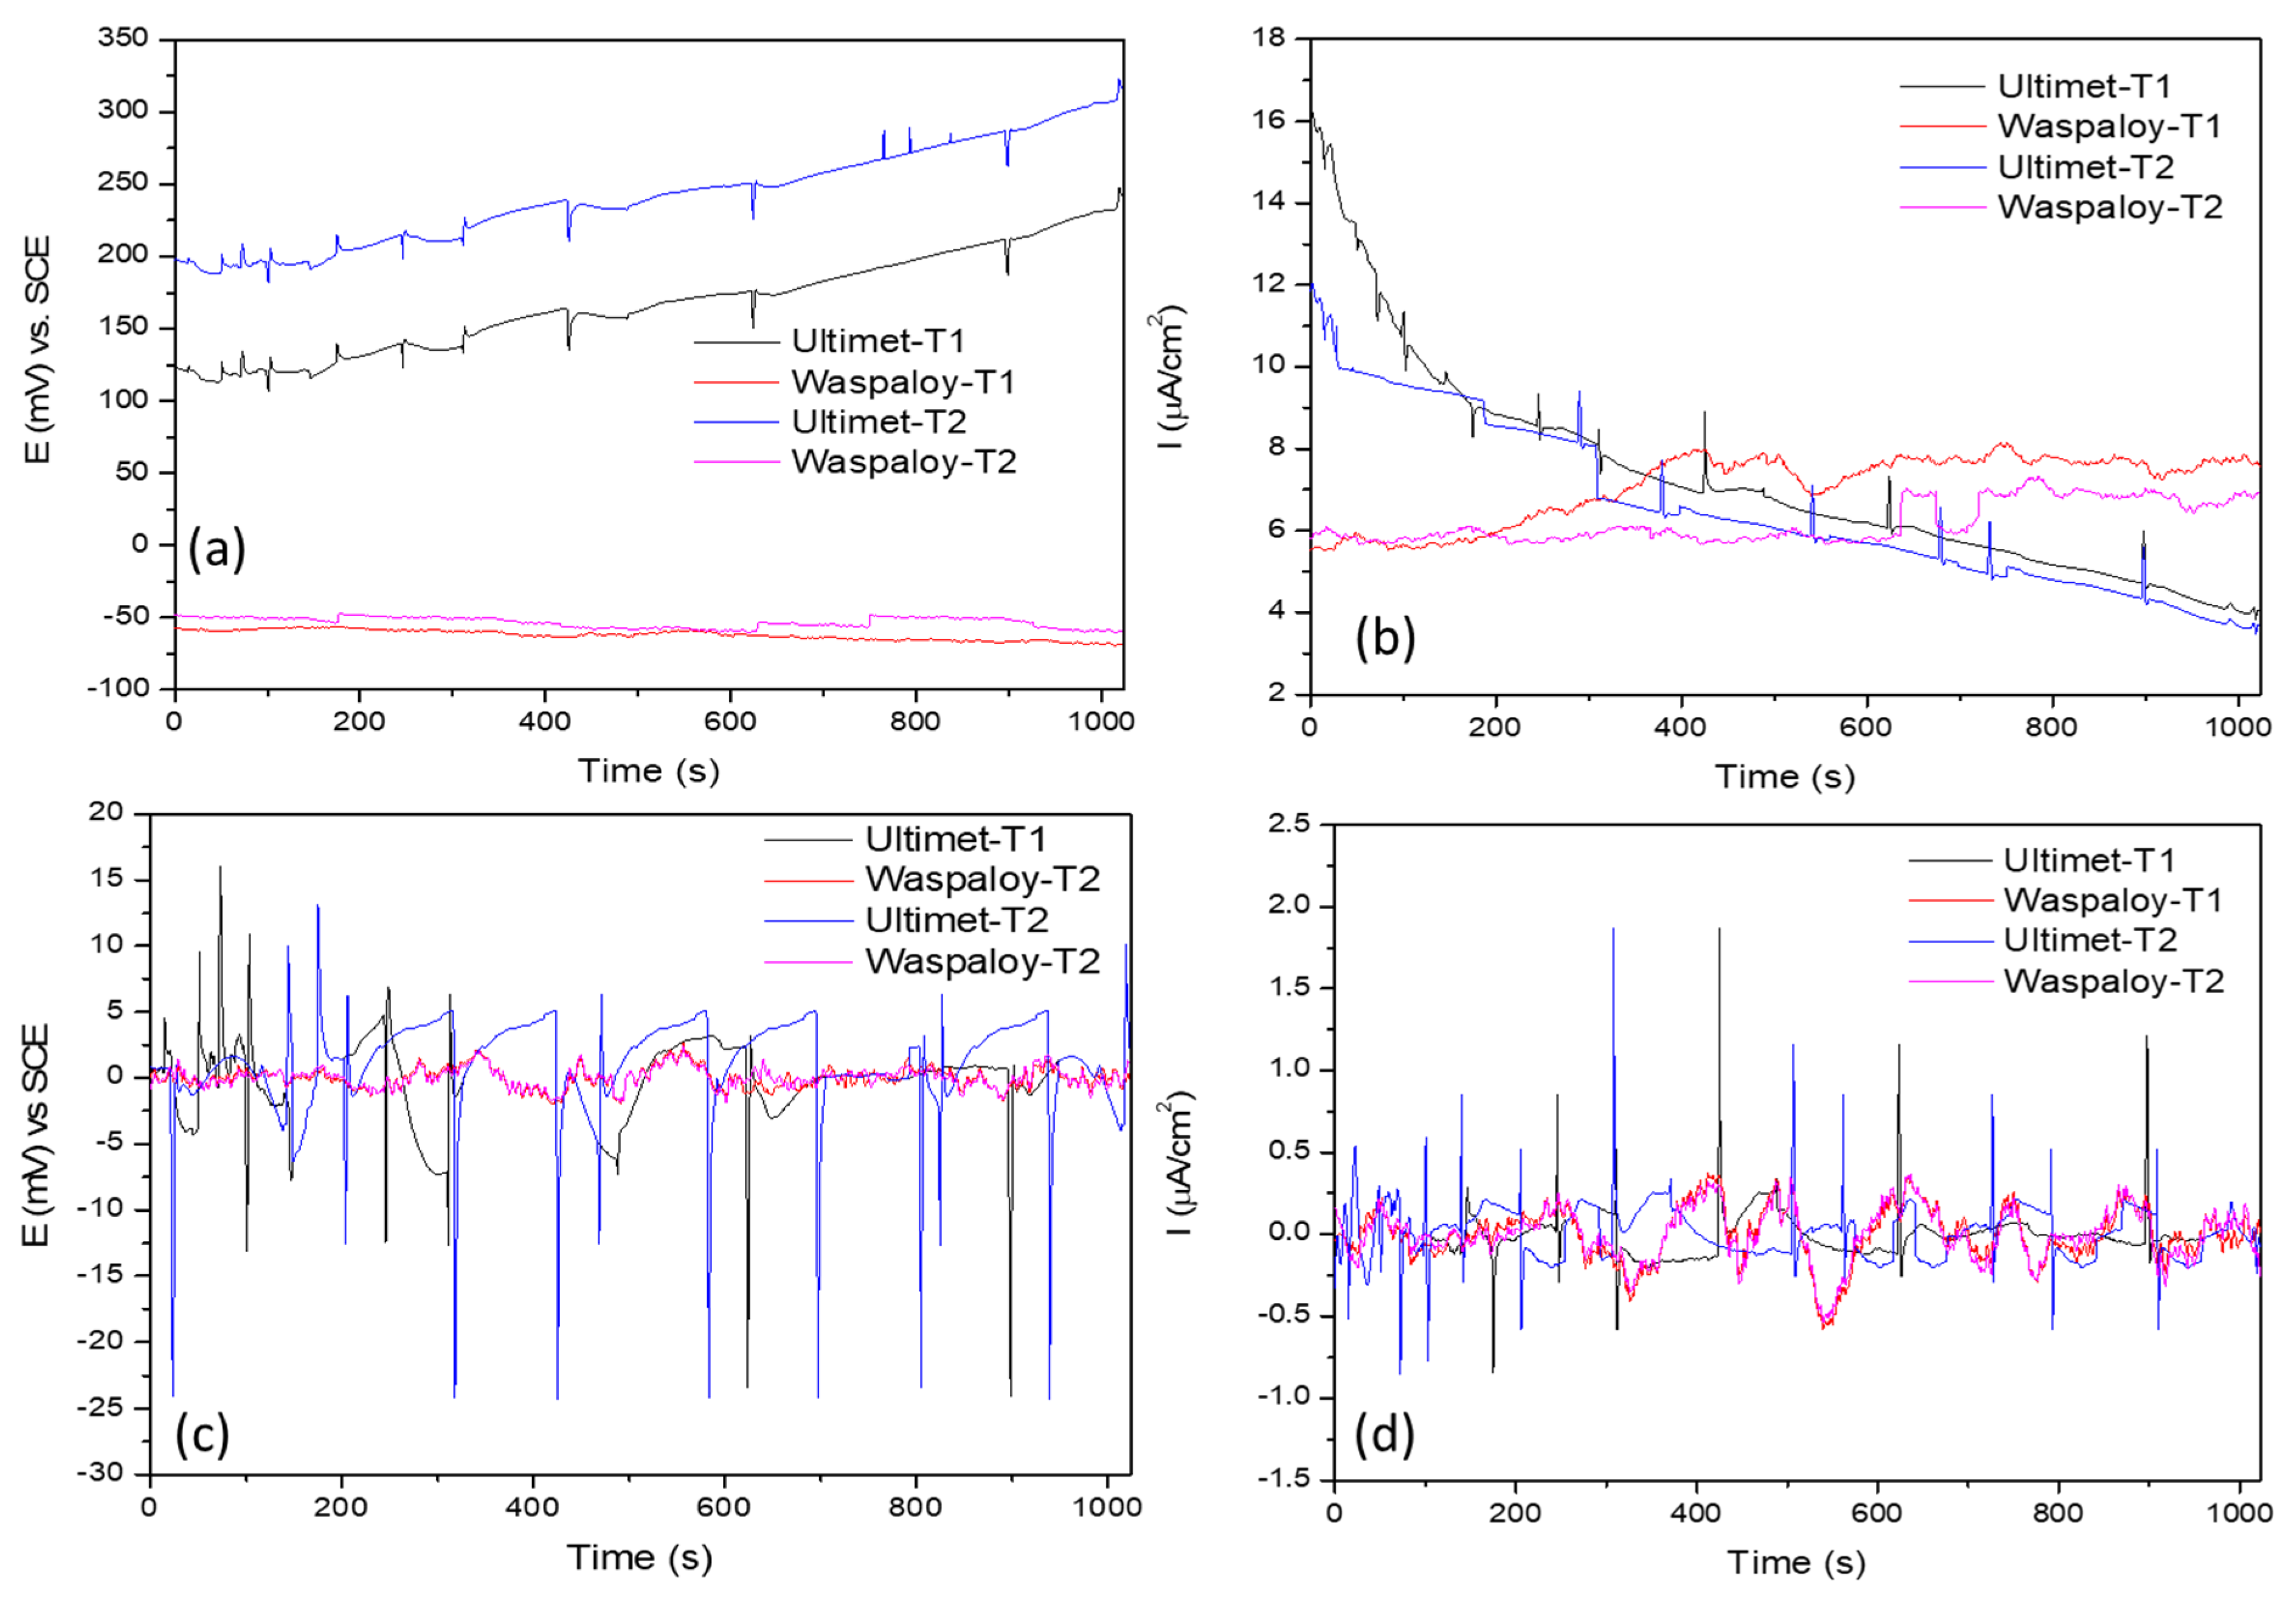
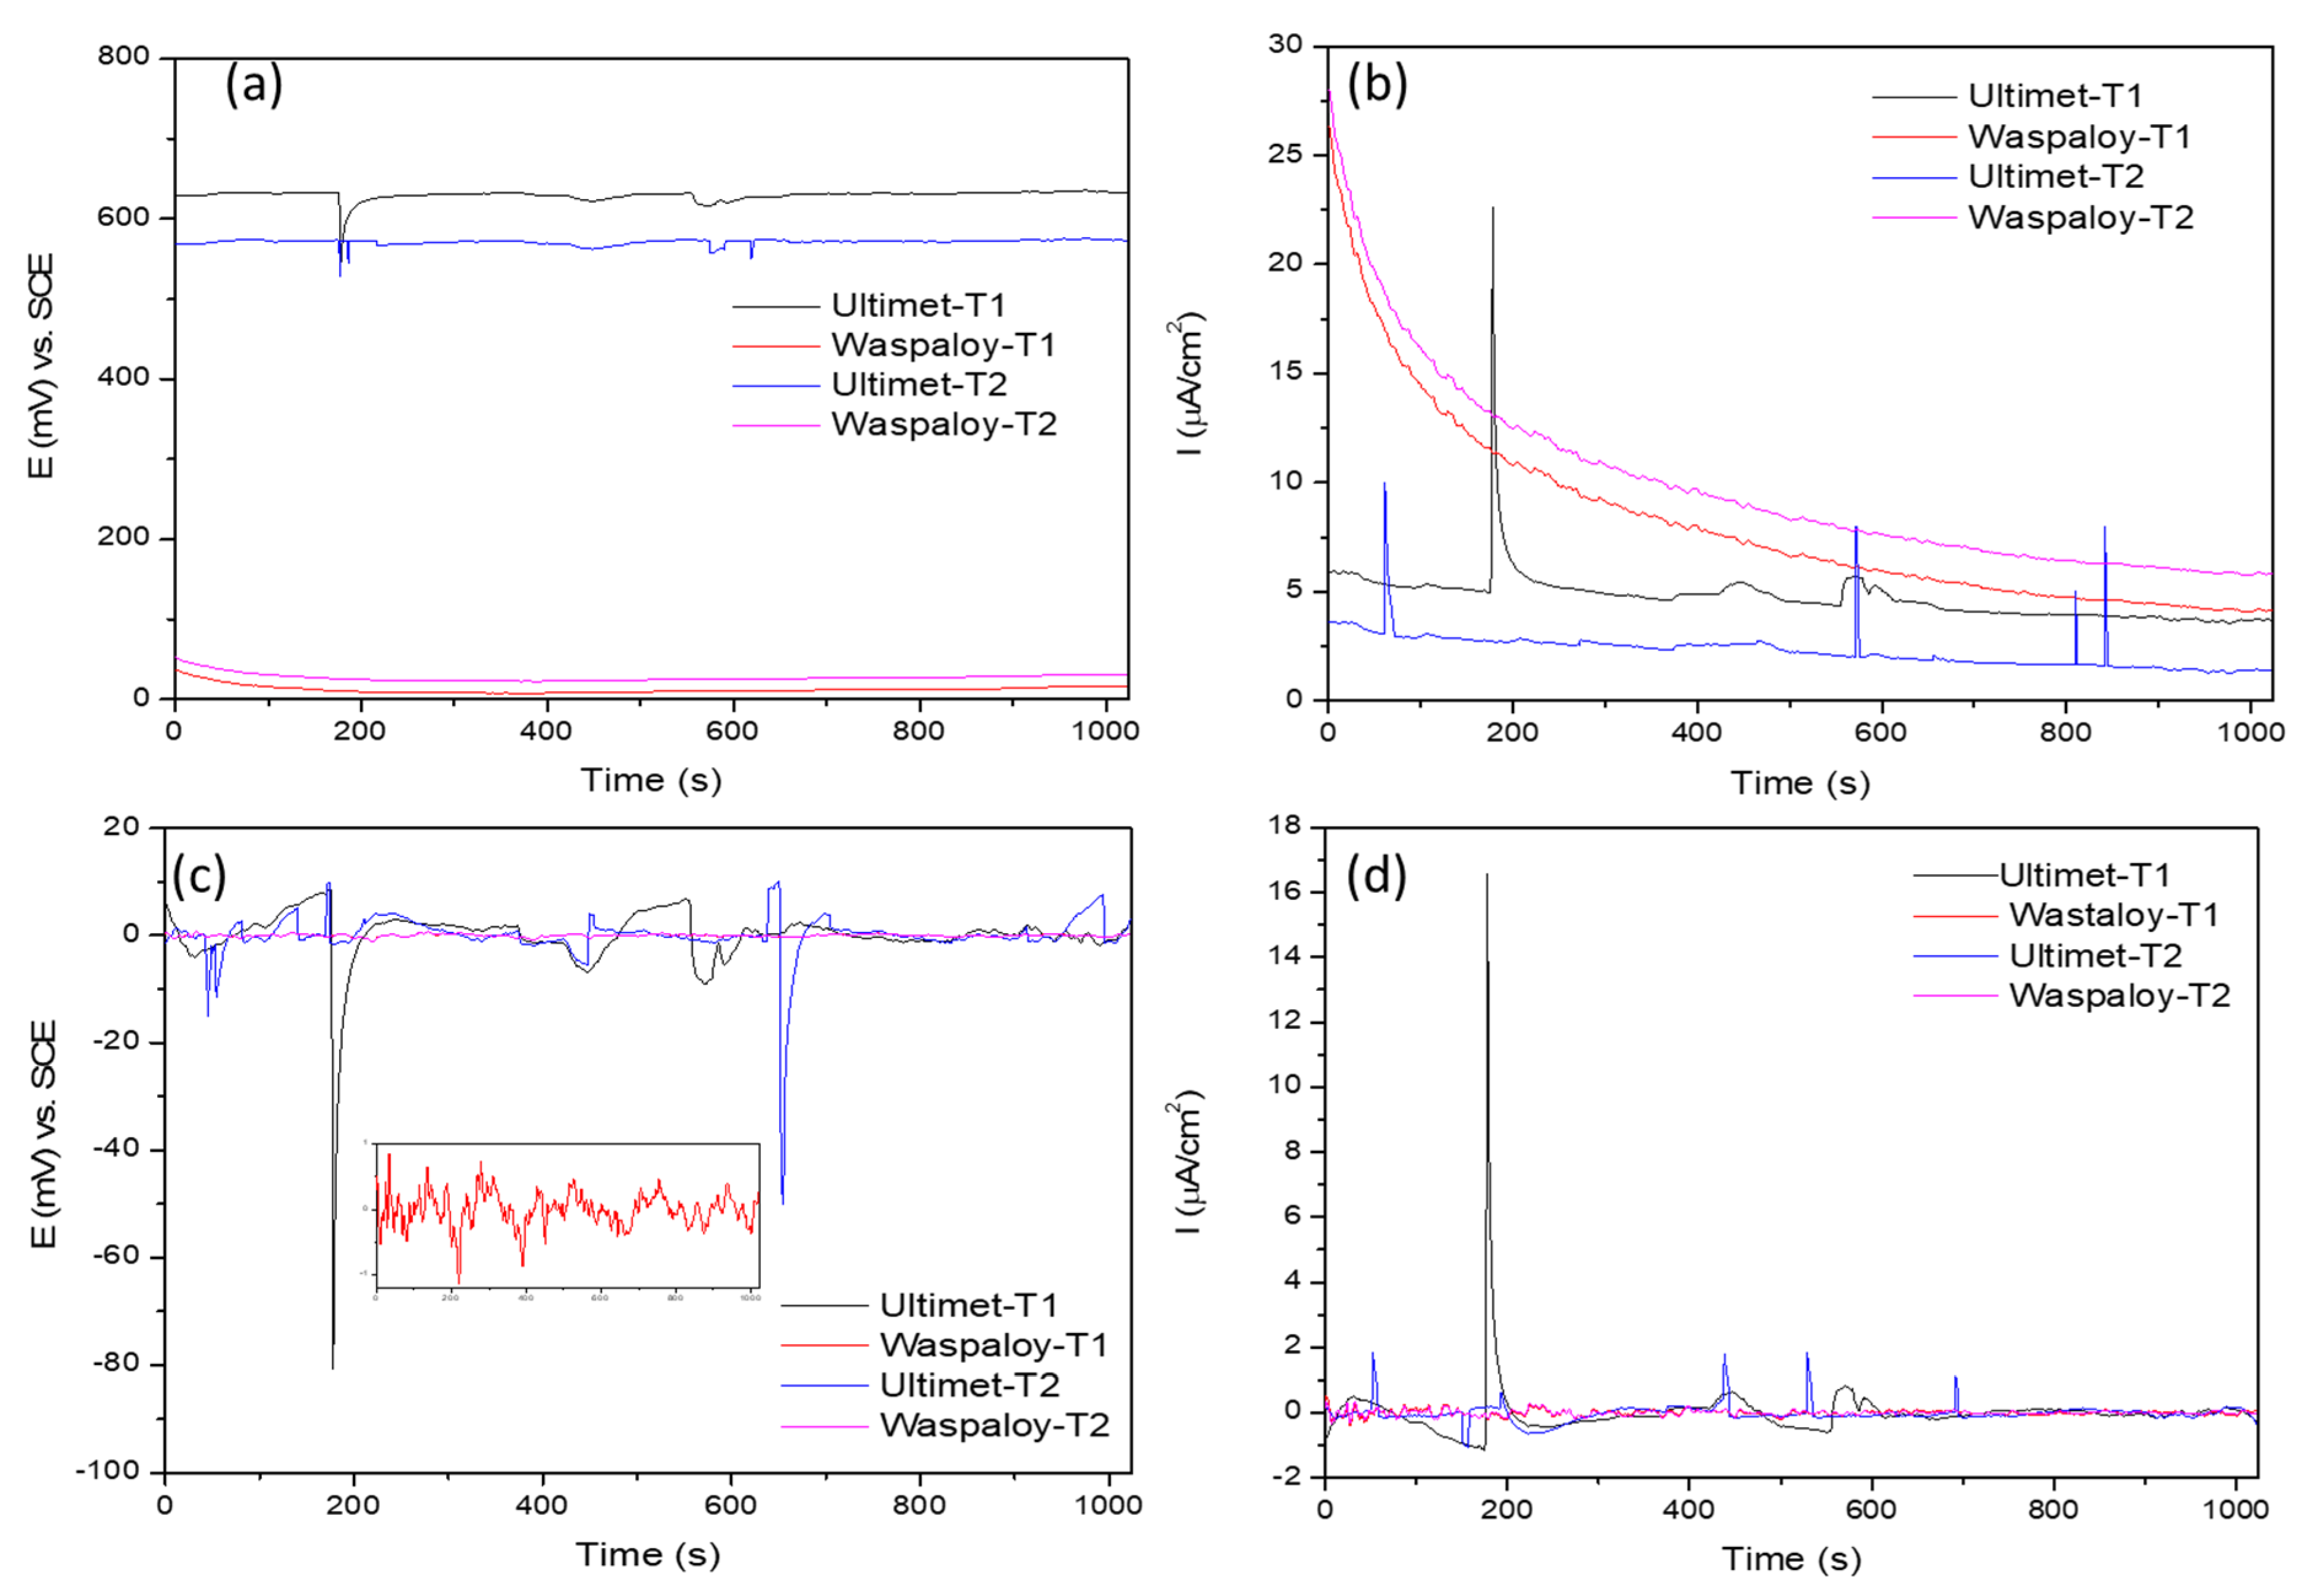
3.2. Electrochemical Noise (EN)

The EN signal was composed of random, stationary, and DC variables. It is necessary to separate DC from random and stationary components to analyze EN data because DC creates false frequencies and interferes in visual, statistical, and PSD analysis. In this way, when DC is removed, corrosion data presented at low frequencies are conserved [43,44,45,46,47,48,49]. In the EN time series, there are three components: DC signal, Random, and Stationary. The latter are the components that define the corrosion system [41]. The polynomial method defines the noise signal and polynomial of a grade at term in time to obtain a signal without trend [40,50,51,52].
Figure 3 shows EN signal from tests 1 and 2 of the superalloys in 3.5 wt.% NaCl solution at 25 °C. Figure 3a,b presents the signal with the trend. Here, 3a shows EPN signal, Ultimet presents nobler potential than Waspaloy, but in the time function, Ultimet potential goes to active potential, while Waspaloy goes to noble potential. In Figure 3b, the ECN Ultimet shows the fluctuation in current demand, and Waspaloy presents high-frequency anodic transients. Figure 3c,d present the signal with trend removal by the polynomial method. In Figure 3c, Ultimet T1/T2 shows fluctuations of 16 mV (−1 to 5 mV) amplitude, but it is not periodic. Waspaloy T1/T2 amplitude increase in time function with a maximum amplitude of 4 mV (−2 to 2 mV). For Figure 3d, Ultimet T1/T2 shows aggressive fluctuations of 2 µA/cm2 (−0.5 to 1.5), meaning an increase in current demand. Waspaloy T1/T2 presents anodic transients in all time-series of 1 µA/cm2 (0 to 1), which indicate the localization of corrosion phenomena.
Figure 4 presents the EN signal from tests 1 and 2 of the superalloys in 3.5 wt.% NaCl solution at 60 °C. EPN signal with the trend in Figure 4a shows that Ultimet T1/T2 is continuously presenting nobler potential (1250 to 1300 mV) than Waspaloy with 350 mV. In the ECN signal with the trend (4b), Ultimet and Waspaloy T1/T2 decrease current demand, but Waspaloy presents high amplitude transients. EPN (4c) shows that Waspaloy T1/T2 has fluctuations of −8 mV (−4 to 4) amplitude in the polynomial method’s signal filter. ECN (4d), Waspaloy T1/T2 presents anodic high amplitude transients 0.9 μA/cm2 (0.1 to 0.8). Meanwhile, Ultimet presents low amplitude fluctuations.
Figure 5 shows EN signal from tests 1 and 2 of the superalloys in 3.5 wt.% H2SO4 solution at 25 °C, Figure 5a,b present trend signal. In the EPN signal of Figure 4a Ultimet T1/T2 presents nobler potential, and along time it is continuously increasing potential values, but anodic transients occur in time series. Waspaloy presents more active potential (−57 mV), and the trend is to go to active potentials. Figure 5b shows the ECN signal, Ultimet current demand is reduced in time function with the anodic transient. Meanwhile, Waspaloy shows a trend to increase current demand. Figure 5c,d show the time-series with trend removal by the polynomial method. Ultimet T1/T2 shows anodic transients in EPN and ECN signals, presenting a reciprocal behavior between potential and current. Potential transients are 30 mV (−25 to 15 mV) maximum, and the current is 2 µA/cm2 (−1 to 1). Waspaloy T1/T2 shows fluctuations of −0.7 to 2 µA/cm2.
Figure 6 shows the EN signal from tests 1 and 2 of the superalloys in 3.5 wt.% H2SO4. Electrochemical current and potential noise-time series with DC figures (a) and (b), Ultimet T1/T2 have a nobler potential value than Waspaloy (from 30 to 630 mV, respectively) in Figure 6a. ECN (Figure 6b), Ultimate presents an anodic transient at the second 180. Waspaloy current demand decrease in time function. With trend removal in 6c and d, EPN (Figure 6c) shows a metastable transient for Ultimet T1/T2 of 90 mV (1 to 10) of amplitude. Waspaloy fluctuation is 2 mV of amplitude. ECN in Figure 6d shows Ultimet, the anodic transient of 17 μA/cm2 (−1 to 16). Meanwhile, Waspaloy T1/T2 presents a fluctuation of 0.8 μA/cm2 (−0.4 to 0.4)

3.2.1. Statistical Analysis

To determine noise resistance (Rn) is necessary to obtain standard deviation from time series values. These statistical values give corrosion kinetics and mechanism information. Cottis and Turgoose [37] found a relationship between the increase of variance and standard deviation with an increase in corrosion rate. For standard deviation, (σ) evaluation applying Equation (1) is required, by which Rn can be obtained (Equation (2)) from EN time series (EPN and ECN):
σ x = x 2 ¯ = 1 N ( x i x ¯ ) 2 N  
R n = σ v σ I A
where Rn and Rp are related, and the Stern–Geary equation (Equation (3)) can be applied as an analog relation between them to determine corrosion kinetically. B is a constant with a recommended value of 0.026 V for active and 0.052 V for the passive corrosion [14,15,50]:
R n = Β i c o r r = ( Δ E ) ( Δ i )    
Some authors related the EN signal’s statistical analysis with the metal surface’s corrosion process [30]. The Irms is obtained by Equation (4), where X is the average of EN data, n the data number, and σ the standard deviation:
r m s = X n 2 + σ 2
With standard deviation and Irms, localization index can be calculated:
L I = σ i I r m s
Values obtained can be associated with the system’s corrosion type (see Table 2) [19,51,52,53]. This research will take more parameters to determine the corrosion type.
This research employed kurtosis and skewness to try to define the corrosion type. Localization index (LI) was not considered because Mansfeld and Sun [54] in 1995 concluded that LI can present limitations and should be used with discretion. In 2001, Reid and Eden [55] developed a patent where they identified corrosion type based on statistical moments with skewness and kurtosis (Equations (6) and (7)), which are the 3rd and 4th statistical moments [54,55,56,57,58,59,60,61]:
S k e w n e s s = 1 N i = 1 N ( x i x ¯ ) 3 σ 3
K u r t o s i s = 1 N i = 1 N ( x i x ¯ ) 4 σ 4
Statistical calculations have a standard error (SE) that generates uncertainty in the results. The following equation can be provided, where N is the number of data studied [61]. Hence, when the data number is significant, the standard error will be lower than when the data number is high.
S E = 24 N
SE is 0.153; values obtained will take SE as a parameter of uncertainty. Corrosion type determined by kurtosis and skewness is shown in Table 3:
Kurtosis and skewness were applied to the ECN signal to determine the corrosion mechanism based on corrosion kinetic. Table 4 shows Rn, icorr, skewness, and kurtosis from EN signal filtered with a 9th-grade polynomial to remove DC signal.
Table 4 presents statistical results, with duplicates results (tests 1 and 2), where Waspaloy showed higher Rn values at 25 °C than at 60 °C. This means that resistance to corrosion of Waspaloy is lower when the temperature increases. Ultimet presents the same behavior in H2SO4, but in NaCl Rn increase with temperature, meaning that corrosion resistance increase. Ultimet alloy presented higher Rn values at 60 °C than Waspaloy in both electrolytes. However, at 25 °C, Waspaloy has higher Rn values than Ultimet. For LI, only Waspaloy at 60 °C in NaCl presented uniform corrosion, but kurtosis value corresponds to pitting corrosion (as in all samples). However, skewness present values corresponding to uniform corrosion. Ultimet at 25 °C shows the same behavior in both electrolytes with mixed corrosion, but skewness shows pitting corrosion.
Nevertheless, considering that SE was 0.153, skewness values of 1.04 and 1.01 are in-side of uncertain error, which can be considered a uniform process. This meaning that uniform and localized processes are occurring on the Ultimet surface. Waspaloy in NaCl at 60 °C presents the behavior previously described.
High kurtosis values can indicate instability or high amplitude transients in different distribution, provoking different processes on the metal surface [59].

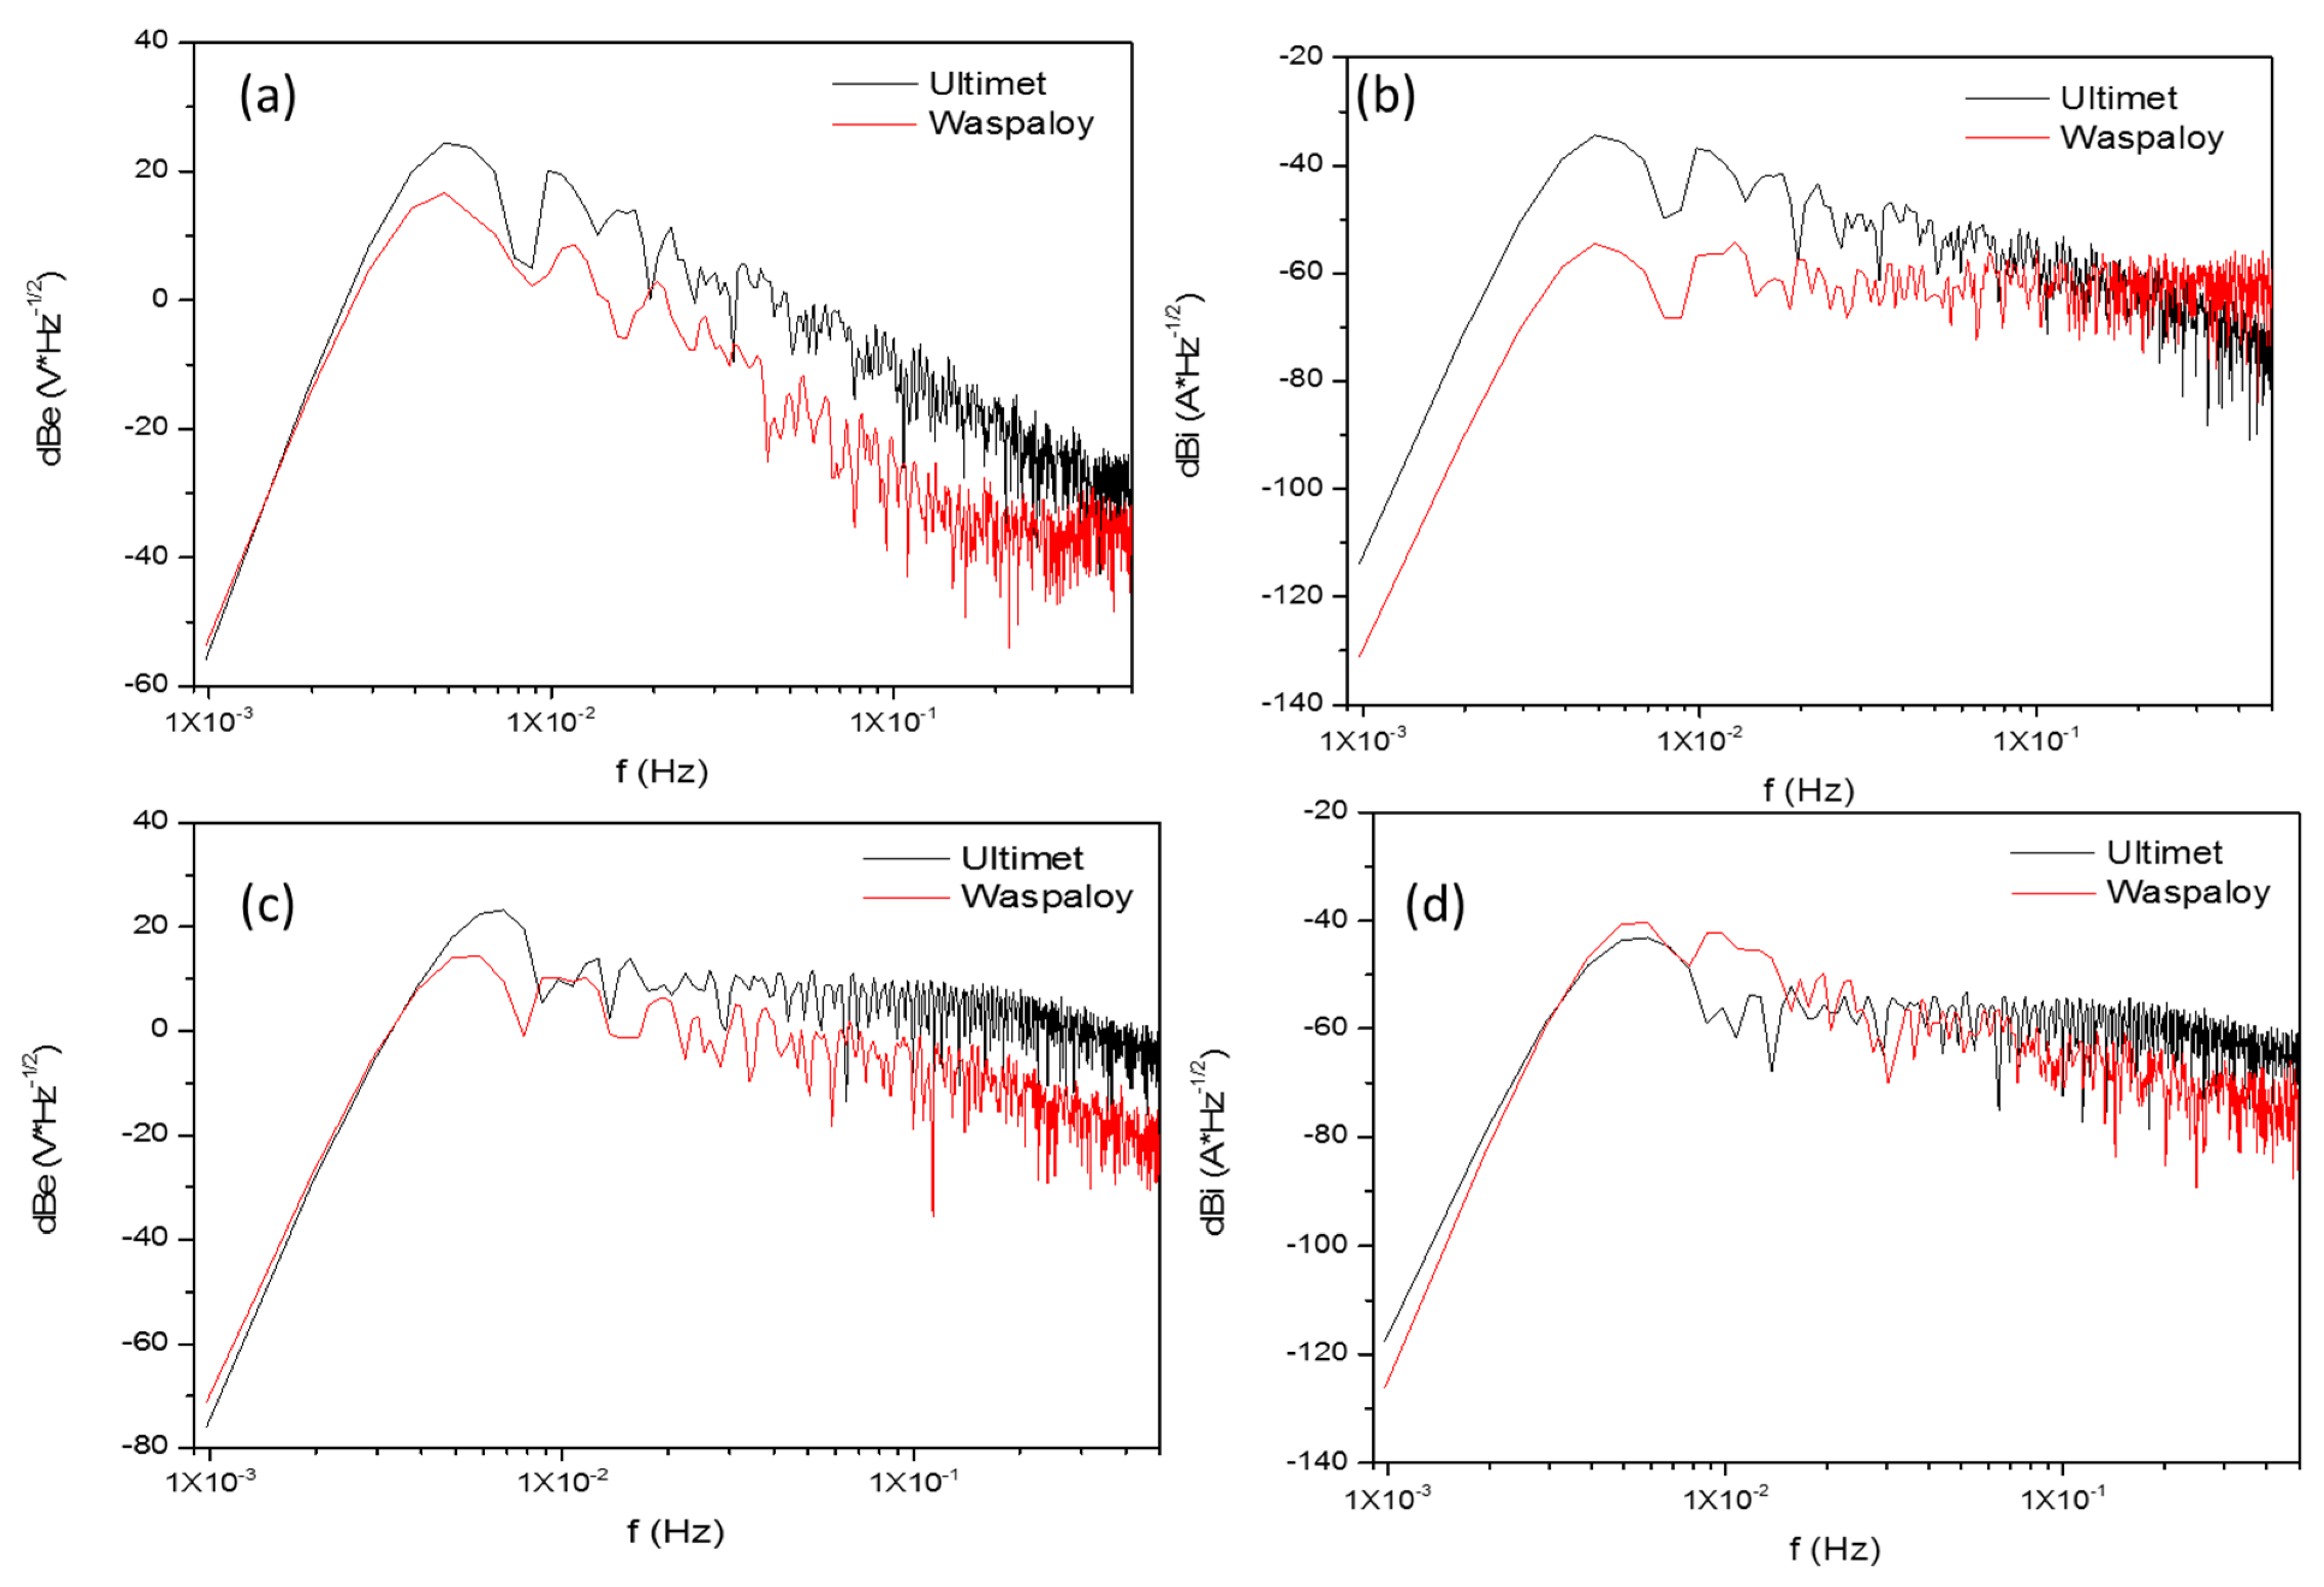
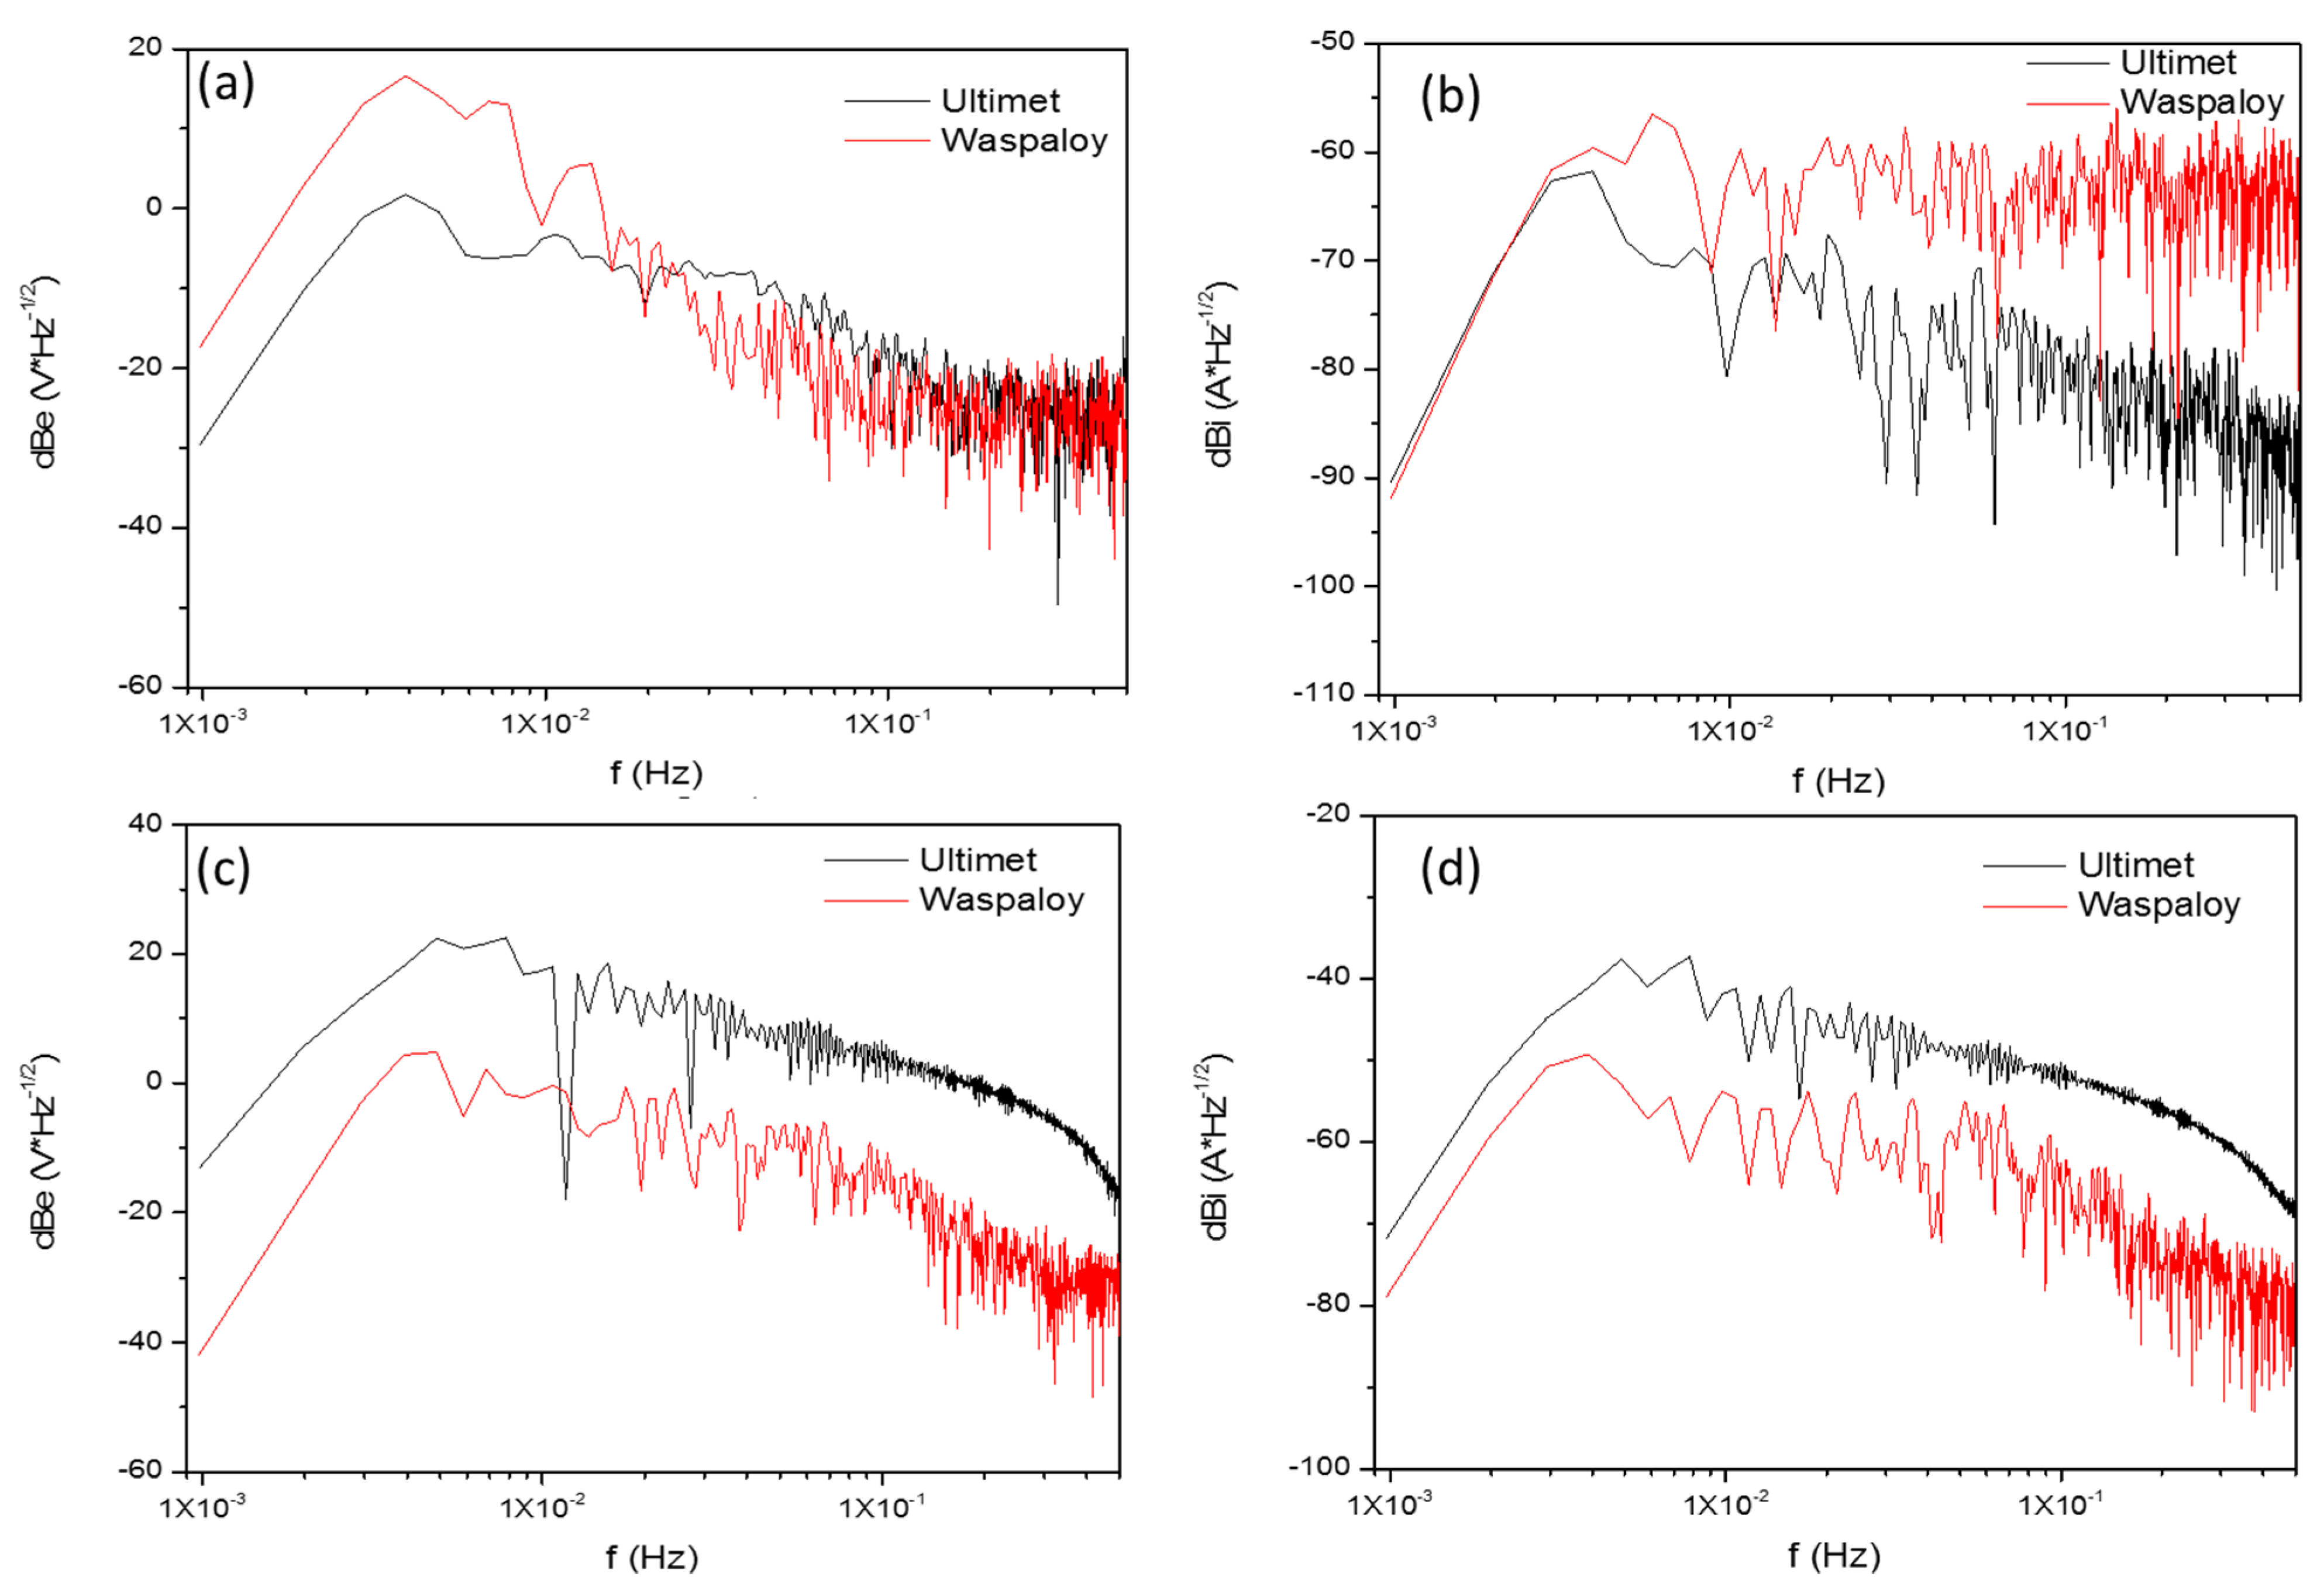
3.2.2. Power Spectral Density Analysis

For power spectral density (PSD) analysis, it is necessary to transform the time-domain EN to frequency-domain by applying FFT, since there is a correlation with EN signal (with a polynomial filter applied), after which spectral density is calculated with Equations (9) and (10) [60].
R x x ( m ) = 1 N n = 0 N m 1 x ( n ) · x ( n + m ) ,   when   values   are   from   0 < m < N
Ψ x ( k ) = γ · t m N · n = 1 N ( x n x ¯ n ) · e 2 π k n 2 N
The interpretation of PSD is based on limit frequency to cut frequency, with the cut frequency indicates when to begin and end a slope. A slope could be helpful to find the corrosion mechanism. Cut frequency gives information about sample representation after pitting [35,36]. The slope is defined by βx and is represented by Equation (11):
log Ψ x = β x log f
The frequency zero limit (Ψ0) gives material dissolution information because PSD is related to the total energy present in the system [22]. It is essential to clarify that material dissolution is only present in the current PSD [56,57]. The following table was proposed by Mansfeld et al. [54] in 1999 to determine the corrosion phenomena occurring on the material surface. This table is adapted to decibels (see Table 5) [60,61]. Results of Table 6 show the parameters obtained from the first test because experiments have not presented many variations.
Figure 7a,b show PSD in NaCl at 25 °C, Ultimet slope values in voltage and current are of −10.4 dB (V) and −7.5 dB (A), it can be associated with localized corrosion. At 60 °C, the behavior is similar for Ultimet. Waspaloy presents passivation values of slope (1.4 dB (A)) at 25 °C (see Figure 7d). The values of Ψ0 show similar values for Ultimet and Waspaloy at both temperatures. However, at 60 °C, the dissolution of the material is higher (see Table 6).
Figure 8 shows PSD plots in H2SO4 for both superalloys. Here, 7a Ultimet and Waspaloy present B values of −22.9 and 20.4 dB (V) respectively (see Table 6), where such values are related with passive and pitting values that accord with Table 5. Current B values indicate that Ultimet presents pitting corrosion (−15.6 dB (A)). Meanwhile, Waspaloy shows a slope of 1.5, and positive values are associated with passivation. Waspaloy presents a lower Ψ0 value of -91 dBi, and Ultimet has −72.2 dBi. Those results indicate that Ultimate presents a higher material dissolution than Waspaloy in NaCl at 25 °C.
At 60 °C in NaCl (Figure 8c,d) slope values of Ultimet in potential and current reflects uniform corrosion (−6.1 dB (A) and −4 dB (V)) and Waspaloy shows values of −13 dB (V) and −11.4 dB (A) associated with pitting. Ψ0 values of Waspaloy and Ultimet are very close (−82.3 and −78.7 dBi). Material dissolution is lower at 60 °C for Ultimet.
The results concerning type and corrosion mechanisms presented some uncertainty for slope analysis [60,61,62]. For that reason, slope values present limitations to determine the type of corrosion in superalloys.

3.2.3. Noise Impedance (Zn)

The noise impedance, Zn (f), also called spectral noise resistance, is defined as [63,64]:
Z n = ψ V ( f ) ψ I ( f )
Zn is calculated by the square root of the PSD division of potential and current [56,64]. The electrochemical noise impedance is related to the corrosion resistance, and the inverse is related to conductance and corrosion rate [65,66].
Figure 9 shows the spectral noise resistance for each media. Table 7 presents results of spectral noise resistance for each media and different temperatures. All samples presented a reduction of Zn when frequency increases. Some researchers associated the Zn with corrosion rate, associated with Ψ0, and Rn [49,61]. In this research, Ψ0 values presented more relation with Zn. Moreover, systems where they are divergent occur where Ψ0 are nearly values (H2SO4 at 60 °C). Waspaloy presented a passivation behavior in the spectral noise resistance (as well as in potential slope).

4. Discussion

Jing mentioned in further research [41,42,67,68,69] that Ultimet presents a single face-centered-cubic phase with relatively fine, uniform grains (size from 50 to 250 µm) and annealing twins. At higher magnification, it presents a widmanstatten morphology. It was related to the heat-treated condition of material and partial dislocations provoking misorientation [69,70]. Kelekanjeri et al. [71] reported that the Waspaloy surface’s porosities were due to chemical attack and not by precipitates presence. This indicates that the material has been aging.
The critical aspect of superalloys is their microstructure. The high-temperature strength is based on a stable face-centered cubic (FCC) matrix combined with either precipitation strengthening (age-hardenable) and/or solid solution hardening. In age hardenable nickel-based superalloys, the γ′ intermetallic (Ni3, Al, Ti) is generally present for strengthening. The non-hardenable nickel-, cobalt-, and iron-based superalloys rely on solid-solution strengthening of the FCC (γ) matrix. Cobalt-based superalloys may develop some precipitation strengthening from carbides (Cr7C3, M23C6). No intermetallic phase is strengthening equal to γ′ strengthening in nickel-base alloys [72,73].
The mechanical, thermal, and microstructure stability of superalloys depend on alloying elements and their concentrations. The design strategy is stabilizing the compositions, microstructures, and thermal-mechanical properties [74,75]. Some alloying elements stabilize the control of the microstructural and mechanical properties of superalloys. These elements are divided into four categories according to their main effects on these properties: comprising base elements, mechanical strengthening elements, long-term stability elements, and the oxidation resistance elements (for example, Al and Cr may strengthen the alloy matrix and improve oxidation resistance).
The corrosion behavior of a Cobalt-Tungsten-Carbon alloy using potentiodynamic and potentiostatic polarization techniques in 0.5 M sulfuric acid, at room temperature, was studied by Hume et al. [76]. They demonstrated that the additions of Tungsten (>8 wt.%) and Carbon (>0.15 wt.%) influence the corrosion behavior of the alloy. With increasing additions of tungsten and carbon, the corrosion current density and the critical current density were reduced. The corrosion potential shifted to more positive values with increasing additions. In this type of study, it can be observed how the alloying elements influence.
Some research [25,26,27,28,29,30,36,37,53,54,55,56,57,58] indicates that Several EN procedures correlating time-dependent fluctuation of current and potential during the corrosion process have been used to indicate the type of corrosion occurring. For instance, it is well recognized that the primary source of electrochemical noise is the passive film breakdown process and repassivation process. This is crucial to superalloy behavior with aeronautical applications. Since this type of structural component is exposed to different industrial and marine atmospheres.
Electrochemical noise cathodic and anodic reactions cause changes in material surfaces: when superalloys are exposed to aqueous solutions, independently of the mix, the hydrogen will react by an evolution reaction, given by the following chemical reaction:
2 H + + 2 e H 2
Less information about the behavior of superalloys at 25 and 60 °C degree has been developed. Almost all information employs potentiodynamic polarization and Tafel analysis. In EN, the transients amplitude is related to the size of the pitting nucleation of the pitting and the frequency with localized corrosion.
Some other workers have attributed the transients to the reduction of some species present in the solution. The transients presented in time series of potential and current characteristics of pitting nucleation or metastable pitting [19,24,36,52,53].
Kup [77] analyzed the alloying effect on several superalloys’ corrosion behavior with Mo, Ni, and Al. They used the potentiodynamic polarization technique in 3 wt.% NaCl solution. Their conclusions were the percentage of Mo, Al, and Ni play an essential role in inhibiting corrosion. In the linear sweep, voltammograms showed that the free corrosion potentials become more hostile as de Mo content increases. Ting [78] applied an aging treatment to a 718 nickel-base alloy with previous finishing treatments. The finishing process modifies the pitting corrosion resistance because it affects the surface the stresses condition.
Electrochemical noise gives mechanistic information about corrosion systems employing statistical methods. However, authors as Mansfeld and Eden [52,54] suggest that LI should be used with discretion to determine the type of corrosion. For that reason, this research employed different methods to determine the corrosion type. Eden and various researchers [35,36,50,51] propose kurtosis and skewness to analyze corrosion systems. Xia et al. [28] mentioned that kurtosis and skewness could be used to determine the shape of the distribution and transients’ peaks. The skewness helps determine the phenomenon of the corrosion system. If it is positive (for ECN), this indicates a predominance of anodic transients, whereas if it is negative, this indicates a predominance of cathodic transients. Moreover, Xia [29] mentioned that it presents a higher standard error. This error can be reduced by increasing the number of data acquired.
Similar results to those previously presented were shown, and these converged with LI and skewness results. Razavi et al. [79] founded that Waspaloy in 3.5 wt.% NaCl with PPC presented pitting corrosion but with a passivation tendency between 0 and 473 mV. Pan et al. [80] concluded that K38C Ni-based superalloy presents passivation, but pitting occurs at the final stage. Pan’s results accord with results obtained here and in Razavi’s research and given Ni superalloys behavior, the work of Zhang and Ma [81,82]
The importance of analyzing the current and potential transients using high polynomials allows obtaining better results in superalloys behavior. Gaona et al. [25,30] study localized corrosion in Ni-based superalloys at room temperature using electrochemical noise (localization index (LI) and noise resistance), in 10 wt.% H2SO4 and CH3COOH solutions. The difference in results could be attributed to acid concentration and type of data processing. The employment of a low polynomials grade to filter signals or not using a filter provokes a variation in standard deviation, and results could be uncertain. Nickel-based superalloys have an excellent response to low-temperature corrosion but tend to localize corrosion in the electrolyte tested.
The study of superalloys electrochemical behavior at room temperature is important, and even more so, few works are using the electrochemical noise technique. Klein and Virtanen [83] studied a new γ/γ’-strengthened Co-based superalloy in comparison with pure Co at room temperature in 1 M Na2SO4 (pH 5.9) and 0.1 M NaOH (pH 12.8) aqueous solutions. Electrochemical impedance spectroscopy and potentiodynamic polarization determine that electrochemical behavior presented passivation in acid environments, and Si as alloying element considerably increases the corrosion resistance.
PSD gives essential information about material dissolution that could be compared with Rn results. The Ψ0 showed similar results in that Rn, Ultimet showed in NaCl higher values of resistance at 60 °C than at 25 °C (2.12 × 10⁴ and 7.58 × 10³ Ω·cm2), indicating that corrosion resistance is higher at 60 °C. This result is related with Ψ0 where Ultimet showed −72.2 dBi at 25 °C and −78.7 dBi at 60 °C, so that dissolution will be higher at 25 °C in NaCl. This behavior is present in other research with different materials [24,55], denoting that Rn and Ψ0 can be considered counterpart parameters to determine corrosion resistance. However, to analyze the type of corrosion, slope parameters divergent from statistical parameters, they cannot be considered mechanistic [84,85]. For this type of alloy, slope parameters should be employed with discretion.
This research agrees with diverse authors in Zn use and relation with Rn and corrosion kinetics [27,28,55,86,87]. Moreover, Zn results can be associated with Ψ0 (material degradation), so all parameters can be related to corrosion rate.

5. Conclusions

After studying the frequency analysis of transients by electrochemical noise of two superalloys (Waspaloy and Ultimet), immersed at 3.5 wt.% in H2SO4 and NaCl solutions at two different temperatures, 25 and 60 °C:
  • Results indicated that, after trend removal, EN signals conserved transients and fluctuation behavior and gave practical corrosion information for removing DC. The standard deviation of ECN and the noise resistance have direct relationships with the corrosion rate.
  • Statistical analysis (time-domain) and PSD (frequency domain) results showed that NaCl Ultimet presents higher corrosion resistance at 60 °C than at 25 °C.
  • In NaCl at 25 °C, Ultimet and Waspaloy presented localized corrosion, and at 60 °C mixed. Furthermore, in H2SO4 at 60 °C, Waspaloy presented uniform corrosion by LI evaluation parameter. Skewness showed the same result.
  • When skewness is negative, it indicates a significant predominance of cathodic transients.
  • EN results show that Rn and Ψ0 parameters should be considered as a counterpart to calculate the corrosion resistance of materials.
  • For this type of superalloy, LI and skewness are more practical to determine corrosion than PSD slope.
  • High kurtosis values are associated with a chaotic system.
  • The discordance of statistical results could be related to developing a different corrosion process on the surface. When LI indicates mixed corrosion and skewness uniform corrosion, it suggests that localized and uniform corrosion occurs on the surface, but uniform corrosion is the predominant system.
  • To reduce uncertainty created by a standard error in the calculation of kurtosis and skewness, it is necessary to increase the number of data acquired for EN characterization.

Author Contributions

Conceptualization, F.A.-C., J.M.J.-M. and C.G.-T.; methodology, J.C.-M., L.D.L.-L., J.O.-C., F.E.-L. and C.G.-T.; data curation, F.A.-C., J.M.J.-M., E.M.-B., D.N.-M., J.O.-C. and J.C.-N.; formal analysis, F.A.-C., J.M.J.-M. and C.G.-T.; writing—review and editing, F.A.-C., J.M.J.-M. and C.G.-T. All authors have read and agreed to the published version of the manuscript.

Funding

This research was funded by the Mexican National Council for Science and Technology (CONACYT) of the projects CB 253272, A1-S-8882 and the Universidad Autónoma de Nuevo León (UANL).

Institutional Review Board Statement

Not applicable.

Informed Consent Statement

Not applicable.

Data Availability Statement

The data presented in this study are available on request from the corresponding author.

Acknowledgments

The authors acknowledge The Academic Body UANL—CA-316 “Deterioration and integrity of composite materials”and Miguel Esneider.

Conflicts of Interest

The authors declare no conflict of interest.

References

  1. Gialanella, S.; Malandruccolo, A. Aerospace Alloys, 1st ed.; Springer: Cham, Switzerland, 2020; pp. 129–189. [Google Scholar]
  2. Mouritz, P.A. Introduction to Aerospace Materials; Woodhead Publishing: Cambridge, UK, 2012; pp. 202–223. [Google Scholar]
  3. Osoba, L.O.; Oladoye, A.M.; Ogbonna, V.E. Corrosion evaluation of superalloys Haynes 282 and Inconel 718 in Hydrichloric acid. J. Alloys Compd. 2019, 5, 376–384. [Google Scholar] [CrossRef]
  4. Reed, C.R. The Superalloys Fundamentals and Applications; Cambridge University Press: Edinburg, UK, 2006. [Google Scholar]
  5. ASM International. Heat-Resistant Materials; ASM International, ASM Specialty Handbook; ASM International: Almere, The Netherlands, 1997; p. 255. [Google Scholar]
  6. Simon, H.; Thoma, M. Attack on superalloys by chemical and electrolytic processes. Aircr. Eng. Aerosp. Tec. 1981, 53, 10. [Google Scholar] [CrossRef]
  7. Geddes, B.; León, H.; Huang, X. Superalloys Alloying and Performance; ASM International: Materials Park Ohio, OH, USA, 2010. [Google Scholar]
  8. Akandea, I.G.; Oluwolea, O.O.; Fayomib, O.S.I.; Odunlamic, O.A. Overview of mechanical, microstructural, oxidation properties and high-temperature applications of superalloys. Mater. Today Proc. 2021. [Google Scholar] [CrossRef]
  9. Donachie, J.M.; Donachie, J.S. Superalloys a Technical Guide; ASM International: Materials Park Ohio, OH, USA, 2002. [Google Scholar]
  10. Sims, C.T.; Stoloff, N.S.; Hagel, W.S. Superalloys: Genesis and Character, Superalloys II; John Wiley & Sons: Hoboken, NJ, USA, 1987. [Google Scholar]
  11. Maebashi, T.; Doi, M. Coarsening behaviours of coherent γ′ and γ precipitates in elastically constrained Ni–Al–Ti alloys. Mater. Sci. Eng. A 2004, 373, 72–79. [Google Scholar] [CrossRef]
  12. Murata, Y.; Suga, K.; Yukawa, N. Effect of transition elements on the properties of MC carbides in IN-100 nickel-based superalloy. J. Mater. Sci. 1986, 21, 3653–3660. [Google Scholar] [CrossRef]
  13. Beltran, A.M.; Sims, C.T.; Stoloff, N.S.; Hagel, W.C. Superalloys II; John Wiley & Sons: Hoboken, NJ, USA, 1987. [Google Scholar]
  14. Stern, M.; Geary, A.L. Electrochemical polarization. I. A theoretical analysis of the shape of the polarization curves. J. Electrochem. Soc. 1957, 104, 56–63. [Google Scholar] [CrossRef]
  15. Pellegrini-Cervantes, M.J.; Almeraya-Calderon, F.; Borunda-Terrazas, A.; Bautista-Margulis, R.G.; Chacón-Nava, J.G.; Fajardo-San-Miguel, G.; Almaral-Sanchez, J.L.; Barrios-Durstewitz, C.; Martinez-Villafañe, A. Corrosion Resistance, Porosity and Strength of lended Portland Cement Mortar Containing Rice Husk Ash and Nano-SiO2. Int. J. Electrochem. Sci. 2013, 8, 10697–10710. [Google Scholar]
  16. Volmer, M.; Weber, A. Keimbildung in nbersättigten Gebilden. Z. Phys. Chem. 1959, 119, 277–3013. [Google Scholar] [CrossRef]
  17. Butler, J.A.V. Studies in heterogeneous equilibria, II. The kinetic interpretation of the Nernst theory of electromotive force. Trans. Faraday Soc. 1924, 19, 729–733. [Google Scholar] [CrossRef]
  18. Butler, J.A.V. Studies in heterogeneous equilibria, I. Conditions at the boundary surface of crystalline solids and liquids, and the application of statistical mechanics. Trans. Faraday Soc. 1924, 19, 659–665. [Google Scholar] [CrossRef]
  19. Macdonald, D.D. Review of mechanistic analysis by electrochemical impedance spectroscopy. Electrochim. Acta 1990, 35, 1509–1525. [Google Scholar] [CrossRef]
  20. Estupiñán-López, H.F.; Almeraya-Calderón, F.; Bautista Margulis, G.R.; Baltazar Zamora, M.A.; Martínez-Villafañe, A.; Uruchurtu, C.J.; Gaona-Tiburcio, C. Transient Analysis of Electrochemical Noise for 316 and Duplex 2205 Stainless Steels Under Pitting Corrosion. Int. J. Electrochem. Sci. 2011, 6, 1785–1796. [Google Scholar]
  21. Mehdipour, M.; Naderi, R.; Markhali, B.P. Electrochemical study of effect of the concentration of azole derivatives on corrosion behavior of stainless steel in H2SO4. Prog. Org. Coat. 2014, 77, 1761–1767. [Google Scholar] [CrossRef]
  22. Kelly, R.G.; Scully, J.R.; Shoesmith, D.W.; Buchheit, G. Electrochemical Techniques in Corrosion Science and Engineering; Taylor & Francis: Boca Raton, FL, USA, 2002; pp. 54–123. [Google Scholar]
  23. Kearns, J.R.; Eden, D.A.; Yaffe, M.R.; Fahey, J.V.; Reichert, D.L.; Silverman, D.C. ASTM Standardization of Electrochemical Noise Measurement. In Electrochemical Noise Measurement for Corrosion Applications; Kearns, J.R., Scully, J.R., Roberge, P.R., Reirchert, D.L., Dawson, L., Eds.; ASTM International, Materials Park: Russell, OH, USA, 1996; pp. 446–471. [Google Scholar]
  24. Botana, P.J.; Bárcena, M.M.; Villero, Á.A. Ruido Electroquímico: Métodos de Análisis; Septem Ediciones: Cadiz, Spain, 2002; pp. 50–70. [Google Scholar]
  25. Gaona-Tiburcio, C.; Aguilar, L.M.R.; Zambrano-Robledo, P.; Estupiñán-López, F.; Cabral-Miramontes, J.A.; Nieves-Mendoza, D.; Castillo-González, E.; Almeraya-Calderón, F. Electrochemical Noise Analysis of Nickel Based Superalloys in Acid Solutions. Int. J. Electrochem. Sci. 2014, 9, 523–533. [Google Scholar]
  26. Ma, C.; Song, S.; Gao, Z.; Wang, J.; Hu, W.; Behnamian, Y.; Xia, D.H. Electrochemical noise monitoring of the atmospheric corrosion of steels: Identifying corrosion form using wavelet analysis. Corros. Eng. Sci. Technol. 2017, 5, 1–9. [Google Scholar] [CrossRef]
  27. Ma, C.; Wang, Z.; Behnamian, Y.; Gao, Z.; Wu, Z.; Qin, Z.; Xia, D.H. Measuring atmospheric corrosion with electrochemical noise: A review of contemporary methods. Measurement 2019, 138, 54–79. [Google Scholar] [CrossRef]
  28. Xia, D.H.; Song, S.; Behnamian, Y.; Hu, W.; Cheng, F.; Luo, J.L.; Huet, F. Review—Electrochemical Noise Applied in Corrosion Science: Theoretical and Mathematical Models towards Quantitative Analysis. J. Electrochem. Soc. 2020, 167, 081507. [Google Scholar] [CrossRef]
  29. Contreras, A.; Salazar, M.; Carmona, A.; Galván-Martínez, R. Electrochemical Noise for Detection of Stress Corrosion Cracking of Low Carbon Steel Exposed to Synthetic Soil Solution. Mater. Res. 2017, 20, 1–10. [Google Scholar] [CrossRef] [Green Version]
  30. Montoya-Rangel, M.; de Garza-Montes, O.N.; Gaona-Tiburcio, C.; Colás, R.; Cabral-Miramontes, J.; Nieves-Mendoza, D.; Maldonado-Bandala, E.; Chacón-Nava, J.; Almeraya-Calderón, F. Electrochemical Noise Measurements of Advanced High-Strength Steels in Different Solutions. Metals 2020, 10, 1232. [Google Scholar] [CrossRef]
  31. Monticelli, C. Evaluation of Corrosion Inhibitors by Electrochemical Noise Analysis. J. Electrochem. Soc. 1992, 139, 706. [Google Scholar] [CrossRef]
  32. Park, C.J.; Kwon, H.S. Electrochemical noise analysis of localized corrosion of duplex stainless steel aged at 475 °C. Mater. Chem. Phys. 2005, 91, 355–360. [Google Scholar] [CrossRef]
  33. Suresh, G.U.; Kamachi, M.S. Electrochemical Noise Analysis of Pitting Corrosion of Type 304L Stainless Steel. Corrosion 2014, 70, 283–293. [Google Scholar] [CrossRef]
  34. Cabral-Miramontes, J.A.; Barceinas-Sánchez, J.D.O.; Poblano-Salas, C.A.; Pedraza-Basulto, G.K.; Nieves-Mendoza, D.; Zambrano-Robledo, P.C.; Almeraya-Calderón, F.; Chacón-Nava, J.G. Corrosion Behavior of AISI 409Nb Stainless Steel Manufactured by Powder Metallurgy Exposed in H2SO4 and NaCl Solutions. Int. J. Electrochem. Sci. 2013, 8, 564–577. [Google Scholar]
  35. Nagiub, A.M. Electrochemical Noise Analysis for Different Green Corrosion Inhibitors for Copper Exposed to Chloride Media. Port. Electrochim. Acta 2017, 35, 201–210. [Google Scholar] [CrossRef]
  36. Dawson, D.L. Electrochemical Noise Measurement: The definitive In-Situ Technique for Corrosion Applications? In Electrochemical Noise Measurement for Corrosion Applications STP 1277; Kearns, J.R., Scully, J.R., Roberge, P.R., Reirchert, D.L., Dawson, L., Eds.; ASTM International, Materials Park: Russell, OH, USA, 1996; pp. 3–39. [Google Scholar]
  37. Cottis, R.; Turgoose, S.; Mendoza-Flores, J. The Effects of Solution Resistance on Electrochemical Noise Resistance Measurements: A Theorical Analysis. In Electrochemical Noise Measurement for Corrosion Applications STP 1277; Kearns, J.R., Scully, J.R., Roberge, P.R., Reirchert, D.L., Dawson, L., Eds.; ASTM International, Materials Park: Russell, OH, USA, 1996; pp. 93–100. [Google Scholar]
  38. ASTM E3-95. Standard Practice for Preparation of Metallographic Specimens; ASTM International: West Conshohocken, PA, USA, 1995. [Google Scholar]
  39. ASTM E407-07. Standard Practice for Microetching Metals and Alloys; ASTM International: West Conshohocken, PA, USA, 2011. [Google Scholar]
  40. ASTM G199-09. Standard Guide for Electrochemical Noise Measurement; ASTM International: West Conshohocken, PA, USA, 2009. [Google Scholar]
  41. Vander, V.F.G. ASM Handbook Volume 9: Metallography and Microstructures; ASM International: Materials Park Ohio, OH, USA, 2004; ISBN 978-0-87170-706-2. [Google Scholar]
  42. Jiang, L.; Liaw, K.P.; Brooks, R.C.; Somieski, B.; Klarstrom, L.D. Nondestructive evaluation of fatigue damage in ULTIMET® superalloy. Mater. Sci. Eng. A 2001, 313, 153–159. [Google Scholar] [CrossRef]
  43. ASTM E112-13. Standard Test Methods for Determining Average Grain Size; ASTM International: West Conshohocken, PA, USA, 2013. [Google Scholar]
  44. Osório, R.W.; Cheung, N.; Spinelli, J.E.; Goulart, P.R.; Garcia, A. The effects of a eutectic modifier on microstructure and surface corrosion behavior of Al-Si hypoeutectic alloys. J. Solid State Electrochem. 2007, 11, 1421–1427. [Google Scholar] [CrossRef]
  45. Donelan, P. Modelling microstructural and mechanical properties of ferritic ductile cast iron. Mater. Sci. Technol. 2000, 16, 261–269. [Google Scholar] [CrossRef]
  46. Petch, J.N. The cleavage strength of polycrystals. J. Iron Steel Inst. 1953, 174, 25–28. [Google Scholar]
  47. Brogdon, L.M.; Rosenberger, H.A. Evaluation of the Influence of Grain Structure on the Fatigue Variability of Waspaloy. Superalloys 2008, 583–588. [Google Scholar] [CrossRef]
  48. Almeraya-Calderón, F.; Estupiñán, F.; Zambrano, R.P.; Martínez-Villafañe, A.; Borunda, T.A.; Colás, O.R.; Gaona-Tiburcio, C. Análisis de los transitorios de ruido electroquímico para aceros inoxidables 316 y -DUPLEX 2205 en NaCl y FeCl. Rev. Metal. 2012, 4, 147–156. [Google Scholar] [CrossRef]
  49. Liu, X.; Zhang, T.; Shao, Y.; Meng, G.; Wang, F. In-situ study of the formation process of stannate conversion coatings on AZ91D magnesium alloy using electrochemical noise. Corros. Sci. 2010, 52, 892–900. [Google Scholar] [CrossRef]
  50. Seifzadeh, D.; Basharnavaz, H.; Bezaatpour, A. A Schiff base compound as effective corrosion inhibitor for magnesium in acidic media. Mater. Chem. Phys. 2013, 138, 794–802. [Google Scholar] [CrossRef]
  51. Homborg, A.M.; Tinga, T.; Zhang, X.; Van Westing, E.P.M.; Ferrari, G.M.; Wit, J.H.W.; Mol, J.M.W. A Critical Appraisal of the Interpretation of Electrochemical Noise for Corrosion Studies. Corrosion 2017, 70, 971–987. [Google Scholar] [CrossRef]
  52. Eden, D.A.; John, D.G.; Dawson, J.L. “Corrosion Monitoring” International Patent WO 87/07022 (World Intellectual Property Organization, Nov. 19, 1997). Available online: https://patentimages.storage.googleapis.com/19/ca/d4/c180ce2c0b9dfe/WO1987007022A1.pdf (accessed on 15 March 2021).
  53. Corral-Higuera, R.; Arredondo-Rea, P.; Neri-Flores, M.A.; Gómez-Soberón, J.M.; Almaral-Sánchez, J.L.; Castorena-González, J.C.; Almeraya-Calderón, F. Chloride ion penetrability and Corrosion Behavior of Steel in Concrete with Sustainability Characteristics. Int. J. Electrochem. Sci. 2011, 6, 958–970. [Google Scholar]
  54. Mansfeld, F.; Sun, Z. Technical Note: Localization Index Obtained from Electrochemical Noise Analysis. Corrosion 1999, 55, 915–918. [Google Scholar] [CrossRef]
  55. Reid, S.A.; Eden, D.A. Assessment of Corrosion. US9264824B1; UK, 24 July 2001. Available online: http://www.khdesign.co.uk/Patents/US6264824.Eden%20AI.pdf (accessed on 15 March 2021).
  56. Jáquez-Muñoz, J.M.; Gaona-Tiburcio, C.; Cabral-Miramontes, J.; Nieves-Mendoza, D.; Maldonado-Bandala, E.; Olguín-Coca, J.; López-Léon, L.D.; Flores-De los Rios, J.P.; Almeraya-Calderón, F. Electrochemical Noise Analysis of the Corrosion of Titanium Alloys in NaCl and H2SO4 Solutions. Metals 2021, 11, 105. [Google Scholar] [CrossRef]
  57. Cottis, R. Interpretation of Electrochemical Noise Data. Corrosion 2001, 57, 265–285. [Google Scholar] [CrossRef]
  58. Coakley, J.; Vorontsov, V.A.; Littlell, K.C.; Heenan, R.K.; Ohnuma, G.; Jones, N.G.; Dye, D. Nanoprecipitation in a beta-titanium alloy. J. Alloy. Compd. 2015, 623, 146. [Google Scholar] [CrossRef] [Green Version]
  59. Bertocci, U.; Huet, F. Noise Analysis Applied to Electrochemical Systems. Corrosion 1995, 51, 131–144. [Google Scholar] [CrossRef]
  60. Lee, C.C.; Mansfeld, F. Analysis of electrochemical noise data for a passive system in the frequency domain. Corr. Sci. 1998, 40, 959–962. [Google Scholar] [CrossRef]
  61. Legat, A.; Dolecek, V. Corrosion Monitoring System Based on Measurement and Analysis of electrochemical Noise. Corrosion 1995, 51, 295–300. [Google Scholar] [CrossRef]
  62. Homborg, A.M.; Cottis, R.A.; Mol, J.M.C. An integrated approach in the time, frequency and time-frequency domain for the identification of corrosion using electrochemical noise. Electrochim. Acta 2016, 222, 627–640. [Google Scholar] [CrossRef]
  63. Bertucci, U.; Gabrielli, C.; Huet, F.; Keddam, M.; Rousseau, P. Noise Resistance Applied to Corrosion Measurements: II. Experimental Tests. J. Electrochim. Soc. 1997, 144, 37. [Google Scholar] [CrossRef]
  64. Xia, D.-H.; Song, S.-Z.; Behnamian, Y. Detection of corrosion degradation using electrochemical noise (EN): Review of signal processing methods for identifying corrosion forms. Corros. Eng. Sci. Technol. 2016, 51, 527–544. [Google Scholar] [CrossRef]
  65. Cottis, R.A.; Turgoose, S. Electrochemical Impedance and Noise, Corrosion Testing Made Easy; Syrett, B.C., Ed.; NACE International: Houston, TX, USA, 1999; Volume 7. [Google Scholar]
  66. Galvan-Martinez, R.; Orozco-Cruz, R.; Torres-Sanchez, R.; Martinez, E.A. Corrosion study of the X52 steel immersed in seawater with a corrosion inhibitor using a rotating cylinder electrode. Mater. Corros. 2010, 61, 872–876. [Google Scholar] [CrossRef]
  67. Sakairi, M.; Sasaki, R.; Kaneko, A.; Seki, Y.; Nagasawa, D. Evaluation of metal cation effects on galvanic corrosion behavior of the A5052 aluminum alloy in low chloride ion containing solution by electrochemical noise impedance. Electrochim. Acta 2014, 131, 123. [Google Scholar] [CrossRef] [Green Version]
  68. Lentka, L.; Smulko, J. Methods of trend removal in electrochemical noise data-overview. Measurement 2019, 131, 569–581. [Google Scholar] [CrossRef]
  69. Jing, L.; Brooks, C.R.; Liaw, P.K.; Wang, H.; Rawn, C.L.; Klastrom, D.L. High-frequency metal fatigue: The high-cycle fatigue behavior of ULTIMET® alloy. Mater. Eng. 2001, A314, 162. [Google Scholar] [CrossRef]
  70. Keyvani, M.; Garcin, T.; Militzer, M.; Fabregue, D. Laser ultrasonic measurement of recrystallization and grain growth in an L605 cobalt superalloy. Mater. Charact. 2020, 167, 110465. [Google Scholar] [CrossRef]
  71. Kelekanjeri, V.S.K.G.; Moss, L.K.; Gerhardt, R.A.; Ilavsky, J. Quantification of the coarsening kinetics of γ’ precipitates in Waspaloy microstructures with different pri-or homogenizing treatments. Act. Mater. 2009, 57, 4658. [Google Scholar] [CrossRef]
  72. Hussein, S.I.S.; Segal, J.; McCartney, D.G.; Pashby, I.R. Microstructure formation inWaspaloy multilayer builds following direct metal deposition with laser and wire. Mater. Sci. Eng. A 2008, 497, 260–269. [Google Scholar] [CrossRef]
  73. Charpagne, M.; Franchet, J.M.; Bozzolo, N. Overgrown grains appearing during sub-solvus heat treatment in a polycrystalline γ-γ’ Nickel-based superalloy. Mater. Des. 2018, 144, 353–360. [Google Scholar] [CrossRef] [Green Version]
  74. Long, H.; Mao, S.; Liu, Y.; Zhang, Z.; Han, X. Microstructural and compositional design of Ni-based single crystalline superalloys—A review. J. Alloys Compd. 2018, 743, 203–220. [Google Scholar] [CrossRef]
  75. Martínez-Villafañe, A.; Almeraya-Calderón, M.F.; Gaona-Tiburcio, C.; Gonzalez-Rodriguez, J.G.; Porcayo-Calderón, J. High-Temperature Degradation and Protection of Ferritic and Austenitic Steels in Steam Generators. J. Mater. Eng. Perform. 1998, 7, 108–113. [Google Scholar] [CrossRef]
  76. Human, A.M.; Roebuck, B.; Exner, H.E. Electrochemical polarisation and corrosion behaviour of cobalt and Co(W,C) alloys in 1 N sulphuric acid. Mater. Sci. Eng. 1998, A241, 202–210. [Google Scholar] [CrossRef]
  77. Kup, A.N.; Tiras, E.; Karahan, H.I.; Aylikci, V.; Eskil, M.; Cengiz, E. Alloying effect on K to L shell vacancy transfer probabilities in Zn-Co Alloys and Al-Ni-Mo superalloys. J. Chem. Phys. 2010, 377, 100–108. [Google Scholar]
  78. Ting, C.; Hendrik, J.; Jing, X.; Qiuhong, L.; Jeffrey, H.; Xingbo, L. Influence of surface modifications on pitting corrosion behavior of nickel-base alloy 718. Part 2: Effect of aging treatment. Corr. Sci. 2014, 78, 151–161. [Google Scholar] [CrossRef]
  79. Razavi, S.R. Laser beam welding of Waspaloy: Characterization and corrosion behavior evaluation. Opt. Laser Technol. 2016, 82, 113–120. [Google Scholar] [CrossRef]
  80. Pan, C.; Liu, L.; Li, Y.; Wang, F. The electrochemical corrosion behavior of K38G nanocrystalline thin film in 3.5% NaCl solution. Thin Solid Films 2011, 519, 4781–4787. [Google Scholar] [CrossRef]
  81. Zhang, B.; Xiu, M.; Tan, T.Y.; Wei, J.; Wang, P. Pitting Corrosion of SLM Inconel 718 sample under surface and heat treatments. Appl. Surf. Sci. 2019, 490, 556–567. [Google Scholar] [CrossRef]
  82. Ma, C.; Zhou, C.; Sun, J. Electrochemical corrosion behavior of the cobalt modified aluminide coating in 3.5 wt% NaCl Solutions. Prog. Nat. Sci. 2018, 28, 85–89. [Google Scholar] [CrossRef]
  83. Klein, L.; Virtanen, S. Electrochemical characterization of novel γ/γ’—Strengthened Co-base superalloys. Electrochim. Acta 2012, 76, 275–281. [Google Scholar] [CrossRef]
  84. Eden, D.A. Electrochemical Noise—The First Two Octaves. In NACE International Corrosion/98; NACE International: San Diego, FL, USA, 1998; pp. 1–31. [Google Scholar]
  85. Lara-Banda, M.; Gaona-Tiburcio, C.; Zambrano-Robledo, P.; Delgado, E.M.; Cabral-Miramontes, J.A.; Nieves-Mendoza, D.; Maldonado-Bandala, E.; Estupiñan-López, F.; Chacón-Nava, J.G.; Almeraya-Calderón, F. Alternative to Nitric Acid Passivation of 15-5 and 17-4PH Stainless Steel Using Electrochemical Techniques. Materials 2020, 13, 2836. [Google Scholar] [CrossRef] [PubMed]
  86. Galván-Martínez, R.; Cabrera-de la Cruz, D.; Contreras, A.; Orozco-Cruz, R. A novel experimental arrangement for corrosión study of X60 pipeline steel weldments at turbulent flow conditions. Corros. Eng. Sci. Technol. 2016, 5, 1–8. [Google Scholar] [CrossRef]
  87. Bertocci, U.; Gabrielli, C.; Huet, F.; Keddam, M. Noise Resistance Applied to Corrosion Measurements: I. Theorical Analysis. J. Electrochem. Soc. 1997, 144, 31. [Google Scholar] [CrossRef]
Figure 1. Experimental setup for electrochemical noise (EN) measurements.
Metals 11 00702 g001
Figure 2. OM micrographs of superalloys (initial conditions): (a) Ultimet, (b) Waspaloy, 100×. and Measurement of average ASTM grain size by interception. (c) 3.82, (d) 4.01.
Metals 11 00702 g002
Figure 3. Electrochemical current and potential noise-time series for Superalloys in NaCl at 25 °C. (a,b) with trend (c,d) without trend.
Metals 11 00702 g003
Figure 4. Electrochemical current and potential noise-time series for Superalloys in H2SO4 at 25 °C. (a,b) with trend (c,d) without trend.
Metals 11 00702 g004
Figure 5. Electrochemical current and potential noise-time series for Superalloys in NaCl at 60 °C. (a,b) with trend (c,d) without trend.
Metals 11 00702 g005
Figure 6. Electrochemical current and potential noise-time series for Superalloys in H2SO4 at 60 °C. (a,b) with trend (c,d) without trend.
Metals 11 00702 g006
Figure 7. Power spectral density (PSD) in potential and current for NaCl. (a,b) 25 °C (c,d) 60 °C.
Metals 11 00702 g007
Figure 8. Power spectral density (PSD) in potential and current for H2SO4. (a,b) 25 °C (c,d) 60 °C.
Metals 11 00702 g008
Figure 9. Spectral noise resistance (Zn) in: H2SO4 at (a) 25 °C, (b) 60 °C and NaCl at (c) 25 °C, (d) 60 °C.
Metals 11 00702 g009
Table 1. Chemical Composition of the Used Superalloys (wt.%).
SuperalloysElements
NiCrFeCoMoSiCWAlTiZr
Ultimet9.225.5354.14.80.310.062.1------
Waspaloy55.318.82.112.54.20.750.07--1.43.40.01
Table 2. Corrosion Types Evaluated by Localization Index (LI).
Corrosion TypeLI
Localized1.0—0.1
Mixt0.1—0.01
Uniform0.01—0.001
Table 3. Corrosion Types Evaluated by Kurtosis and Skewness [55].
Corrosion TypePotentialCurrent
Skewness KurtosisSkewness Kurtosis
Uniform<±1<3<±1<3
Pitting<−2>>3>±2>>3
Transgranular (SCC)420−420
Intergranular (SCC #1)−6.618 to 1141.5 to 3.26.4 to 15.6
Intergranular (SCC #2)−2 to −65 to 453 to 610 to 60
Table 4. EN Statistical Parameters from Different Superalloys and Electrolytes.
SolutionT (°C)MaterialsTestRnicorr (mA/cm2)LICorrosion TypeKurtosis Corrosion TypeSkew (I)Corrosion Type
(ohm)(I)
NaCl25Ultimet17.58 × 103 ± 3793.43 × 10−3
± 1.7 × 10⁻⁴
0.4Localized4.1Pitting1.04Pitting
27.12 × 10³ ± 3563.41 × 10−3
± 1.7 × 10⁻⁴
0.36Localized3.9Pitting1.09Pitting
6012.12 × 104 ± 10601.22 × 10−3
± 6.1 × 10⁻⁵
0.02Mix29.4Pitting2.52Pitting
22.02 × 10⁴ ± 1010 1.19 × 10⁻³
± 6.0 × 10⁻⁵
0.02Mix27.5Pitting2.68Pitting
25Waspaloy18.64 × 103 ± 432 3.01 × 10⁻³
± 1.5 × 10⁻⁴
0.11Localized38.43Pitting5.47Pitting
28.71 × 10³ ± 4353.09 × 10−3
± 1.5 × 10⁻⁴
0.23Localized39.56Pitting5.51Pitting
6014.67 × 103 ± 2335.56 × 10-3
± 2.8 × 10⁻⁴
0.02Mix3.71Pitting−0.49Uniform
24.03 × 10³ ± 2015.65 × 10−3
± 2.8 × 10⁻⁴
0.02Mix3.61Pitting−0.52Uniform
H2SO425Ultimet11.28 × 104 ± 6402.02 × 10−3
± 1.0 × 10⁻⁴
0.02Mix9.41Pitting1.01Pitting
21.16 × 10⁴ ± 580 2.00 × 10⁻³
± 1.0 × 10⁻⁴
0.020Mix9.49Pitting1.09Pitting
6016.44 × 103 ± 3224.04 × 10−3
± 2.0 × 10⁻⁴
0.17Localized181.91Pitting11.32Pitting
26.58 × 10³ ± 3294.02 × 10−3
± 2.0 × 10⁻⁴
0.18Localized175.53Pitting11.01Pitting
25Waspaloy11.40 × 104 ± 7001.84 × 10−3
± 9.2 × 10⁻⁵
0.1Mix61.82Pitting6.83Pitting
21.34 × 10⁴ ± 6701.91 × 10−3
± 9.6 × 10⁻⁵
0.09Mix61.63Pitting6.71Pitting
6012.83 × 103 ± 1419.18 × 10−3
± 4.6 × 10⁻⁴
0.01Uniform6.05Pitting0.32Uniform
22.95 × 10³ ± 1479.21 × 10−3
± 4.6 × 10⁻⁴
0.01Uniform6.01Pitting0.29Uniform
Table 5. β Intervals to Indicate the Type of Corrosion [60].
Corrosion TypedB (V)·Decade−1dB (A)·Decade−1
MinimumMaximumMinimumMaximum
Uniform0−70−7
Pitting−20−25−7−14
Passive−15−25−11
Table 6. Parameters Obtained by PSD.
AlloysTermsΨ0 (dBi)Β (dB (V))B (dB (A))
UltimetNaCl,
25 °C
−72.2−22.9−15.6
Waspaloy−91.3−20.41.5
UltimetNaCl,
60 °C
−78.7−6.1−4.0
Waspaloy−82.3−13.0−11.4
UltimetH2SO4,
25 °C
−71.3−10.4−7.5
Waspaloy−71.7−11.51.4
UltimetH2SO4,
60 °C
−52.9−14.2−11.4
Waspaloy−59.7−15.2−13.3
Table 7. Parameters Obtained by Zn.
AlloysTermsΨ0 (dBi)Zn (Ω·cm2)
UltimetNaCl,
25 °C
−72.28.1 × 104
Waspaloy−91.31.2 × 105
UltimetNaCl,
60 °C
−78.71.9 × 103
Waspaloy−82.34.5 × 103
UltimetH2SO4,
25 °C
−71.31.1 × 104
Waspaloy−71.79.2 × 104
UltimetH2SO4,
60 °C
−52.97.9 × 103
Waspaloy−59.71.9 × 103
Publisher’s Note: MDPI stays neutral with regard to jurisdictional claims in published maps and institutional affiliations.

