Abstract
In this research, different ductile irons and austempered ductile irons were successfully developed using several alloying contents of nickel, copper and microalloying with niobium. Additionally, special nanocarbon powder was added to the molten iron to enhance the nucleation tendency of spheroidal graphite and compensate for the possible negative effect of Nb addition on the nodule morphology. Metallographic analysis showed that increasing the niobium content in the alloy to 0.1 wt % raises the number of graphite eutectic cells and refines the final structure of the graphite. Moreover, the nodule count of graphite slightly increased, but it concurrently decreased the nodularity when the Nb amount reached 0.1 wt %. SEM micrographs illustrated that nano- to microsized niobium carbides (NbC) particles were dispersed in the matrix of the Nb microalloyed ductile irons. Both optical and SEM micrographs clearly showed that alloying of ductile irons with nickel, copper and microalloying with niobium had a significant effect on defining the final pearlite structure. Coarse, fine, broken and spheroidized pearlite structures were simultaneously observed in all investigated alloys. Dilatometry studies demonstrated that the nano NbC particles acted as nucleation sites for graphite and ferrite needles. Therefore, Nb addition accelerated the formation of ausferrite during the austempering stage. Finally, alloying with Cu, Ni and microalloying with Nb led to developing novel grades of ADI with excellent strength/ductility property combination.
1. Introduction
Austempered ductile cast iron (ADI) presents an important material in the ductile iron family that exhibits an exceptional combination of mechanical and physical properties, such as an excellent combination of strength and ductility, outstanding fatigue strength and fracture toughness combined with a lower density as well as improved tribological behavior compared to steel. This exceptional combination of properties nominates the ADI to be used in various engineering applications and makes it a strong competitor for steel castings and forgings [1,2]. According to the ASTM standard A897 [3], ADI alloys are classified into five main grades based on their strength and ductility. The strongest grade possesses a nominal ultimate tensile strength (UTS) of 1600 MPa, at a minimum ductility of 1%. The grade with the highest ductility of 9% possesses UTS~900 MPa.
The ADI is produced by applying austempering heat treatment, in which the ductile iron is austenitized at a high temperature within the range of 850–950 °C, then it is quenched down to a temperature ranging between 250 and 400 °C and held there for a certain time to allow for the austempering transformation to occur. During the latter holding, two consecutive reactions may occur as follows: the first reaction, ausferrite transformation, results in a tailorable microstructure composing of spheroidal graphite in ausferritic matrix (α-ferrite needles + high carbon stabilized austenite, HC-γ) [1,4]. After an extremely long holding time, the second reaction occurs, where HC-γ decomposes to α-ferrite and undesirable ε-iron carbides, which deteriorate the mechanical properties of the ADI. The period between the end of the first reaction and the start of the second reaction is known as the process window, in which the optimum mechanical properties could be achieved [4].
Over the years, many investigations have been conducted to study the effect of different alloying elements, especially copper and nickel, on enhancing the performance of ADI alloys [5,6,7,8,9,10,11]. It has been reported that alloying ADI with 1 wt % Ni results in increasing the hardenability and the volume fraction of retained austenite by shifting the ausferritic transformation to lower temperatures [5]. The presence of Cu in the ADI alloys plays a significant role in delaying the nucleation of the early growth of ferrite needles. Therefore, it expands the processing window and suppresses the formation of the carbides in the matrix during the ausferrite transformation [5,6]. Amran et al. [7] extensively studied the effect of Cu addition on the kinetics of transformation of ADI. It was concluded that Cu addition increases the volume fraction of austenite in the matrix, but it decreases the final carbon content of the austenite. Furthermore, alloying with Cu decreases the ferrite volume fraction and changes the growth kinetics of the ferrite [7,8]. Rajnovic et al. [9] investigated the effect of both Cu and Ni on the kinetics of transformation and the mechanical properties of ADI. It was also stated that the synergetic effect of both Cu and Ni on expanding the time for the isothermal reaction and increasing the volume fraction of austenite by lowering the transformation temperature is purposefully important [5,9,11]. Moreover, alloying with Cu and Ni creates grades of ADI with high ductility and toughness properties [5,10].
It is widely acknowledged that combining high ductility with high strength values is essential to produce dynamically loaded parts. Such premise intrigued many researchers to study the effect of small additions of niobium on different types of cast iron alloys [12,13,14,15,16,17,18,19,20,21,22,23,24]. The effect of Nb alloying differs to some extent according to the type of cast irons. In white cast irons, Nb is added to control the final microstructure. It has been reported that alloying white cast irons with up to ~2 wt% Nb refines the primary M7C3 carbides and forms fine NbC carbides within the matrix; both carbides notably enhance not only wear resistance but also the toughness properties of the produced castings [12,13]. In grey cast irons, Nb combines with carbon and forms nano NbC precipitates, which act as nucleation sites for graphite, causing the refinement of graphite structure and increasing the number of graphite eutectic cells [14,15,16]. Pan et al. [16] established that alloying grey iron with up to 0.2 wt % Nb increases the volume fraction of pearlite and refines its structure by reducing its lamellar spacing. Furthermore, Nb strengthens the matrix with extremely fine NbC carbides. This results in remarkable improvement in tensile strength, toughness, and thermal fatigue properties. Recently, many research efforts have been performed to enhance the mechanical properties of solution strengthened ferritic ductile iron alloy (SSFDI) [17,18,19,20]. SSFDI provides a unique combination of strength and ductility as well as high fatigue strength. Additionally, the microstructure of the SSFDI alloy is a fully ferritic matrix, which makes this alloy less sensitive to the property variation along the thickness. Therefore, SSFDI introduces excellent machinability properties compared to ferritic-pearlitic cast irons with the same tensile strength [19]. Riebisch et al. [20] extensively studied the combined effect of the carbide promoting elements, such as Cr, Mn, Mo, Nb and V on the mechanical properties of SSFDI alloy at different cooling conditions. It was concluded that Nb has a positive impact on the overall mechanical properties by increasing the tensile strength of the SSFDI alloy with a minor decrease in ductility. In conventional ductile irons, there is a significant conflict over the effect of Nb on the final microstructure [21,22]. Bedolla-Jacuinde et al. [21] produced a series of Ni alloyed ductile irons modified with up to 0.8 wt % Nb. It was concluded that Nb did not affect the spheroidal graphite morphology, and the nodule count, as well as the modularity, remain constant at the level of 150 mm−2 and 90%, respectively, with only a slight increase in the volume fraction of pearlite observed at 0.8 wt % Nb. Moreover, rectangular NbC carbides were observed in the matrix; the volume fraction and size of these carbides considerably increased as the Nb content increased. It should be noted that these large carbides increased both the hardness and the wear resistance of the produced alloys but dramatically reduced the ductility and the impact toughness properties. On the other hand, Chen et al. [22] had recently noted a remarkable change in the spheroidal graphite morphology when Nb was added. Nodule count decreased from 287 mm−2 to 212 mm−2, and nodularity also decreased from 92.4% to 84.5% when the Nb content increased from 0 to 0.11 wt %. However, increasing the Nb content to 0.11 wt % refined the pearlite structure by decreasing the lamellar spacing from 1.04 to 0.79 µm as the Nb content increased from 0 to 0.11 wt %. The authors [22] also pointed out that having a fine pearlite structure in the matrix of the Nb-modified ductile irons, in turn, significantly improved the mechanical properties despite the irregularity of the graphite morphology. Chen et al. [23] also evaluated the toughness, as well as the wear resistance of a series of Nb, modified ADI grades. It was illustrated that NbC nano precipitates act as nucleation sites for the graphite as well as for the ferrite needles; hence, increasing the volume fraction of the ausferrite in the matrix of the ADI. Moreover, Nb prevented the grain growth of the austenite during the austenitization stage of the austempering heat-treatment process. It has been demonstrated that the optimum alloying range of Nb in this study to achieve the best combination of toughness and wear resistance ranged between 0.2 and 0.5 wt % Nb [23]. It was also established that Nb-modified ADI (up to 0.2 wt % Nb) showed a considerable influence on the strength and ductility properties as a result of the fine ausferritic structure along with the NbC nano precipitates dispersed in the matrix [24].
There is a general discrepancy so far concerning the effect of Nb on the microstructure and the properties of the ductile iron and ADI alloys. Therefore, taking into consideration the previous studies, it is quite interesting to investigate the effect of Nb microalloying on the solidification as well as the microstructure development for different ductile iron and ADI grades.
The main objective of this research was to produce high-strength/toughness ductile iron and ADI alloys by using different alloying contents of Ni, Cu and microalloying with Nb. Additionally, special nanocarbon additives were used to enhance the nucleation tendency of the spheroidal graphite to compensate for the possible negative effect of Nb addition on the nodule morphology, such as that reported in [22] because of the Nb addition. Moreover, different austempering heat-treatment schemes were applied, in which the contents of the proeutectoid ferrite and ausferrite were controlled. Optical microscope and scanning electron microscope analyses were performed to study the influence of Nb addition on microstructure development. The kinetics of transformation were evaluated by using a quenching dilatometer. Finally, the mechanical properties were characterized in terms of tensile, compression and hardness properties.
2. Materials and Methods
2.1. Melting and Casting Processes
The melting process was carried out in a 100 kg medium-frequency induction furnace. The main raw materials were steel scrap and high purity pig iron. The additions charged into the furnace to achieve the targeted chemical composition were a carburizer (99.0 wt % C), ferroalloys FeSi (65.0 wt % Si) and FeNb (70.0 wt % Nb). It should be noted that the FeNb was added in the latest stage of the melting process in the form of very fine-grained particles (1–3 mm) for the following reasons: (1) To avoid the formation of small lumps of FeNb in the final castings as the FeNb has a high melting point with a solidus- and liquidus temperatures of 1580 °C and 1630 °C, respectively; such temperatures are well above the production temperature of the ductile irons; (2) The Nb has a high affinity to carbon and form strong niobium carbides at a high temperature and could segregate in the molten iron or even combine with the slag; thus, decreasing the recovery of the niobium in the solidified castings. Therefore, the addition of the FeNb to the molten iron must be carried out just before pouring the molten iron into the transfer ladle. After completing the melting process, the molten iron is tapped at a temperature of 1500 °C into the transfer ladle.
A commercial FeSiMg (9.0 wt % Mg) with an amount of 1.5% of the total charge was used throughout the spheroidization process. For the inoculation treatment, a special inoculant powder (with an amount of 0.5% of the total charge), modified with nanocarbon additives, was added to the molten iron. This special inoculant was locally prepared to improve the final graphite morphology of the produced alloys. A simple ball mill was adopted to mix a commercial Ce inoculant (70–76 wt % Si, 0.5–0.75 wt % Ca, 1.5–2.0 wt % Ce, 0.75–1.25 wt % Al) with a graphene nanopowder for the following purposes: (1) To obviate the agglomeration of the nanopowder when in contact with the molten iron, (2) To ensure that the nanopowder weldability on the surface of the inoculant powder. The following steps were implemented to produce an effective inoculant with diverse particle sizes: (1) 200 g of the nanopowder was mixed with 200 g with the commercial inoculant using a simple ball mill for 20 h; (2) 100 g of the commercial inoculant was added to the mixture and thoroughly mixed by hand. The final inoculating material consisted of 60% commercial inoculant and 40% nanopowder. Figure 1 shows the SEM images of both powders before and after the mixing process.
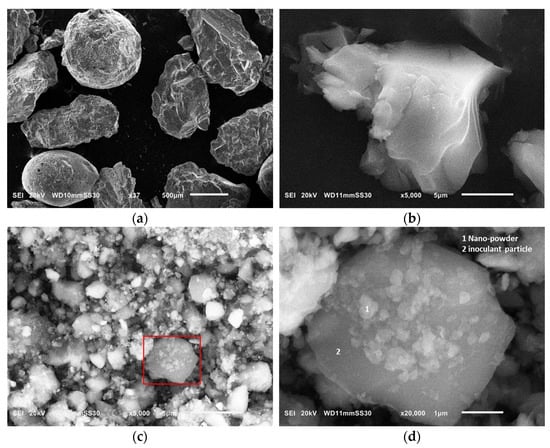
Figure 1.
SEM images of (a) a commercial Ce inoculant powder; (b) flakes of the graphene nanopowder; (c) mixture of the two powders after mixing for 20 h; (d) magnified image of the mixture showing how the nanopowder welded on the surface of the commercial inoculant particle.
The vortex method [25] was used throughout this investigation for both spheroidization and inoculation processes (see Figure 2). The inoculation was performed in two steps, where 25% of the total inoculant amount was added in the vortex unit, whereas the rest of the inoculant was added in-stream during transferring the molten iron into another ladle. Finally, the molten ductile iron was poured at a temperature of 1400 °C into green sand molds in the shape of 30 mm thickness keel-blocks, then the molds were left for cooling to the room temperature. The final chemical composition of the investigated alloys is shown in Table 1. The chemical composition for the casting samples was measured using a spectrometry device, Oxford FOUNDRY-MASTER Pro (Hitachi Ltd, Tokyo Japan).
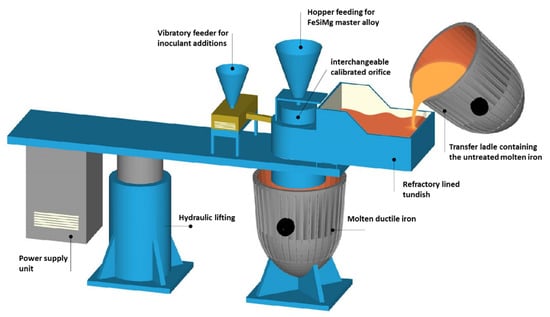
Figure 2.
A schematic drawing of a vortex unit showing the main parts.

Table 1.
Chemical composition in wt % of the produced ductile iron alloys.
2.2. Thermodynamic Calculations
Thermodynamic calculations for predicting the phases under equilibrium and their compositions were performed using the ThermoCalc software implementing the database TCFE9. The thermodynamic simulations of the precipitation process of NbC were carried out using the software MatCalc version 6.00 (MatCalc Engineering, Vienna, Austria), applying the database mc_fe_V2.058.2.2.
2.3. Dilatometry Studies
The dilatometry experiments were conducted to study the influence of the alloying elements of Cu, Ni and microalloying with Nb together with the graphite morphology on the eutectoid transformation- as well as on the ausferrite transformation kinetics. Dilatometry tests were performed using a quenching dilatometer, LINSEIS L78/RITA (Linseis Messgeraete GmbH, Selb, Germany). Cylindrical specimens with 3 mm diameter and 10 mm length were used for these experiments, and the change in length was recorded against temperature and time during the computer-controlled test cycle. All thermal cycles were conducted under a vacuum of 5 × 10⁻³ Pa using a high-frequency induction heating generator. High purity helium gas was used for the cooling.
2.4. Austempering Heat-Treatment Cycles
Three different austempering heat-treatment schedules (see Figure 3) were applied to the produced cast alloys. The heat-treatment processes were started by heating the research samples using an electric resistance furnace to reach the austenitizing temperature. Subsequently, all the samples were quenched in a salt bath furnace for achieving the targeted austempering temperatures. Finally, the research samples were quenched in water to room temperature.
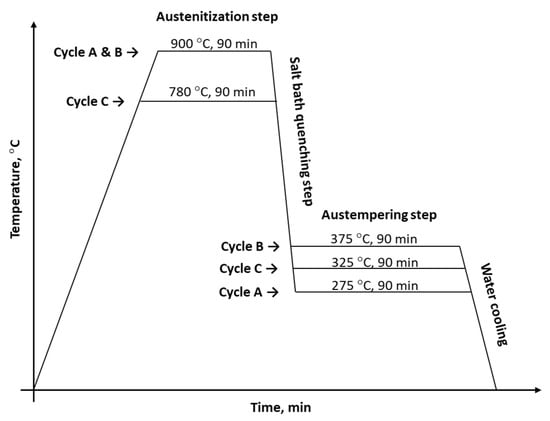
Figure 3.
The heat-treatment schemes applied for this research.
2.5. Metallographic Characterization
The samples used for metallographic investigation were cut from the bottom side of the keel blocks. The austempered metallographic samples were heat-treated together with the tensile and compression samples. The samples were prepared to apply the conventional procedure, which comprised mounting, grinding, and polishing. A 3% nital solution was used for etching the samples. The microstructure characterization was performed using a digital microscope, KEYENCE VHX-5000 (Keyence Corporation of America, Elmwood Park, NJ, USA). Scanning electron microscopy (SEM) was also conducted on deep-etched samples using FEI XL30 ESEM (Thermo Fisher Scientific Inc, Waltham, MA, USA)equipped with an EDS analyzer. The microstructures were analyzed in terms of the graphite characteristics and matrix constituents of all cast alloys. Graphite morphology was evaluated using image analyzer software, ZEISS (Carl ZEISS Microscopy GmbH, Jena, Germany) in terms of nodule count and nodularity according to EN ISO 945-1.
2.6. Mechanical Characterization
Tensile and compression tests were carried out using a computerized 250 KN universal testing machine, INSPEKT 250 (Hegewald & Peschke Meß- und Prüftechnik GmbH, Nossen, Germany). The tensile specimens were machined based on the ASTM standard E8M before heat treatment to avoid possible transformation of retained austenite to martensite during machining. The samples had a gauge diameter of 9.0 mm and a gauge length of 45 mm. The machine was programmed to pull the specimen by upward movement of the crosshead at a rate of 5 mm/min to fracture.
Quasi-static uniaxial compression tests were conducted on 5 mm diameter × 10 mm length specimens. The investigated samples were pinched between two rigid steel blocks and compressed with a strain rate of 1 mm/min.
3. Results
3.1. Characterization of the Cast Alloys
3.1.1. Microstructure Evaluation
Figure 4 illustrates the microstructure (non-etched and etched micrographs) of the three developed ductile iron alloys. The microstructure of the three casting alloys consisted of well-spheroidized graphite in a pearlitic matrix (~80%) and a limited ferrite content (~10%) in the form of a thin halo surrounding the graphite spheroids. By increasing the niobium content in the alloy to 0.1 wt %, the nodule count (N.C.) of the graphite increased from a level around 250 mm−2 to more than 320 mm−2, but it concurrently decreased the nodularity (N) from 90% to around 80% when the Nb amount reaches 0.1 wt %. Fraś et al. [26] studied the effect of small additions of niobium (up to 0.038 wt % Nb) on the structure and mechanical properties of ductile irons. It was indicated that small addition of Nb slightly decreased graphite nodule count and increased the fraction of carbides in the matrix, although the effect of small additions of niobium on the type of the matrix was negligible.
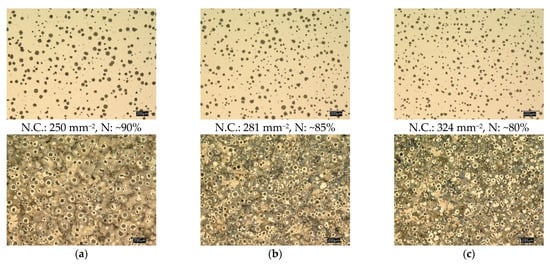
Figure 4.
Optical micrographs of the ductile iron alloys at the three investigated niobium contents; (a) DI-1, 0 wt % Nb, (b) DI-2, 0.05 wt % Nb, (c) DI-3, 0.1 wt % Nb.
The optical micrographs also show the increase in the number of eutectic cells and the reduction in the graphite diameter in the presence of the niobium element. Furthermore, thanks to the nanocarbon additions, extremely fine graphite with a diameter ranging between (3–5 µm) was homogeneously distributed in the matrix. It is well established that high graphite nodule count plays a significant role in enhancing the final mechanical properties of the ductile irons—especially the ductility and toughness properties. In addition, increasing the nodule count in the matrix effectively reduces the tendency of carbide formation [27,28,29].
Nb microalloyed ductile iron alloys, DI-2 and DI-3, showed different sizes and morphology of niobium carbide particles. With a view to identifying the nature of these precipitated, EDS analysis was conducted (Figure 5). Nanosized NbC particles were observed in the 0.05 wt % Nb alloy (see Figure 5a, marked by the red rectangle). By increasing the Nb content to 0.1 wt %, the size and volume fraction of the NbC particles increased. (NbC primary carbides with a size of 3.5–4.0 µm were observed in the ductile iron alloyed with up to 0.1 wt % Nb (see Figure 5b). The EDS analysis revealed Ti. Indeed, both ductile irons contained Ti, an impurity of 0.005 wt %. The Ti remains as an accompanying element in the NbC. According to the thermodynamic calculations with ThermoCalc, this impurity level of Ti was reflected in the chemistry of NbC particles in an amount of 7.9 wt % in DI-2 and 4.3 wt % in DI-3. The predicted Nb and C contents were 79.5 wt % and 12.3 wt %, respectively, in DI-2 and 84.0 wt % and 11.7 wt %, respectively, in DI-3. The Fe was predicted to had a negligible quantity in NbC. The source of Fe in the analyses of Figure 5 was the matrix, therefore, decreased the accuracy of the analyses. Transmission electron microscopy (TEM) analysis was carried out by Chen et al. [22] and Fraś et al. [30] on Nb-microalloyed ductile irons. The TEM analysis revealed that nano and microsized carbide precipitated formed in the matrix, acting as a nucleation site for graphite nodules.
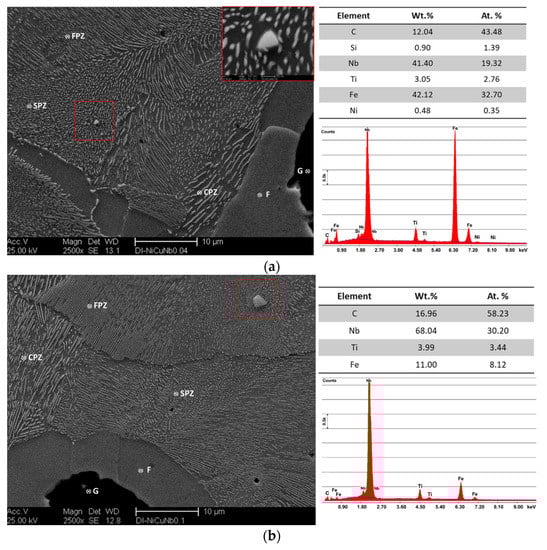
Figure 5.
SEM micrographs and EDS analysis of the Nb microalloyed ductile iron alloys, (a) DI-2, 0.05 wt % Nb, (b) DI-3, 0.1 wt % Nb; G: graphite, F: ferrite, CPZ: coarse pearlite zone, FPZ: fine pearlite zone. SPZ: spheroidized pearlite zone.
On the other hand, alloying modification of ductile irons with Ni, Cu, and microalloying with Nb had a significant effect on defining the final pearlite structure. Figure 6 shows three different pearlite structures in all investigated alloys. The pearlite structure in DI-1 consisted of both coarse and fine lamellar pearlite together with a small amount of broken lamellar and spheroidized pearlite structure (see Figure 6). The graphite spheroids were surrounded with a layer of rather coarse pearlite structure, whereas fine pearlite was located in the rest of the structure at the intercellular area. It is well established [1,7] that at the early stage of eutectoid transformation, ferrite starts to form at the γ/G interface. In the meantime, pearlite forms at the austenite grain boundaries. Since the final pearlite structure depends on the carbon content of the austenite, the rather coarse pearlite around the graphite spheroids may have been a result of decreased carbon content in the volumes around the graphite spheroids. It was claimed that [31,32,33] copper atoms segregate at the γ/G interface during solidification and further cooling to the eutectoid range. The accumulated copper atoms at those areas will represent a barrier against carbon diffusion from austenite to graphite associated with the decrease of C-stability in austenite upon cooling. This will result in the formation of a C-enriched zone around the graphite spheroids. Furthermore, copper atoms could also dissolve in the ferrite and pearlite; thus, that copper could have refined the interlamellar spacing of the pearlite and enhances the strength of the ductile iron through solid solution strengthening of the ferrite and pearlite in the matrix [33].
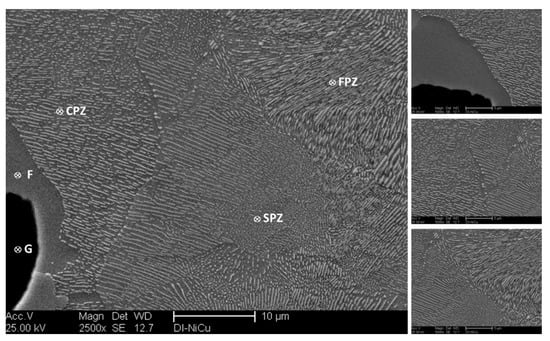
Figure 6.
SEM micrographs of the Ni–Cu-modified ductile iron alloy, DI-1; G: graphite, F: ferrite, CPZ: coarse pearlite zone, FPZ: fine pearlite zone. SPZ: spheroidized pearlite zone.
The finer pearlitic structure is illustrated in both Nb microalloyed ductile iron alloys, DI-2 and DI-3 (see Figure 7a–c). The pearlite lamellar spacing of the three investigated alloys was measured in order to analyze the effect of Nb quantitatively. The measurements of the pearlite lamellar spacing were calculated according to the point intersection method described elsewhere [16,34] by using at least three high magnification SEM micrographs for each sample. For DI-1, the average lamellar spacing of pearlite was ranging between 0.87 and 1.13 µm. Increasing the Nb content from 0.05 wt % to 0.1 wt % significantly shortened and narrowed the lamellar spacing of pearlite. The average lamellar spacing ranged from 0.71 and 0.80 µm in DI-2 and ranged from 0.60 to 0.77 µm in DI-3. Pan et al. [16] reported the same phenomena in the Nb-modified gray cast iron alloys. Moreover, large areas of broken lamellar and spheroidized pearlite were observed in both Nb microalloyed ductile iron alloys. As formerly mentioned, Nb had a strong affinity to carbon and resulting in nano-, and microsized NbC precipitates. Taking into account that NbC precipitates are very strong carbides, the pearlite lamellae were no longer able to grow in their lowest energy habit plane and direction as a result of insufficient carbon diffusion to develop continuous lamellae. The lamellae then gradually turn back to their habit orientation, resulting in curved lamellae or spheroidized pearlite structure [35].
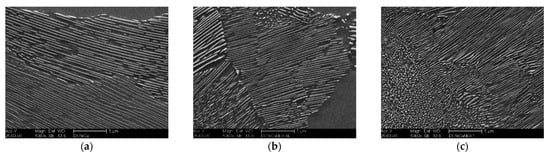
Figure 7.
Magnified SEM micrographs showing the pearlite structure of the developed ductile iron alloys; (a) DI-1, 0 wt % Nb, (b) DI-2, 0.05 wt % Nb, (c) DI-3, 0.1 wt % Nb.
Figure 8a,b clearly reveals the effect of NbC precipitates on defining the final pearlite structure in the ductile iron alloy modified with 0.1 wt % Nb. Figure 8a shows a completely spheroidized pearlite structure at the cell boundaries between two neighboring graphite nodules. As Nb is a carbide stabilizing element, it was expected to concentrate at the cell boundaries. It may be assumed that the spheroidized pearlite was associated with higher levels of Nb. The appearance of NbC particles at these zones supports the probabilities of Nb segregation at the cell boundaries. However, a relatively coarse and broken pearlite structure also appeared in the area between another two neighboring graphite in the same sample (see Figure 8b). Subsequently, this region contains much fewer NbC precipitated. Furthermore, Figure 9 demonstrated incomplete spheroidal graphite growth in the ductile iron sample DI-3 due to lacking carbon in this region as it may be consumed during the formation of NbC particles during solidification at high temperatures.
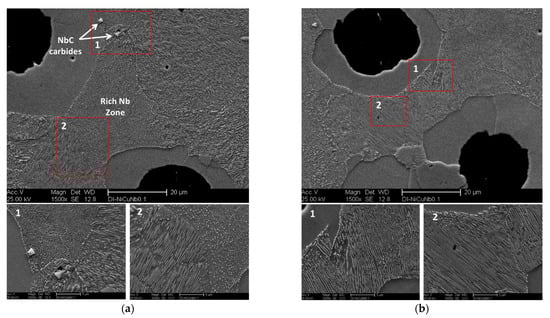
Figure 8.
SEM micrographs showing the effect of 0.1 wt % Nb on the final pearlite structure of the ductile iron sample DI-3 at two different regions: (a) spheroidized pearlite structure, (b) broken lamellar pearlite structure appears at the region between two neighboring graphite nodules.
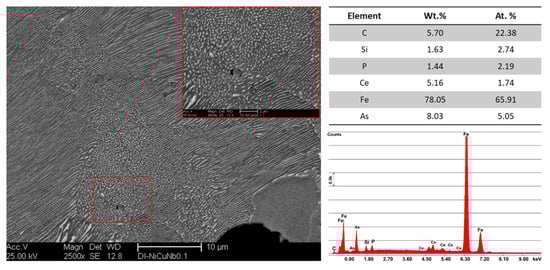
Figure 9.
SEM micrographs illustrate the effect of Nb addition on the spheroidal graphite growth of the ductile iron alloy microalloyed with 0.1 wt % Nb DI-3.
3.1.2. Effect of Nb on the Eutectoid Transformation
The influence of the niobium additions on the eutectoid temperature was investigated using the dilatometric experiments (described in Section 2.2). The three investigated ductile iron alloys were cooled from 950 °C with a slow cooling rate of 0.2 K/s. After reaching the target temperature, the samples were held for 15 min, and then slowly cooled at 0.2 K/s. The relative expansion of the samples was determined based on the following Equation (1):
where Lo is the initial length of the sample (mm), L is the final length of the specimen.
ε = (L − Lo)/(Lo) × 100 [%]
Figure 10 illustrates a part of the dilatation curve during cooling of the investigated ductile iron samples. When the sample cooled from the austenite zone, it showed a linear reduction of the ε values until it reaches the eutectoid transformation, where the austenite starts to decompose into ferrite and pearlite. Such decomposition caused deviation from linearity. The austenite decomposition starts at a slow rate due to the formation of ferrite. The rate of austenite decomposition continued at a higher rate by the growth of pearlite within the austenite and the redistribution of carbon between both of the microconstituents [36]. In this way, the eutectoid transformation of the austenite could be defined by the start and end temperatures (Ar1, Ar3), which were determined by the deviation from linearity using the tangent method. Figure 10 reveals that microalloying with niobium had a significant effect on the eutectoid temperature of the ductile iron. The Ar1 of the eutectoid transformation for the DI-1 sample was 741.7 °C, while the samples DI-2 and DI-3 had approximately the same Ar1 of ~761.2 °C and 762.4 °C, respectively. The three ductile iron samples nearly had the same Ar3 of the eutectoid transformation, close to ~661–665 °C. Therefore, it could be concluded that small additions of niobium (0.05–0.1%) could widen the eutectoid range (ΔTEutectoid) of the ductile iron by approximately 20 °C.
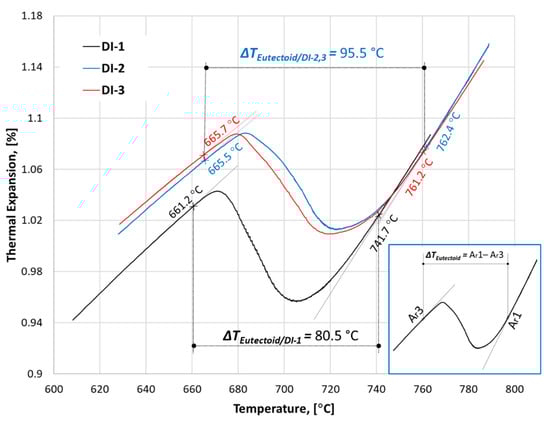
Figure 10.
The dilatation chart during continuous cooling of ductile iron alloys with three different niobium contents. The investigated samples were heated to 950 °C at 0.2 K/s, held at that temperature for 15 min, and then slowly cooled at 0.2 K/s.
Nevertheless, the Nb addition showed no thermodynamic effect on the austenite start and end temperatures under equilibrium, Ae1 and Ae3, respectively, as revealed by the thermodynamic calculations and illustrated in Figure 11. Therefore, it could be deduced that the varied starting microstructure was the reason for the higher Ar3 of the Nb alloyed DI. The preexisting NbC particles, which represent nucleation sites during continuous cooling and the finer eutectoid cells, both favored the transformation process in such a way that the austenite decomposition took place earlier in the Nb alloyed DI. On the other hand, the reason for the significantly lower measured Ar1 and Ar3 temperatures than the calculated Ae1 and Ae3 could be attributed to the sluggish kinetics of austenite decomposition during cooling. The calculated start and end temperatures of the eutectoid transformation were 773 °C and 811 °C, respectively.
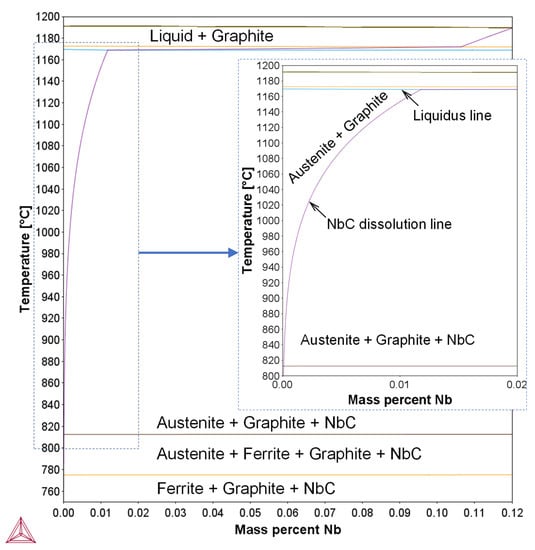
Figure 11.
Nb-based equilibrium diagram calculated using Thermo-Calc software of the studied ductile irons.
3.2. Ausferrite Formation in the ADI Alloys
3.2.1. Kinetics of Transformation
The dilatometric diagrams of the investigated alloys subjected to the three different austempering cycles are illustrated in Figure 12. Although the Nb addition did not affect the driving force of ausferrite formation (ΔGγα), as shown in Figure 13, the existence of NbC as a nucleator of the ausferrite phase influenced accelerating the formation of ausferrite during the austempering stage. Additionally, the smaller size of the eutectoid cell in the Nb alloyed ductile iron promoted the ausferrite formation kinetics. This was because the greater number of nucleation sites, resulting from the higher grain boundary areas, enhances the transformation kinetics. The following observations could be noticed from the dilatometry study:
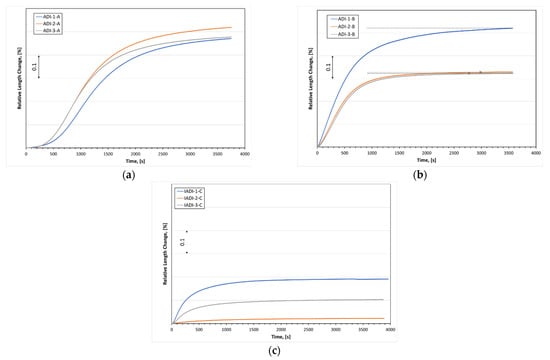
Figure 12.
The dilatation charts during continuous cooling of ductile iron alloys alloyed with different niobium contents: (a,b) samples were heated to 900 °C at 2 K/s, held at that temperature for 25 min, and then cooled at a high cooling rate of 20 K/s to the temperature of 275 °C and 375 °C, (c) samples were heated near to the eutectoid region (780 °C) at 2 K/s, held at that temperature for 25 min, and then quenched at a high cooling rate of 20 K/s to the temperature of 325 °C.
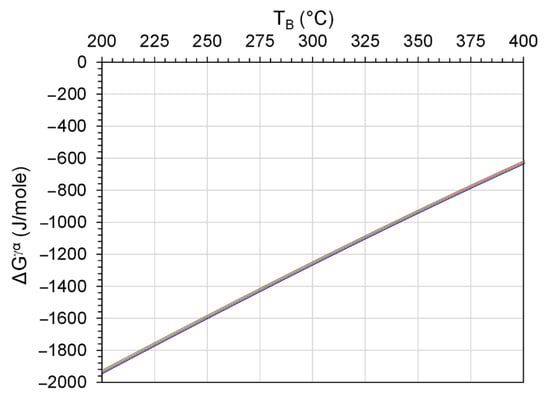
Figure 13.
Driving force of ausferrite formation transformation, ΔGγα of the three ductile irons (the curves of the three irons are almost coincident). The calculations are based on the composition of austenite at 900 °C.
Figure 12a illustrates the kinetics of ausferrite transformation at low austempering temperature, 275 °C. At the beginning of the transformation, a particular incubation time was required for the carbon atoms in the austenite to diffuse away to allow the ferrite needles to nucleate. Low austempering transformation revealed long incubation time than high austempering one (see Figure 12b) because the diffusion rate was slow at low temperatures. Alloys DI-2 and DI-3 displayed short incubation times than the alloy DI-1. This implies that NbC precipitates influenced the ausferrite transformation rate by providing more nucleation sites for the ausferrite formation.
At high austempering temperatures, 375 °C, Nb microalloyed DI alloys showed a higher transformation rate than in the DI-1 alloy. In addition, the presence of the NbC precipitated, and the high nodule count of the fine graphite in the matrix of DI-2 and DI-3 significantly reduces the time required for the cessation of ausferrite transformation. Ahmadabadi et al. [37] defined the end of reaction I of the ausferrite transformation by reaching a plateau in the transformation curve. Horizontal dotted line illustrators were plotted nearby these points to determine them (see Figure 12b).
Figure 12c depicts the ausferrite transformation curves for the investigated alloys after the intercritical austenitizing at 780 °C and austempering at 325 °C. It is obvious that the three alloys provide lower dilatation values compared to the other mentioned austempering heat-treatment cycles in Figure 12a,b. The presence of proeutectoid ferrite in the matrix in addition to the small amount of ausferrite formation explains the lower dilatation values for the intercritically annealed austempered ductile iron (IADI) samples. Furthermore, the intercritical austenite formed at 780 °C was predicted to contain 0.50 wt % carbon, whereas that formed by annealing at 900 °C was predicted to contain 0.75 wt % of carbon. The lower hardenability of the intercritically annealed austenite resulted in an additional motivation of the ausferrite transformation kinetics.
In the context of microalloying with Nb, the high carbon content of irons resulted in stabilizing the NbC in DI-2 and DI-3 such that it could only be completely dissolved above the melting temperature, as shown in Figure 11. Indeed, in order for any precipitate-forming microalloying elements to effectively provide strengthening, they must be first brought into the solution at the stage of austenitization. The subsequent deformation [38] or isothermal holding heat treatments [39] results in the formation of nanosized particles (nano-precipitates). Therefore, the high carbon content of cast irons presents a hindrance for exploiting the potential of microalloying because of the increased NbC dissolution temperature. The NbC in the DI-2 and DI-3 formed during solidification (Figure 11) remains almost intact during heat treatments. In contrast, in microalloyed steels, which had NbC with lower stability compared to cast iron (due to the lower carbon content of the steels), the Nb can form nanosized precipitates because it was amenable to be dissolved in austenite during reheating.
Nevertheless, the NbC particles in ductile irons could partially dissolve in austenite during annealing, which resulted in increasing its Nb content and subsequent formation of nanosized NbC. Figure 13 shows the predicted dependence of dissolved Nb in austenite on the annealing temperature. Actually, the austenite annealed at 900 °C was predicted to contain negligible content of Nb, as shown in Figure 14a. The thermodynamic calculation using MatCalc software illustrates that this trifling dissolution results in the formation of a venial quantity of nano-precipitates during holding at the austempering temperature, as shown in Figure 14b.
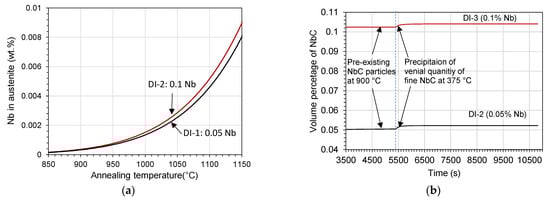
Figure 14.
(a) Predicted dependence of the dissolved Nb in austenite on the annealing temperature and (b) predicted development of volume percentage of the NbC particles during annealing at 900 °C and austempering at 375 °C of ductile irons DI-1 and DI-2.
3.2.2. Metallographic Characterization
As noted earlier, the microstructure of austempered ductile iron consisted of spheroidal graphite, which was dispersed in a matrix of high carbon austenite and ferrite needles called ausferrite. The final morphology of the ausferrite structure was determined according to the austenitization and the austempering temperature. Figure 15a–f illustrates the resulting microstructures of the dilatometry samples, which were austenitized at 900 °C and then austempered at two different temperatures of 275 °C and 375 °C. The main features of the microstructures could be described as follows:
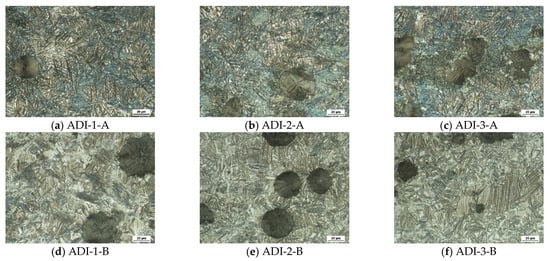
Figure 15.
Optical micrographs of the austempered ductile iron alloys produced using two different austempering heat-treatment schemes indicating the effect of different niobium additions on the final ausferrite morphology.
At low austempering temperature, i.e., 275 °C, the graphite spheroids were dispersed in a matrix of fine ausferrite due to enhanced ferrite nucleation at a higher degree of undercooling and hence more refined ausferritic structure (Figure 15a–c). The ferrite phase appears as dark areas, whereas the austenite appears as bright areas. Increasing the austempering temperature to 375 °C led to coarsening of the ausferrite needles from the parent austenite together with the increased carbon diffusion rate, which rendered the ferrite to be coarser with feathery morphology (Figure 15d–f).
Niobium addition had a remarkable effect on the ausferrite formation. It seems that Nb addition gave rise to an increase in the volume fraction of ausferrite at the expense of retained austenite when the Nb content increased from 0 to 0.1 wt %. This might happen because of the existence of the NbC precipitates, which acted as nucleation sites for the lamellar ferrite of the ausferritic structure during the ausferrite transformation. At low austempering temperature, a finer ausferrite structure was noticed at the intercellular area of the graphite in the three investigated alloys. As mentioned above in Section 3.1.1, copper atoms segregated at the γ/G interface during solidification and represented a barrier against carbon diffusion from austenite to graphite. In such cases, a decrease in C-stability in austenite will take place upon cooling and resulted in forming different ausferrite morphology in the matrix. The inhomogeneity of carbon content may be enhanced at a lower austempering temperature of 275 °C, where the diffusion rate of carbon was rather low. Moreover, a finer ausferrite structure was observed in Nb microalloyed ductile iron samples that were austempered at low and high austempering temperatures.
Figure 16a–c shows the optical micrographs of the dilatometry samples that intercritically austenitized at 780 °C and austempered at 325 °C. The microstructure of the IADI samples consisted of ausferrite and proeutectoid ferritic islands in the ausferrite continuous phase. As a result of the low austenitizing temperature, the austenite was relatively low in carbon, which raised the Ms temperature during water quenching, resulting in increased martensite formation during cooling. As previously mentioned, Nb addition results in multiplying the eutectic cells. As a result, the amount of proeutectoid ferrite increased when the Nb content increased from 0 wt % to 0.1 wt % Nb.
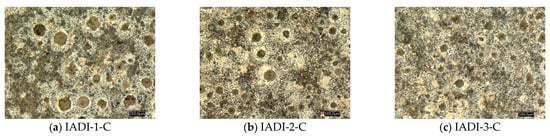
Figure 16.
Optical micrographs of the dilatometry samples intercritically austenitized at 780 °C and austempered at 325 °C: (a) IADI-1-C, 0 wt % Nb, (b) IADI-2-C, 0.05 wt % Nb, (c) IADI-3-C, 0.1 wt % Nb.
3.3. Mechanical Properties of the ADI Alloys
3.3.1. Tensile Behavior
The values of the ultimate tensile strength (UTS), yield strength (YS) and elongation (e) are listed in Table 2, which concludes the average values of the three specimens. It is obvious that the heat-treatment parameters, as well as the alloying additions, had a great impact on the mechanical behavior of the developed ADI alloys. Figure 17 represents the engineering stress—strain curves for all investigated ADI samples. Some remarks of interest may be summarized as follows:
Table 2.
Effect of Nb contents and austempering heat treatment on the tensile properties of ADI.
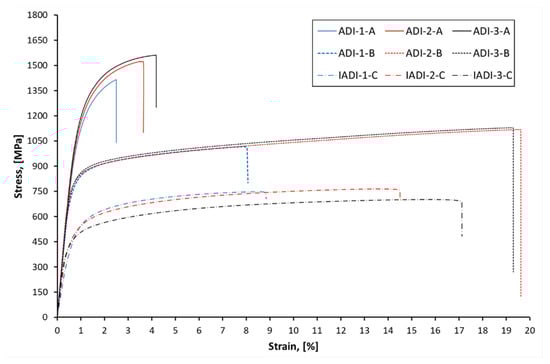
Figure 17.
Engineering stress—strain curves obtained during tensile testing of the investigated ADI alloys microalloyed with three different niobium contents.
- ADI samples, austempered at low temperature showed superior strength values; ultimate tensile strength ranged between 1411 Mpa (0 wt % Nb), 1412 Mpa (0.05 wt % Nb) and 1538 Mpa (0.1 wt % Nb). The yield strength values fell between 1112 Mpa (0 wt % Nb), 1087 Mpa (0.05 wt % Nb) and 1027 Mpa (0.1 wt % Nb). These surprisingly high-strength values, which exceed those of most alloyed steels, were associated with low elongations levels of 1.45% (0 wt % Nb), 2.8% (0.05 wt % Nb) and 3.5% (0.1 wt % Nb);
- Increasing the austempering temperature resulted in a considerable decrease in the strength values, whereas the ductility significantly increased. The ultimate tensile strength ranged between 1026 Mpa (0 wt % Nb), 1088 Mpa (0.05 wt % Nb) and 1113 Mpa (0.1 wt % Nb). The yield strength values fell between 767 Mpa (0 wt % Nb), 774 Mpa (0.05 wt % Nb) and 805 Mpa (0.1 wt % Nb). Thanks to the Nb addition, these ADI grade seemed to have excellent strength/ductility combination. The ductility value exceeded the levels of 7.6% (0 wt % Nb) and 18% in both Nb microalloyed samples;
- Finally, the IADI samples show elongation value very close to ferritic grades of DI, with strength values increased by about 50%. Apparently, the enhanced elongation was related to the presence of proeutectoid ferrite and NbC precipitates, whereas the increased strength was attributed to the reinforcing effect of ausferrite in the structure.
To confirm the decisive role of the morphology of the ausferrite on the tensile behavior of the Nb microalloyed ADI samples, SEM micrographs were obtained (see Figure 18). It was mentioned earlier that Nb addition resulted in refining the graphite structure and increasing the number of eutectic cells. This would explain the short-length ausferrite structure and the fine austenite blocks that appeared in the Nb microalloyed ADI samples. Moreover, the inhomogeneity of C-content in the matrix resulted in the formation of coarse ausferrite structure and fine sheaves of ausferrite (marked by a red circle).
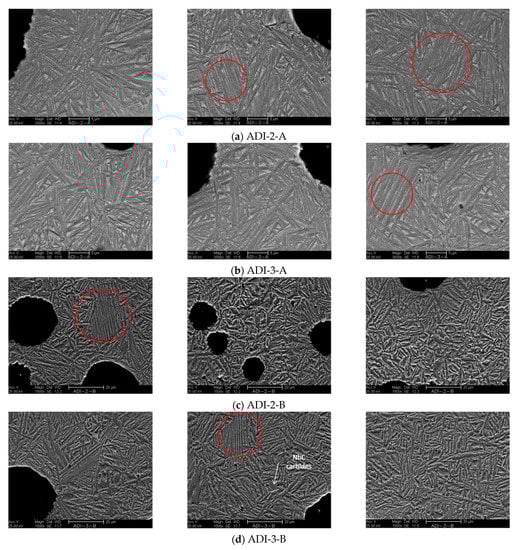
Figure 18.
SEM micrographs at different magnifications of the tensile test samples of two ADI alloys alloyed two different Nb contents: (a,b) ADI samples austempered at 275 °C and alloyed with 0.04 wt % Nb and 0.1% wt % Nb, respectively, (c,d) ADI samples austempered at 375 °C and alloyed with 0.04 Nb and 0.1% Nb, respectively.
Figure 19 illustrates the microstructure of the IADI tensile samples. It could be noticed that the amount of proeutectoid ferrite increased as the Nb content increased from 0 wt % to 0.1 wt % Nb. This would certainly interpret the increase in the elongation values with increasing from 8.0% to 16.8%when the Nb content increased from 0 wt % to 0.1 wt %, respectively.
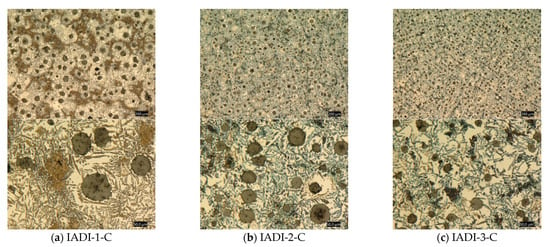
Figure 19.
Optical micrographs at two different magnifications of the tensile samples intercritically austenitized at 780 °C and austempered at 325 °C: (a) IADI-1-C, 0 wt % Nb, (b) IADI-2-C, 0.05 wt % Nb, (c) IADI-3-C, 0.1 wt % Nb.
3.3.2. Compression Testing
Figure 20 displays the true stress—true strain curves measured during compression tests of the ADI samples. In general, low austempering temperature, 275 °C samples showed the highest compression strength values (over 2000 MPa) and low ductility results. By increasing the austempering temperature to 375 °C, the best combination of compression strength and ductility was evident. It seems that the presence of proeutectoid ferrite in the IADI alloys resulted in increased ductility at the expense of both yield and compression strength. It was also obvious that Nb addition resulted in increasing the ductility at high austempered temperatures and IADI samples.
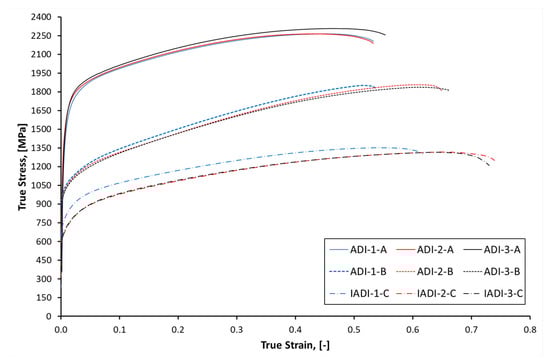
Figure 20.
True stress—strain curves obtained during compression of the investigated ADI alloys microalloyed with three different niobium contents.
4. Conclusions
The effect of Nb microalloying on the microstructure and the mechanical properties of Ni-Cu alloyed ductile iron, and different ADI alloys were investigated. The following observations could be concluded:
Effect of Nb on ductile irons:
- By increasing the niobium content in the alloy to 0.1 wt %, the nodule count (N.C.) of the graphite increased, but concurrently, it slightly decreased the nodularity (N). In addition, Nb addition significantly increased the number of eutectic cells and refined the graphite structure. Furthermore, thanks to the nanocarbon additions, extremely fine graphite with a diameter ranging between (3–5 µm) were homogeneously distributed in the matrix;
- Coarse, fine, broken lamellae and spheroidized pearlite structures were observed in all investigated ductile iron samples. SEM micrographs clearly revealed that with increasing the Nb content, the finer pearlite structure formed in the matrix;
- Nb microalloyed ductile iron alloys showed different sizes and morphologies of niobium carbide particles. Nanosized NbC precipitates were observed in the 0.05 wt % Nb alloy. By increasing the Nb content to 0.1 wt %, the size and volume fraction of the NbC particles increased. (NbC primary carbides with a size of 3.5–4.0 µm) were observed in the ductile iron alloyed with up to 0.1 wt % Nb.
Effect of Nb on ADI:
- The dilatometry studies together with the thermodynamic calculations proved that NbC nanoparticles acted as nucleation sites for the graphite as well as for the ferrite needles of the ausferrite. Therefore, Nb addition accelerated the formation of ausferrite during the austempering stage. Additionally, the smaller size of the eutectoid cell in the Nb alloyed ductile iron promoted the ausferrite formation kinetics. Moreover, Nb prevented the grain growth of the austenite during the austenitization stage of the austempering heat-treatment process;
- The more Nb content in the ADI alloys, the finer ausferrite structure was produced in the matrix. A short-length ausferrite structure with fine austenite blocks was formed in the Nb microalloyed ADI samples. Moreover, the inhomogeneity of C- content in the matrix was caused by Cu additions; thus, resulting in the formation of both coarse ausferrite and fine sheaves of ausferrite structure;
- In all developed ADI alloys, Ni, Cu, and microalloying with Nb additions positively affected increasing both strength and ductility properties. The excellent strength/ductility combination was achieved in the Nb microalloyed ADI samples, which austenitized at 900 °C and austempered at a temperature of 375 °C.
Author Contributions
Conceptualization, M.A., A.N., R.B.; methodology, M.A., M.Y.; software, M.S.; validation, M.A., M.S., M.Y.; formal analysis, M.A., M.S., A.N.; investigation, M.A., M.Y; resources, M.A., M.S; data curation, M.A., M.S.; writing—original draft preparation, M.A.; writing—review and editing, M.A., M.S., R.B., A.N.; visualization, M.A., M.S., R.B., A.N.; supervision, R.B., A.N. All authors have read and agreed to the published version of the manuscript.
Funding
This research received no external funding.
Data Availability Statement
The data used to support the findings of this study are available from the corresponding authors upon request.
Acknowledgments
Authors would like to thank M. Maamoun from Central Metallurgical R&D Institute, Department of Corrosion Controls, and surface Protection for his valuable contribution in the preparation of the graphene nanopowder.
Conflicts of Interest
The authors declare no conflict of interest.
References
- Nofal, A. Advances in the metallurgy and applications of ADI. J. Metall. Eng. 2013, 2, 1–18. [Google Scholar]
- Kovacs, B.V. Development of austempered ductile iron (ADI) for automobile crankshafts. J. Heat Treat. 1987, 5, 55–60. [Google Scholar] [CrossRef]
- ASTM A897/A897M-16. Standard Specification for Austempered Ductile Iron Castings; ASTM International: West Conshohocken, PA, USA, 2016. [Google Scholar]
- Harding, R.A. The production, properties and automotive applications of austempered ductile iron. Kov. Mater. 2007, 45, 1–16. [Google Scholar]
- Batra, U.; Ray, S.; Prabhakar, S.R. The Influence of Nickel and Copper on the Austempering of Ductile Iron. J. Mater. Eng. Perform. 2004, 13, 64–68. [Google Scholar] [CrossRef]
- Batra, U.; Ray, S.; Prabhakar, S.R. Austempering and Austempered Ductile Iron Microstructure in Copper Alloyed Ductile Iron. J. Mater. Eng. Perform. 2003, 12, 426–429. [Google Scholar] [CrossRef]
- Amran, Y.; Katsman, A.; Schaaf, P.; Bamberger, M. Influence of Copper Addition and Temperature on the Kinetics of Austempering in Ductile Iron. Metall. Mater. Trans. B 2010, 41, 1052–1058. [Google Scholar] [CrossRef]
- Sertucha, J.; Larrañaga, P.; Lacaze, J.; Insausti, M. Experimental Investigation on the Effect of Copper Upon Eutectoid Transformation of As-Cast and Austenitized Spheroidal Graphite Cast Iron. Int. Met. 2010, 4, 51–58. [Google Scholar] [CrossRef]
- Rajnovic, D.; Eric, O.; Sidjanin, L. The standard processing window of alloyed ADI materials. Kov. Mater. 2012, 50, 199–208. [Google Scholar] [CrossRef][Green Version]
- Shih, T.-S.; Yang, Z.-C. Effects of nickel and processing variables on the mechanical properties of austempered ductile irons. Int. J. Cast Met. Res. 1998, 10, 335–344. [Google Scholar] [CrossRef]
- Bosnjak, B.; Radulovic, B.; Pop-Tonev, K.; Asanovic, V. Influence of Microalloying and Heat Treatment on the Kinetics of Bainitic Reaction in Austempered Ductile Iron. J. Mater. Eng. Perform. 2001, 10, 203–211. [Google Scholar] [CrossRef]
- Reda, R.; Nofal, A.A.; Ibrahim, K.M.; Hussien, A.-H.A. Microstructure–wear performance relationship of hypoeutectic 15% Cr-2% Mo white iron. Int. J. Mater. Res. 2012, 103, 838–846. [Google Scholar] [CrossRef]
- Zhi, X.; Xing, J.; Fu, H.; Xiao, B. Effect of niobium on the as-cast microstructure of hypereutectic high chromium cast iron. Mater. Lett. 2008, 62, 857–860. [Google Scholar] [CrossRef]
- Beniwal, G.; Saxena, K.K. Effect of niobium addition in grey cast iron: A short review. Mater. Today Proc. 2020, 26, 2337–2343. [Google Scholar] [CrossRef]
- Devecili, A.O.; Yakut, R. The Effect of Nb Supplement on Material Characteristics of Iron with Lamellar Graphite. Adv. Mater. Sci. Eng. 2014, 2014, 1–5. [Google Scholar] [CrossRef][Green Version]
- Pan, S.; Zeng, F.; Su, N.; Xian, Z. The effect of niobium addition on the microstructure and properties of cast iron used in cylinder head. J. Mater. Res. Technol. 2020, 9, 1509–1518. [Google Scholar] [CrossRef]
- Franzen, D.; Weiß, P.; Pustal, B.; Bührig-Polaczek, A. Modification of Silicon Microsegregation in Solid-Solution-Strengthened Ductile Iron by Alloying with Aluminum. Int. Met. 2020, 14, 1105–1114. [Google Scholar] [CrossRef]
- Borsato, T.; Ferro, P.; Berto, F.; Carollo, C. Effect of Solidification Time on Microstructural, Mechanical and Fatigue Properties of Solution Strengthened Ferritic Ductile Iron. Metals 2019, 9, 24. [Google Scholar] [CrossRef]
- Borsato, T.; Ferro, P.; Fabrizi, A.; Berto, F.; Carollo, C. Long solidification time effect on solution strengthened ferritic ductile iron fatigue properties. Int. J. Fatigue 2021, 145, 106137. [Google Scholar] [CrossRef]
- Riebisch, M.; Pustal, B.; Bührig-Polaczek, A. Impact of carbide-promoting elements on the mechanical properties of solid-solution-strengthened ductile iron. Int. Met. 2020, 14, 365–374. [Google Scholar] [CrossRef]
- Bedolla-Jacuinde, A.; Solis, E.; Hernandez, B. Effect of niobium in medium alloyed ductile cast irons. Int. J. Cast Met. Res. 2003, 16, 481–486. [Google Scholar] [CrossRef]
- Chen, X.; Xu, J.; Hu, H.; Mohrbacher, H.; Kang, M.; Zhang, W.; Guo, A.; Zhai, Q. Effects of niobium addition on microstructure and tensile behavior of as-cast ductile iron. Mater. Sci. Eng. A 2017, 688, 416–428. [Google Scholar] [CrossRef]
- Chen, X.; Zhao, L.; Zhang, W.; Mohrbacher, H.; Wang, W.; Guo, A.; Zhai, Q. Effects of niobium alloying on microstructure, toughness and wear resistance of austempered ductile iron. Mater. Sci. Eng. A 2019, 760, 186–194. [Google Scholar] [CrossRef]
- Abdullah, B.; Alias, S.K.; Jaffar, A.; Rashid, A.A.; Haskil, M.; Ramli, A. Tensile Strength Properties of Niobium Alloyed Austempered Ductile Iron on Different Austempering Time. AMR 2012, 457–458, 1155–1158. [Google Scholar] [CrossRef]
- Bakkerus, H.; van DER, H.B. Dutch develop vortex process for ductile iron treatment. Mod. Cast. 1981, 71, 41–44. [Google Scholar]
- Fraś, E.; Górny, M.; Kawalec, M. Effect of small additions of vanadium and niobium on structure and mechanical properties ductile iron. Arch. Foundry Eng. 2007, 7, 89–90. [Google Scholar]
- Fraś, E.; Górny, M.; Tyrała, E.; Lopez, H. Effect of nodule count on austenitising and austempering kinetics of ductile iron castings and mechanical properties of thin walled iron castings. Mater. Sci. Technol. 2012, 28, 1391–1396. [Google Scholar] [CrossRef]
- Guo, X.; Stefanescu, D.M.; Chuzhoy, L.; Pershing, M.A.; Biltgen, G.L. A mechanical properties model for ductile iron. AFS Trans. 1997, 105, 47–54. [Google Scholar]
- Wang, Z.; Zhang, X.; Xu, F.; Qian, K.; Chen, K. Effect of nodularity on mechanical properties and fracture of ferritic spheroidal graphite iron. China Foundry 2019, 16, 386–392. [Google Scholar] [CrossRef]
- Fraś, E.; Górny, M.; Blicharski, M.; Dymek, S.; Guzik, E. Synthesis of nanoparticeles in ductile iron with small additions of vanadium and niobium and its mechanical properties. Arch. Foundry Eng. 2007, 7, 49–56. [Google Scholar]
- Tsujikawa, M.; Matsumoto, N.; Nakamoto, K.; Michiura, Y. Pearlite Stabilisation by Copper on Ductile Cast Iron. KEM 2010, 457, 151–156. [Google Scholar] [CrossRef]
- Riebisch, M.; Weiß, P.; Cremer, C.; Aboulkhair, I.; Bührig-Polaczek, A. Properties and microstructure of copper-alloyed solid solution-strengthened ductile iron. Mater. Sci. Technol. 2018, 34, 725–730. [Google Scholar] [CrossRef]
- Guo, X.; Stefanescu, D.M. Partitioning of alloying elements during the eutectoid transformation of ductile iron. Int. J. Cast Met. Res. 1999, 11, 437–441. [Google Scholar] [CrossRef]
- Vander Voort, G.F.; Roósz, A. Measurement of the interlamellar spacing of pearlite. Metallography 1984, 17, 1–17. [Google Scholar] [CrossRef]
- Tian, Y.L.; Kraft, R.W. Mechanisms of Pearlite Spheroidization. Metall. Trans. A 1987, 18, 1403–1414. [Google Scholar] [CrossRef]
- de Meyer, M.; Mahieu, J.; de Cooman, B.C. Empirical microstructure prediction method for combined intercritical annealing and bainitic transformation of TRIP steel. Mater. Sci. Technol. 2002, 18, 1121–1132. [Google Scholar] [CrossRef]
- Ahmadabadi, M.N.; Farjami, S. Transformation kinetics of unalloyed and high Mn austempered ductile iron. Mater. Sci. Technol. 2003, 19, 645–649. [Google Scholar] [CrossRef]
- Soliman, M. Microstructural Control and Properties Optimization of Microalloyed Pipeline Steel. Metals 2020, 10, 1499. [Google Scholar] [CrossRef]
- Brito, R.M.; Kestenbach, H.-J. On the dispersion hardening potential of interphase precipitation in micro-alloyed niobium steel. J. Mater. Sci. 1981, 16, 1257–1263. [Google Scholar] [CrossRef]
Publisher’s Note: MDPI stays neutral with regard to jurisdictional claims in published maps and institutional affiliations. |
© 2021 by the authors. Licensee MDPI, Basel, Switzerland. This article is an open access article distributed under the terms and conditions of the Creative Commons Attribution (CC BY) license (https://creativecommons.org/licenses/by/4.0/).