Article

Effects of Gas Pressure during Electron Beam Energy Deposition in the EBM Additive Manufacturing Process

1
Nuclear Research Center (NRCN), P.O. Box 9001, Beer-Sheva 84190, Israel
2
Department of Nuclear Engineering, Ben-Gurion University of the Negev, Beer-Sheva 84105, Israel
3
AM R&D Center, AM Center, Rotem Industries, Mishor Yamin 86800, Israel
*
Author to whom correspondence should be addressed.
Metals 2021, 11(4), 601; https://doi.org/10.3390/met11040601
Submission received: 2 March 2021 / Revised: 20 March 2021 / Accepted: 24 March 2021 / Published: 7 April 2021
(This article belongs to the Special Issue Additive Manufacturing Processes in Metals)

Abstract

:
Electron beam melting (EBM) is a metal powder bed fusion additive manufacturing (AM) technology that facilitates the production of metal parts by selectively melting areas in layers of metal powder. The electron beam melting process is conducted in a vacuum chamber environment regulated with helium (He) at a pressure on the scale of 10−3 mbar. One of the disadvantages of vacuum environments is the effect of vapor pressure on volatile materials: indeed, elements in the pre-alloyed powder with high vapor pressure are at risk of evaporation. Increasing the He pressure in the process can improve the thermodynamic stability of the pre-alloyed components and decrease the composition volatility of the solid. However, increasing the pressure can also attenuate the electrons and consequently reduce the energy deposition efficiency. While it is generally assumed that the efficiency of the process is 90%, to date no studies have verified this. In this study, Monte Carlo simulations and detailed thermal experiments were conducted utilizing EGS5 and an Arcam Q20+ machine. The results reveal that increasing the gas pressure in the vacuum chamber by one order of magnitude (from 10−3 mbar to 10−2 mbar) did not significantly reduce the energy deposition efficiency (less than 1.5%). The increase in gas pressure will enable the melting of alloys with high vapor pressure elements in the future.

1. Introduction

Electron beam melting (EBM) is a metal powder bed fusion additive manufacturing (AM) technology [1,2] that facilitates the fabrication of three-dimensional near-net-shaped parts by spreading successive layers of metal powder on a powder bed-chamber and selectively melting areas in them [3,4].
Previous studies have reviewed the transient physical effects that occur during EBM process [5], helping to shape specific procedures that improve its efficiency. Preheating the powder bed contends with the most important transient effect—the “smoking effect” [6], which occurs when the oxide over layer on the Ti64 particles electrically insulates the particles and charges the powder bed during EBM, acting as a capacitor. Consequently, when an electron beam interacts with the cold powder, part of the energy is lost and not deposited (and transferred to heat) as intended. This happens when some powder becomes charged by the electrons [5], resulting in a kinematic phenomenon in which recoiled powder particles are ejected from the powder bed. It was found that preheating the powder bed facilitates optimal efficiency of the energy deposition during melting [7].
Prior to melting, each powder layer is preheated to a temperature of about 700 °C (which is ~0.5 of the melting temperature of Ti64 in °K). This study demonstrates how additional parameters, such as gas partial pressure might influence the efficiency of energy deposition to the metal alloy.
In L-PBF (laser powder bed fusion) and LMD (laser metal deposition) technologies, the process atmosphere, usually inert gas, has a significant effect on the rapid solidification rates and the consequent microstructure [8,9]. Yet, in EBM vacuum environment affects not only the above parameters but also enables low level of oxygen contamination. Melting stage of EBM is conducted in the same way as the preheating stage, in a controlled vacuum regulated with helium (He) atmosphere (10−3 mbar), thus ensuring minimal interaction with the beam along its path. Among the many advantages of vacuum controlled environment, some disadvantages should be noted. Due to the high temperatures and low pressures used during the EBM process, high vapor pressure components are at risk of evaporation [10,11,12]. Evaporation of a certain element from an alloy alters the chemical composition of the manufactured parts, which may impair the properties of the product and its durability [13]. One possible solution to this is raising the ambient process pressure, resulting in evaporation at a higher temperature [14]. However, increasing the pressure may attenuate the electrons and consequently decrease energy deposition efficiency.
Seeking to reduce evaporation losses in Ti64 [15], some studies have reviewed process parameters such as scanning speed, while others have investigated the relationship between porosity and loss of aluminum due to evaporation [16]. This study endeavors to achieve a balanced state in which the chamber pressure will, on the one hand, suppress the evolved elements phenomenon and, on the other, ensure that the beam path is not affected by electron–gas interactions that may attenuate the electron beam.
It is generally assumed that the efficiency of the process varies between 88% and 91% [17,18]. However, the process efficiency in a powder bed EBM can be affected by many variables, and this has not yet been verified by studies.
It is well-known that EB possesses high penetration ability [19], previous studies have used CASINO [20] Monte Carlo (MC) to develop heat source models and thus determine the maximum penetration depth of the electron [21,22]. However, this study employs the MC–EGS5 (Electron-Gamma Shower) code system to calculate the electrons’ energy deposition on the metal alloy. EGS5 is a general-purpose package for the MC simulation of the coupled transport of electrons and photons in an arbitrary geometry for particles with energies ranging from above a few KeV (Kilo electron Volt) to several hundred GeV (Giga electron Volt) [23]. The EGS5 code uses well-known cross-section tables for elements (Z = 1 through 100) to calculate the electrons’ energy transport for any element, compound, or mixture. The electron cross sections are based on previous studies [24,25]. Since the previous EGS4 (SLAC National Accelerator Laboratory, Menlo park, California) code was released in the 1990s, it has been used in a wide variety of applications, particularly in radiation measurement studies. It has been found to be both accurate and reliable, thus commonly used in medical radiotherapy research [26]. The EGS5 code consists of many subprograms and subroutines, some of which are user-written.
When electrons accelerate and interacts with a material object, different interactions can occur. Such interactions are usually divided into two types: elastic and inelastic. In an elastic interaction, the electron can alter its course while retaining its energy. However, inelastic interactions result in electrons energy loss and the emission of secondary particles. These inelastic interactions can further be divided into countable catastrophic interactions and enormous soft interactions, both of which are statistically grouped into separate steps of interactions, a classification first made by M. J. Berger [27]. Several types of catastrophic and soft interactions [28] in the range of 1 keV up to 100 keV can be detected in an AM process. The first is a Bremsstrahlung emission (eN → eγN) — the creation of photons above the threshold variables, AP and AE (the lower threshold photon and electron cutoff energy), by electrons in the field of an atom [29]. Another interaction is Møller scattering (ee → ee) — when incident electrons collide with another electron [30,31]. The last is X-ray fluorescence (XRF) or Auger electrons—the emission of X-rays or secondary electrons from a material that has been excited by the external energy [32]. This can also be detected in processes involving metal material, such as AM.
While previous work focused on the interactions that occur during the process of the electrons’ transport [33,34]. This study presents calculations of the electrons’ energy deposition efficiency to the metal alloy using EGS5 simulations, which were validated by thermal experiments performed using an Arcam Q20+ machine (Arcam, Mölndal, Sweden). It aimed to discover the optimal gas pressure point to decrease the composition volatility of the melt pool while not significantly attenuating the electrons and consequently preserving the energy deposition efficiency.

2. Motivation

Due to their vast industrial importance, the thermodynamic properties of steels have been thoroughly studied. The difference between partial pressures of metallic elements in liquid states in pure vs. alloyed forms can be explained by the changes in entropy and other thermodynamic properties. This can be verified by comparing the partial pressure of chromium in a pure state [35] vs. in stainless steel 316L [36]. The partial pressure for chromium in a liquid solution of SS316L alloy was measured as 1.86 × 10⁻² atm [36], at a temperature of 2025 °C, which is the estimated temperature of the melt pool during the printing of Ti64. The ambient pressure of the EBM chamber is 4 × 10⁻⁶ atm, which is well under the partial pressure, and it is expected that the chromium will evaporate. Chromium depletion from stainless steels during vacuum annealing is a well-known phenomenon [37]. Nevertheless, previous studies did not detect a noticeable evaporation of chrome in steels [38], perhaps due to the rapid solidification rates. Other studies detect Mn evaporation using XRD analyses of sintered 316L [39] and changes in chemical composition were detected in Ti64 SLM [2]. Initial experiments conducted on Q20+ and SS 316L (TLS Technik GmbH, Bitterfeld-Wolfen, Deutschland) showed ~0.1 at% variations in Mn and Cr when comparing initial powder to the solid bulk (for additional information see Appendix B). This study demonstrates how additional factors such as partial gas pressure, influence the efficiency of energy deposition to the metal alloy. Increasing the gas pressure might reduce volatility for elements such as chromium or aluminum in the process. Hence exploring the optimal gas pressure environment that will suppress elemental evaporation without affecting the energy deposition efficiency, is the goal of this paper.

3. Methods

(1) Monte Carlo Simulations:
In this study, MC simulations (Los Alamos National Laboratory, New Mexico) were carried out using an EGS5 code system in order to distinguish the additional parameters that affect the process. The simulations can examine a wide range of pressures. Three files are needed to run an EGS5 simulation: the main Fortran file; a combinatorial geometry file containing the simulation 3D geometry details (including two zones, as shown in Figure 1; and the cross-sections parameters file, which includes the list of materials involved in the simulation.
The energy deposition calculation in the paper is based on the dose equation:
D o s e = E m = E ρ · v   [ Joule / kg ]
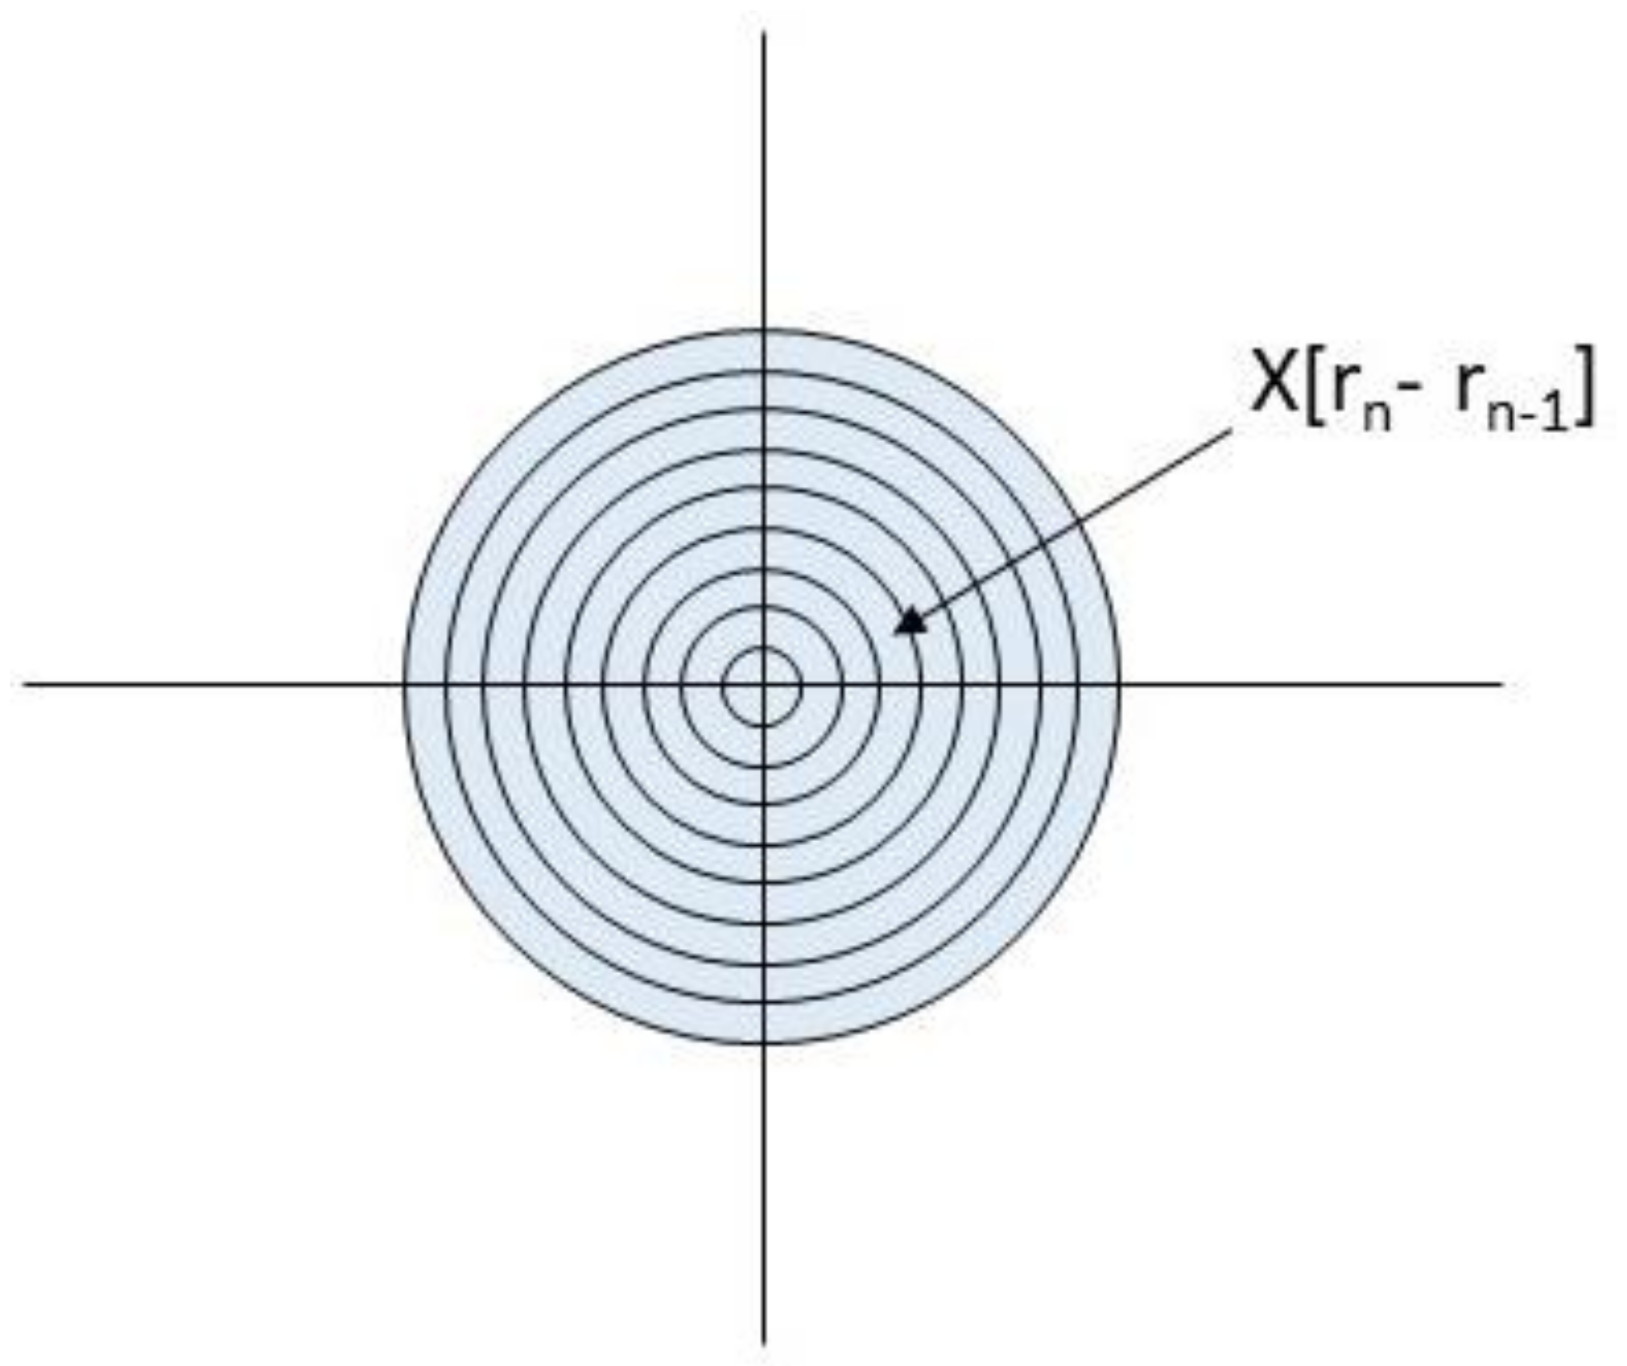
where ρ is the metal density (known constant) and V is the volume of the substrate below the beam. The sample model used in the simulations is based on a thick disk’s volume units (Figure 2). The disk volume ( V n ) can be obtained from Equation (2), where x is the disk’s radius difference (1 µm), and h is the disk’s thickness.
V n = π · x 2 2 n 1 · h   c m 3
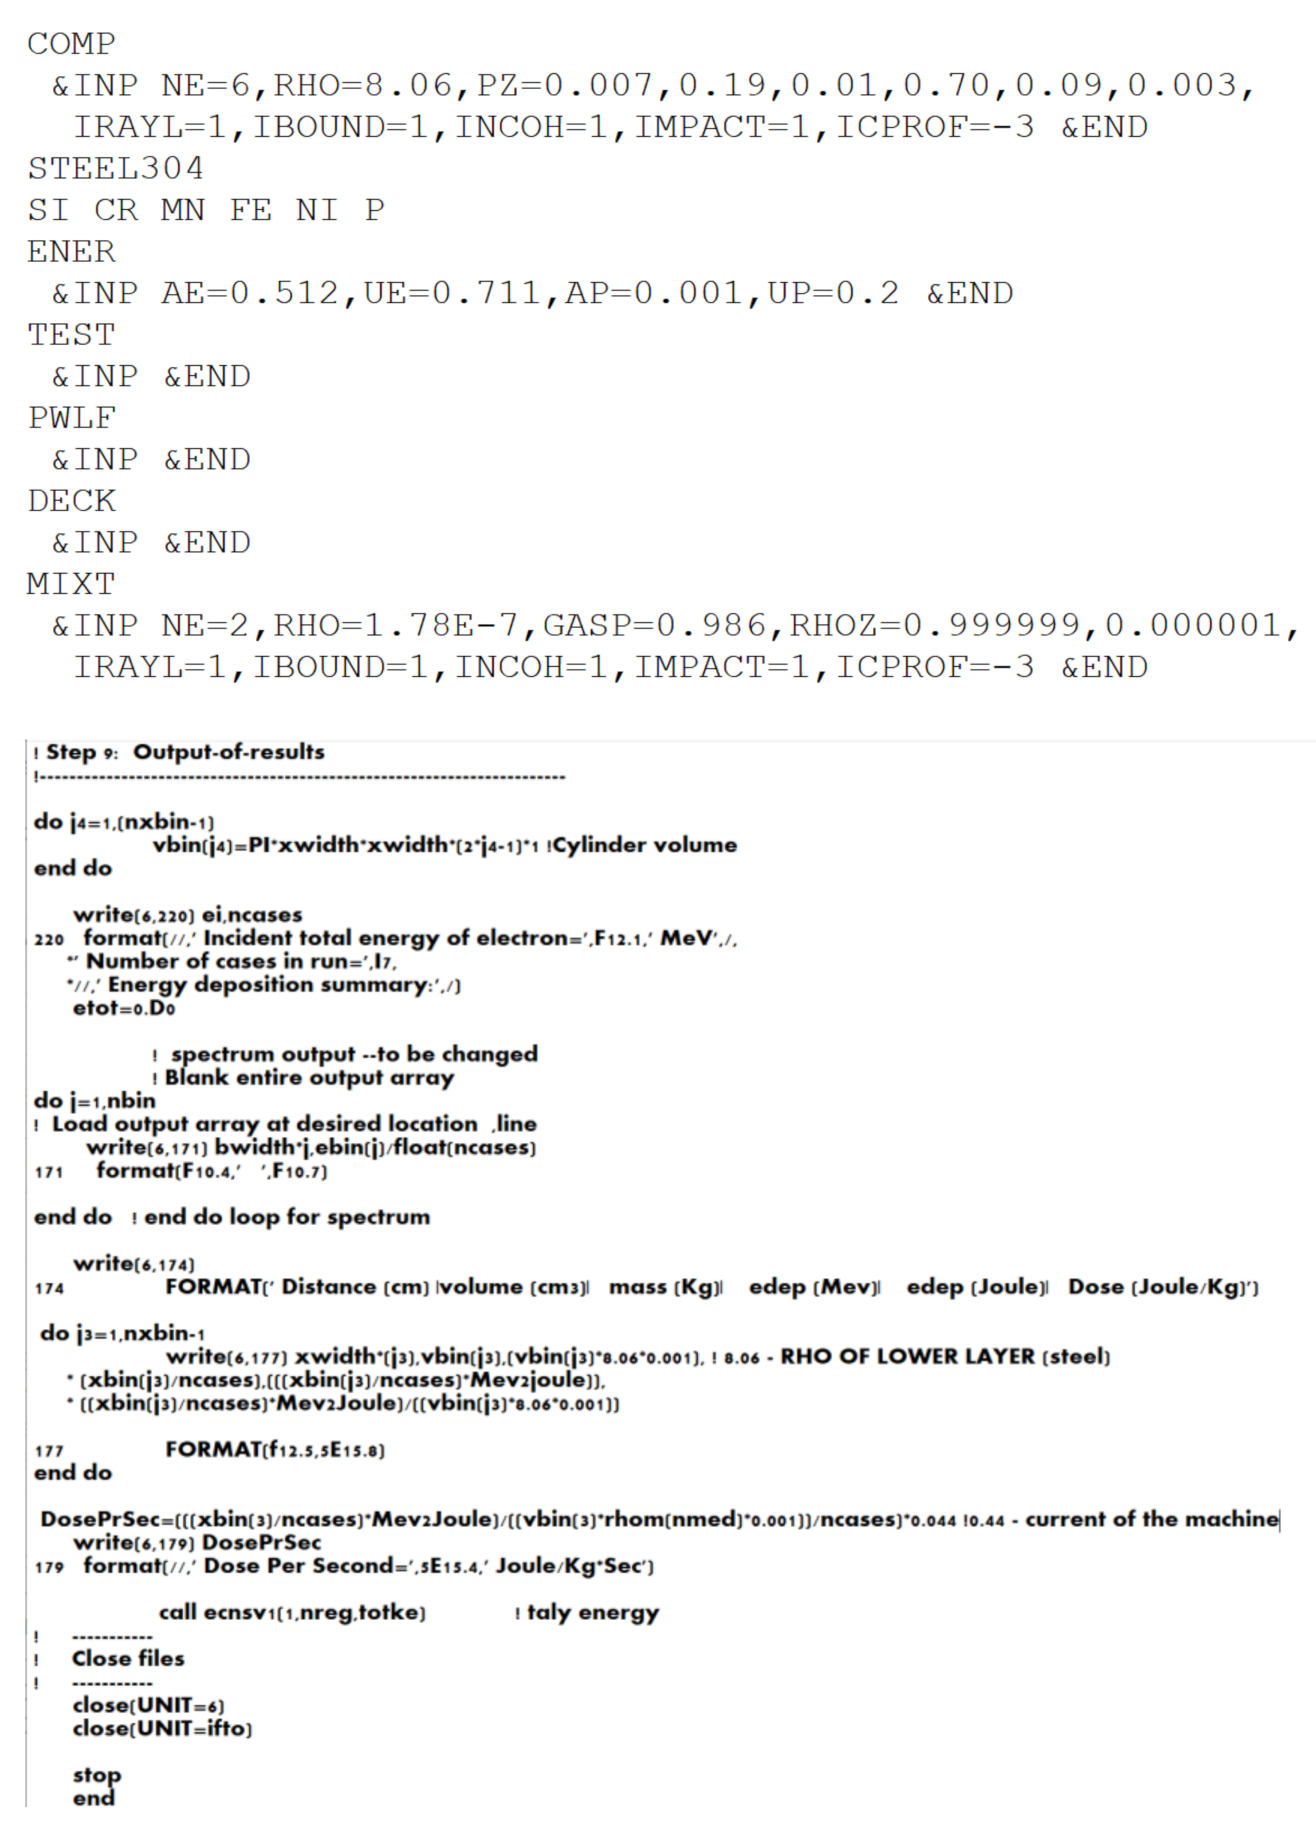
The process environment includes two zones with different He partial pressures (4 × 10⁻³ mbar at the vacuum chamber and lower than 10−4 mbar at the beam-column). The code must refer to those two zones when simulating the energy deposition using the EGS5 code system. In this study, the materials file used three mixtures: Steel 304L (Arcam, Mölndal, Sweden) plate (a mixture of Fe, Cr, Ni, Si, Mn, P) with a density of 8 g/cm3, He, and a second He with a different density (Appendix A). The EGS simulations can examine a wide range of materials, the code must refer to the atomic number on the simulations results.
The code and subroutine preparations must relate to all the process properties: beam energy (60 keV), beam current (44 mA), electrons and photons cutoff energies (1 keV), beam direction (negative Z-axis), and geometries—as shown in Figure 1 and Appendix A. The simulations were run using a gaussian beam with FWHM (full width at half maximum) of 100 μm and 800 μm, no influence of beam diameter on the simulations’ results was found. The output user-code was designed to include a table detailing which particles participated in which process, the extent of the particles’ contribution to the energy transported, and in which region the energy was deposited (SS304L plate or escaped outside the process geometries). Table 1 presents an example of an output file for a preheated SS304L plate simulation. It indicates that the electrons deposited 81.7% of the energy to the plate, 18.1% of the energy escaped as kinetic energy of electrons leaving the process geometry, and the rest produced XRF (0.2%).
The Monte Carlo method employs a pseudo-random number generator. To receive the variance and standard deviation, the user must repeat ten identical simulations with different seeds ranging between 1 and 231. In this study, all simulations were conducted with 106 histories, and it was found that the variance was σ 2 = 1.2 × 10 7 , and the standard deviation was   σ = 3.27 × 10 4 .
(2) Experiment:
To validate the findings, an experiment was conducted using an Arcam Q20+ system. A standard stainless steel 304L start plate was preheated using standard Arcam Q20+ preheating parameters (Table 2). The distance between the scan lines creates overlaps of about 200 microns, due to a LO (line offset) of 1.2 mm and a beam radius of 800 microns with an overlap area of 200 microns. Based on these parameters (estimated according to the line offset overlap), the beam is with FWHM of ~800 µm radius.
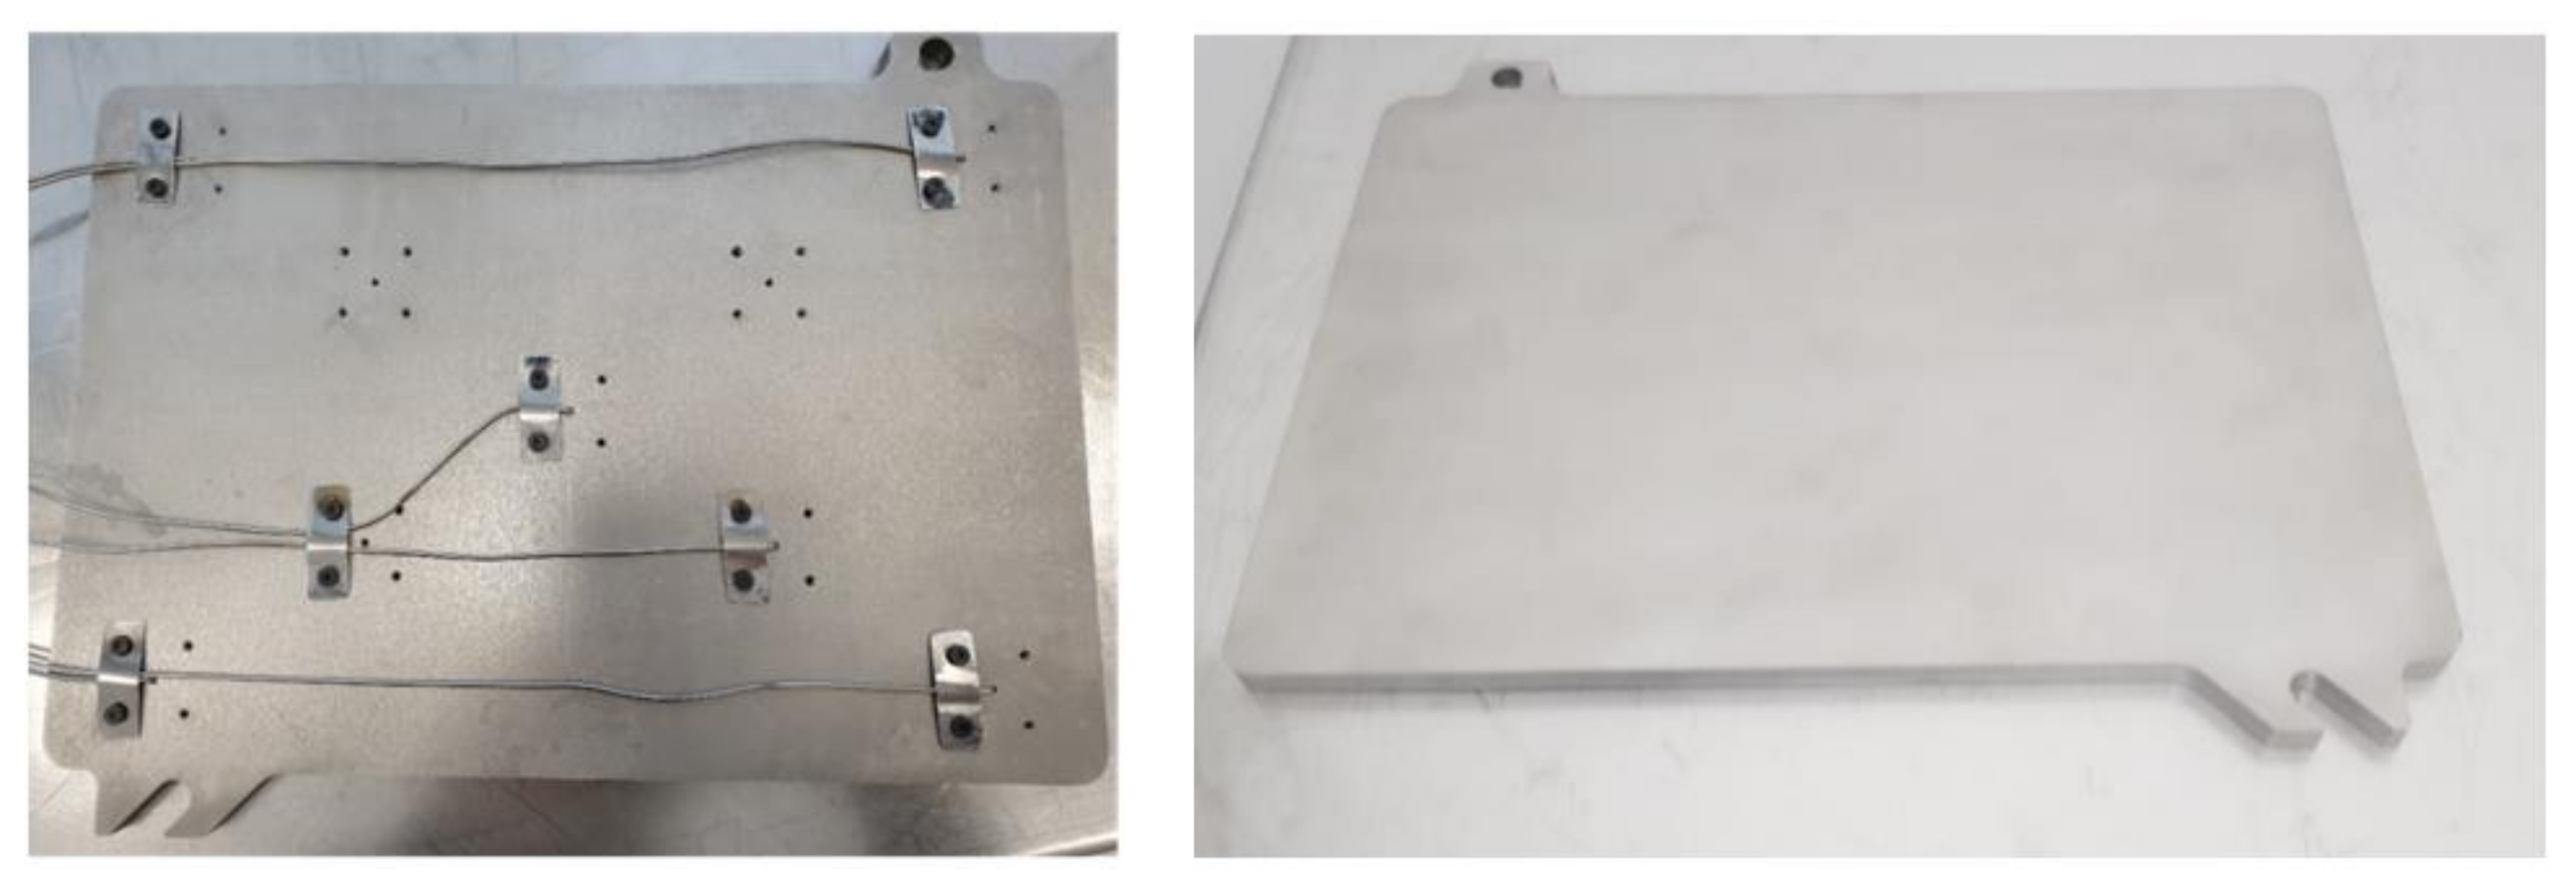
The plate was heated to approximately 750 °C using the electron beam, the temperature was measured using type K thermocouples that were attached to the plate about 1.5 mm from the top surface (Figure 3). The data from the thermocouples were gathered using a PicoLog (TC-08) data logger and software (Pico Technology, St Neots, United Kingdom).
In addition to those on the plate, thermocouples were also attached to the heat shield (Figure 4). The thermocouples facilitated the measurement of the heat shield temperature, thus indicating whether changes in gas pressure affect the heat dissipation during the process.
Seeking to discern the optimal environment to suppress the evolved elements phenomena, this study explored the process chamber pressure value. The delivered energy directly affects the metal heating; hence, the thermal experiments were used to compare the process efficiencies (expressed in temperature difference).

Preliminary Assumptions for MC Simulations

The Arcam Q20+ process environment included two zones of He partial pressure: the electron beam column and the vacuum chamber. The vacuum chamber contains uniformly distributed He gas in ~1m3; in this study, the He gas was treated as two single dense layers instead of uniformly dispersed gas. In order to simplify the simulations, it was assumed that a dense layer absorbs more energy than uniformly dispersed gas. To verify this assumption, two simulations were performed. The first involved a dense gas layer (0.178 g/cm3) and the second a thin gas layer, with the distributed gas uniformly densified to the ratio of the layers (0.00178 g/cm3). The comparison of the two simulations is presented in Figure 5. A numerical comparison of the table in the output file reveals that 85% of the electrons were exploited and delivered energy to the metal layer when using a thin gas layer; by contrast, when using a dense layer, only 74% of the electrons deposited energy to the metal layer. These results indicate that the preliminary assumption was correct and the gas layers in the simulations can be treated as dense layers.

4. Results

(1) MC simulations:
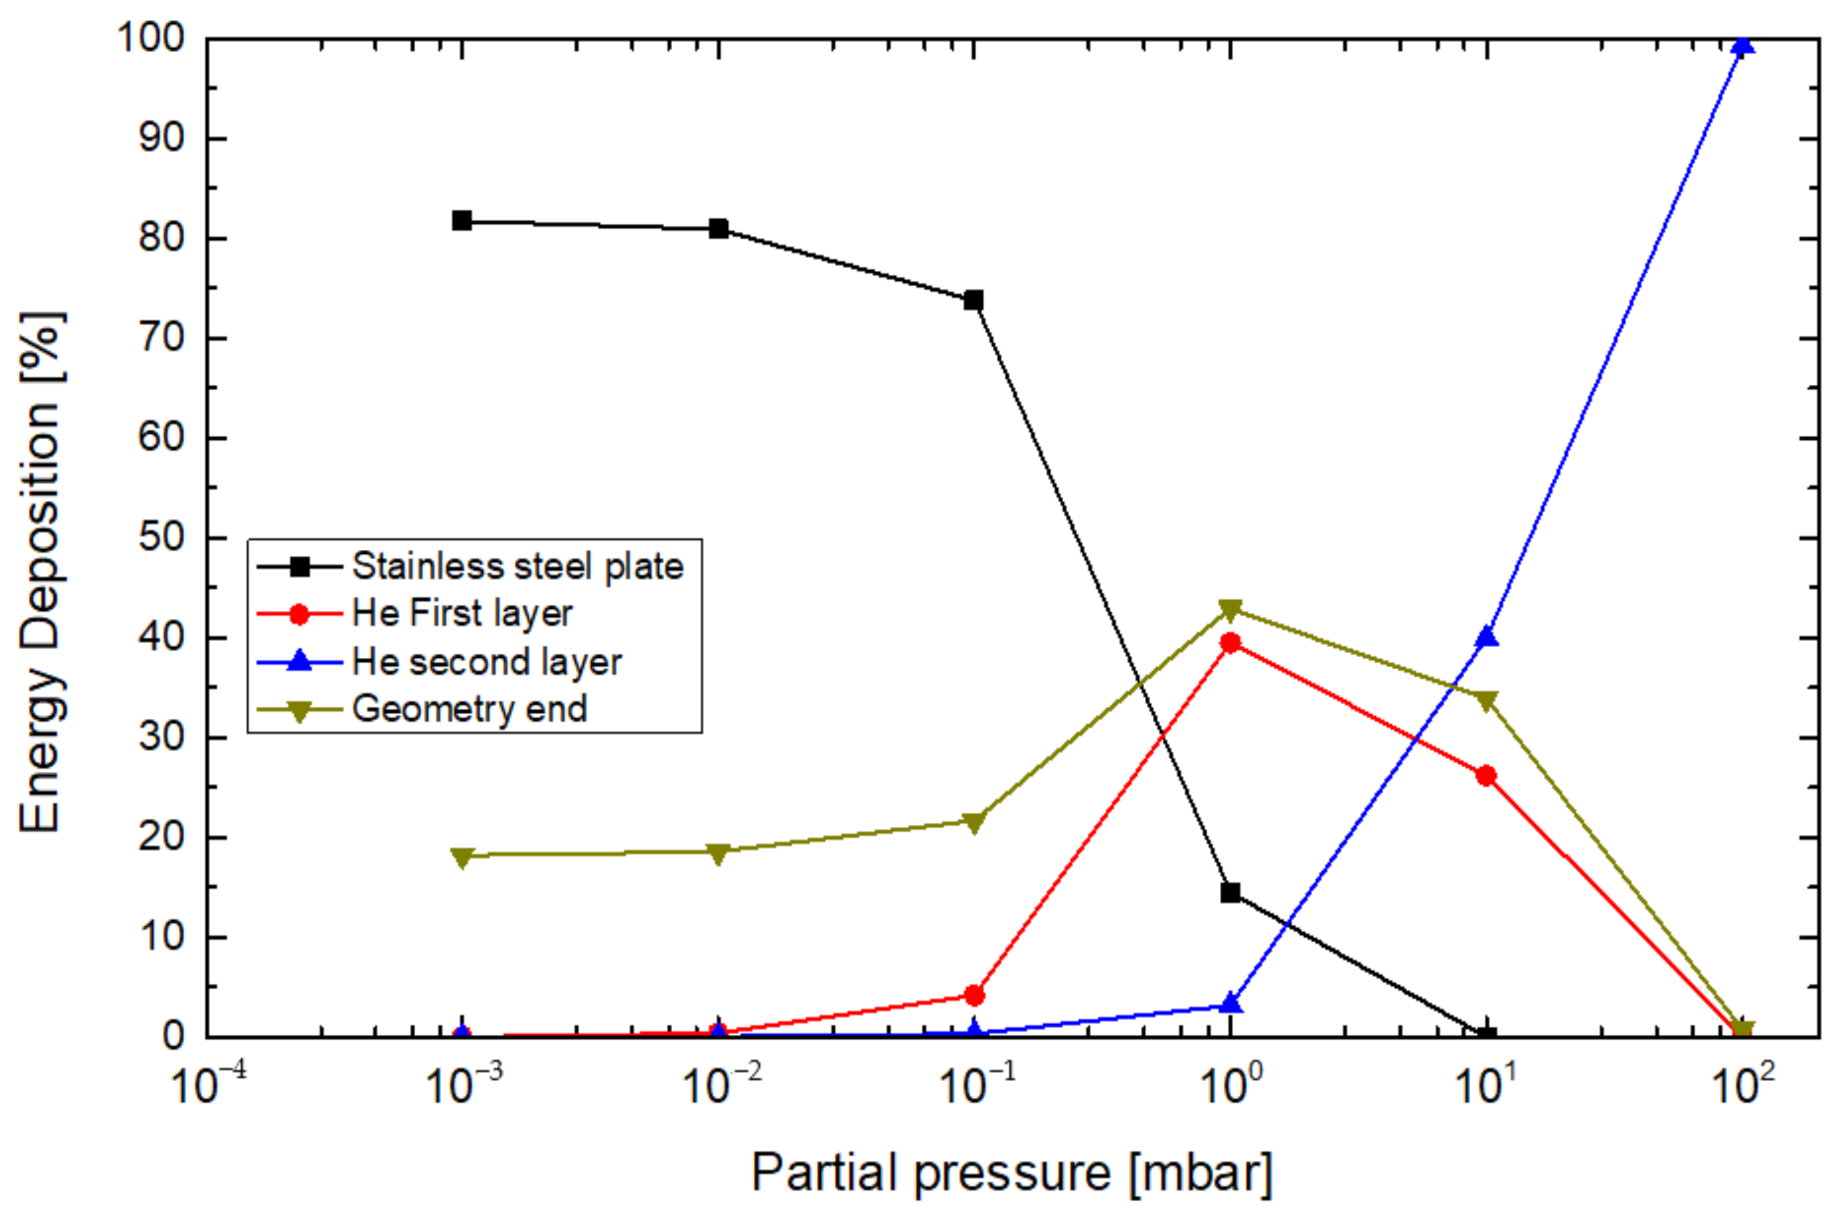
MC simulations allow us to examine a wide range of gas pressures. In order to assess the effect of gas pressure on the energy deposition, six simulations were conducted on He with different gas pressures varying from 102 mbar to 10−3 mbar. While the energy delivered to the stainless steel plate was manifested in a clear high temperature buildup, electrons which interact with the He gas in their flight path did not participate in the process. The initial value of 102 mbar was chosen since this value causes 100% of the energy to be lost in the gas. The results presented in Figure 6 demonstrate that decreasing the gas pressure from 10−2 to 10−3 mbar led to a minor improvement in the energy deposition to the stainless steel plate (from 80.8% to 81.7%). Increasing the gas pressure (from 10−2 to 10−1 mbar) led to an efficiency loss of 8%. An additional increase (to 1 mbar) led to a loss of almost 70% of the energy: most of the electrons’ energy deposited to the He gas (geometry end—backscattered outside the simulation boundary) rather than being deposited to the stainless steel plate.
(2) Experiment on Arcam Q20
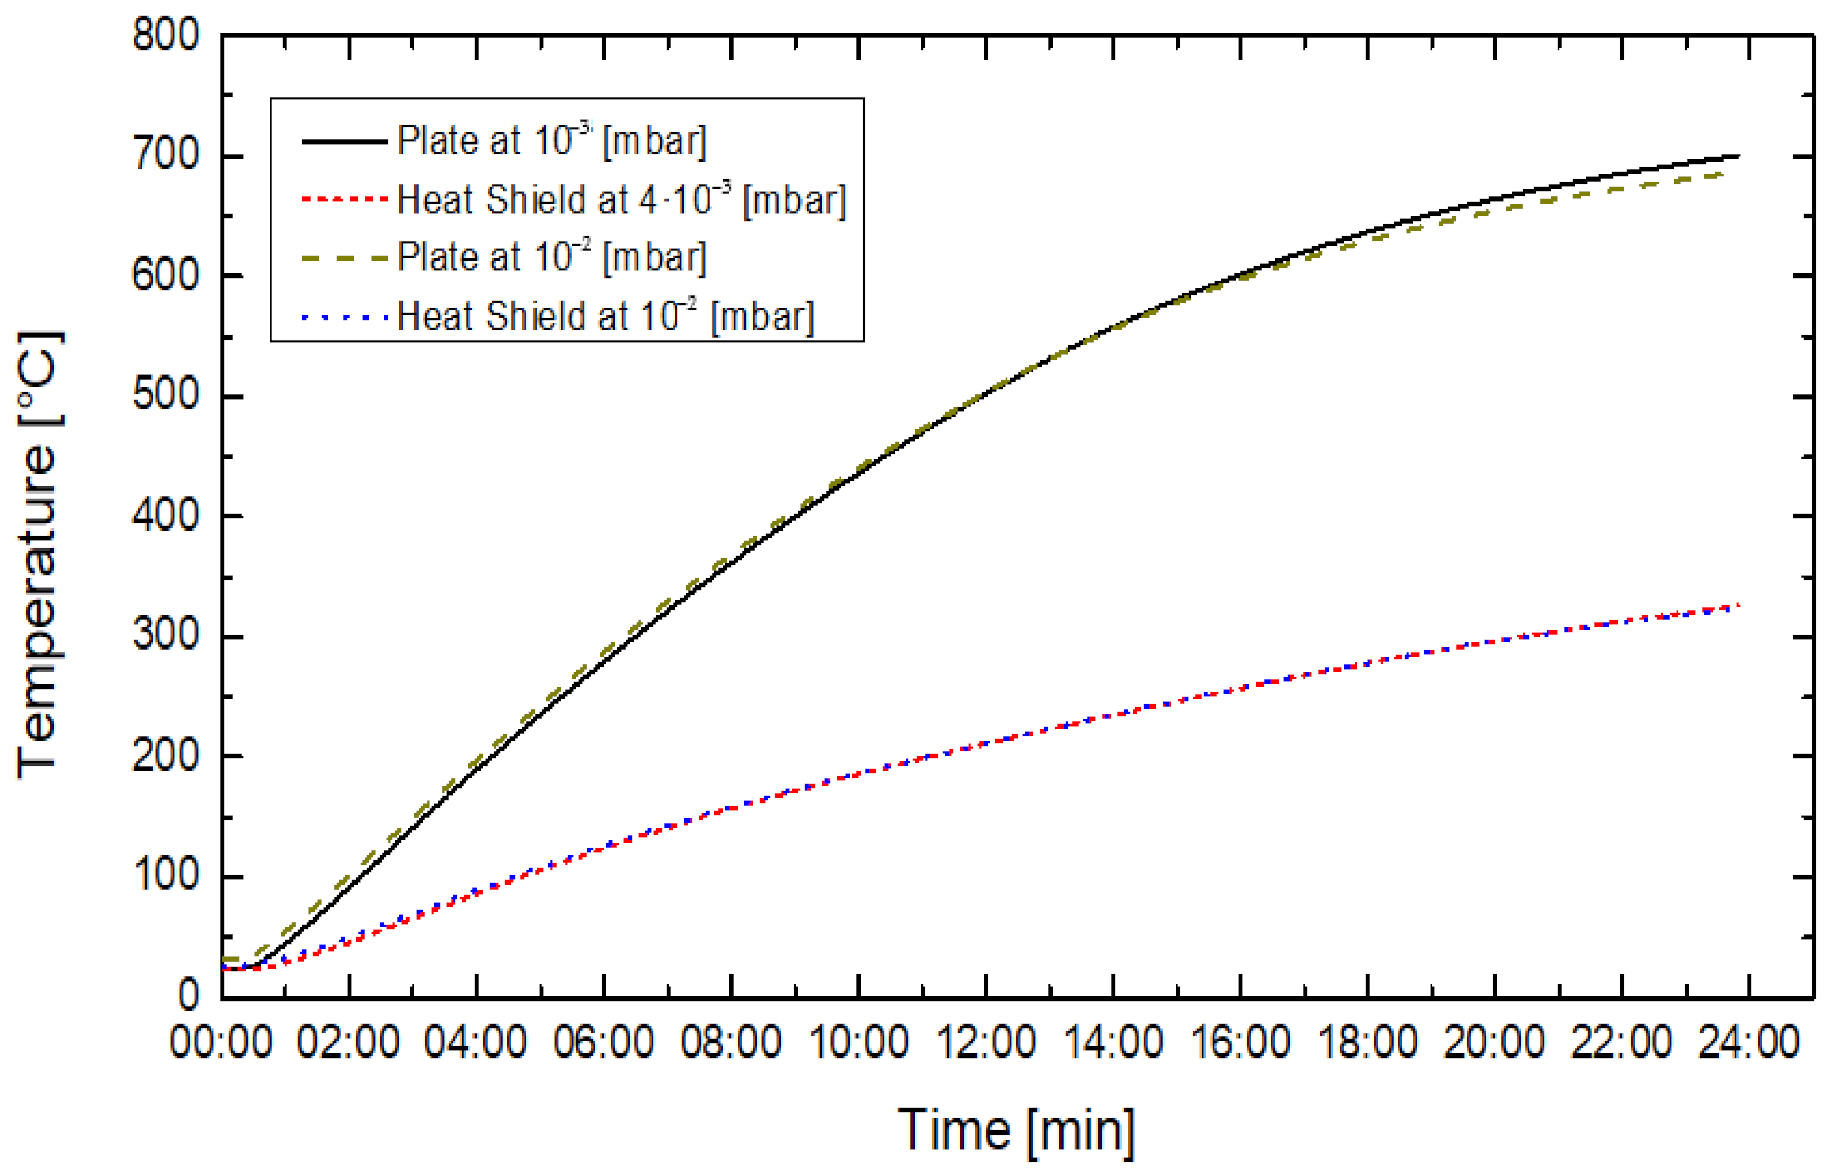
In the experiments conducted using an Arcam Q20+ system, a stainless steel 304L plate was preheated and the temperature was measured via the thermocouples attached to the plate and heat shield. While simulations can examine a wide range of pressures, the limits of the machine software dictate the boundaries of experiments. The experiment was conducted for two different pressure values, 10−2 mbar and 10−3 mbar (as in the EGS5 simulations). The results are presented in Figure 7.
Table 3 presents the temperature difference between the two pressures, which is minor (less than 2% on the plate and 0.5% on the heat shield).

5. Discussion

The EBM process is conducted in a vacuum chamber environment regulated with He at a pressure of 10−3 mbar. Increasing the He pressure will, on the one hand, increase the vapor pressure, which can reduce the volatility of the solid and melt pool. However, on the other hand, this may also attenuate the electrons and, consequently, decrease the energy deposition efficiency. Figure 6 presents MC simulations of the energy deposition as a function of He gas pressure. In the simulations, a minor contribution to the energy depositions to the metal (a 1% difference) was observed when the pressure was reduced from 10−2 mbar to 10−3 mbar (the nominal pressure in the EBM process). This ~1% improvement in process efficiency is probably negligible, while an additional increase in the gas pressure (from 10−2 to 10−1mbar) led to an efficiency dissipation of ~8%.
To validate the MC simulations, and to understand how these findings reflect the thermal conductivity, two thermal experiments were conducted and compared. The first used the nominal He gas pressure in the process (4 × 10⁻³ mbar) and the second used 10−2 mbar (the pressure in our simulations). Figure 7 presents the plate and heat shield temperatures for both experiments, which yielded almost identical results.
When working with SS304L, as in this study, under pressure conditions of 4 × 10⁻³ mbar, chromium will become thermodynamically unstable at a temperature of about 1300 °C [36]. SS304L melting occurs at about 1400 °C. Therefore, thermodynamically, evaporation of chromium will occur before the melting phase. However, at pressure conditions of 10−2 mbar, chromium starts to become thermodynamically unstable at about 1400 °C [14]. In different environments, evaporation of chromium in alloys could occur at an even lower temperature [37]. For a similar case regarding Ti64, the aluminum evaporation instability temperature is about 1100 °C at 4 × 10⁻³ mbar, while at 10−2 mbar it is about 1200 °C [14,15]. Therefore, increasing the chamber pressure widens the temperature ranges at which chromium and aluminum are thermodynamically stable. It is important to note that the above analysis only refers to these elements in their pure state. When a component is part of an alloy, the evaporation temperatures change. Moreover, the above analysis is only thermodynamic, that is, in terms of the equilibrium state. However, it is important to consider the kinetics of the evaporation process. Indeed, in the standard EBM process, the solidification rates depend on the thermal conductivity, liquid and powder temperatures etc. These are in the range of 104 °C/s–105 °C/s [2], meaning the liquid solidifies very quickly. Therefore, even if the thermodynamics suggest that a certain component will necessarily evaporate, the solidification occurs so rapidly that the material might only evaporate mildly.
Table 3 presents the temperature difference (∆T) for both experiments. As it indicates, the temperature difference is 15 °C, which is less than 2% of the upper scale. The heat shield’s temperature disparity reveals even better results (less than 0.5%), meaning that, as expected, the thermal conductivity is maintained when the pressure is increased. The results of both thermal experiments agree with the findings of the MC simulations.

6. Conclusions

This study sought to present a new, innovative way to calculate the energy deposition of electrons to a metal alloy using a Monte Carlo code. Correlative temperature increases were validated by thermal experiments conducted using an ARCAM Q20+ machine. In an EBM process, a pre-determined and generic pressure is usually applied for all kinds of materials printed by the Arcam Q20+ machine. Increasing the gas pressure will help to increase the vapor pressure in the built chamber, which could reduce the volatility of the solid and melt pool. However, it may also attenuate the electrons and, consequently, decrease the energy deposition efficiency.
It is suggested that:
  • Increasing the gas pressure by one order of magnitude does not affect the process. It did not significantly reduce (less than 1%) the energy deposition efficiency.
  • When increasing gas pressure, the heat shield temperature did not change substantially, meaning that it did not influence the thermal conductivity, despite the slight increase of gas presence in the chamber.
  • Hence, the option of reducing volatility for elements such as chromium or aluminum is promising, especially since new pre-alloyed materials, such as stainless steel, are fresh candidates for EBM.

Author Contributions

Conceptualization, E.T., I.O.; methodology, E.D., E.T., D.B., Y.I.G., I.O.; software, E.D., I.O.; formal analysis, E.D., D.B., Y.I.G., M.C.; investigation, E.D., E.T., D.B., Y.I.G., I.O.; data curation, E.D., E.T., D.B., Y.I.G., I.O.; writing—original draft preparation, E.D.; writing—review and editing, E.T., D.B., Y.I.G., I.O.; visualization, E.D., E.T., I.O.; supervision, E.T., I.O.; project administration, E.T.; funding acquisition, E.T. All authors have read and agreed to the published version of the manuscript.

Funding

This research was funded by Pazi foundation under grant 2020-ID147.

Institutional Review Board Statement

Not applicable.

Informed Consent Statement

Not applicable.

Data Availability Statement

Not applicable.

Acknowledgments

The authors are grateful to Amir Hajaj and Yonatan Markman for their technical assistance and the analysis of the chemical composition.

Conflicts of Interest

The authors declare no conflict of interest.

Appendix A

Figure A1. Part of EGS5 main user code and materials file.
Metals 11 00601 g0a1

Appendix B

Table A1. Initial experiments (used the below parameters) conducted on Q20+ and SS 316L led to SS316L melting.
Beam Current [mA]Beam Velocity [mm/s]Focus Offset [mA]Line Offset [mm]Line OrderHatch DirectionNo. of Repetitions
3342000440.420unidirectional3
Table A2. The chemical composition post melting was measured using ICP-OES (inductively coupled plasma–optical emission spectroscopy). Next table listing the major chemical compositions of 316L stainless steel gas-atomized powders, listed in at%. As powder (pre melting) and as build (post melting).
Mn [%]Si [%]Ni [%]Cr [%]Mo [%]P [%]
Powder1.670.7212.3418.282.680.024
As Build1.570.7112.4618.402.720.024

References

  1. Zhang, L.; Liu, Y.; Li, S.; Hao, Y. Additive Manufacturing of Titanium Alloys by Electron Beam Melting: A Review. Adv. Eng. Mater. 2018, 20, 1700842. [Google Scholar] [CrossRef]
  2. Körner, C. Additive manufacturing of metallic components by selective electron beam melting—A review. Int. Mater. Rev. 2016, 61, 361–377. [Google Scholar] [CrossRef] [Green Version]
  3. Gong, X.; Anderson, T.; Chou, K. Review on powder-based electron beam additive manufacturing technology. Manuf. Rev. 2014, 1, 2. [Google Scholar] [CrossRef]
  4. Gaytan, S.M.; Murr, L.E.; Medina, F.; Martinez, E.; Lopez, M.I.; Wicker, R.B. Advanced metal powder based manufacturing of complex components by electron beam melting. Mater. Technol. Futur. Light Mater. 2009, 24, 180–190. [Google Scholar] [CrossRef]
  5. Cordero, Z.C.; Meyer, H.M.; Nandwana, P.; Dehoff, R.R. Powder bed charging during electron-beam additive manufacturing. Acta Mater. 2017, 124, 437–445. [Google Scholar] [CrossRef] [Green Version]
  6. Milberg, J.; Sigl, M. Electron beam sintering of metal powder. Prod. Eng. 2008, 2, 117–122. [Google Scholar] [CrossRef]
  7. Gibson, I.; Rosen, D.; Stucker, B. Additive Manufacturing Technologies, 2nd ed.; Springer: London, UK, 2014. [Google Scholar] [CrossRef]
  8. Pauzon, C.; Hryha, E.; Forêt, P.; Nyborg, L. Effect of argon and nitrogen atmospheres on the properties of stainless steel 316L parts produced by laser-powder bed fusion. Mater. Des. 2019, 179. [Google Scholar] [CrossRef]
  9. Calleja, A.; Tabernero, I.; Ealo, J.A.; Campa, F.J.; Lamikiz, A.; de Lacalle, L.N.L. Feed rate calculation algorithm for the homogeneous material deposition of blisk blades by 5-axis laser cladding. Int. J. Adv. Manuf. Technol. 2014, 74, 1219–1228. [Google Scholar] [CrossRef]
  10. Schwerdtfeger, J.; Körner, C. Selective electron beam melting of Ti–48Al–2Nb–2Cr: Microstructure and aluminium loss. Intermetallics 2014, 49, 29–35. [Google Scholar] [CrossRef]
  11. Semiatin, S.; Ivanchenko, V.; Ivasishin, O. Diffusion models for evaporation losses during electron-beam melting of alpha/beta-titanium alloys. Metall. Mater. Trans. B 2004, 35, 235–245. [Google Scholar] [CrossRef]
  12. Sarychev, V.; Nevskii, S.; Konovalov, S.; Granovskii, A.; Ivanov, Y.; Gromov, V. Model of nanostructure formation in Al-Si alloy at electron beam treatment. Mater. Res. Express 2019, 6. [Google Scholar] [CrossRef]
  13. DebRoy, T.; Wei, H.L.; Zuback, J.S.; Mukherjee, T.; Elmer, J.W.; Milewski, J.O.; Beese, A.M.; Wilson-Heid, A.; De, A.; Zhang, W. Additive manufacturing of metallic components–process, structure and properties. Prog. Mater. Sci. 2018, 92, 112–224. [Google Scholar] [CrossRef]
  14. Sarangan, A. Physical and Chemical Vapor Deposition. In Nanofabrication—Principles to Laboratory Practice, 1st ed.; CRC Press: Boca Raton, FL, USA, 2017; p. 315. [Google Scholar] [CrossRef]
  15. Juechter, V.; Scharowsky, T.; Singer, R.F.; Körner, C. Processing window and evaporation phenomena for Ti–6Al–4V produced by selective electron beam melting. Acta Mater. 2014, 76, 252–258. [Google Scholar] [CrossRef] [Green Version]
  16. Klassen, A.; Forster, V.E.; Juechter, V.; Körner, C. Numerical simulation of multi-component evaporation during selective electron beam melting of TiAl. J. Mater. Process. Tech. 2017, 247, 280–288. [Google Scholar] [CrossRef]
  17. Rouquette, S.; Guo, J.; le Masson, P. Estimation of the parameters of a Gaussian heat source by the Levenberg–Marquardt method: Application to the electron beam welding. Int. J. Therm. Sci. 2007, 46, 128–138. [Google Scholar] [CrossRef]
  18. Yan, W.; Ge, W.; Smith, J.; Lin, S.; Kafka, O.L.; Lin, F.; Liu, W.K. Multi-scale modeling of electron beam melting of functionally graded materials. Acta Mater. 2016, 115, 403–412. [Google Scholar] [CrossRef] [Green Version]
  19. Matsumoto, T.; Okumura, Y.; Ichimura, M.; Nakamura, H.; Honda, K.; Shibahara, M.; Hirano, T.; Yamada, H.; Tanaka, R.; Sakai, I.; et al. Surface Modification and Adhesion Mechanism of Isotactic Polypropylene with Low-Energy Electron-Beam Treatments. Langmuir 2020, 36, 10846–10852. [Google Scholar] [CrossRef]
  20. Drouin, D.; Couture, A.R.; Joly, D.; Tastet, X.; Aimez, V.; Gauvin, R. CASINO V2.42—A Fast and Easy-to-use Modeling Tool for Scanning Electron Microscopy and Microanalysis Users. Scanning 2007, 29, 92–101. [Google Scholar] [CrossRef]
  21. Galati, M.; Iuliano, L. A literature review of powder-based electron beam melting focusing on numerical simulations. Addit. Manuf. 2018, 19, 1–20. [Google Scholar] [CrossRef]
  22. Yan, W.; Smith, J.; Ge, W.; Lin, F.; Liu, W. Multiscale modeling of electron beam and substrate interaction: A new heat source model. Comput. Mech. 2015, 56, 265–276. [Google Scholar] [CrossRef]
  23. Hirayama, H.; Namito, Y.; Nelson, W.R.; Bielajew, A.F.; Wilderman, S.J.; Michigan, U. The EGS5 Code System (No. SLAC-R-730); Department of Energy Stanford University: Stanford, CA, USA, 2005. [Google Scholar] [CrossRef] [Green Version]
  24. Berger, M.J.; Seltzer, S.M. Stopping Powers and Ranges of Electrons and Positions; NIST Information Services Office: Washington, DC, USA, 1982. Available online: https://nvlpubs.nist.gov/nistpubs/Legacy/IR/nbsir82-2550.pdf (accessed on 7 April 2021).
  25. Berger, M.J.; Inokuti, M.; Anderson, H.H.; Bichsel, H.; Dennis, J.A.; Powers, D.; Seltzer, S.M.; Turner, J.E. Report 37. J. Int. Comm. Radiat. Units Meas. 1984, os19. [Google Scholar] [CrossRef]
  26. Rogers, D.W.O. Fifty years of Monte Carlo simulations for medical physics. Phys. Med. Biol. 2006, 51, R287–R301. [Google Scholar] [CrossRef] [PubMed]
  27. Martin, J.B. Monte Carlo Calculation of the Penetration and Diffusion of Fast Charged Particles. Methods Comput. Phys. 1963, 1, 135–215. [Google Scholar]
  28. Bielajew, A.F.; Wilderman, S.J. Innovative electron transport methods in EGS5. In Proceedings of the Second International Workshop on EGS (KEK-PROC--2000-20), Tsukuba, Japan, 8–12 August 2000; Ban, S., Ed.; High Energy Accelerator Research Organization: Tsukuba, Japan, 2000. RN:33008052. [Google Scholar]
  29. Siegbahn, K. Alpha-, Beta- and Gamma-Ray Spectroscopy; Elsevier B.V.: Amsterdam, The Netherlands, 1965; Volume 1. [Google Scholar] [CrossRef]
  30. Messel, H.; Crawford, D.F. Electron–Photon Shower Distribution Function, 1st ed.; Pergamon Press London: London, UK, 1970. [Google Scholar]
  31. Møller, C. Passage of hard beta rays through matter. Ann. Phys. 1932, 406, 531–585. [Google Scholar] [CrossRef]
  32. Jenkins, R.; de Vries, J.L. Practical X-Ray Spectrometry, 2nd ed.; Springer: New York, NY, USA, 1969. [Google Scholar] [CrossRef]
  33. Geller, M.; Orion, I.; Golan, E.; Castro, G.R.; Rubio-Zuazo, J.; Tiferet, E. Electron inelastic mean free path in carbon and polycarbonate using a newly developed wide spectrum measurement method. J. Electron Spectros. Relat. Phenomena 2018, 229, 85–93. [Google Scholar] [CrossRef]
  34. Givon, A.; Tiferet, E.; Orion, I. Algorithm for evaluating layer thickness based on electron average energy shift analysis. Nucl. Inst. Methods Phys. Res. B 2012, 288, 23–27. [Google Scholar] [CrossRef]
  35. Alcock, C.B.; Itkin, V.P.; Horrigan, M.K. Vapour Pressure Equations for the Metallic Elements: 298–2500K. Can. Metall. Q. 1984, 23, 309–313. [Google Scholar] [CrossRef]
  36. Kim, C.S. Thermophysical Properties of Stainless Steels No. ANL-75-55; Argonne National Lab: Lemont, IL, USA, 1975. [CrossRef]
  37. Falk-Windisch, H.; Svensson, J.E.; Froitzheim, J. The effect of temperature on chromium vaporization and oxide scale growth on interconnect steels for Solid Oxide Fuel Cells. J. Power Sources 2015, 287, 25–35. [Google Scholar] [CrossRef] [Green Version]
  38. Jurisch, M.; Wenz, T.; Kirchner, A.; Kloeden, B.; Weissgaerber, T.; Kieback, B. Processing of FeCrV-steels by Selective Electron Beam Melting (SEBM). In Proceedings of the EURO PM 2019 Congress & Exhibition, Maastricht, The Netherlands, 13–16 October 2019. [Google Scholar]
  39. Zhong, Y.; Rännar, L.E.; Liu, L.; Koptyug, A.; Wikman, S.; Olsen, J.; Cui, D.; Shen, Z. Additive manufacturing of 316L stainless steel by electron beam melting for nuclear fusion applications. J. Nucl. Mater. 2017, 486, 234–245. [Google Scholar] [CrossRef]
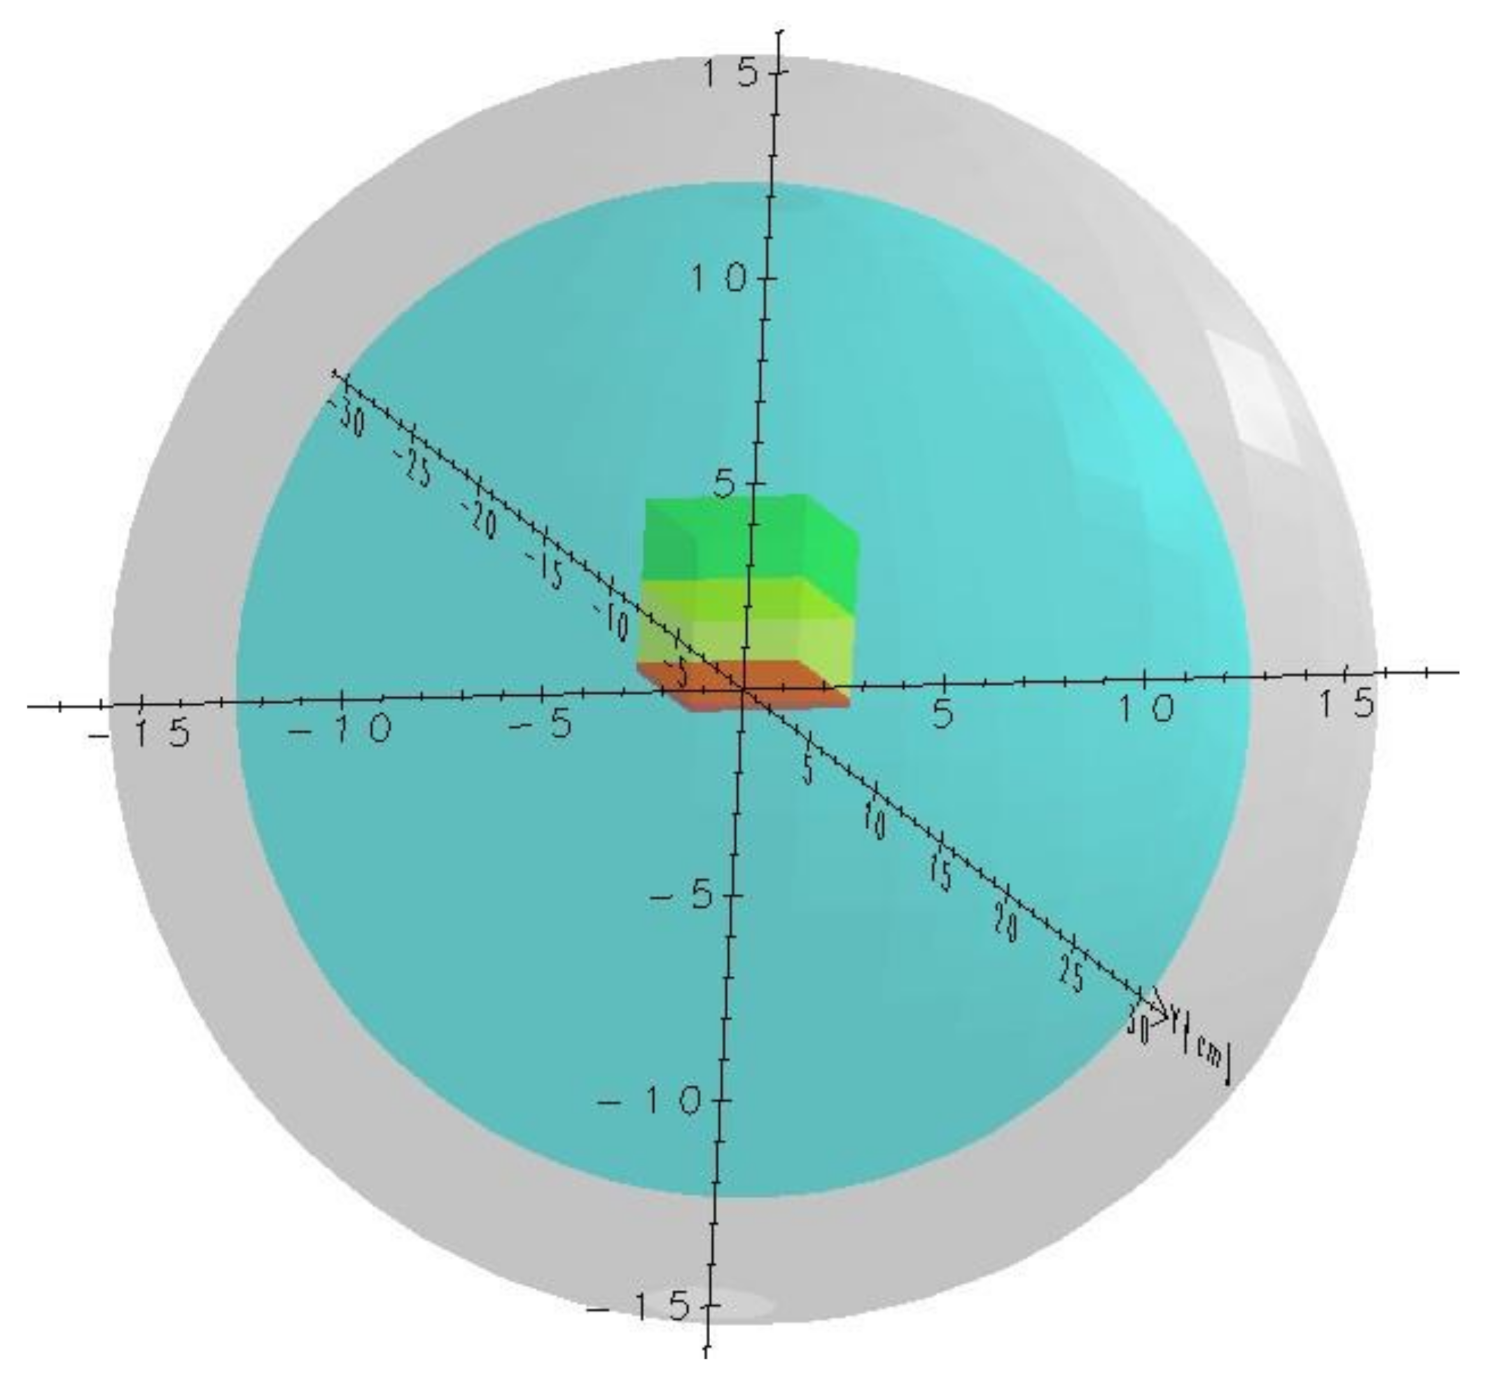
Figure 1. Two zones geometry and the SS304 alloy layer. Orange-SS304 alloy (2 × 2 × 0.2 cm), Yellow and green (2 × 2 × 2 cm)—He layers, azure—source zone (12 cm), gray—geometry end (15 cm).
Metals 11 00601 g001
Figure 2. Sample model used in simulations.
Metals 11 00601 g002
Figure 3. Stainless steel plate. On the right—the plate’s upper side (toward the electron beam). On the left—thermocouples that were inserted into bores on the lower side of the plate.
Metals 11 00601 g003
Figure 4. Experimental setup for the Q20+ build chamber: (a) front view with the heat shield, (b) front view without the heat shield, (c) the main heat shield with thermocouple sleeves, (d) schematics of thermocouple locations in the heat shield (THS—thermocouple heat shield).
Metals 11 00601 g004
Figure 5. Results of MC simulations: absorbed dose at the metal layer for both thin and dense layers of He above the metal.
Metals 11 00601 g005
Figure 6. Results of MC simulations: the energy deposition as a function of gas pressure in each region: stainless steel plate, two zones of He layers, and outside of the geometry (backscattered).
Metals 11 00601 g006
Figure 7. Temperature experiment (preheating a stainless steel plate) for different pressure values (10−2 mbar and 4 × 10⁻³ mbar).
Metals 11 00601 g007
Table 1. Energy deposition – percentage of total energy fluence per incidence electron, output from the Monte Carlo (MC) code. (AE and AP are lower electron and photon cutoff energy).
Energy Deposition [%]
RegionTransport ChangeDiscarded Below CutoffDiscarded Below AE or APDiscarded Geometry endXRFSummary
SS304L plate0.72408.79 × 10−204.4 × 10−30.817
Out0000.18100.181
Sum0.72408.79 × 10−20.1814.4 × 10−30.998
Table 2. Arcam Q20+ preheating parameters.
Beam Current [mA]Beam Velocity [mm/s]Focus Offset [mA]Line Offset [mm]Line OrderHatch DirectionDuration [min]
4435,000901.220unidirectional105
Table 3. Temperature experiment: temperature difference (∆t) in the two different pressure experiments (temperature at 10−2—temperature at 10−3).
RegionPlateHeat Shield
Temperature Difference—∆T [°C]153
Temperature Diversion [%]2.10.5
Publisher’s Note: MDPI stays neutral with regard to jurisdictional claims in published maps and institutional affiliations.