Article

Fabrication of Roughened Electrodeposited Copper Coating on Steel for Dissimilar Joining of Steel and Thermoplastic Resin

1
Department of Materials Chemistry, Faculty of Engineering, Shinshu University, Nagano 380-8553, Japan
2
Technical Devision, Faculty of Engineering, Shinshu University, Nagano 380-8553, Japan
3
Taisei Plas Co., Ltd., Tokyo 103-0023, Japan
*
Author to whom correspondence should be addressed.
Metals 2021, 11(4), 591; https://doi.org/10.3390/met11040591
Submission received: 2 March 2021 / Revised: 2 April 2021 / Accepted: 2 April 2021 / Published: 5 April 2021
(This article belongs to the Special Issue Dissimilar Material Welding and Joining)

Abstract

:
Electrodeposition of a roughened copper coating onto steel was carried out to produce a bonding surface for thermoplastic resin (polyphenylenesulfide). The roughened copper film was electrodeposited using a copper sulfate bath containing polyacrylic acid (PAA). Following injection molding of the resin, the bonding strength was evaluated in a tensile lap shear strength test, followed by durability testing at high temperature and humidity (85 ± 2 °C and 85 ± 2% relative humidity, respectively) for 2000 h, and a thermal shock test (−50 °C–150 °C) for 1000 cycles. An analysis of the boundary microstructure showed that the PAA concentration had a large effect on the surface morphology of the copper film. The shear strength of the joint between the coated steel substrate and the resin was more than 40 MPa, and the bonding strength also remained above 40 MPa throughout the durability test. During the thermal shock test, although the bonding strength gradually decreased with increasing number of cycles, it remained at over 20 MPa, even after 1000 cycles. This method achieves not only high initial bonding strength, but also durability for joints between dissimilar materials such as steel and resin.

Graphical Abstract

1. Introduction

To tackle issues such as reducing CO2 emissions and mitigating global climate change, one effective method is the use of multiple materials for reducing the weight of vehicles, such as cars [1]. It is therefore important to develop techniques for joining such materials together, in an approach known as “multi-materialization” [2]. Steel has long been used for car frames due to its excellent mechanical properties and low price. Fiber-reinforced plastics, including carbon-fiber-reinforced plastics, are also attractive due to their light weight and superior mechanical properties. The combination of steel and fiber-reinforced plastics can reduce the weight of cars and make them less expensive. It is therefore important to develop methods to form joints between these dissimilar materials. In order to join metals to plastics, many methods such as laser welding [3] and friction stir welding [4] have been developed. There has recently been a great deal of interest in joint formation between roughened metals and thermoplastic resins. The high bonding strength of such joints arises mainly because of the so-called “anchor effect” associated with micrometer scale surface roughness. To form the joint, an injection molding machine or hot press is used to apply the resin to the roughened metal at high temperature and pressure. This causes the plastic to fill the irregularities on the metal surface. To produce a rough metal surface, methods such as laser treatment [5,6,7,8,9,10,11], chemical etching [12,13], and abrasive blasting [14,15,16] have been shown to be effective. However, all of these methods give rise to a different surface morphology, which depends on the type of metal or alloy used. Since this can lead to differences in bonding strength, it is necessary to develop a method to produce a consistent surface morphology for all metals and alloys. One promising approach is plating, because the final surface morphology depends only on the plating conditions.
Recently, we reported excellent bonding strength between steel and a thermoplastic resin using a roughened electrodeposited nickel film without adhesives [17,18]. However, a composite plating technique was employed to form the roughened surface. For practical applications, a joining technology with a roughened plating film that does not rely on composite plating is desirable. We have already reported that a roughened electrodeposited copper film can be fabricated using a roughening agent [19], and that the roughened copper film acts as an effective current collector when applied to a lithium [20,21] or sodium [22] ion battery anode.
In the present study, we deposited copper films with various degrees of roughness on a steel substrate, and evaluated the strength of the bond with a thermoplastic resin in a tensile lap shear strength test. The joint durability was also assessed.

2. Materials and Methods

2.1. Fabrication of Roughened Electrodeposited Copper Films on Steel Substrates

Before electrodeposition of the copper film, a copper strike was applied to a steel substrate to form a copper layer and avoid a displacement reaction between iron and copper. A pyrophosphate bath containing 0.04 M Cu2P2O7 and 0.36 M K4P2O7 was used to form the copper strike. The substrate was a cold-rolled steel sheet (SPCC, JIS G 3141), which was masked with insulating tape to expose a cathode area measuring 1.8 cm2 (1.8 cm × 1.0 cm). The anode was a pure copper plate. For electrodeposition, a commercially available electrolytic cell (Microcell Model I, Yamamoto-MS Co., Ltd., Tokyo, Japan) was used. After degreasing with a commercially available degreasing agent (C4000, C. Uemura & Co., Ltd., Osaka, Japan) and activation using a 10 wt.% H2SO4 solution, electrodeposition was performed under galvanostatic conditions (10 mA cm−2) at room temperature (about 25 °C) with aeration. The electrical charge was 1.36 C cm−2. A roughened copper film was then electrodeposited on the copper strike layer. A sulfate bath containing CuSO4·5H2O and 0.55 M H2SO4 was used as the base plating bath. Polyacrylic acid (PAA, mean molecular weight 5000) was added to prepare the bath for application of roughened copper film [19]. The anode was a copper plate containing phosphorous. The electrolytic cell described above was employed for electrodeposition, which was performed under galvanostatic conditions (20 mA cm−2) at room temperature (about 25 °C) without stirring. The electrical charge was 4.1 C cm−2.

2.2. Preparation of Bonded Samples

To produce bonded samples, an injection molding machine was used (PNX60, Nissei Plastic Industrial Co., Ltd., Nagano, Japan). The thermoplastic resin was polyphenylenesulfide (PPS; SGX-120 containing 20 mass% glass fibers, TOSOH Co., Ltd., Tokyo, Japan). The initial resin temperature was 310 °C, and the mold was pre-heated to 140 °C. Figure 1 shows the dimensions of the sample for bonding, which conform to ISO 19,095 [23]. The area of the bonded region between the plated SPCC substrate and the PPS resin plate was 0.5 cm2 (1.0 cm × 0.5 cm).

2.3. Evaluation of Bonding Strength

The tensile lap shear strength test described in ISO 19,095 [23] was applied to determine the bonding strength using a universal testing machine (AGS-J, Shimazu Co. Ltd., Kyoto, Japan) for a total of five samples (n = 5).

2.4. Durability Tests

2.4.1. High-Temperature and High-Humidity Test

A constant temperature and humidity tester (IH4000, Yamato Science Co. Ltd., Tokyo, Japan) was used to perform high-temperature (85 ± 2 °C) and high-humidity (RH 85 ± 2%) tests. The testing times were 24, 48, 168, 336, 672, 1000, 1500, and 2000 h. These conditions conform to ISO 19,095 [23]. Three different samples were measured. For each sample, the bonding strength was evaluated by the tensile lap shear strength test described above.

2.4.2. Thermal Shock Test

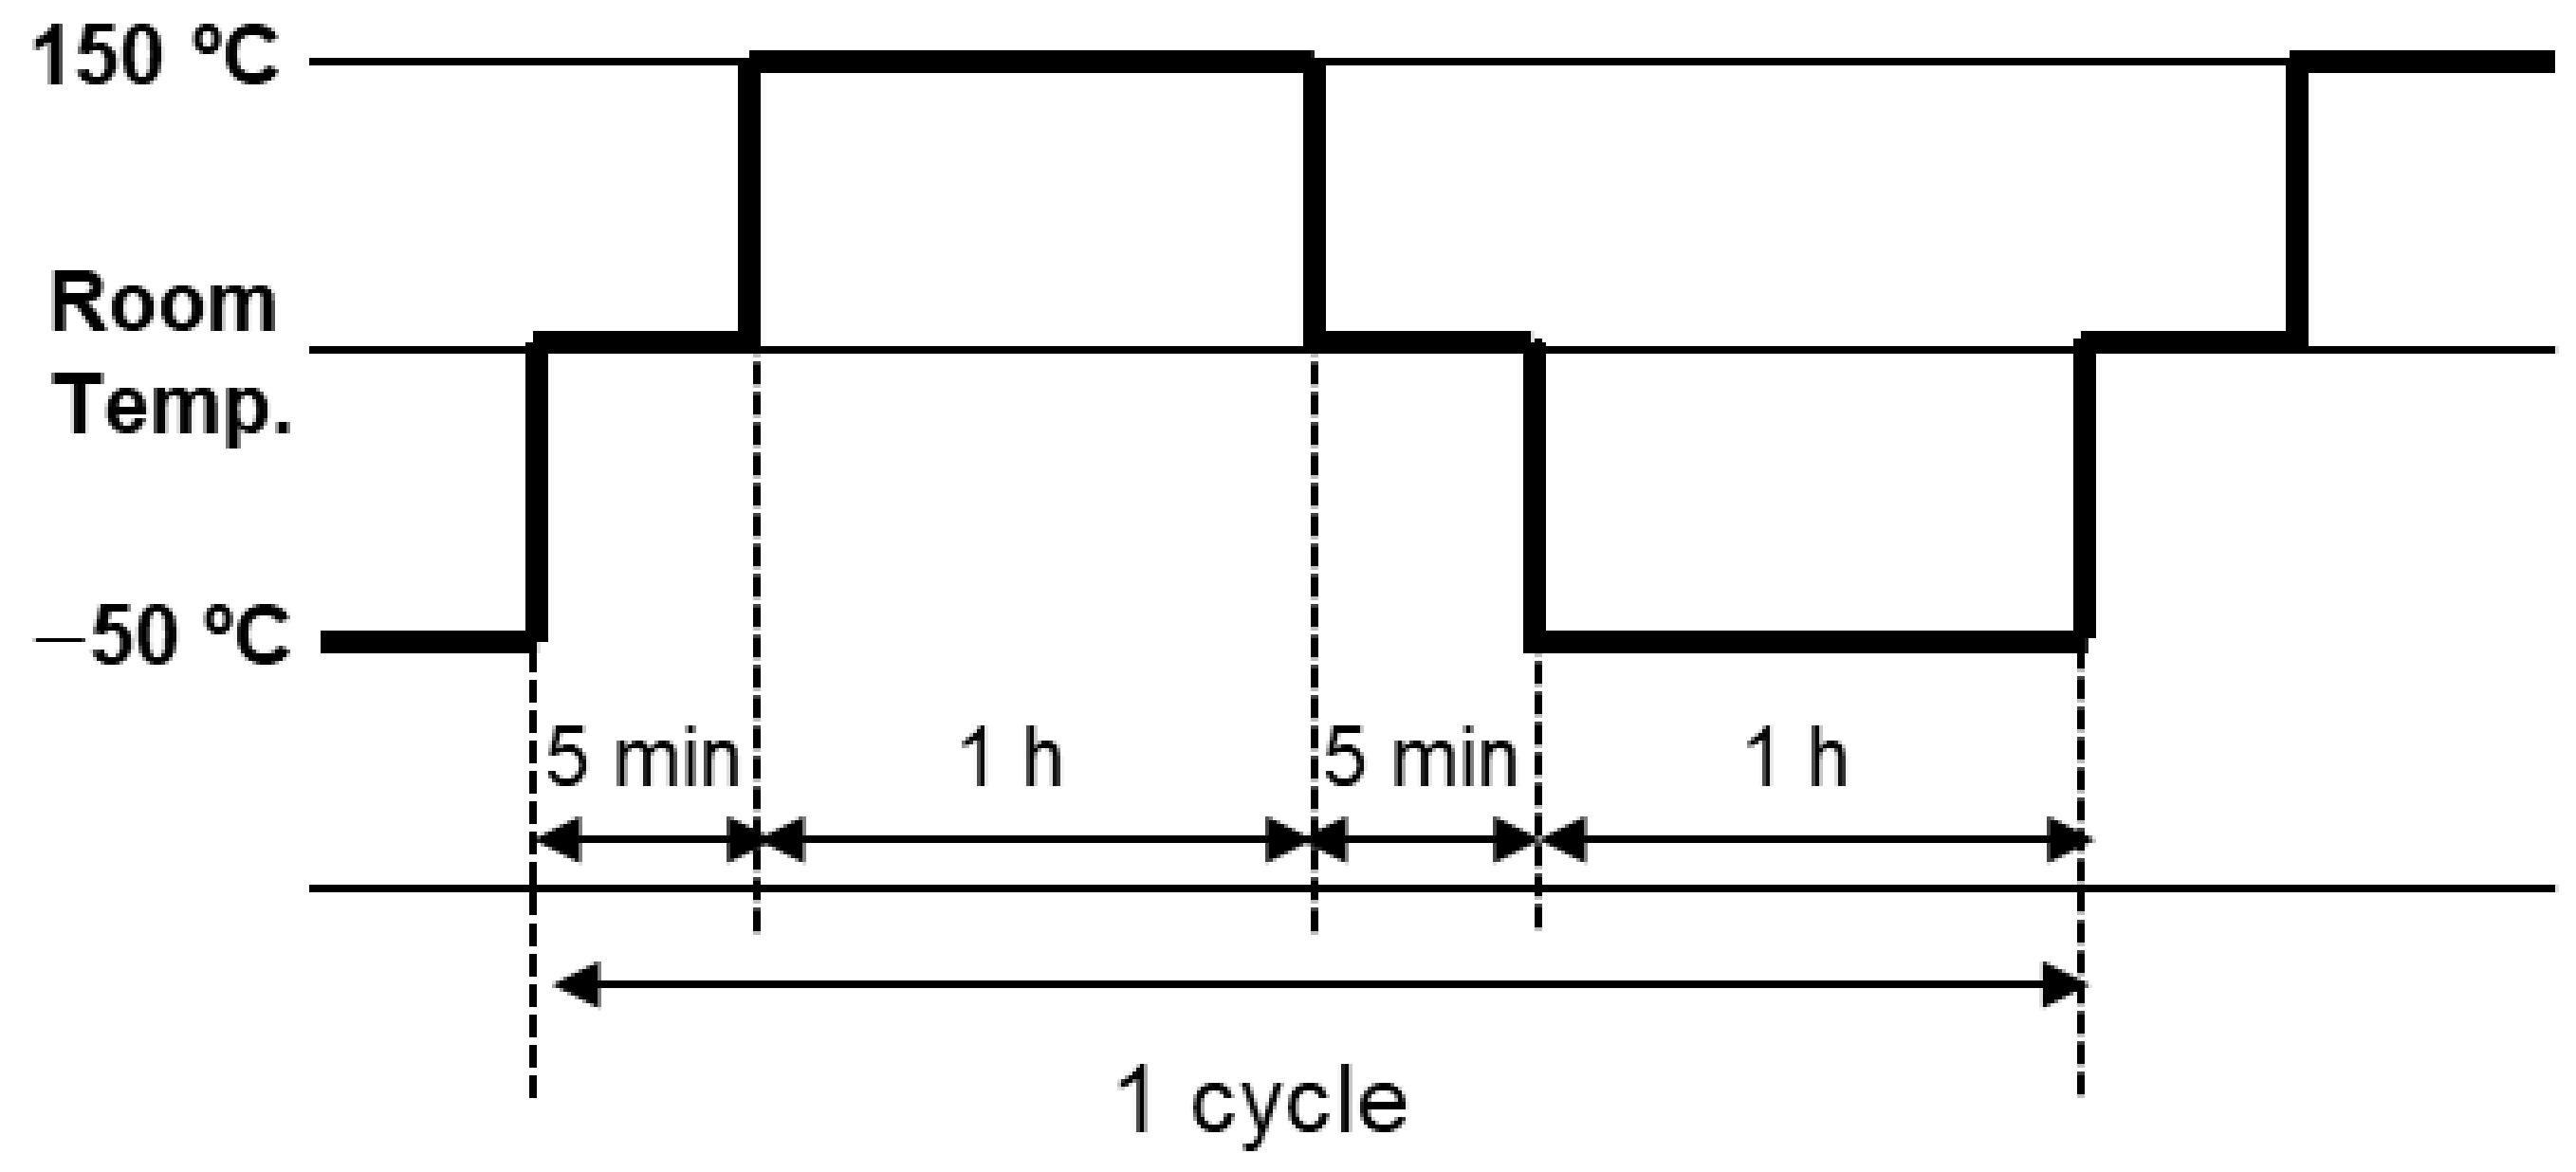
Thermal shock testing was performed using a thermal shock tester (TSE-11, Espec Corp., Osaka, Japan). Figure 2 shows the test pattern, with low and high temperatures of −50 °C and 150 °C, respectively. The number of cycles were 10, 50, 100, 200, 500, and 1000. These conditions almost conform to ISO 19,095 [23], although the temperature range was wider than the most severe conditions specified in ISO 19,095 (−40 °C–150 °C). Five samples were measured, and the bonding strength for each sample was evaluated by the tensile lap shear strength test described above.

2.5. Structural Analysis

The surface and cross-sectional morphology of the copper films were observed by field emission scanning electron microscopy (FE-SEM; SU-8000, Hitachi High-Tech Co., Ltd., Tokyo, Japan). The cross-sectional morphology of the bonded samples was analyzed by focused ion beam FE-SEM (JIB-4610F, JEOL Ltd., Tokyo, Japan) and scanning transmission electron microscopy (STEM; HD2300A, Hitachi High-Tech Ltd., Tokyo, Japan). Non-destructive analysis of the non-shear-tested bonded samples during the thermal shock test was performed using scanning acoustic tomography (SAT; FineSAT V, Hitachi Power Solutions Co. Ltd., Hitachi, Japan).

3. Results and Discussion

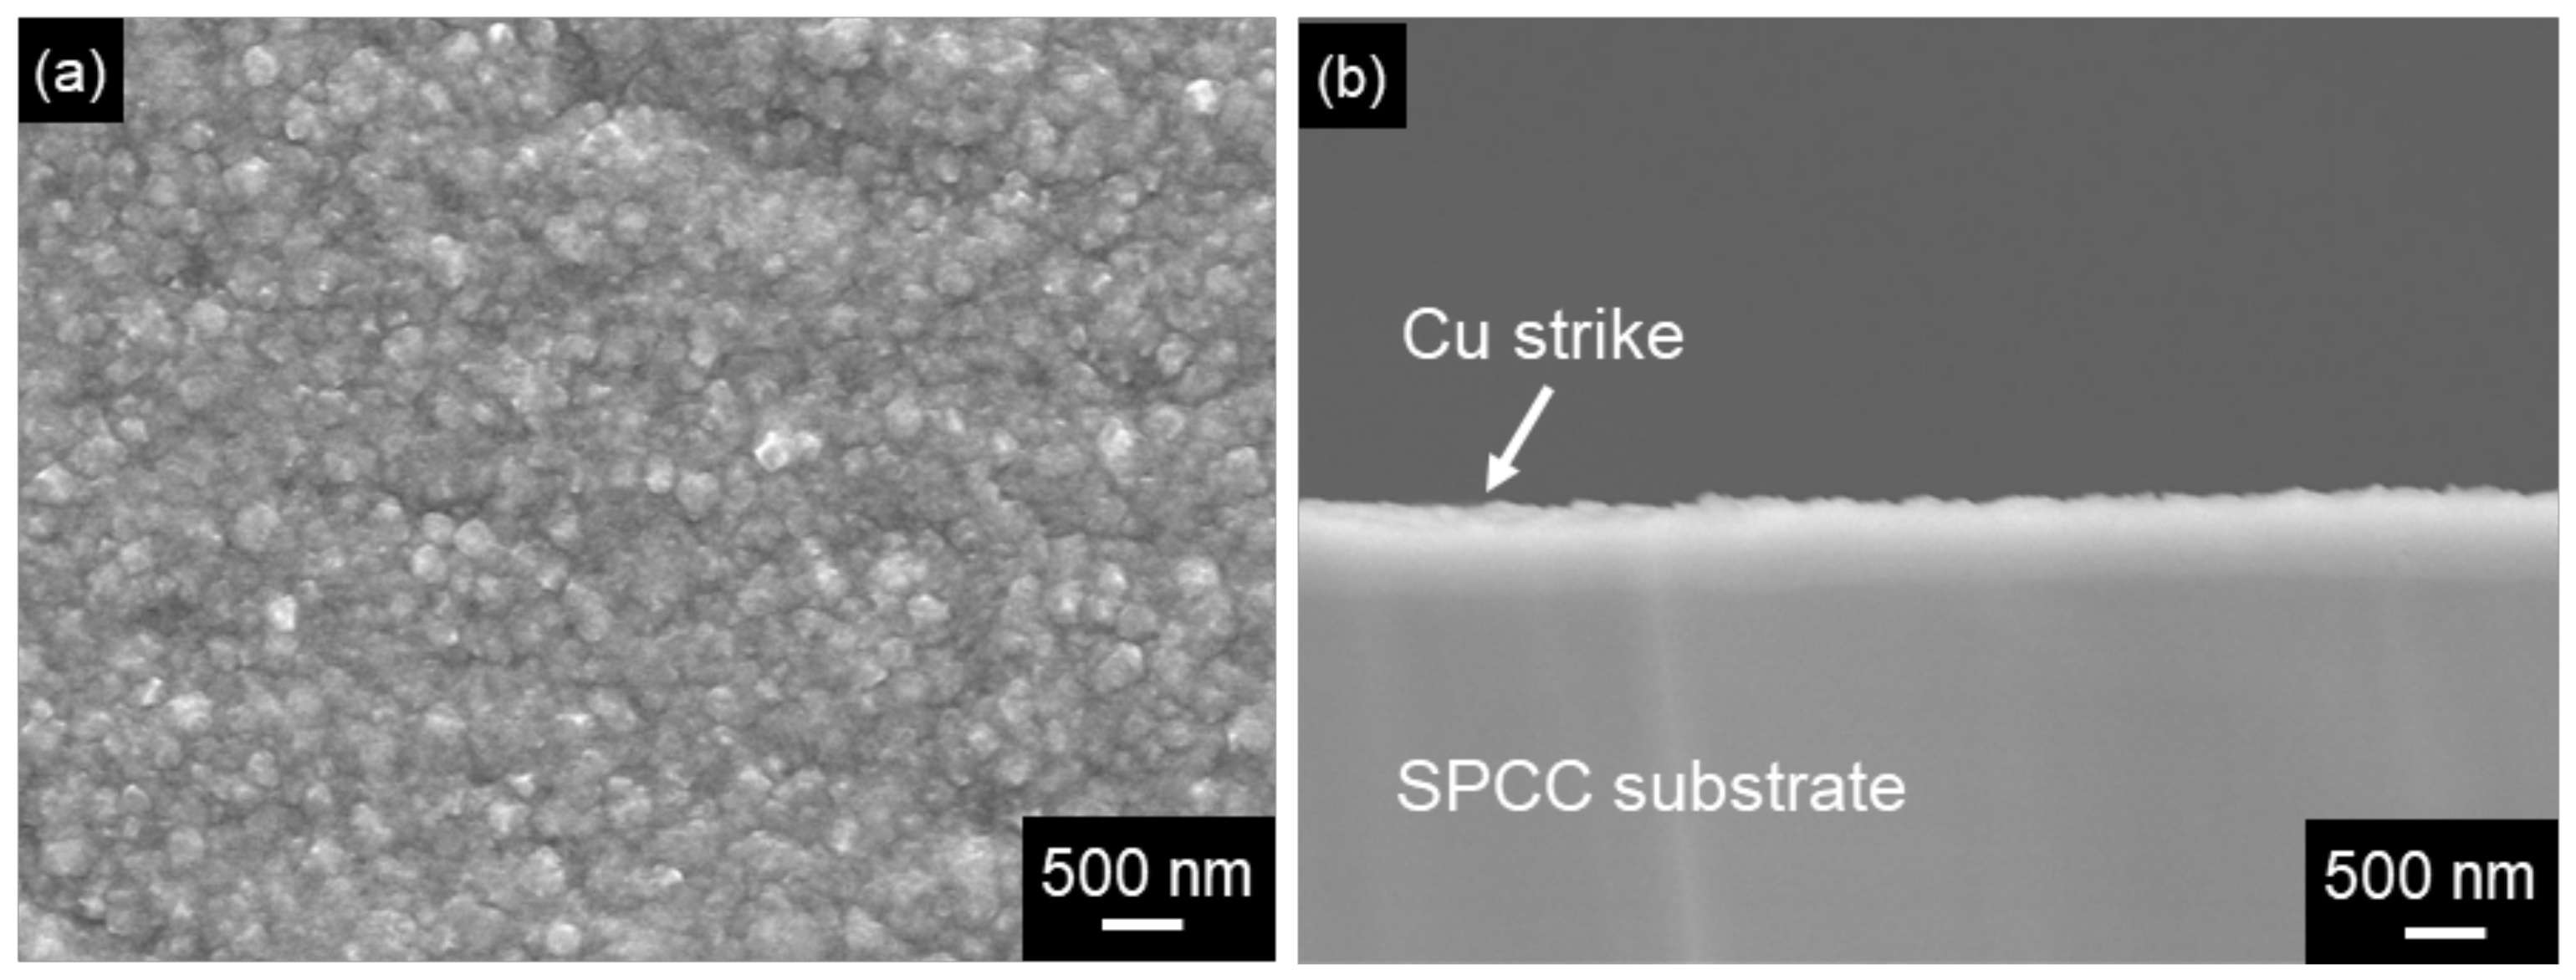
Figure 3 shows surface and cross-sectional SEM images of the copper strike layer. A homogeneous surface morphology consisting of grains with sizes of 100 to 200 nm was observed on the film (Figure 3a). The copper film (bright region) had a thickness of ≈500 nm, and there were no gaps between the SPCC substrate and the film (Figure 3b).
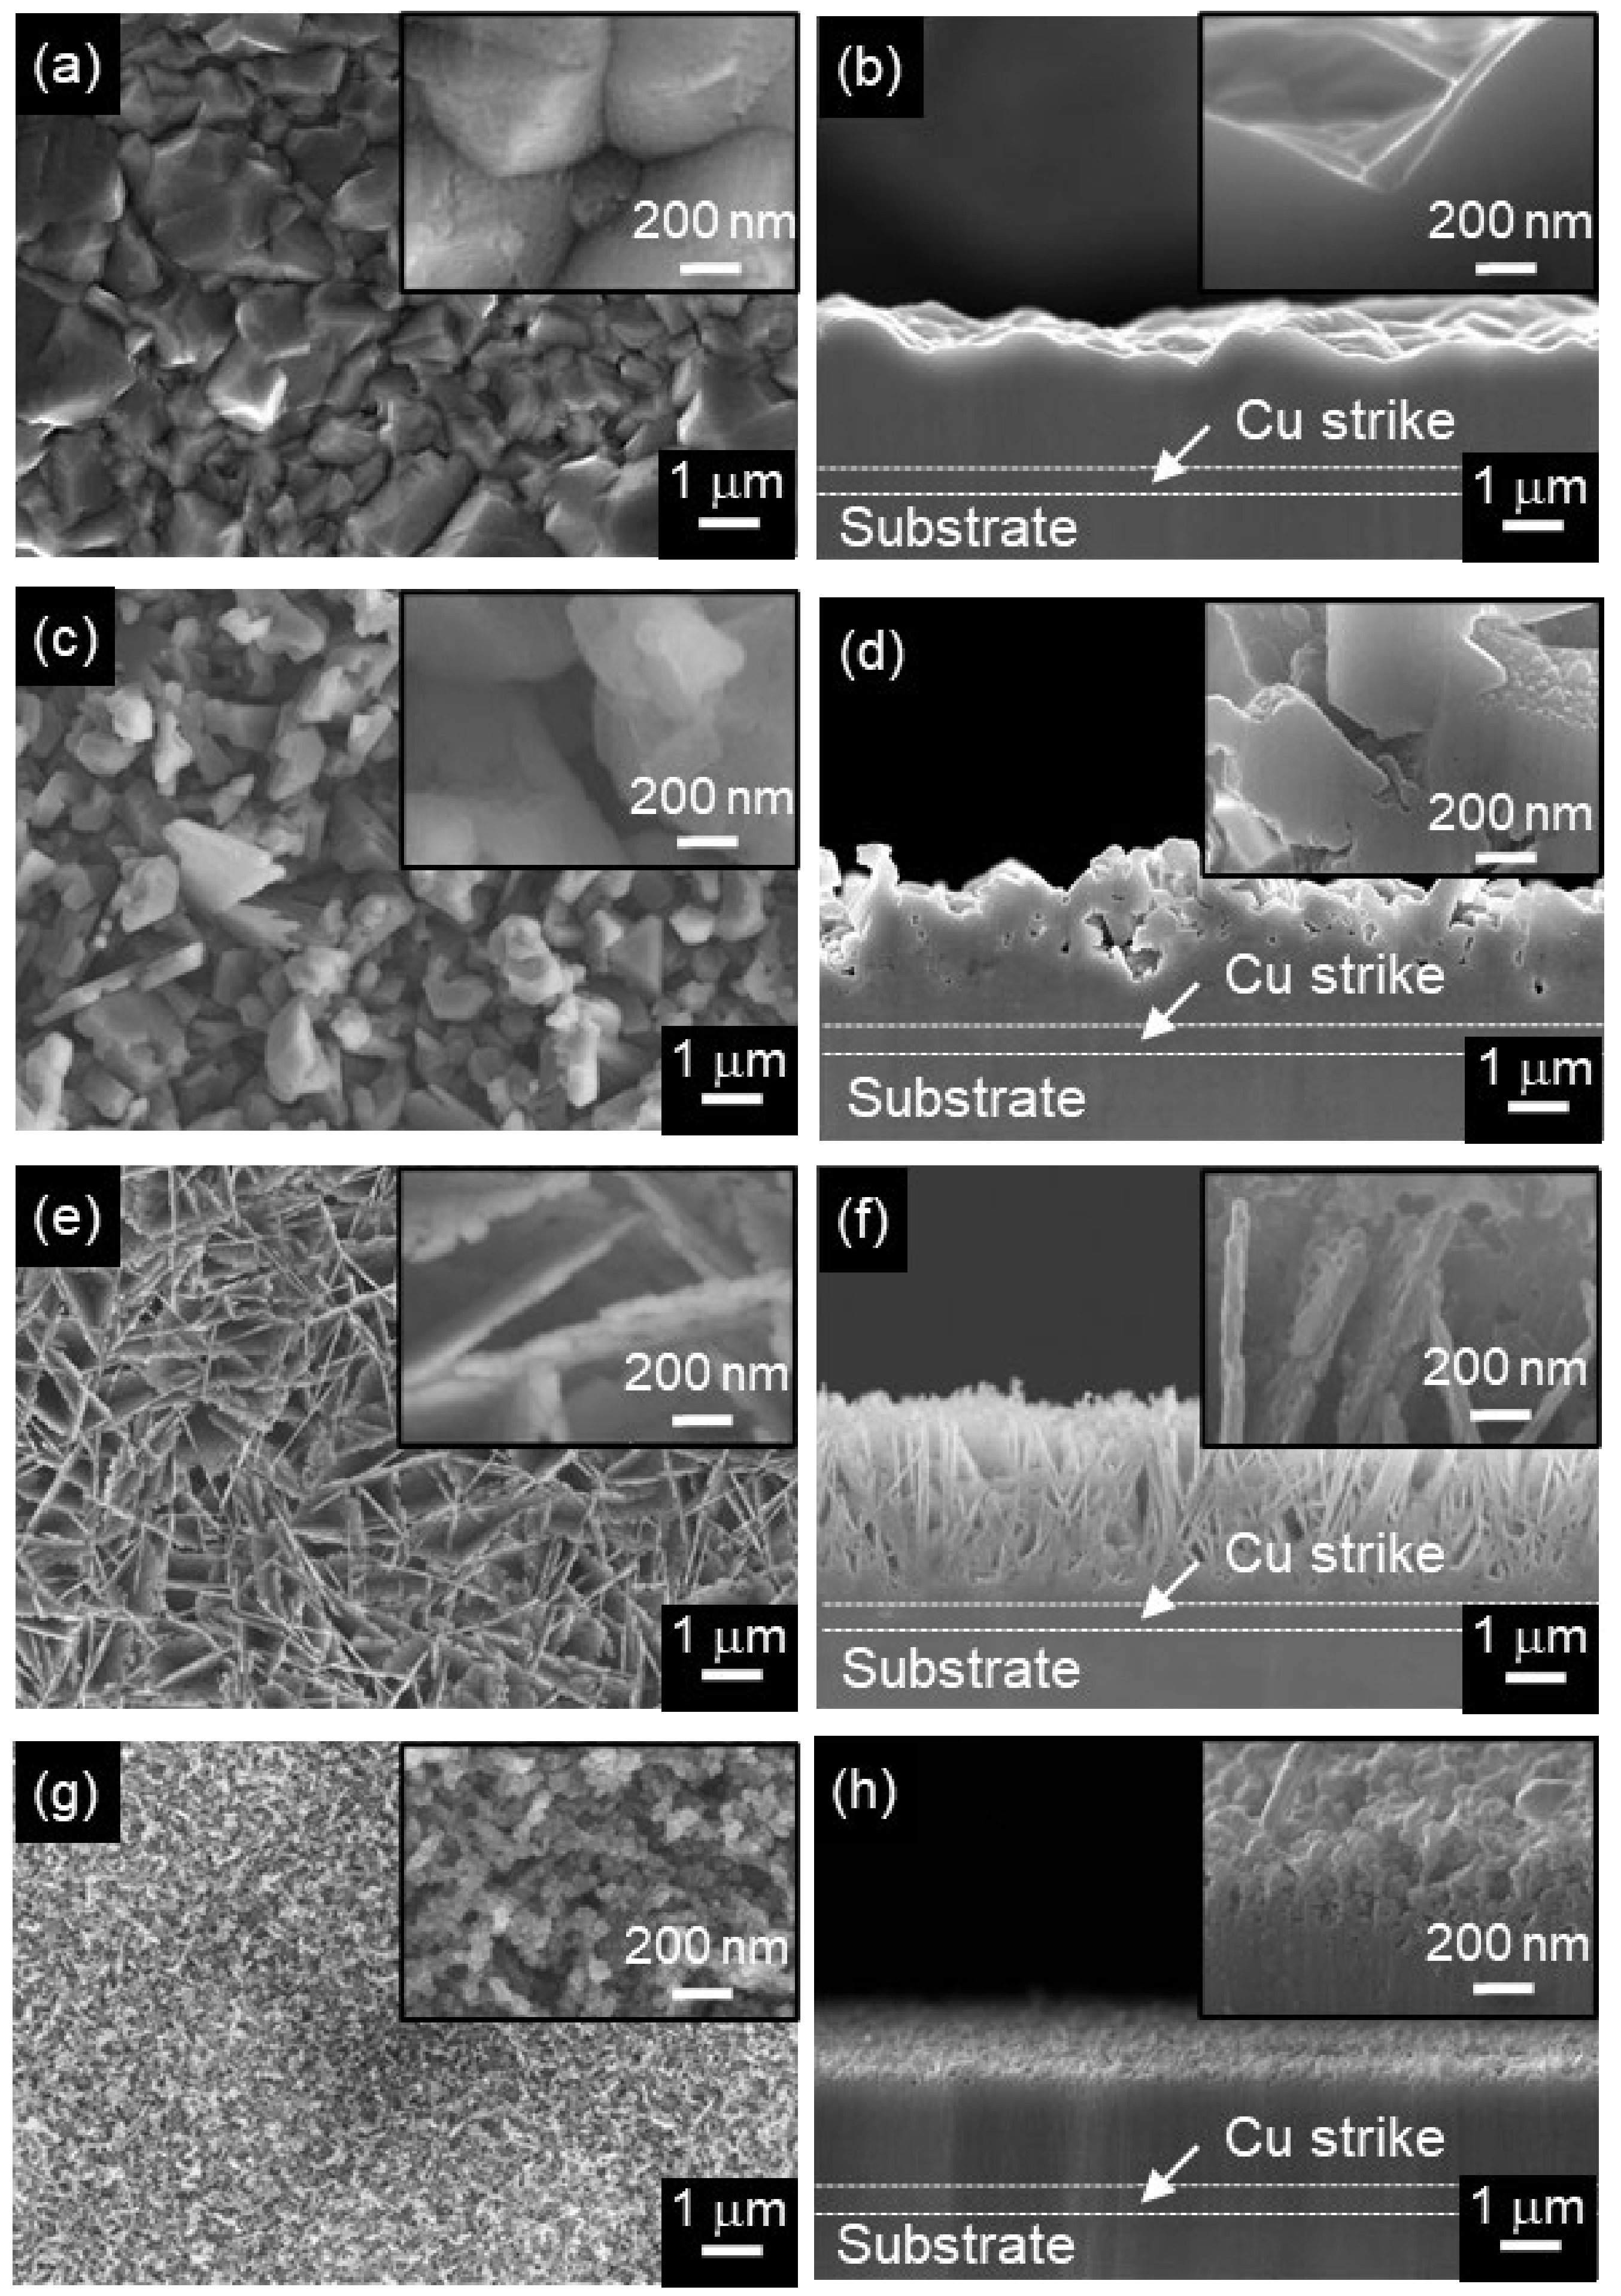
Figure 4 shows surface and cross-sectional SEM images of copper films electrodeposited using plating baths containing different concentrations of PAA. The insets are the corresponding high-magnification images. Figure 4a,b show surface and cross-sectional SEM images, respectively, of the copper film plated without using PAA (Sample A). It was seen that grains with sizes of 1–3 μm were present on the copper film (Figure 4a). Although an unevenness of about 1 μm was observed for this film, this was insufficient to achieve the anchor effect (Figure 4b). Figure 4c,d show surface and cross-sectional SEM images, respectively, of a copper film deposited in a plating bath with 5 × 10⁻⁵ M PAA (Sample B). The morphology in Figure 4c was seen to be similar to that in Figure 4a. However, the unevenness was larger and a morphology that can achieve the anchor effect was present (Figure 4d). Figure 4e,f are surface and cross-sectional SEM images, respectively, of a copper film produced by a plating bath with 3 × 10⁻⁴ M PAA (Sample C). Large irregularities consisting of plate-shaped deposits with a thickness of 30–40 nm were seen to intersect each other (Figure 4e). The total thickness was ≈4 μm, and so the film was expected to exhibit a strong anchor effect (Figure 4f). Figure 4g,h show surface and cross-sectional SEM images, respectively, of a copper film produced using a plating bath containing 5 × 10⁻⁴ M PAA (Sample D). Small grains and hollows, tens of nanometers in size, were seen on the surface (Figure 4g). This uneven morphology was ≈300 nm thick, and the hollows had intricate shapes, which would allow a strong anchor effect (Figure 4h).
These four types of copper films were plated on the SPCC substrates, and samples bonded with PPS resin were formed by injection molding (Figure 1).
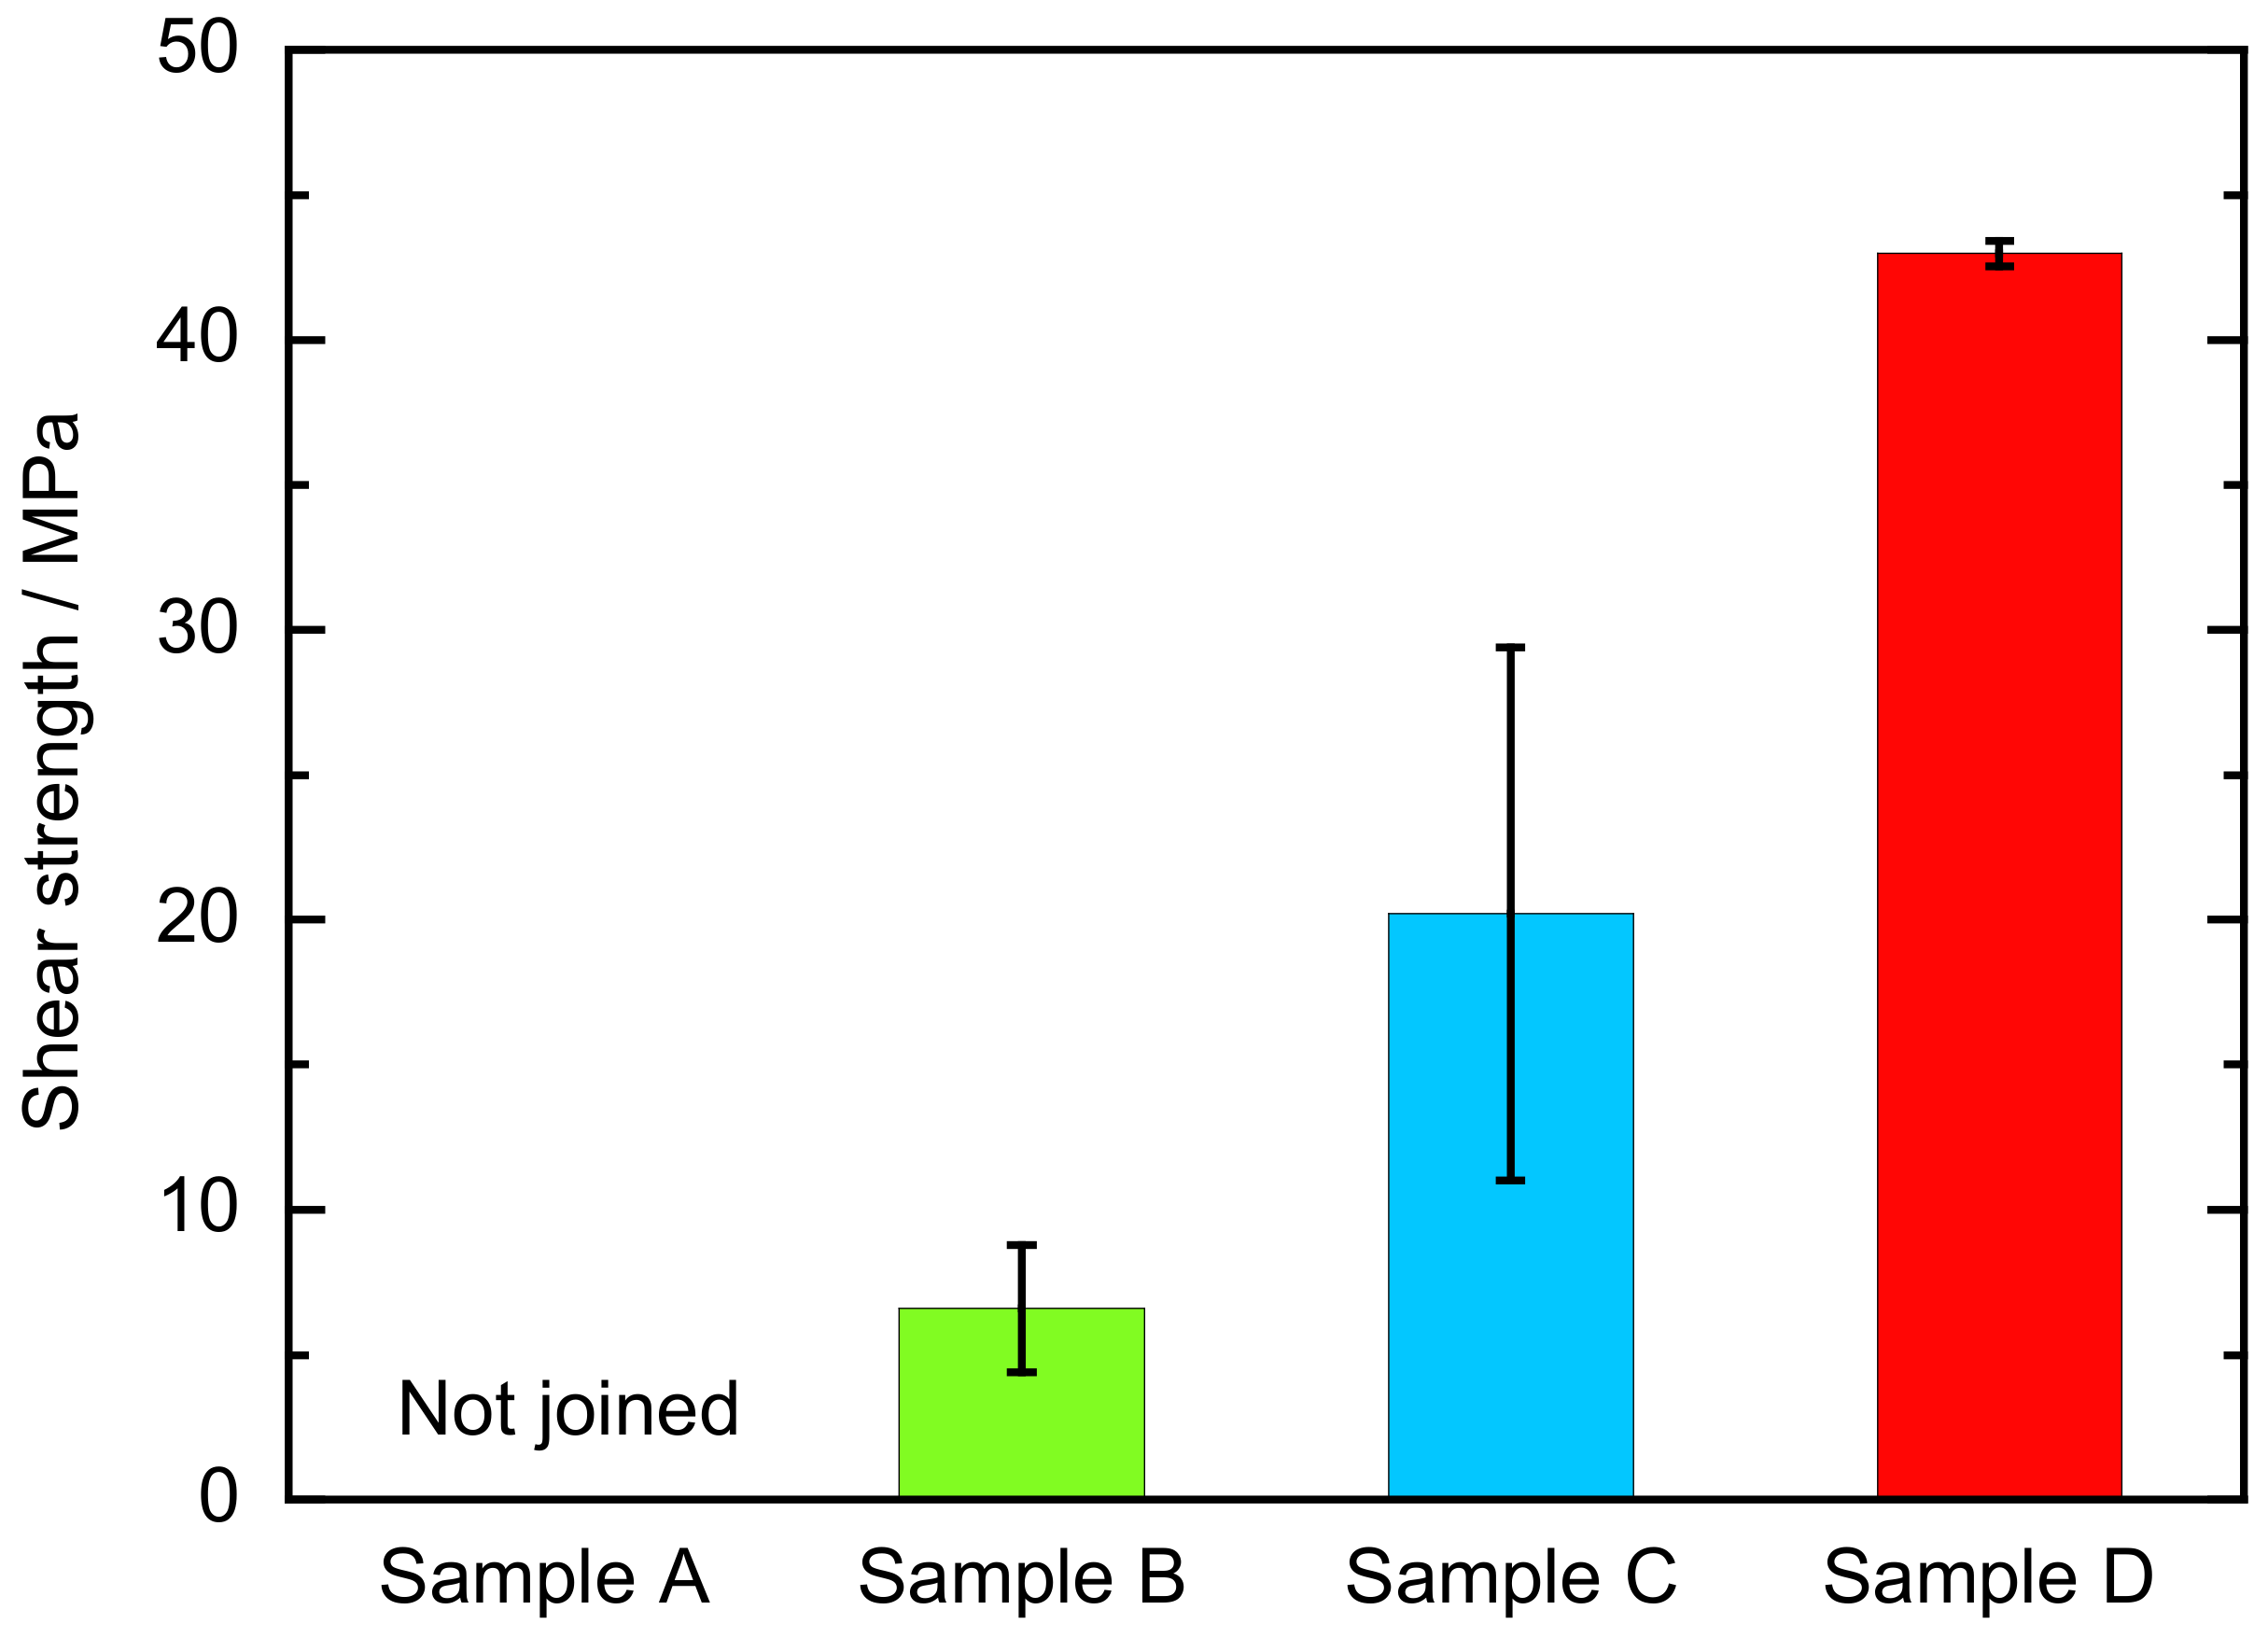
Figure 5 shows the measured shear strength for the four bonded samples. The shear strength could not be evaluated for Sample A because the copper-plated SPCC substrate and the PPS resin did not join at all, and they separated when they were removed from the mold. This means that the chemical bonds and the van der Waals force between the copper film and the PPS resin were very weak. In contrast, all copper films formed with the PAA roughening agent could be joined to the PPS resin. The shear strengths for samples B, C, and D were 6.6 MPa, 20.2 MPa, and 43.0 MPa, respectively. These bonding strengths mainly arise from the anchor effect between the roughened copper films and the PPS resin. Although the unevenness of the roughened copper film in sample C was remarkable (Figure 4f), the bonding strength was lower than expected. Visual inspection showed that the fracture modes for samples B, C, and D were peeling between the copper film and the PPS resin, separation in the copper film, and cohesive failure within the PPS resin, respectively.
To consider the measurement results for the shear strength, the boundaries of the bonding samples were analyzed. Figure 6 shows cross-sectional SEM images of bonded samples before the tensile lap shear strength test. For sample B, there is almost no change in the morphology of the copper film compared to that of the film before bonding (Figure 4d), and the PPS resin was thoroughly inserted into the hollows on the surface of the copper film (Figure 6a). This boundary structure produced an anchor effect and resulted in a shear strength of 6.6 MPa. In contrast, considerable morphological change was observed for sample C. Compared with the morphology of the copper film with deep irregularities before bonding (Figure 4f), a dense morphology was observed after bonding (Figure 6b). A morphology with shallow unevenness was seen on the dense morphology and the PPS resin flowed into this unevenness. The morphological change of the copper film must have been caused by the impact of the PPS resin when it was injected. This means that the copper film needs to have some material strength to form a suitable boundary structure with the resin without deforming the copper film. In sample C, because the fracture mode was separation in the copper film, the crushed copper film areas where the material strength was weak created a separation interface, resulting in a shear strength of 20.2 MPa. Sample D seemed to show almost no change in the morphology of the copper film compared with that of the film before application of the PPS resin (Figure 4h), and the PPS resin seemed to be thoroughly inserted into the hollows in the copper film (Figure 6c).
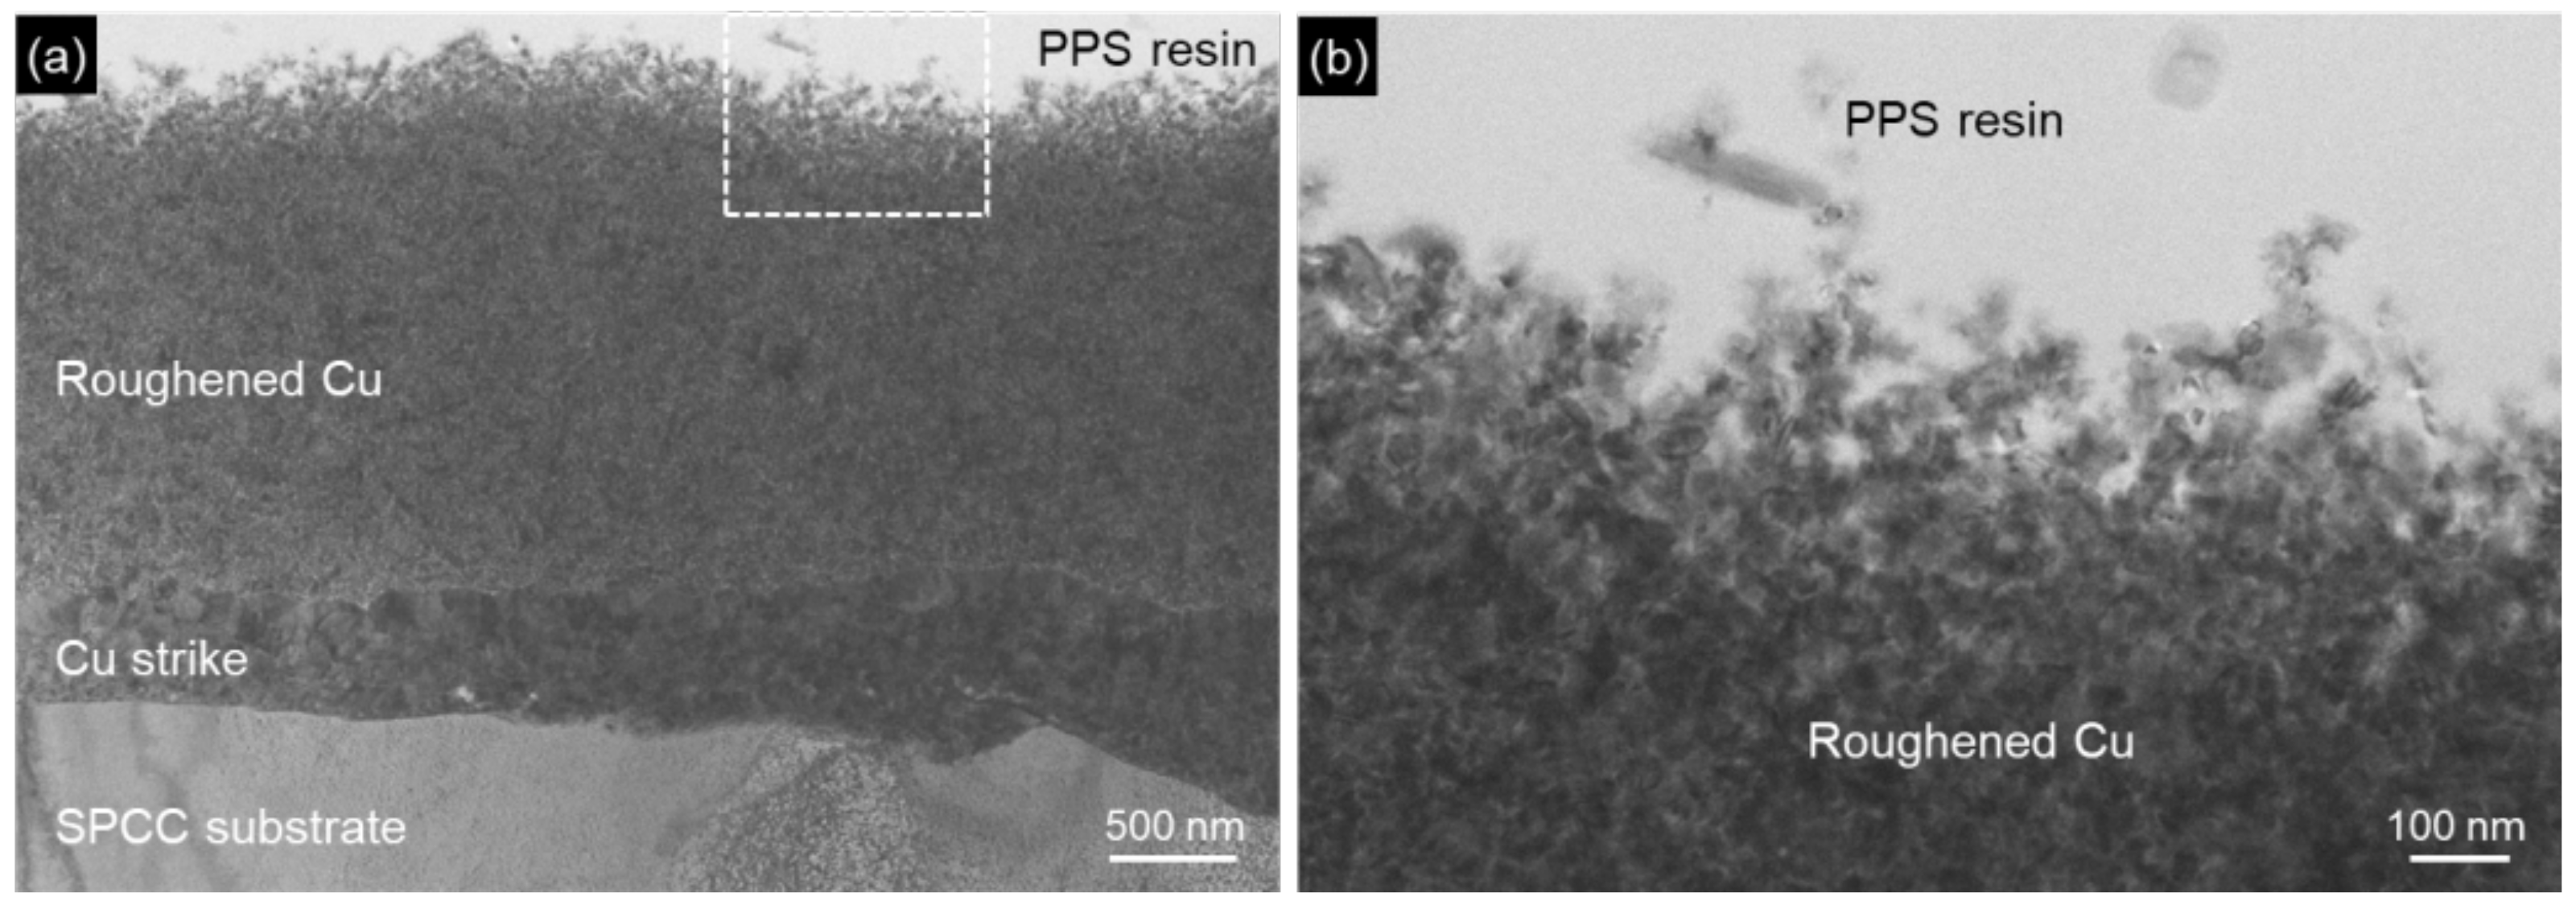
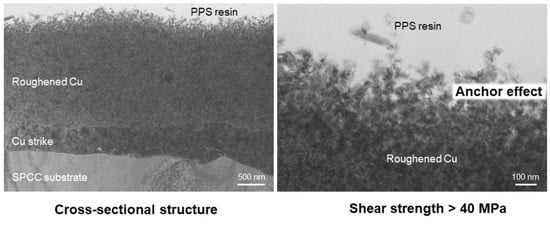
To clarify the boundary structure between the copper film and the PPS resin, a STEM analysis was carried out. Figure 7 shows STEM images of the boundary between the copper film and the PPS resin. A multi-layer structure consisting of the copper strike and the roughened copper film was clearly seen on the SPCC substrate (Figure 7a). At the boundary between the copper film and the PPS resin, fine irregularities were clearly seen, and no gaps appeared between the roughened layer and the PPS resin (Figure 7b), which suggests a strong anchor effect. Therefore, during bonding with the PPS resin by injection molding, the irregularities of the copper film did not deform and the PPS resin was thoroughly inserted into the fine hollows in the copper film, resulting in the maximum shear strength of 43.0 MPa and a fracture mode of cohesive failure of the PPS resin. As the crystallite size in the roughened copper film was very small (tens of nanometers), as shown in Figure 7b, the material strength of the copper film was expected to be high, resulting in no deformation of the irregularities during bonding with the PPS resin. As sample D showed excellent bonding strength, the durability of its bonding strength was further evaluated.
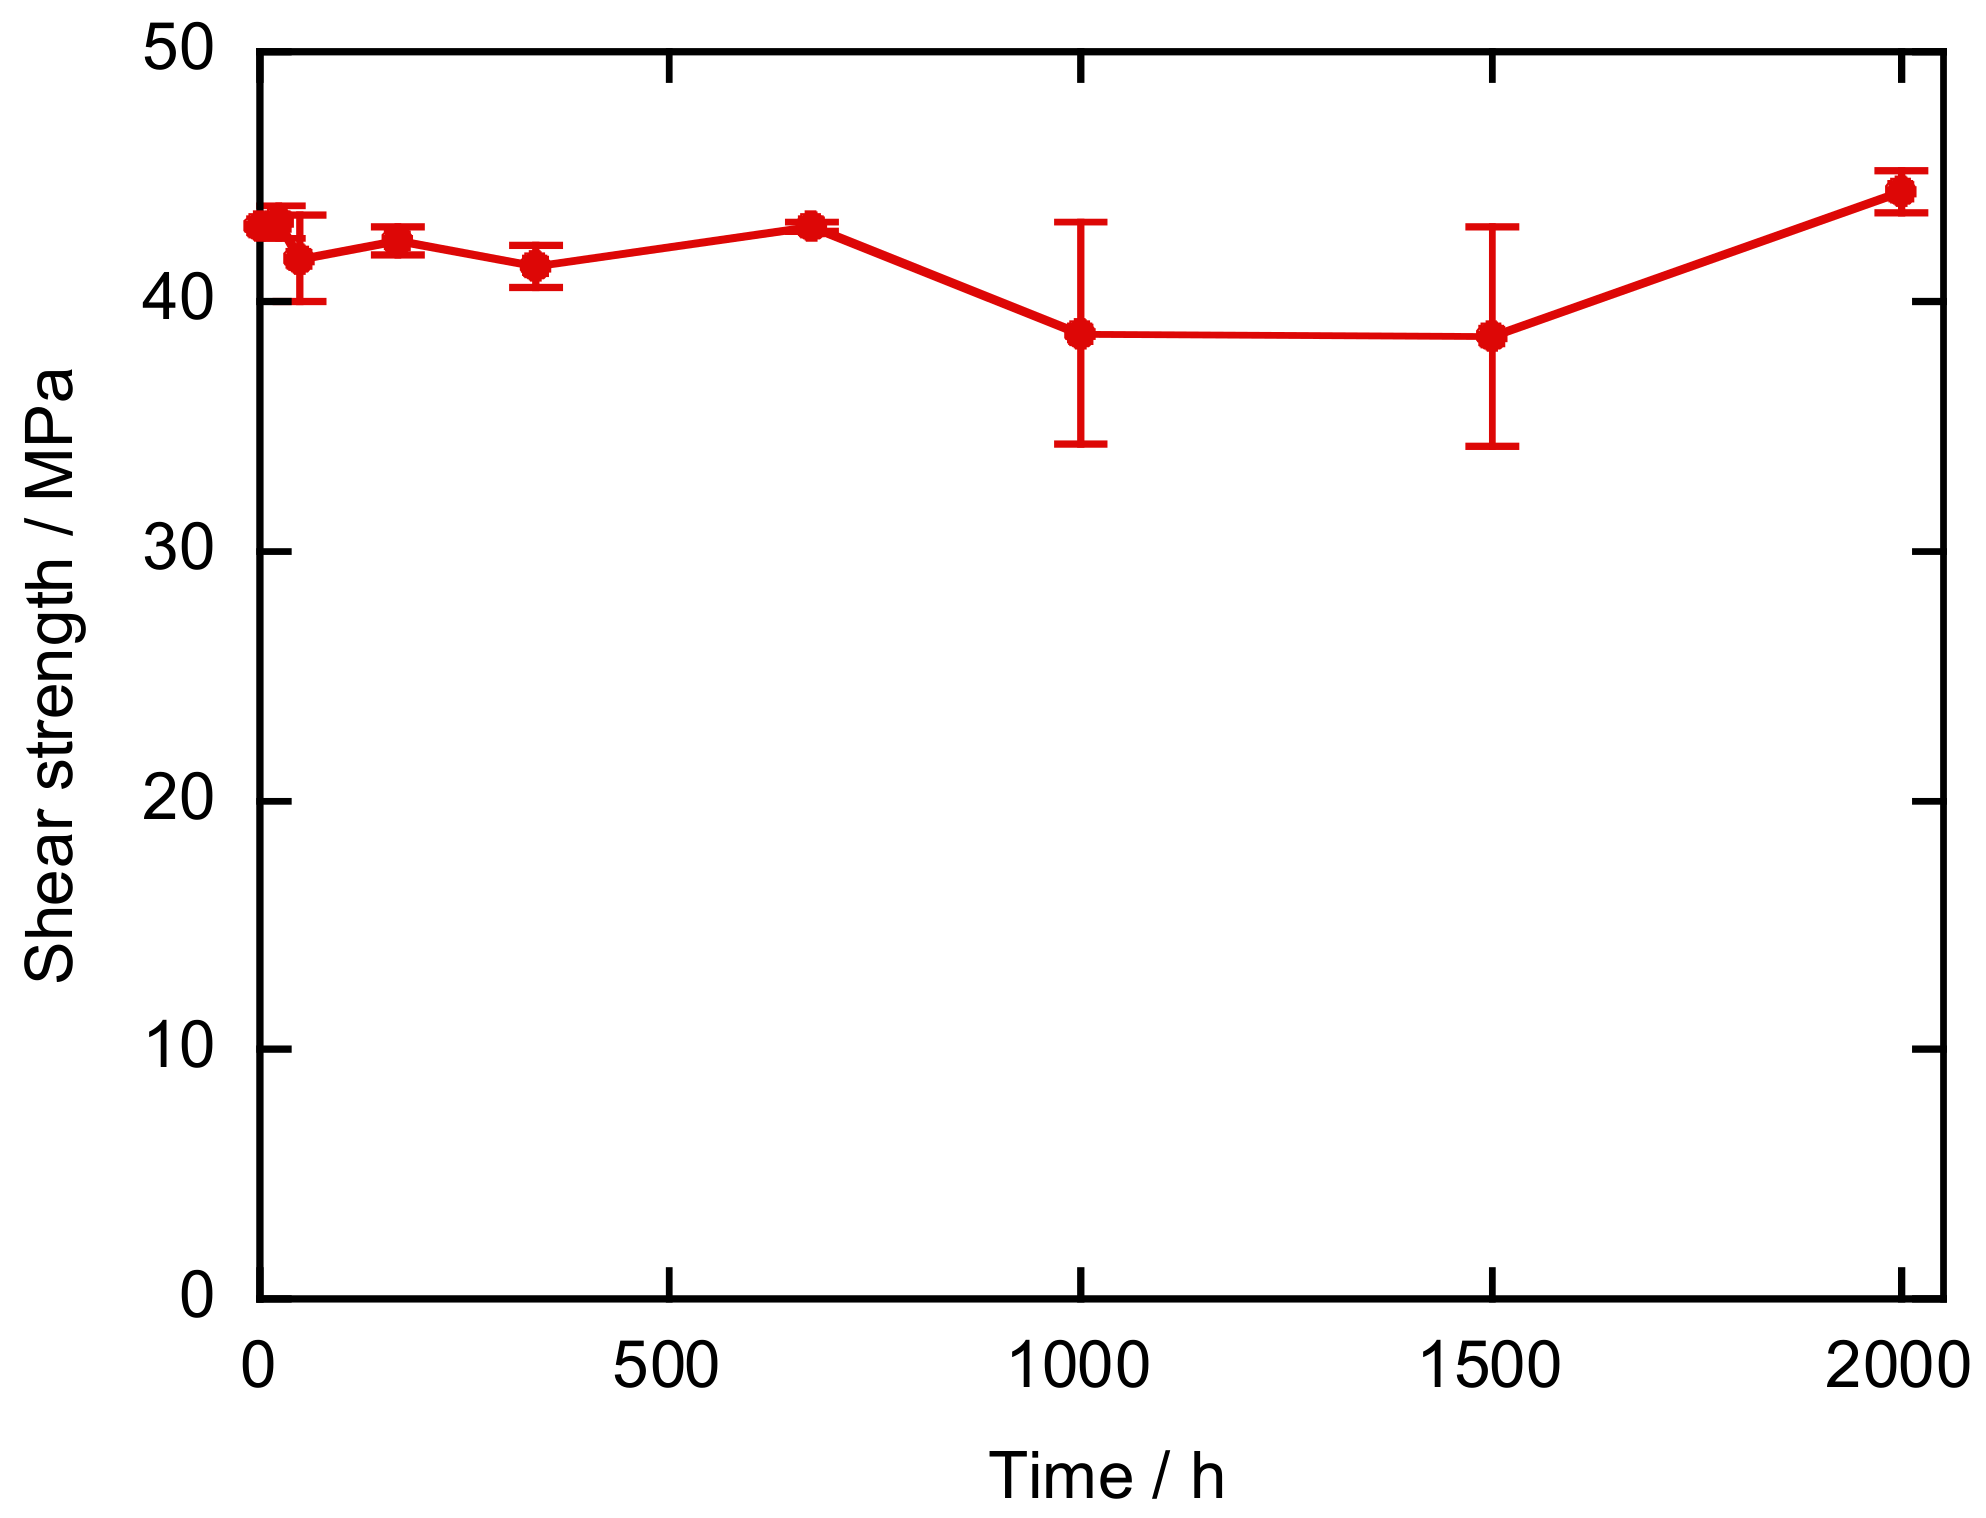
Figure 8 shows the variation in the shear strength during the high-temperature and high-humidity test. Although some variation was observed at 1000 and 1500 h, the shear strength is almost unchanged during the test, remaining above 40 MPa even after 2000 h. Thus, the durability of sample D in the presence of high temperature and humidity was excellent. The fracture mode for all specimens before and after the test was cohesive failure of the PPS resin, as determined by visual inspection. These results show that the bonding strength between the roughened copper film and the PPS resin, the material strength of the roughened copper film, and the bonding strength between the roughened copper film and the SPCC substrate must be higher than the material strength of the PPS resin.
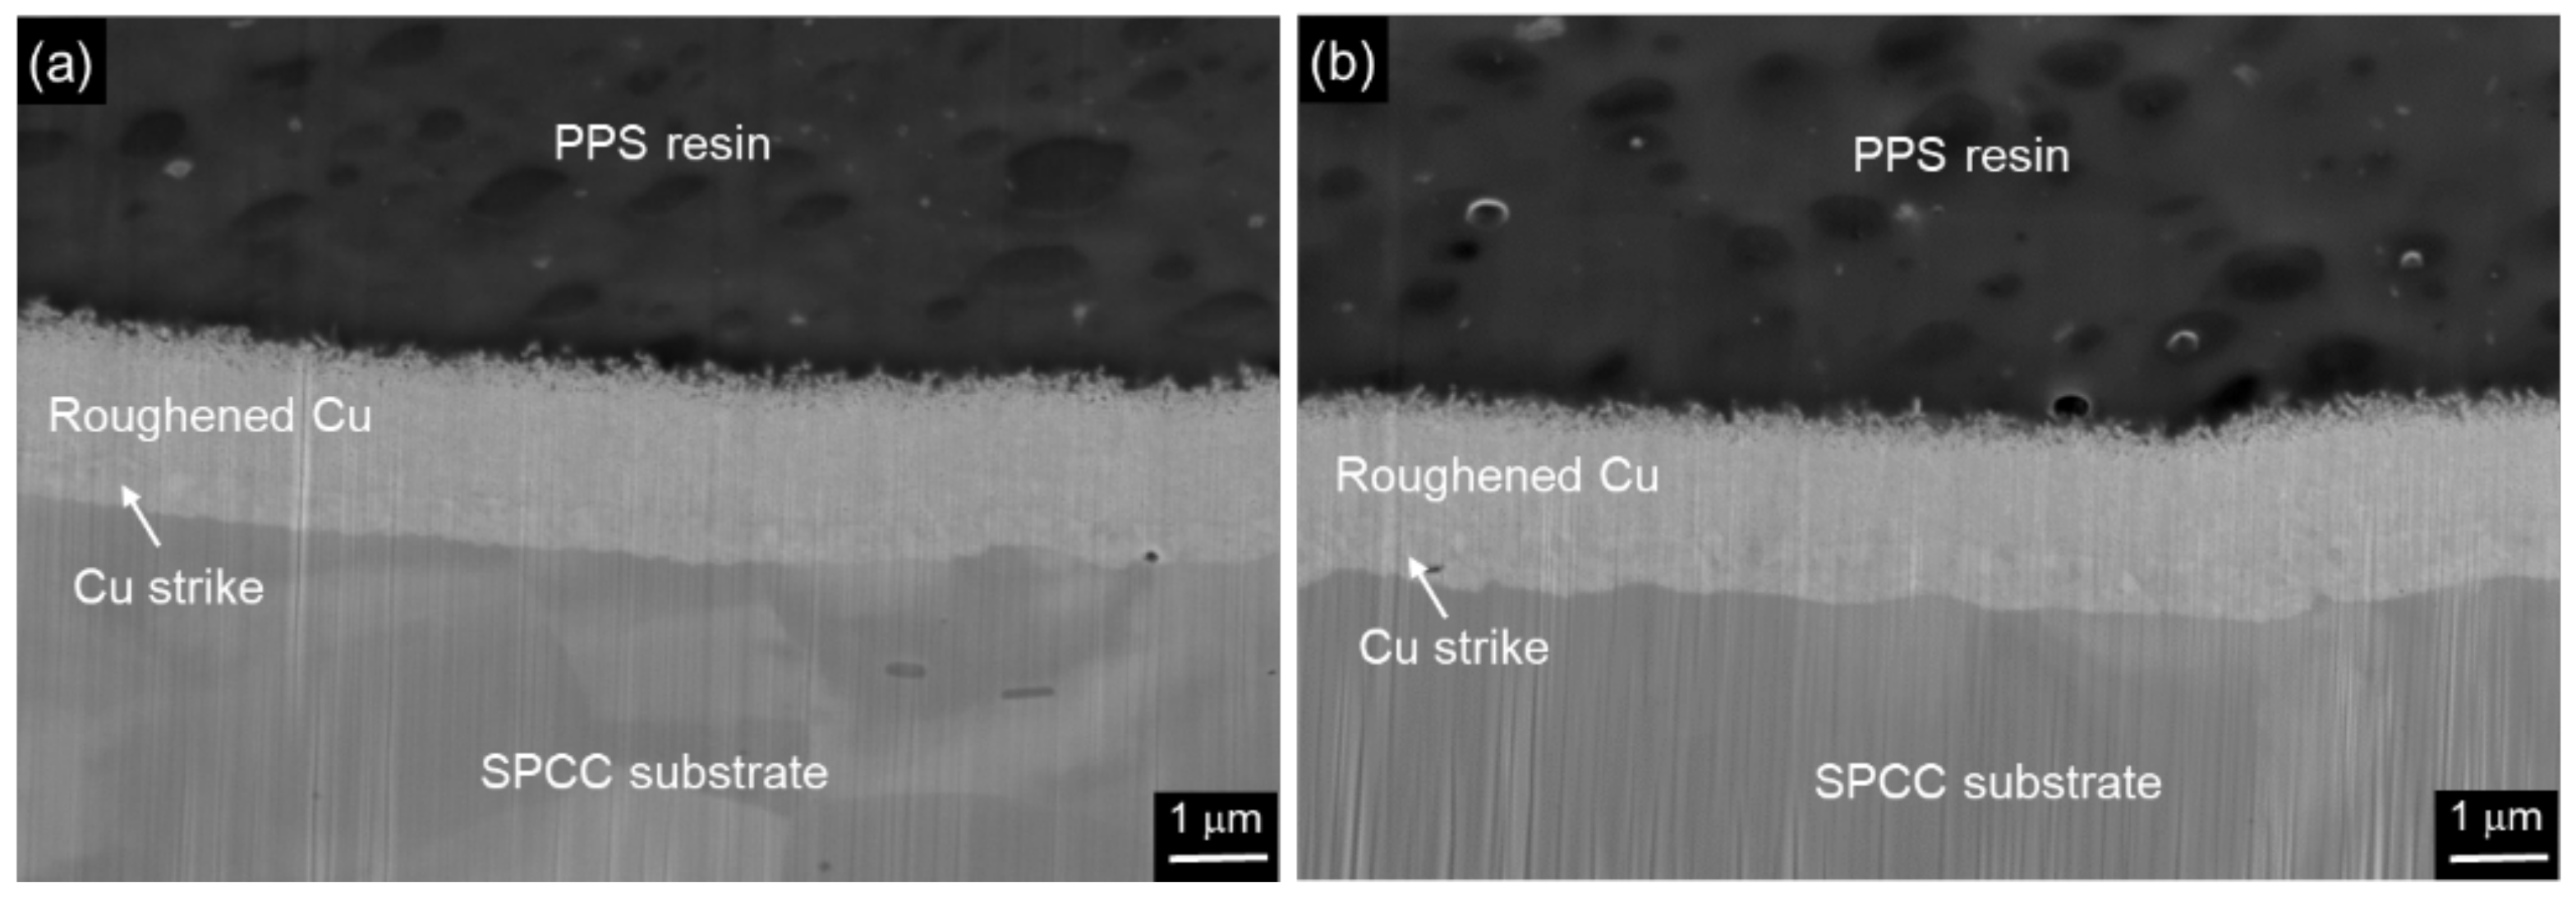
The cross-sectional SEM images in Figure 9a,b show the joint for sample D before and after the high-temperature and high-humidity test (2000 h), respectively. It was seen that no significant shape change occurred during the test, presumably due to the corrosion resistance of the copper film. As copper has a higher standard electrode potential than iron (Cu2+ + 2e → Cu: E° = +0.34 V vs. SHE, Fe2+ + 2e → Fe: E° = −0.44 V vs. SHE), the copper film was thought to protect the SPCC substrate from corrosion. It might be considered that during high-temperature and high-humidity testing, moisture might gradually penetrate the boundary between the electroplated SPCC substrate and the PPS resin [24], thus corroding the SPCC substrate. However, since the roughened copper film had a large surface area, which meant that the distance along the interface with the PPS resin was long, moisture could not easily penetrate from the surface to the interface. For these reasons, no corrosion occurred at the boundary, resulting in excellent bond durability (Figure 8).
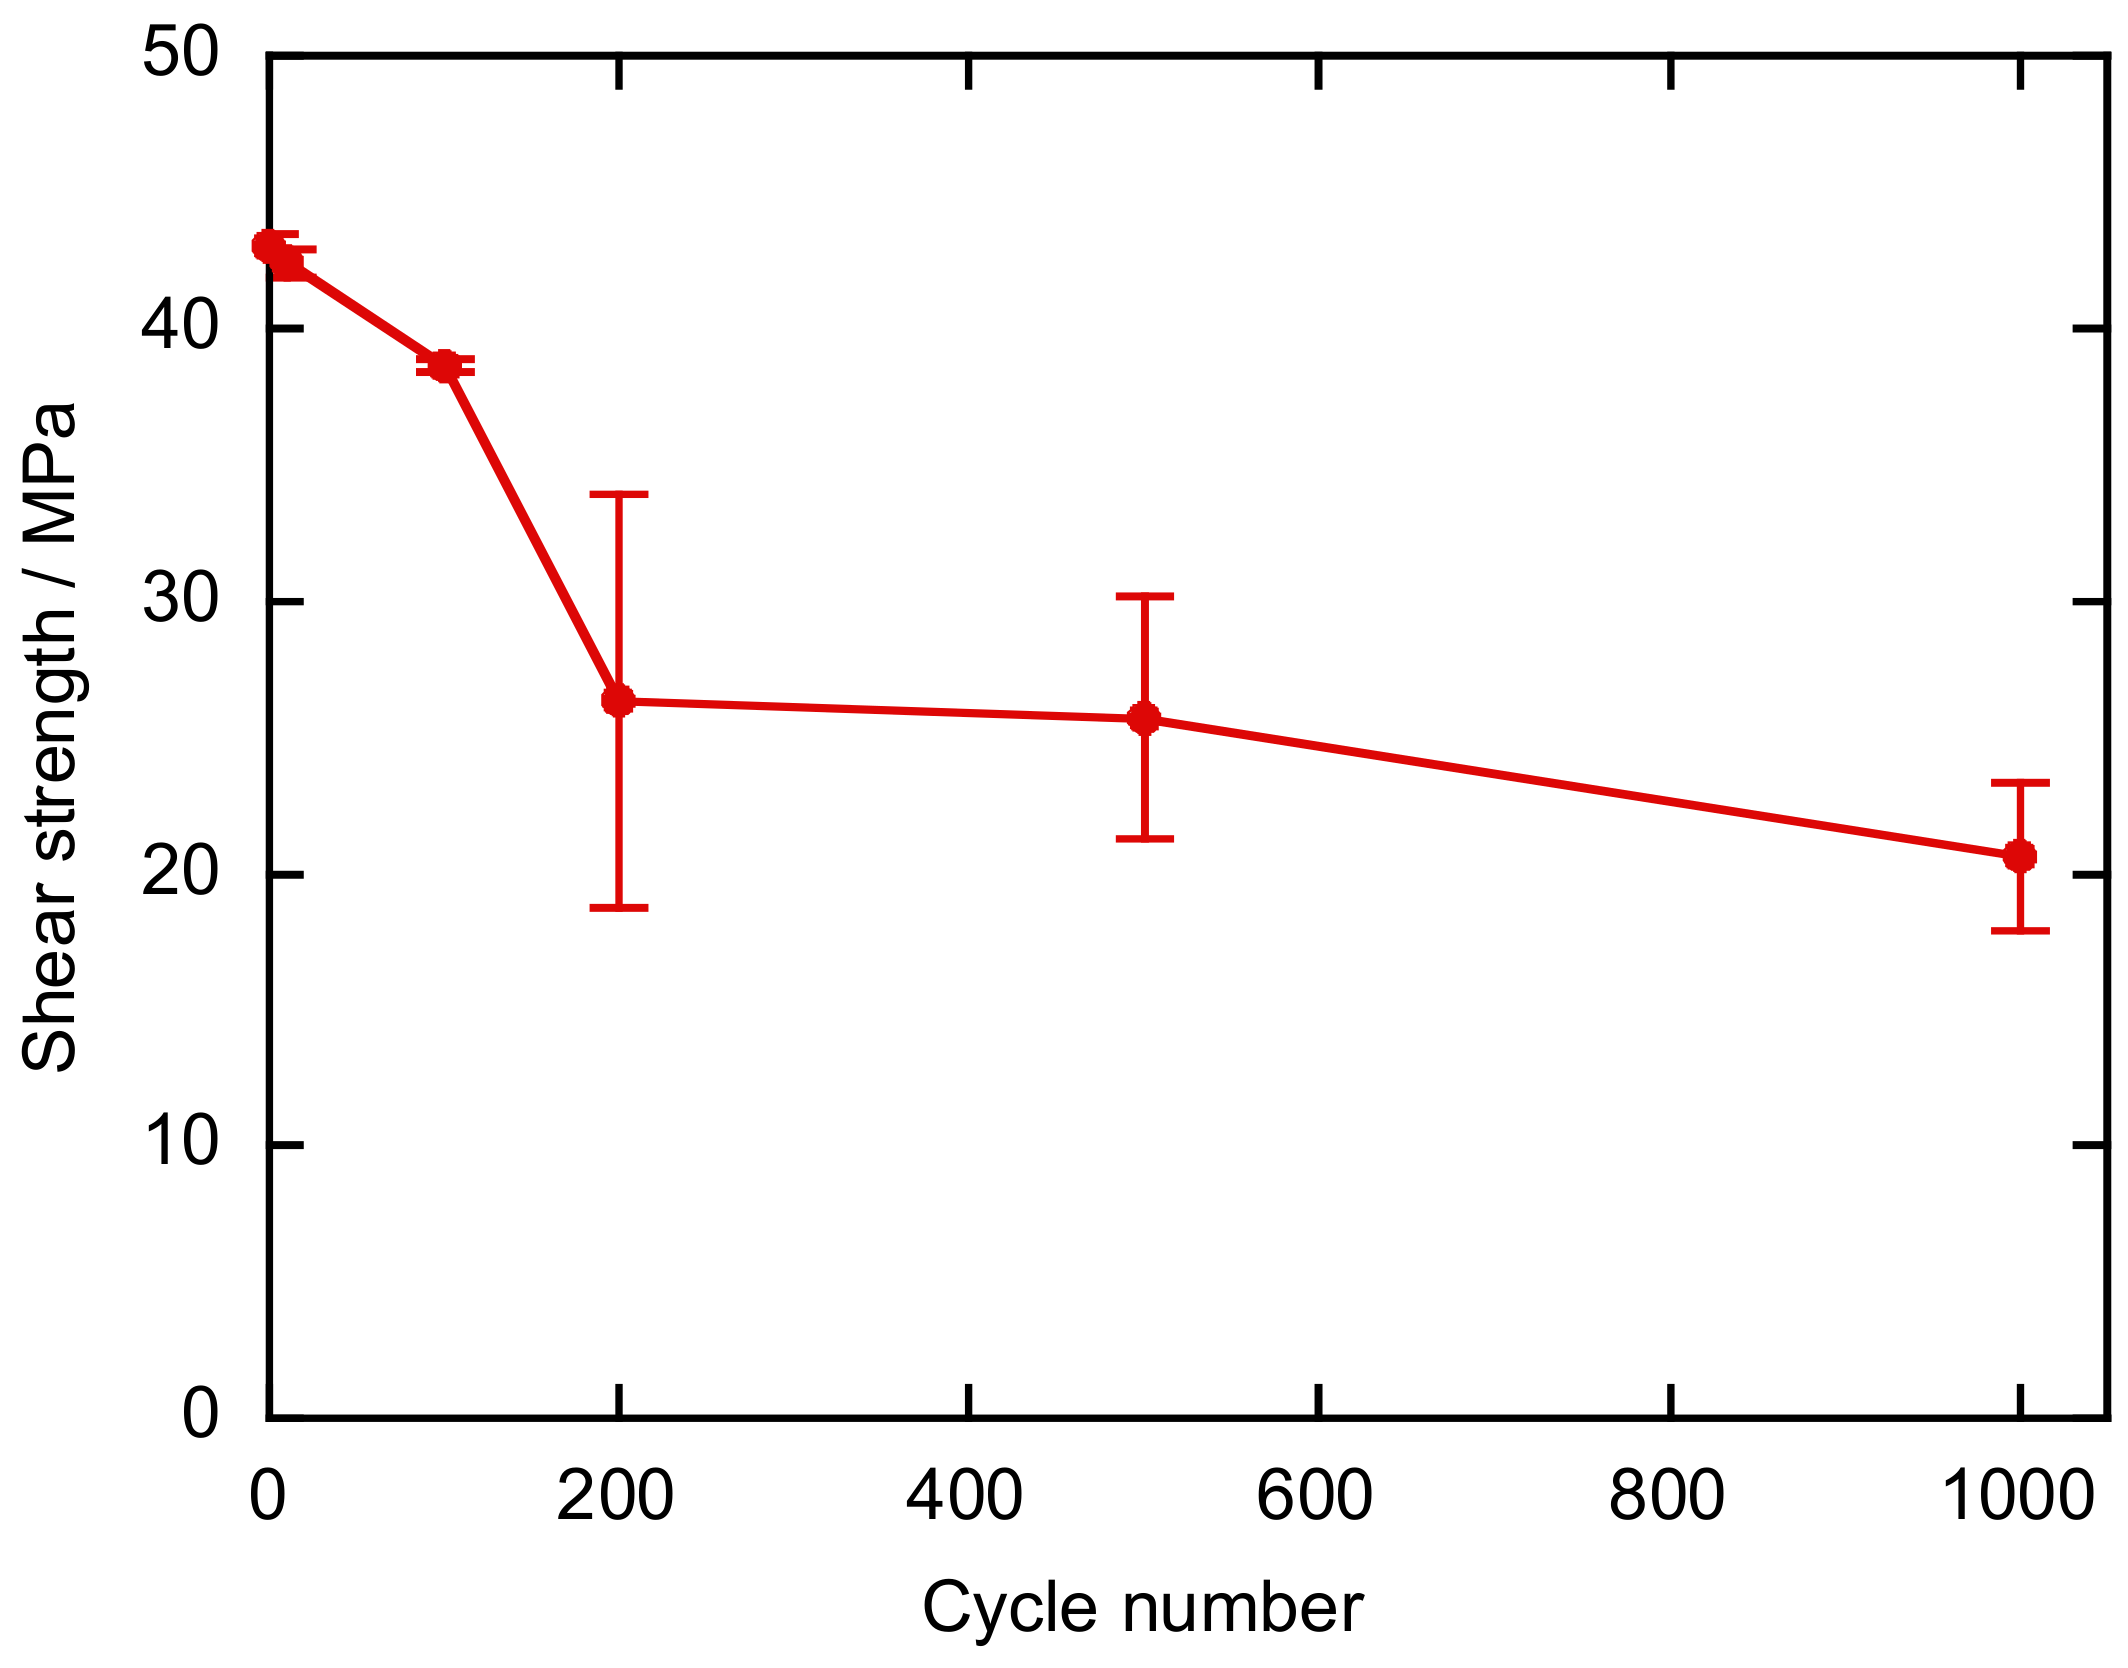
Figure 10 shows the variation in shear strength during the heat shock test. Although the shear strength decreases gradually, the shear strength is above 20 MPa even after 1000 cycles. Taking the severe conditions (−50 °C–150 °C) into consideration, the bond has high durability against thermal shock.
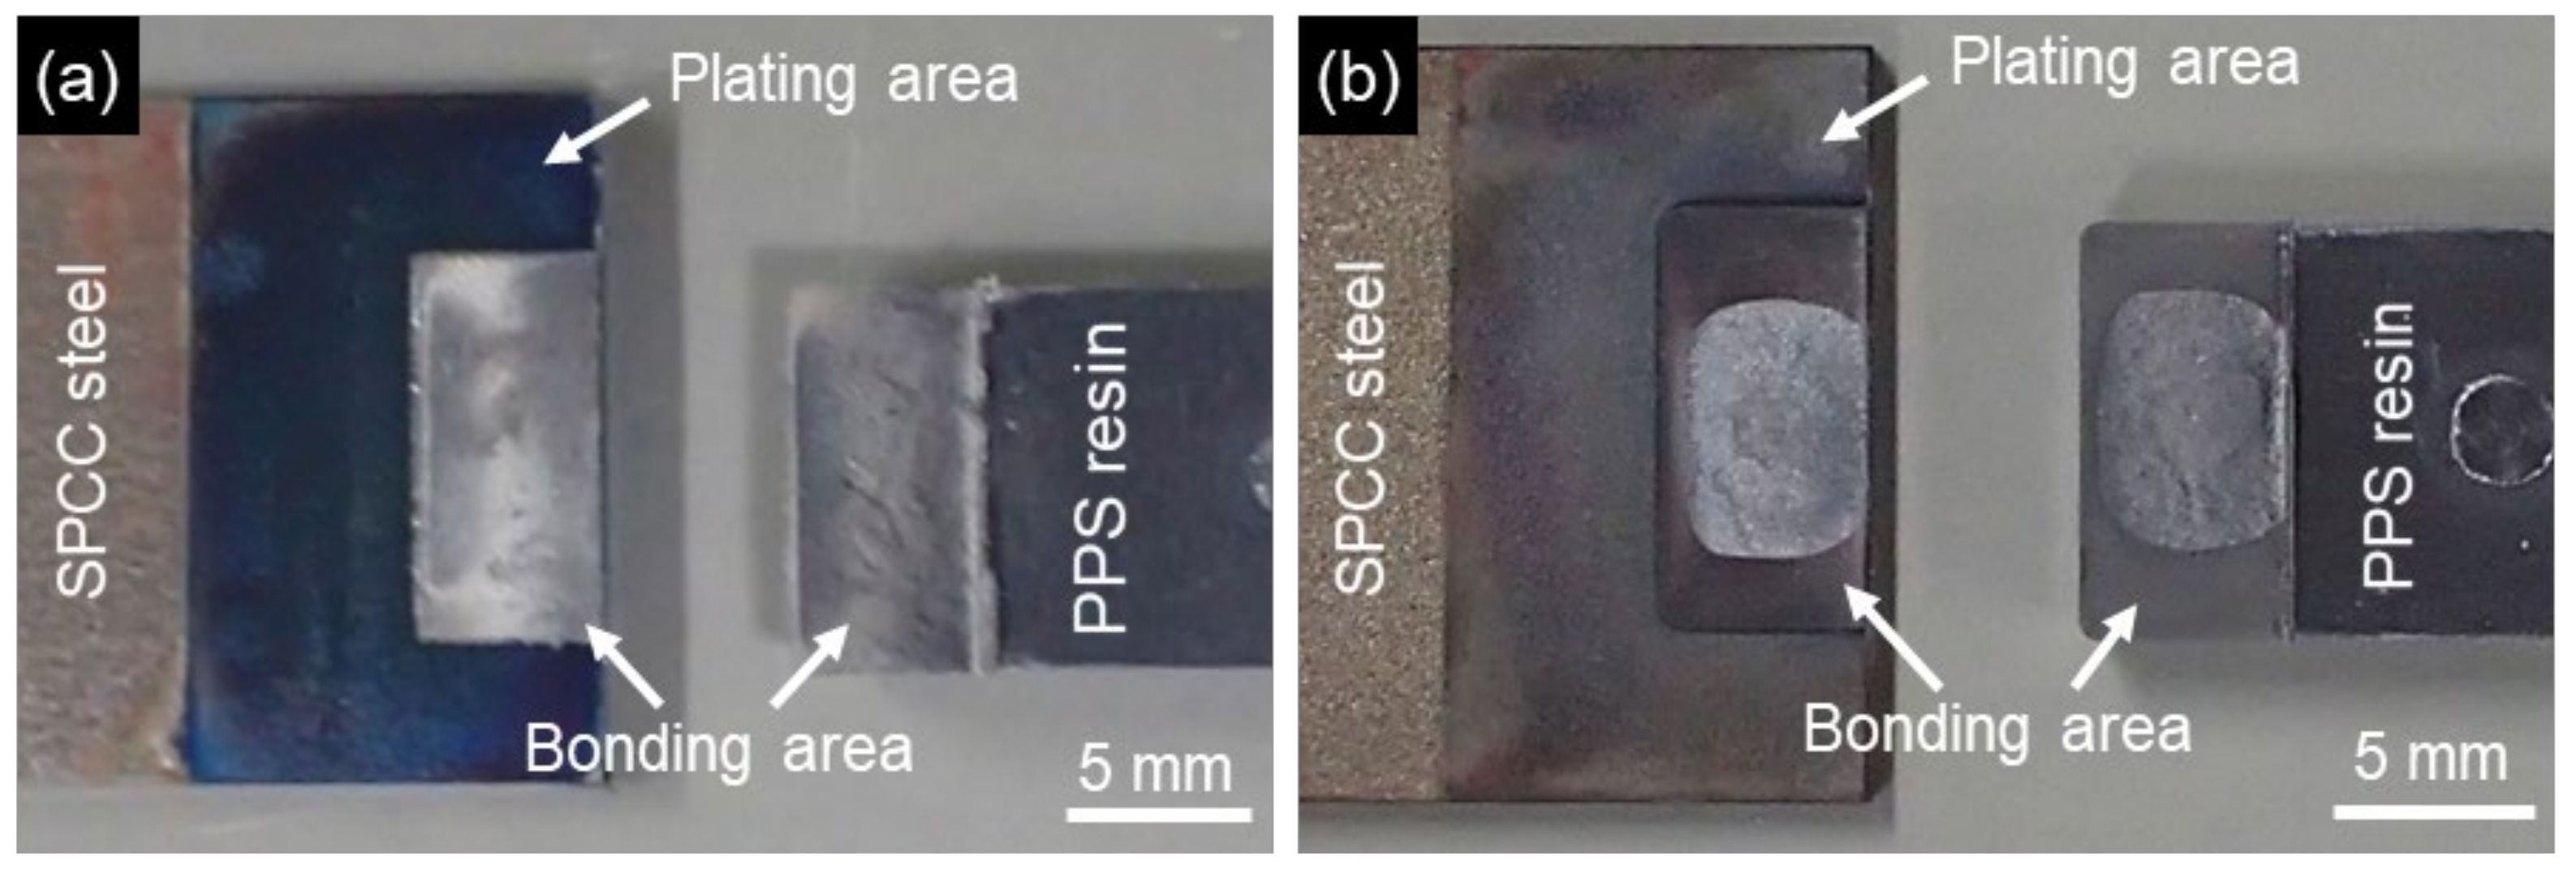
Figure 11 shows the fracture surfaces of the bonded samples used in the heat shock test. There were clearly two different morphologies after the test (Figure 11b), which were different to the case of the pre-test fracture surfaces, which exhibited a uniform morphology over the entire surface (Figure 11a). In addition to the bright central regions with almost the same morphology as that before the test (Figure 11a), the edge regions appeared dark.
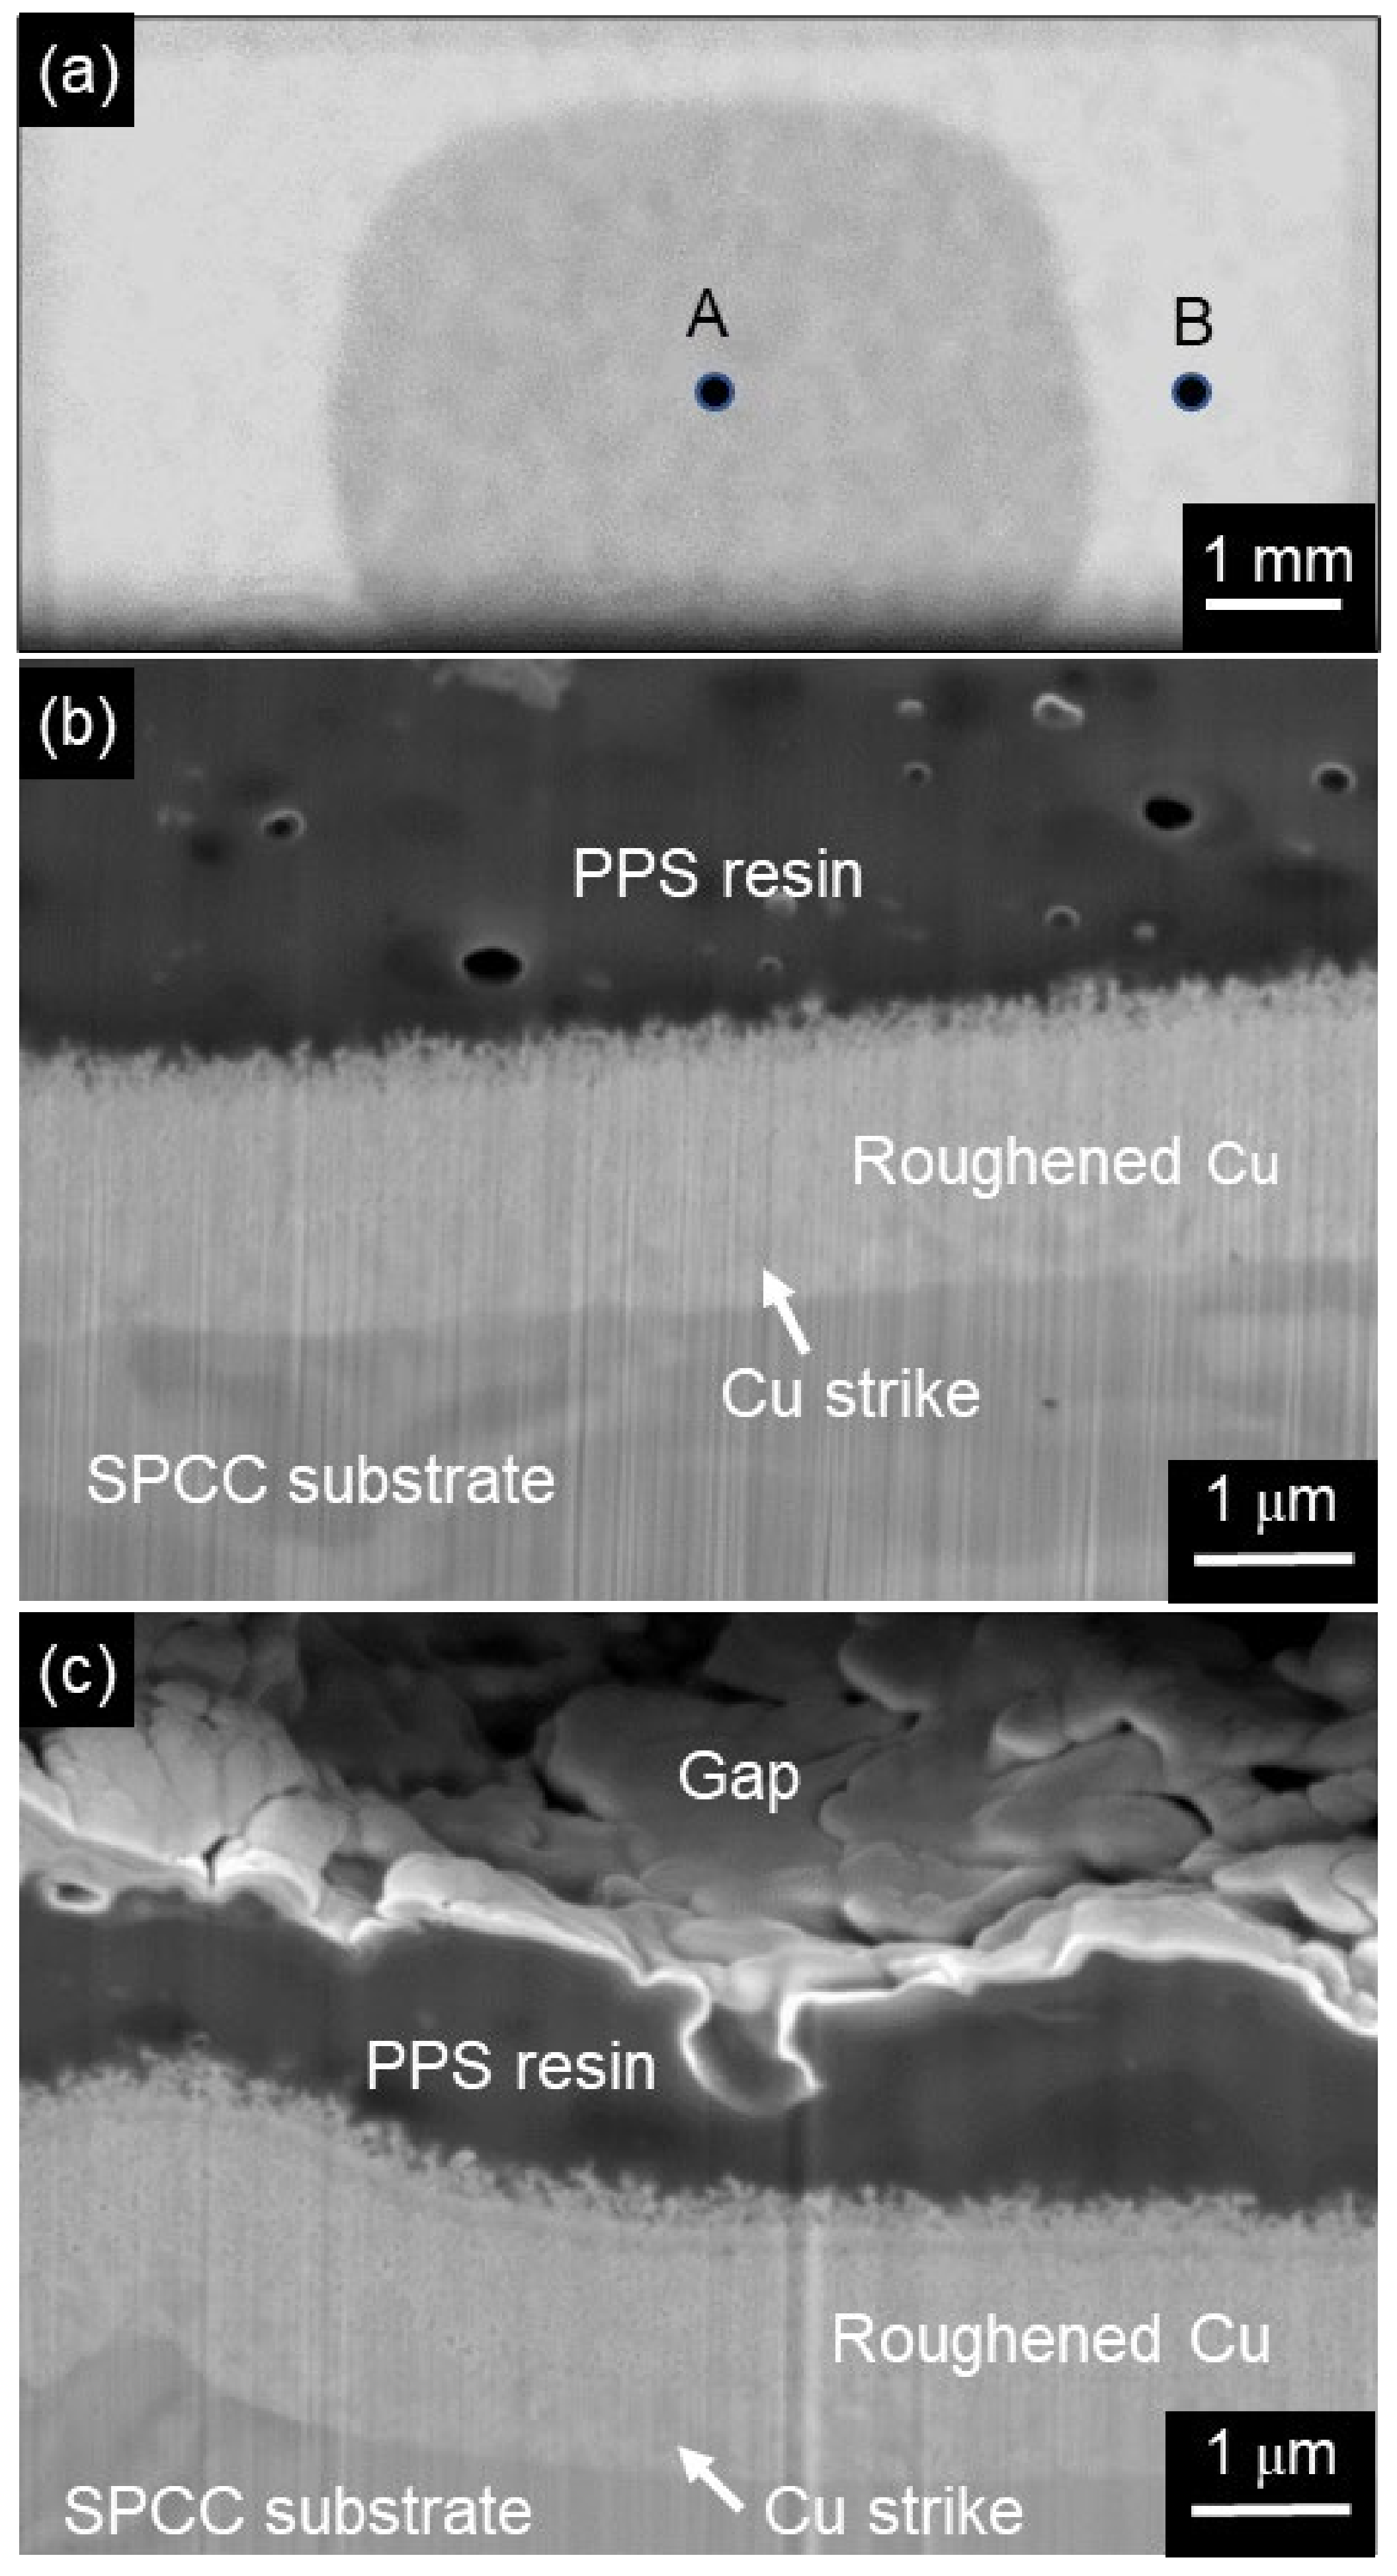
Figure 12 shows SAT images of the bonded areas of the non-shear-tested bonding samples before and after (1000 cycles) the heat shock test. Before the heat shock test, the SAT image was uniformly gray (Figure 12a), which meant that no significant gaps existed at the boundary of the SPCC substrate and the PPS resin. The SAT image obtained after the thermal shock test showed bright regions at the edges, in addition to the central gray region (Figure 12b). This SAT image was very similar to the photograph of the fracture surface obtained after the thermal shock test (Figure 11b). These bright regions indicate the presence of gaps along the boundary of the bonded area. These results showed that the fracture in the edge region must be related to gaps formed during the thermal shock test. To reveal the location of the gaps, a cross-sectional analysis was conducted in the bright and dark areas of the SAT image (Figure 12b).
Figure 13 shows cross-sectional SEM images of the non-shear-tested bonded sample after the thermal shock test (1000 cycles). The SAT image (Figure 13a, which is the same view as Figure 12b) indicates the cross-sectional analysis points. Point A is the gray area in the SAT image; the corresponding cross-sectional SEM image is shown in Figure 13b. This SEM image revealed that no significant morphological change occurred during the thermal shock test (as compared with Figure 9a). Thus, the dark central region in the SAT image was the bonded area where the initial boundary structure between the SPCC substrate and the PPS resin was maintained even after the thermal shock test. In contrast, at the point indicated in the bright region (B in Figure 13a), a continuous gap was formed in the PPS resin near the copper film (Figure 13c).
Stress is known to develop near the edge of interfaces between dissimilar materials that are bonded together, due to the difference in the coefficient of thermal expansion (CTE) [25,26]. In the present study, PPS resin and SPCC steel were bonded using a roughened copper film as an interlayer. There was a large difference between the CTE value for steel (1.2 × 10⁻⁵ K−1 [27]) and PPS resin (ca. 5 × 10⁻⁵ K−1 [28]). Although the exact CTE for the roughened copper film is not known, that for copper is 1.7 × 10⁻⁵ K−1 [27], which is similar to the value for SPCC steel. Therefore, during the thermal shock test, it was thought that high stress developed at the edge of the interface between the roughened copper film and the PPS resin, resulting in crack formation in the resin near the copper film starting from the edge of the bonded area. Figure 13b,c show that the bonding strength between the copper film and the PPS resin, the material strength of the copper film, and the bonding strength between the copper film and the SPCC substrate were larger than the material strength of the PPS resin throughout the thermal shock test.
The shear strength of the bonded samples decreased during the thermal shock test because the bonded area was reduced due to the formation of gaps in the PPS resin near the copper film. This gap formation was attributed to the CTE difference between the copper film (and/or SPCC substrate) and the PPS resin. Therefore, improvement of the PPS material strength and reduction of the CTE difference between the plating film and the PPS resin are promising approaches for increasing the bonding durability during thermal cycling.

4. Conclusions

Roughened copper films were electrodeposited on a steel substrate using PAA as a roughening agent to enhance the anchor effect. The strength of bonds with an injection-molded thermoplastic resin was then evaluated by a tensile lap shear strength test. The surface morphology of the copper films was found to be strongly dependent on the PAA concentration, and the bonding strength varied according to the morphology. A PAA concentration of 5 × 10⁻⁵ M yielded fine irregularities that measured tens of nanometers on the copper film surface and had sufficient strength to resist deformation during injection molding. The bonding strength between the steel substrate plated with a roughened copper film and the PPS resin exceeded 40 MPa at this concentration, and the fracture mode was cohesive failure within the PPS resin. This bonded sample also showed superior bonding durability. The shear strength maintained its high initial value of more than 40 Mpa after being subjected to high temperature and humidity (85 ± 2 °C and 85 ± 2%, respectively) even after 2000 h. During the thermal shock test (−50 °C–150 °C), although the shear strength decreased gradually, it remained at more than 20 MPa even after 1000 cycles. This method offers a way to achieve practical high-strength bonding of dissimilar materials, such as steel and resin.

Author Contributions

Conceptualization, S.A.; methodology, S.A.; validation, R.I., formal analysis, J.I., M.H., and T.N.; investigation, R.I.; resources, M.I.; data curation, R.I.; writing—original draft preparation, S.A.; writing—review and editing, M.S.; visualization, S.A. and R.I.; supervision, S.A.; project administration, S.A.; funding acquisition, S.A. All authors have read and agreed to the published version of the manuscript.

Funding

This research was supported by the Japan Science and Technology Agency, and Adaptable and Seamless Technology Transfer Program through Target-driven R&D (A-STEP, Grant Number JPMJTM19B9).

Institutional Review Board Statement

Not applicable.

Informed Consent Statement

Not applicable.

Data Availability Statement

Not applicable.

Acknowledgments

We thank Yousei Sakaigawa and Kaoru Onodera of Hitachi Power Solutions Co. Ltd. for performing the SAT analysis.

Conflicts of Interest

The authors declare no conflict of interest.

References

  1. Goede, M.; Stehlin, M.; Rafflenbeul, L.; Kopp, G.; Beeh, E. Super light car—Lightweight construction thanks to a multi-material design and function integration. Eur. Trans. Res. Rev. 2009, 1, 5–10. [Google Scholar] [CrossRef] [Green Version]
  2. Amancio-Filho, S.T.; do Santos, J.F. Joining of polymers and polymer-metal hybrid structures: Recent developments and trend. Polym. Eng. Sci. 2009, 49, 1461–1476. [Google Scholar] [CrossRef]
  3. Wang, H.; Kawamoto, Y.; Nishimoto, K. A laser system for titanium and polyethylene terephthalate plastic controlled by multiple signal sources. IEEE T. Ind. Electron. 2019, 66, 1255–1263. [Google Scholar] [CrossRef]
  4. Liu, F.C.; Liao, J.; Nakata, K. Joining of metal to plastic using friction lap welding. Mater. Des. 2014, 54, 236–244. [Google Scholar] [CrossRef]
  5. Seto, M.; Asami, Y.; Itakura, M.; Tanaka, H.; Yamabe, M. Influence of molding conditions on joining strength of injection molded parts joined with metal and resin, Yamabe. J. Jpn. Soc. Polym. Process 2015, 27, 68–74. (In Japanese) [Google Scholar] [CrossRef] [Green Version]
  6. Taki, K.; Nakamura, S.; Takayama, T.; Nemoto, A.; Ito, H. Direct joining of a laser-ablated metal surface and polymers by precise injection molding. Microsyst. Technol. 2016, 22, 31–38. [Google Scholar] [CrossRef]
  7. Fabrin, P.A.; Hoikkanen, M.E.; Vuorinen, J.E. Adhesion of thermoplastic elastomer on surface treated aluminum by injection molding. Polym. Eng. Sci. 2007, 47, 1187–1191. [Google Scholar] [CrossRef]
  8. Nielsen, J.B.; Boll, J.V.; Holm, A.H.; Hojsholt, R.; Balling, P. Ultra-high-strength micro-mechanical interlocking by injection molding into laser-structured surfaces. Int. J. Adhes. Adhes. 2010, 30, 485–488. [Google Scholar] [CrossRef]
  9. Roesner, A.; Scheik, S.; Olowinsky, A.; Gillner, A.; Reisgen, U.; Schleser, M. Laser assisted joining of plastic metal hybrids. Phys. Procedia 2011, 12, 370–377. [Google Scholar] [CrossRef]
  10. Amend, P.; Pfindel, S.; Schmidt, M. Thermal joining of thermoplastic metal hybrids by means of mono- and polychromatic radiation. Phys. Procedia 2013, 41, 98–105. [Google Scholar] [CrossRef] [Green Version]
  11. Kurakake, Y.; Farazila, Y.; Miyashita, Y.; Otsuka, Y.; Mutoh, Y. Effect of molten pool shape on tensile shear strength of dissimilar materials laser spot joint between plastic and metal. JLMN-J. Laser Micro/Nanoeng. 2013, 8, 161–164. [Google Scholar] [CrossRef]
  12. Kim, W.S.; Yun, I.H.; Lee, J.J.; Jung, H.T. Evaluation of mechanical interlock effect on adhesion strength of polymer-metal interfaces using micro-patterned surface topography. Int. J. Adhes. Adhes. 2010, 30, 408–417. [Google Scholar] [CrossRef]
  13. Kimura, F.; Kadoya, S.; Kajihara, Y. Effects of molding conditions on injection molded direct joining using a metal with nano-structured surface. Precis. Eng. 2016, 45, 203–208. [Google Scholar] [CrossRef]
  14. Ramani, K.; Moriarty, B. Thermoplastic bonding to metals via injection molding for macro-composite manufacture. Polym. Eng. Sci. 1998, 35, 870–877. [Google Scholar] [CrossRef]
  15. Harris, A.F.; Beevers, A. The effects of grid-blasting on surface properties for adhesion. Int. J. Adhes. Adhes. 1999, 19, 445–452. [Google Scholar] [CrossRef]
  16. Lucchetta, G.; Marinello, F.; Bariani, P.F. Aluminum sheet surface roughness correlation with adhesion in polymer metal hybrid overmolding. CIRP Ann. Manuf. Technol. 2011, 60, 559–562. [Google Scholar] [CrossRef]
  17. Arai, S.; Sugawara, R.; Shimizu, M.; Inoue, J.; Horita, M.; Nagaoka, T.; Itabashi, M. Excellent bonding strength between steel and thermoplastic resin using roughed electrodeposited Ni/CNT composite layer without adhesives. Mater. Lett. 2020, 263, 127241. [Google Scholar] [CrossRef]
  18. Arai, S.; Sugawara, R.; Shimizu, M.; Inoue, J.; Horita, M.; Nagaoka, T.; Itabashi, M. Superior durability of dissimilar material joint between steel and thermoplastic resin with roughened electrodeposited nickel interlayer. Adv. Eng. Mater. 2020, 22, 2000739. [Google Scholar] [CrossRef]
  19. Arai, S.; Kitamura, T. Simple method for fabrication of three-dimensional (3D) copper nanostructured architecture by electrodeposition. ECS Electrochem. Lett. 2014, 3, D7–D9. [Google Scholar] [CrossRef] [Green Version]
  20. Arai, S.; Mendsaikhan, M.; Nishimura, K. Fabrication of a uniformly tin-coated three-dimensional copper nanostructured architecture by electrodeposition. J. Electrochem. Soc. 2016, 163, D54–D56. [Google Scholar] [CrossRef] [Green Version]
  21. Shimizu, M.; Mendsaikhan, M.; Arai, S. Li-insertion/extraction properties of three-dimensional Sn electrode prepared by facile electrodeposition method. J. Appl. Electrochem. 2017, 47, 727–734. [Google Scholar] [CrossRef] [Green Version]
  22. Shimizu, M.; Yatsuzuka, R.; Horita, M.; Yamamoto, T.; Arai, S. Design of Roughened current collector by bottom-up approach using the electroplating technique: Charge-discharge performance of a Sn negative-electrode for Na-ion batteries. J. Phys. Chem. C 2017, 121, 27285–27294. [Google Scholar] [CrossRef]
  23. ISO 19095-3, Plastics-Evaluation of the Adhesion Interface Performance in Plastic-Metal Assemblies—Part 3: Test Methods; ISO: Geneva, Switzerland, 2015.
  24. Iwasaki, R.; Sato, C.; Yamabe, H. Characterization of the water diffusion on the interphase of the epoxy resin adhesive/metal and the visualization of the water accumulation on the interphase using fluorescence. J. Adhesion Soc. Jpn. 2007, 43, 81–88. (In Japanese) [Google Scholar] [CrossRef] [Green Version]
  25. Munz, D.; Yang, Y.Y. Stress near the edge of bonded dissimilar materials described by two stress intensity factors. Int. J. Fract. 1993, 60, 169–177. [Google Scholar] [CrossRef]
  26. Yang, Y.Y.; Munz, D. Stress singularities in a dissimilar materials joint with edge tractions under mechanical and thermal loadings. Int. J. Solid Struct. 1997, 34, 1199–1216. [Google Scholar] [CrossRef]
  27. Wada, J. Kikai Zairyo, 2nd ed.; Ohmsha Ltd.: Tokyo, Japan, 1991. [Google Scholar]
  28. List of Physical Properties of PPS. Available online: https://www.tosoh.co.jp/product/petrochemicals/polymer/assets/pps_49.pdf (accessed on 1 April 2021).
Figure 1. Dimensions of bonded sample.
Metals 11 00591 g001
Figure 2. Thermal shock test pattern.
Metals 11 00591 g002
Figure 3. SEM images of copper strike: (a) Surface; (b) Cross section.
Metals 11 00591 g003
Figure 4. Surface (left) and cross-sectional (right) SEM images of roughened electrodeposited copper films from plating baths containing different concentrations of PAA: (a,b) 0 M; (c,d) 5 × 10⁻⁵ M; (e,f) 3 × 10⁻⁴ M; (g,h) 5 × 10⁻⁴ M.
Metals 11 00591 g004
Figure 5. Measurement results for shear strength.
Metals 11 00591 g005
Figure 6. Cross-sectional SEM images of different bonded samples before the shear strength test: (a) Sample B; (b) Sample C; (c) Sample D.
Metals 11 00591 g006
Figure 7. Cross-sectional scanning transmission electron microscopy (STEM) images of sample D: (a) Sample before shear strength test; (b) Enlargement of panel (a).
Metals 11 00591 g007
Figure 8. Variation in shear strength during high-temperature and high-humidity test.
Metals 11 00591 g008
Figure 9. Cross-sectional SEM images of boundary between SPCC substrate and PPS substrate: (a) Before the high-temperature and high-humidity test (2000 h); (b) After the test.
Metals 11 00591 g009
Figure 10. Variation in shear strength during heat shock test.
Metals 11 00591 g010
Figure 11. Photographs of fracture surfaces of bonded samples: (a) Before heat shock testing (1000 cycles); (b) After heat shock testing.
Metals 11 00591 g011
Figure 12. Scanning acoustic tomography (SAT) images of non-shear-tested bonding samples: (a) Before thermal shock testing (1000 cycles); (b) After thermal shock testing.
Metals 11 00591 g012
Figure 13. Cross-sectional SEM images of the boundaries of non-shear-tested bonded sample D after the thermal shock test: (a) SAT image of bonded sample D after thermal shock testing; points A and B are cross-sectional analysis points. (b,c) Cross-sectional SEM images at points A and B, respectively.
Metals 11 00591 g013
Publisher’s Note: MDPI stays neutral with regard to jurisdictional claims in published maps and institutional affiliations.