Article

Experimental Apparent Stern–Geary Coefficients for AZ31B Mg Alloy in Physiological Body Fluids for Accurate Corrosion Rate Determination

by
Federico R. García-Galvan
1,2,
Santiago Fajardo
1,
Violeta Barranco
1 and
Sebastián Feliu, Jr.
1,*
1
Electrochemistry and Corrosion Research Group (ECORR), Department of Surface Engineering, Corrosion and Durability, National Centre for Metallurgical Research (CENIM-CSIC), Avda. Gregorio del Amo 8, 28040 Madrid, Spain
2
School of Architecture, Engineering and Design, Department of Industrial and Aerospace Engineering, Universidad Europea de Madrid, 28670 Villaviciosa De Odón, Spain
*
Author to whom correspondence should be addressed.
Metals 2021, 11(3), 391; https://doi.org/10.3390/met11030391
Submission received: 5 February 2021 / Revised: 20 February 2021 / Accepted: 22 February 2021 / Published: 27 February 2021
(This article belongs to the Special Issue Corrosion Behavior of Magnesium Alloys)

Abstract

:
The corrosion behavior of AZ31B Mg alloy exposed to Ringer’s, phosphate-buffered saline (PBS), Hank’s, and simulated body fluid (SBF) solutions for 4 days was investigated using electrochemical impedance spectroscopy (EIS), potentiodynamic polarization, weight loss, and surface characterization. Changes in corrosion rates with immersion time determined by weight loss measurements were compared with EIS data to determine the possibility of obtaining quantitative electrochemical information. In addition, changes in the protective properties of the corrosion product layer calculated from the EIS parameters were evaluated as a function of their surface chemical composition as determined by X-ray photoelectron spectroscopy (XPS) and visual observations of the corroded specimen’s surface. Apparent Stern–Geary coefficients for the AZ31B Mg alloy in each test solution were calculated using the relationship between icorr from weight loss measurements and the EIS data (both Rp and Rt). This provided experimental reference B′ values that may be used as a useful tool in independent investigations to improve the accuracy of corrosion rates of AZ31B Mg alloy in simulated body solutions.

1. Introduction

Magnesium (Mg) alloys are promising bioabsorbable materials for biomedical applications such as coronary vascular stent or orthopaedic implants due their mechanical properties close to those of human bone, excellent biocompatibility, and spontaneous degradation behaviors in the human body, which eliminates the need for a second surgical intervention to remove the implant [1,2,3]. Among the AZ series (Mg–Al–Zn alloys), the AZ31 Mg alloy, with a low Al content, is considered to be most suitable for bioimplants due to its appropriate mechanical properties and high activity to enhance cell proliferation [4,5]. Furthermore, even though current investigations focus on the possible relationship between Al concentration in the human body and the manifestation of neurological cell damage, the AZ31 Mg remains as a subject of intense research due to the low concentration of Al in the alloy. Despite such advantages, Mg is a highly active metal, and its corrosion resistance is one of the key factors limiting or even preventing its application in the biomedical field. Briefly, the degradation of the Mg-based implant due to high corrosion rates can result in the loss of mechanical stability of the medical device before the healing process has finished [1]. For this reason, accurate determination of the Mg corrosion rate is critical in monitoring the degradation of Mg-based implants in the biological environment [1,6], as this facilitates the estimates of implant life in service. Furthermore, it also sets the criteria for selecting candidate biodegradable magnesium alloys for testing in the human body [7,8], and for comparative assessments of their corrosion resistance.
Numerous Mg alloys do not exhibit constant corrosion rates in physiological media, for example, due to the precipitation of calcium phosphates on the metal surface [9]. Therefore, it is desirable to measure the corrosion rate over long periods of testing [10,11]. In this regard, electrochemical impedance spectroscopy (EIS) is ideal for the measurement of corrosion rates changes in Mg alloys obtained from long term in vitro corrosion tests [1,12] due to the nondestructive nature of the technique and its high precision, reliability, and reproducibility. Currently, there are very few studies that report corrosion rate values measured by EIS for Mg alloys in simulated body fluid (SBF) solutions [12,13,14,15,16]. In these studies, the Stern–Geary equation was used for the quantitative estimation of the corrosion current density (icorr) [13,14,15]:
i corr = 1 2.3 R p ( β a | β c | β a + | β c | ) = B R p .
where Rp is the polarization resistance determined by EIS, and B is a proportionality constant that depends on the anodic and cathodic Tafel slopes (βa and βc) obtained from the polarization curves. Commonly, B is assumed to be 26 mV/dec for many actively corroding systems, and this value has been used directly to estimate icorr from EIS tests for WE43 Mg alloy in a blood bank buffered saline (BBS) solution [13]. However, the exact values of B for Mg and its alloys immersed in simulated body solutions often differ. For AZ31 Mg alloys, Wang et al. [2] determined B values from polarization data of ~109 mV/dec in phosphate-buffered saline (PBS) solution, of ~35 mV/dec in Hank’s balanced salt solution (HBSS), and of ~63 mV/dec in SBF solution. Han et al. [15] reported values for the AZ31 of ~40 mV/dec alloy in PBS solution, and of ~43 mV/dec in SBF solution. In summary, there is a discrepancy among the values of the B constant in the literature for the AZ31 Mg alloy in different simulated body solutions. It is evident from Equation (1) that besides Rp, the corrosion current density is dependent on the value of B. Therefore, accurate determination of the Tafel slopes from the potentiodynamic polarization curves is critical.
The shape of the anodic polarization curves is influenced by several factors that often lead to nonlinear regions on semilogarithmic plots. One of the main causes for this behavior is the copious amount of hydrogen (H2) that is evolved from the Mg surface during polarization. Hydrogen evolution (HE) is the primary cathodic reaction that occurs on cathodically polarized AZ Mg alloys due to the very low corrosion potential (Ecorr) exhibited by these materials, far below the reversible potential for HE (Erev,H). Furthermore, under anodic polarization, Mg alloys also show an intense evolution of H2, with increasing rates of HE as the applied potential takes more positive values from the Ecorr. This phenomenon, referred to as anomalous HE, contradicts standard electrochemical kinetics, which predict decreasing rates of a cathodic reaction with increasing anodic polarization. The intense production of H2 gas resulting from the increased rates of HE during anodic and cathodic polarization causes large ohmic potential drops that distort the shape of the linear regions expected for an activation-controlled electrochemical reaction [17], in turn complicating an accurate determination of the anodic and cathodic Tafel slopes. Uncertainty in the values of βa determined from the polarization curves may cause large errors in the estimated values of corrosion rate [18]. Curioni et al. [19] commented that the attempt to estimate the anodic Tafel slope proved unsuccessful. Notably, while potentiodynamic polarization provides instantaneous corrosion rates [6], corrosion mechanisms and Tafel slopes can change significantly with exposure time until steady state corrosion is reached, which affects the global corrosion rate [20].
When the typical Tafel behavior is not observed in polarization curves, an alternative approach is to determine the B value empirically from the correlation between electrochemical and gravimetric and/or HE measurements [12,16,21,22,23,24]. The apparent Stern–Geary coefficient (B′) is a purely experimental parameter that varies for different alloys, test solutions, immersion time and other factors influencing corrosion kinetics [24]. Even though it is difficult to find in the literature values of B′ for Mg alloys exposed to simulated body solutions, Liu et al. [12] recently reported that B′ = 85 mV for the Mg-1Ca alloy.
In Vitro corrosion studies and/or electrochemical tests have been predominantly carried out in four typical simulated body fluids namely Ringer’s, PBS, Hank’s, and SBF solutions [25]. Ringer’s is an aqueous solution of NaCl that also contains CaCl2 [26]. PBS contains disodium hydrogen phosphate as the buffering species to maintain the physiological pH (~7.4) [2]. SBF contains phosphate, carbonate, sulphate and CaCl2. The composition of Hank’s solution is similar to that of SBF solution, but it contains MgCl2•6H2O and organic glucose. The presence of HPO42− anions in PBS, Hank’s, and SBF solutions may result in the precipitation of phosphate type compounds (e.g., Mg3(PO4)2 or Ca3(PO4)2) changing the protective properties of the corrosion layers formed on the surface of magnesium [9,12]. This is not the case for Ringer´s solution as it does not contain HPO42− anions. Furthermore, the composition, thickness and morphology of these corrosion layers may vary with exposure time, modifying the corrosion mechanisms and making electrochemical measurements challenging [9,12,27]. For instance, Liu et al. [12] commented that the corrosion behavior in the SBF solution during long term exposure is much more complicated than that in solutions containing only chloride ions.
In this paper, new results obtained on the corrosion behavior of a commercially available AZ31B Mg alloy in Ringer’s, Hank’s, PBS, and SBF solutions at 37 °C (average normal human body temperature) during 4 days of immersion are presented. An XPS analysis was carried out to assess the chemical composition of the corrosion product layer formed on the specimen surfaces as a function of the test solution. Finally, the apparent Stern–Geary coefficients for the AZ31B alloy in each test solution were calculated from the relationship between icorr from weight loss measurements and the EIS data (both Rp and Rt). The aim of this study is to provide experimental reference B′ values that may be used in independent investigations to determine corrosion rates of AZ31B Mg alloy in simulated body solutions.

2. Materials and Methods

A rolled AZ31B Mg alloy sheet (Magnesium Elektron Ltd., Manchester, UK) with a thickness of 3 mm was used as the test specimen. Its chemical composition is given in Table 1. Prior to testing, all samples were ground with SiC paper to a 1200 grit finish, rinsed with ethanol (Sigma-Aldrich, St. Louis, MO, USA), cleaned with acetone, and dried in air.
Four different standard simulated body solutions were selected as test electrolytes for gravimetric and electrochemical determinations. Their chemical compositions can be found in Table 2 [2,15,26]. All tests were carried out thermostatically at 37 °C ± 1 °C (average human body temperature), using an incubator.
X-ray photoelectron spectroscopy (XPS) was performed on a Thermo Scientific K-Alpha ESCA instrument (Thermo Fisher Scientific, Waltham, MA, USA) equipped with Al Kα1,2 monochromatized radiation at 1486.6 eV X-ray source. The binding energy scale was referenced to the adventitious C1s peak at 285.0 eV.
Gravimetric measurements of weight loss after different immersion times in each physiological solution were performed on AZ31 samples with a surface area of 10.4 cm2. Following immersion testing, the corrosion products on the surface were removed using a chromic acid solution (200 g/L chromium trioxide (Sigma-Aldrich, St. Louis, MO, USA), 10 g/L silver nitrate (Sigma-Aldrich, St. Louis, MO, USA)), after which weight loss was calculated.
EIS spectra were performed in the different tests solutions at open circuit potential (OCP) and collected using an Autolab PGSTAT30 coupled with a frequency response analyzer (FRA) (Metrohm, Herisau, Switzerland). An AC amplitude of 10 mV peak-to-peak was applied over a frequency range from 100 kHz to 10 mHz with an acquisition rate of 10 points per decade. The exposure area of the sample was 0.78 cm2. EIS measurements were performed at least in triplicate in each test solution to ensure reproducibility. ZView software (3.0a Scribner Associates, Inc., Southern Pines, NC, USA) was used to analyze the impedance spectra [28].
Potentiodynamic polarization measurements were carried out in separate experiments following the same sample preparation using a Gamry Instruments Interface 1000E potentiostat/galvanostat (Gamry Instruments, Philadelphia, PA, USA) controlled by the Gamry Echem Analyst® software (Gamry Instruments, version 7.0.1, Philadelphia, PA, USA). Prior to polarization, the OCP was monitored for 30 min. This was the time needed for observing a constant potential value. Samples were scanned in the anodic direction starting from the cathodic region at 1 mV/s, in the range of −150 to +250 mV with respect to their corresponding OCP. Each scan was performed at least in duplicate to ensure reproducibility of the results.
All electrochemical experiments were carried out using a three-electrode configuration, with the AZ31B Mg alloy as working electrode, a saturated silver/silver chloride (SSC) as reference electrode (Fisher Scientific Accumet, Waltham, MA, USA), and a platinum spiral as counter electrode.

3. Results

3.1. Macrostructural Surface Analysis

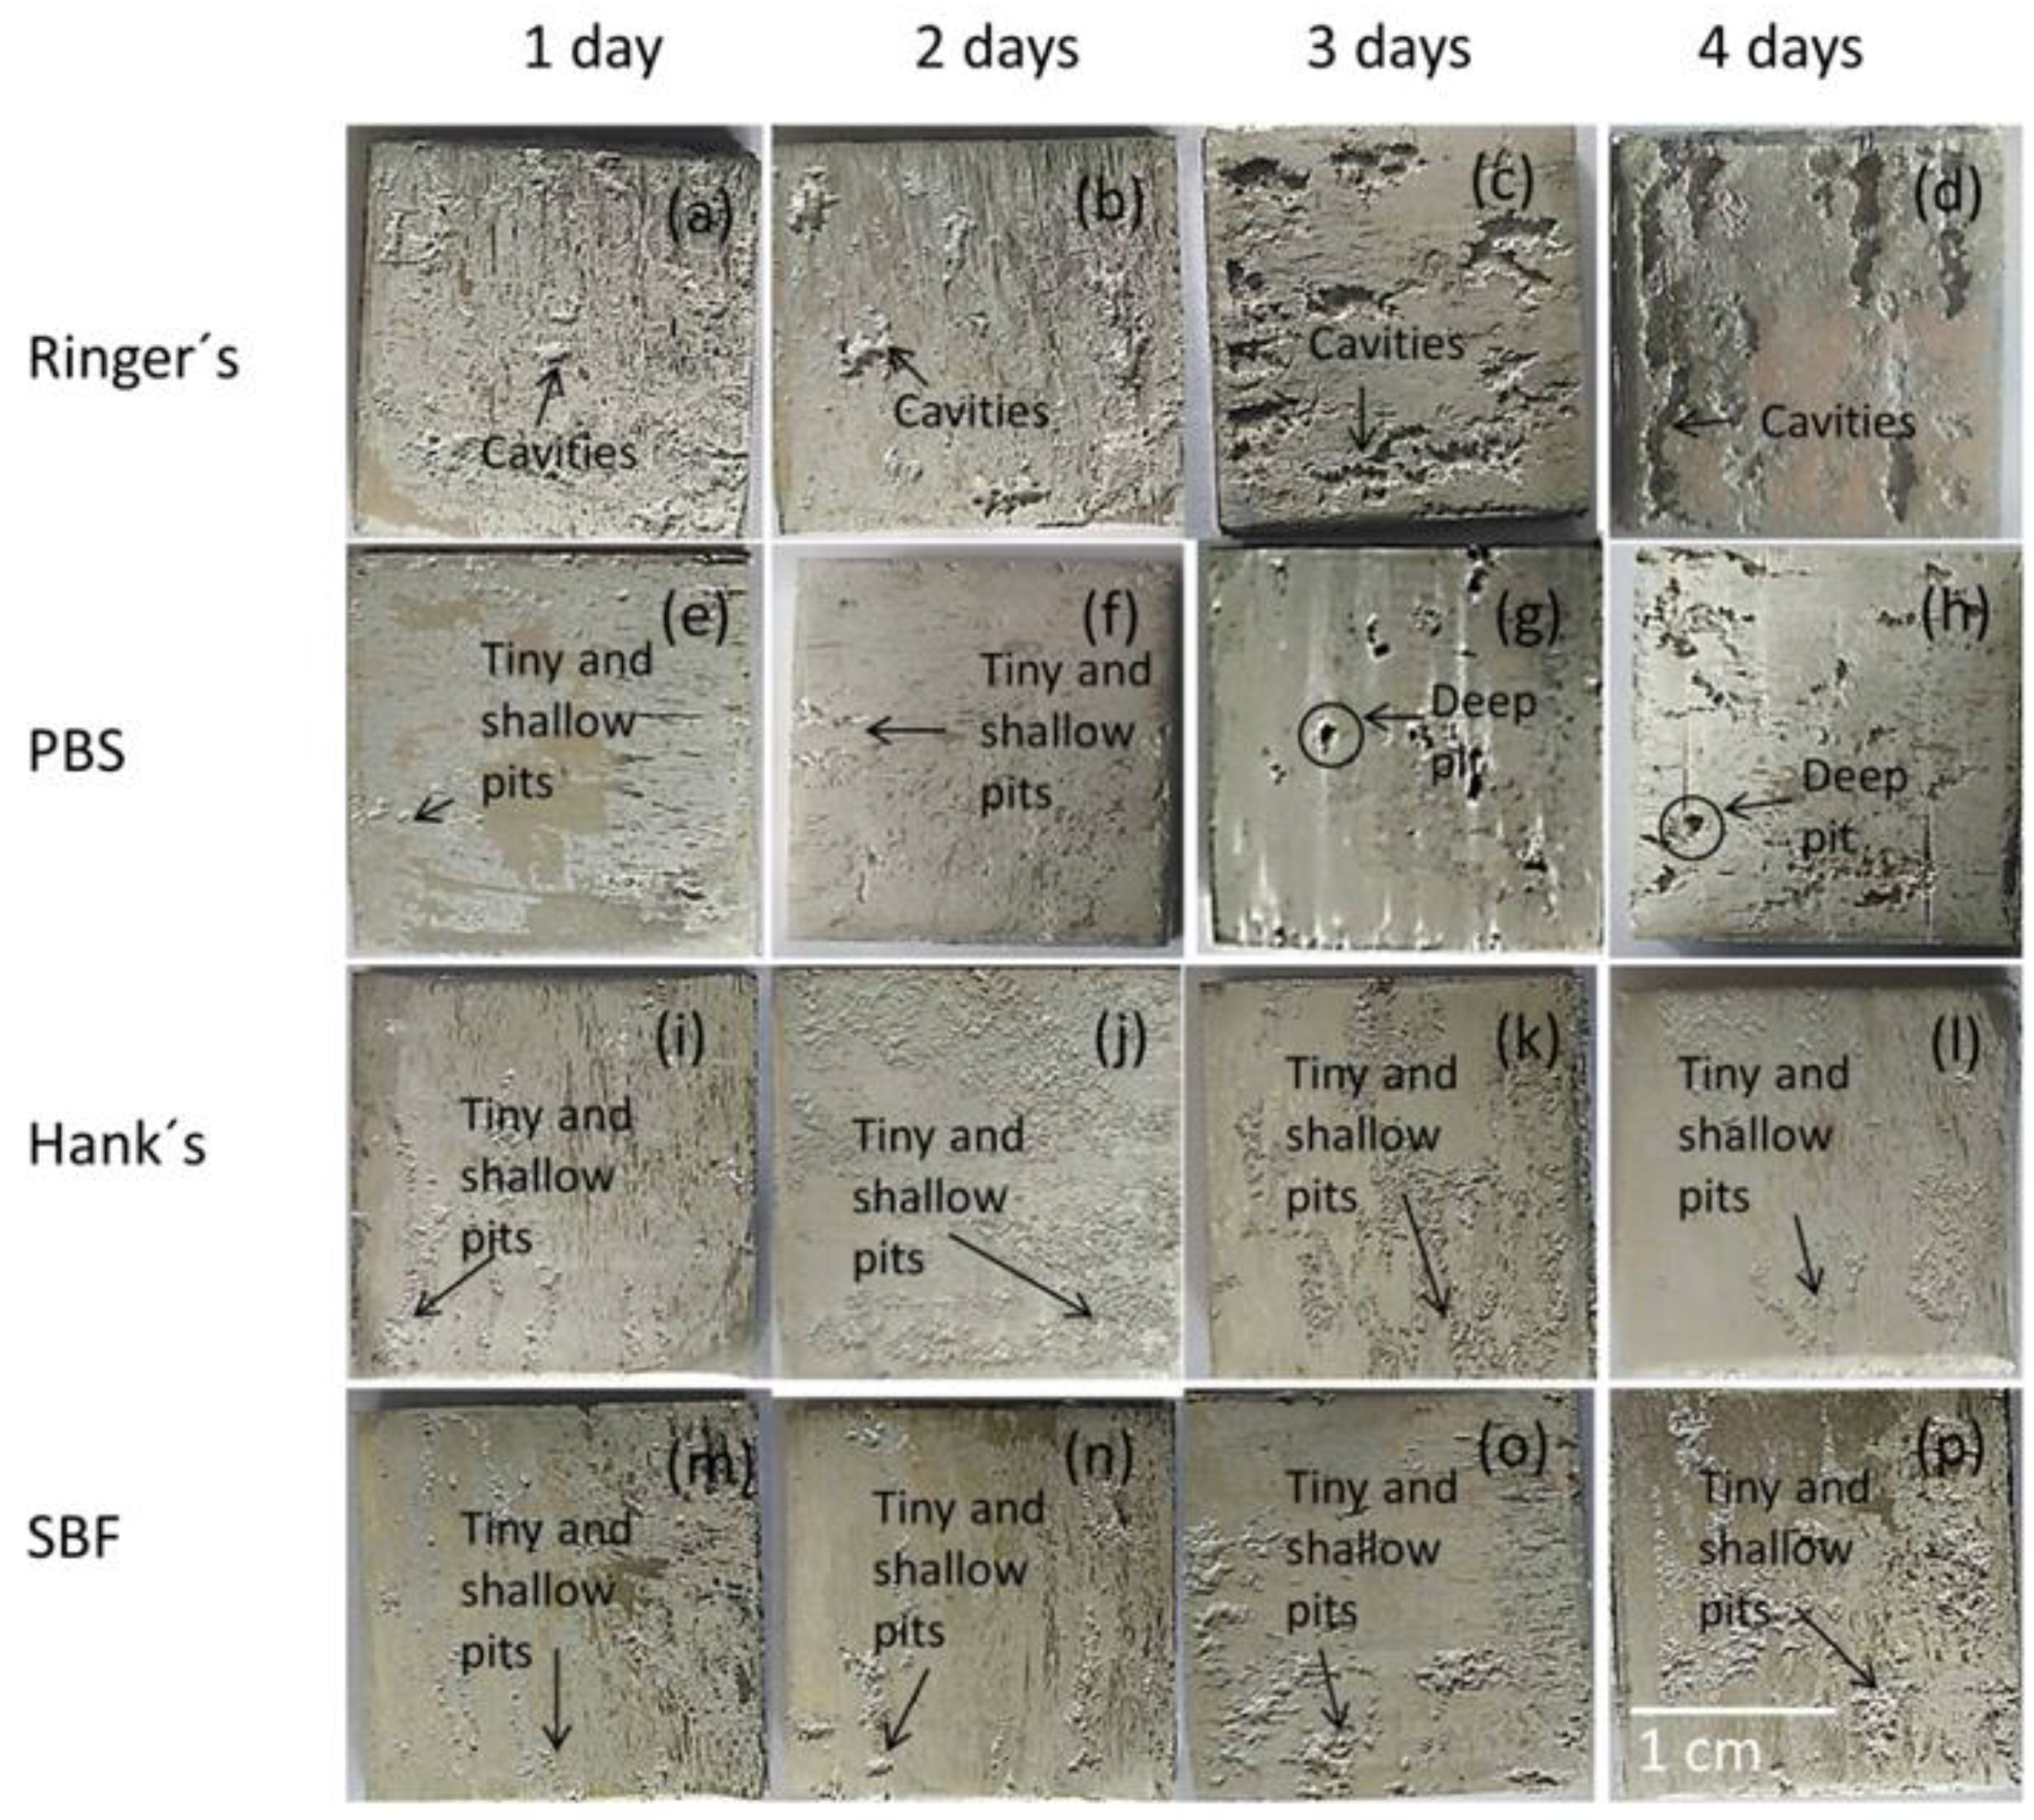
Macrographs of the AZ31B alloy surfaces after different immersion times for the gravimetric test in the Ringer’s, PBS, Hank’s, and SBF solutions are shown in Figure 1. The surface appearance of the AZ31B alloy was strongly affected by the type of solution and time of exposure. For the specimens exposed to Ringer’s solution, cavities were the most prominent feature (Figure 1a–d). The surface fraction of cavities on the AZ31B specimens shown in Figure 1 was estimated using image processing software (ImageJ). Surface analysis performed on randomly selected regions of the specimen immersed in Ringer’s solution showed that the fraction of the surface covered by cavities increased with the time of immersion as follows: 6% (1st day), 10% (2nd day), 16% (3rd day), 21% (4th day).
Immersion of the specimens in PBS solution for 1 day resulted in the formation of a white and thick corrosion product layer, easily detected by visual inspection (Figure 1e–h). In contrast with observations from Ringer’s and PBS solutions, spherical precipitates were homogeneously distributed on the surface of the AZ31B specimens after 1 day of immersion in Hank’s and SBF solutions (Figure 1j–p) [29].
Figure 2 shows the time evolution of the corrosion morphologies on the AZ31B specimens shown in Figure 1 after removal of the corrosion products. As observed in Figure 1, specimens immersed in Ringer’s solution had the most severe corrosion with the presence of large and irregular cavities covering a significant fraction of the surface (Figure 2a–d). The surface of the specimens in PBS presented some relatively large and deep pits after 3 or 4 days of exposure (Figure 2g,h). Localized corrosion in Hank’s solution was not as severe as in Ringer’s or PBS solutions. In this case, despite a greater number of pits being visible, these were small and shallow, and they exhibited a rather uniform pit distribution (Figure 2i–l). A similar behavior was also observed for the specimens exposed to SBF solution (Figure 2m–p).

3.2. Weight Loss Measurements

Figure 3 shows the corrosion rates of the AZ31B Mg alloy in Ringer’s, PBS, Hanks’s and SBF solutions determined from the weight loss measurements. The corrosion rate of the AZ31B specimens was found to be dependent on the test solution. The AZ31B specimens in Hank’s and SBF solutions exhibited similar corrosion rates, while the corrosion rate of the AZ31B alloy in PBS was slightly higher. This is consistent with the presence of some deep pits on the surface after 3 and 4 days of immersion (Figure 2g,h). The corrosion rates of the AZ31B specimens in Ringer’s solution were the highest of all test solutions and increased with the immersion time (from 1.5 to 4 times higher) when compared with those measured in Hank’s or SBF solutions (Figure 3). This is in agreement with the observation in Figure 2a–d, where the specimens exposed to Ringer’s solution presented the greatest corrosion.

3.3. Differences in the Surface Chemistry of the Corrosion Layers Formed on the AZ31B Alloys after Immersion in Ringer’s, PBS, Hank’s, and SBF Solutions

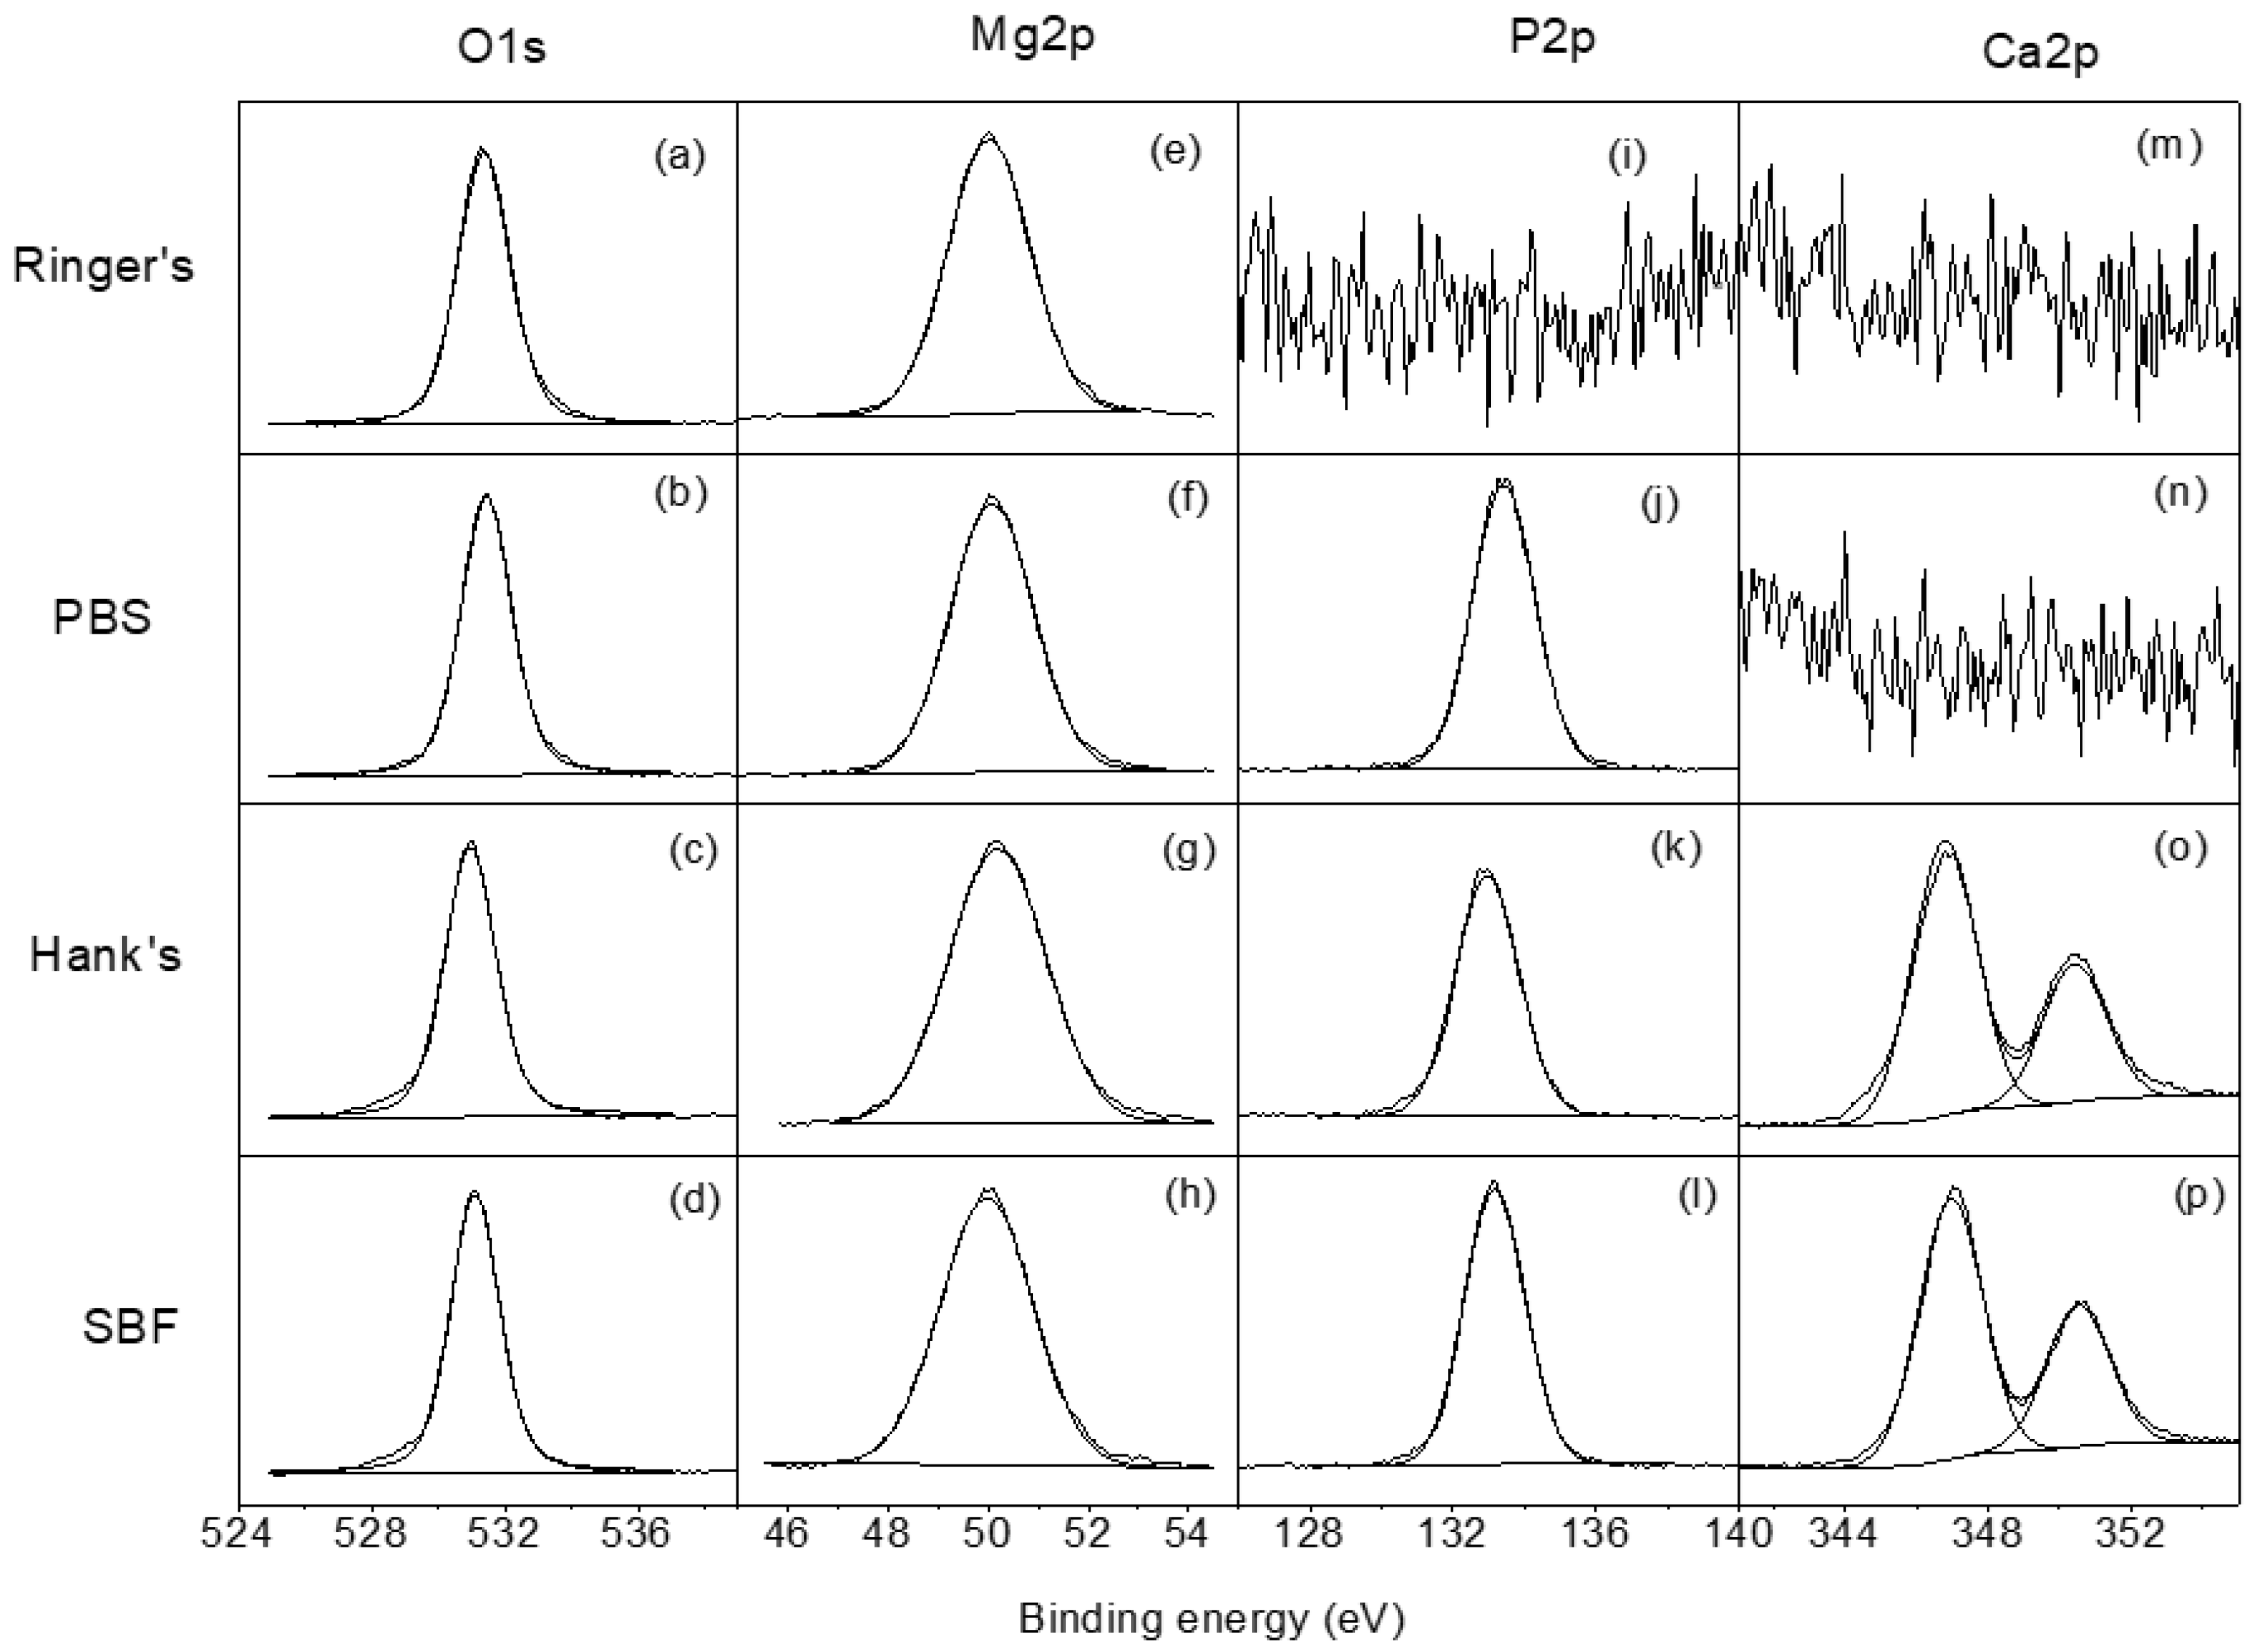
Table 3 shows the elemental composition obtained by XPS on the corroded surfaces of the AZ31B specimens after 4 days of immersion in Ringer’s, PBS, Hank’s, and SBF solutions. On the AZ31B specimen immersed in Ringer’s solution, the XPS analysis showed only Mg and O present at the surface, suggesting the possible accumulation of Mg(OH)2 [30]. For the AZ31B specimens immersed in PBS solution, the atomic ratio Mg/P was 1.3 (see Table 3). This data are consistent with the formation of a corrosion layer composed mainly of magnesium phosphate compounds. With regard to the AZ31B specimens immersed in Hank’s and SBF, there was a significant amount of P and Ca detected on the surface of the corrosion layer compared with the alloy immersed in Ringer’s solution. The Ca/P atomic ratios in the AZ31B specimen exposed to Hank’s and SBF solutions were close to 1.7 (1.6 and 1.5, respectively), suggesting the presence of hydroxyapatite Ca10(PO4)6(OH)2 (HA) or HA-like compounds.
Figure 4 shows the high resolution XPS spectra for O1s, Mg2p, P2p, and Ca2p obtained on the surface of the AZ31B specimens after 4 days of exposure to the four test solutions. The O1s spectra (Figure 4a–d) show one component at 531.0 eV attributed to the presence of phosphate/hydroxides. The high resolution Mg2p spectra (Figure 4e–h) presents one component at 50.0 eV associated with the presence of magnesium hydroxide/phosphate. In the P2p spectra (Figure 4j–l), only one component appears that is associated with the presence of phosphates [30]. Finally, the Ca2p high resolution spectra (Figure 4o,p) may be fitted to one doublet with a binding energy of 347.0 eV, which is associated with the presence of Ca2+ [30,31].

3.4. Electrochemical Tests

3.4.1. Open Circuit Potential Variation and Potentiodynamic Polarization Testing

The OCP evolutions of AZ31B specimens as a function of immersion time in Ringer’s, PBS, Hank’s, and SBF solutions are shown in Table 4. OCP values reached a steady state of approximately −1.5 VSCC after 1 day of immersion and no significant difference was observed between the four test solutions.
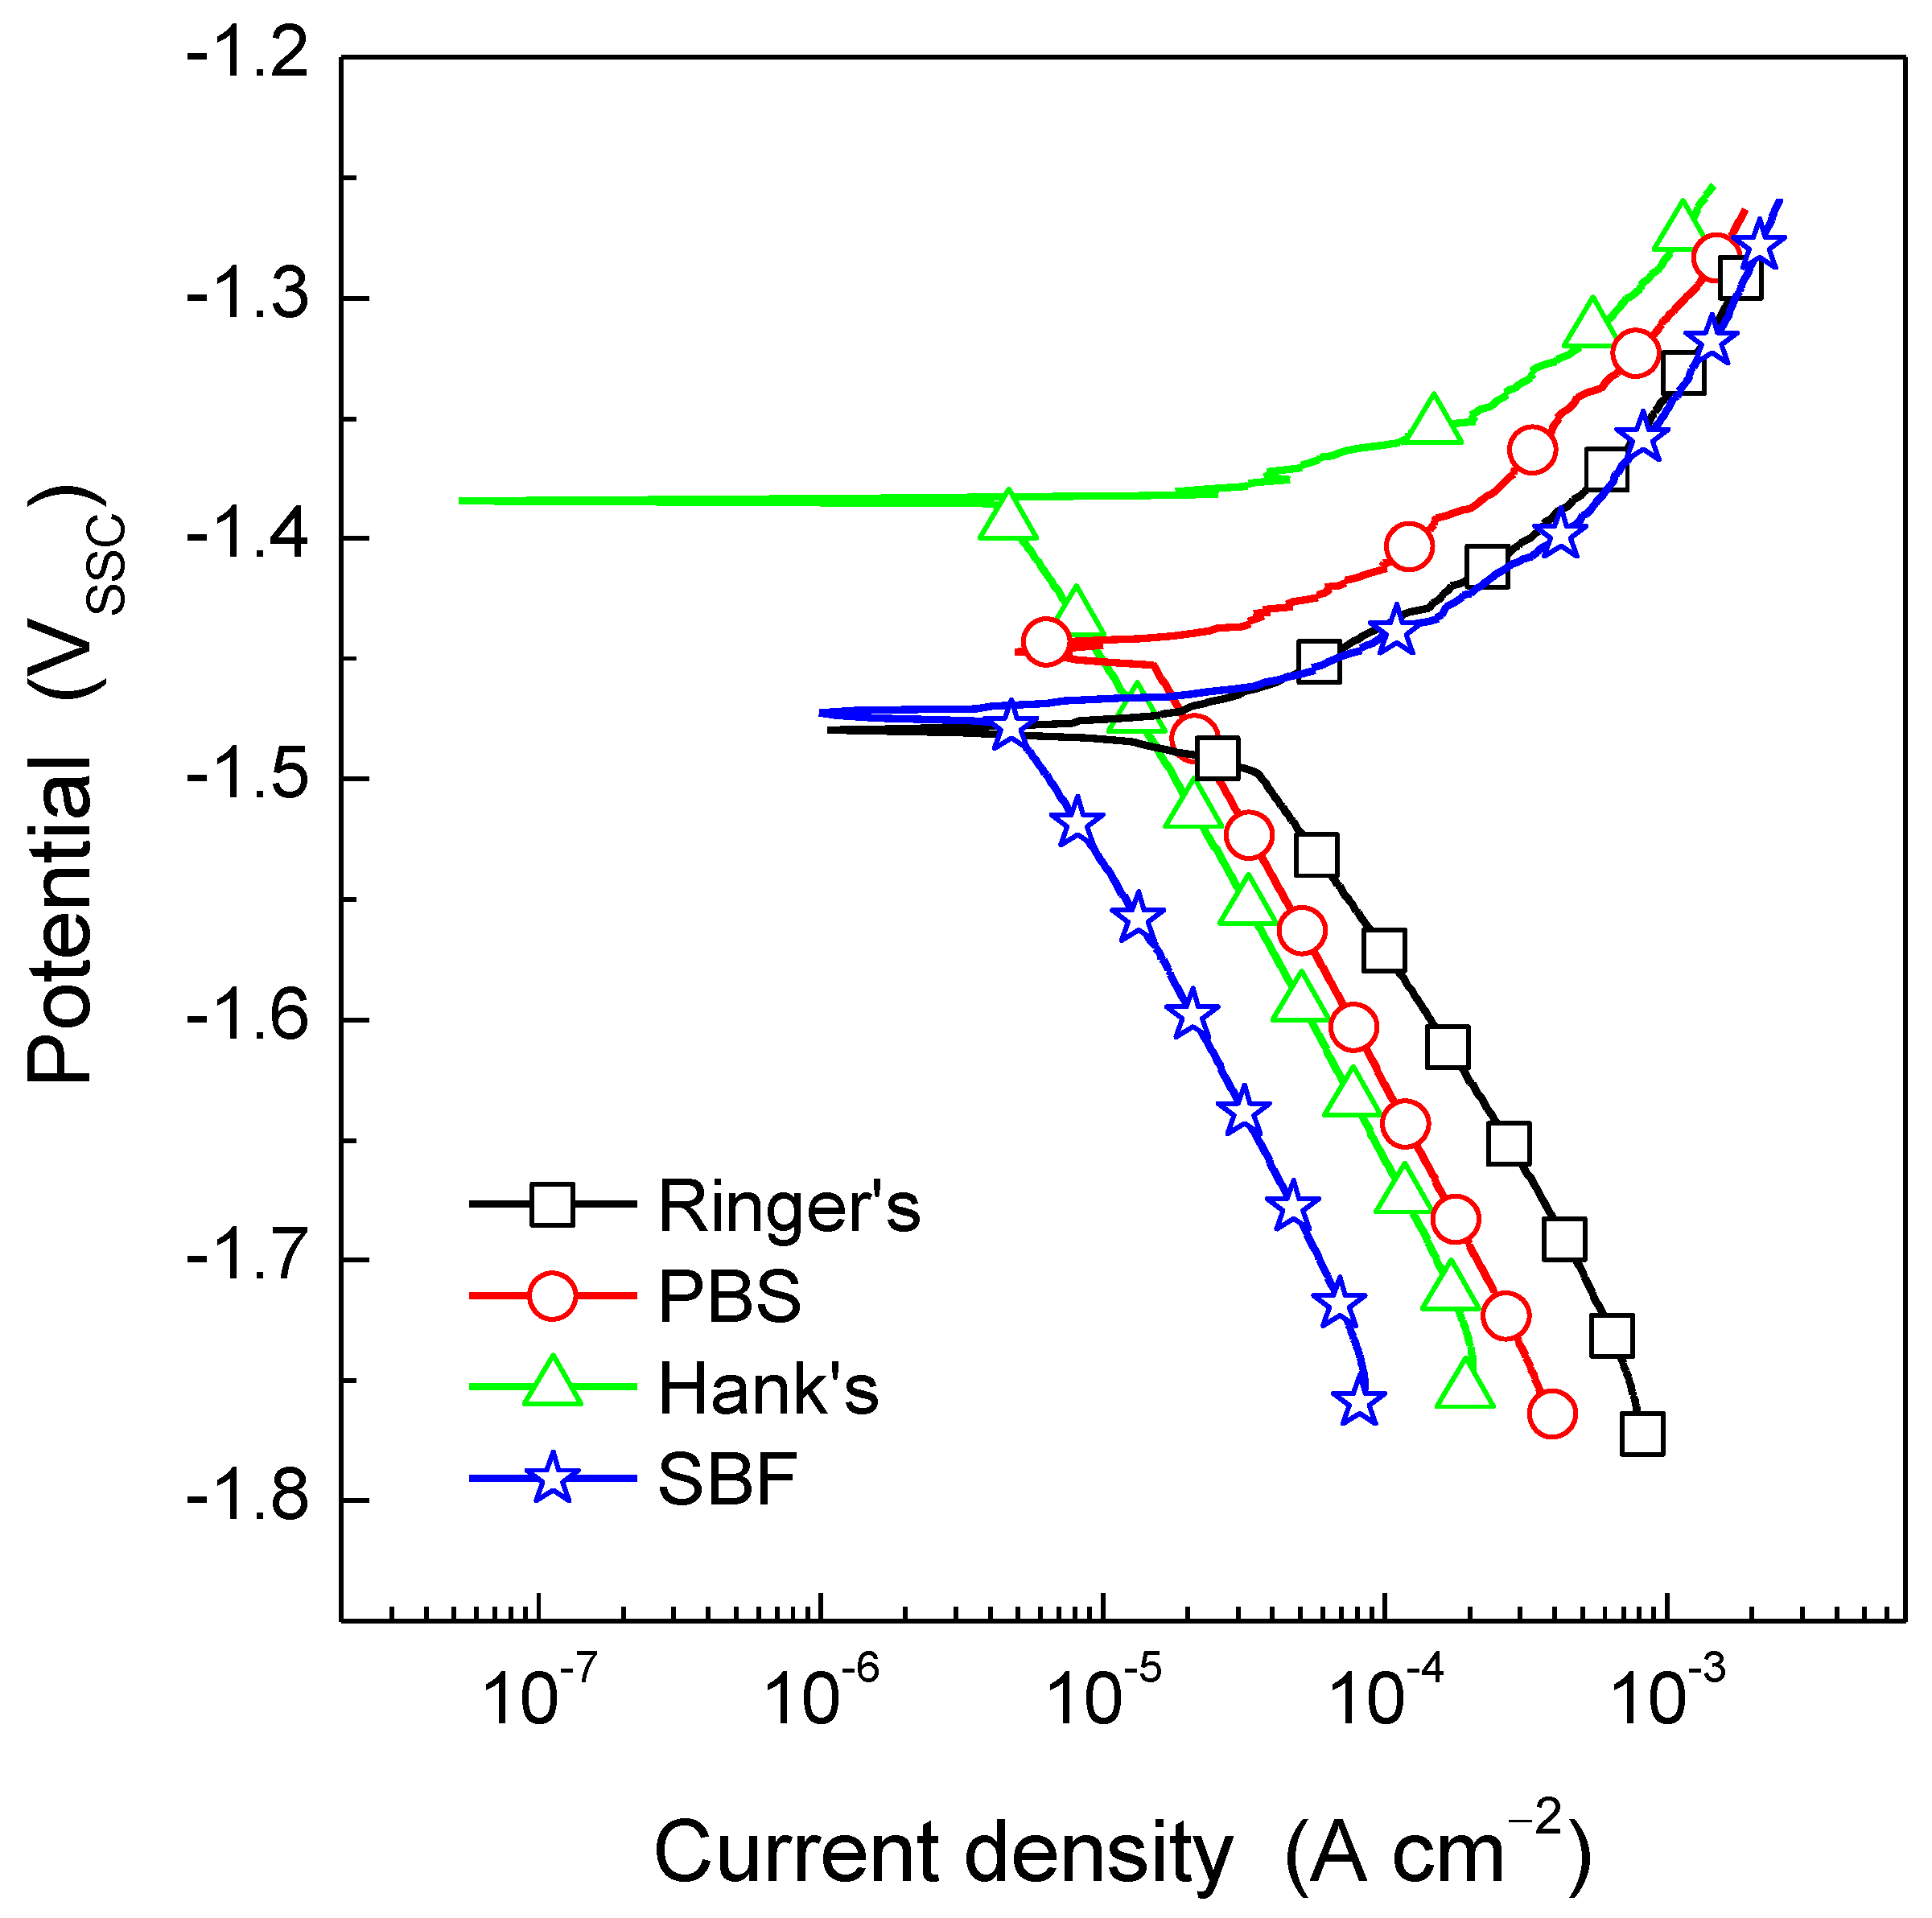
Figure 5 shows the potentiodynamic polarization curves for the AZ31B Mg alloy after 30 min immersion in Ringer’s, PBS, Hank’s, and SBF solutions. Typical results from replicated experiments are presented for simplicity. Differences were observed in both the anodic and the cathodic kinetics as a function of the test solution. It is worth noting that even though the AZ31B exhibited similar Ecorr values and nearly identical anodic current densities in Ringer’s and SBF solutions, the cathodic kinetics in the SBF solution was the lowest of all test solutions, whereas the highest current densities associated with the cathodic reaction were measured using Ringer’s solution. Interestingly, no significant difference was observed in the anodic kinetics when comparing the immersion in Ringer’s and SBF solutions. Furthermore, from the polarization curves in Figure 5, it is clear that during immersion in PBS and Hank’s solutions, the AZ31B Mg alloy exhibited the lowest anodic current density values. This indicates that the presence of phosphate ions hinders metal dissolution during anodic polarization.
As previously commented, determination of icorr by means of Tafel extrapolation is complicated due to the lack of linearity in the anodic branch of the potentiodynamic polarization curve. However, Figure 5 shows that the cathodic current densities exhibited a linear behavior, which is characteristic of an activation-controlled electrochemical reaction. By extrapolation of this linear region to the Ecorr, the icorr associated with the AZ31B Mg alloy in each of the test solutions was determined. Table 5 shows that icorr was the greatest during immersion in Ringer’s solution and decreased in the presence of phosphate ions as follows: PBS > SBF > Hank’s solution. It should be reminded that while the PBS solution only contains phosphate ions (besides NaCl and KCl) as ionic species capable of promoting the deposition of pseudo protective corrosion products, SBF and Hank’s solutions also contain Ca2+ as well as sulphate and carbonate ions. These species have been reported to provide certain protection to Mg alloys under open circuit conditions [30]. Furthermore, Zeng at al. [32] showed that the presence of glucose (i.e., Hank’s solution) is beneficial for the corrosion resistance of pure Mg because the glucose in Hank’s solution enhances the formation of Ca-P compounds due to the chelation of glucose with Ca2+ ions in solution. This is in perfect agreement with the icorr values in Table 5 where the corrosion rate of the AZ31B Mg alloy in Hank’s solution showed the lowest value.

3.4.2. Electrochemical Impedance Spectroscopy (EIS) Testing

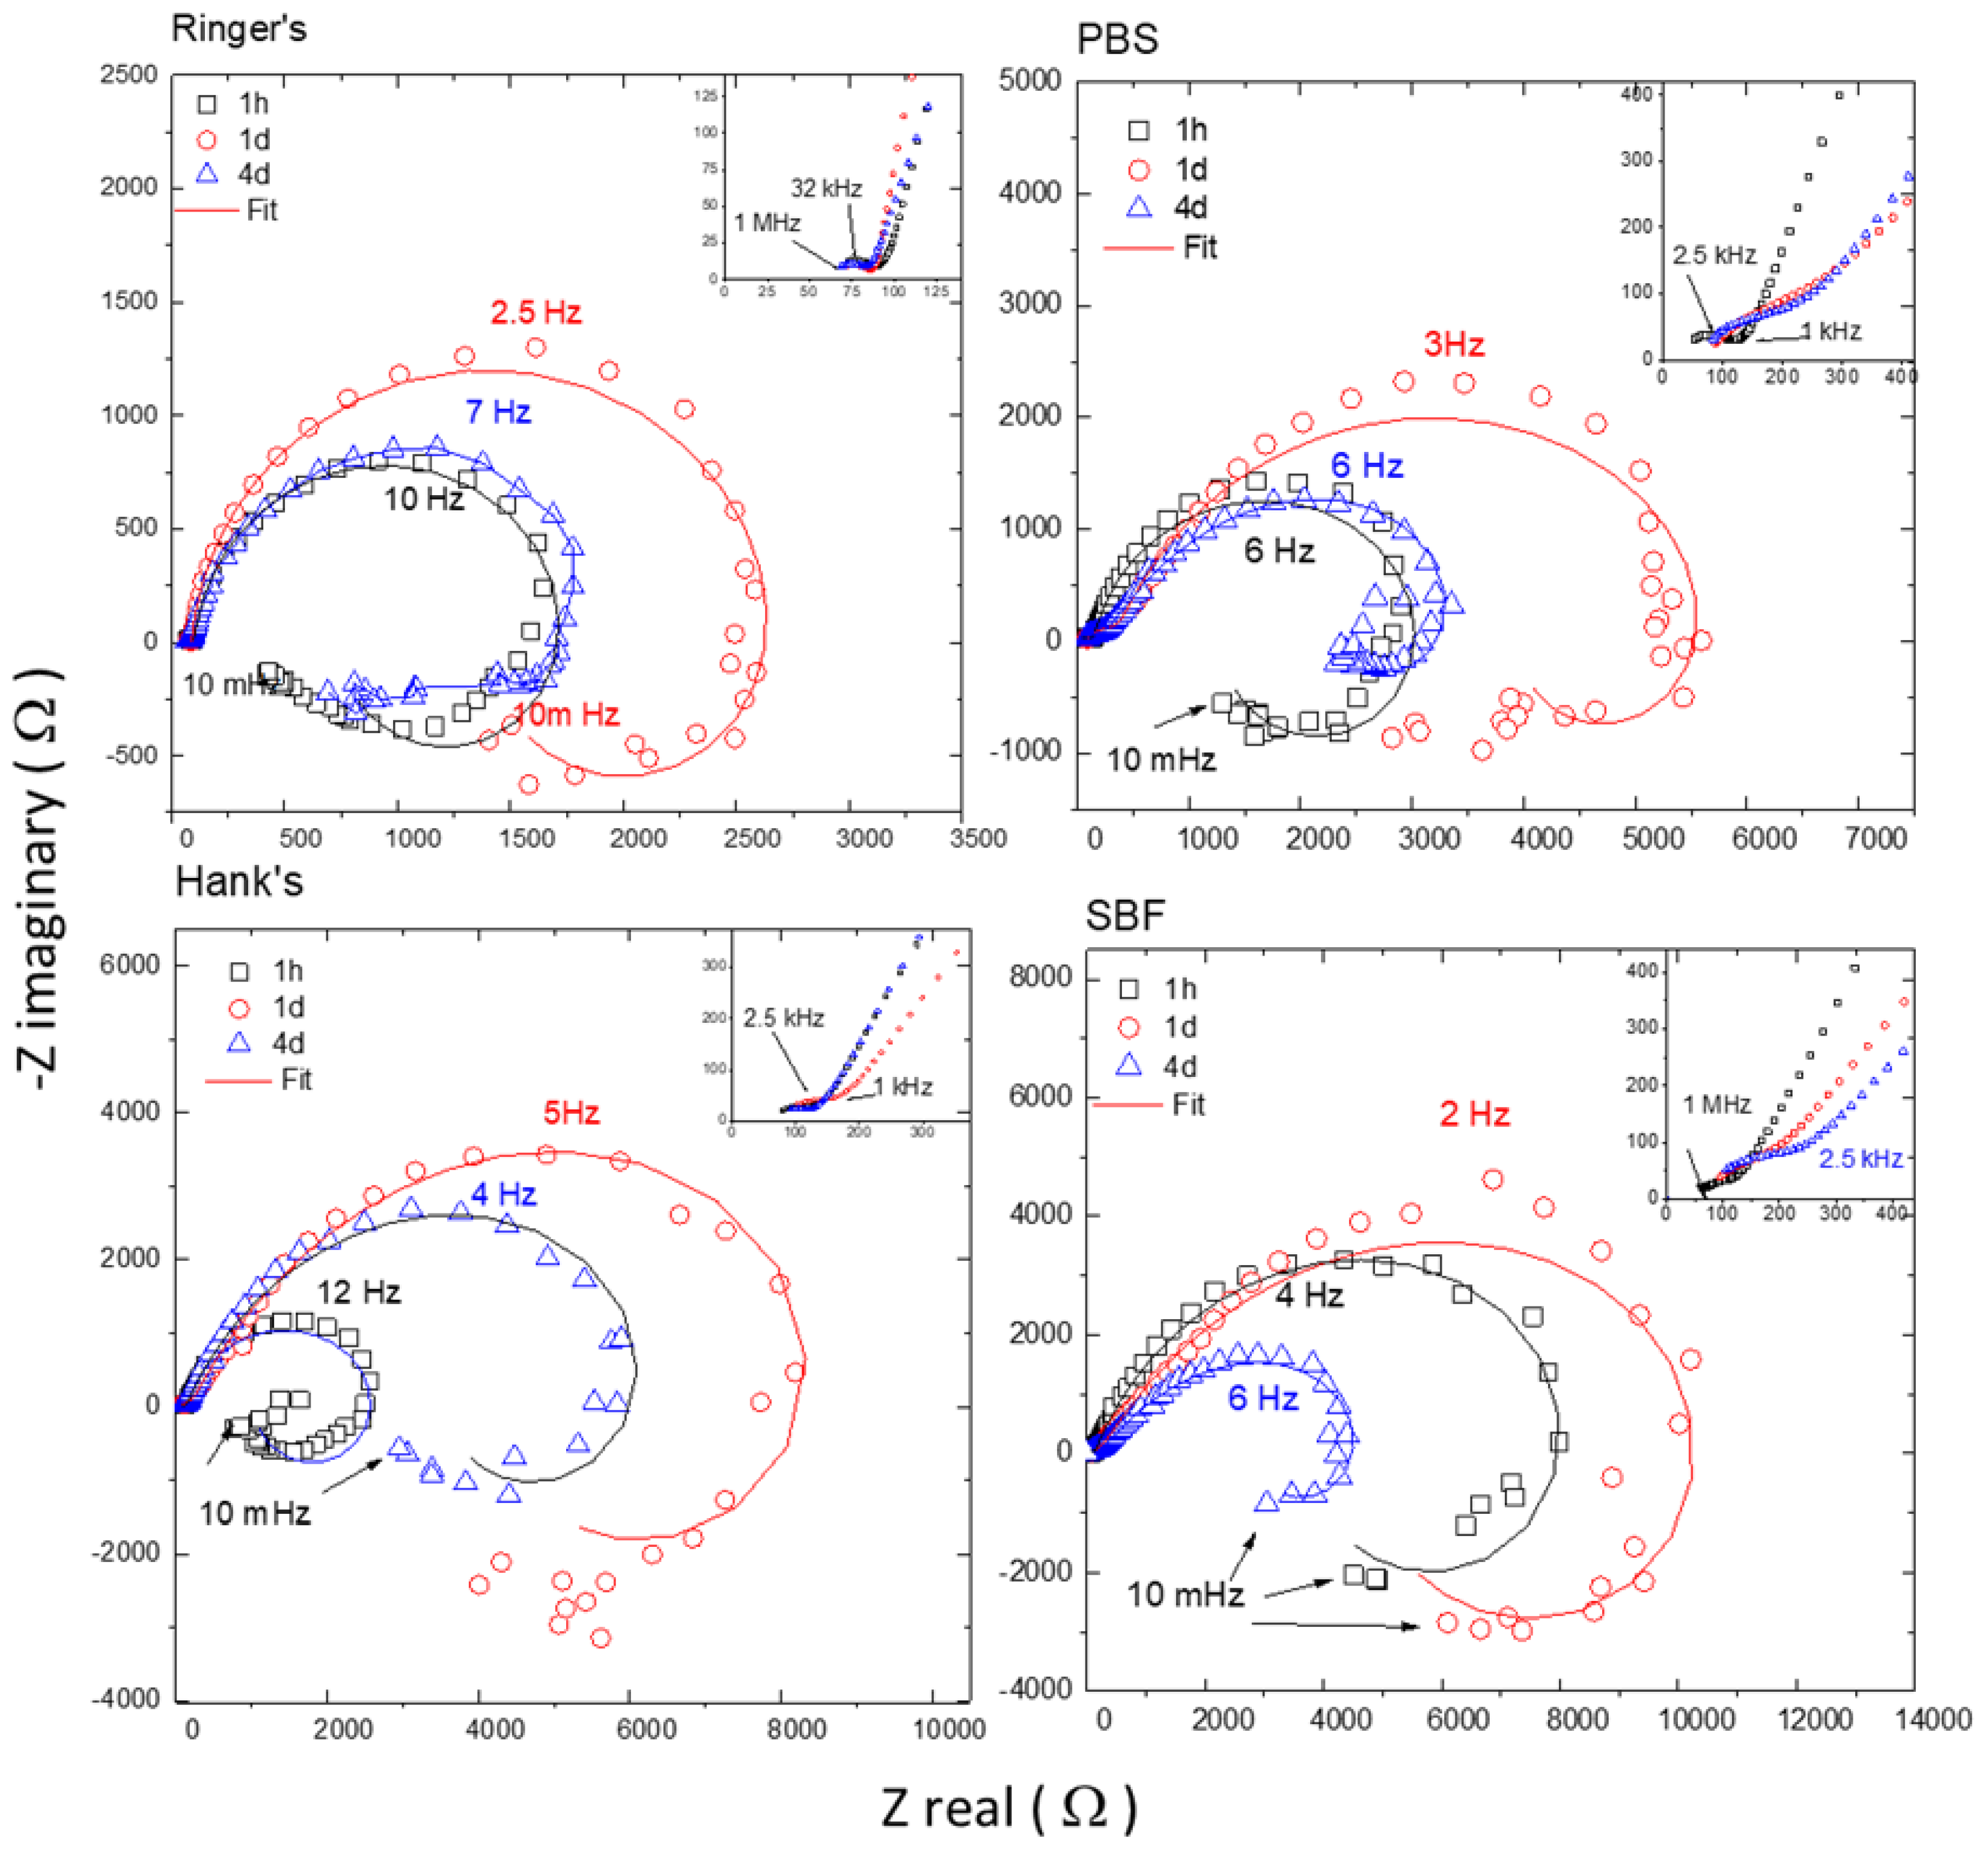
Figure 6 compares the evolution of the Nyquist diagrams obtained for the AZ31B specimens immersed in Ringer’s, PBS, Hank’s, and SBF solutions at 37 °C after different immersion times. For simplicity, only the EIS data at 1 h, 1 d, and 4 d are shown, representing the initial, intermediate, and final immersion times, respectively. All diagrams revealed a high-medium frequency capacitive arc and a low frequency inductive loop. Furthermore, a closer examination at the highest frequency range reveals a small semicircle more or less distorted depending on the solution.
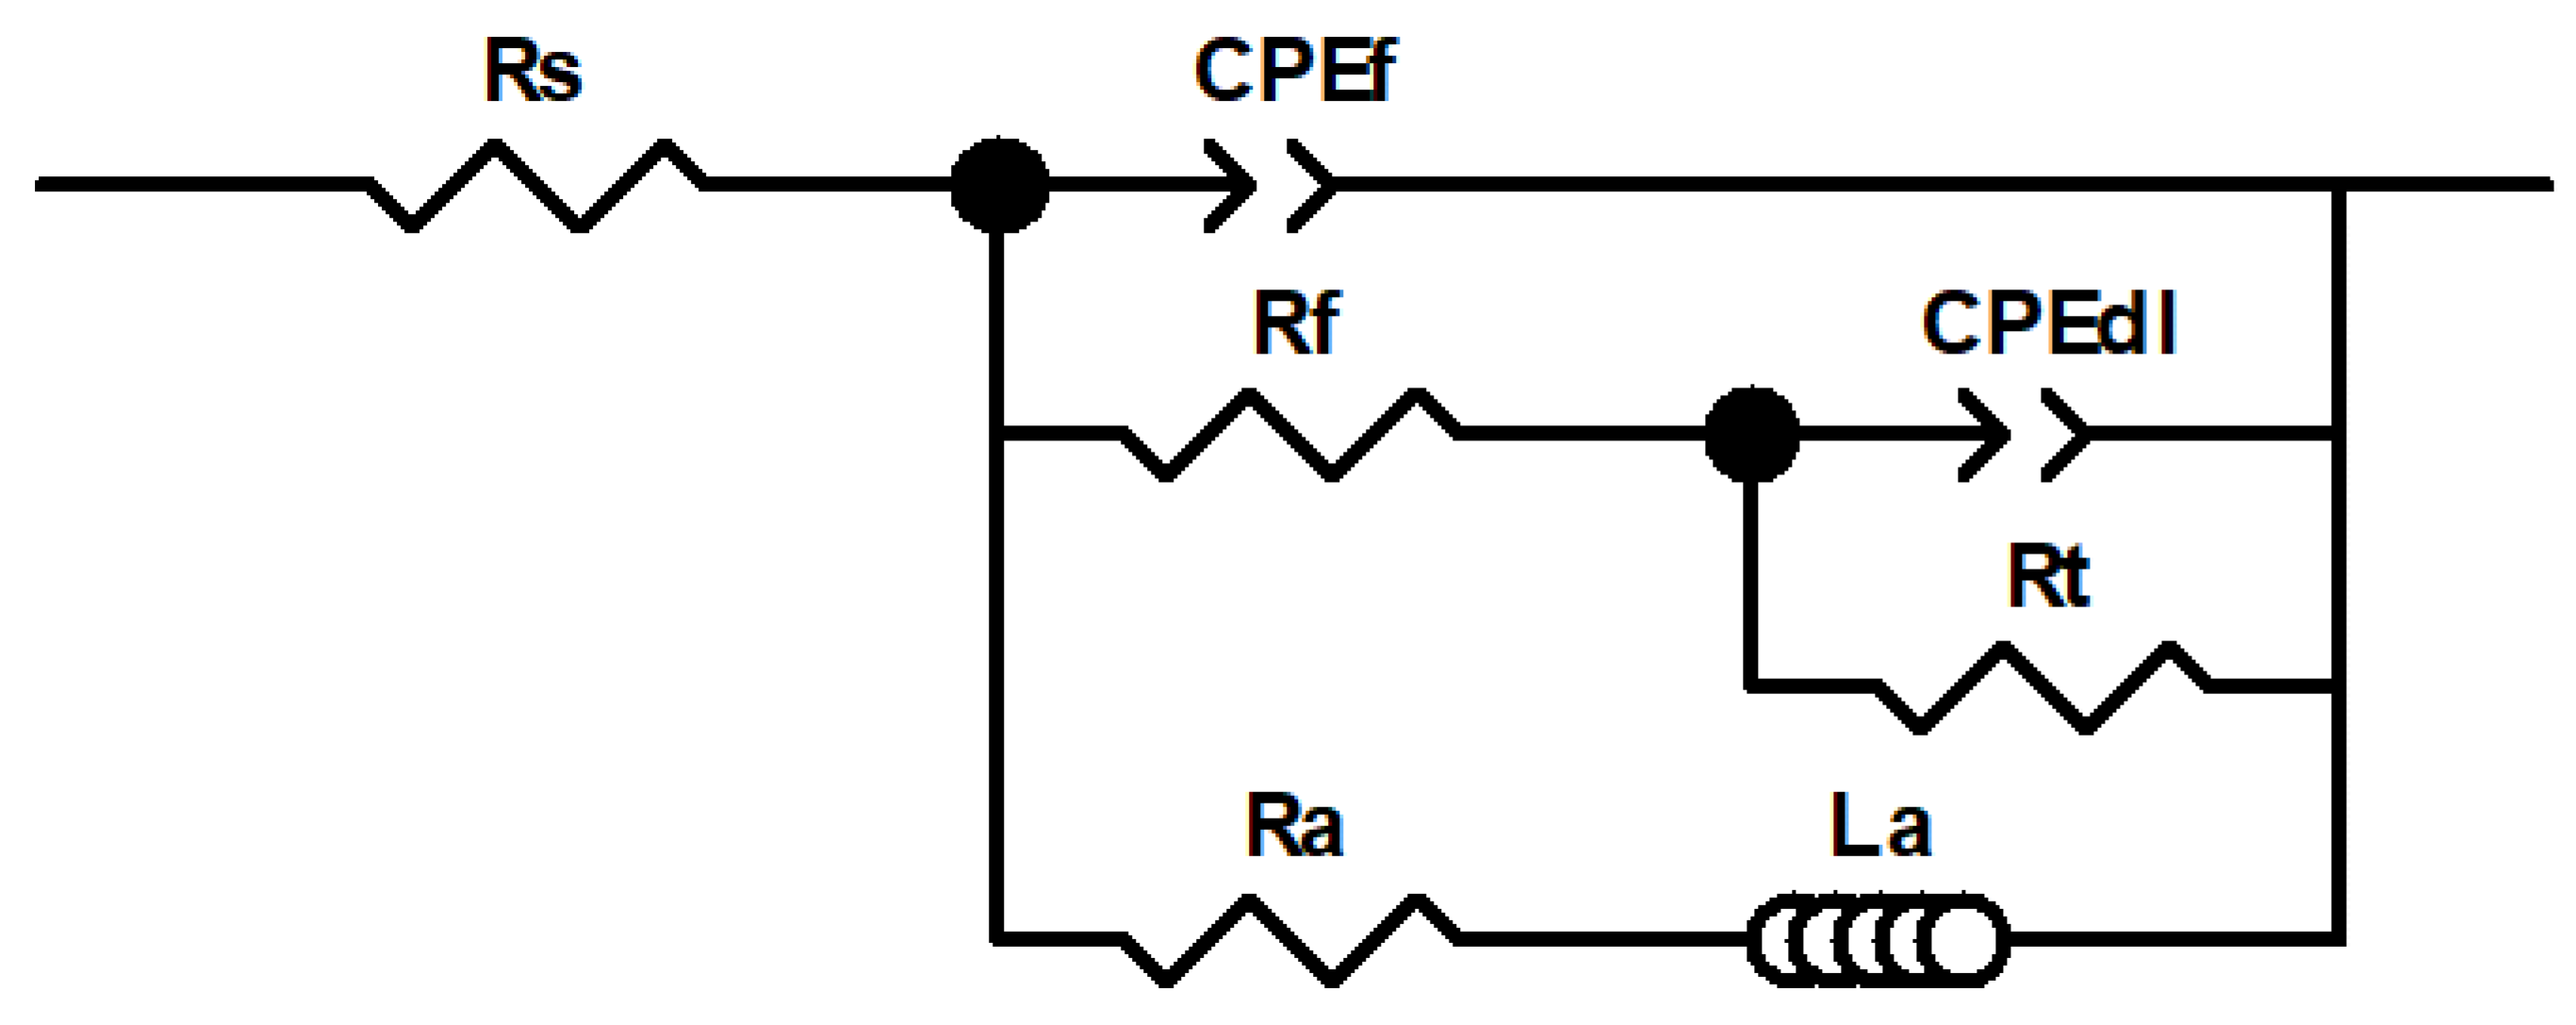
Figure 7 shows the electrical equivalent circuit (EEC) used for fitting the EIS results, as EEC was also employed in previous studies by independent authors [6,19,33]. In this EEC, the high frequency arc was mainly associated with the resistance of the thin native oxide film and/or the corrosion products layers, and the medium frequency arc was associated with the double layer capacitance and charge transfer resistance at the base of the oxide pores and/or at the AZ31 alloy/electrolyte interface. Finally, even though the physical meaning of the inductive loop commonly observed at the lowest frequency range in Mg alloy corrosion is not clear, it may be associated with the presence of adsorbed intermediate species during corrosion [34]. It has also been proposed that the inductive behavior may be associated with the kinetics of the anomalous evolution of hydrogen during Mg dissolution [35]. Furthermore, recent investigations have proposed that Mg dissolution and concomitant H2 evolution may proceed via the reaction of an Mg*H intermediate with water. This would also explain the presence of an inductive behavior at low frequencies [36]. Each electrical element of the EEC proposed in the present work will be explained in detail below.
In Figure 7, Rs accounts for the solution resistance; the parallel combination of CPEf and Rf was included to simulate the corrosion product film that forms on the AZ31B Mg alloy surface during corrosion; CPEdl and Rt represent the electrochemical double layer capacitance and the charge transfer resistance, respectively, at the metal/electrolyte interface. A constant phase element (CPE) was introduced instead of a capacitor to account for the time-constant dispersion due to inhomogeneities and surface roughness. The impedance of a CPE is expressed as ZCPE = (Q)−1(jω)−n, where Q is the admittance (S cm−2 sn), ω is the angular frequency (rad s−1), j is the imaginary number, and n is a dimensionless fractional exponent that ranges between −1 and +1 [37]. Finally, an inductor (La) associated in series with a resistance (Ra) was introduced into the model to account for the inductive behavior [38]. The fitting results of the EIS data are listed in Table 6. The good correlation between the experimental and the fitted data in Figure 6, as well as the average values of χ2 around 10−3 and relative error for each parameter < 5% in Table 6 confirm the suitability of the EEC in Figure 7 for the fitting of the impedance data.
It has been shown that Q (the admittance of the CPE) should not be taken as a measure of capacitance when the value of n (the CPE exponent) deviates from unity because it leads to large computational errors [39,40]. Brug et al. [41] proposed a relationship to calculate the effective capacitance (Ceff) from the CPE parameters (Q and n). Table 6 also shows the capacitance values associated with the capacitive behavior of CPEf and CPEdl calculated using Brug’s method. The calculated values of Ceff,f were in the order of 10−7–10−8 F/cm2, which are typical for the capacitance of an oxide film. This is consistent with the attribution of the time constant at a high frequency range to the dielectric properties of the corrosion product film. Furthermore, in spite of the fact that the Ceff,dl values are slightly lower than those expected for an electric double layer capacitance, they are consistent with the attribution of the time constant at mid-frequencies to the relaxation processes associated with charge transfer and its corresponding double layer capacitance.
Comparing EIS data for the four types of solutions, it can be seen that the capacitance values over the 4 days of immersion are clearly higher in the case of Ringer’s solution than for the PBS, Hank’s, and SBF solutions. The higher initial values of capacitance for alloy AZ31B in Ringer’s solution (Table 6) suggest either the presence of a thinner surface film, according to the inverse relationship between the capacitance and film thickness [42], or a more defective corrosion layer, which leaves a greater fraction of the metallic surface area in contact with the electrolyte [43]. In the case of the PBS, Hank’s, and SBF solutions, the decrease in capacitance values within the first day of immersion can be related to the thickening of the corrosion layer, which spreads and blocks the surface.
From the fitting results in Table 6, it is possible to estimate the polarization resistance (Rp), considering DC conditions. The Rp value was determined using the following equation derived from the EEC considering that the frequency tends to zero [6,15]:
R p 1 = ( R f + R t ) 1 + R a 1
Figure 8 presents the time evolution of Rt and Rp, and the results were calculated from an average of three measurements. In both cases, a similar trend was observed. From the early stages of immersion, the AZ31B specimen exposed to Ringer’s solution showed the lowest values of Rp and Rt. For the cases during which the Mg alloy was exposed to PBS, Hank’s, and SBF solutions, a significant increase in both Rp and Rt values occurred after 1 day of immersion in all cases, indicating decreased rates of corrosion. However, for longer times of exposure (from 2 days until the end of the experiments), both Rp and Rt decreased, and a plateau was observed. This indicates that all systems reached a steady state corrosion rate after 2 days of immersion. In general, the Mg alloy specimens exposed to Hank’s and SBF solution exhibited the highest values of Rp and Rt, thus the lowest corrosion rates.
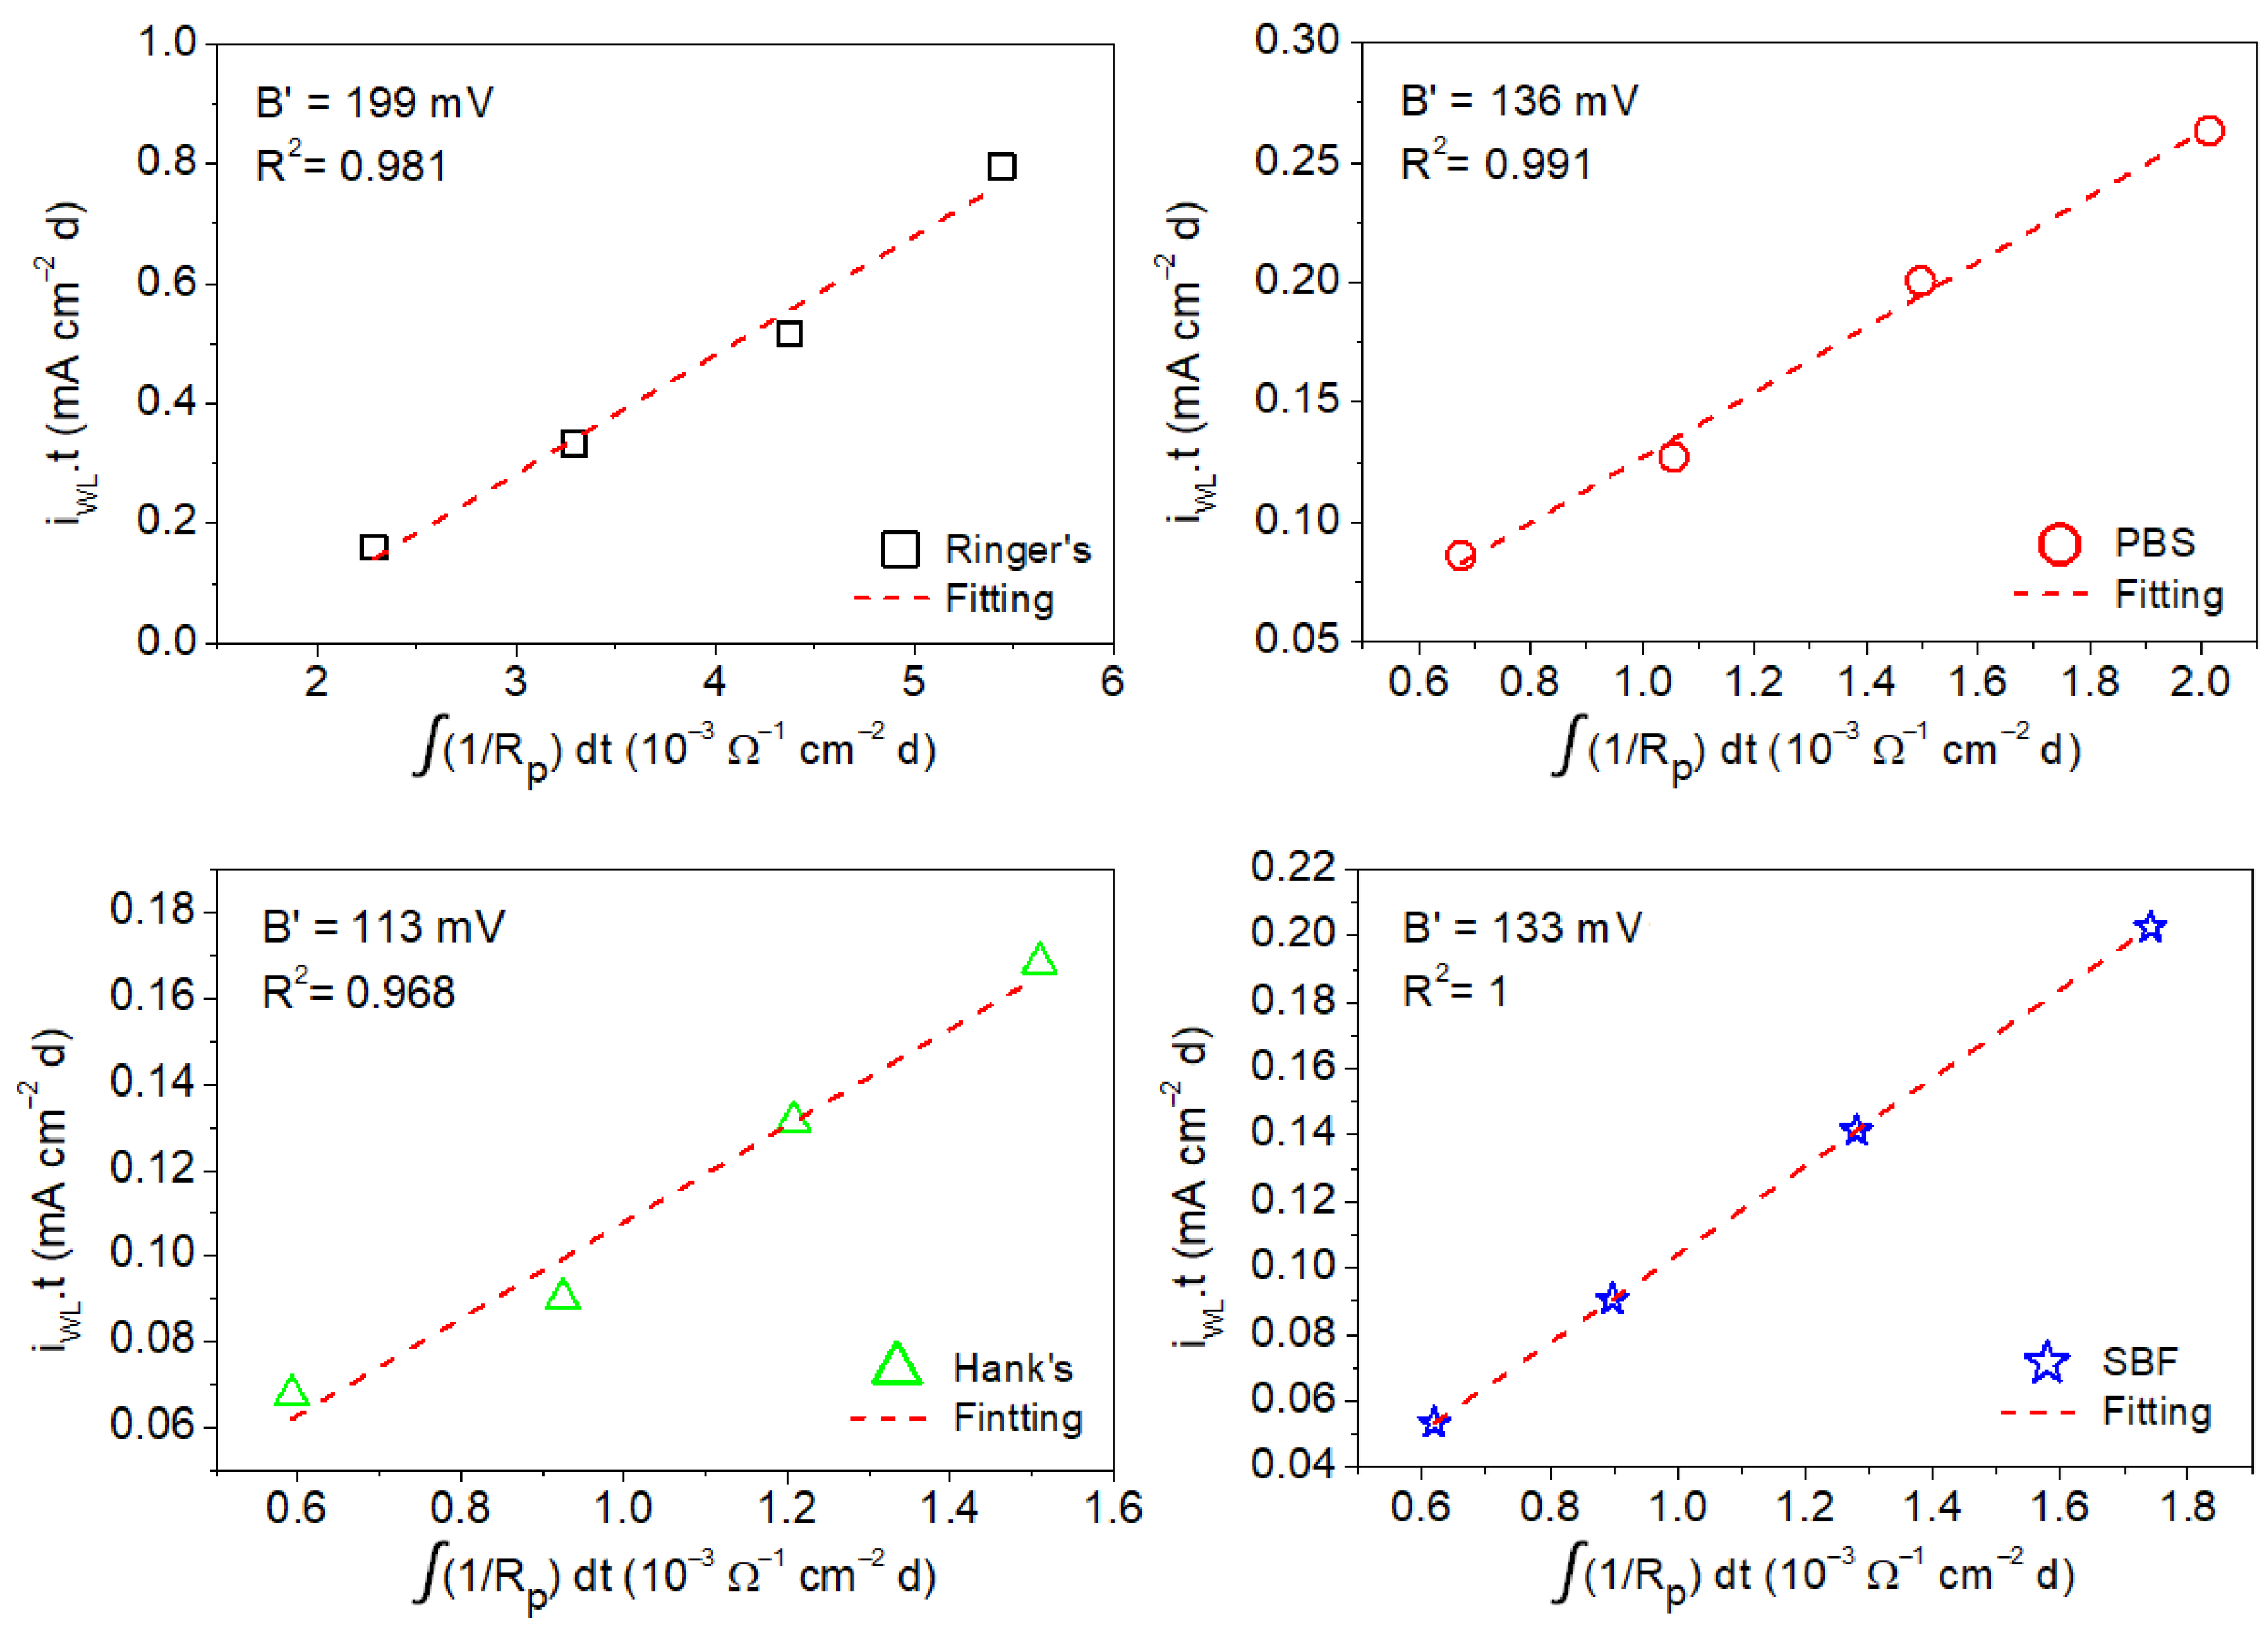
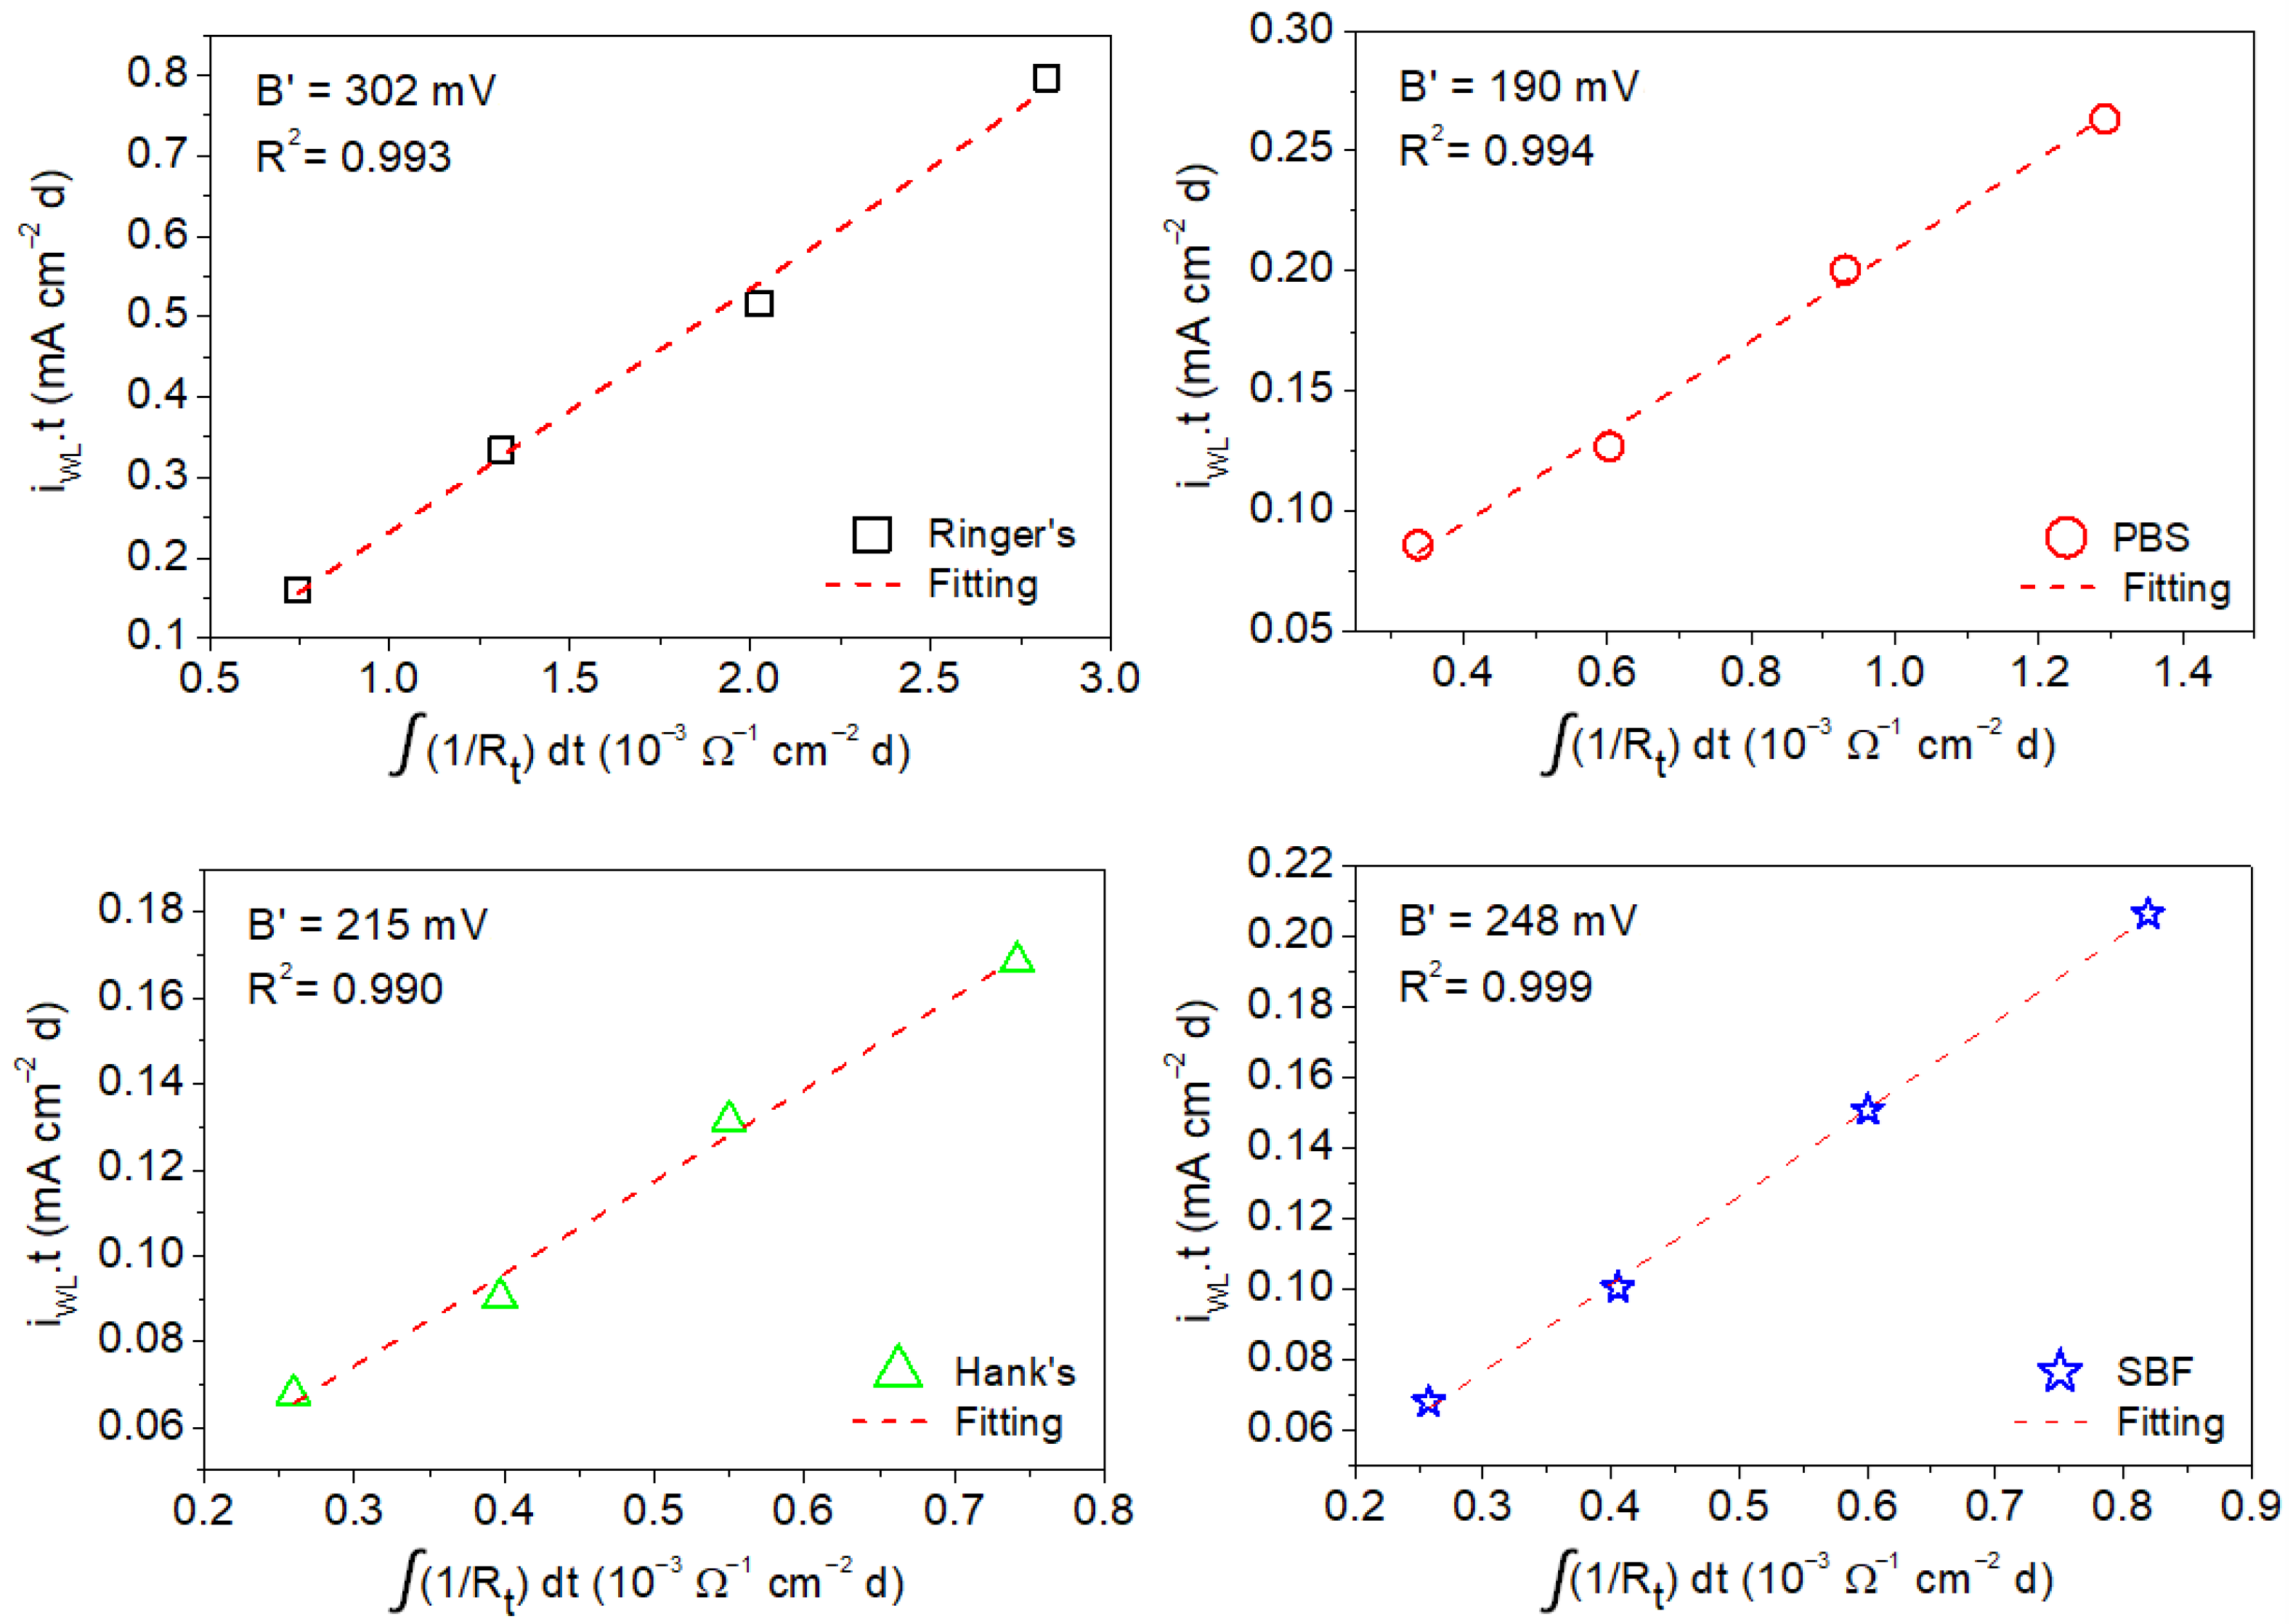
The B′ values associated with corrosion of the AZ31B Mg alloy in the four simulated body fluids were estimated by the linear fitting of the mean values of the anodic charge, which were taken from the weight loss measurements as a function of the time-integrated reciprocal of the mean values of Rp and Rt determined by EIS from 1 h to a maximum of 4 days of immersion (shown in Figure 9 and Figure 10) [16,23].
As expected, the calculated capacitance values obtained for the oxide film (from CPEf) are one order of magnitude smaller than those obtained for the double layer capacitance (CPEdl) in all the solutions (Table 6). The small difference between both capacitance values suggests that either the oxide film was formed mainly on small surface areas or the oxide films formed were dynamic and porous and did not form a continuous and compact oxide barrier against corrosion on the sample surface. This is in agreement with the low oxide resistance values obtained. The oxide layer formed on the sample surface exposed to Ringer’s solution had the lowest resistance values, which tend to disappear with the immersion time. This is in accordance with the higher icorr values obtained from polarization curves (Table 5) and the severe corrosion attack suffered by the AZ31B alloy in this solution. For PBS and Hank’s solutions, the oxide layer resistance slightly increased after 1 day of immersion but decreased again with the exposure time. It is only in the SBF solution where the oxide layer seems to increase its resistance with the immersion time. However, in all the cases the CPE exponent indicates that the semicircles at HF did not show a pure capacitive behavior. A value close to 0.7, which was found in most of the cases, indicates either a strong effect of the surface roughness on the capacitive response or a distribution of constant rates at the porous base of these porous and dynamic oxide layers. In the case of the PBS solution, these effects were more evident, showing a CPE exponent after 1 day of exposure of n = 0.5, which is more consistent with a diffusion process than with a capacitive response of a barrier oxide film.

4. Discussion

4.1. Relationship between the Surface Chemistry of the Corrosion Layers Formed on Magnesium Alloys and Their Corrosion Resistance in Saline Solutions

Electrochemical impedance results (Figure 6 and Figure 8) and weight loss versus time curves (Figure 3) provide information on the effect of the chemical composition of the electrolyte on the corrosion resistance of the specimens tested. The data collected from the EIS experiments in Ringer’s solution (Figure 8) indicate that even though the value of Rp slightly increased with the immersion time, this increment was small in comparison with the other body solutions tested. This is in agreement with the results of the gravimetric tests (Figure 3) and suggests that the corrosion product layer formed on the surface of the alloy while immersed in Ringer’s solution provides poor corrosion protection to the AZ31B Mg alloy. The data obtained through XPS (Table 3) are consistent with this, showing a significant enrichment in Mg(OH)2 in the outermost region of the corrosion product layer [30]. This species is highly porous and relatively soluble in aqueous environments. Therefore, the growth of this layer does not have a large impact on the corrosion rate [34,43,44,45,46]. In addition, the diffusion of the chloride ions may progressively deteriorate the Al-rich inner corrosion layer formed on the AZ31B Mg alloy specimen, decreasing its protective properties and accelerating the corrosion rate [47].
In contrast, the gravimetric results obtained in the immersion tests for the AZ31B alloys in the PBS, Hank’s, and SBF solutions (Figure 3) showed a significant decrease in the corrosion rate after the first day of immersion, followed by a plateau where nearly constant corrosion rate values were exhibited. This is indicative of steady state dissolution kinetics. Furthermore, both Rp and Rt values obtained during the four-day immersion test were approximately 2–5 times greater for alloys in the PBS, Hank´s, and SBF solutions compared to those alloys immersed in Ringer’s solution (Figure 8). This was most likely due to the surface precipitation of protective and insoluble Mg corrosion products. The XPS analysis of the corrosion product surface layer revealed the existence of magnesium phosphates or hydroxyapatite compounds (Table 3), which may lead to an enhancement in corrosion resistance. Several authors have independently reported that the formation of phosphate-containing corrosion products in SBF environments have a positive impact on the corrosion resistance of pure Mg and Mg alloys in aggressive media [29,48,49]. The magnesium phosphate present in the corrosion product layer is denser and more compact than Mg(OH)2, being less affected by the presence of chloride ions [49]. This explains why the corrosion rates measured in PBS, Hank’s, and SBF solutions were significantly lower than those in Ringer’s solution (see Figure 3).
It is interesting to note that both Rp and Rt values for the AZ31B specimens in Hank’s and SBF solutions present higher values than those in PBS solution over the whole period of immersion. These results are consistent with the presence of some deep pits on the surface of the specimens exposed to PBS solution (Figure 2g,h) and the slight decrease in the corrosion rate obtained from the weight loss measurements (Figure 3). The greater resistance of the corrosion layer formed in Hank’s and SBF solutions (containing HPO42− and Ca2+ ions) is in agreement with results reported in the literature, suggesting that the hydroxyapatite could limit the transformation from metastable to stable pits and promote the formation of a temporary barrier between the substrate and medium to increase the general corrosion resistance [3,29,50].

4.2. Determination of Apparent Stern–Geary Coefficient (B′) for the Estimation of Corrosion Rate

In the literature describing the use of the EIS technique to study the corrosion of Mg alloys, it is common to find impedance diagrams that are rather complex, showing two semicircles, one at the high frequency range (HF) characteristic either of passivating films [51,52,53,54,55,56,57] or to the presence of corrosion products, and the other associated with the charge transfer reaction at the medium (MF) to low frequency range (LF). In our study, a small semicircle was found at the highest frequencies followed by a large semicircle that dominated the EIS response of the surface at the MF range. Finally, an inductive loop was observed at the lowest frequencies.
Determination of the corrosion rate on Mg in aqueous environments using EIS requires a careful analysis of the resulting spectra to appropriately obtain the value of Rp [6]. This is not trivial for a number of reasons, such as the inherent high reactivity of Mg and the time needed to complete an EIS measurement that provides reliable information at the LF range. In brief, it is commonly challenging to perform an impedance measurement on a corroding Mg specimen where stationary conditions are satisfied throughout the entirety of the test. This is particularly evident at the lowest frequencies where scattering of the experimental data is normally observed. Thus, the value of Ra obtained at lowest frequencies, which is needed for determining Rp in Equation (2), is highly affected by the high reactivity of Mg rendering its determination less accurate. For this reason, it has been common and precise to use the value of the charge transfer resistance (Rt), which is directly related to the faradaic corrosion processes; this value can be determined from the time constant at HF to MF frequencies, which is normally more reproducible and can be determined in significantly less time. Furthermore, the use of the Stern–Geary equation requires knowledge of the anodic and cathodic Tafel slopes, which in the case of Mg and its alloys are also difficult to assess.
However, it is possible to experimentally determine the apparent Stern–Geary coefficient if the corrosion current density (determined by nonelectrochemical methods) and Rp are known. Assuming that the Tafel slopes do not vary (at least significantly) with the time of immersion [21], B′ can be calculated according to Equation (3) [16]:
B = Q a W L R p 1 d t
where Q a W L is the anodic charge associated with the corrosion of the Mg alloy (in this case obtained from the weight loss measurements) and the rest of the terms have already been described. It should be noted that Q a W L can also be expressed as the multiplication of icorr by the time of exposure to the test solution.
Figure 9 shows the anodic charge associated with the corrosion of the AZ31B specimen immersed in Ringer’s, PBS, Hank’s, and SBF solutions at 37 °C after different immersion times (determined from weight loss measurements) as a function of the time-integrated reciprocal of Rp. A linear behavior was exhibited in all cases. The B′ for the AZ31B Mg alloy in each of the test solutions was determined from the linear fit of the curves. It should be noted that R2 was very close or equal to 1 in all test solutions, which further validates the model in Equation (3). This analysis yielded the following B′ values: 199 ± 16 mV (Ringer’s), 136 ± 7 mV (PBS), 113 ± 12 mV (Hank’s), and 133 ± 4 mV (SBF).
The fact that the B′ value (Figure 9) was much higher than the B value obtained from the polarization curves (Table 5) is not new. Numerous researchers have determined corrosion rates from weight loss measurements up to 15 times higher than those obtained by electrochemical techniques [58,59,60,61,62,63]. These significant differences might be due to (a) the increase in the hydrogen evolution rate observed during anodic polarization (often termed the negative difference effect or NDE); (b) the partial disintegration of specimens into fine metallic particles; (c) participation of reaction intermediates during anodic dissolution; and (d) a significant difference in the instantaneous corrosion rate determined by the electrochemical techniques compared with the average corrosion rate provided by weight loss [19,64,65,66,67,68]. Moreover, further analysis of the results shows that if B values in Table 5 are used instead of B′ for icorr determination using Rp in the Stern–Geary equation, the real corrosion rate (as determined by weight loss) is underestimated by between one and two orders of magnitude. Therefore, we suggest that the B constant used in the Stern–Geary equation cannot be obtained by the direct determination of the Tafel slopes [12,19].
The same analysis as that carried out above for the determination of B′ from the values of Rp was performed using Rt. Figure 10 shows the anodic charge associated with corrosion of the AZ31B specimen immersed in Ringer’s, PBS, Hank’s, and SBF solutions at 37 °C after different immersion times (determined from weight loss measurements) as a function of the time-integrated reciprocal of Rt. As in the case where Rp was used (Figure 9), a linear behavior was exhibited in all cases, and values of R2 were close to 1. Linear fits of the curves in Figure 10 resulted in the following values of B′ for the AZ31B Mg alloy in each of the test solutions: 302 ± 14 mV (Ringer’s), 190 ± 9 mV (PBS), 215 ± 12 mV (Hank’s), and 248 ± 5 mV (SBF). Similar to that observed when the values of B were used instead of B′ for icorr determination using Rp in the Stern–Geary equation, the use of Rt leads to differences of about one to two orders of magnitude between the corrosion rate determined by weight loss and that from electrochemical methods were exhibited. This confirms the lack of suitability of the B constant from the direct determination of the Tafel slopes on the AZ31B Mg alloy in the typical simulated body solutions for corrosion rate determination using EIS.
In summary, the apparent Stern–Geary coefficients for the AZ31B Mg alloy in each test solution were calculated from the relationship between icorr from weight loss measurements and the EIS data (both Rp and Rt). This provided experimental reference B′ values that may be used as a useful tool in independent investigations to more accurately determine the corrosion rates of AZ31B Mg alloy in simulated body solutions. This approach will be extended in further experiments to other alloy system of interest for biodegradable implants such as Mg-Ca and Mg-Ca-Zn alloys to elucidate the main factors influencing the value of B′ for a particular alloy exposed to simulated body solutions.

5. Conclusions

  • EIS measurements have been demonstrated to be useful for the quantitative determination of the corrosion rate of AZ31B alloy in SBF’s solutions.
  • The apparent Stern–Geary coefficient (B′) was estimated using data obtained via gravimetric experiments and the integration of the reciprocal values of the charge transfer resistance (Rt) and polarization resistance (Rp) obtained from the EIS diagrams. This apparent Stern–Geary coefficient is essential to obtain accurate corrosion rates using EIS measurements.
  • Apparent Stern–Geary coefficients determined in Ringer’s, PBS, Hank’s, and SBF solutions at 37 °C after different immersion times as a function of the time-integrated reciprocal of the following: (i) Rp yielded the following B′ values: 199 ± 16 mV (Ringer’s), 136 ± 7 mV (PBS), 113 ± 12 mV (Hank’s), and 133 ± 4 mV (SBF); (ii) Rt yielded the following B′ values: 302 ± 14 mV (Ringer’s), 190 ± 9 mV (PBS), 215 ± 12 mV (Hank’s), and 248 ± 5 mV (SBF).
  • All B′ values were significantly higher than the B values obtained from the polarization curves in this study. This is not new. Corrosion rates obtained by numerous researchers from weight loss measurements found values up to 15 times higher than those obtained by electrochemical techniques.
  • Analysis of the results showed that if B values obtained from polarization curves are used instead of B′ for icorr determination using Rp in the Stern–Geary equation, the real corrosion rate (as determined by weight loss) is underestimated by between one and two orders of magnitude. Therefore, it is suggested that the B constant used in the Stern–Geary equation cannot be obtained by the direct determination of the Tafel slopes.
  • The increase of the Rt values in the impedance spectra observed for Hank’s and SBF solutions compared to those obtained for PBS and Ringer’s solutions tends to reflect the precipitation of hydroxyapatite-like compounds observed by XPS analysis on the surface of the corrosion layer formed during exposure.

Author Contributions

F.R.G.-G. performed the preparation of samples and their corrosion tests. S.F., V.B., and S.F.J. discussed the results and wrote the manuscript with contributions from all authors. S.F.J. conceived and supervised the project. All correspondence should be addressed to S.F.J. All authors have read and agreed to the published version of the manuscript.

Funding

This research was funded by the Spanish Ministry of Economy and Competitiveness (project MAT2015-65445-C2-1-R). S.F. expresses his gratitude to the State Research Agency (Ministry of Science and Innovation of Spain), the Spanish National Research Council (CSIC) and the European Regional Development Fund (ERDF) for the funfing under the project RYC2019-027006-I (AEI/FEDER/UE).

Institutional Review Board Statement

Not applicable.

Informed Consent Statement

Not applicable.

Data Availability Statement

The study did not report any data.

Conflicts of Interest

The author declares no conflict of interest.

References

  1. Sanchez, A.H.M.; Luthringer, B.J.C.; Feyerabend, F.; Willumeit, R. Mg and Mg alloys: How comparable are in vitro and in vivo corrosion rates? A review. Acta Biomater. 2015, 13, 16–31. [Google Scholar] [CrossRef] [Green Version]
  2. Wang, C.; Wu, L.; Xue, F.; Ma, R.; Etim, I.-I.N.; Hao, X.; Dong, J.; Ke, W. Electrochemical noise analysis on the pit corrosion susceptibility of biodegradable AZ31 magnesium alloy in four types of simulated body solutions. J. Mater. Sci. Technol. 2018, 34, 1876–1884. [Google Scholar] [CrossRef]
  3. Yang, L.; Zhang, E. Biocorrosion behavior of magnesium alloy in different simulated fluids for biomedical application. Mater. Sci. Eng. C 2009, 29, 1691–1696. [Google Scholar] [CrossRef]
  4. Wang, B.; Xu, D.; Dong, J.; Ke, W. Effect of corrosion product films on the in vitro degradation behavior of Mg-3% Al-1% Zn (in wt %) alloy in hank’s solution. J. Mater. Sci. Technol. 2018, 34, 1756–1764. [Google Scholar] [CrossRef]
  5. Zhang, L.; Zhang, J.Q.; Chen, C.F.; Gu, Y.H. Advances in microarc oxidation coated AZ31 Mg alloys for biomedical applications. Corros. Sci. 2015, 91, 7–28. [Google Scholar] [CrossRef]
  6. King, A.D.; Birbilis, N.; Scully, J.R. Accurate Electrochemical Measurement of Magnesium Corrosion Rates; a Combined Impedance, Mass-Loss and Hydrogen Collection Study. Electrochim. Acta 2014, 121, 394–406. [Google Scholar] [CrossRef]
  7. Song, G. Control of biodegradation of biocompatable magnesium alloys. Corros. Sci. 2007, 49, 1696–1701. [Google Scholar] [CrossRef]
  8. Atrens, A.; Liu, M.; Zainal Abidin, N.I. Corrosion mechanism applicable to biodegradable magnesium implants. Mater. Sci. Eng. B 2011, 176, 1609–1636. [Google Scholar] [CrossRef]
  9. Staiger, M.P.; Feyerabend, F.; Willumeit, R.; Sfeir, C.S.; Zheng, Y.F.; Virtanen, S.; Müeller, W.D.; Atrens, A.; Peuster, M.; Kumta, P.N.; et al. Summary of the panel discussions at the 2nd Symposium on Biodegradable Metals, Maratea, Italy. Mater. Sci. Eng. B 2011, 176, 1596–1599. [Google Scholar] [CrossRef]
  10. Aung, N.N.; Zhou, W. Effect of grain size and twins on corrosion behaviour of AZ31B magnesium alloy. Corros. Sci. 2010, 52, 589–594. [Google Scholar] [CrossRef]
  11. Witte, F.; Feyerabend, F.; Maier, P.; Fischer, J.; Stormer, M.; Blawert, C.; Dietzel, W.; Hort, N. Biodegradable magnesium-hydroxyapatite metal matrix composites. Biomaterials 2007, 28, 2163–2174. [Google Scholar] [CrossRef] [PubMed] [Green Version]
  12. Liu, Y.X.; Curioni, M.; Liu, Z. Correlation between electrochemical impedance measurements and corrosion rates of Mg-1Ca alloy in simulated body fluid. Electrochim. Acta 2018, 264, 101–108. [Google Scholar] [CrossRef]
  13. Mraied, H.; Wang, W.; Cai, W. Influence of Chemical Heterogeneity and Microstructure on the Corrosion Resistance of Biodegradable WE43 Magnesium Alloys. J. Mater. Chem. B 2019, 7, 6399–6411. [Google Scholar] [CrossRef]
  14. Khalifeh, S.; Burleigh, T.D. Super-hydrophobic stearic acid layer formed on anodized high purified magnesium for improving corrosion resistance of bioabsorbable implants. J. Magnes. Alloys 2018, 6, 327–336. [Google Scholar] [CrossRef]
  15. Han, L.; Li, X.; Bai, J.; Xue, F.; Zheng, Y.; Chu, C. Effects of flow velocity and different corrosion media on the in vitro bio-corrosion behaviors of AZ31 magnesium alloy. Mater. Chem. Phys. 2018, 217, 300–307. [Google Scholar] [CrossRef]
  16. Veleva, L.; Fernandez-Olaya, M.G.; Feliu, S. Initial stages of AZ31B magnesium alloy degradation in Ringer’s solution: Interpretation of EIS, mass loss, hydrogen evolution data and scanning electron microscopy observations. Metals 2018, 8, 933. [Google Scholar] [CrossRef] [Green Version]
  17. Fajardo, S.; Glover, C.F.; Williams, G.; Frankel, G.S. The Source of Anodic Hydrogen Evolution on Ultra High Purity Magnesium. Electrochim. Acta 2016, 212, 510–521. [Google Scholar] [CrossRef] [Green Version]
  18. Atrens, A.; Song, G.-L.; Liu, M.; Shi, Z.; Cao, F.; Dargusch, M.S. Review of recent developments in the field of magnesium corrosion. Adv. Eng. Mater. 2015, 17, 400–453. [Google Scholar] [CrossRef]
  19. Curioni, M.; Scenini, F.; Monetta, T.; Bellucci, F. Correlation between electrochemical impedance measurements and corrosion rate of magnesium investigated by real-time hydrogen measurement and optical imaging. Electrochim. Acta 2015, 166, 372–384. [Google Scholar] [CrossRef]
  20. Bland, L.G.; King, A.D.; Birbilis, N.; Scully, J.R. Assessing the corrosion of commercially pure magnesium and commercial AZ31B by electrochemical impedance, mass-loss, hydrogen collection and inductively coupled plasma optical emission spectrometry solution analysis. Corrosion 2015, 71, 128–145. [Google Scholar] [CrossRef]
  21. Hsieh, M.K.; Dzombak, D.A.; Vidie, R.D. Bridging gravimetric and electrochemical approaches to determine the corrosion rate of metals and metal alloys in cooling systems: Bench scale evaluation method. Ind. Eng. Chem. Res. 2010, 49, 9117–9123. [Google Scholar] [CrossRef]
  22. Feliu, S.; Maffiotte, C.; Samaniego, A.; Galvan, J.C.; Barranco, V. Effect of the chemistry and structure of the native oxide surface film on the corrosion properties of commercial AZ31 and AZ61 alloys. Appl. Surf. Sci. 2011, 257, 8558–8568. [Google Scholar] [CrossRef] [Green Version]
  23. Delgado, M.C.; Garcia-Galvan, F.R.; Barranco, V.; Feliu, S., Jr. A measuring approach to assess the corrosion rate of magnesium alloys using electrochemical impedance measurements. In Magnesium Alloys; Aliofkhazraei, M., Ed.; Intech: Rijeka, Croatia, 2017; pp. 129–159. [Google Scholar]
  24. Liu, Y. Corrosion Behaviour of Biodegradable Mg-1Ca Alloy in Simulated Body Fluid. Ph.D. Thesis, The University of Manchester, Manchester, UK, March 2018. [Google Scholar]
  25. Liu, C.L.; Wang, Y.J.; Zeng, R.C.; Zhang, X.M.; Huang, W.J.; Chu, P.K. In Vitro corrosion degradation behaviour of Mg–Ca alloy in the presence of albumin. Corros. Sci. 2010, 52, 3341–3347. [Google Scholar] [CrossRef]
  26. ISO 16428, Implants for Surgery—Test Solutions and Environmental Conditions for Static and Dynamic Corrosion Tests on Implantable Materials and Medical Devices. 2005. Available online: https://www.iso.org/standard/30280.html (accessed on 9 November 2018).
  27. Song, G.; Song, S. A possible biodegradable magnesium implant material. Adv. Eng. Mater. 2007, 9, 298–302. [Google Scholar] [CrossRef]
  28. ZView Software, Version 3.1c; Scribner Associates Inc.: Southern Pines, NC, USA, 2007.
  29. Jang, Y.; Collins, B.; Sankar, J.; Yun, Y. Effect of biologically relevant ions on the corrosion products formed on alloy AZ31B: An improved understanding of magnesium corrosion. Acta Biomater. 2013, 9, 8761–8770. [Google Scholar] [CrossRef] [PubMed]
  30. Mena-Morcillo, E.; Veleva, L. Degradation of AZ31 and AZ91 magnesium alloys in different physiological media: Effect of surface layer stability on electrochemical behavior. J. Magnes. Alloys 2020, 8, 667–675. [Google Scholar] [CrossRef]
  31. Wu, Y.; Wang, Y.; Tian, S.; Jing, Y.; Zhuang, J.; Guo, L.; Jia, D.; Zhou, Y. Hydrothermal fabrication of rGO/apatite layers on AZ31 magnesium alloy for enhanced bonding strength and corrosion resistance. Appl. Surf. Sci. 2019, 470, 430–438. [Google Scholar] [CrossRef]
  32. Zeng, R.-C.; Li, X.-T.; Li, S.-Q.; Zhang, F.; Han, E.-H. In Vitro degradation of pure Mg in response to glucose. Sci. Rep. 2015, 5, 13026. [Google Scholar] [CrossRef]
  33. Pacha-Olivenza, M.A.; Galván, J.C.; Porro, J.A.; Lieblich, M.; Díaz, M.; Angulo, I.; Cordovilla, F.; García-Galván, F.R.; Fernández-Calderón, M.C.; González-Martín, M.L.; et al. Efficacy of laser shock processing of biodegradable Mg and Mg-1Zn alloy on their in vitro corrosion and bacterial response. Surf. Coat. Technol. 2020, 384, 125320. [Google Scholar] [CrossRef]
  34. Baril, G.; Pebere, N. The corrosion of pure magnesium in aerated and deaerated sodium sulphate solutions. Corros. Sci. 2001, 43, 471–484. [Google Scholar] [CrossRef]
  35. Curioni, M.; Salamone, L.; Scenini, F.; Santamaria, M. A mathematical description accounting for the superfluous hydrogen evolution and the inductive behaviour observed during electrochemical measurements on magnesium. Electrochim. Acta 2018, 274, 343–352. [Google Scholar] [CrossRef]
  36. Yuwono, J.A.; Taylor, C.D.; Frankel, G.S.; Birbilis, N.; Fajardo, S. Understanding the enhanced rates of hydrogen evolution on dissolving magnesium. Electrochem. Commun. 2019, 104, 106482. [Google Scholar] [CrossRef]
  37. Singh, C.; Tiwari, S.K.; Singh, R. Exploring environment friendly nickel electrodeposition on AZ91 magnesium alloy: Effect of prior surface treatments and temperature of the bath on corrosion behavior. Corros. Sci. 2019, 151, 1–19. [Google Scholar] [CrossRef]
  38. Jamesh, M.; Kumar, S.; Narayanan, T.S.N.S. Corrosion behavior of commercially pure Mg and ZM21 Mg alloy in Ringer’s solution—Long term evaluation by EIS. Corros. Sci. 2011, 53, 645–654. [Google Scholar] [CrossRef]
  39. Huang, V.M.-W.; Vivier, V.; Orazem, M.E.; Pébère, N.; Tribollet, B. The apparent constant-phase-element behavior of a disk electrode with faradaic reactions: A global and local impedance analysis. J. Electrochem. Soc. 2007, 154, C99–C107. [Google Scholar] [CrossRef] [Green Version]
  40. Harrington, S.P.; Wang, F.; Devine, T.M. The structure and electronic properties of passive and prepassive films of iron in borate buffer. Electrochim. Acta 2010, 55, 4092–4102. [Google Scholar] [CrossRef]
  41. Brug, G.J.; van den Eeden, A.L.G.; Sluyters-Rehbach, M.; Sluyters, J.H. The analysis of electrode impedances complicated by the presence of a constant phase element. J. Electroanal. Chem. Interfa. Electrochem. 1984, 176, 275–295. [Google Scholar] [CrossRef]
  42. Baril, G.; Galicia, G.; Deslouis, C.; Pébere, N.; Tribollet, B.; Vivier, V. An impedance investigation of the mechanism of pure magnesium corrosion in sodium sulfate solutions. J. Electrochem. Soc. 2007, 154, C108–C113. [Google Scholar] [CrossRef] [Green Version]
  43. Pardo, A.; Merino, M.C.; Coy, A.E.; Viejo, F.; Arrabal, R.; Feliu, S. Influence of Microstructure and Composition on the Corrosion Behaviour of Mg/Al Alloys in Chloride Media. Electrochim. Acta 2008, 53, 7890–7902. [Google Scholar] [CrossRef]
  44. Santamaria, M.; di Quarto, F.; Zanna, S.; Marcus, P. Initial surface film on magnesium metal: A characterization by X-ray photoelectron spectroscopy (XPS) and photocurrent spectroscopy (PCS). Electrochim. Acta 2007, 53, 1314–1324. [Google Scholar] [CrossRef] [Green Version]
  45. Cui, Z.; Li, X.; Xiao, K.; Dong, C. Atmospheric corrosion of field-exposed AZ31 magnesium in a tropical marine environment. Corros. Sci. 2013, 76, 243–256. [Google Scholar] [CrossRef]
  46. Luo, Y.; Sun, Y.; Lv, J.; Wang, X.; Li, J.; Wang, F. Transition of interface oxide layer from porous Mg(OH)2 to dense MgO induced by polyaniline and corrosion resistance of Mg alloy. Appl. Surf. Sci. 2015, 328, 247–254. [Google Scholar] [CrossRef]
  47. Feliu, S.; Veleva, L.; García-Galvan, F. Effect of Temperature on the Corrosion Behavior of Biodegradable AZ31B Magnesium Alloy in Ringer’s Physiological Solution. Metals 2019, 9, 591. [Google Scholar] [CrossRef] [Green Version]
  48. Yamamoto, A.; Hiromoto, S. Effect of inorganic salts, amino acids and proteins on the degradation of pure magnesium in vitro. Mater. Sci. Eng. C 2009, 29, 1559–1568. [Google Scholar] [CrossRef]
  49. Xin, Y.; Huo, K.; Tao, H.; Tang, G.; Chu, P.K. Influence of aggressive ions on the degradation behavior of biomedical magnesium alloy in physiological environment. Acta Biomater. 2008, 4, 2008–2015. [Google Scholar] [CrossRef] [PubMed]
  50. Prabhu, D.B.; Gopalakrishnan, P.; Ravi, K.R. Morphological studies on the development of chemical conversion coating on surface of Mg-4Zn alloy and its corrosion and bio mineralisation behaviour in simulated body fluid. J. Alloys Compd. 2020, 812, 152146. [Google Scholar] [CrossRef]
  51. Miao, H.; Huang, H.; Shi, Y.; Zhang, H.; Pei, J.; Yuan, G. Effects of solution treatment before extrusion on the microstructure, mechanical properties and corrosion of Mg-Zn-Gd alloy in vitro. Corros. Sci. 2017, 122, 90–99. [Google Scholar] [CrossRef]
  52. Pinto, R.; Ferreira, M.G.S.; Carmezim, M.J.; Montemor, M.F. Passive behavior of magnesium alloys (Mg–Zr) containing rare-earth elements in alkaline media. Electrochim. Acta 2010, 55, 2482–2489. [Google Scholar] [CrossRef]
  53. Zidoune, M.; Grosjean, M.H.; Roué, L.; Huot, J.; Schulz, R. Comparative study on the corrosion behavior of milled and unmilled magnesium by electrochemical impedance spectroscopy. Corros. Sci. 2004, 46, 3041–3055. [Google Scholar] [CrossRef]
  54. Hu, J.; Huang, D.; Zhang, G.; Song, G.L.; Guo, X. Research on the inhibition mechanism of tetraphenylporphyrin on AZ91D magnesium alloy. Corros. Sci. 2012, 63, 367–378. [Google Scholar] [CrossRef]
  55. Huang, D.; Hu, J.; Song, G.L.; Guo, X. Inhibition effect of inorganic and organic inhibitors on the corrosion of Mg–10Gd–3Y–0.5Zr alloy in an ethylene glycol solution at ambient and elevated temperatures. Electrochim. Acta 2011, 56, 10166–10178. [Google Scholar] [CrossRef]
  56. Shi, Z.; Cao, F.; Song, G.-L.; Liu, M.; Atrens, A. Corrosion behaviour in salt spray and in 3.5% NaCl solution saturated with Mg(OH)2 of as-cast and solution heat-treated binary Mg–RE alloys: RE = Ce, La, Nd, Y, Gd. Corros. Sci. 2013, 76, 98–118. [Google Scholar] [CrossRef]
  57. Cao, F.Y.; Shi, Z.M.; Song, G.L.; Liu, M.; Atrens, A. Corrosion behaviour in salt spray and in 3.5% NaCl solution saturated with Mg(OH)2 of as-cast and solution heat-treated binary Mg-X alloys: X = Mn, Sn, Ca, Zn, Al, Zr, Si, Sr. Corros. Sci. 2013, 76, 60–97. [Google Scholar] [CrossRef]
  58. Zhang, C.; Wu, L.; Huang, G.; Liu, K.; Jiang, B.; Wang, G.; Xia, D.; Atrens, A.; Pan, F. Influence of microalloying with Ca and Ce on the corrosion behavior of extruded Mg-3Al-1Zn. J. Electrochem. Soc. 2019, 166, C445–C453. [Google Scholar] [CrossRef]
  59. Zhong, L.P.; Wang, Y.J.; Lu, H.; Cui, X.J.; Zhang, Y.J.; Dou, B.J.; Peng, J. Influence of aging prior to extrusion on the microstructure and corrosion resistance of Mg-8Sn-2Zn-0.2Mn alloy. J. Alloys Compd. 2019, 780, 783–791. [Google Scholar] [CrossRef]
  60. Silva, C.L.P.; Oliveira, A.C.; Costa, C.G.F.; Figueiredo, R.B.; de Fátima Leite, M.; Pereira, M.M.; Lins, V.F.C.; Langdon, T.G. Effect of severe plastic deformation on the biocompatibility and corrosion rate of pure magnesium. J. Mater. Sci. 2017, 52, 5992–6003. [Google Scholar] [CrossRef] [Green Version]
  61. Gu, M.Y.; Wei, G.L.; Liu, W.C.; Wu, G.H. Influence of neodymium on microstructure and corrosion behavior of Mg-8Li-3Al-2Zn alloy. Mater. Corros. 2017, 68, 436–443. [Google Scholar] [CrossRef]
  62. Shi, Y.; Peng, C.; Feng, Y.; Wang, R.; Wang, N. Enhancement of discharge properties of an extruded Mg-Al-Pb anode for seawater-activated battery by lanthanum addition. J. Alloys Compd. 2017, 721, 392–404. [Google Scholar] [CrossRef]
  63. Li, T.; Zhang, H.; He, Y.; Wang, X. Comparison of corrosion behavior of Mg–1.5Zn–0.6Zr and AZ91D alloys in a NaCl solution. Mater. Corros. 2015, 66, 7–15. [Google Scholar] [CrossRef]
  64. Zhou, M.; Liu, C.; Xu, S.; Gao, Y.; Jiang, S. Accelerated degradation rate of AZ31 magnesium alloy by copper additions. Mater. Corros. 2018, 69, 760–769. [Google Scholar] [CrossRef]
  65. Dinodi, N.; Nityananda, S. Alkyl carboxylates as efficient and green inhibitors of magnesium alloy ZE41 corrosion in aqueous salt solution. Corros. Sci. 2014, 85, 411–427. [Google Scholar] [CrossRef]
  66. Choi, H.Y.; Kim, W.J. The improvement of corrosion resistance of AZ91 magnesium alloy through development of dense and tight network structure of Al-rich α phase by addition of a trace amount of Ti. J. Alloys Compd. 2017, 696, 736–745. [Google Scholar] [CrossRef]
  67. Duffó, G.S.; Farina, S.B.; Rodríguez, F.M. Corrosion behaviour of non-ferrous metals embedded in mortar. Constr. Build. Mater. 2019, 210, 548–554. [Google Scholar] [CrossRef]
  68. Pardo, A.; Feliu, S., Jr.; Merino, M.C.; Arrabal, R.; Matykina, E. Electrochemical estimation of the corrosion rate of Magnesium/Aluminium alloys. Int. J. Corros. 2010, 2010, 953850. [Google Scholar] [CrossRef]
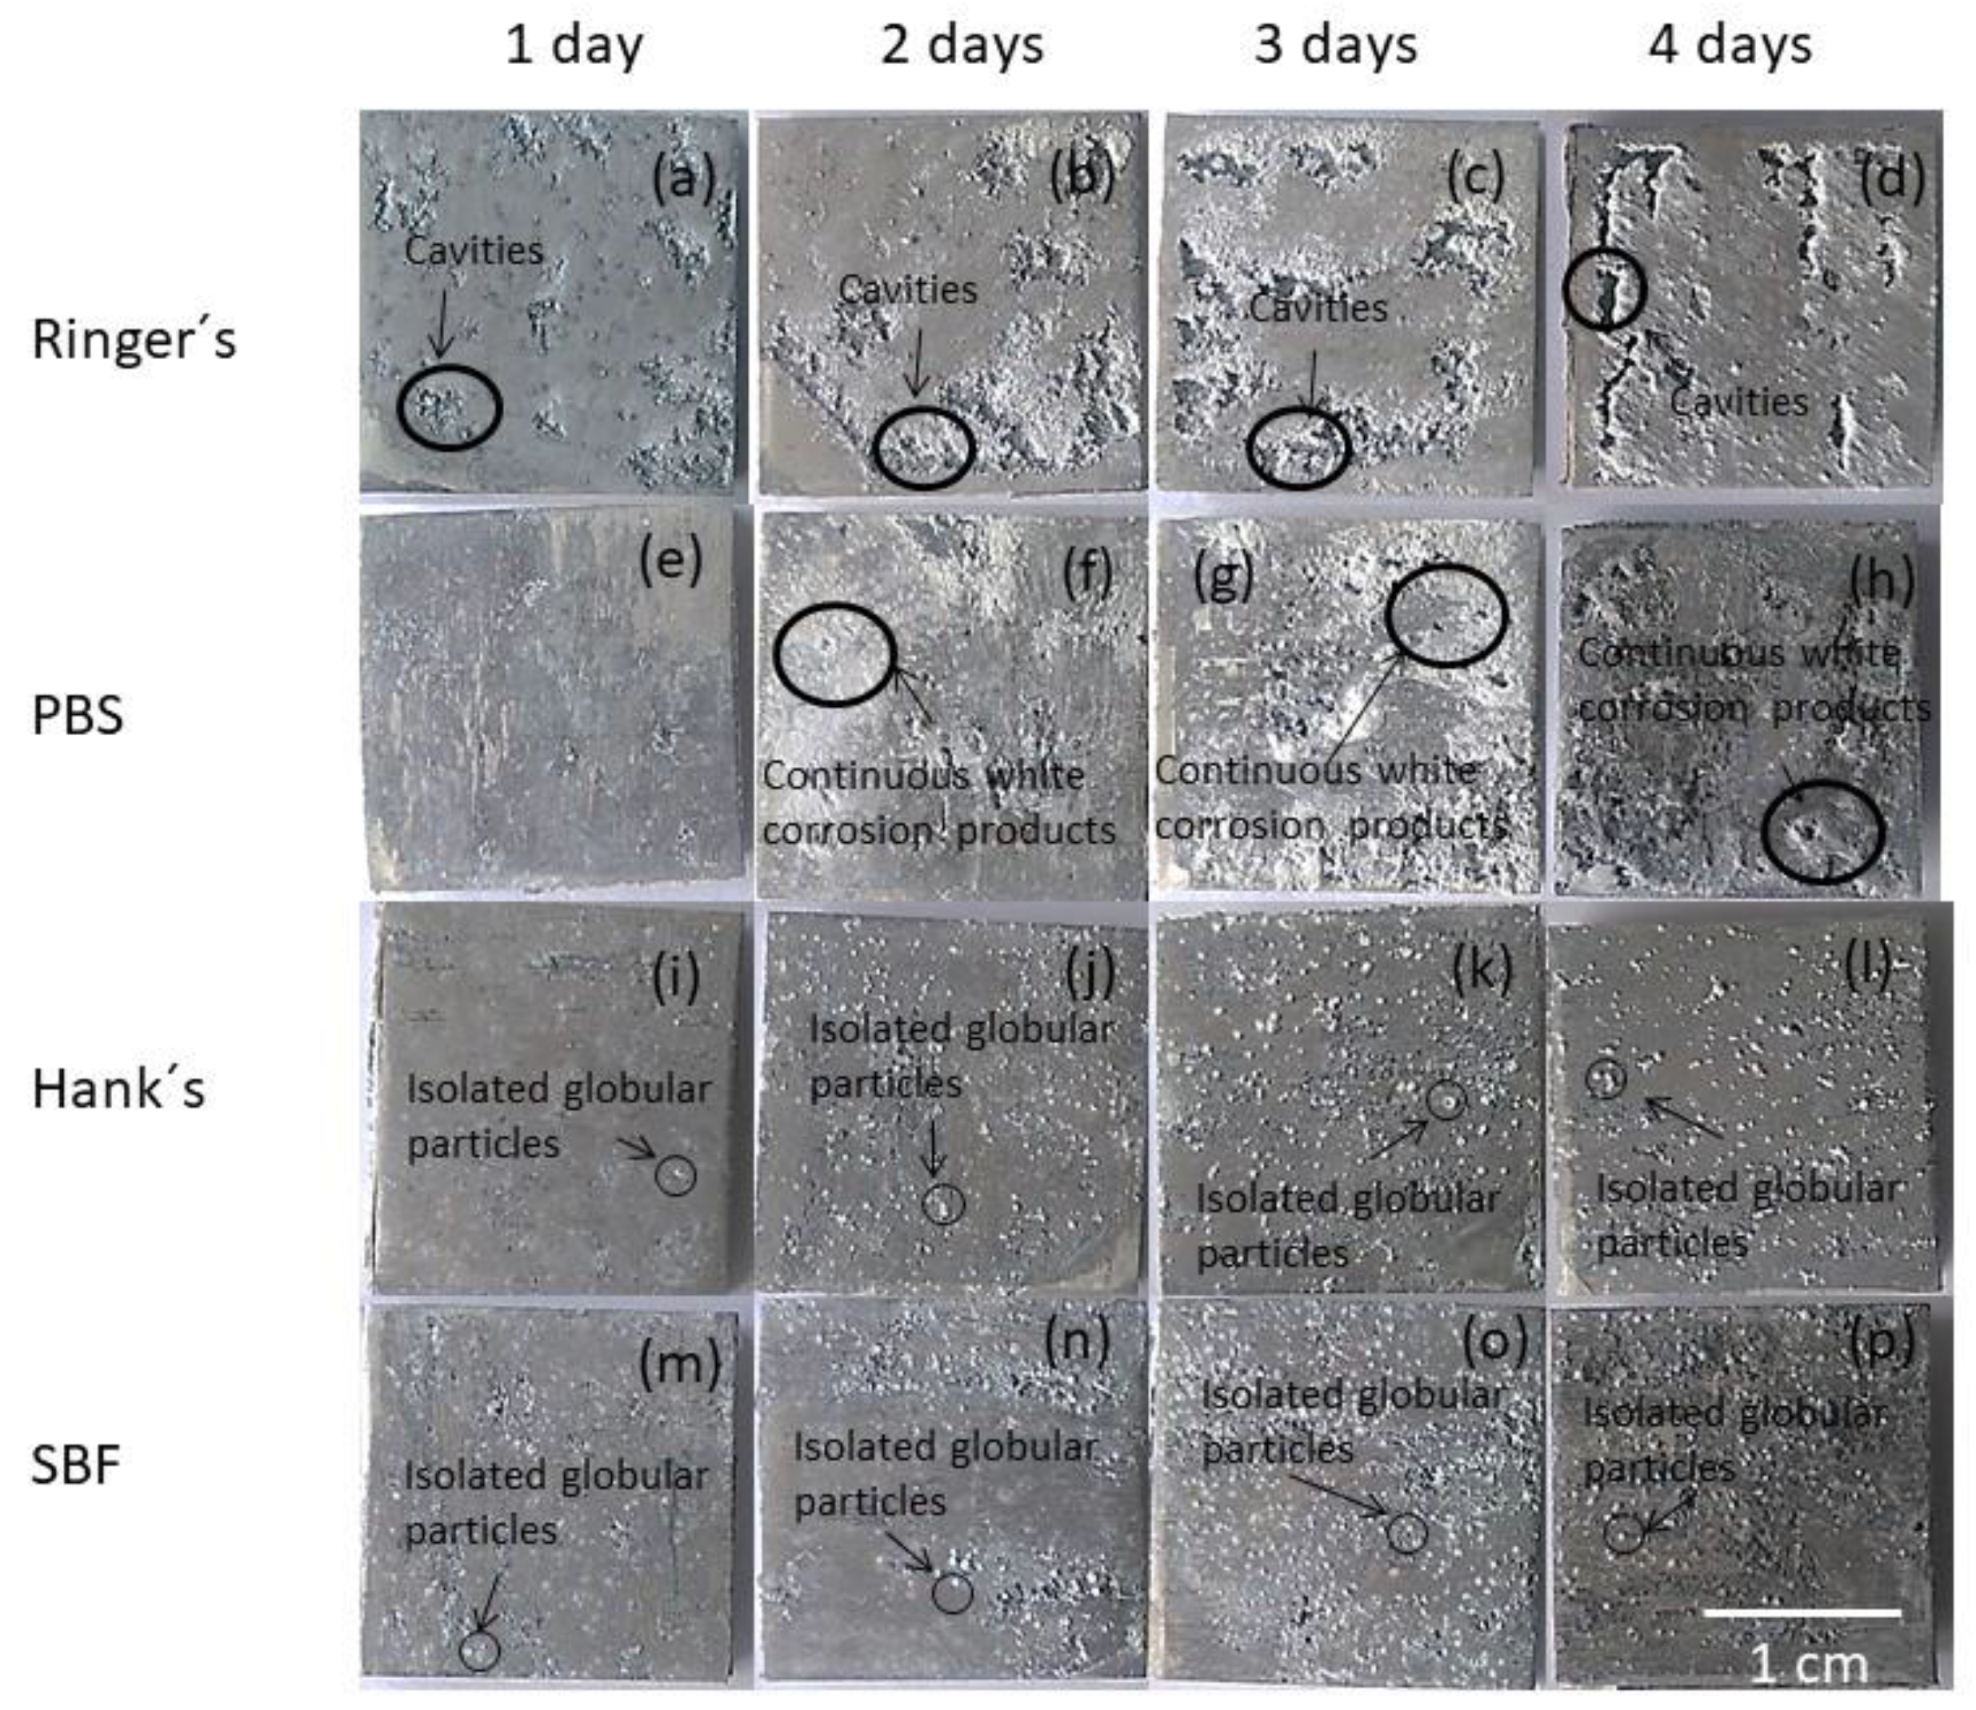
Figure 1. (ad) Surface appearance of the AZ31B specimens as a function of immersion time in Ringer’s; (eh) phosphate-buffered saline (PBS); (il) Hank’s, and (mp) simulated body fluid (SBF) solutions.
Metals 11 00391 g001
Figure 2. (ad) Surface appearance of AZ31B specimens as a function of immersion time in Ringer’s; (eh) PBS; (il) Hank’s, and (mp) SBF solutions, after removal of the corrosion products.
Metals 11 00391 g002
Figure 3. Time evolution of the corrosion rates of the AZ31B Mg alloy in Ringer’s, PBS, Hank’s, and SBF solutions at 37 °C obtained from weight loss measurements.
Metals 11 00391 g003
Figure 4. (ad) High-resolution O1s, (eh) Mg2p, (il) P2p, and (mp) Ca2p spectra obtained for AZ31B specimens after immersion in Ringer’s, PBS, Hank’s, and SBF solutions for 4 days.
Metals 11 00391 g004
Figure 5. Potentiodynamic polarization curves for the AZ31B Mg alloy specimens in Ringer’s, PBS, Hank’s, and SBF solutions at 37 °C. Scan rate was 1 mV/s. Typical data from replicated experiments are presented.
Metals 11 00391 g005
Figure 6. Typical Nyquist plots with respective fitting for AZ31B specimens after 1 h, 1 d, and 4 d of immersion at the open circuit potential (OCP) in (a) Ringer’s, (b) PBS, (c) Hank’s, and (d) SBF solutions. Samples had an exposed area of 0.78 cm2. Fitting results shown in Table 6.
Metals 11 00391 g006
Figure 7. Electrical equivalent circuit (EEC) used for fitting the experimental electrochemical impedance spectroscopy (EIS) data.
Metals 11 00391 g007
Figure 8. (a) Variations in polarization resistance (Rp) and (b) charge transfer resistance (Rt) values as a function of the immersion time in Ringer’s, PBS, Hank’s, and SBF solutions.
Metals 11 00391 g008
Figure 9. Charge values from weight loss measurements as a function of time-integrated reciprocal of the Rp values determined by EIS for AZ31B alloy from measurement in Ringer’s, PBS, Hank’s, and SBF solutions.
Metals 11 00391 g009
Figure 10. Charge values from weight loss measurements as a function of time-integrated reciprocal of the Rt values determined by EIS for AZ31B alloy from measurement in Ringer’s, PBS, Hank’s, and SBF solutions.
Metals 11 00391 g010
Table 1. Chemical composition of AZ31B magnesium alloy (X-ray fluorescence analysis).
ElementMgAlZnMn
wt.%95.83.01.00.2
Table 2. Chemical compositions of four standard electrolyte solutions: Ringer’s, PBS, Hank’s, and SBF.
NaClKClKH2PO4Na2HPO4·12H2OMgSO4·7H2OCaCl2NaHCO3MgCl2·6H2OC6H12O6
Ringer’s
(g/L) [27]
8.360.3---0.15---
PBS
(g/L) [2]
8.00.20.22.89-----
Hank’s
(g/l) [2]
8.00.40.060.060.060.140.350.11.0
SBF
(g/L) [2]
8.00.40.060.120.20.140.35
Table 3. Atomic percentage observed by XPS in the surface of the corrosion layer formed on alloys exposed to Ringer’s, PBS, Hank’s, and SBF solutions for 4 days of immersion.
Electrolyte SolutionOMgPCaCa/P
Ringer’s752500-
PBS66191500
Hank’s561013211.6
SBF57814211.5
Table 4. Variation of OCP values as a function of immersion time for AZ31B specimens in Ringer’s, PBS, Hank’s, and SBF solutions.
Solution
Time
OCP (VSCC)
1 h1 Day2 Days3 Days4 Days
Ringer’s−1.533−1.505−1.506−1.494−1.502
PBS−1.534−1.494−1.502−1.495−1.494
Hank’s−1.526−1.514−1.501−1.508−1.507
SBF−1.522−1.506−1.495−1.501−1.507
Table 5. Data from polarization curves of AZ31B Mg alloy in Ringer’s, PBS, Hank’s, and SBF solutions.
Ringer’sPBSHank’sSBF
Ecorr (VSCC)−1.48−1.45−1.38−1.47
icorr (µA cm−2)37184.35.1
βa (mV/dec)68.173.733.560.2
βc (mV/dec)173.9216.7204.2195.9
B (mV/dec)21.323.912.520.0
Table 6. Fitting results from EIS measurements for the AZ31B Mg alloy in Ringer’s, PBS, Hank’s, and SBF solutions after 1 h, 1 d, and 4 d of immersion. The EEC used for fitting is shown in Figure 7. Relative error for each parameter ≤ 5% and χ2 ≤ 1 × 10⁻³.
ElectrolyteRsCPEfCefffn1RfCPEdlCeffdln2RtRaLaRp
Time(Ω)(µS cm−2 sn1)(µF cm−2) (Ω cm2)(µS cm−2 sn2)(µF cm−2) (Ω cm2)(Ω cm2)(H cm2)(Ω cm2)
Ringer’s
1 h526.410.0430.643614.108.870.941309854391522
1 d593.970.0800.712517.9013.440.962072211530901053
4 d588.460.1330.682521.808.000.87178235953451203
PBS
1 h132.000.0130.6810218.6012.000.95232415691164953
1 d7411.900.1410.6233714.503.930.844242772518,2932875
4 d558.720.0460.6021419.201.940.752890495511171908
Hank’s
1 h537.310.0440.628711.002.940.8523201434370899
1 d692.310.0290.6810813.301.140.747719240232941838
4 d712.690.0490.706117.602.970.795717249241331741
SBF
1 h752.460.0850.731128.591.370.808535450753942963
1 d730.270.0260.8311613.700.710.7011,310780077914636
4 d840.180.0370.8811822.900.900.664524332318461937
Publisher’s Note: MDPI stays neutral with regard to jurisdictional claims in published maps and institutional affiliations.