Article

Corrosion Behavior and Osteogenic Activity of a Biodegradable Orthopedic Implant Mg–Si Alloy with a Gradient Structure

1
Engineering Research Centre for Waster Oil Recovery Technology and Equipment of Ministry of Education, Chongqing Technology and Business University, Chongqing 400067, China
2
College of Materials Science and Engineering, Chongqing University, Chongqing 400045, China
3
Chongqing Key Laboratory of Vanadium-Titanium Metallurgy and Advanced Materials, Chongqing 400045, China
*
Author to whom correspondence should be addressed.
Metals 2021, 11(5), 781; https://doi.org/10.3390/met11050781
Submission received: 9 April 2021 / Revised: 5 May 2021 / Accepted: 6 May 2021 / Published: 11 May 2021
(This article belongs to the Special Issue Corrosion Behavior of Magnesium Alloys)

Abstract

:
A gradient Mg-8 wt % Si alloy, which was composed of the agglomerated Mg2Si crystals coating (GMS8-1) and the eutectic Mg–Si alloy matrix (GMS8-2), was designed for biodegradable orthopedic implant materials. The bio-corrosion behavior was evaluated by the electrochemical measurements and the immersion tests. The results show that a significant improvement of bio-corrosion resistance was achieved by using the gradient Mg–Si alloy, as compared with the traditional Mg-8 wt % Si alloy (MS8), which should be attributed to the compact and insoluble Mg2Si phase distributed on the surface of the material. Especially, GMS8-1 exhibits the highest polarization resistance of 1610 Ω, the lowest corrosion current density of 1.7 × 10⁻⁶ A·cm−2, and the slowest corrosion rate of 0.10 mm/year. In addition, GMS8-1 and GMS8-2 show better osteogenic activity than MS8, with no cytotoxicity to MC3T3-E1 cells. This work provides a new way to design a gradient biodegradable Mg alloys with some certain biological functions.

1. Introduction

Magnesium (Mg) and its alloys are promising biodegradable materials for metallic implants, which have gained great interest from the bio-medical field [1,2]. The most critical question for the clinical application of Mg alloys is to control the degradation rate, because Mg belongs to chemically active elements and can be dissolved quickly in the physiological environment. Thus, many methods including coatings [3,4,5,6,7,8,9] have been tried widely. Moreover, the selection of an appropriate alloying element to retard the degradation of the Mg alloys has attracted increasing attention in the last decades [10].
Silicon (Si) is an indispensable trace element in the human body. It can promote the healing process of wound bone tissues and improve the immune system [11,12]. Mg-1 wt % Si alloy extract was reported to significantly promote the osteoblastic cell viability [13]. Thus, it should be promising if the Mg–Si alloys can be used as the degradation biomedical materials for the good biological functions of Si. However, the addition of Si can result in the generation of a secondary phase, e.g., Mg2Si. The higher potential of the secondary phase leads to formation of the micro-galvanic cells between Mg2Si and the adjacent matrix, which makes Mg2Si served as the initial site of localized corrosion and accelerates the corrosion process of Mg alloys in simulated body fluid (SBF) [14].
In the last decades, many efforts have been made to clarify the relationship between the secondary phases and the corrosion behavior. The influences of the morphology, size and distribution of the secondary phases on the corrosion performance of the alloys have been investigated [15,16]. Amirnejad et al. [17] and Ben-Hamu et al. [18] studied the effect of Mg2Si morphology on the corrosion behavior. They suggested that Mg2Si phases with large Chinese script shape accelerated the corrosion process, while the ones with the polygonal shape hindered it. Simultaneously, Ben-Hamu et al. [18] also pointed out that the former morphology can be transformed into the latter one when the Si addition increased to above 1 wt %, thereby improving the corrosion resistance of the alloy. Additionally, Srinivasan et al. [19] found that fine and evenly distributed Mg2Si intermetallics of polygon shape inhibited the corrosion effectively and Zhang et al. [20] reported that a small amount of Zn and Ca addition can refine and modify the morphology of Mg2Si, which may improve the corrosion resistance. Although these attempts have obtained some achievements, the degradation rate of Mg–Si alloys still cannot meet the requirement of orthopedic implant materials.
Besides the modification methods mentioned above, some other techniques have also been tried to decrease the degradation rate with outstanding results [21,22,23]. Among them, the coating technology has attracted more attentions because a corrosion barrier can form on the surface of the alloy matrix. For example, Kaseem et al. [24] developed a highly compact coating on the surface of Al–Mg–Si alloy employing a plasma electrolytic oxidation (PEO) method. They found that the main reason for this coating to eliminate corrosion should be attributed to that the insoluble compounds of SiO2 and AlF3 were incorporated uniformly throughout the coating. Additionally, Chen et al. [25] created a porous and rough Si-containing coating on the surface of the Mg-Zn-Ca bulk metallic glass (BMG) by using the micro-arc oxidation (MAO) technique. The results indicated that corrosion resistance of BMG specimens was significantly improved. These works implied that a surface modification of the magnesium alloys can result in great enhancement of the corrosion resistance and substantially decrease the degradation rate. However, it should be pointed out that most of the created coatings through the surface treatment method were not very stable, and therefore their long-term corrosion resistances were unsatisfactory. Considering that the biodegradation bone implant materials must suffer the complexity environment of human body and take a long-term service, a more stable and better corrosion-resistant coating are still expected.
In order to make use of the good biocompatibility of Mg–Si alloys as well as to solve the problem of high degradation rate caused by the secondary phase, an Mg2Si/Mg gradient composite was produced in our previous work [26] by using the electromagnetic solidification technology. The coarse Mg2Si phases in the alloys were successfully agglomerated and precipitated on the surface of the Mg matrix because of the electromagnetic force. The results show that the net-like Mg2Si-rich coating layer on the surface of the Mg matrix can be served as a stable corrosion barrier and can significantly reduce the corrosion rate. Thus, the produced Mg2Si/Mg gradient composite would be a promising candidate for biodegradation bone implant. However, our previous work focused mainly on the corrosion resistance of the composite material, the control mechanism of the degradation rate was not discussed thoroughly. Additionally, the effect of this material degradation on bone growth and healing has not been clarified yet. Therefore, it is necessary to do a further work to control the degradation rate and understand interactions between the biodegradable material and the osteoblasts.
In this paper, a gradient alloy with the initial composition of Mg-8 wt % Si was produced firstly by using the electromagnetic directional solidification. Then the microstructure, bio-corrosion properties and biocompatibility as well as osteogenic activity of the alloy were investigated. Moreover, osteogenic response of osteoblasts co-cultured with the alloy extracts was evaluated.

2. Materials and Methods

2.1. Material Preparation

Gradient Mg-8 wt % Si alloy and conventional Mg-8 wt % Si alloy were prepared by using 0.78 g high-purity Mg (99.98 wt %) pellets and 8.98 g high-purity silicon (99.99 wt %) powders as the raw materials, and then they were mixed and melt in a high-purity graphite crucible (outer diameter = 26 mm; inner diameter = 20 mm; depth = 90 mm). In order to obtain the gradient alloys, an electromagnetic solidification apparatus was employed, and the schematic diagram is shown Figure 1. Before sample heating, the air in the quartz chamber of the furnace was pumped out by a vacuum pump, and then the high purity argon gas (99.999%) was refilled to the chamber in order to avoid the oxidation of Si and Mg at high temperatures. After that, the alloys were completely melted in a graphite crucible at 1223 K after 30 min heating. Then the graphite crucible was cooled by pulling downward (pulling velocity was 10 μm/s) to prepare the gradient Mg-8 wt % Si alloy, while conventional Mg-8Si (wt %) alloy was obtained by natural cooling without pulling down the crucible.

2.2. Microstructure Characterization

The solidified specimens were cut into two halves along the cross section. One half was ground by SiC sandpaper and polished by diamond grinding paste, and then it was ultrasonically cleaned and dried in cold air. Finally, microstructures of the solidified specimens were observed via an Axiovert 40 MAT optical microscope (OM, Precise, Beijing, China) and a scanning electron microscope (SEM, VegaIII LMU/LMH, TESCAN, Brno, Czech Republic) equipped with energy dispersive X-ray spectrometry (EDS, Oxford Instrument INKAx-sight; Oxford Instrument, Oxford, UK). The phase identification of the samples was studied by X-ray powder diffraction (XRD, Rigaku D/MAX-2500PC, Rigaku, Tokyo, Japan) analysis with Cu Kα radiation (λ = 0.154 nm, 40 kV, 150 mA) at a scan rate of 0.3 °/s. The obtained XRD patterns were analyzed by MDI Jade 6.5 software (MDI, Burbank, CA, USA). The other half was dealt with for other tests.

2.3. Bio-Corrosion Tests

2.3.1. Electrochemical Measurements

Each specimen was processed to the cylindrical shape with a diameter of 3 mm and then they were mounted in self-curing denture acrylic. The electrochemical measurement was carried out in a traditional three-electrode cell of the CS350H electrochemical workstation by setting the temperature of the phosphate buffer solution (PBS), which consists of KH2PO4, Na2HPO4, NaCl and KCl, at 37 ± 0.5 °C. Saturated calomel electrode as reference electrode, platinum electrode as counter electrode, with the self-made sample form a three electrodes system. After an open circuit potential (OCP) test for 30 min, the potentiodynamic polarization curves and Nyquist plots were performed, respectively. Noting that the impedance electrochemistry tests were performed at the OCP. The polarization curves were fitted by CorrView software (Wuhan CorrTest co. LTD., Wuhan, China) in polarization resistance (Rp) mode and the Nyquist plots were analyzed by Zsimpwin 3.0 software (Princeton applied research, Princeton, NJ, USA). Three replicates were conducted to ensure the reproducibility of each test.

2.3.2. Immersion Test

In terms of ASTM-G31-72 [27], specimens of Φ 3 × 10 mm were immersed in PBS with the ratio of 50 mL/cm2 (solution volume/surface area). During the 7 day immersion, the pH value of the solution was measured by a pH meter (PHS-3C). Then, the specimens with corrosion products were fetched out to be examined by a scanning electron microscopy (SEM) equipped with an energy dispersive X-ray spectrometer (EDS). After that, the specimens were cleaned chemically in solution (200 g/L of chromic acid and 10 g/L of AgNO3) for 10 min. The specimens were weighed before and after the immersion to get the mass loss rate V (mm/y), which was calculated according to the following equation [26]:
V = Δ W / K ρ St
where K is a constant (equals to 8.76 × 10⁴), ΔW is the mass loss (g), S is the exposed surface area (cm2), t is the immersion time (h), and ρ is the density of the material (g/cm3).
Finally, the cleaned corroded surfaces of the specimens were characterized by SEM again. Three replicates were conducted for the reproducibility of each test.

2.4. Biological Test

2.4.1. Cytotoxicity Test

The pre-osteoblast MC3T3-E1 cells (ATCC CRL-2593) were cultured in Dulbecco’s modified Eagle’s medium (DMEM) with 10% fetal bovine serum (FBS), 100 μL/mL penicillin and 100 mg/mL streptomycin in a humidified atmosphere of 5% CO2 at 37 ± 0.5 °C. The extracts of specimens were prepared in the DMEM serum free medium, with a ratio of 1.25 cm2/mL (surface area/ medium volume). After 7 days incubation, the withdrawn supernatant was centrifuged to get the extraction, which was then diluted serially to 10%, 30% and 50% concentration. Herein, DMEM was used as negative control group. Cells of an initial density of 5 × 10³ cells/well were incubated in 96-well plates with 100 µL DMEM for 24 h to ensure attachment. Then the medium was replaced with the prepared extracts. After incubating the cells for 3 days, 100 µL cell counting kit (CCK-8) was added and the cells continued to be incubated for 6 h. Finally, the absorbance was measured by spectrophotometer (Bio-RAD 680, Bio-rad, Berkeley, CA, USA) at 490 nm, and the corresponding relative growth rate (RGR) of cells was calculated by the following equation (OD represents optical density):
R G R = O D t e s t O D c o n t r o l
where ODtest is the optical density of the cells co-cultured with extracts, ODcontrol is the optical density of the cells cultured in DMEM.
The cells co-cultured with 10% extracts were then studied by immunofluorescence technique. Meanwhile, the ion concentrations of the 10% diluted extracts were measured by an inductively coupled plasma optical emission spectrometry (ICP-OES, Optima 8000, PerkinElmer, Waltham, MA, USA).

2.4.2. Osteogenesis Test

The osteogenesis activity was evaluated by the method of alkaline phosphate (ALP) staining. The exponentially growing MC3T3-E1 cells were trypsinized and seeded into a 6-well plank with 1 × 10⁵ cells per well. Then the cells are continuously observed, and co-cultured with 7 days extracts for 7 days. By the time, the cells were fixed with 4% paraformaldehyde and kept in a refrigerator at 4 °C for 30 min. Then the cells were washed with PBS three times for 3 min. After that, the washing solution was removed and then the staining solution was added according to the description of the ALP reagent box. The cells were subsequently incubated at room temperature in the dark for 30 min. By then the staining solution was removed and the cells were washed with distilled water. Finally, the residue liquid was removed and then the staining test was completed.

3. Results

3.1. Macro Appearance and Microstructures

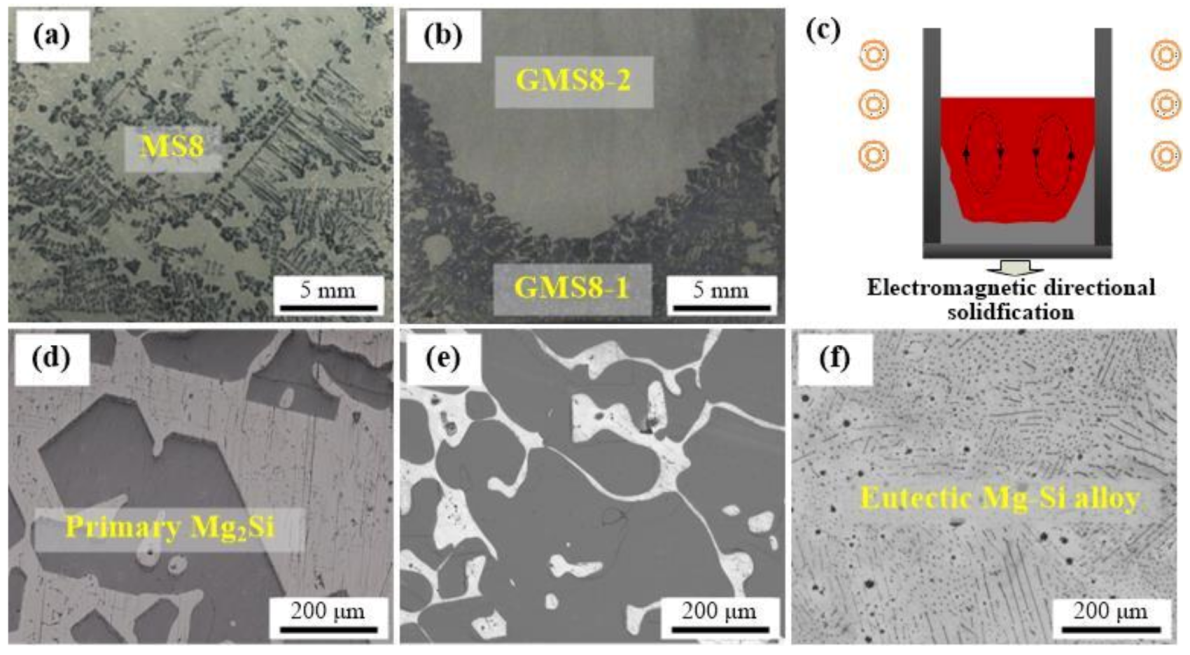
The macro appearances in longitudinal direction for solidified ingots were characterized, and the results are shown in Figure 2a,b. Conventional Mg-8 wt % Si alloy without gradient structure was denoted as MS8. Gradient Mg-8 wt % Si alloy consists of two different parts. The lower one is the agglomerated Mg2Si crystals and upper one is the eutectic Mg–Si alloy, which was denoted as GMS8-1 and GMS8-2, respectively. The agglomeration schematic diagram of Mg2Si crystals can be shown in Figure 2c. The primary Mg2Si crystals precipitated first at the bottom of the crucible during the electromagnetic directional solidification process, which was consistent with the analysis of the Mg–Si phase diagram [28]. Next, the eutectic Mg–Si alloy phase of low melting point was solidified later at the upper part of the crucible. Consequently, a gradient structure formed as shown in Figure 2b. The specimens for tests were prepared from MS8, GMS8-1 and GMS8-2, respectively. Figure 2d–f shows the microstructures of the solidified specimens. It can be seen from Figure 2d that the primary Mg2Si with a dendritic morphology was randomly distributed in the Mg matrix for the conventional Mg-8 wt % Si (MS8). However, GMS8-1 exhibited continuous polygonal primary Mg2Si with a little bit of eutectic structure clearly (as shown in Figure 2e), and GMS8-2 was composed of eutectic Mg2Si and Mg matrix (as shown in Figure 2f). Moreover, the connected polygonal primary Mg2Si for GMS8-1 formed like a network, which resulted from the existence of gradient temperature. The detailed formation reason was clarified in our previous work [26].

3.2. Bio-Corrosion Behavior

3.2.1. Electrochemical Corrosion Behavior

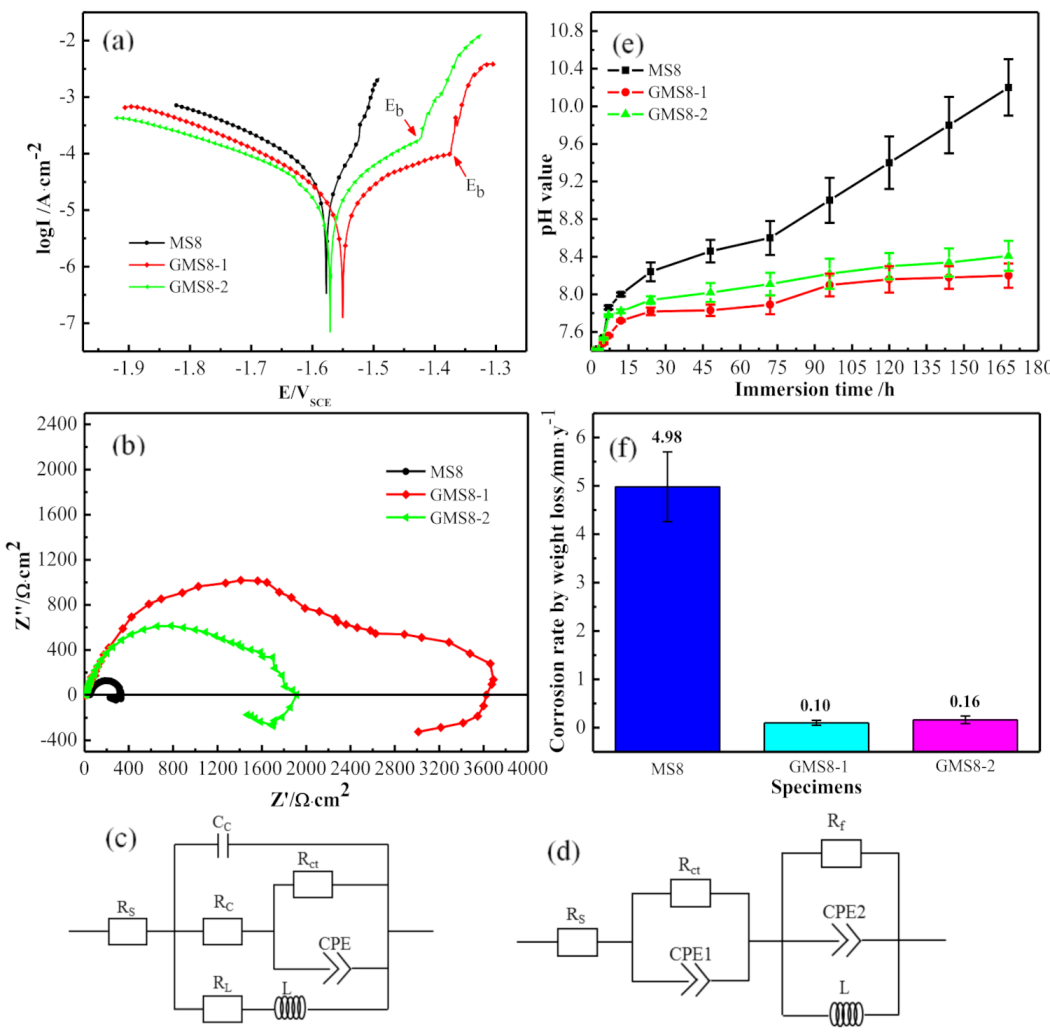
The fluctuating of OCP reflect the potential change of the electrode surface in electrolyte without any externally applied voltage. Kania [29] reported that the testing time of OCP was set to 60 min. Hamid [7] measured OCP against the time of 30 min. The main reason should be attributed to the difference of electrode materials and electrolyte, resulting in the variation of time for the OCP becoming relatively stable in the experiment. In this work, the OCP of samples was performed for 30 min. The potentiodynamic polarization curves for specimens MS8, GMS8-1 and GMS8-2 were directly analyzed by software CorrView, respectively, and the results were shown in Figure 3a. The fitted parameters were listed in Table 1 with some typical biodegradable Si-containing Mg alloys from literatures [17,20]. From Table 1, it is obvious that the corrosion current densities (Icorr) of GMS8-1 and GMS8-2 were much lower than that of MS8, and the typical Si-containing Mg alloys (Mg-6Al-1Zn-1Si and Mg-0.6Si) lie between them. Especially, GMS8-1 presents the lowest Icorr of 1.7 × 10⁻⁶A·cm−2 with the largest Rp of 1.61 × 10³ Ω. It is well known that second phases always play a dual role in the corrosion process of alloys [14,30]. Generally, second phases possess more positive electrode potential than the matrix in Mg alloys and usually act as cathodes to accelerate the corrosion. However, if the positive second phases can connect each other together in a net-like structure, it could act as barriers to resist the corrosive ions attacking [31,32,33]. Herein, the connected big primary Mg2Si phases of GMS8-1 happens to act as barriers and hinder the corrosive ions interpenetrating. Thereby the polarization resistance (Rp) has been improved and the corrosion current decreased. Moreover, the self-corrosion potential (Ecorr) of the three specimens is close to each other. It is worth noting that the obvious break potential (Eb) presented on the anodic branches of GMS8-1 and GMS8-2, indicating that the formed protective film was damaged at that time. The more positive Eb was, the denser the film was. GMS8-1 shows a more positive Eb than GMS8-2 because of the dense netlike structure of Mg2Si phase.
As the Nyquist plots (Figure 3b) shown, MS8 only has a high frequency capacitor loop while the specimens GMS8-1 and GMS8-2 still have another intermediate frequency capacitor loop. Moreover, all of the three specimens have an inductive arc. The radius of the capacitive loop at high frequency determines the corrosion resistance of charge transfer. The largest radius of high-frequency loop for GMS8-1 suggests that it is the most difficult to dissolve in solution. Meanwhile, the smallest loop radius of MS8 means that it dissolves at the fastest rate in solution. As for the intermediate frequency loop, the arc was associated with the protective properties of the oxide film formed on the surface of alloys [34,35,36]. The larger arc implies better protective property of the oxide film. Larger arc for GMS8-1 than that for GMS8-2 means the oxide film is more protective on GMS8-1. As for MS8, no intermediate frequency loop implies that no protective oxide film formed. For Mg alloys, the corrosion products are mainly Mg oxide and (or) Mg hydroxide, which are too porous and loose to offer protection. The corrosive ions like Cl can easily penetrate the corrosion products film and reach the matrix. Hence, the localized corrosion occurs and it is correlated with the low frequency inductive loop. This is the reason that all of the three specimens show a low frequency inductive arc. However, the change of the microstructure of GMS8-1and GMS8-2 may influence the protective property of the oxide film, which might be the reason why GMS8-1and GMS8-2 show much higher bio-corrosion resistances than MS8.
In order to further quantify the corrosion characteristics of the Nyquist plots, the equivalent circuit models shown in Figure 3c,d were fitted by Zsimpwin 3.0 software, and the fitted parameters are listed in Table 2. The value of Chisq proves the validity of the equivalent circuit models.
Rs represents the solution resistance. In Table 2, Rs of MS8 is much higher than GMS8-1 and GMS8-2, which means the composition of solution is not that stable. It might be caused by the faster degradation of MS8. Rct is the charge transfer resistance caused by the electric double layer capacitance between the specimen surface and the electrolyte during the electrochemical reaction. Compared to MS8, the larger value of Rct for GMS8-1 and GMS8-2 implies that the charge transfer process is more difficult to occur. That is to say, GMS8-1 and GMS8-2 are more difficult to degrade than MS8. CPE represents the constant phase angle component of the electric double layer capacitor. Rf stands for the oxide film resistance which can judge the protective property of surface film for Mg matrix. Herein, it is easy to see there is no protective film generated above the surface of MS8, for the lack of Rt data. The data of Rt for GMS8-1 and GMS8-2 shows both of them can form a protective film on the surface after immersion. The higher Rt of GMS8-1 implies the more protective film produced on the surface. Cc and Rc represent the capacitance and resistance of this corrosion product layer. L is the inductive reactance at low frequency, representing susceptibility to local corrosion. The higher Rct and Rf of GMS8-1 and GMS8-2 than that of MS8 in Table 2 indicates the higher corrosion resistance. The charge transfer resistor Rct in parallel with the electric double layer capacitor is a very important parameter and it is an effective resistance for the corrosive ions to pass through the electric double layer to reach the surface of the specimens. Furthermore, a larger Rf means the oxide film formed is more resistant to corrosion. In particular, GMS8-1 presents the highest value of Rct and Rf, which means the largest corrosion resistance, similarly with the results from polarization curves. Differently, MS8 cannot form a protective oxide film on the surface, so it is the easiest to corrode in solution.

3.2.2. Static Immersion Corrosion Behavior

The pH variation of PBS with specimens during 7 days immersion and the corrosion rates of the specimens for 7 days by mass loss method are shown in Figure 3e,f, respectively. In the first 12 h, the pH value increased rapidly, and then it climbed up slowly (as shown in Figure 3e). The value of pH is dependent on the concentration of OH, which is produced by the reaction of Mg dissolution. The highest pH value for MS8 suggests that Mg dissolves at the fastest rate. The lowest pH value for GMS8-1 means the slowest corrosion rate. This phenomenon is demonstrated further by the mass loss rate (as shown in Figure 3f). Among the investigated specimens, MS8 presents the highest corrosion rate of 4.98 mm/year, while GMS8-1 shows the lowest corrosion rate of only 0.10 mm/year and GMS8-2 shows the second corrosion rate of 0.16 mm/year.
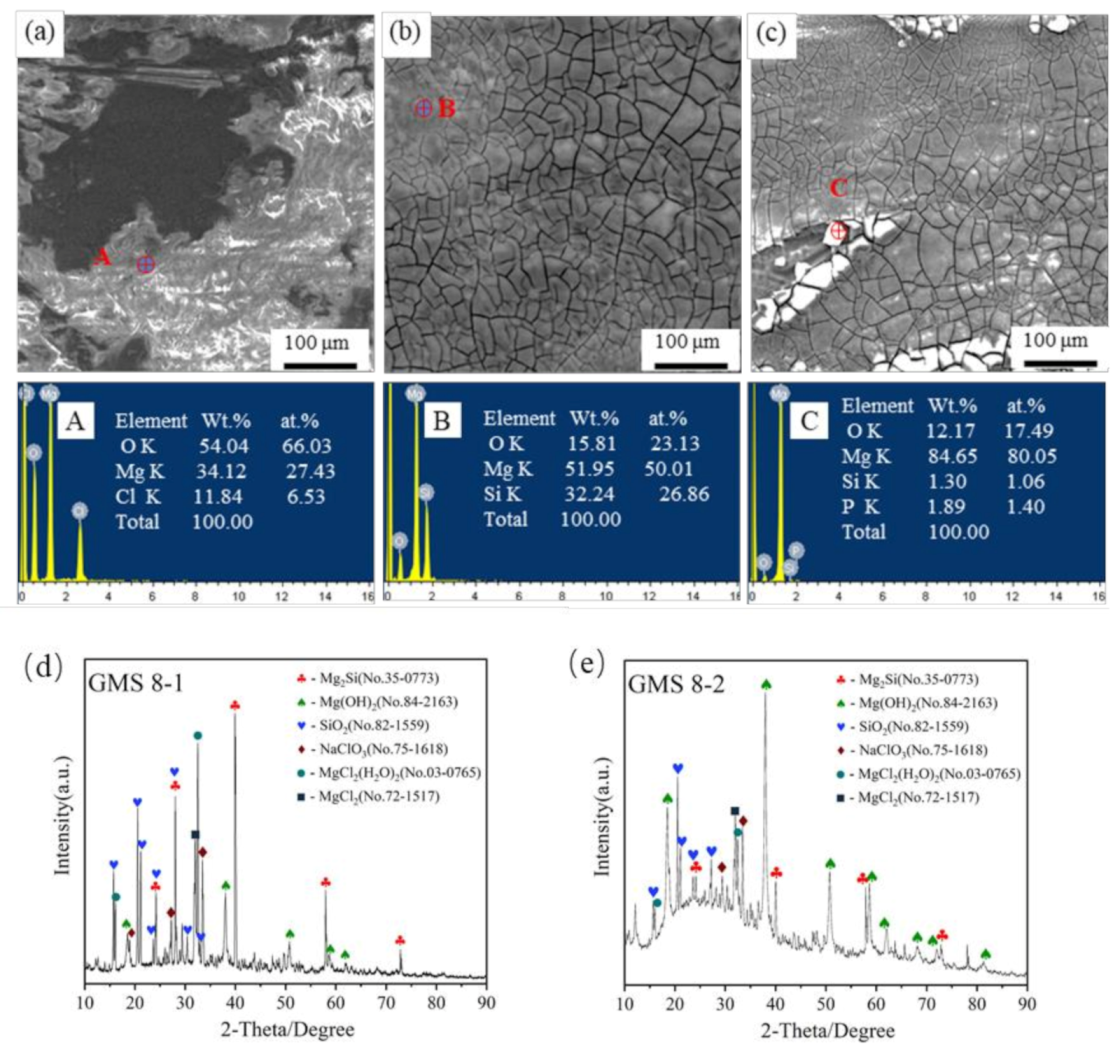
To better clarify the origins of the corrosion behaviors, the morphology of 7 days corroded specimens was observed and analyzed by SEM-EDS (as shown in Figure 4). The surface of MS8 is covered by lots of corrosion products with a rough topography. The chemical composition of point A is analyzed by EDS and the result shows that it is composed of O, Mg and Cl. This indicates that the corrosion products are mainly MgO, Mg(OH)2 and MgCl2, all of which are loose and porous. This character determines that the product film is not protective. Unlikely, the surfaces of GMS8-1 and GMS8-2 are covered with more uniform, denser, and thinner corrosion products films. The EDS result of point B shows the corrosion product on GMS8-1 mainly consists of O, Mg and Si, which implies that it might be MgO, Mg(OH)2 and SiO2. As for point C, it is made up of O, Mg, Si and P, which means it might be MgO, Mg(OH)2 and SiO2 and some phosphate. To confirm this, the corrosion products on the surface of GMS8-1 and GMS8-2 were examined by X-ray powder diffraction (XRD) analysis and the patterns are shown in Figure 4d,e, respectively. It shows that the corrosion products mainly composed of Mg(OH)2 and SiO2. The diffraction peaks of Mg(OH)2 in GMS8-2 is much higher than that in GMS8-1, while the peaks of SiO2 and Mg2Si phase in the former are much stronger than those in the latter. This result agrees well with the conclusion of the above analysis. That is to say, much less generation of Mg(OH)2 in GMS8-1 means Mg is more difficult to degrade. Therefore, it should be concluded that the larger the proportion of Mg2Si, the greater the bio-corrosion resistance.
As is well known that the Pilling–Bedworth (P-B) ratio of SiO2 is 2.27 [17], which could improve the density of the corrosion product film. This partly explains why GMS8-1 and GMS8-2 show better bio-corrosion resistance than MS8. Moreover, higher ratio of SiO2 in the products of GMS8-1 makes it possess larger bio-corrosion resistance, and GMS8-1 displays the largest bio-corrosion resistance.
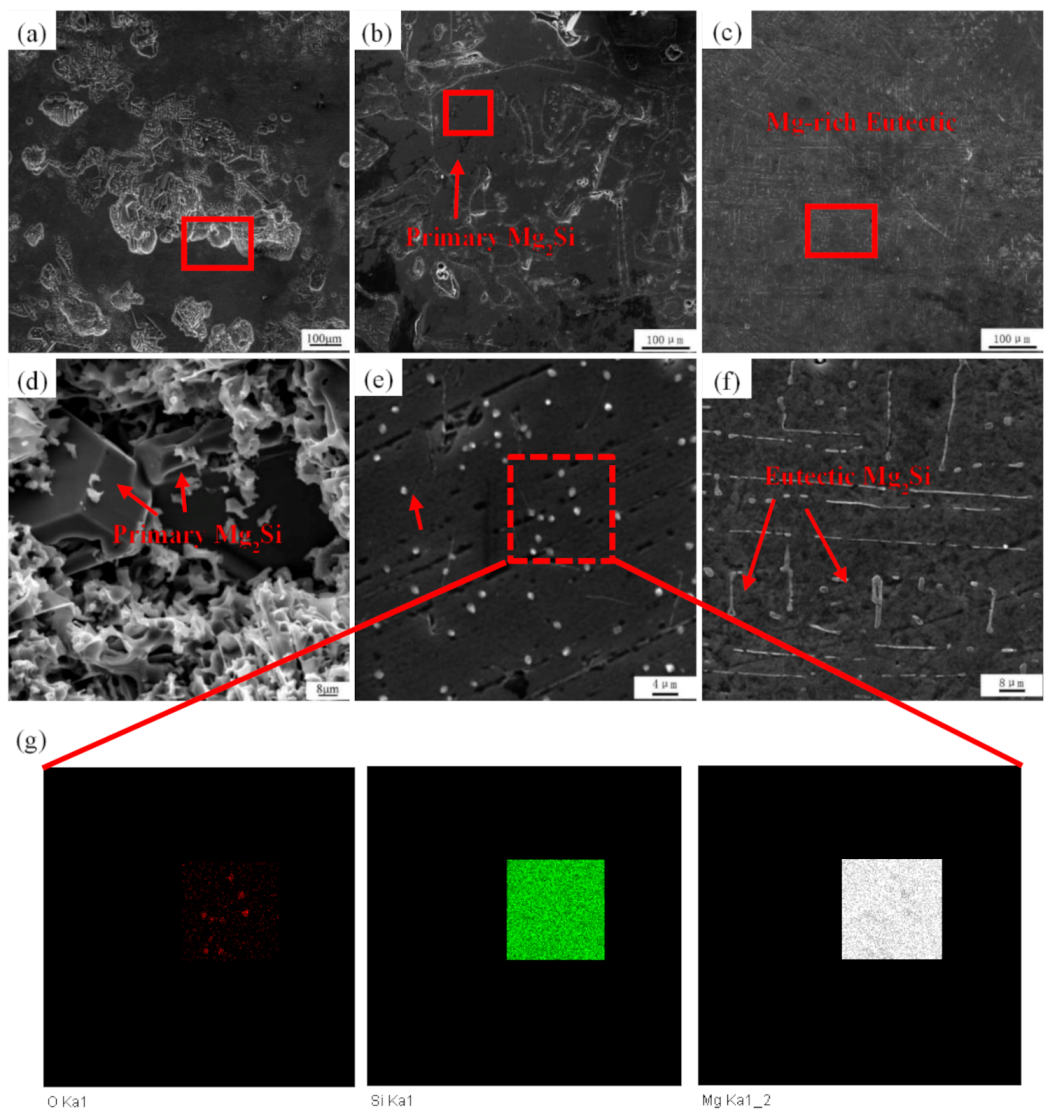
In order to elucidate the corrosion process more directly, corrosion products are chemically removed (as shown in Figure 5). The surface of MS8 is quite seriously corroded (as shown in Figure 5a), while GMS8-1 and GMS8-2 remain relatively flat with no obvious pitting pits. From the enlarged views of the corroded surface of MS8 (as shown in Figure 5d), corrosion around the second phase Mg2Si is more severe compared with other areas. It should be pointed out [17] that the electrode potential of Mg2Si phase is higher than Mg matrix. The micro-galvanic corrosion formed between Mg2Si and Mg matrix can accelerate the corrosion. The Mg2Si phases in MS8 are distributed dispersedly, the existence of Mg2Si phases can only play the role of accelerating the galvanic corrosion. Conversely, the distribution of Mg2Si phases in GMS8-1 and GMS8-2 (see Figure 5b,c) were adjusted by directional solidification, which resulted in a network of primary Mg2Si in GMS8-1 and randomly distributed fine eutectic Mg2Si in GMS8-2. This significant change in structure results in substantial enhancement of bio-corrosion resistance. For GMS8-1, the big polygonal primary Mg2Si connected to form a net can act like a corrosion barrier to hinder the corrosion process and Mg2Si itself is difficult to react with solution. Moreover, in the enlarged views, a lot of spherical white particles are presented on the surface (Figure 5e). The fine white spherical particles composed of Si and O, which can be concluded as SiO2 by the EDS result (see Figure 5g). SiO2 itself is not only insoluble in solutions, but also can improve the compactness of the corrosion product film [37]. Si participating in the corrosion film formation can also contribute to resist the corrosion attack. All these factors mentioned above are in favor of the enhancement of bio-corrosion resistance. As for GMS8-2, the eutectic Mg2Si is fine and numerous (Figure 5f), the micro-galvanic corrosion occurred reasonably slightly and uniformly. It explains well that GMS-1 possesses the best bio-corrosion resistance in the present investigation. Moreover, the bio-corrosion resistance of the samples can be ranked as: GMS8-1 > GMS8-2 > MS8.

3.3. Cytotoxicity Evaluation

The cell viability (Figure 6a) of MC3T3-E1 cells co-cultured in the negative control group, MS8, GMS8-1 and GMS8-2 extractions for 3 days shows that all the 10%, 30% and 50% extracts from GMS8-1 and GMS8-2 exhibit higher cell viability than the control group and the cytotoxicity is of grades 0–1 [38]. Cell viability is always connected to the ion concentrations in the co-culture medium [39,40]. The concentration of Mg and Si ions released in 7 days extracts were shown in Figure 6b. The Si ions in solution for GMS8-1 and GMS8-2 are only 0.012 and 0.019 mg/L, respectively. As low content of Si ion in physical environment is reported to promote injured bone healing [41], the trace amount Si ions released by GMS8-1 and GMS8-2 involves positive influence on cells. Moreover, Mg ions released always bring about promoting effects on cell growth [42,43,44]. Witte [41] reported that appropriate magnesium concentration could lead to bone cells activation. The concentrations of Mg ions are of 0.098 mg/L for GMS8-1, and 0.218 mg/L for GMS8-2, much lower than 3.800 mg/L for MS8. One thing that should be mentioned is that higher release of Mg ions definitely goes with the larger amount of OH, which will result in a bad effect on cell growth. Therefore, it is concluded that higher Mg ion and Si ion in 30% and 50% MS8 extraction reduced the cell viability, and the trace amount Si ions and Mg ions released by GMS8-1 and GMS8-2 are the basic reason for the higher cell viability.
The morphologies of MC3T3-E1 cells co-cultured with 10% extracts were characterized by immunofluorescence microscope in Figure 6c–e. All the cells adhere, grow and proliferate normally in vitro, in basically uniform spindle-shaped or star-shaped. The small blue spheres dispersed are cell nuclei, the number of which are the largest for GMS8-1. Next comes GMS8-2, and finally MS8. It demonstrates GMS8-1 exhibits the best proliferation and the highest activity to MC3T3-E1 cells, compared with GMS8-2 and MS8, which leads to the good effect on the enhancement of new bone formation and stable bone growth [45]. Therefore, GMS8-1 and GMS8-2 specimens are deserved for further study as promising orthopedic implant materials.

3.4. Osteogenic Activity

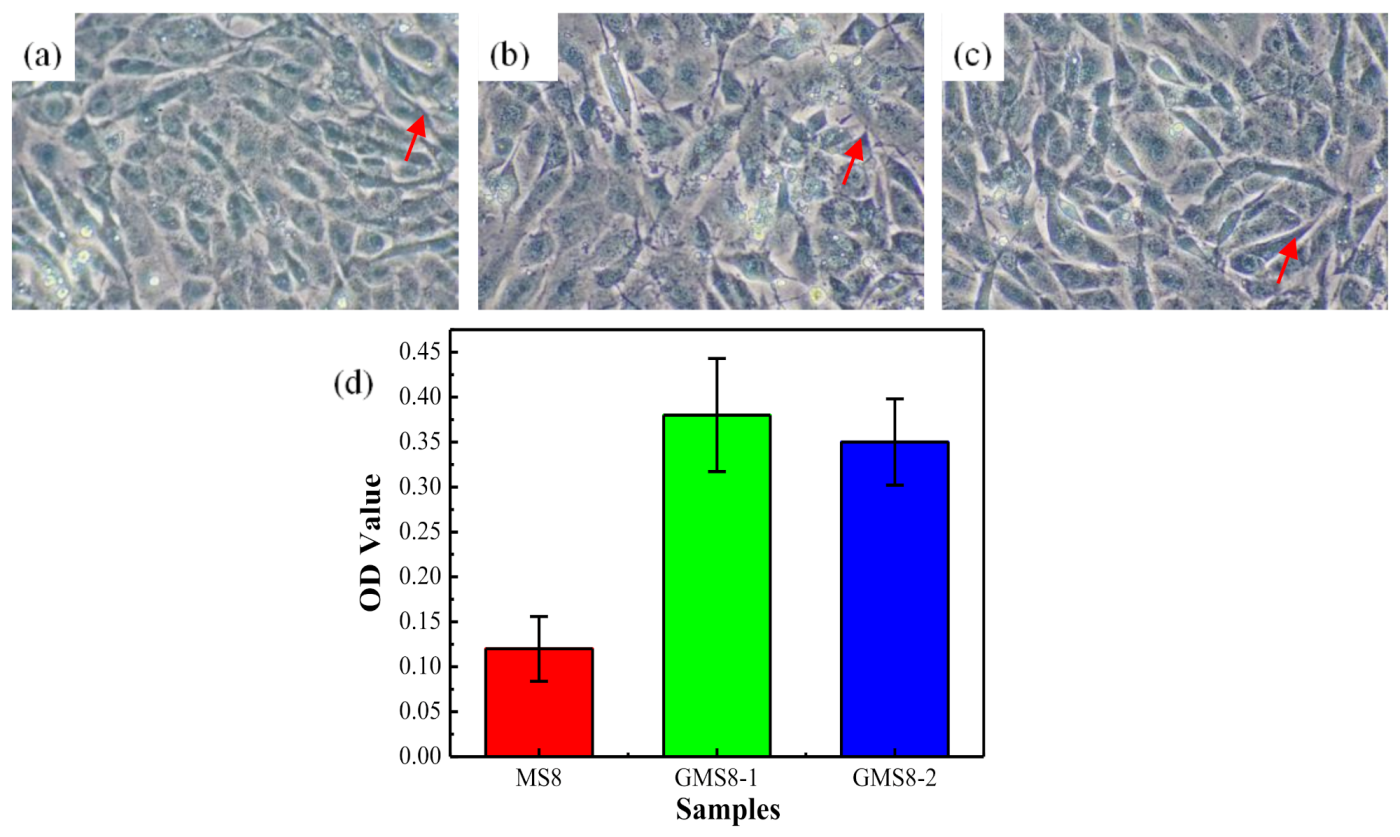
The osteogenic activity of MC3T3-E1 cells co-cultured with extracts can be primarily evaluated by alkaline phosphate (ALP) staining kit method. ALP activity is an indicator of osteoblast function and differentiation. The amount of ALP content in MC3T3-E1cells, characterized by the content of pale blue staining granules (as indicated by the red arrows in Figure 7a–c), reflects the osteogenic activity and degree of osteogenic differentiation of cells. It is seen that GMS8-1 has the largest amount of the blue granules, the second is GMS8-2, and MS8 has the least number, which suggest that the ALP activity changes with the specimens changed. Specially, GMS8-1 shows the largest ALP activity, that is to say the highest osteogenic activity. The corresponding OD values (Figure 7 days) measured verifies this result further. In other words, this gradient Mg-8Si alloy with components of GMS8-1 and GMS8-2 is potential to be studied as biodegradable bone implant materials, for the higher osteogenic activity compared with traditional MS8 alloy.

4. Conclusions

A gradient Mg-8Si alloy was successfully fabricated by employing the electromagnetic directional solidification process. The longitudinal profile of the ingot revealed that an obvious gradient structure, which consisting of primary Mg2Si-rich layer (GMS8-1) and Mg-rich eutectic layer (GMS8-2) appeared in the sample. Both of GMS8-1 and GMS8-2 exhibited a great enhancement of the bio-corrosion resistance in PBS at 37 °C, which could be attributed to the distribution of compact and insoluble Mg2Si phase. Especially for GMS8-1, the coarse primary Mg2Si formed a net-like structure and acted as a physical barrier to hinder the attacking of the corrosive ions and to obtain the highest bio-corrosion resistance of 1610 Ω. As nutrient elements, Mg and Si exhibit growth promoting effects on MC3T3-E1 cells with no cytotoxicity in this study. Especially, this gradient alloy also displays good osteogenic activity, enabling this novel gradient Mg-8Si alloy to be of great potential in the development of functional orthopedic implant materials.

Author Contributions

Conceptualization, W.J.; Methodology, W.J.; Software, W.J.; Validation, W.J. and W.Y.; Formal Analysis, W.J. and W.Y.; Investigation, W.J. and W.Y.; Resources, W.J.; Data Curation, W.J.; Writing—Original Draft Preparation, W.J.; Writing—Review and Editing, W.J.; Visualization, W.Y.; Supervision, W.Y.; Project Administration, W.J.; Funding Acquisition, W.J. and W.Y. All authors have read and agreed to the published version of the manuscript.

Funding

This research was funded by the National Natural Science Foundation of China (51704053), the Fundamental Research Funds for the Key Universities (2018CDJDCL0021) and the Scientific Research Project for High-level Talents (950319133).

Institutional Review Board Statement

Not applicable.

Informed Consent Statement

Not applicable.

Data Availability Statement

Not applicable.

Acknowledgments

The authors are grateful for financial support from the National Natural Science Foundation of China (51704053), the Fundamental Research Funds for the Key Universities (2018CDJDCL0021) and the Scientific Research Project for High-level Talents (950319133).

Conflicts of Interest

The authors declare no conflict of interest.

References

  1. Witte, F.; Hort, N.; Vogt, C.; Cohen, S.; Kainer, K.U.; Willumeit, R.; Feyerabend, F. Degradable biomaterials based on magnesium corrosion. Curr. Opin. Solid State Mater. Sci. 2008, 12, 63–72. [Google Scholar] [CrossRef] [Green Version]
  2. Witte, F. The history of biodegradable magnesium implants: A review. Acta Biomater. 2010, 6, 1680–1692. [Google Scholar] [CrossRef] [PubMed]
  3. Hariprasad, S.; Gowtham, S.; Arun, S.; Ashok, M.; Rameshbabu, N. Fabrication of duplex coatings on biodegradable AZ31 magnesium alloy by integrating cerium conversion (CC) and plasma electrolytic oxidation (PEO) processes. J. Alloys Compd. 2017, 722, 698–715. [Google Scholar]
  4. Rakoch, A.G.; Monakhova, E.P.; Khabibullina, Z.V.; Serdechnova, M.; Blawert, C.; Zheludkevich, M.L.; Gladkova, A.A. Plasma electrolytic oxidation of AZ31 and AZ91 magnesium alloys: Comparison of coatings formation mechanism. J. Alloys Compd. 2020, 8, 587–600. [Google Scholar] [CrossRef]
  5. Li, W.; Guan, S.; Chen, J.; Hu, J.; Chen, S.; Wang, L.; Zhu, S. Preparation and in vitro degradation of the composite coating with high adhesion strength on biodegradable Mg-Zn-Ca alloy. Mater. Charact. 2011, 62, 1158–1165. [Google Scholar] [CrossRef]
  6. Liu, P.; Pan, X.; Yang, W.; Cai, K.; Chen, Y. Improved anticorrosion of magnesium alloy via layer-by-layer self-assembly technique combined with micro-arc oxidation. Mater. Lett. 2012, 75, 118–121. [Google Scholar] [CrossRef]
  7. Hamid, A.; Baviththira, S.; Sama, G.; Hitesh, H.; Ramaraja, P.R. A multifunctional polymeric coating incorporating lawsone with corrosion resistance and antibacterial activity for biomedical Mg alloys. Prog. Org. Coat. 2021, 153, 106157–106171. [Google Scholar]
  8. Jesslyn, K.; Balan, P.; Birbilis, N. Advances in LDH coatings on Mg alloys for biomedical applications: A corrosion perspective. Appl. Clay Sci. 2021, 202, 105948–105969. [Google Scholar]
  9. Mostafizur, R.; Yuncang, L.; Cuie, W. HA coating on Mg alloys for biomedical applications: A review. JMA 2020, 8, 929–943. [Google Scholar]
  10. Bommala, V.K.; Krishna, M.G.; Rao, C.T. Magnesium matrix composites for biomedical applications: A review. JMA 2019, 7, 72–79. [Google Scholar] [CrossRef]
  11. Keeting, P.E.; Oursler, M.J.; Wiegand, K.E.; Bonde, S.K.; Spelsberg, T.C.; Riggs, B.L. Zeolite A increases proliferation, differentiation, and transforming growth factor beta production in normal adult human osteoblast-like cells in vitro. JBMR 1992, 7, 1281–1289. [Google Scholar] [CrossRef]
  12. Reffitt, D.M.; Ogston, N.; Jugdaohsingh, R.; Cheung, H.F.J.; Evans, B.A.J.; Thompson, R.P.H.; Powell, J.J.; Hampson, G.N. Hampson Orthosilicic acid stimulates collagen type I synthesis and osteoblastic differentiation in human osteoblast-like cells in vitro. Bone 2003, 32, 127–135. [Google Scholar] [CrossRef]
  13. Gu, X.N.; Zheng, Y.F.; Cheng, Y.; Zhong, S.P.; Xi, T.F. In vitro corrosion and biocompatibility of binary magnesium alloys. Biomaterials 2009, 30, 484–498. [Google Scholar] [CrossRef]
  14. Ben-Hamu, G.; Eliezer, D.; Shin, K.S. The role of Si and Ca on new wrought Mg-Zn-Mn based alloy. MSE A 2007, 447, 35–43. [Google Scholar] [CrossRef]
  15. Lu, Y.; Bradshaw, A.; Chiu, Y.L.; Jones, I. Effects of secondary phase and grain size on the corrosion of biodegradable Mg-Zn-Ca alloys. MSE C 2015, 48, 480–486. [Google Scholar] [CrossRef]
  16. Esmaily, M.; Svensson, J.E.; Fajardo, S.; Birbilis, N.; Frankel, G.S.; Virtanen, S.; Arrabal, R.; Thomas, S.; Johansson, L.G. Fundamentals and advances in magnesium alloy corrosion. Prog. Mater. Sci. 2017, 89, 92–193. [Google Scholar] [CrossRef]
  17. Amirnejad, M.; Rajabi, M.; Motavalli, A. Effect of addition of Si on microstructure, mechanical properties, bio-corrosion and cytotoxicity of Mg-6Al-1Zn alloy. Trans. Nonferrous Met. Soc. China 2018, 28, 1755–1762. [Google Scholar] [CrossRef]
  18. Ben-Hamu, G.; Eliezer, D.; Shin, K.S. The role of Mg2Si on the corrosion behavior of wrought Mg-Zn-Mn alloy. Intermetallics 2008, 16, 860–867. [Google Scholar] [CrossRef]
  19. Srinivasan, A.; Ningshen, S.; Mudali, U.; Pillai, U.T.S.; Pai, B.C. Influence of Si and Sb addition on the corrosion behavior of AZ91 magnesium alloy. Intermetallics 2007, 15, 1511–1517. [Google Scholar] [CrossRef]
  20. Zhang, E.L.; Yang, L.; Xu, J.W.; Chen, H.Y. Microstructure, mechanical properties and bio-corrosion properties of Mg-Si(-Ca, Zn) alloy for biomedical application. Acta Biomater. 2010, 6, 1756–1762. [Google Scholar] [CrossRef]
  21. Li, X.; Liu, X.M.; Wu, S.L.; Yeung, K.W.K.; Zheng, Y.F.; Chu, P.K. Design of magnesium alloys with controllable degradation for biomedical implants: From bulk to surface. Acta Biomater. 2016, 45, 2–30. [Google Scholar] [CrossRef]
  22. Chen, Q.Z.; Thouas, G.A. Metallic implant biomaterials. MSE R 2015, 87, 1–57. [Google Scholar] [CrossRef]
  23. Pan, Y.K.; Chen, C.Z.; Wang, D.G.; Zhao, T.G. Improvement of corrosion and biological properties of microarc oxidized coatings on Mg-Zn-Zr alloy by optimizing negative power density parameters. Colloid Surf. B 2014, 113, 421–428. [Google Scholar] [CrossRef]
  24. Kaseem, M.; Choi, K.; Ko, Y.G. A highly compact coating responsible for enhancing corrosion properties of Al-Mg-Si alloy. Mater. Lett. 2017, 196, 316–319. [Google Scholar] [CrossRef]
  25. Chen, S.S.; Tu, J.X.; Hu, Q.; Xiong, X.B.; Wu, J.J. Corrosion resistance and in vitro bioactivity of Si-containing coating prepared on a biodegradable Mg-Zn-Ca bulk metallic glass by micro-arc oxidation. J. Non-Cryst. Solids 2017, 456, 125–131. [Google Scholar] [CrossRef]
  26. Jiang, W.Y.; Wang, J.F.; Yu, W.Z.; Ma, Y.; Guo, S.F. In-situ formation of a gradient Mg2Si/Mg composite with good biocompatibility. Surf. Coat. Technol. 2019, 361, 255–262. [Google Scholar] [CrossRef]
  27. ASTM-G31-72: Standard Practice for Laboratory Immersion Corrosion Testing of Metals. In Annual Book of ASTM Standards; American Society for Testing and Materials: Philadelphia, PA, USA, 2004.
  28. Yu, W.Z.; Ma, W.H.; Lv, G.Q.; Xue, H.Y.; Li, S.Y.; Dai, Y.N. Effect of electromagnetic stirring on the enrichment of primary silicon from Al-Si melt. J. Cryst. Growth 2015, 405, 23–28. [Google Scholar] [CrossRef]
  29. Kania, A.; Nowosielski, R.; Gawlas-Mucha, A.; Babilas, R. Mechanical and corrosion properties of Mg-Based alloys with Gd addition. Materials 2019, 12, 1775. [Google Scholar] [CrossRef] [Green Version]
  30. Khalajabadi, S.Z.; Kadir, M.R.A.; Izman, S.; E-Kahrizsangi, R. Fabrication, bio-corrosion behavior and mechanical properties of a Mg/HA/MgO nanocomposite for. biomedical applications. Mater. Des. 2015, 88, 1223–1233. [Google Scholar] [CrossRef]
  31. Tompa, G.S.; Li, Y.B.; Agassi, D.; Kim, S.I.; Hong, S.K. Mg2Si buffer layers on Si(1 0 0)prepared by a simple evaporation method. J. Electron. Mater. 1996, 25, 925–929. [Google Scholar] [CrossRef]
  32. Li, C.; Wu, Y.Y.; Li, H.; Liu, X.F. Morphological evolution and growth mechanism of primary Mg2Si phase in Al-Mg2Si alloys. Acta Mater. 2011, 59, 1058–1067. [Google Scholar] [CrossRef]
  33. Stathokostopoulos, D.; Chaliampalias, D.; Stefanaki, E.; Polymeris, G.; Pavlidou, E.; Chrissafis, K.; Hatzikraniotis, E.; Paraskevopoulos, K.; Vourlias, G. Structure, morphology and electrical properties of Mg2Si layers deposited by pack cementation. Appl. Surf. Sci. 2013, 285P, 417–424. [Google Scholar] [CrossRef]
  34. Mandal, M.; Moon, A.P.; Deo, G.; Mendis, C.L.; Mondal, K. Corrosion behavior of Mg–2.4Zn alloy micro-alloyed with Ag and Ca. Corros. Sci. 2014, 78, 172–182. [Google Scholar] [CrossRef]
  35. Song, G.L. Effect of tin modification on corrosion of AM70 magnesium alloy. Corros. Sci. 2009, 51, 2063–2070. [Google Scholar] [CrossRef]
  36. Yamasaki, M.; Izumi, S.; Kawamura, Y.; Habazaki, H. Corrosion and passivation behavior of Mg-Zn-Y-Al alloys prepared by cooling rate-controlled solidification. Appl. Surf. Sci. 2011, 257, 8258–8267. [Google Scholar] [CrossRef]
  37. Cesarz-Andraczke, K.; Kazek-Kęsik, A. PEO layers on Mg-based metallic glass to control hydrogen evolution rate. Bull. Pol. Acad. Sci. Tech. Sci. 2020, 68, 119–124. [Google Scholar]
  38. Cheng, J.; Liu, B.; Wu, Y.H.; Zheng, Y.F. Comparative in vitro study on pure metals (Fe, Mn, Mg, Zn and W) as biodegradable metals. J. Mater. Sci. Technol. 2013, 29, 619–627. [Google Scholar] [CrossRef]
  39. Witte, F.; Feyerabend, F.; Maier, P.; Fischer, J.; Störmer, M.; Blawert, C.; Dietzel, W.; Hort, N. Biodegradable magnesium-hydroxyapatite metal matrix composites. Biomaterials 2007, 28, 2163–2174. [Google Scholar] [CrossRef] [Green Version]
  40. Grillo, C.A.; Alvarez, F.; de Mele, M.A.F.L. Cellular response to rare earth mixtures (La and Gd) as components of degradable Mg alloys for medical applications. Colloid Surf. B 2014, 117, 312–321. [Google Scholar] [CrossRef] [Green Version]
  41. Witte, F.; Kaese, V.; Haferkamp, H.; Switzer, E.; Meyer-Lindenberg, A.; Wirth, C.J.; Windhagen, H. In vivo corrosion of four magnesium alloys and the associated bone response. Biomaterials 2005, 26, 3557–3563. [Google Scholar] [CrossRef]
  42. Ren, Y.; Huang, J.; Yang, K.; Zhang, B.; Yao, Z.; Wang, H. Study of bio-corrosion of pure magnesium. Acta Metall. Sin. 2005, 41, 1228–1232. [Google Scholar]
  43. Xu, L.; Pan, F.; Yu, G.; Yang, L.; Zhang, E.; Yang, K. In vitro and in vivo evaluation of the surface bioactivity of a calcium phosphate coated magnesium alloy. Biomaterials 2009, 30, 1512–1523. [Google Scholar] [CrossRef]
  44. Bahl, S.; Aleti, B.T.; Suwas, S.; Chatterjee, K. Surface nanostructuring of titanium imparts multifunctional properties for orthopedic and cardiovascular applications. Mater. Des. 2018, 144, 169–181. [Google Scholar] [CrossRef]
  45. Kim, S.Y.; Kim, Y.K.; Kim, K.S.; Lee, K.B.; Lee, M.H. Enhancement of bone formation on LBL-coated Mg alloy depending on the different concentration of BMP-2. Colloid Surf. B 2019, 173, 437–446. [Google Scholar] [CrossRef]
Figure 1. Schematic of electromagnetic directional solidification setup: (1) Ar gas (99.999%) tank; (2) gas flow meter; (3) two-way valve; (4) Ar gas inlet; (5) Ar gas outlet; (6) flange; (7) gas outlet; (8) stainless steel; (9) quartz tube; (10) corundum tube; (11) graphite crucible; (12) induction coil; (13) Mg–Si melt; (14) solidified Mg2Si crystals; (15) refractory; (16) drawing bar; (17) infrared pyrometer; (18) vacuum pump; (19) glass bottle.
Metals 11 00781 g001
Figure 2. Macroscopic appearance of MS8 (a), GMS8-1and GMS8-2 (b) in longitudinal direction; schematic diagram of electromagnetic directional solidification (c); microstructures of MS8 (d), GMS8-1 (e), GMS8-2 (f).
Metals 11 00781 g002
Figure 3. Potentiodynamic polarization curves of specimens (a); Nyquist plots of specimens (b); equivalent circuit of specimens MS8 (c), GMS8-1 and GMS8-2 (d); pH value of PBS solutions with specimens soaked for 7 days (e); corrosion rate by weight loss for 7 days (f).
Metals 11 00781 g003
Figure 4. Surface morphologies of specimens after 7 days immersion: MS8 (a), GMS8-1 (b), GMS8-2 (c) by SEM with the EDS results of Point A, B and C; X-ray diffraction patterns of corrosion products on GMS8-1 (d), GMS8-2 (e).
Metals 11 00781 g004
Figure 5. The surface morphologies of chemically cleaned specimens after 7 days immersion (a,d) MS8; (b,e) GMS-1;(c,f) GMS-2; (g) EDS map result of red square in (e).
Metals 11 00781 g005
Figure 6. Cell viability of MC3T3-E1 cells co-cultured with extracts for 3d (a); ion concentrations of PBS (b) with the specimens soaked for 7 days; immunofluorescence figures of ME3T3-E1 cells cultivated with extracts of MS8 (c), GMS8-1 (d) and GMS8-2 (e) for 3d.
Metals 11 00781 g006
Figure 7. Alkaline phosphate activity of ME3T3-E1 cells with specimens extracts of MS8 (a), GMS8-1 (b), GMS8-2 (c); the corresponding OD values (d).
Metals 11 00781 g007
Table 1. Electrochemical parameters derived from the polarization curves of the specimens in PBS at 37 °C.
SpecimenEcorr(V)Icorr
(10−5A·cm−2)
Eb(V)Rp
(Ω·cm2)
Refs.
MS8−1.5828.1 254.5This work
GMS8-1−1.550.17−1.371610This work
GMS8-2−1.572.56−1.421291This work
Mg-6Al-1Zn-1Si−1.658.61 [17]
Mg-0.6Si−1.723.06 711[20]
Table 2. Parameters of the circuit model fitted from the Nyquist plots of the specimens in PBS at 37 °C.
SpecimenMS8GMS8-1GMS8-2
Rs (Ωcm2)26.488.157.17
Rct (Ω/cm2)266.313351072
CPE1-T (F/cm2)1.22 × 10−53.38 × 10−5
CPE1-P (F/cm2)0.838840.83241
Rf (Ω/cm2)511.4271.2
Rc26.3
Cc4.44 × 10−8
CPE2-T (F/cm2)6.72 × 10−54.43 × 10−41.99 × 10⁻⁴
CPE2-P (F/cm2)0.91330.96870.9409
L (H/cm2)846.1185.373.88
Chisq9.013 × 10−47.120 × 10−47.938 × 10−4
Publisher’s Note: MDPI stays neutral with regard to jurisdictional claims in published maps and institutional affiliations.