Tool Wear Prediction in the Forming of Automotive DP980 Steel Sheet Using Statistical Sensitivity Analysis and Accelerated U-Bending Based Wear Test

 , and
, and 
Abstract
:
1. Introduction
2. Materials and Tool Wear Characteristics
3. Tool Wear Prediction Model
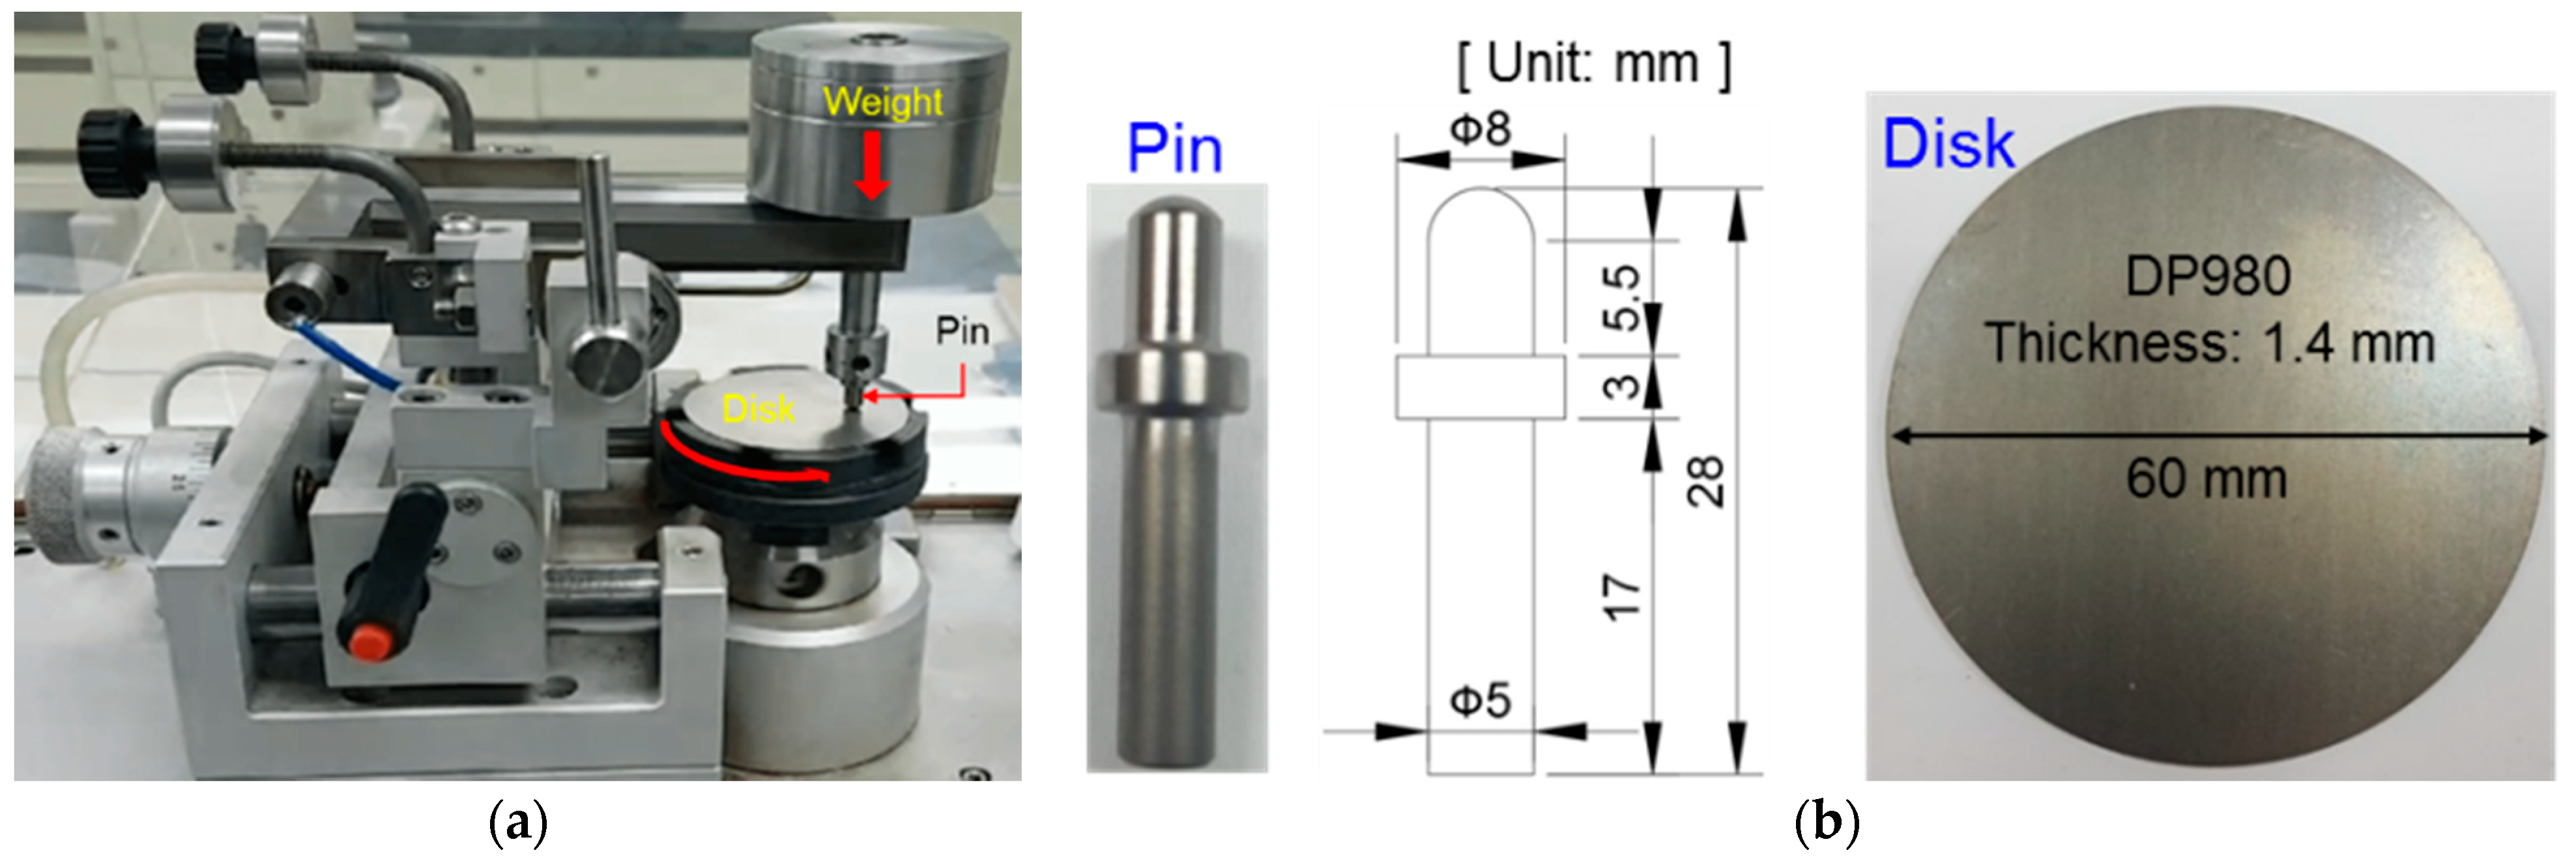
3.1. Experimental Setup for a Pin-on-Disk Test
3.2. Experimental Design Parameters
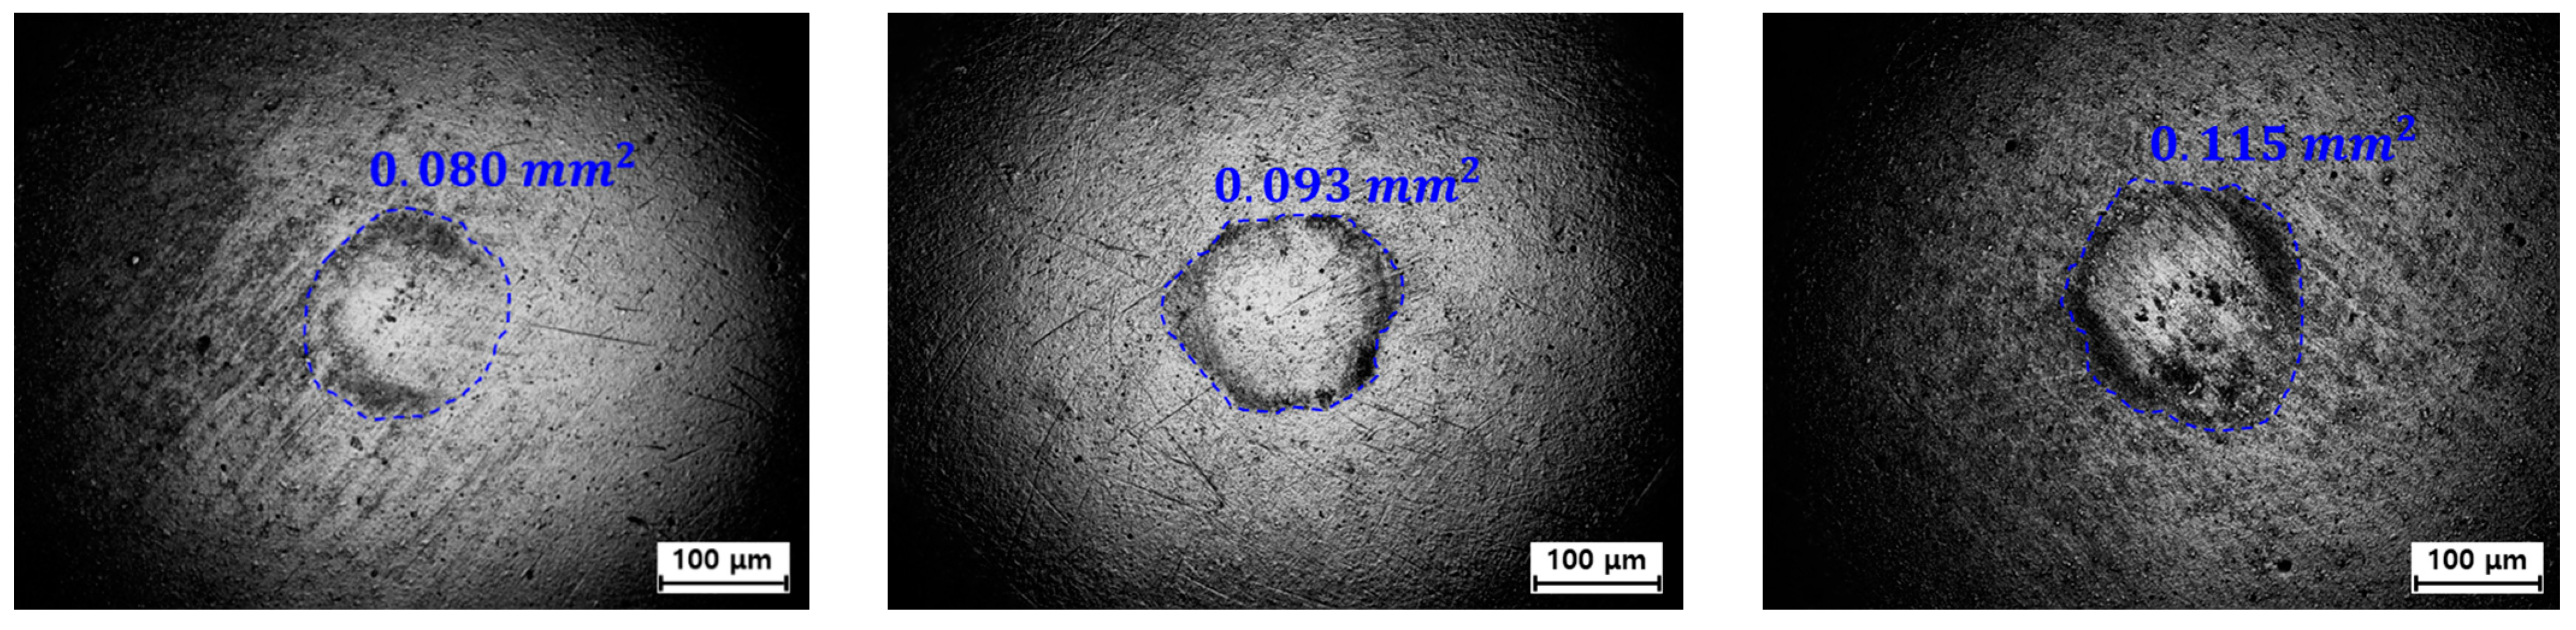
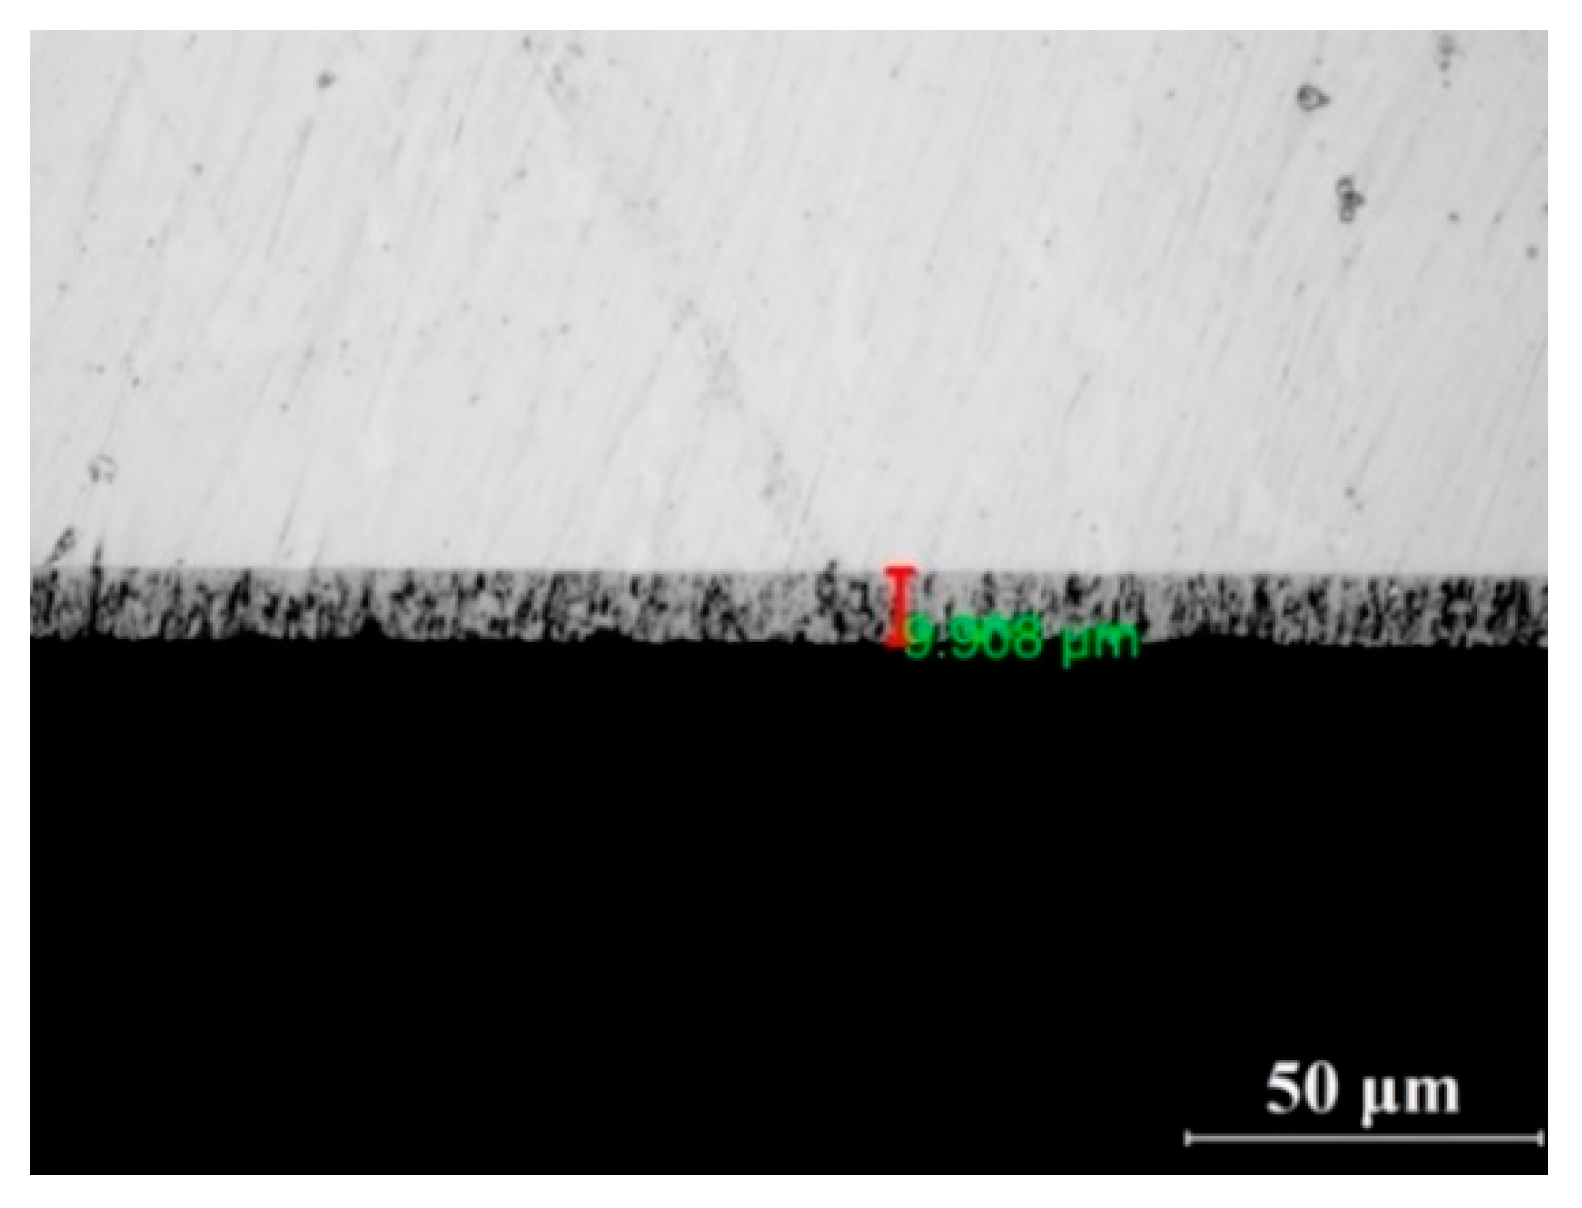
3.3. Measurement of Pin Wear Depth
3.4. Sensitivity Analysis of Wear Parameters
3.5. Tool Wear Prediction Model
4. Verification of Tool Wear Using the U-Draw Forming Process
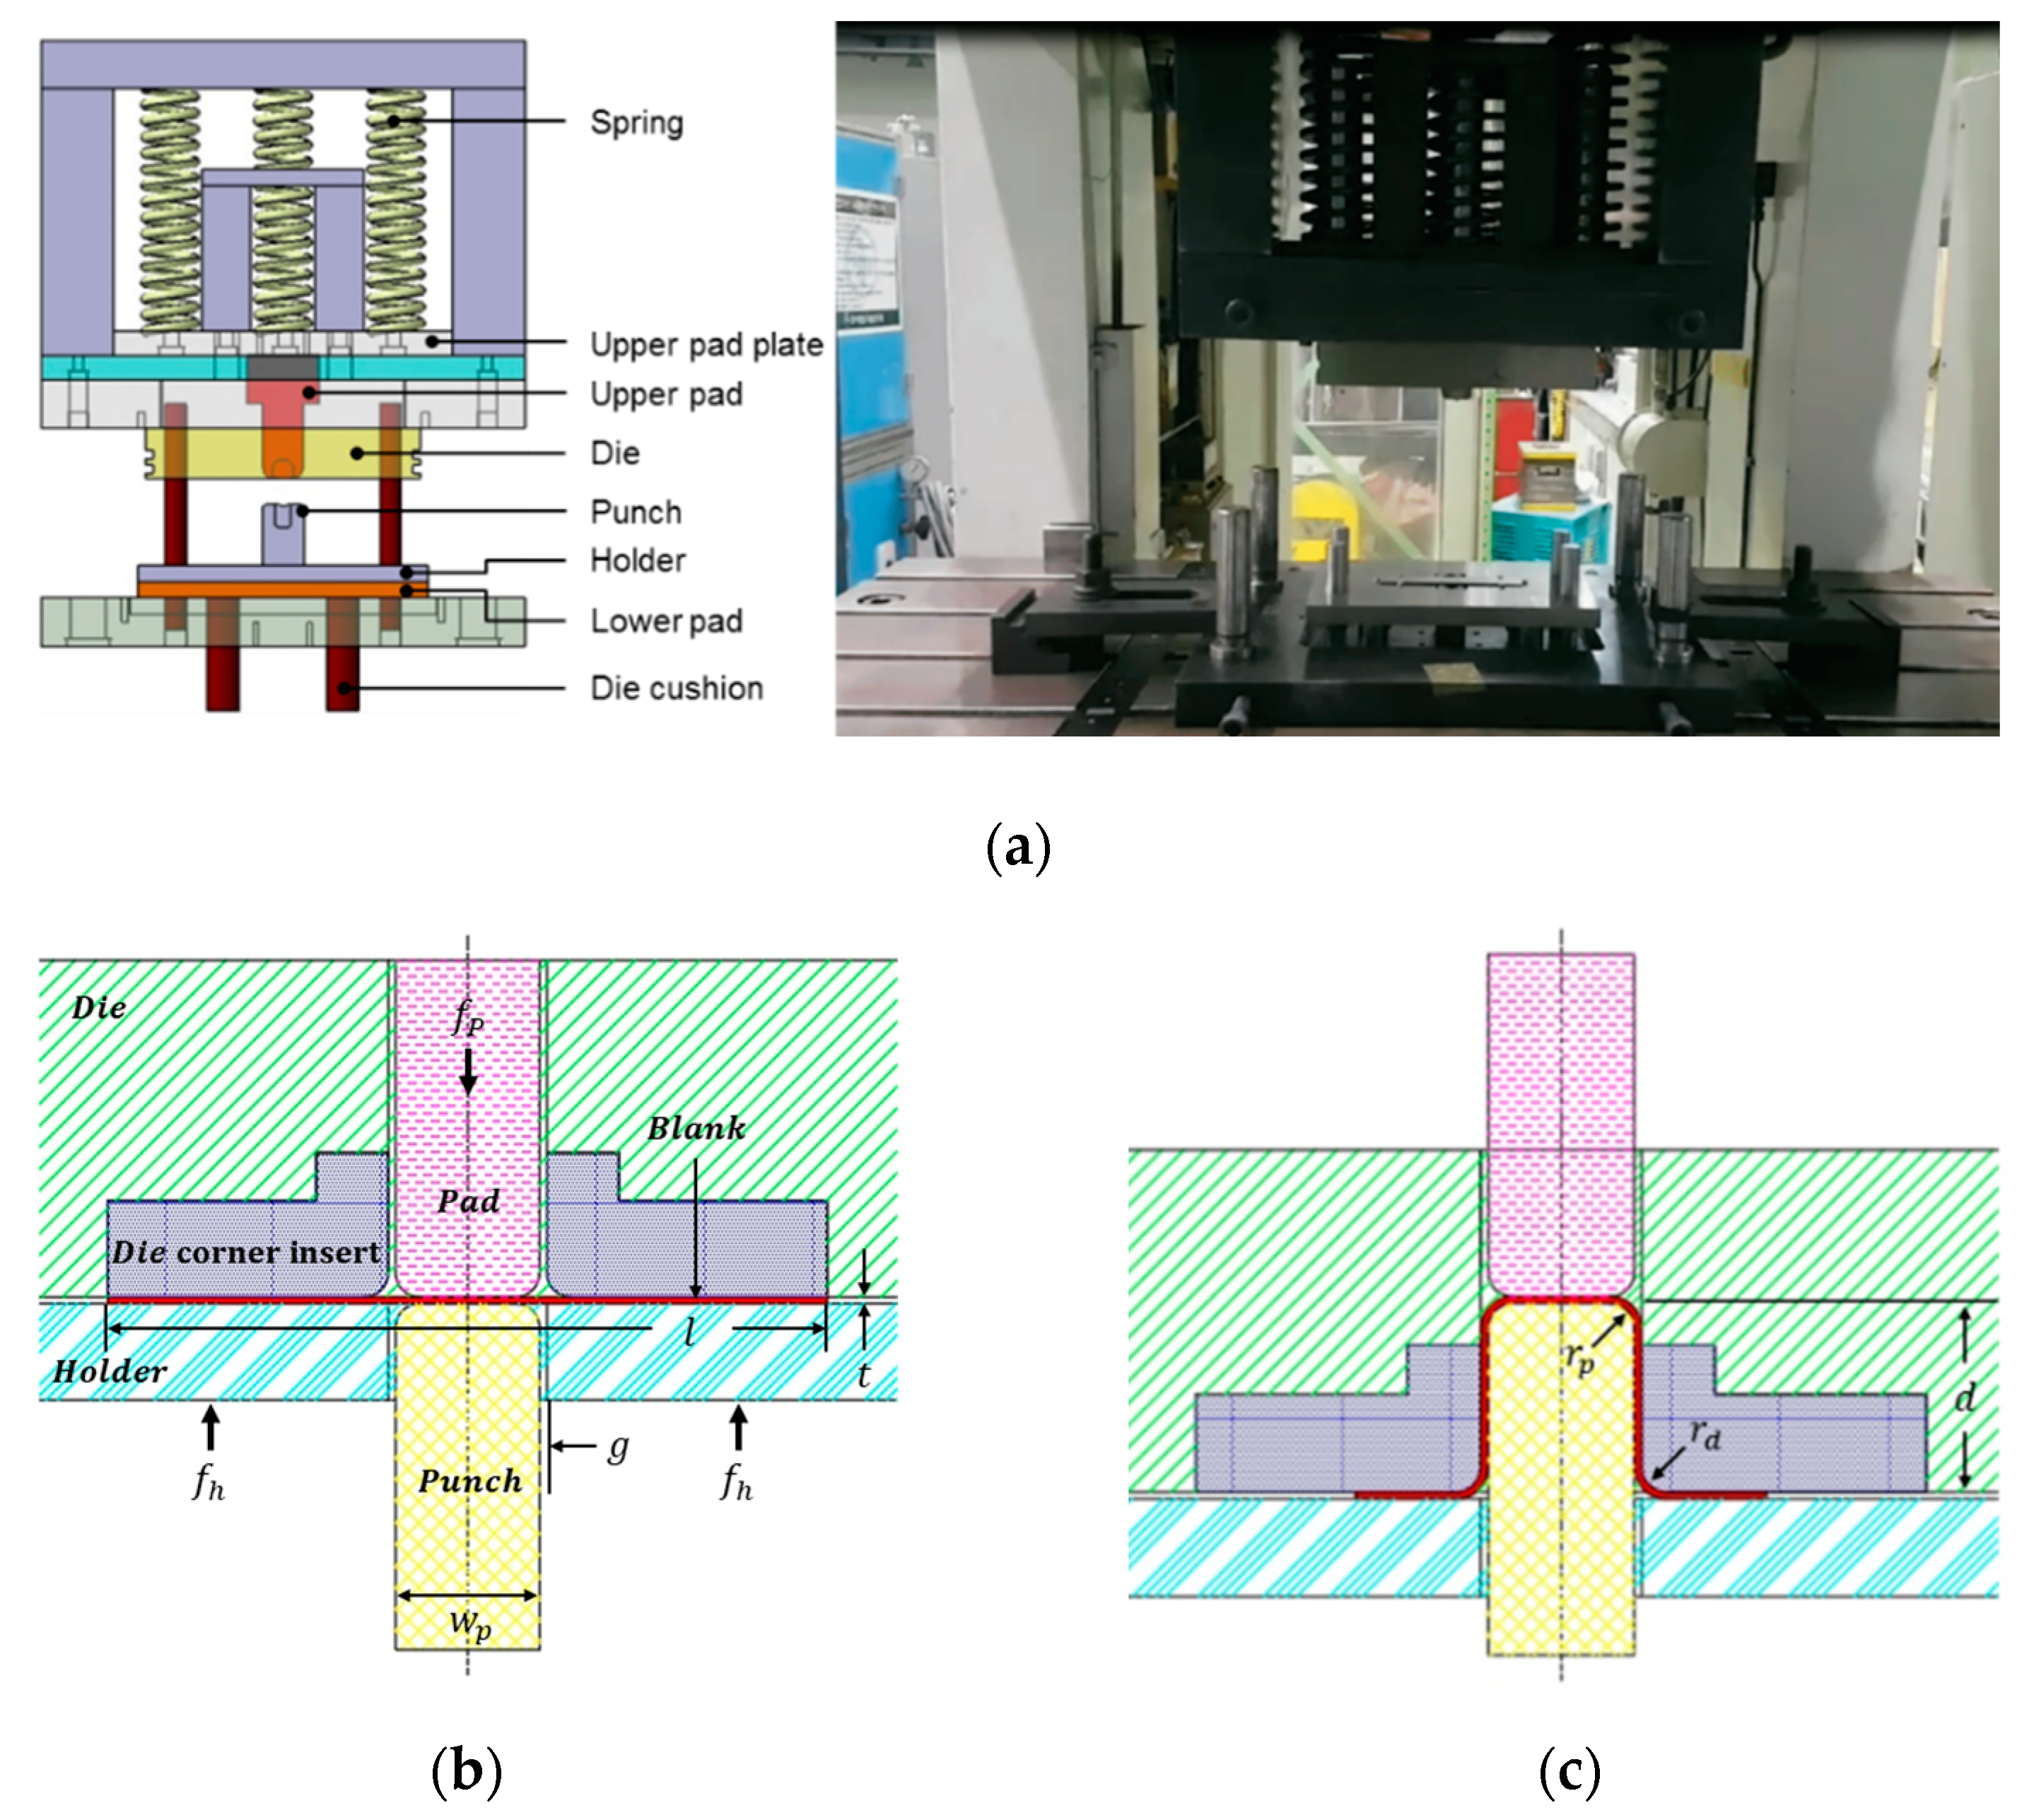
4.1. Drawing Tool Design by Numerical Simulation
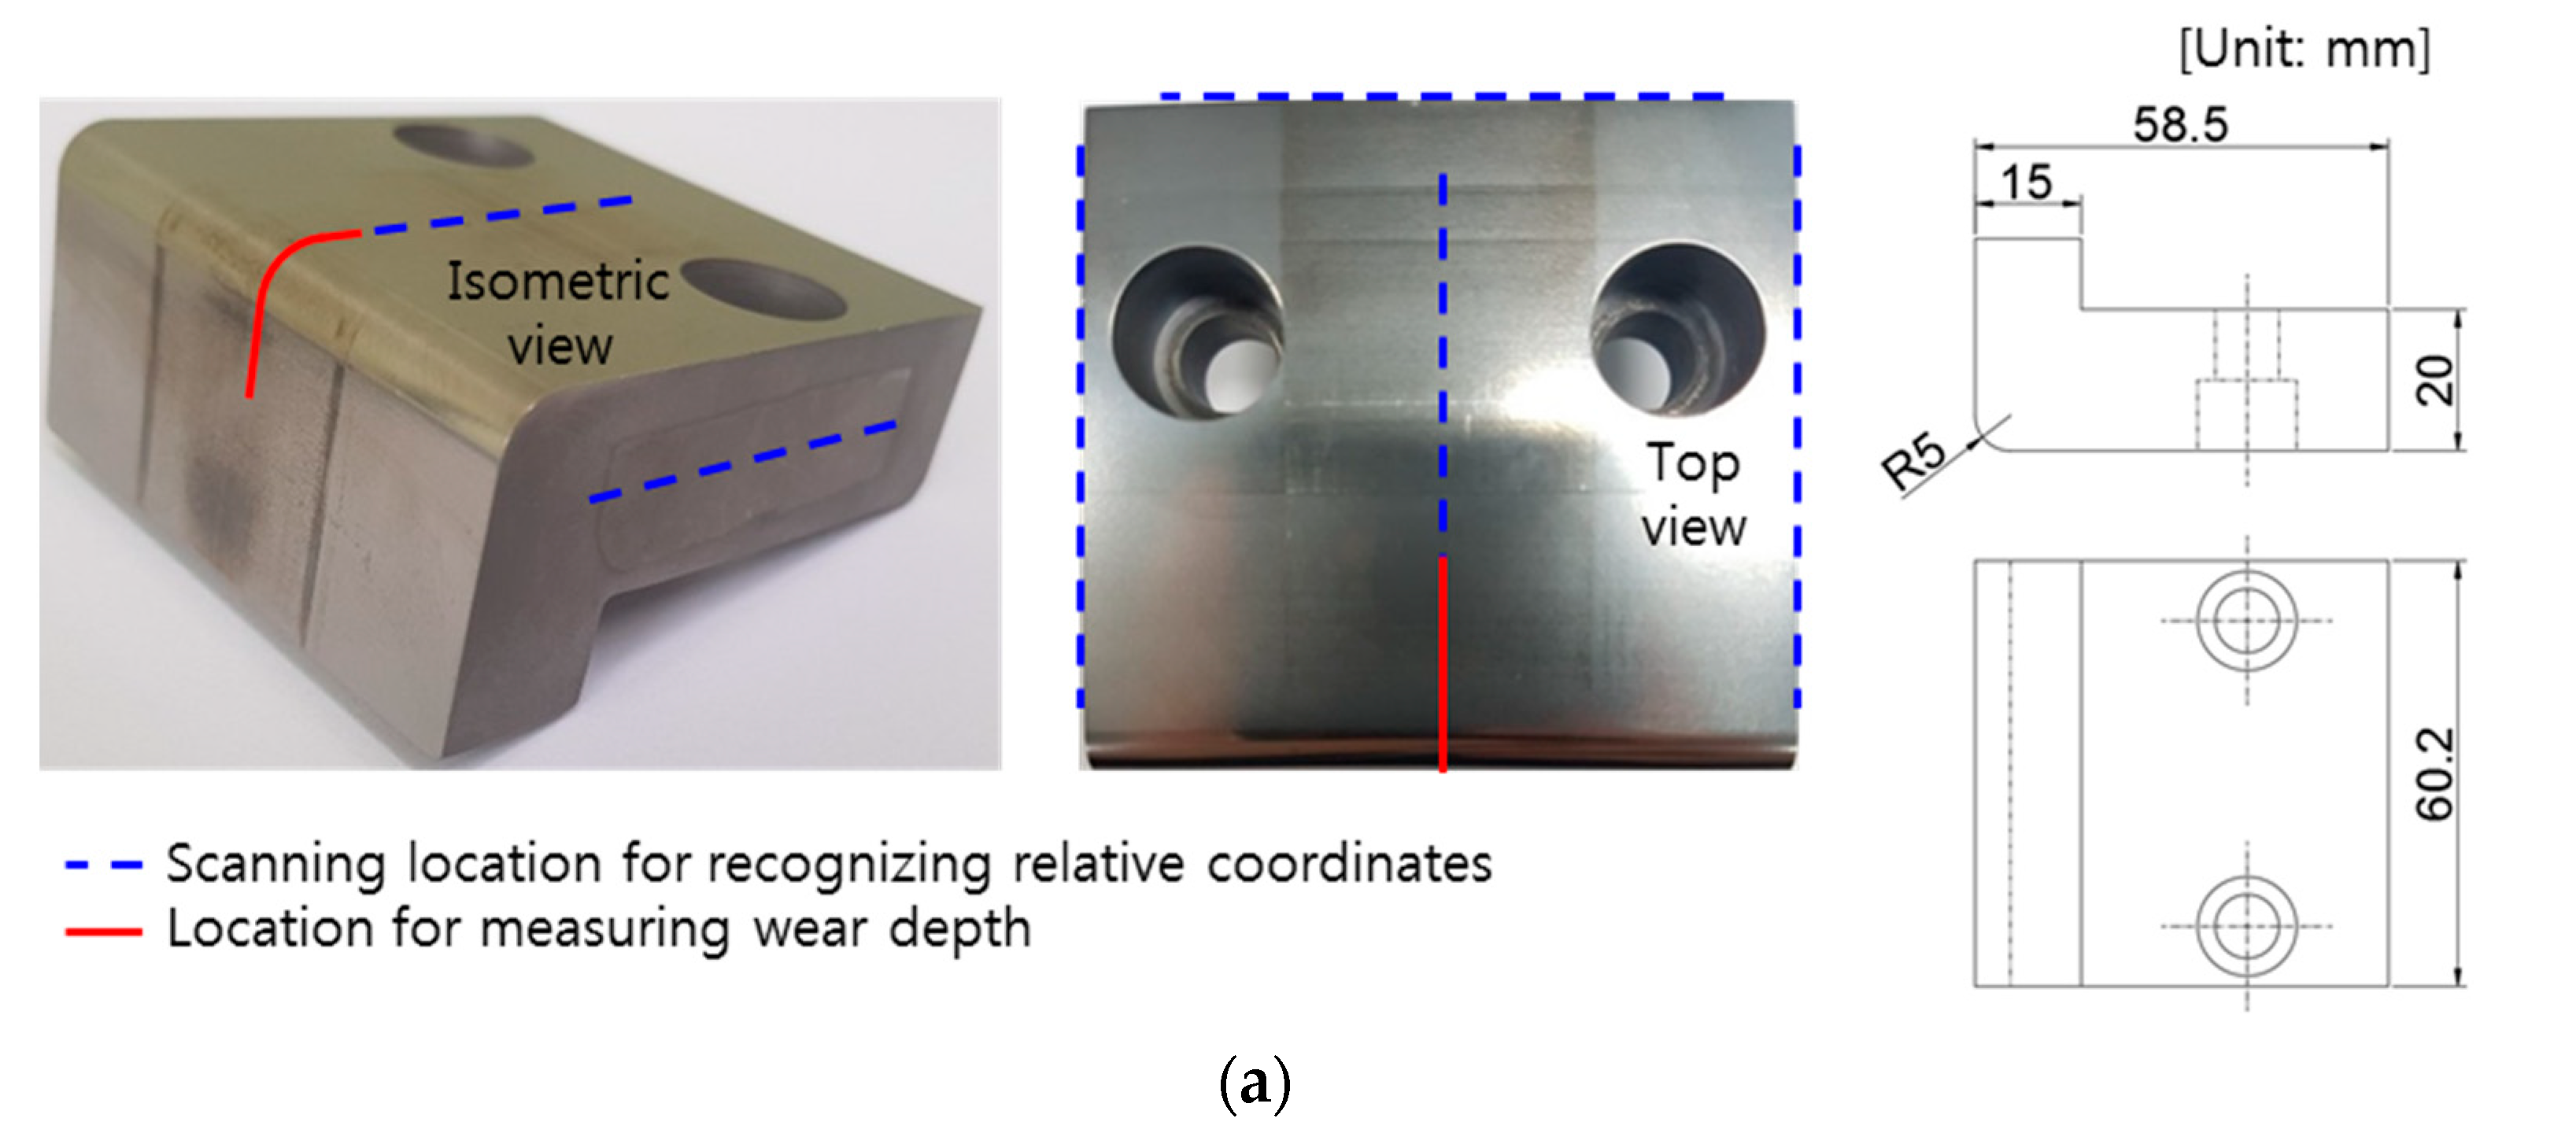
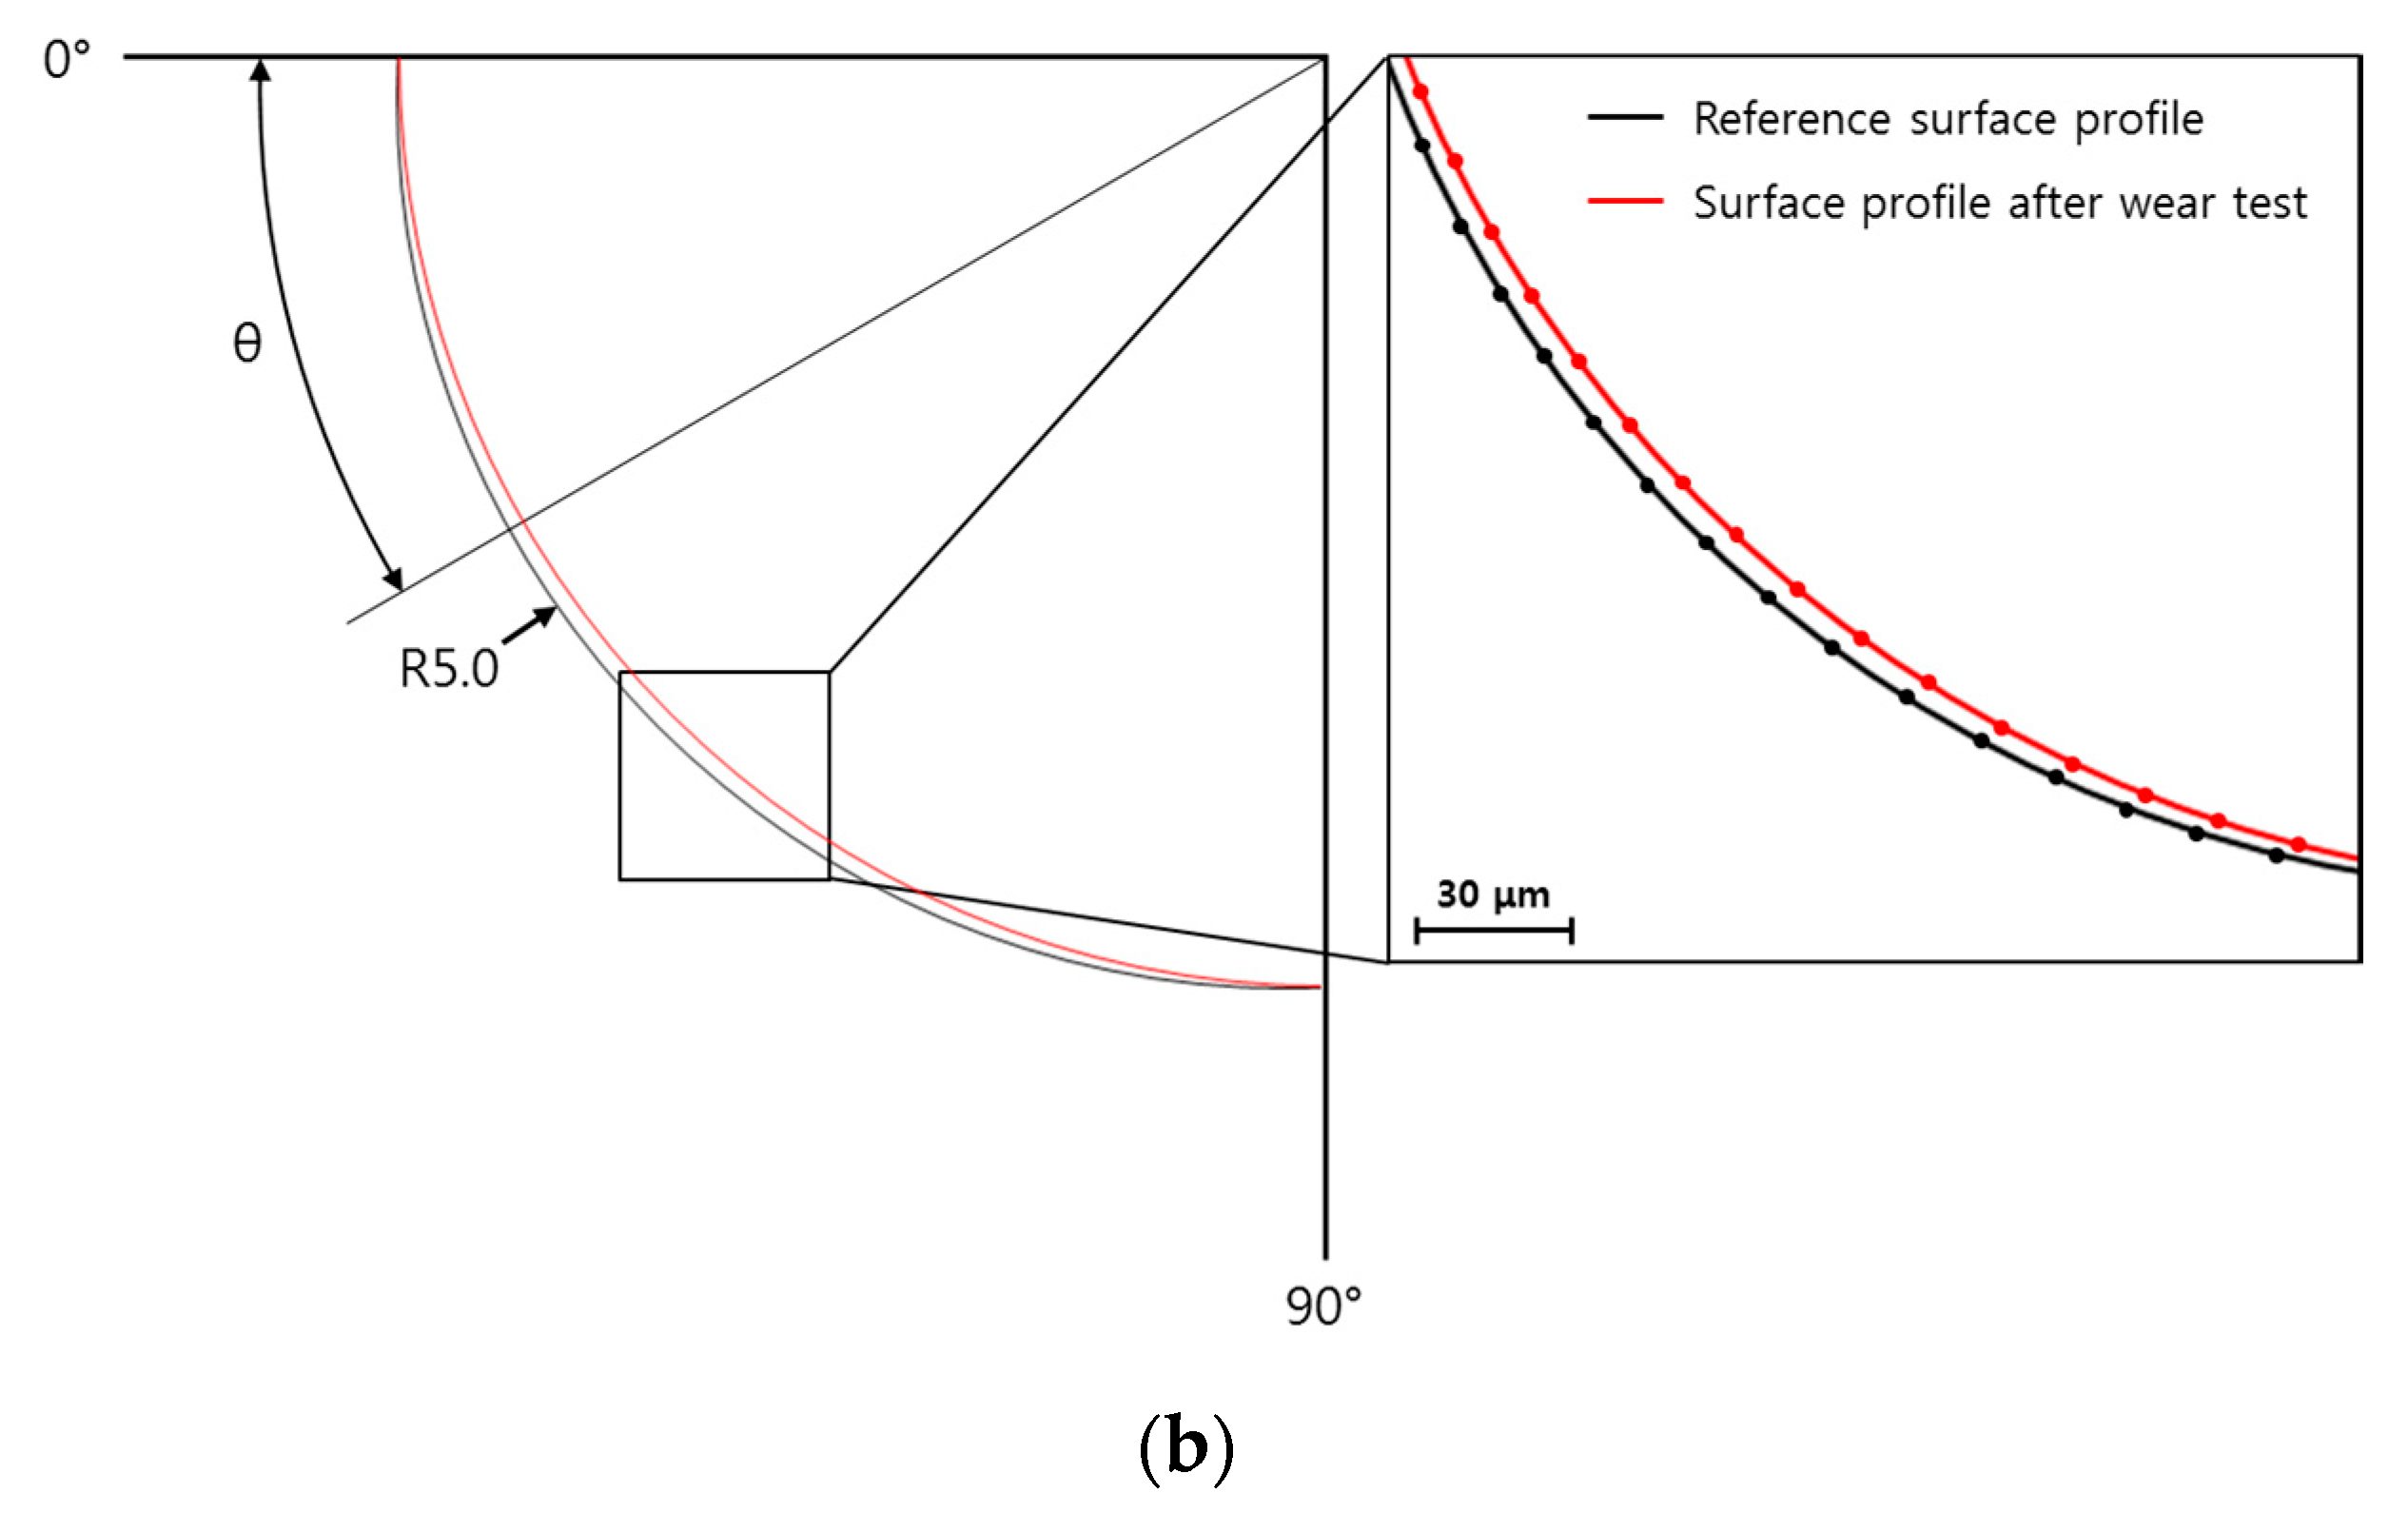
4.2. Drawing Wear Test
4.3. Validation of the Tool Wear Prediction Procedure
5. Conclusions
- (1)
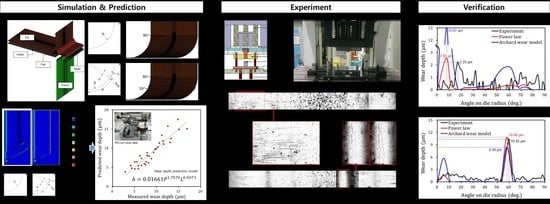
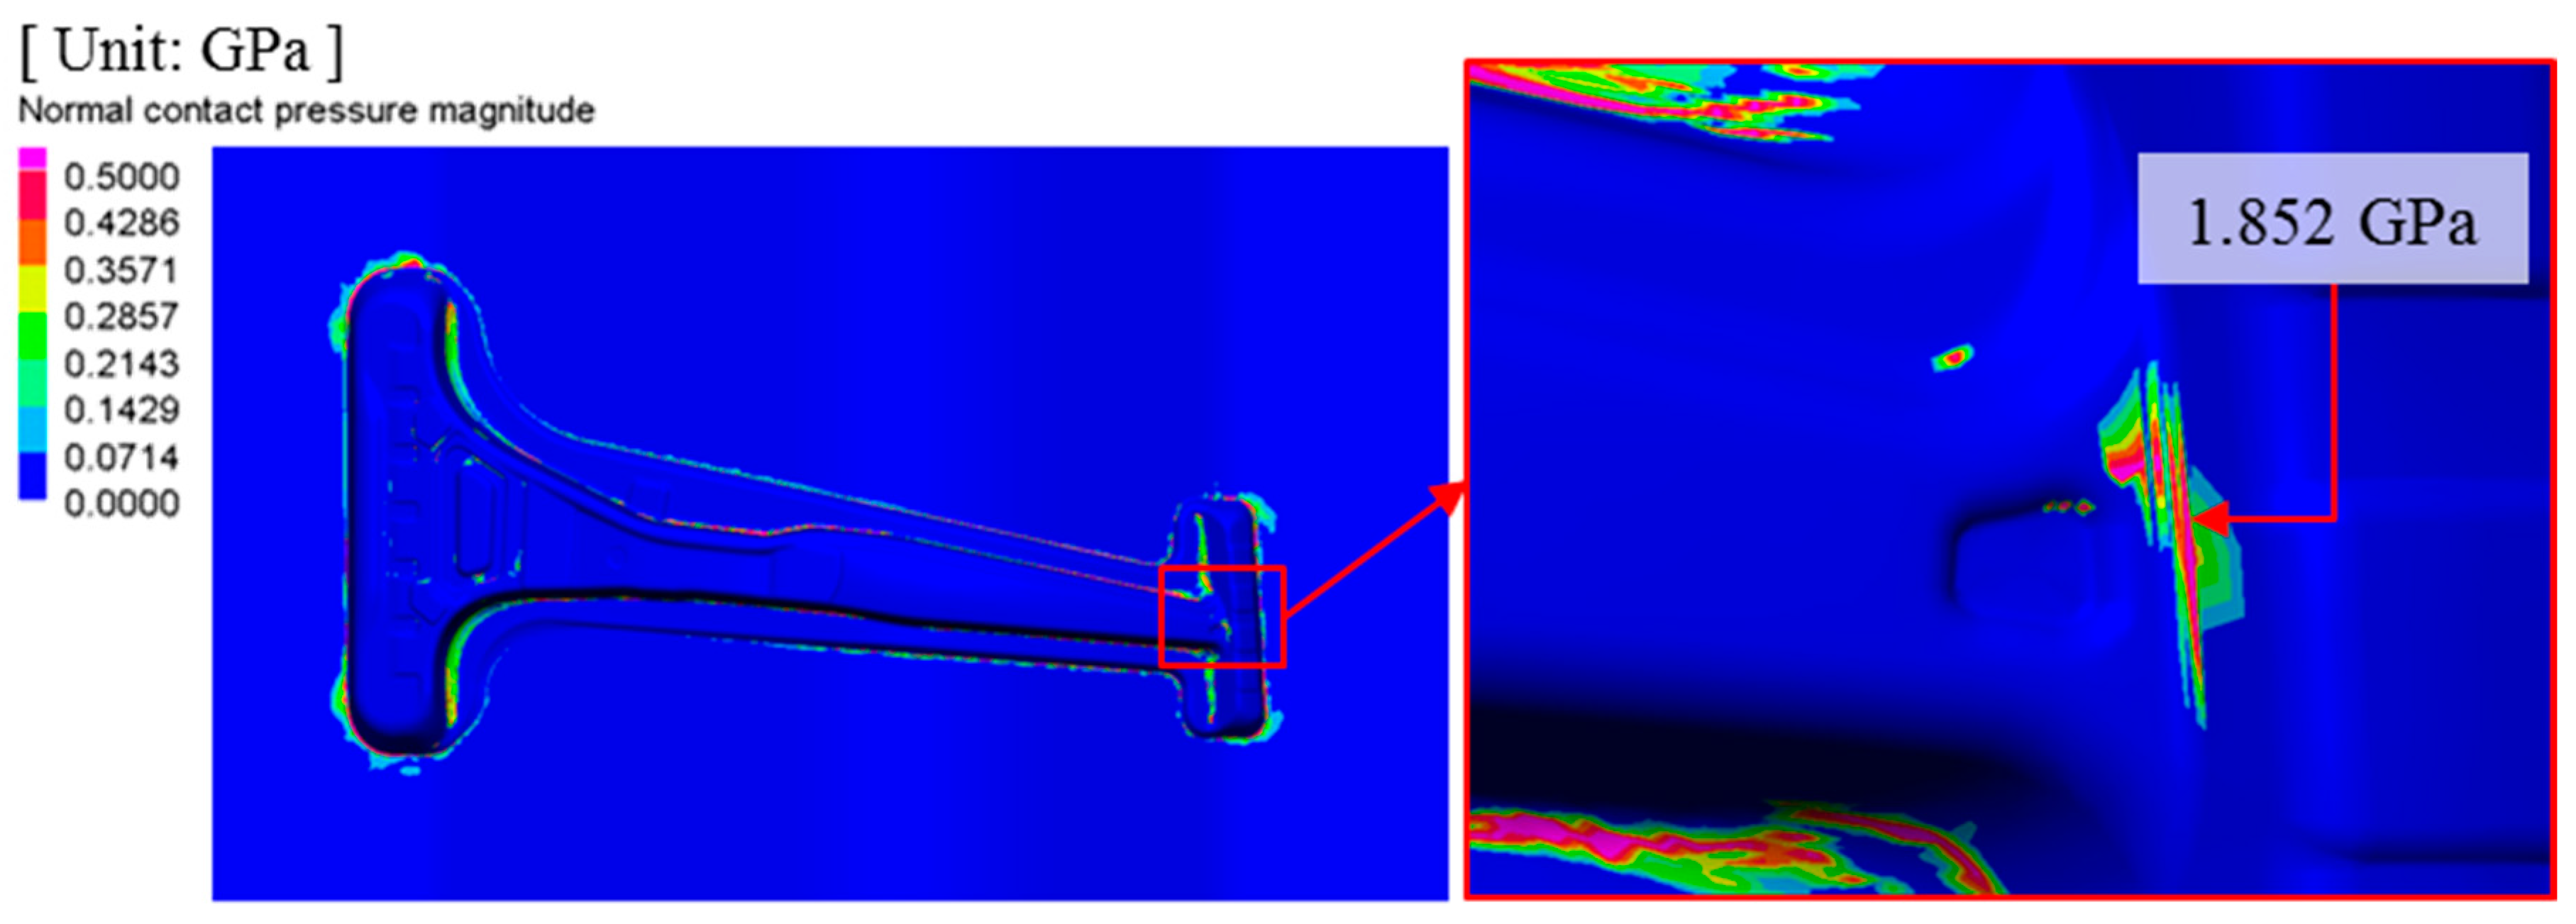
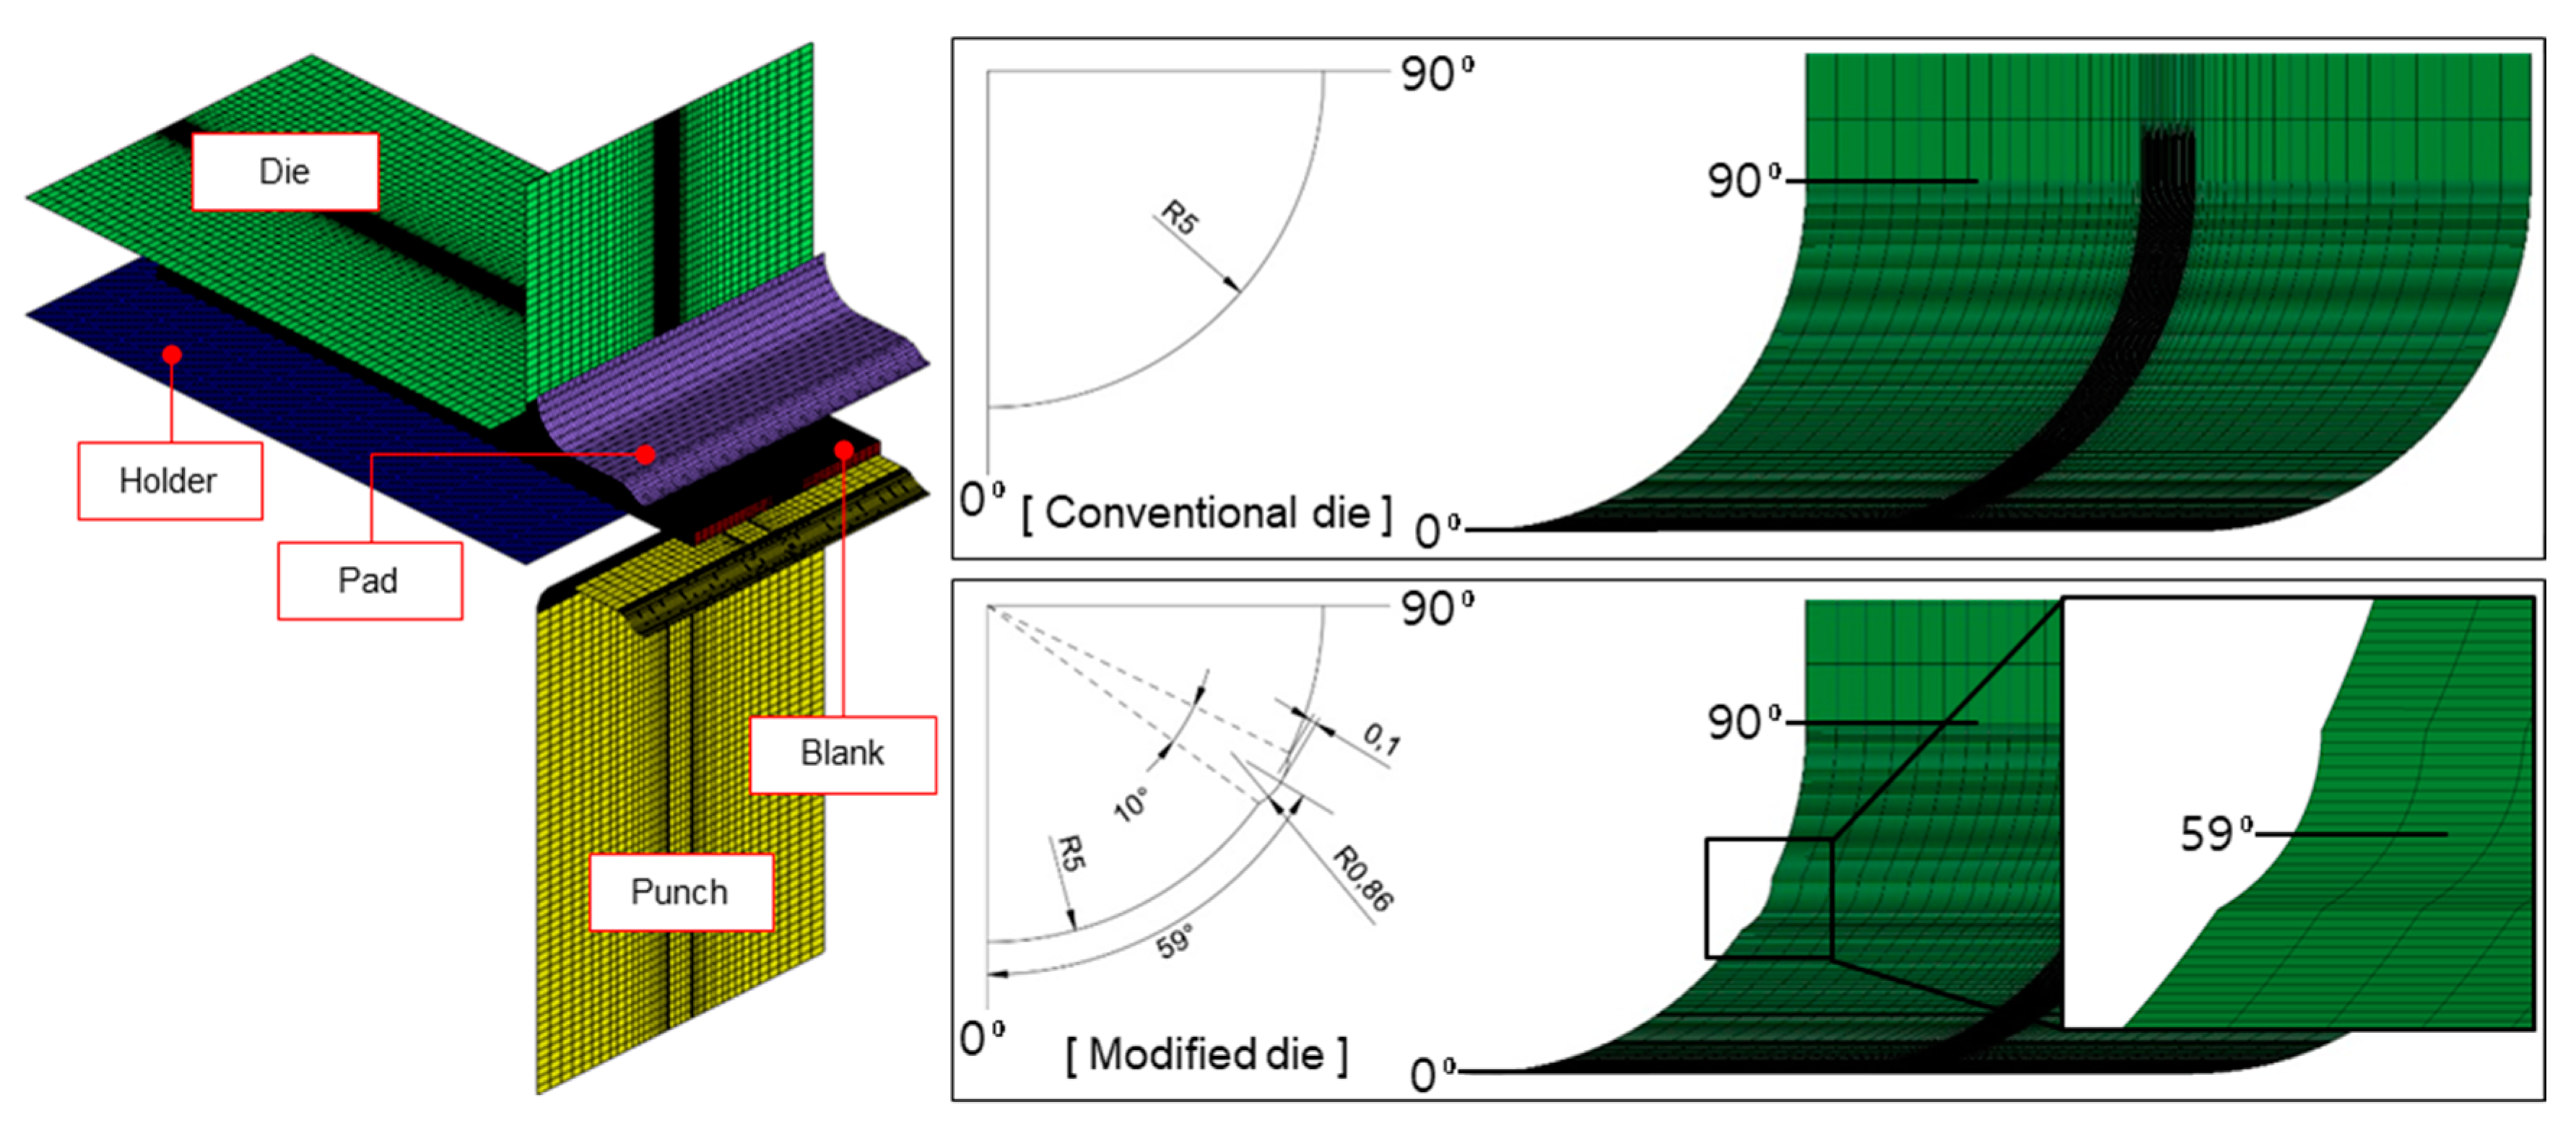
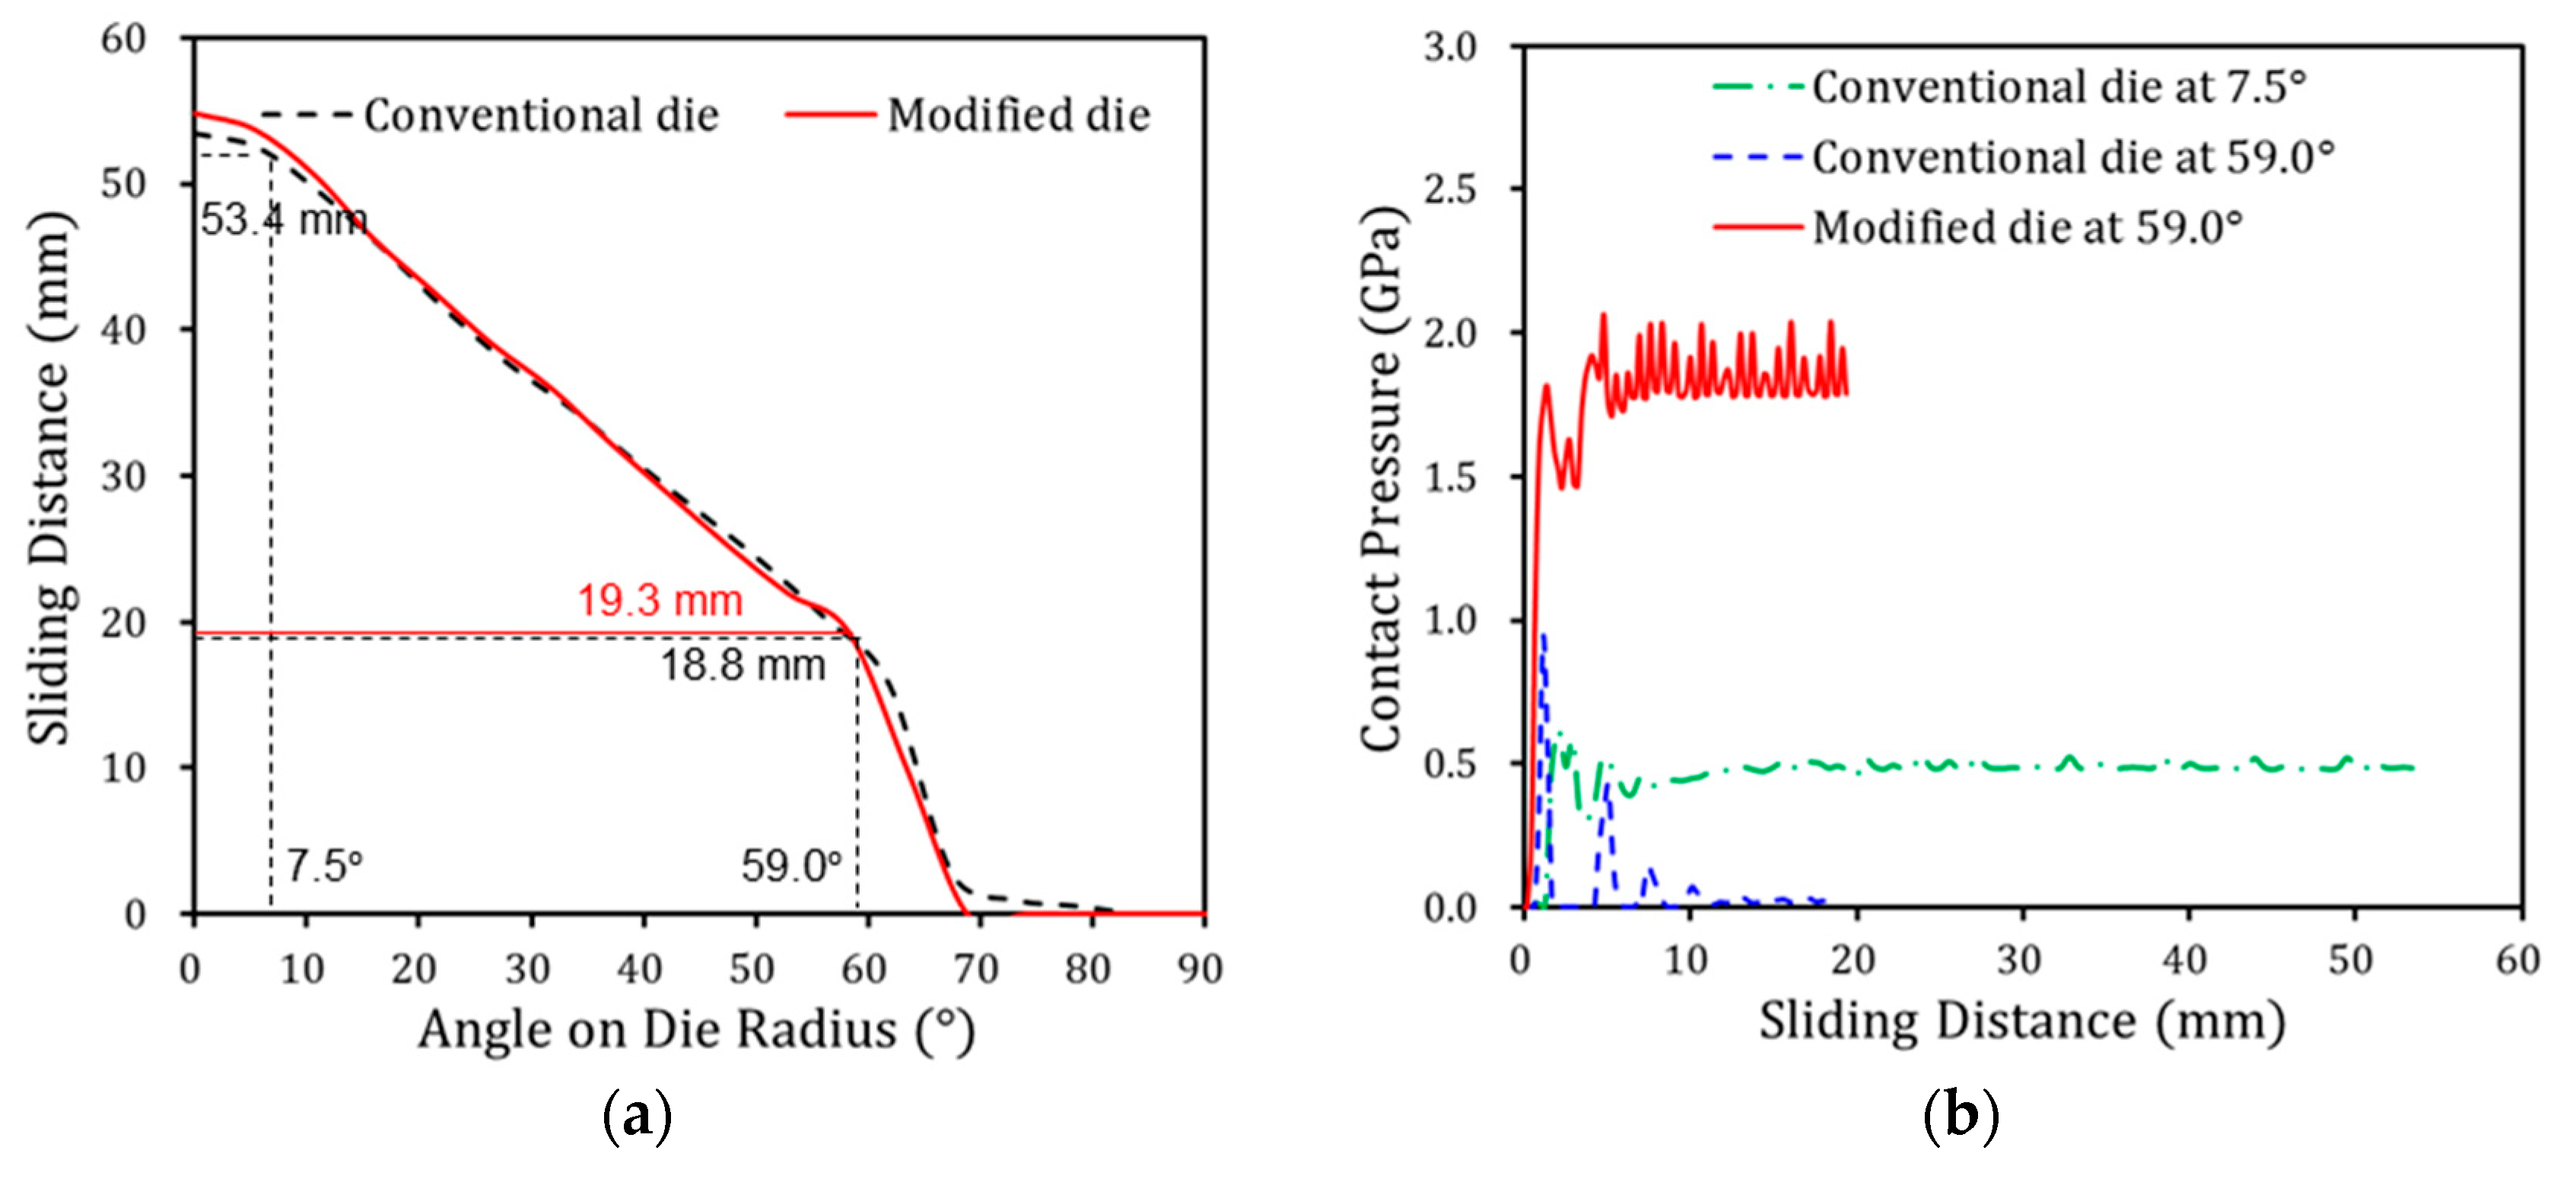
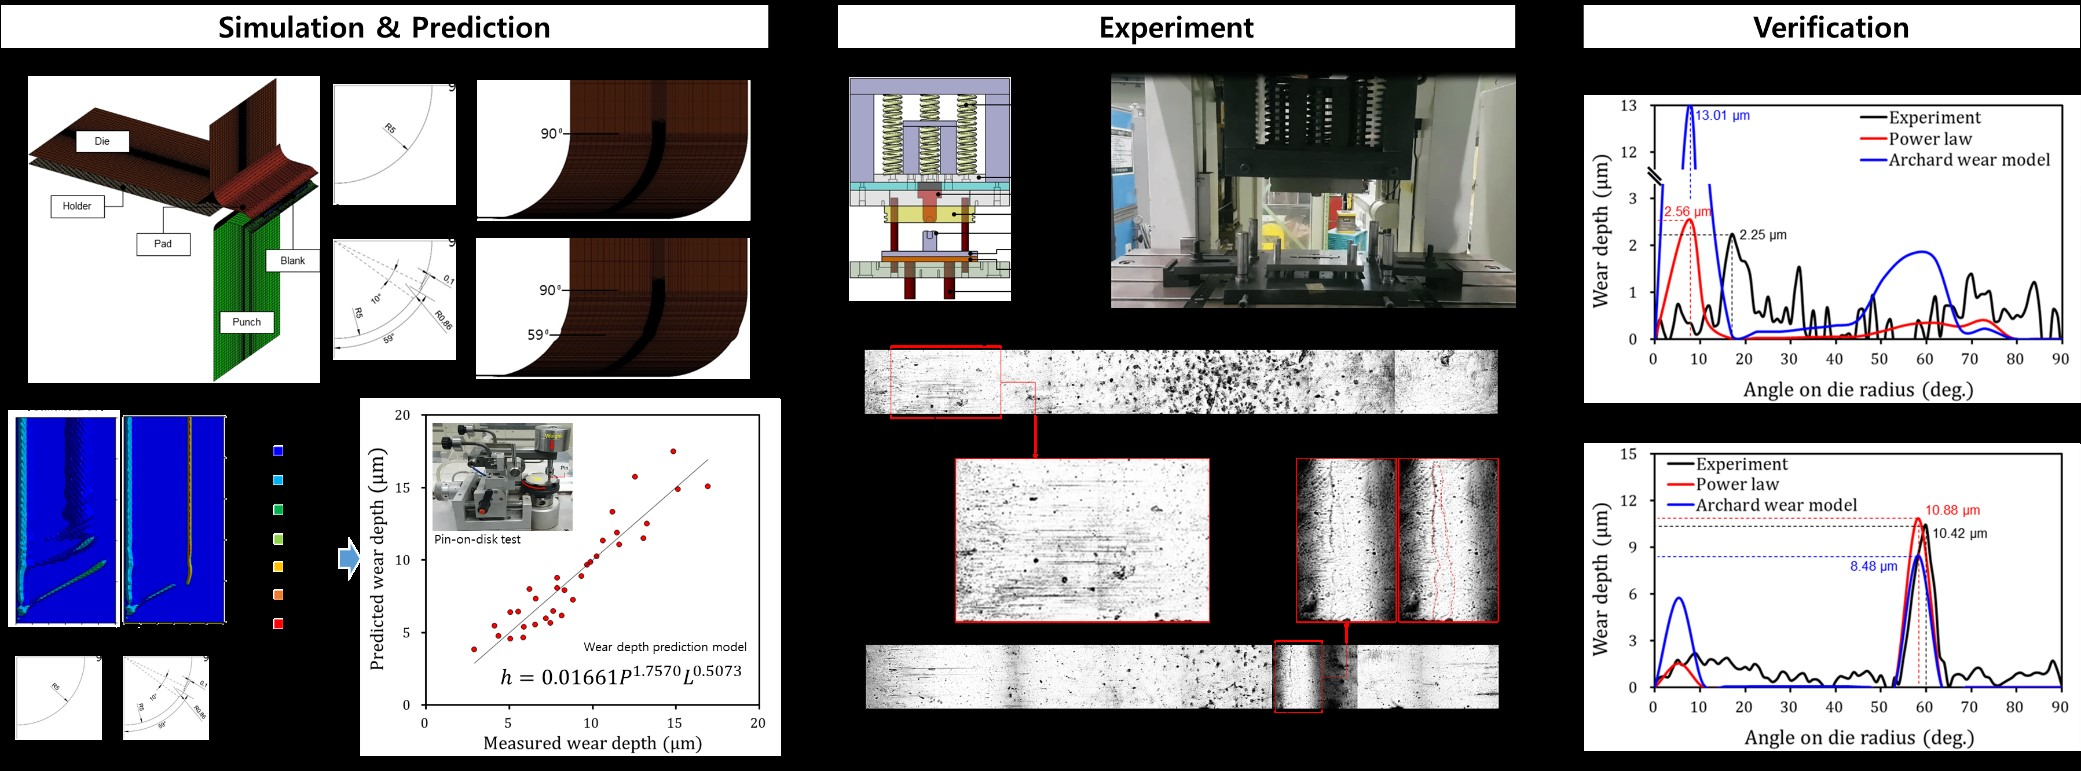
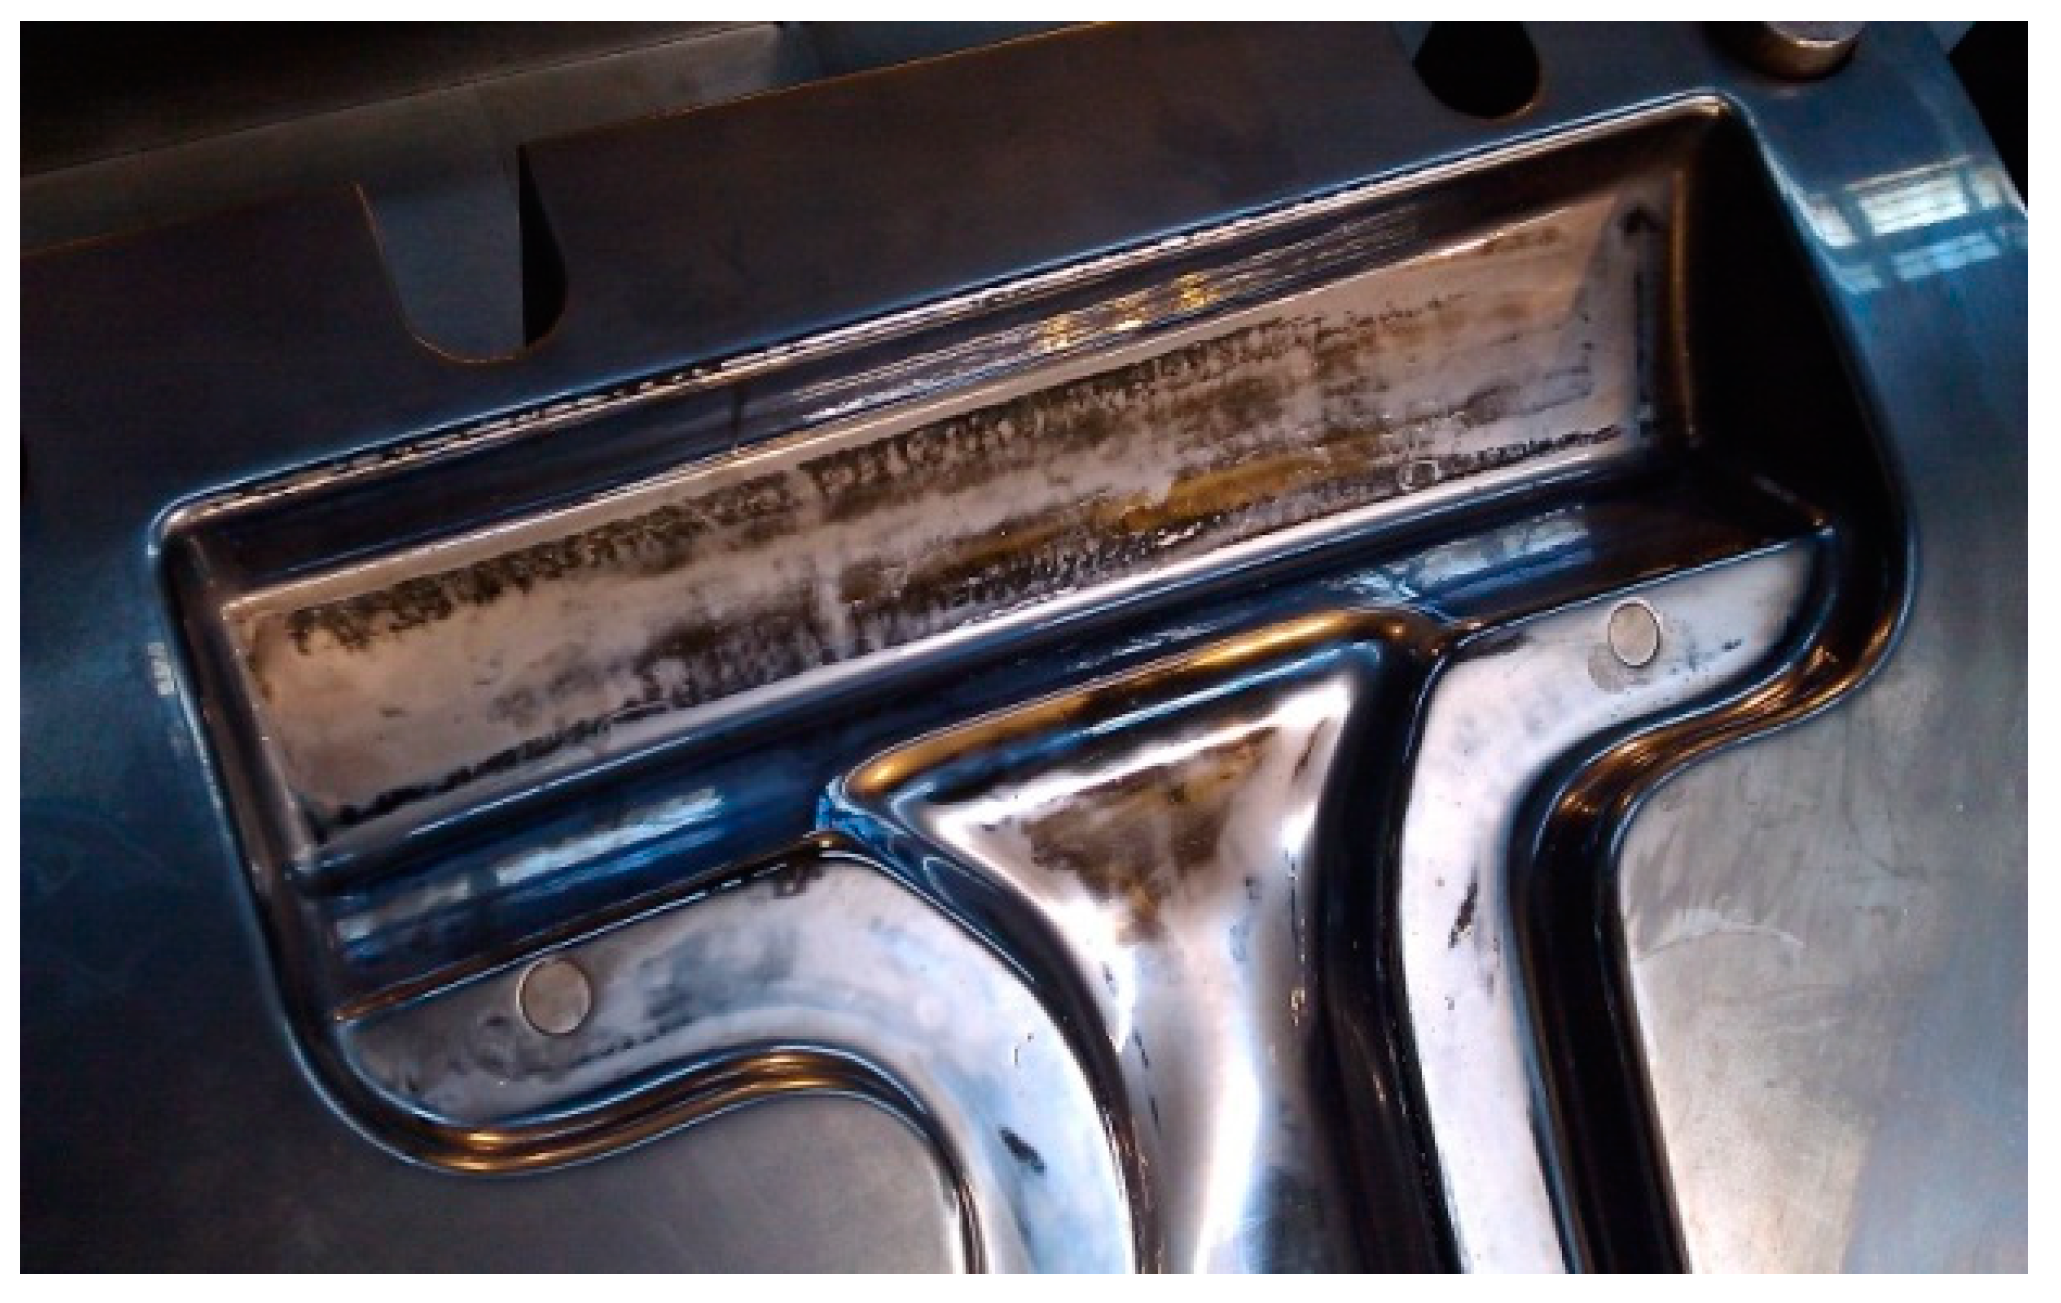
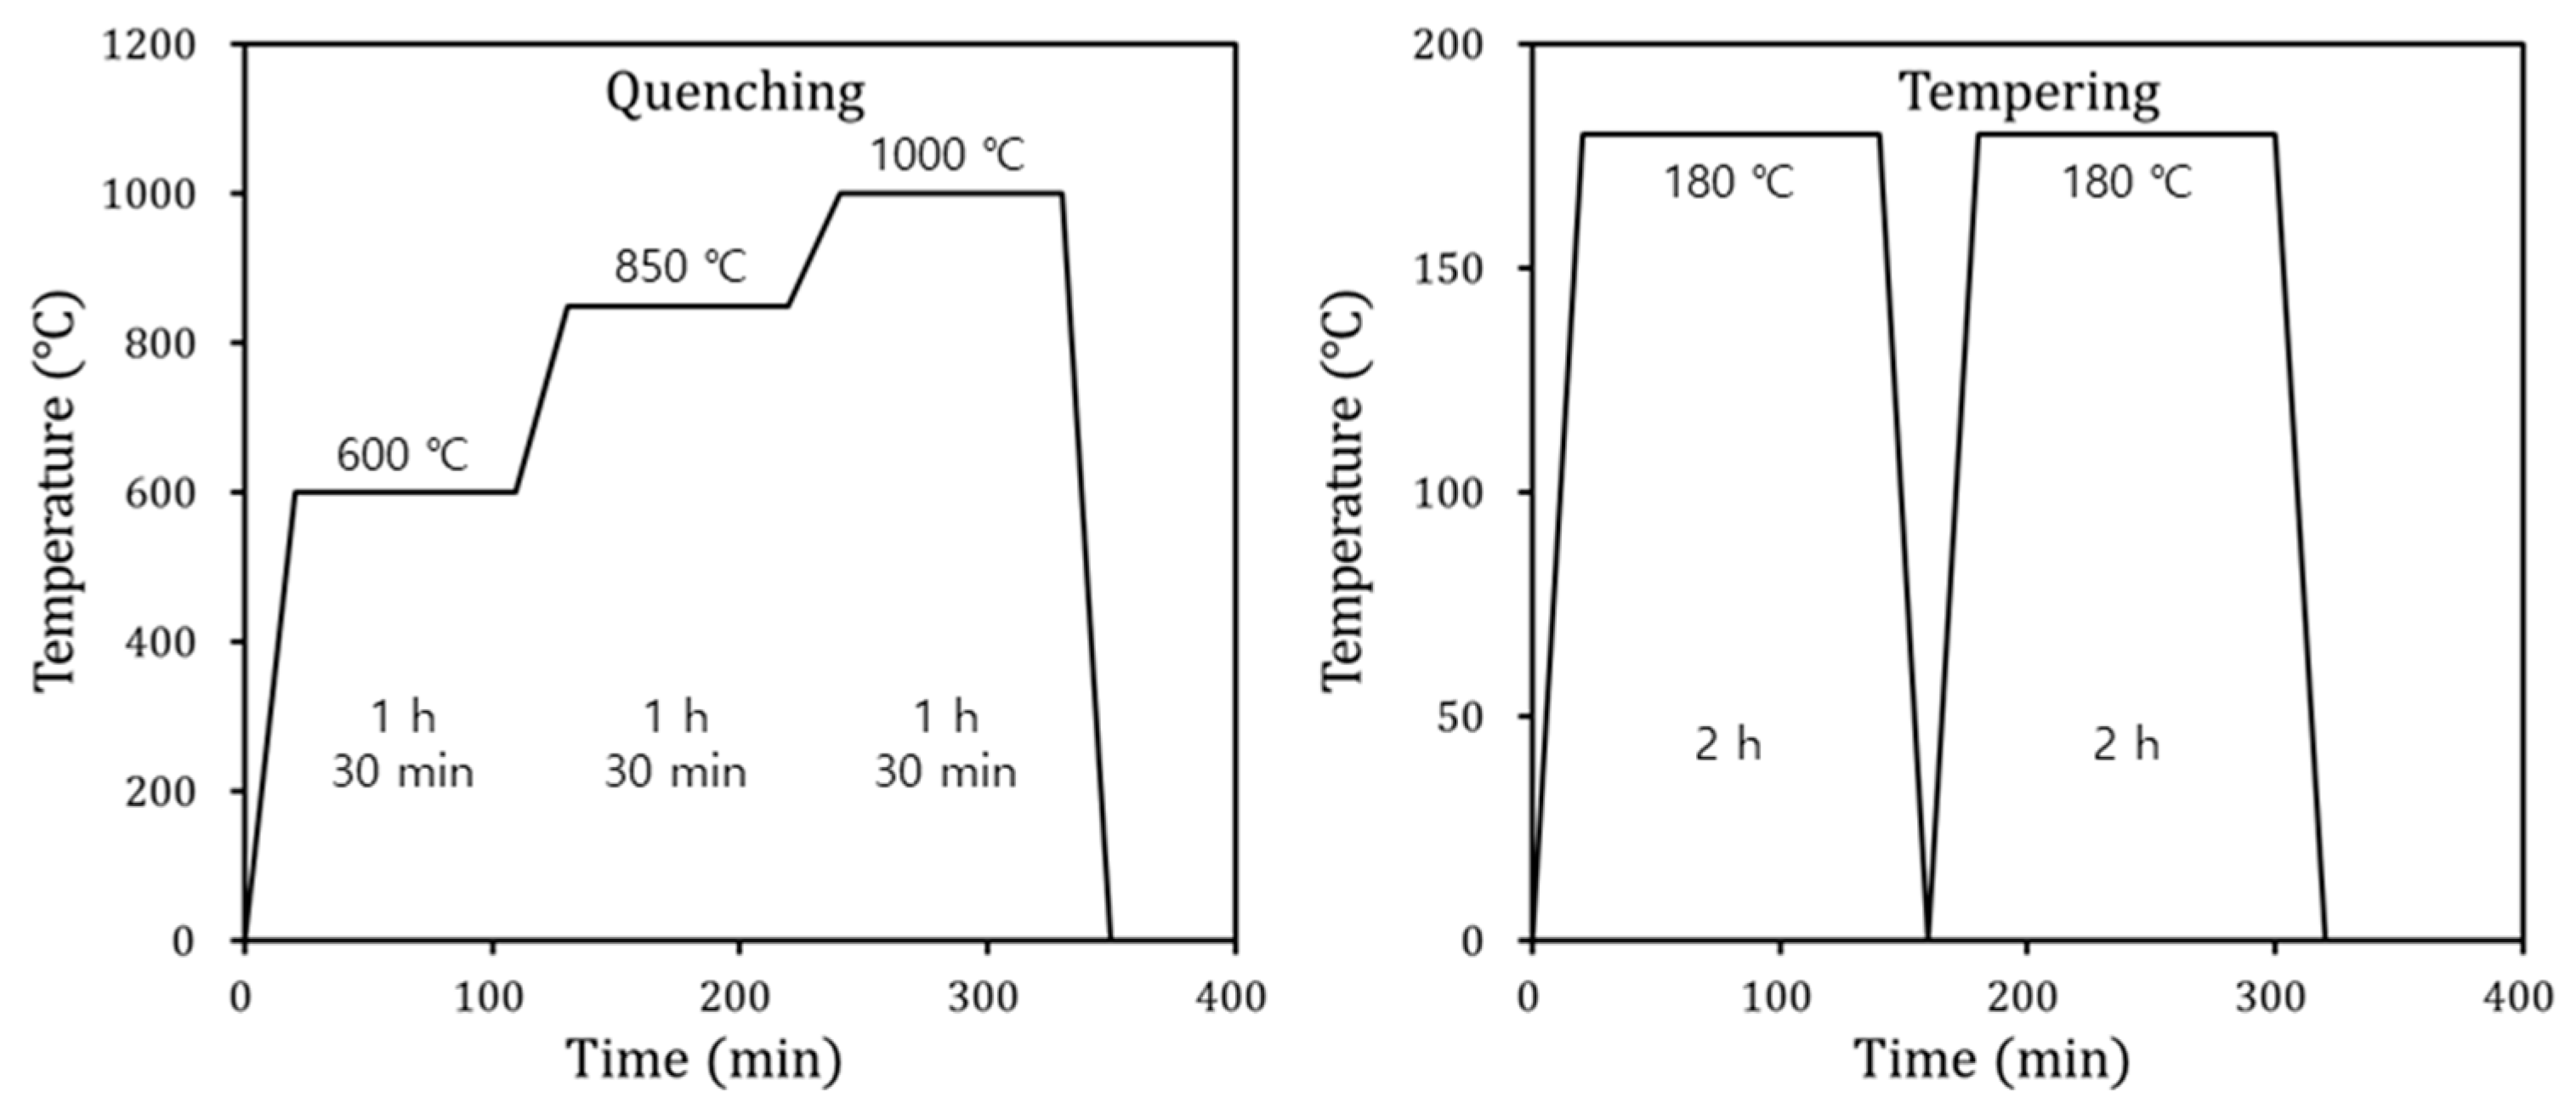
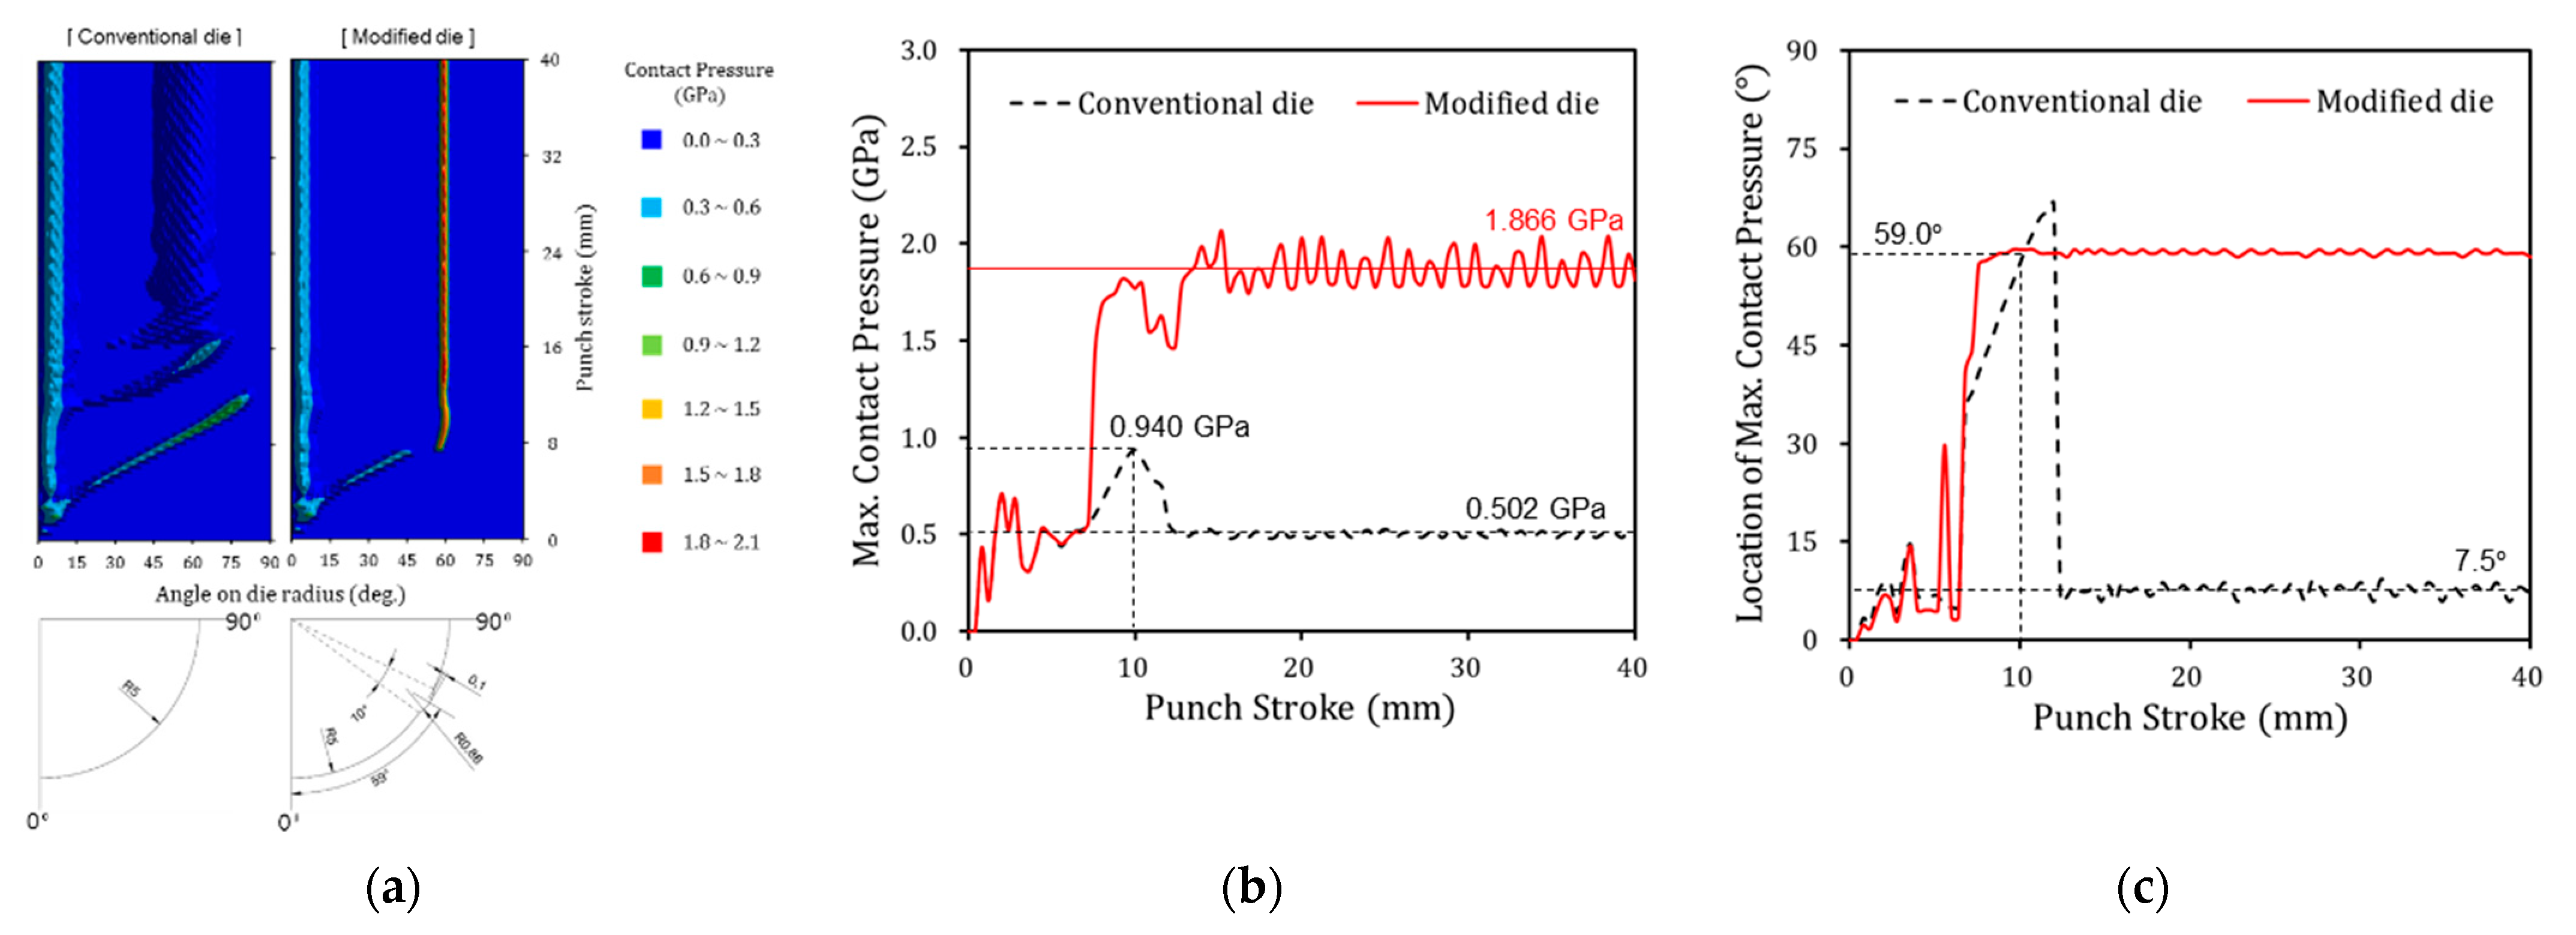
- The contact conditions applied to the die surface were evaluated by the sheet metal forming of the B-pillar based on FE simulation. The contact pressure 1.852 GPa was concentrated at the die corner radius where the actual wear occurred. It was conformed that the contact pressure has a significant influence on the tool wear, by comparing the wear status of the B-pillar die and simulation results.
- (2)
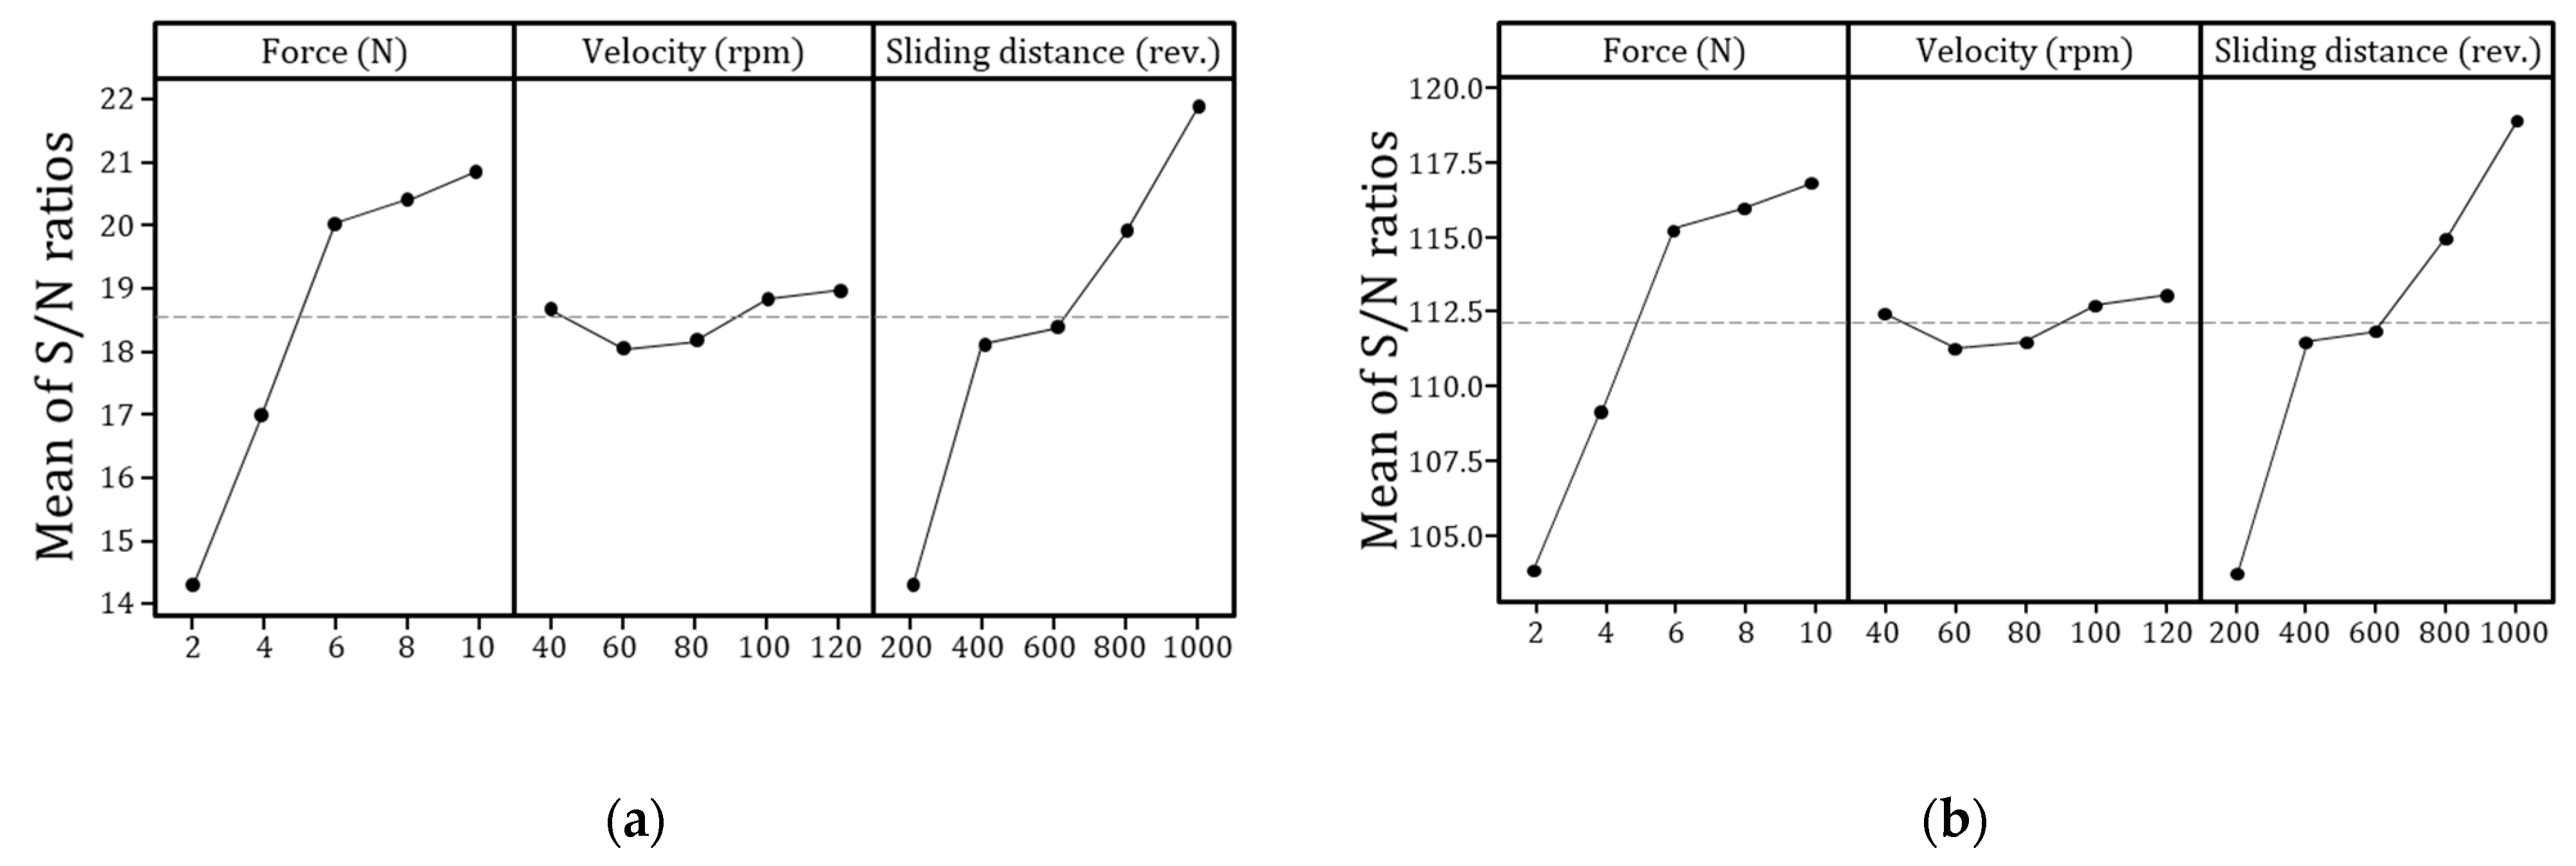
- The pin-on-disk test was conducted for the quantitative evaluation of the wear behavior. Based on the contact pressure of 1.852 GPa of the B-pillar simulation result, the range of test conditions was established. According to statistical analyses using the S/N ratio and the ANOVA result, it was found that contact pressure and sliding distance had a significant influence on the tool wear of the drawing process but the effect of the sliding velocity was minor.
- (3)
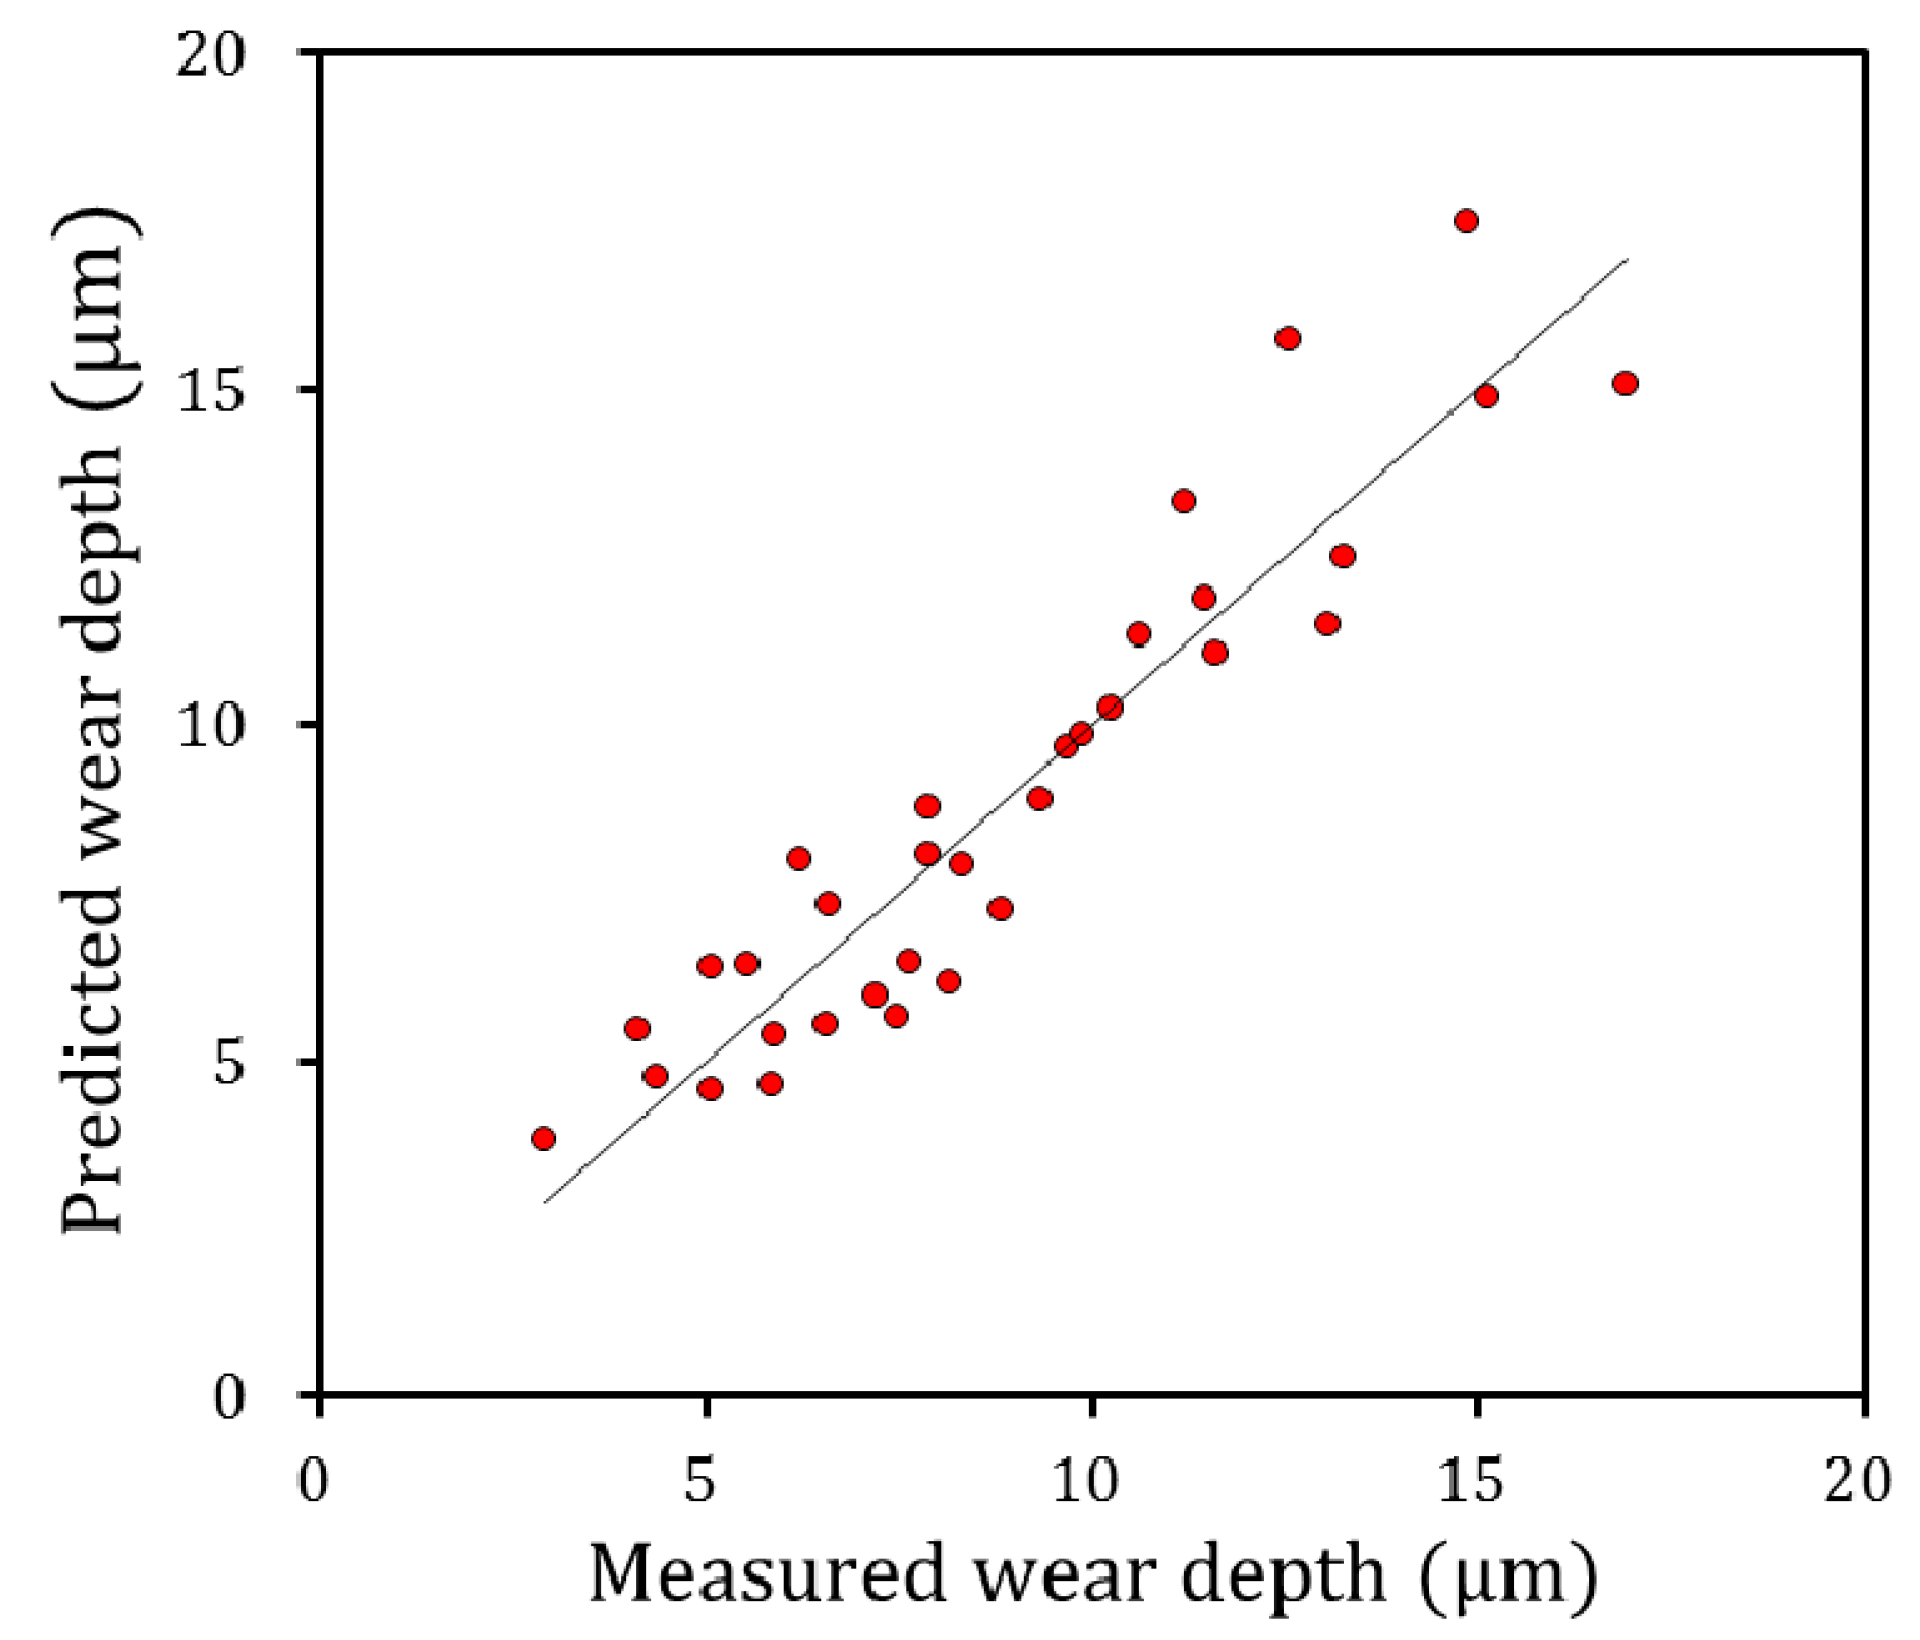
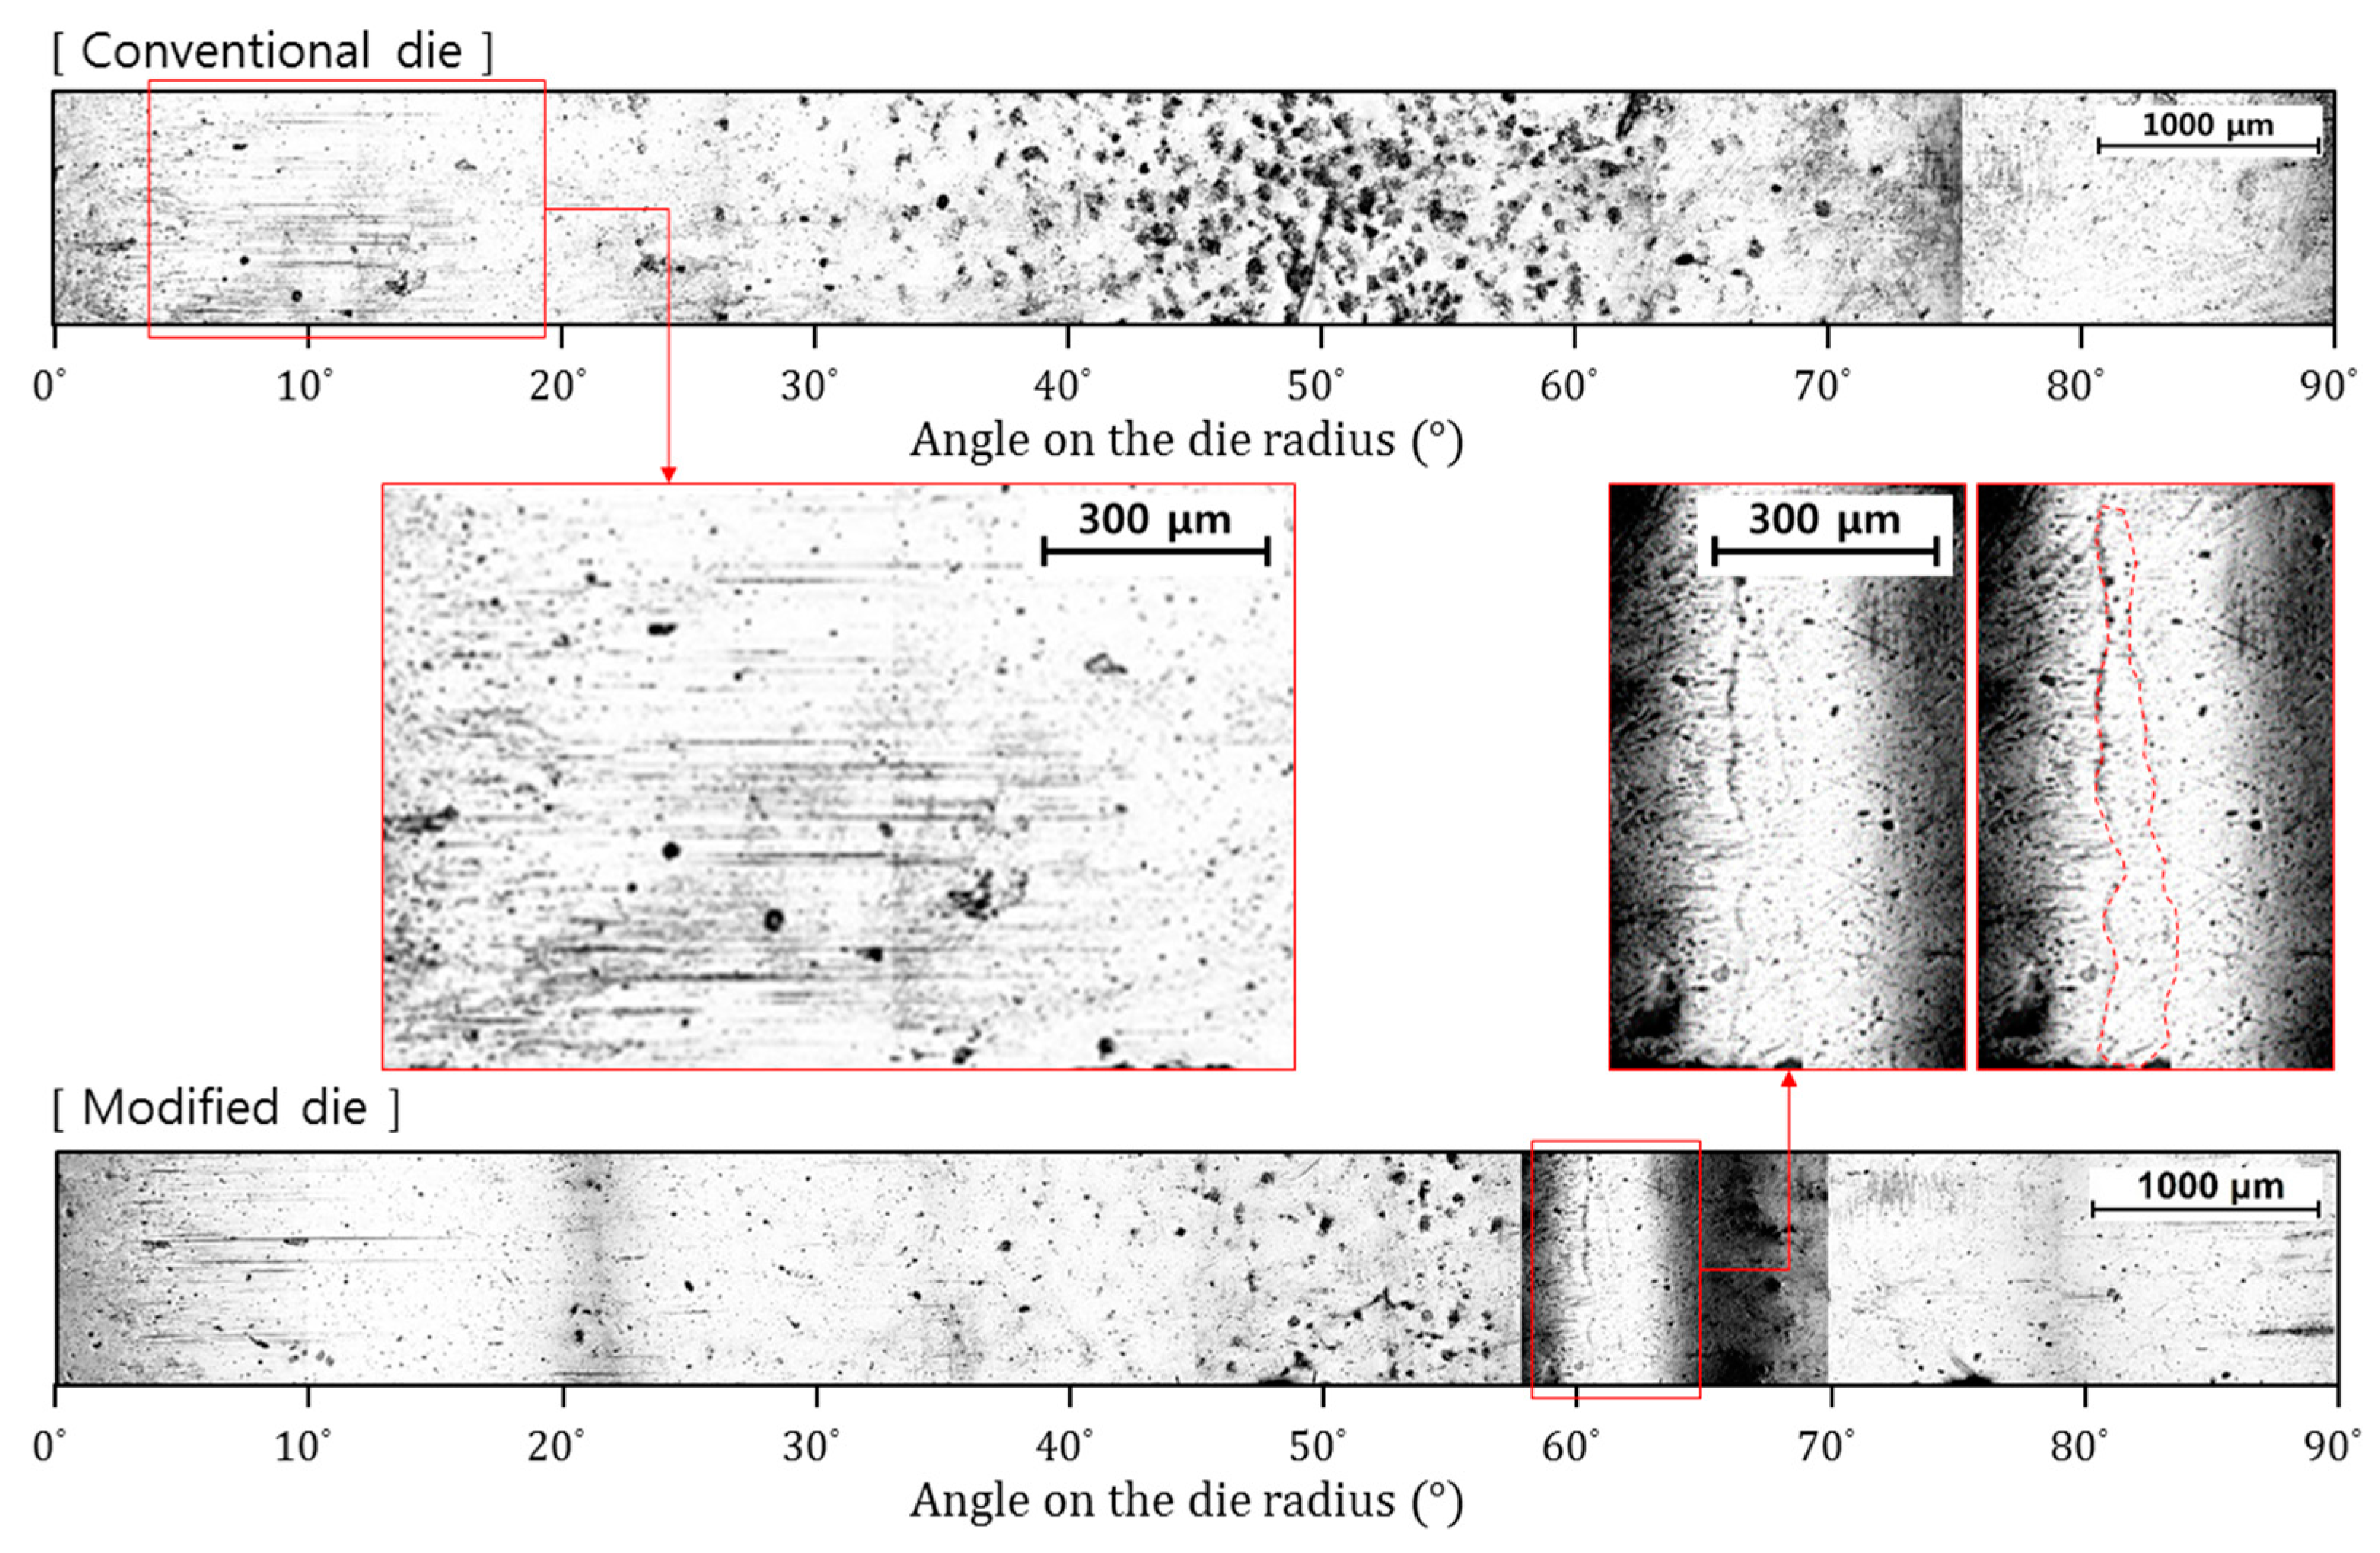
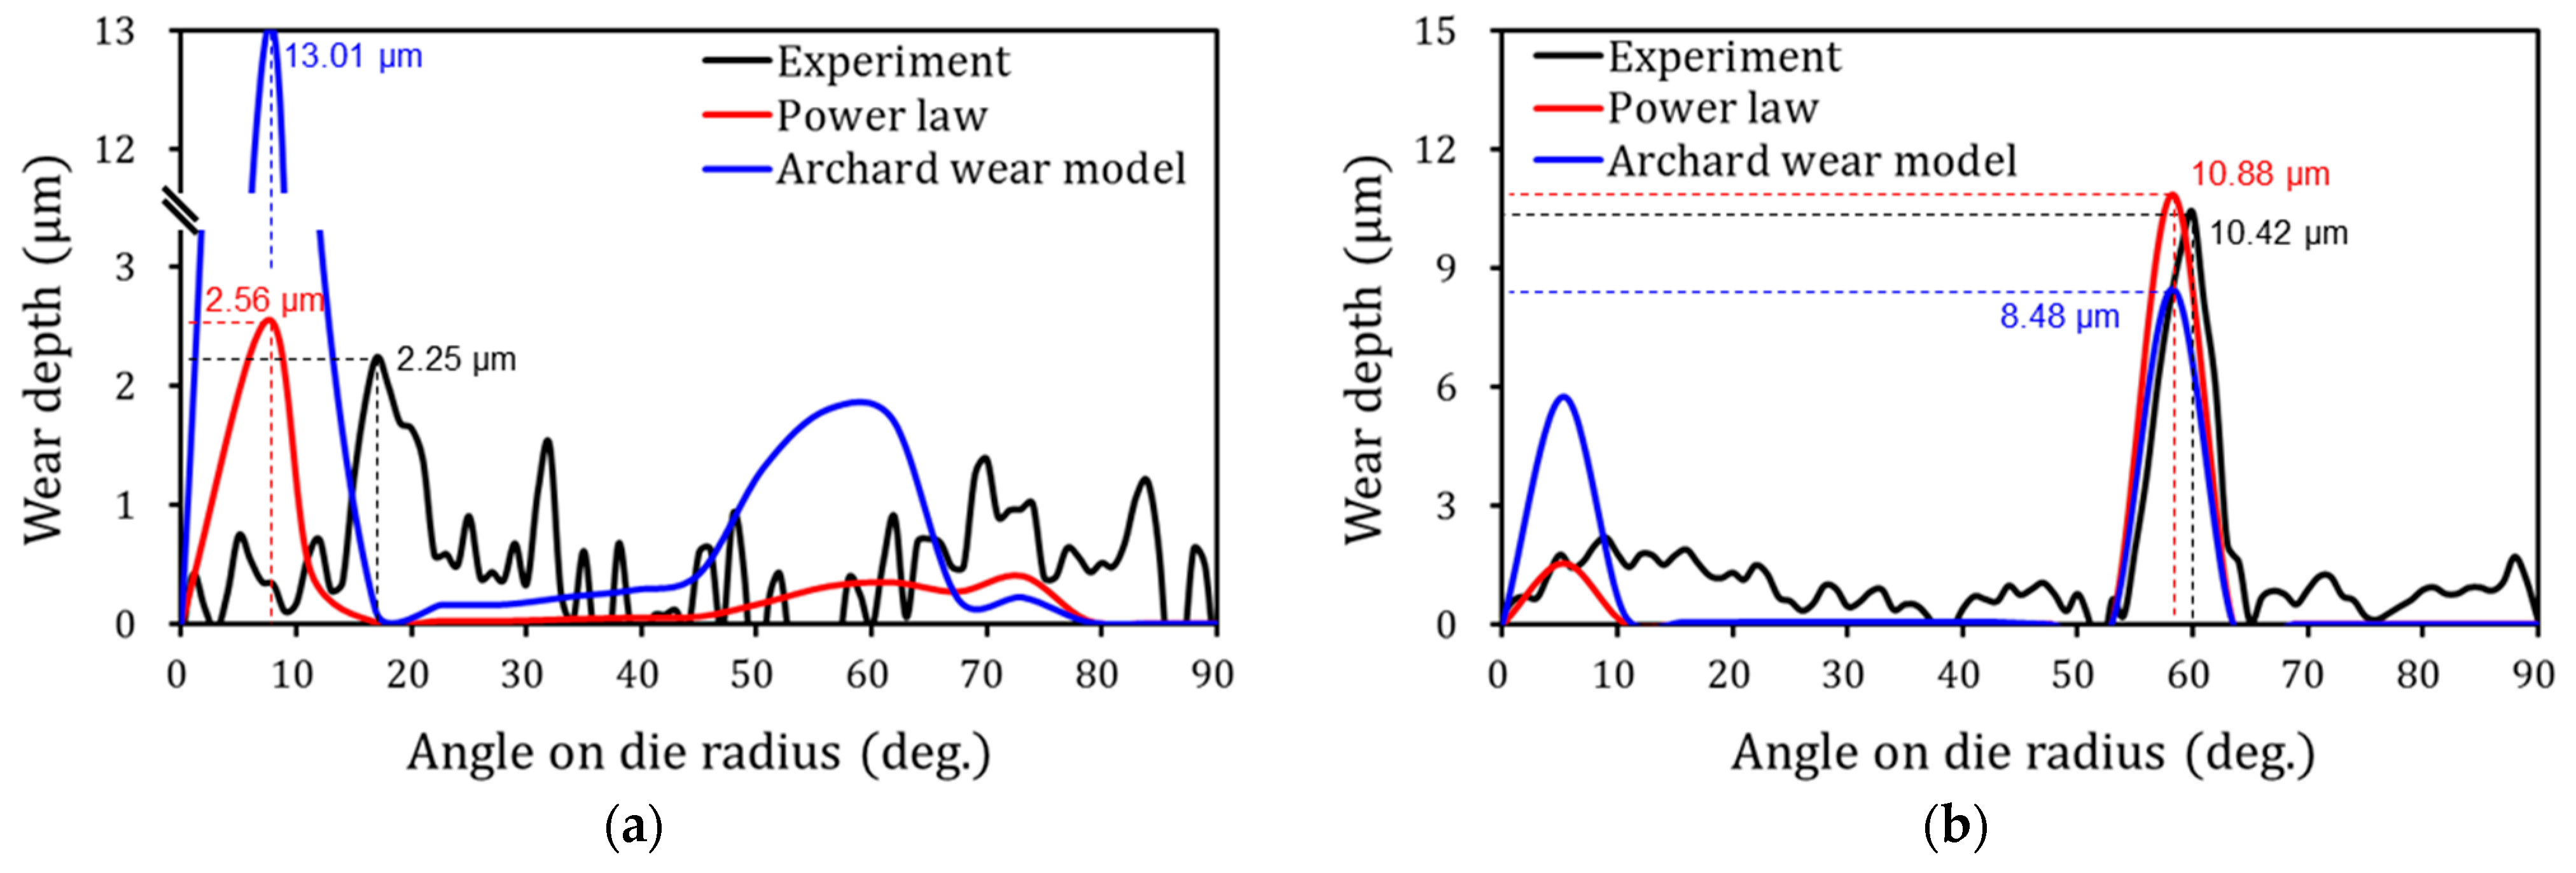
- The tool wear prediction model was constructed by the power-law-type regression model to predict the nonlinear evolution of the tool wear depth as a function of the contact pressure and the sliding distance based on the pin-on-disk test results. The U-draw bending test was employed to verify the reliability of the wear prediction model. The modified die was newly designed to accelerate the wear behaviors of the tool surface, which generated a contact pressure four times higher than that of the conventional die. The drawing wear test was conducted using conventional and accelerated drawing tools to measure the wear depth under different contact conditions. For the conventional die and the modified die, the predicted values showed an error of 13.78 and 4.41%, respectively, compared with the experimental values. From the validation process, it can be concluded that the power-law-type wear prediction model could provide reliable prediction for the continuous wear depth profile of the DP980 material and the PVD CrN-coated tool.
- (4)
- The suggested prediction procedure can be further generalized to obtain tool wear predictions by constructing an experimental database of the pin-on-disk tests of combinations of various sheet materials and tool coatings. It has the advantage of saving time and cost because it can predict the tool wear in the drawing process by using pin-on-disk test results. This prediction procedure will help reduce maintenance costs and productivity.
Author Contributions
Funding
Institutional Review Board Statement
Informed Consent Statement
Data Availability Statement
Acknowledgments
Conflicts of Interest
Nomenclature
| k, ε0, n | Coefficients of Swift hardening equation |
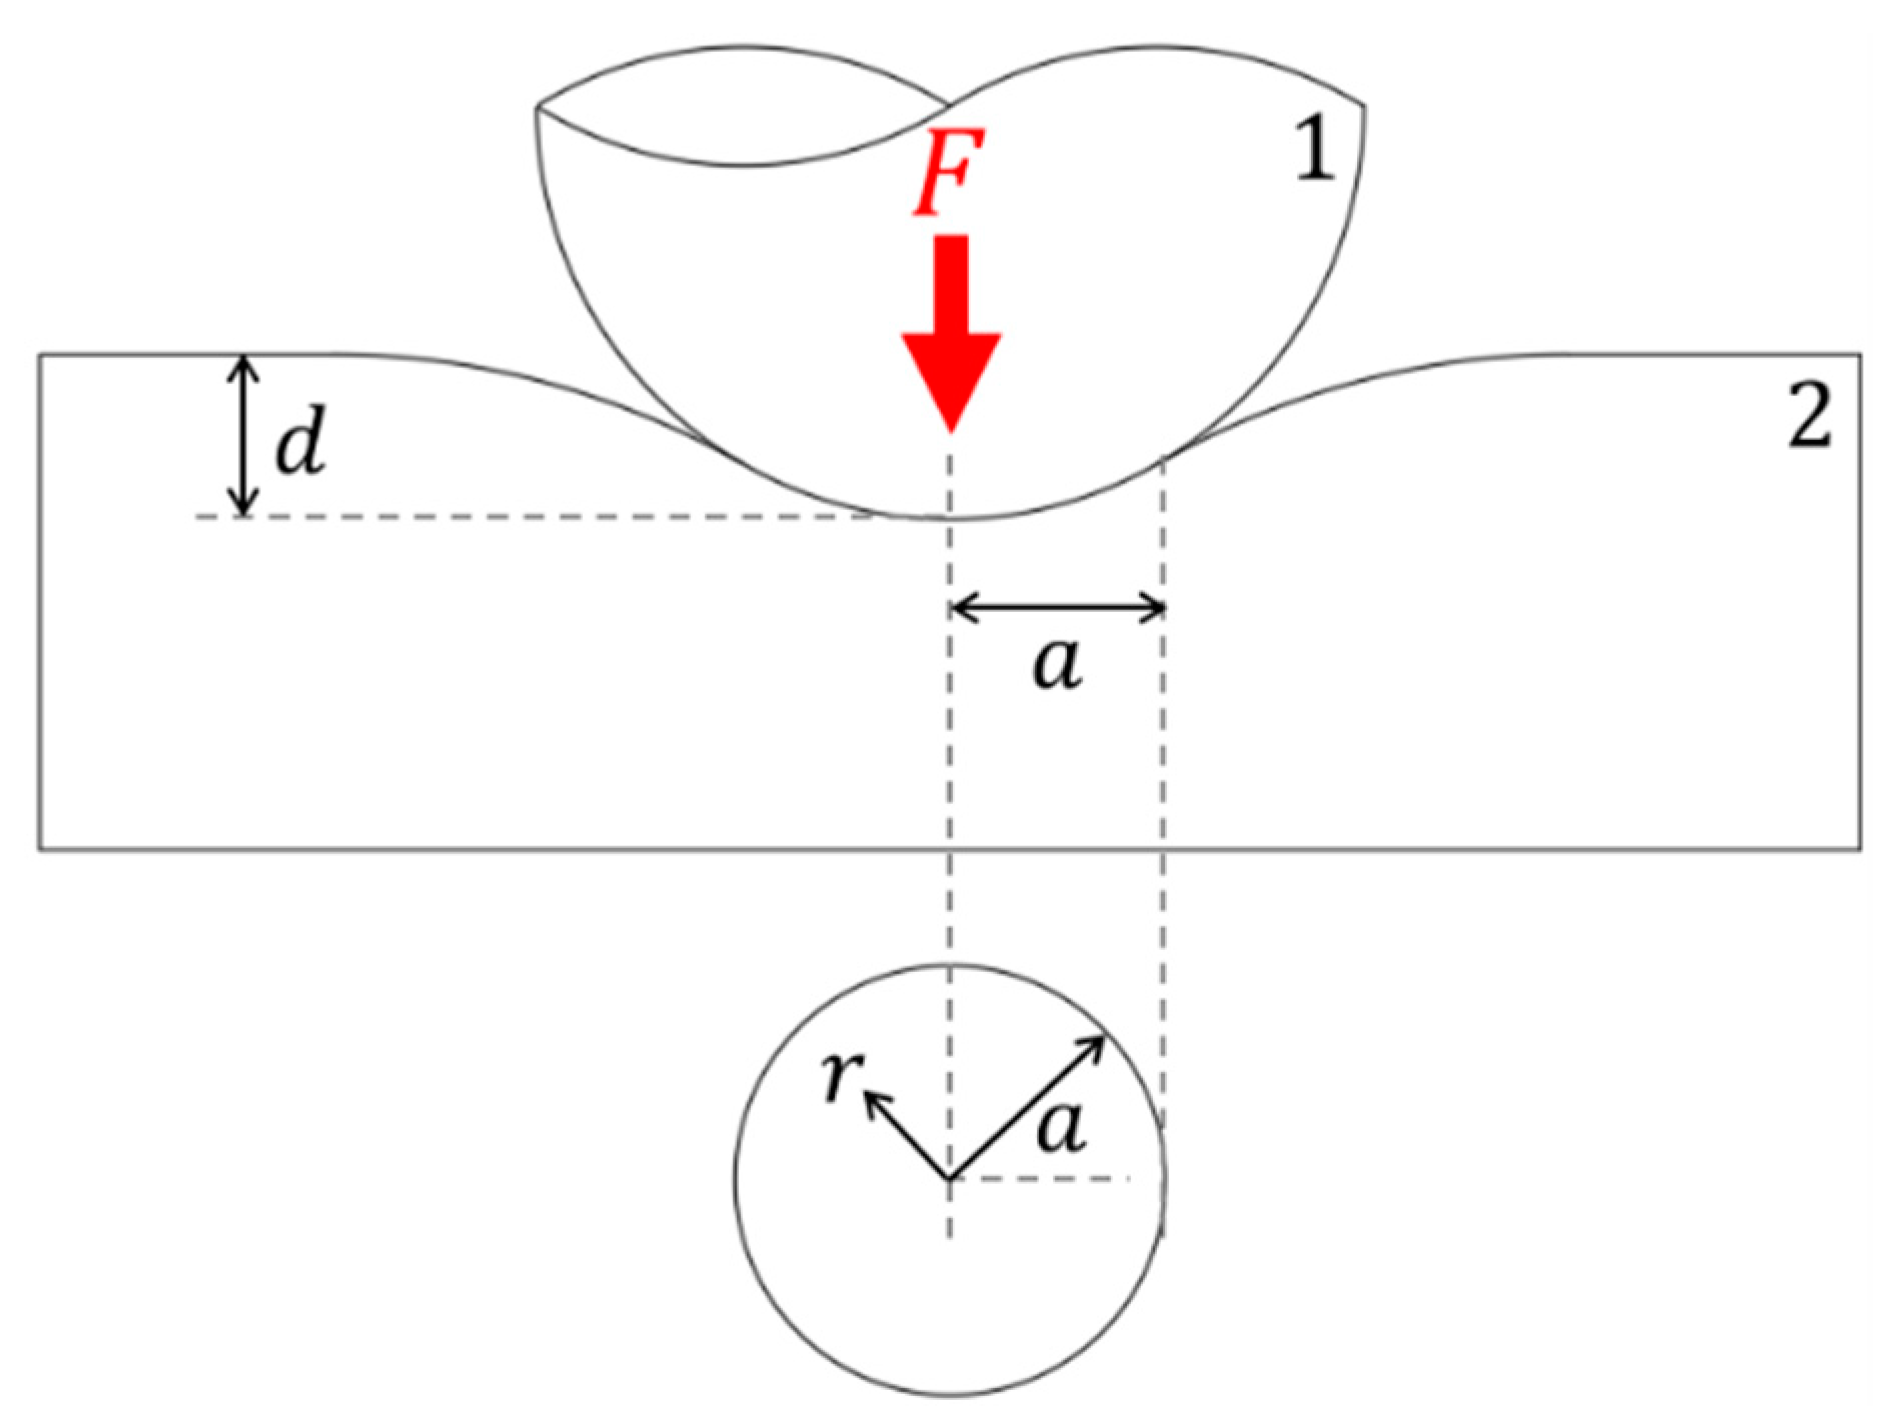
| a | Radius of the contact surface (mm) |
| R | Radius of the elastic sphere (mm) |
| d | Indented depth (mm) |
| Er | Reduced elastic modulus (MPa) |
| E | Elastic modulus (MPa) |
| ν | Poisson’s ratio |
| p | Contact pressure acting on the elastic body (MPa) |
| p0 | Maximum contact pressure acting on the elastic body (MPa) |
| r | Distance from the center of the circle at the contact area (mm) |
| F | Normal force (N) |
| V | Sliding velocity (rpm) |
| L | Sliding distance (rev.) |
| Ap | Tool wear area (mm2) |
| dw | Wear scar diameter (mm) |
| rp | Pin end radius (mm) |
| h | Tool wear depth (μm) |
| Vloss | Pin volume loss (mm3) |
| η | Signal-to-noise (S/N) ratio |
| K, α, β | Coefficient of the wear depth prediction model |
References
- Li, Y.; Lin, Z.; Jiang, A.; Chen, G. Use of high strength steel sheet for lightweight and crashworthy car body. Mater. Des. 2003, 24, 177–182. [Google Scholar] [CrossRef]
- Carlsson, P. Surface Engineering in Sheet Metal Forming. Ph.D. Thesis, Uppsala University, Uppsala, Swenden, 2005. [Google Scholar]
- Jeon, Y.J. A study on the Prediction of Tool Damage According to the Surface Treatment in the Press Stamping Process. Master’s Thesis, Daegu University, Daegu, Korea, 2011. [Google Scholar]
- Podra, P.; Andersson, S. Finite element analysis wear simulation of a conical spinning contact considering surface topography. Wear 1999, 224, 13–21. [Google Scholar] [CrossRef]
- Kim, N.H.; Won, D.; Burris, D.; Holtkamp, B.; Gessel, G.R.; Swanson, P.; Sawyer, W.G. Finite element analysis and experiments of metal/metal wear in oscillatory contacts. Wear 2005, 258, 1787–1793. [Google Scholar] [CrossRef]
- Lengiewicz, J.; Stupkiewicz, S. Efficient model of evolution of wear in quasi-steady-state sliding contacts. Wear 2013, 303, 611–621. [Google Scholar] [CrossRef]
- Yen, Y.C.; Sohner, J.; Lilly, B.; Altan, T. Estimation of tool wear in orthogonal cutting using the finite element analysis. J. Mater. Process. Technol. 2004, 146, 82–91. [Google Scholar] [CrossRef]
- Binder, M.; Klocke, F.; Lung, D. Tool wear simulation of complex shaped coated cutting tools. Wear 2015, 330–331, 600–607. [Google Scholar] [CrossRef]
- Binder, M.; Klocke, F.; Doebbeler, B. An advanced numerical approach on tool wear simulation for tool and process design in metal cutting. Simul. Modell. Pract. Theory 2017, 70, 65–82. [Google Scholar] [CrossRef]
- Pimenov, D.Y.; Guzeev, V.I. Mathematical model of plowing forces to account for flank wear using FME modeling for orthogonal cutting scheme. Int. J. Adv. Manuf. Technol. 2017, 89, 3149–3159. [Google Scholar] [CrossRef]
- Archard, J.F. Rubbing of flat surface. J. Appl. Phys. 1953, 24, 981–988. [Google Scholar] [CrossRef]
- Lee, R.S.; Hou, J.L. Application of numerical simulation for wear analysis of warm forging die. J. Mater. Process. Technol. 2003, 140, 43–48. [Google Scholar] [CrossRef]
- Behrens, B.A.; Schaefer, F. Prediction of wear in hot forging tools by means of finite-element-analysis. J. Mater. Process. Technol. 2005, 167, 309–315. [Google Scholar] [CrossRef]
- Hoffmann, H.; Hwang, C.; Ersoy, K. Advanced wear simulation in sheet metal forming. CIRP Ann. 2005, 54, 217–220. [Google Scholar] [CrossRef]
- Hoffmann, H.; Nurnberg, G. A new approach to determine the wear coefficient for wear prediction of sheet metal forming tools. Prod. Eng. Res. Dev. 2007, 1, 357–363. [Google Scholar] [CrossRef]
- Rhee, S.K. Wear equation for polymers sliding against metal surfaces. Wear 1970, 16, 431–445. [Google Scholar] [CrossRef]
- Bayer, R.G. A general model for sliding wear in electrical contacts. Wear 1993, 162–164, 913–918. [Google Scholar]
- Hsu, S.M.; Shen, M.C.; Ruff, A.W. Wear prediction for metals. Tribol. Int. 1997, 30, 311–383. [Google Scholar] [CrossRef]
- Eriksen, M. The influence of die geometry on tool wear in deep drawing. Wear 1997, 207, 10–15. [Google Scholar] [CrossRef]
- Gonzalez, C.; Martin, A.; Llorca, J.; Carrido, M.A.; Gomez, M.T.; Rico, A.; Rodriguez, J. Numerical analysis of pin on disc tests on Al-Li/SiC composites. Wear 2005, 259, 609–612. [Google Scholar] [CrossRef]
- Bortoleto, E.M.; Rovani, A.C.; Seriacopi, V.; Profito, F.J.; Zachariadis, D.C.; Machado, I.F. Experimental and numerical analysis of dry contact in the pin on disc test. Wear 2013, 301, 19–26. [Google Scholar] [CrossRef]
- Pereira, M.P.; Yan, W.; Rolfe, B.F. Contact pressure evolution and its relation to wear in sheet metal forming. Wear 2008, 265, 1687–1699. [Google Scholar] [CrossRef]
- Ersoy-Nurnberg, K.; Nurnberg, G.; Golle, M.; Hoffmann, H. Simulation of wear on sheet metal forming tools—An energy approach. Wear 2008, 265, 1801–1807. [Google Scholar] [CrossRef]
- KS D 3753:2008. Alloys Tool Steels; Korean Standard Association: Seoul, Korea, 2018.
- Farabi, N.; Chen, D.L.; Zhou, Y. Microstructure and mechanical properties of laser welded dissimilar DP600/DP980 dual-phase steel joints. J. Alloys Compd. 2011, 509, 982–989. [Google Scholar] [CrossRef]
- Taguchi, G.; Konishi, S. Taguchi Methods Orthogonal Arrays and Linear Graphs: Tools for Quality Engineering; American Supplier Institute: Dearborn, MI, USA, 1987. [Google Scholar]
- Pereira, M.P.; Yan, W.; Rolfe, B.F. Sliding distance, contact pressure and wear in sheet metal stamping. Wear 2010, 268, 1275–1284. [Google Scholar] [CrossRef]
- Lingbeek, R.A.; Meinders, T. Towards efficient modelling of macro and micro tool deformations in sheet metal forming. Eur. J. Eng. Educ. 2007, 908, 723–728. [Google Scholar]
- Choi, K.Y.; Lee, M.G.; Kim, H.Y. Sheet metal forming simulation considering die deformation. Int. J. Autom. Technol. 2013, 14, 935–940. [Google Scholar] [CrossRef]
- Hertz, H.R. Übber die berüehrung elastischer köerper. Journal für die Reine und Angewandte Mathematik 1882, 92, 156–171. [Google Scholar]
- Johnson, K.L. Contact Mechanics; Cambridge University Press: Cambridge, UK, 1985. [Google Scholar]
- Ichimura, H.; Ando, I. Mechanical properties of arc-evaporated CrN coating: Part 1-nanoindentaion hardness and elastic modulus. Surface Coat. Technol. 2001, 145, 88–93. [Google Scholar] [CrossRef]
- Fabis, P.M.; Cooke, R.A.; Mcdonough, S. Stress state of chromium nitride films deposited by reactive direct current planar magnetron sputtering. J. Vacuum Sci. Technol. A 1990, 8, 3809. [Google Scholar] [CrossRef]
- ASTM G99-17. Standard Test Method for Wear Testing with a Pin-On-Disk Apparatus; ASTM International: West Conshohocken, PA, USA, 2017.
- MINITAB User’s Guide 2: Data Analysis and Quality Tools; Minitab Inc.: State College, PA, USA, 2000.
- Weiss, M.; Pereira, M.P.; Rolfe, B.F.; Hilditch, T.B. Wear mechanisms in forming of HSS and AHSS. In Proceedings of the International Deep Drawing Research Group (IDDRG) 2009 International Conference, Golden, CO, USA, 1–3 June 2009. [Google Scholar]


| Thickness (mm) | YS 1 (MPa) | UTS 2 (MPa) | Swift Hardening Law | R-Value | ||||
|---|---|---|---|---|---|---|---|---|
| k (MPa) | ||||||||
| 1.4 | 721.6 | 1042.0 | 1499.11 | 0.00108 | 0.107 | 0.956 | 0.996 | 1.098 |
| Steel | C | Mn | Si | Al | Cr | Ni | N | Fe | Mo | V |
|---|---|---|---|---|---|---|---|---|---|---|
| DP980 | 0.15 | 1.45 | 0.33 | 0.05 | 0.02 | 0.01 | 0.009 | Balance | - | - |
| STD11 | 1.55 | 0.30 | 0.26 | - | 11.36 | - | - | - | 0.81 | 0.20 |
| Contact Parameters | Level 1 | Level 2 | Level 3 | Level 4 | Level 5 |
|---|---|---|---|---|---|
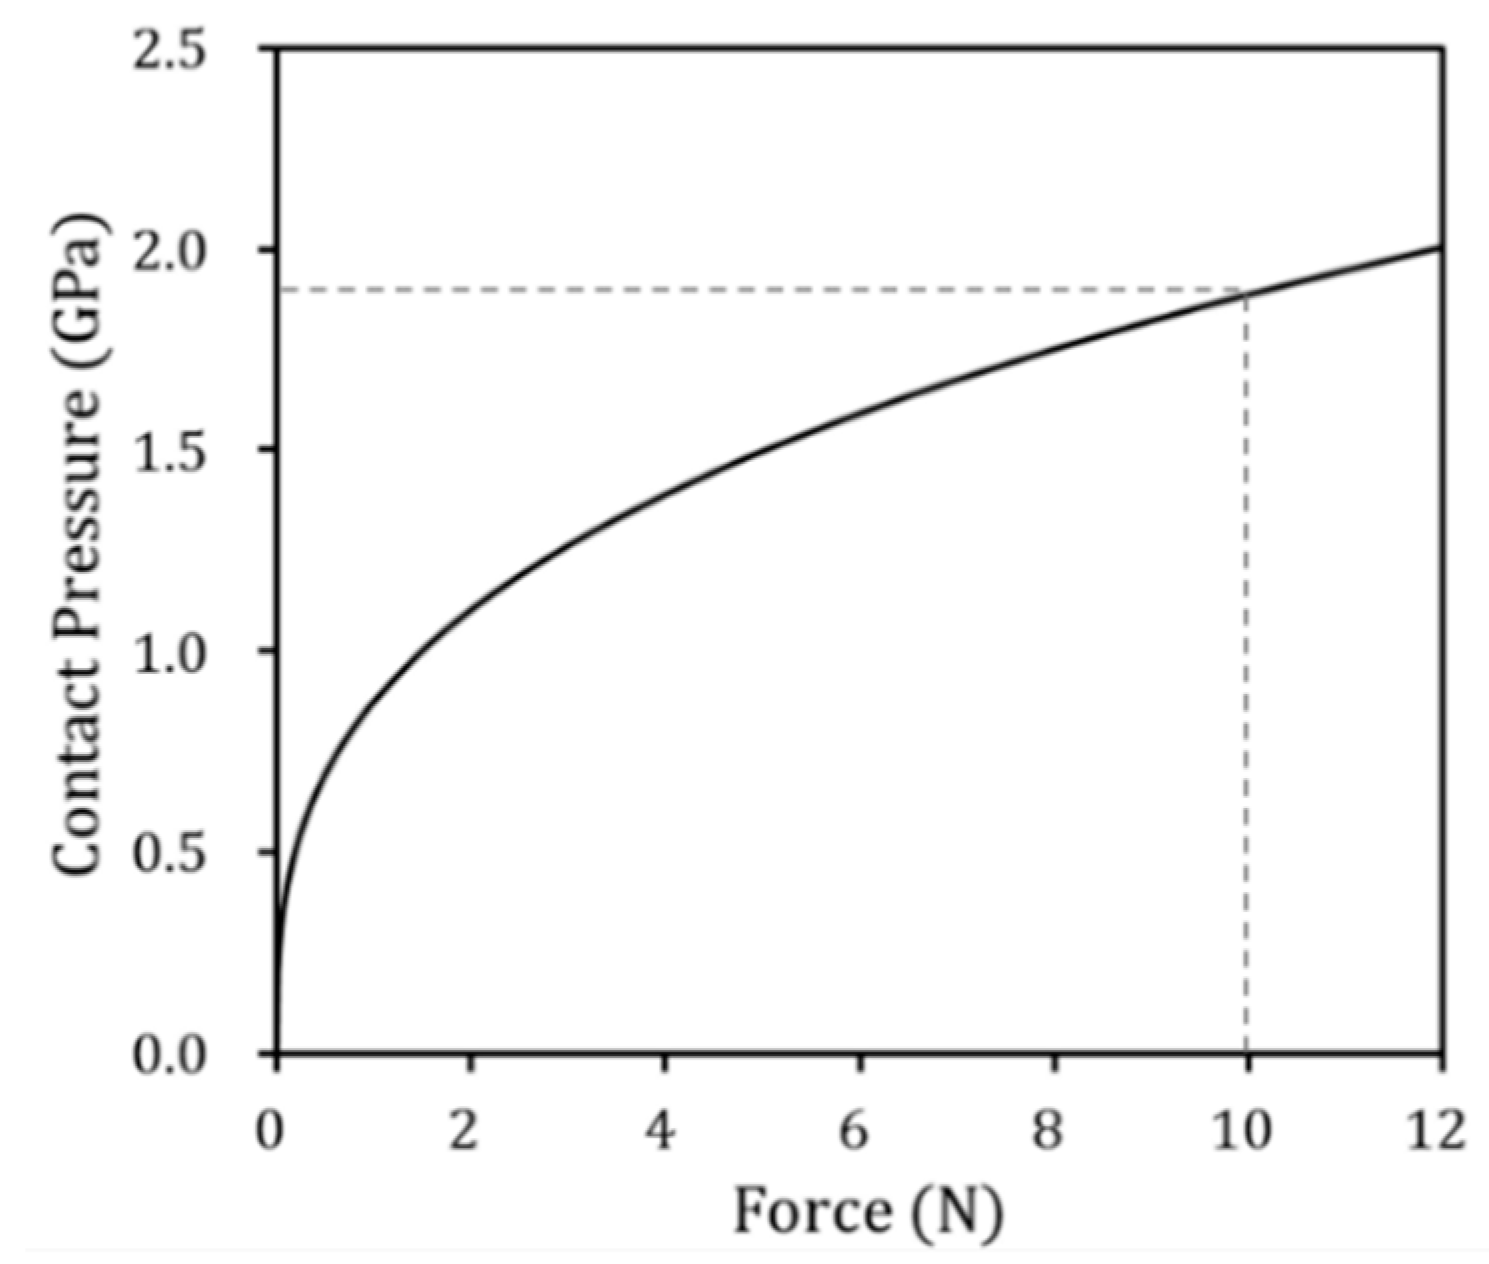
| Normal force, F | 2 N (1.104 GPa) | 4 N (1.391 GPa) | 6 N (1.592 GPa) | 8 N (1.752 GPa) | 10 N (1.887 GPa) |
| Sliding velocity, V | 120 rpm (188.4 mm/s) | 100 rpm (157.0 mm/s) | 80 rpm (125.6 mm/s) | 60 rpm (94.2 mm/s) | 40 rpm (62.8 mm/s) |
| Sliding distance, L | 1000 rev. (94.20 m) | 800 rev. (75.36 m) | 600 rev. (56.52 m) | 400 rev. (37.68 m) | 200 rev. (18.84 m) |
| Run | Normal Force F (N) | Sliding Velocity V (rpm) | Sliding Distance L (rev.) | Pin Wear Depth h (μm) | Pin Volume Loss Vloss (mm3) |
|---|---|---|---|---|---|
| 1 | 10 | 120 | 1000 | 15.1 ± 1.3 | 2.136 ± 0.350 |
| 2 | 10 | 100 | 800 | 14.9 ± 3.8 | 2.085 ± 0.509 |
| 3 | 10 | 80 | 600 | 11.5 ± 1.0 | 1.241 ± 0.215 |
| 4 | 10 | 60 | 400 | 11.3 ± 1.5 | 1.206 ± 0.345 |
| 5 | 10 | 40 | 200 | 5.6 ± 1.0 | 0.299 ± 0.690 |
| 6 | 8 | 120 | 800 | 12.5 ± 2.3 | 1.467 ± 0.453 |
| 7 | 8 | 100 | 600 | 11.9 ± 0.5 | 1.326 ± 0.128 |
| 8 | 8 | 80 | 400 | 8.9 ± 0.5 | 0.744 ± 0.059 |
| 9 | 8 | 60 | 200 | 5.1 ± 0.7 | 0.288 ± 0.035 |
| 10 | 8 | 40 | 1000 | 17.5 ± 0.5 | 2.868 ± 0.191 |
| 11 | 6 | 120 | 600 | 9.6 ± 0.9 | 0.876 ± 0.085 |
| 12 | 6 | 100 | 400 | 8.1 ± 1.0 | 0.615 ± 0.081 |
| 13 | 6 | 80 | 200 | 6.4 ± 0.5 | 0.392 ± 0.050 |
| 14 | 6 | 60 | 1000 | 15.7 ± 2.2 | 2.326 ± 0.356 |
| 15 | 6 | 40 | 800 | 13.3 ± 0.4 | 1.666 ± 0.110 |
| 16 | 4 | 120 | 400 | 8.0 ± 1.2 | 0.600 ± 0.064 |
| 17 | 4 | 100 | 200 | 4.8 ± 1.1 | 0.215 ± 0.037 |
| 18 | 4 | 80 | 1000 | 9.8 ± 1.6 | 0.911 ± 0.051 |
| 19 | 4 | 60 | 800 | 7.3 ± 1.0 | 0.496 ± 0.084 |
| 20 | 4 | 40 | 600 | 6.5 ± 2.1 | 0.394 ± 0.097 |
| 21 | 2 | 120 | 200 | 3.8 ± 0.4 | 0.139 ± 0.019 |
| 22 | 2 | 100 | 1000 | 7.3 ± 1.2 | 0.507 ± 0.085 |
| 23 | 2 | 80 | 800 | 5.4 ± 1.7 | 0.274 ± 0.029 |
| 24 | 2 | 60 | 600 | 4.6 ± 0.2 | 0.197 ± 0.023 |
| 25 | 2 | 40 | 400 | 5.5 ± 1.4 | 0.281 ± 0.019 |
| Variance Source | Degree of Freedom (DOF) | Adjusted Sums of Squares (Adj. SS) | Adjusted Mean Squares (Adj. MS) | F-Value | p-Value | |
|---|---|---|---|---|---|---|
| Pin wear depth | Normal force (F) | 4 | 156.083 | 39.021 | 11.52 | 0.000 |
| Sliding velocity (V) | 4 | 6.705 | 1.676 | 0.49 | 0.740 | |
| Sliding distance (L) | 4 | 168.735 | 42.184 | 12.45 | 0.000 | |
| Error | 12 | 40.662 | 3.388 | - | - | |
| Total | 24 | 372.185 | - | - | - | |
| Pin volume loss | Normal force (F) | 4 | 5 × 10⁻⁶ | 1 × 10⁻⁶ | 6.72 | 0.004 |
| Sliding velocity (V) | 4 | 0 | 0 | 0.59 | 0.677 | |
| Sliding distance (L) | 4 | 6 × 10⁻⁶ | 2 × 10⁻⁶ | 8.20 | 0.002 | |
| Error | 12 | 2 × 10⁻⁶ | 0 | - | - | |
| Total | 24 | 1.3 × 10⁻⁵ | - | - | - |
| Parameter | Description | Value |
|---|---|---|
| Punch width | wp | 30 mm |
| Draw depth | D | 40 mm |
| Blank holding force | fh | 12.5 kN |
| Die-to-punch gap | G | 1.54 mm (10% clearance) |
| Blank length | L | 150 mm |
| Die corner radius | rd | 5 mm |
| Punch corner radius | rp | 5 mm |
| Blank thickness | t | 1.4 mm |
| Blank width | wb | 26 mm |
Publisher’s Note: MDPI stays neutral with regard to jurisdictional claims in published maps and institutional affiliations. |
© 2021 by the authors. Licensee MDPI, Basel, Switzerland. This article is an open access article distributed under the terms and conditions of the Creative Commons Attribution (CC BY) license (http://creativecommons.org/licenses/by/4.0/).
Share and Cite
Bang, J.; Park, N.; Song, J.; Kim, H.-G.; Bae, G.; Lee, M.-G. Tool Wear Prediction in the Forming of Automotive DP980 Steel Sheet Using Statistical Sensitivity Analysis and Accelerated U-Bending Based Wear Test. Metals 2021, 11, 306. https://doi.org/10.3390/met11020306
Bang J, Park N, Song J, Kim H-G, Bae G, Lee M-G. Tool Wear Prediction in the Forming of Automotive DP980 Steel Sheet Using Statistical Sensitivity Analysis and Accelerated U-Bending Based Wear Test. Metals. 2021; 11(2):306. https://doi.org/10.3390/met11020306
Chicago/Turabian StyleBang, Junho, Namsu Park, Junghan Song, Hong-Gee Kim, Gihyun Bae, and Myoung-Gyu Lee. 2021. "Tool Wear Prediction in the Forming of Automotive DP980 Steel Sheet Using Statistical Sensitivity Analysis and Accelerated U-Bending Based Wear Test" Metals 11, no. 2: 306. https://doi.org/10.3390/met11020306
APA StyleBang, J., Park, N., Song, J., Kim, H.-G., Bae, G., & Lee, M.-G. (2021). Tool Wear Prediction in the Forming of Automotive DP980 Steel Sheet Using Statistical Sensitivity Analysis and Accelerated U-Bending Based Wear Test. Metals, 11(2), 306. https://doi.org/10.3390/met11020306