Abstract
Automotive, railway and aerospace sectors require a high level of quality on the thread profiles in their manufacturing systems knowing that the tapping process is a complex manufacturing process and the last operation in a manufacturing cell. Therefore, a multivariate statistical process control chart, for each tap, is presented based on the principal components of the torque signal directly measured from spindle motor drive to diagnosis the thread profile quality. This on-line multivariate control chart has implemented an alarm to avoid defected screw threads (oversized). Therefore, it could work automatically without any operator intervention assessing the thread quality and the safety is guaranteed during the tapping process.
Keywords:
sculptured surface machining; tapping; over-sized; monitoring; wear; tribology; high speed steel 1. Introduction
Internal thread manufacturing is a widespread operation in automotive, railway, and aerospace sectors. The machining companies sculpt millions of internal threads in brake disks, suspension pieces, landing gears and some parts of the turbine. In addition to this, tapping and threading can be also applied after new ways of joining dissimilar alloys, as it was developed by Urbikain et al. [1]. Therefore, these sectors require high quality in the manufacturing systems.
Before defining the thread quality, the tapping is described. Tapping is the last operation in a manufacturing cell when the product has all the added value. Additionally, the tapping requirements are challenging because a need of high synchronism between rotational and vertical movements is required [2] and the tool has many teeth while mating the thread during the tapping operation. Furthermore, the tap tool is coated to improve the life tool. Coatings are also a prime concern about threading [3], PVD ones must be carefully eliminated of droplets to achieve a good performance [4].
Once explaining the tapping process, thread quality is defined manually by the “go-no go” gauge according to ISO 1502:1996 [5] and consequently, two types of lack of quality are the thread undersizing when the head of “go” gauge cannot enter and the thread oversizing when the head of “no-go” gauge can enter in the thread profile.
Tool condition monitoring is a demanding but rewarding technique to assess the quality of the products. On one hand, it is demanding because these approaches recollect the data from internal and intrusive sensors in the modern machine tools [6,7].
Moreover, currently industrial internet of things has being developed to manage the huge volume of these internal signals from spindle and feed drivers [8]. In this context, one of most used signals is the torque in some industrial monitoring systems because this signal is influenced by the geometry tool, material characteristics, machine specifications, movement control, and cutting conditions [9,10]. On the other hand, it is rewarding because these tools guarantee the safety of the process avoiding faults and the high level of product quality in manufacturing systems [11].
Focusing on tapping operation, Chen et al. [12] proposed a classification system based on a set of parameters from the torque and force signals (radial and thrust) applying condition probability functions to classify three common tapping faults: tap wear level, misalignment between hole and tap axis and under/oversized predrilled holes diameter. Liu et al. [13] developed a neural network strategy based on ten parameters from the same signals to address the same types of faults as the previous author. These two first strategies used intrusive sensors in manufacturing cell. To avoid this drawback and taking into account the same manufacturing faults, Li et al. [14] proposed a monitoring system to classify these problems based on a neuronal approach fed by a principal component analysis (PCA) parameter reduction from a wavelet decomposition of internal current signals from the spindle motor coils. PCA has also been used to optimize the tool geometry in tapping operations [15]. In addition to this, Tien-I Liu et al. [16] proposed an adaptive neuro-fuzzy interface system based on features of signals (thrust and lateral) from a Kistler dynamometer to classify the same five abnormal faults during tapping operation. The above described strategies are classification approaches of tapping and some of them used intrusive sensors. Additionally, these studies do not study undersized and oversized threads.
Related to the thread quality, Zawada-Tomkiewicz et al. [17] proposed Taguchi approach to study the metric screw thread based on a method called the closed-loop manufacturing (CLM) system. De Freitas et al. [18] verified the CFRP thread profile quality based on the ISO metric thread basic profile when studying the influence of several cutting parameters. Finally, Monka et al. [19] studied the screw quality when a tap failure happens in machining C45. The studies analyze the thread quality after finishing the cutting process or when the fault is happened and none of them study the case of oversized thread.
Currently, Pereira et al. [20] improved the tap geometries studying the torque and temperature signals for each individual thread. Polvorosa et al. [21] proposed a cutting-edge strategy based on cutting signals when tapping a hard to machine material. Finally, Gil Del Val et al. [22] studied the wear evolution of conical and cylindrical teeth when tapping nodular cast iron at high speed conditions.
The review paper by Brandao et al. [23] makes it clear that there has been an important work in the last 20 years of research on this subject but that it is necessary to develop applications that link this knowledge with the real industrial process. In this direction, the research team of this article has presented advances in the study of the significance of the pair signal [24]. This paper aims and validates an oversizing thread diagnosis strategy based on a multivariate control chart processing a set of torque features from spindle driver of the machine tool to control the thread quality. Firstly, measurement configuration and thread quality will be illustrated. In the Section 2 and Section 3, the torque parameter selection and statistical background will be explained, respectively. Later, the diagnosis strategy will be described and finally, results, and conclusions will be discussed.
2. Materials and Methods
2.1. Measurement Configuration and Thread Quality
Tapping measurements are carried out on a Kondia B500 (Kondia, Guipuzcoa, Spain) vertical CNC machining center. Tool material is high speed steel coated with titanium carbon nitride (TiCN). Taps have three flutes with metric M 10 × 1.5 mm. Work piece materials used are AISI 1045 medium carbon steel, grey cast iron (GG25) and nodular cast iron (GGG50) in 250 by 450 mm plates 20 mm thick. Holes of the appropriate diameter are pre-drilled holes and inspected at four different depths by a 0.01 mm resolution micrometer. To assess thread quality, all tapped threads are inspected by a “go/non-go” gauge [5].
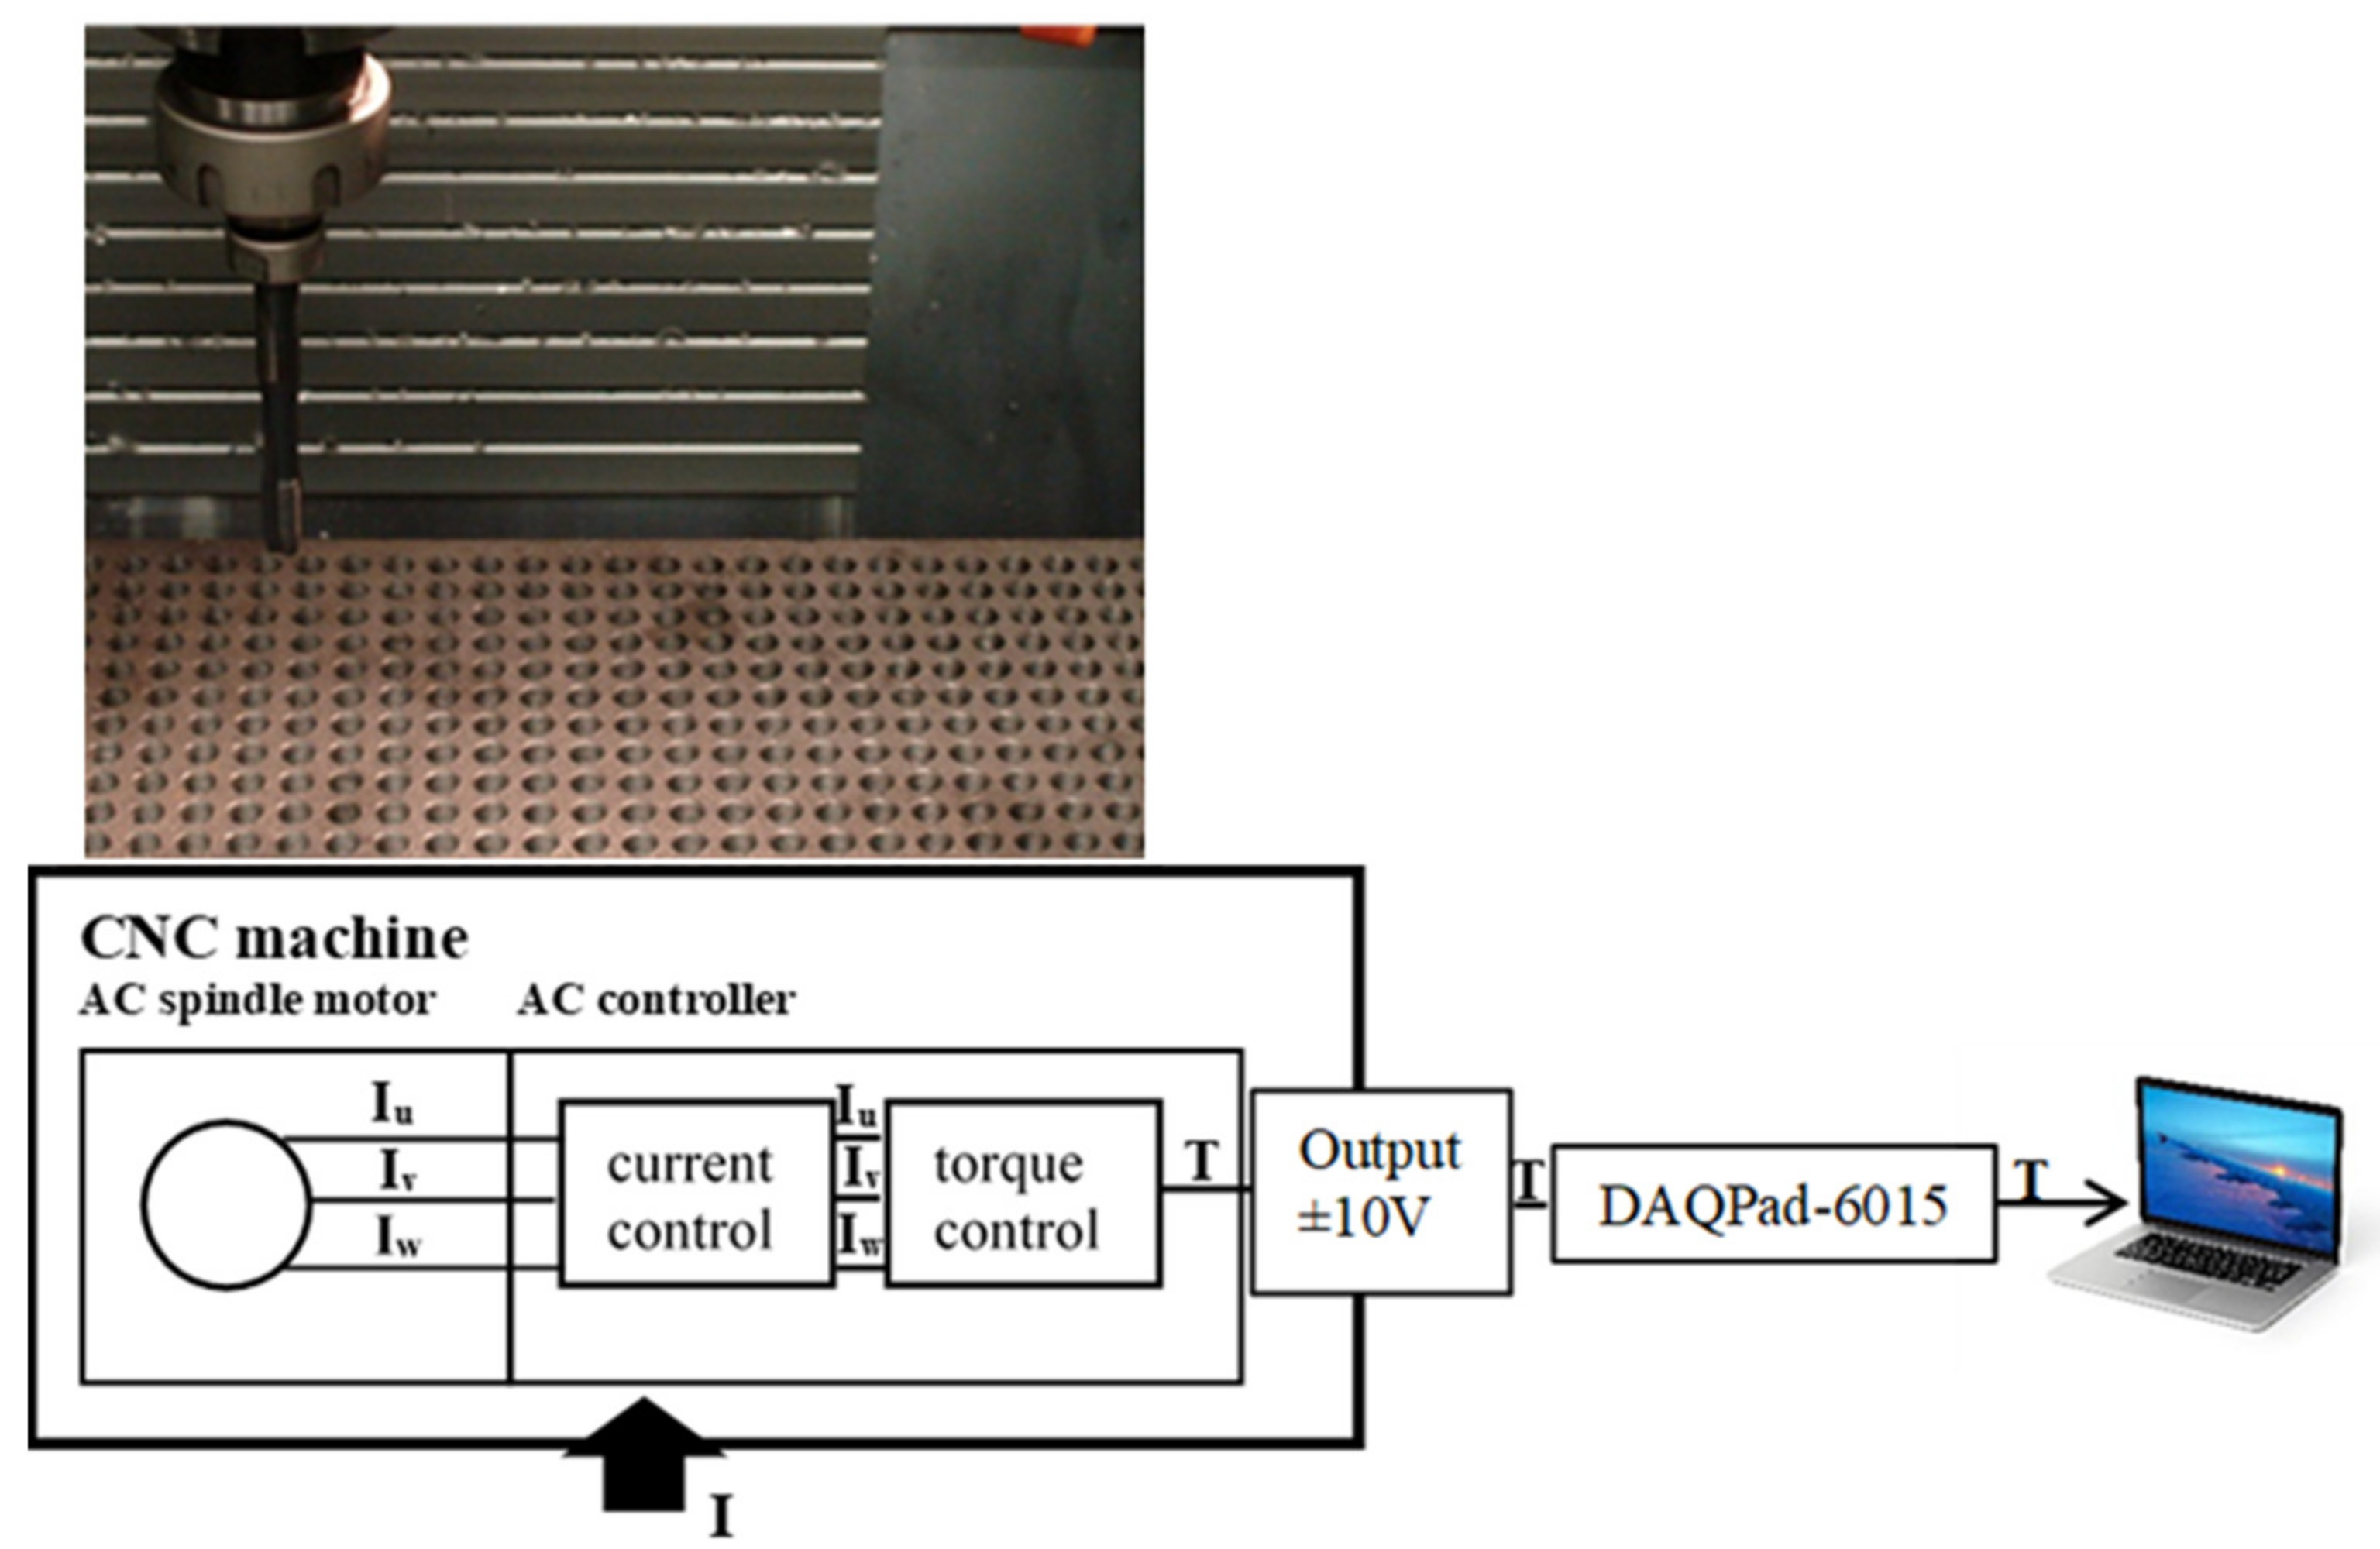
Figure 1 illustrates the setup of experiments. The torque signal was measured directly from a screw terminal of the I/O module of the spindle motor drive in the Figure 1 (bottom). Therefore, the proposed tap diagnosis system is essentially an internal sensor solution. Figure 1 (top) shows the tap tool, the holder, workpiece material, and CNC machine.

Figure 1.
Real tapping experimentation (top) and setup scheme of torque registration (bottom).
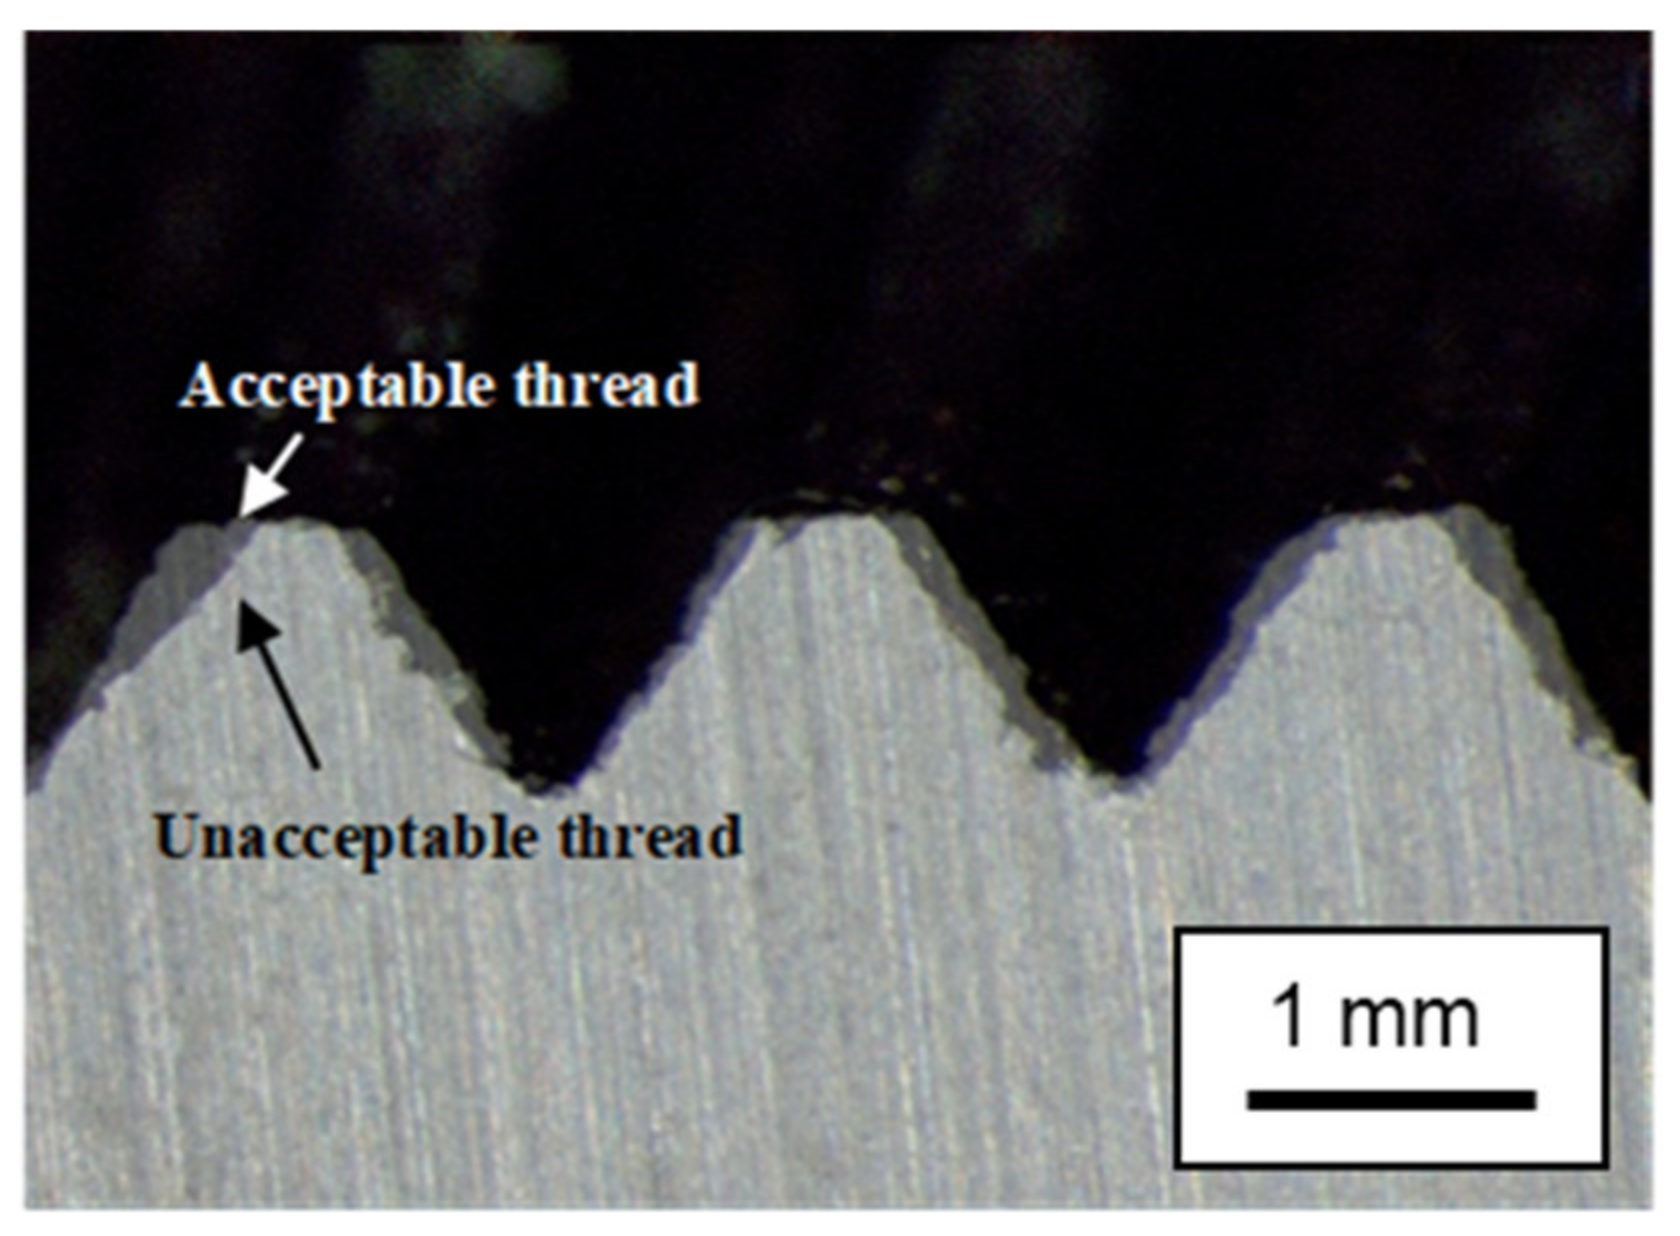
Figure 2 illustrates the oversizing of thread profiles. This lack of quality is happened because the workpiece flanks of unacceptable thread have been receded a value more than gauge allowance (H6) and, therefore, “non-go” gauge head enters throughout the thread profile [5].
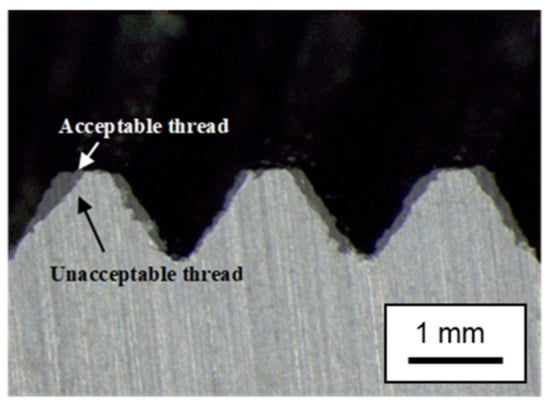
Figure 2.
Lack of quality (oversizing): acceptable and unacceptable thread profiles in GG25.
2.2. Torque Parameter Selection
The sensitive between tool wear and torque signal has been studied [6,7]. Additionally, the sensitive between thread major diameter undersizing and torque signal has been studied [24]. However, “thread major diameter oversizing- torque signal” correlation has not yet been considered in literature.
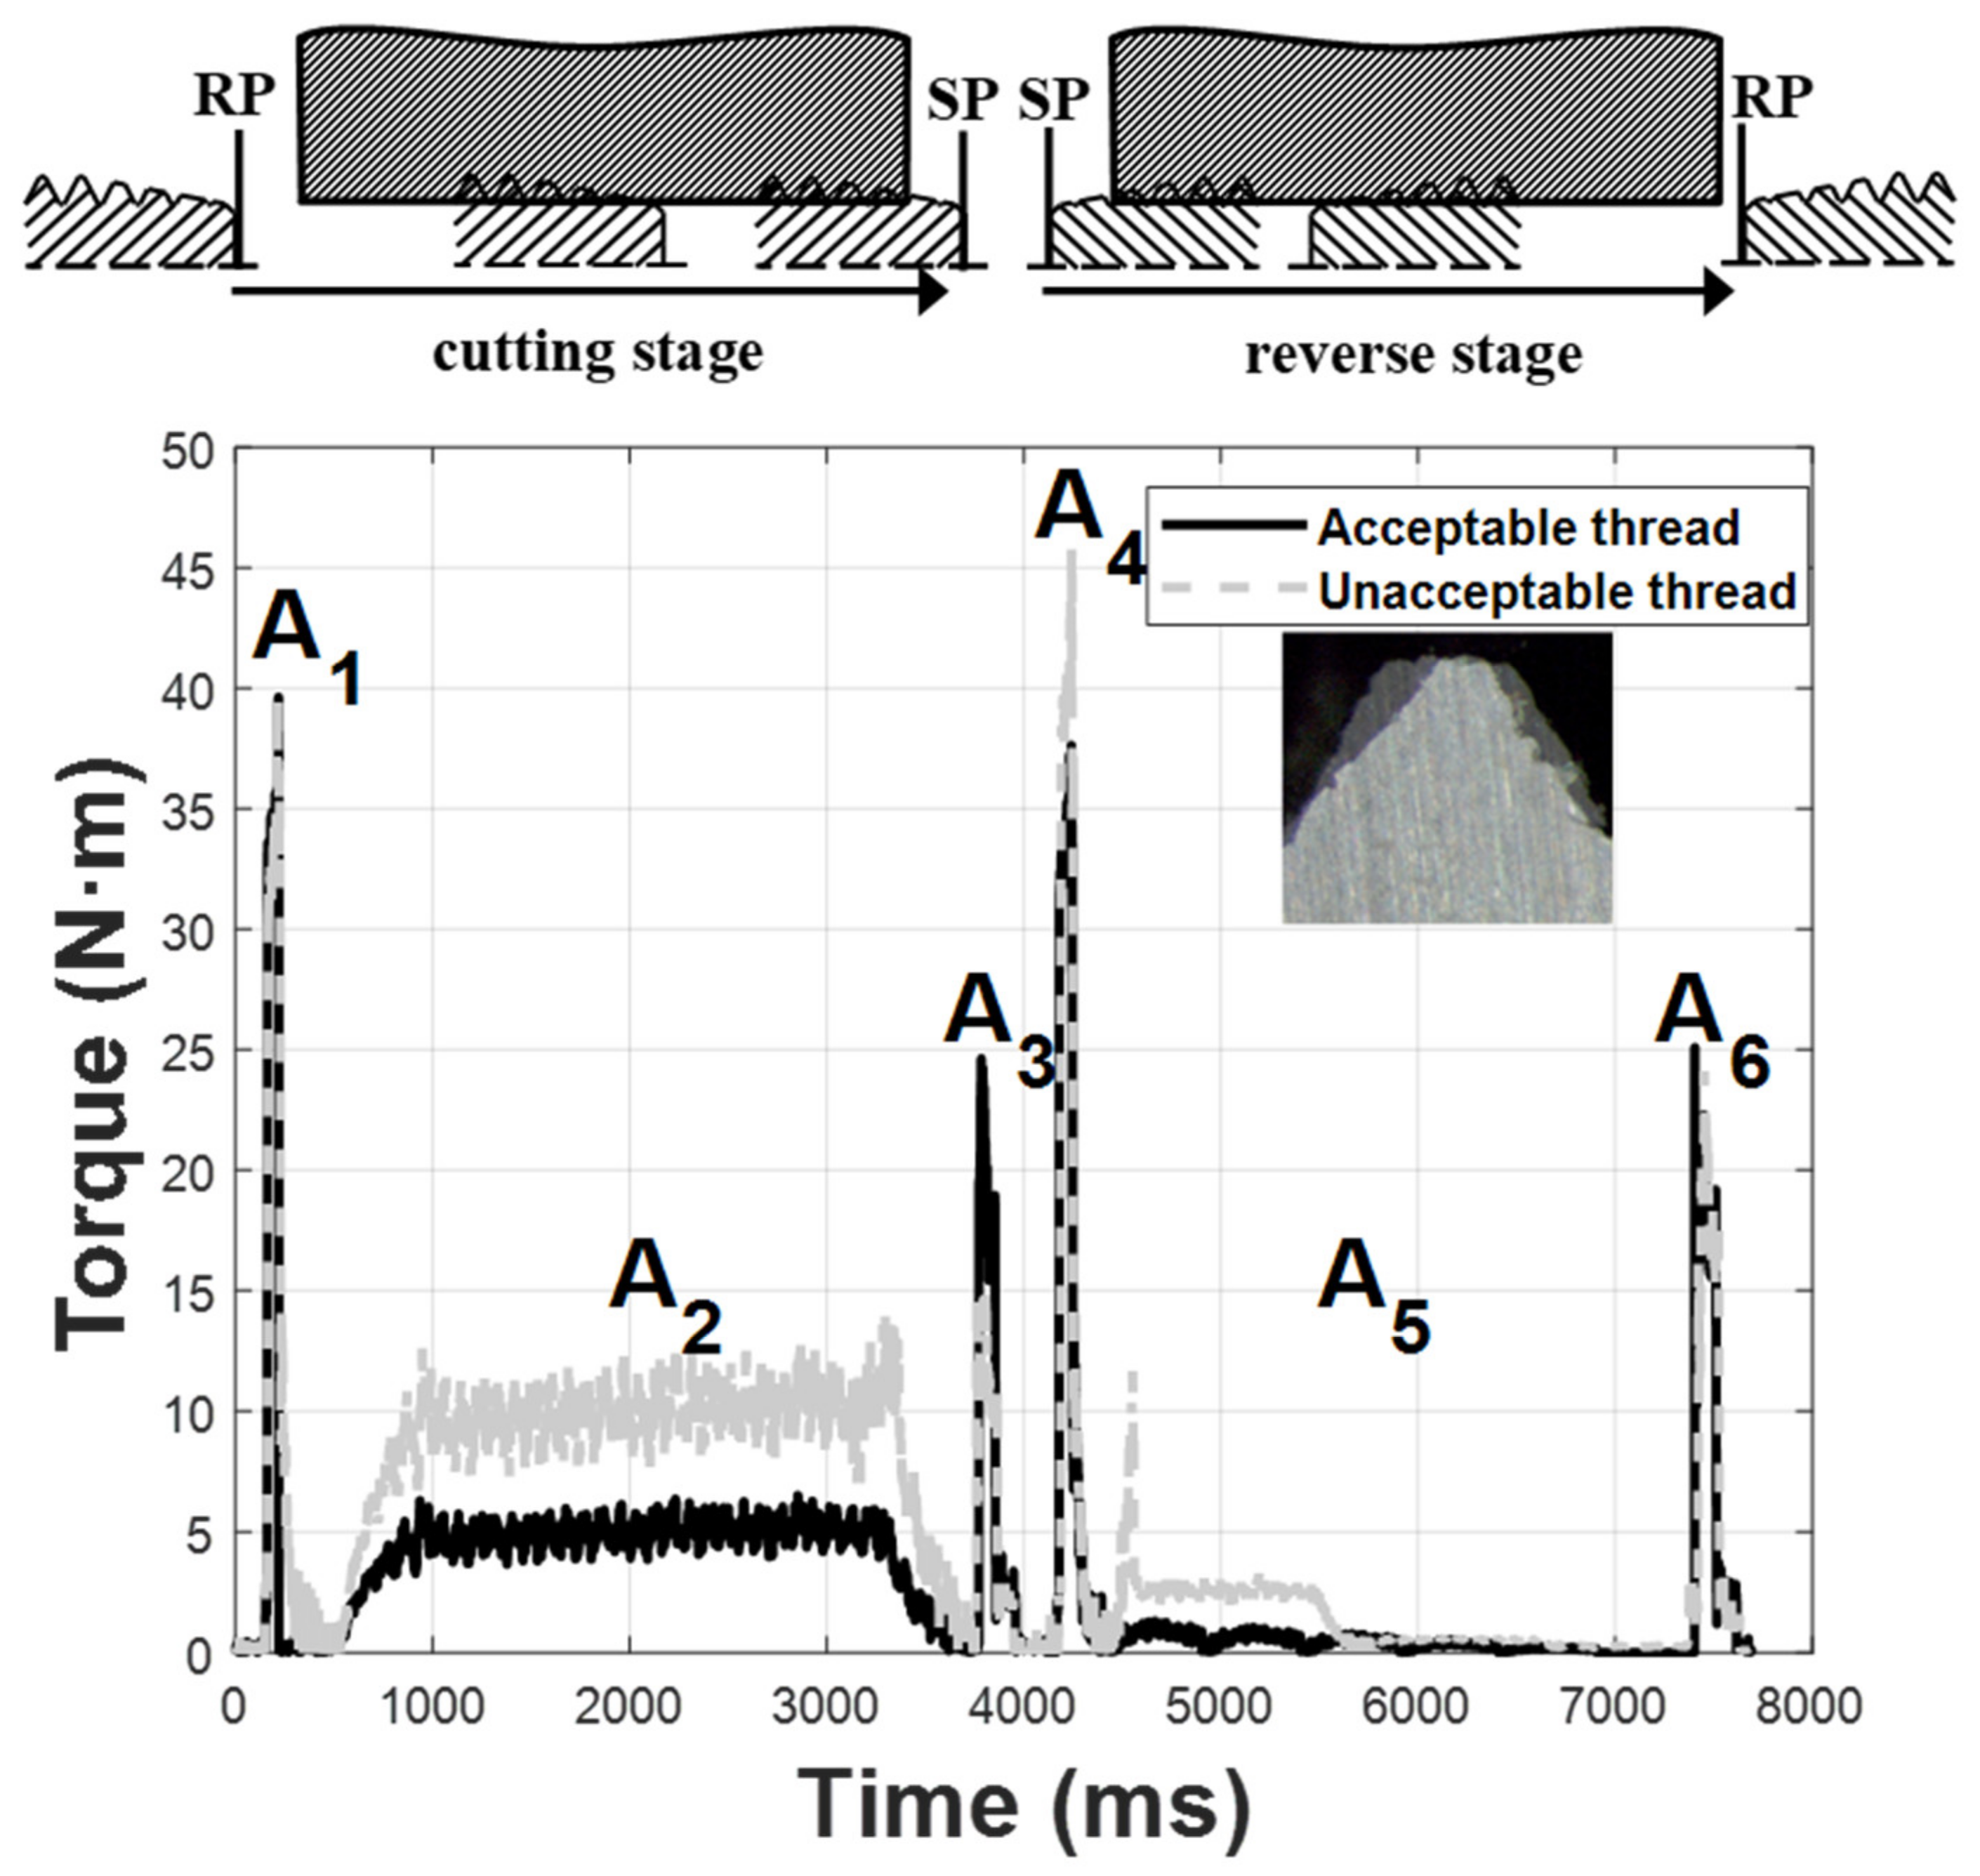
Figure 3 shows the overlapping of the new tap and worn-out tap, when the lack of quality has been identified as an oversizing of thread profile, torque signals during a tapping cycle. Furthermore, the cutting and reverse stages have been illustrated to understand the process, the parameter selection, and sensitivity.
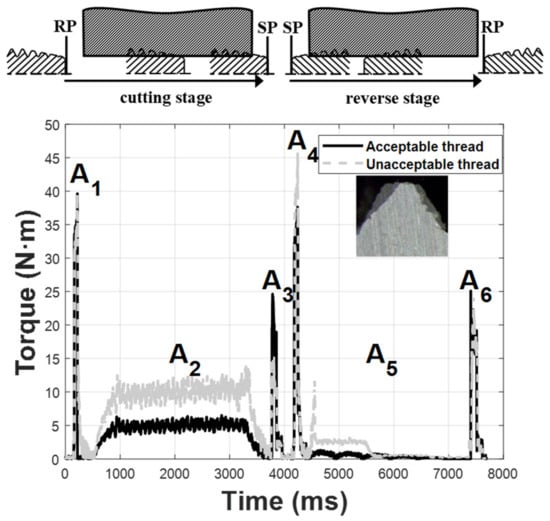
Figure 3.
Tap movements (top) and torque signal from the spindle drive during the two stages (cutting and reverse) of tapping cycle (bottom).
The cutting stage is when the tap moves from the reference plane (RP) to the stop plane (SP) in Figure 3. The process information in this cutting direction is composed of three main area parameters. The first area parameter (A1) represents the motor torque area required for accelerating the spindle from zero speed to the tapping angular speed in RP. The second area parameter (A2) is the cutting torque area when the tap sculpts the thread profile. This parameter recollects the main information of the operation. However, it also represents the wear on the flank thread due to the lack of synchronism between rotational and feed movements during the cutting stage. Finally, the third area parameter (A3) represents the deceleration torque required for stopping the main spindle in SP.
The A1 sensitivity seems to be low or, even, neglected as shown in Figure 3. However, the A2 sensitivity is higher because the tap teeth remove the work piece material to generate the thread profile. The tap wear is included in this parameter. Finally, the A3 sensitivity is reasonable because the spindle motor needs less torque to stop owing to the friction of cylinder when the chamfered teeth are worn as noticed in Figure 3.
The reverse stage is when the tool goes from the SP to RP in Figure 3. The process information in this reverse direction is composed of three main area parameters. The first area parameter (A4) is the tap torque required for accelerating the spindle from zero to the cutting speed the SP. Again, when the wear of the cylinder teeth cannot be neglected, the spindle motor needs to provide additional torque corresponding to the friction induced by the wear on the cylinder teeth. The second area parameter (A5) represents the torque time evolution induced by the friction of the active cylinder teeth when sliding on the newly tapped threads. In addition to this, it represents the wear on the flank thread due to the lack of synchronism between rotational and feed movements. Finally, the third area parameter (A6) corresponds to the torque time evolution to stop the process in RP.
The A4 sensitivity is reasonable because spindle motor needs to provide additional torque corresponding to the friction induced by the wear on the cylinder teeth as shown in Figure 3. However, the A5 sensitivity is reasonable higher because the tap cylinder teeth have friction on the thread profiles and, even, remove small parts of the work piece material in the flanks if there is no synchronism between rotational and feed movements. That is, the tap wear and thread quality are included in this parameter. Finally, the A6 sensitivity seems to be neglected.
3. Theoretical Background
3.1. Principal Component Analysis (PCA)
PCA is a well-established statistical technique that expresses multivariate data as a set of linear functions of latent variables (the principal components, PCs). Although the number of PCs is equal to original variables, it is common, however, to find only a few of them (two or three) account for a high percentage (80–95%) of the variability of the process [25], therefore it represents a dimensionality reduction step.
Let X be a n × p matrix containing the n observations (number of threads of a tap) of the p parameters (in the tapping process, these are the Ai torque area values, so p = 6). It is good practice to standardize each column of X such that it has a mean of zero and a variance of 1:
and where S_(x_i) is the standard deviation of the ith column of X. The principal components Y are linear combinations of the standardized data:
where matrix V is found in such a way that the variance-covariance matrix of Y is diagonal (and hence, the PCs are orthogonal):
and, therefore, V is the matrix that diagonalizes cov(Z). This is well-known by [25] to be achieved by the p × p matrix of eigenvectors of cov(Z) (the eigenvectors are orthonormalized, i.e., V′V = I). Thus, the PCs Y point in p orthogonal directions in p-dimensional space where the data varies the most. The dimensionality of the problem is reduced by selecting only a subset of k (k < p) PCs that explain most of the variance in Z. The proportion of variability explained by the ith PC is given by are the eigenvalues of matrix cov(Z).
Equation (4) is the main structure being i the number of PCs, j the number of threads per tap and p is the total number of area parameters, in this case six parameters:
3.2. Statistical Process Control (SPC)
SPC is a preventive approach which suggests to stop a process before the production of a defective part. Therefore, in the tapping process, the SPC scheme may suggest to stop the process and, even, replace the tap when the tap has a high level of wear and before sculpting an unacceptable thread.
The GV control chart requires estimation of the instantaneous variance of the PCs, estimated using the moving ranges [26]:
where i is the number of PC, m is the length of the learning period and j is the tapped hole number during the learning period. To estimate the covariance matrix with [26]:
Before calculating the GV statistic for the jth tapped hole, the PCs are standardized using [22]:
where i is the number of principal components, j is the tapped hole and is the average of corresponding PCs over the learning period. The statistic (GV) plotted at time (tapped hole) j on the chart is calculated by [27]:
where p is the number of principal components selected and is the average of corresponding standardized PC over the training period, respectively. There are several criteria to indicate the number of samples to be used in the SPC learning period but, after some trial and error tests, it was decided two learning periods. The first training period ends when the A2 parameter value is equal to 1.1 times the average value of the first five tapped holes and the second learning period ends when the A2 parameter value is equal to 1.5 times the average value of the first five tapped holes. The averages of all training periods for both learning periods are 12 and 50 threads. These values are reasonable according to manufacturer’s knowledge and literature [27], respectively. The upper control limit (UCL) or threshold of the GV chart is then calculated as [27]:
where is the average value of the GV statistic during the learning period, i.e.:
and B4 is a constant that depends on m and corrects for bias [27]. The process is deemed “out of control” when .
4. Diagnosis Strategy
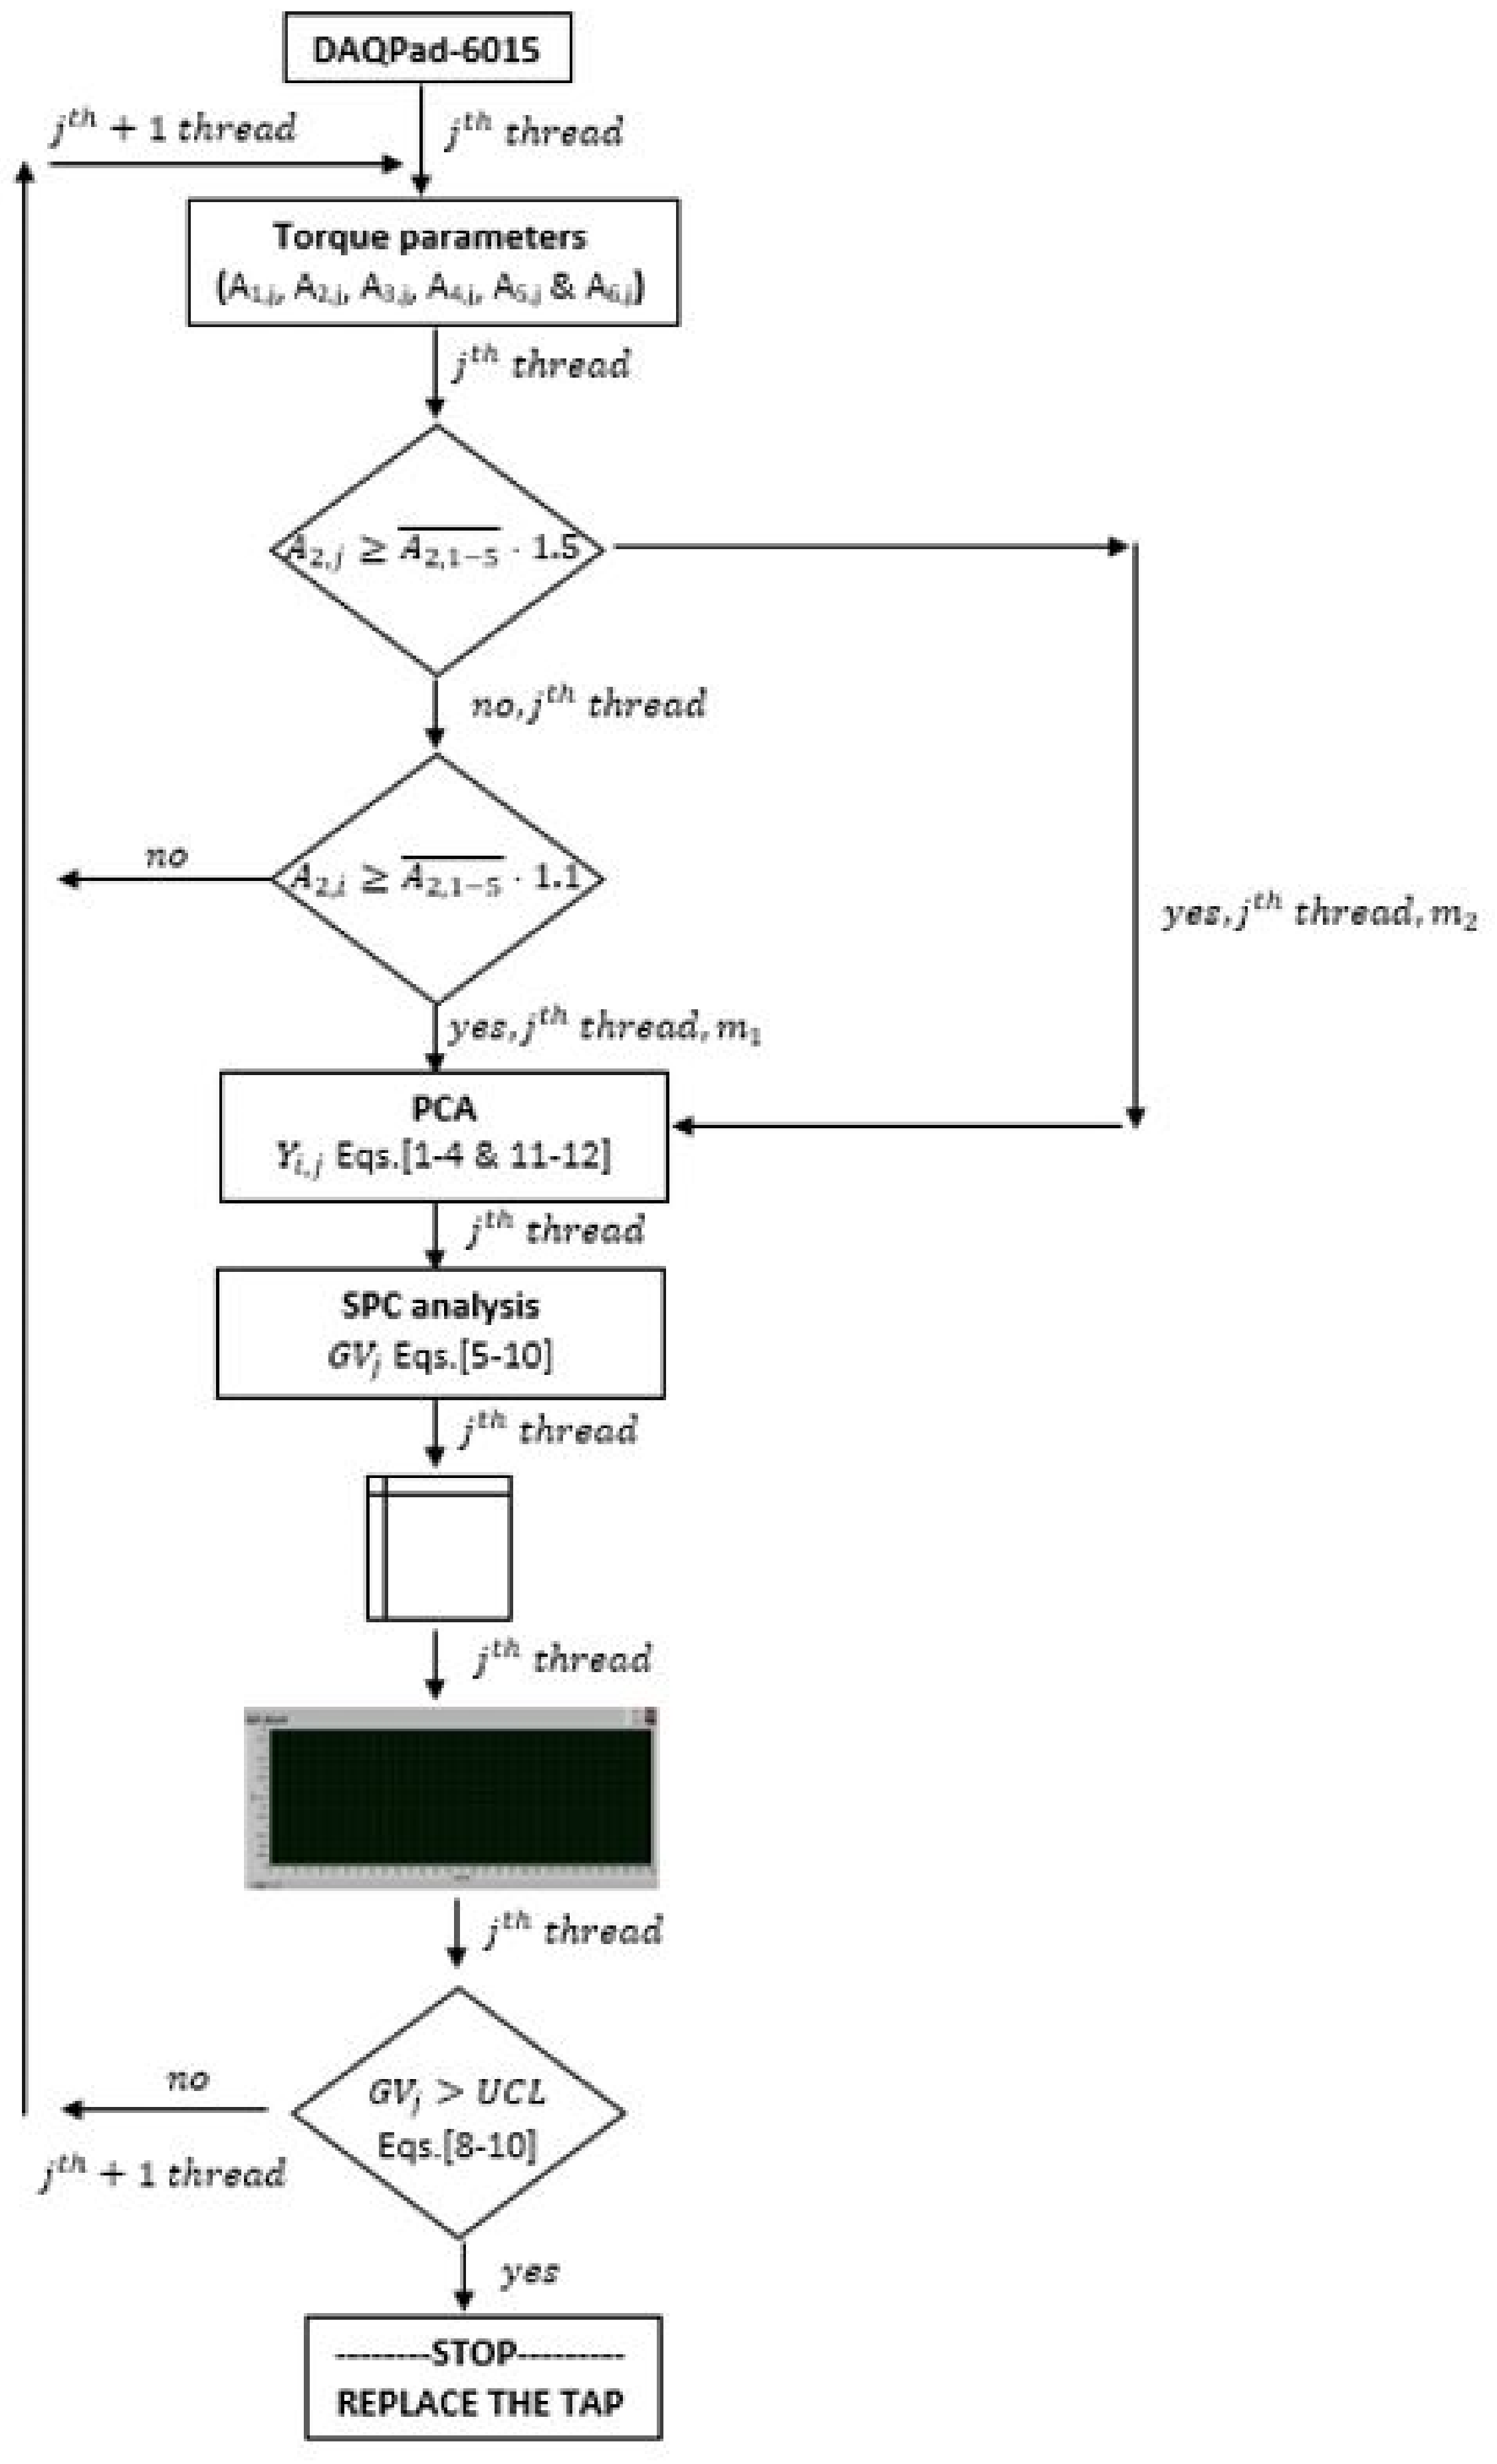
Figure 4 describes the diagnosis approach implemented using the LabviewTM software from National Instruments (Austin, TX, USA). The flowchart has five stages. In the first stage and for each tap, the diagnosis system receives the main spindle torque data of a mating thread from the spindle motor drive to the DAQPaD-6015. The torque signal is filtered and the Ai,j area parameters are computed (i is the area parameter number and j is the thread number). The second stage, called the learning period calculation, is composed of two training periods. Firstly, the A2 average of the first five threads is calculated. Secondly, two thresholds are computed 50% bigger than the A2 average of the first five threads and 10% upper than this average, respectively. Therefore, the first level will the last learning period (m2) and the last threshold will be the first training period (m1).

Figure 4.
Flow chart of diagnosis strategy.
Next stage is the statistical analysis. The first statistical approach calculates the PCs (Equations (1)–(4) and (11)–(12)) as shown in Figure 4 and the second one calculates the statistical control parameters (GV, UCL, etc., by Equations (5)–(10)) according to the information of first and second learning periods, respectively. Then, all the PCA and SPC parameters are registered and GV statistic and UCL threshold values are plotted.
The last stage is the diagnosis system, the multivariate control chart provides an alarm when the process is out of statistical control via Equations (8)–(10) as can be noticed in Figure 4. Besides, the control approach informs to the operator the necessity of replacing the tap tool.
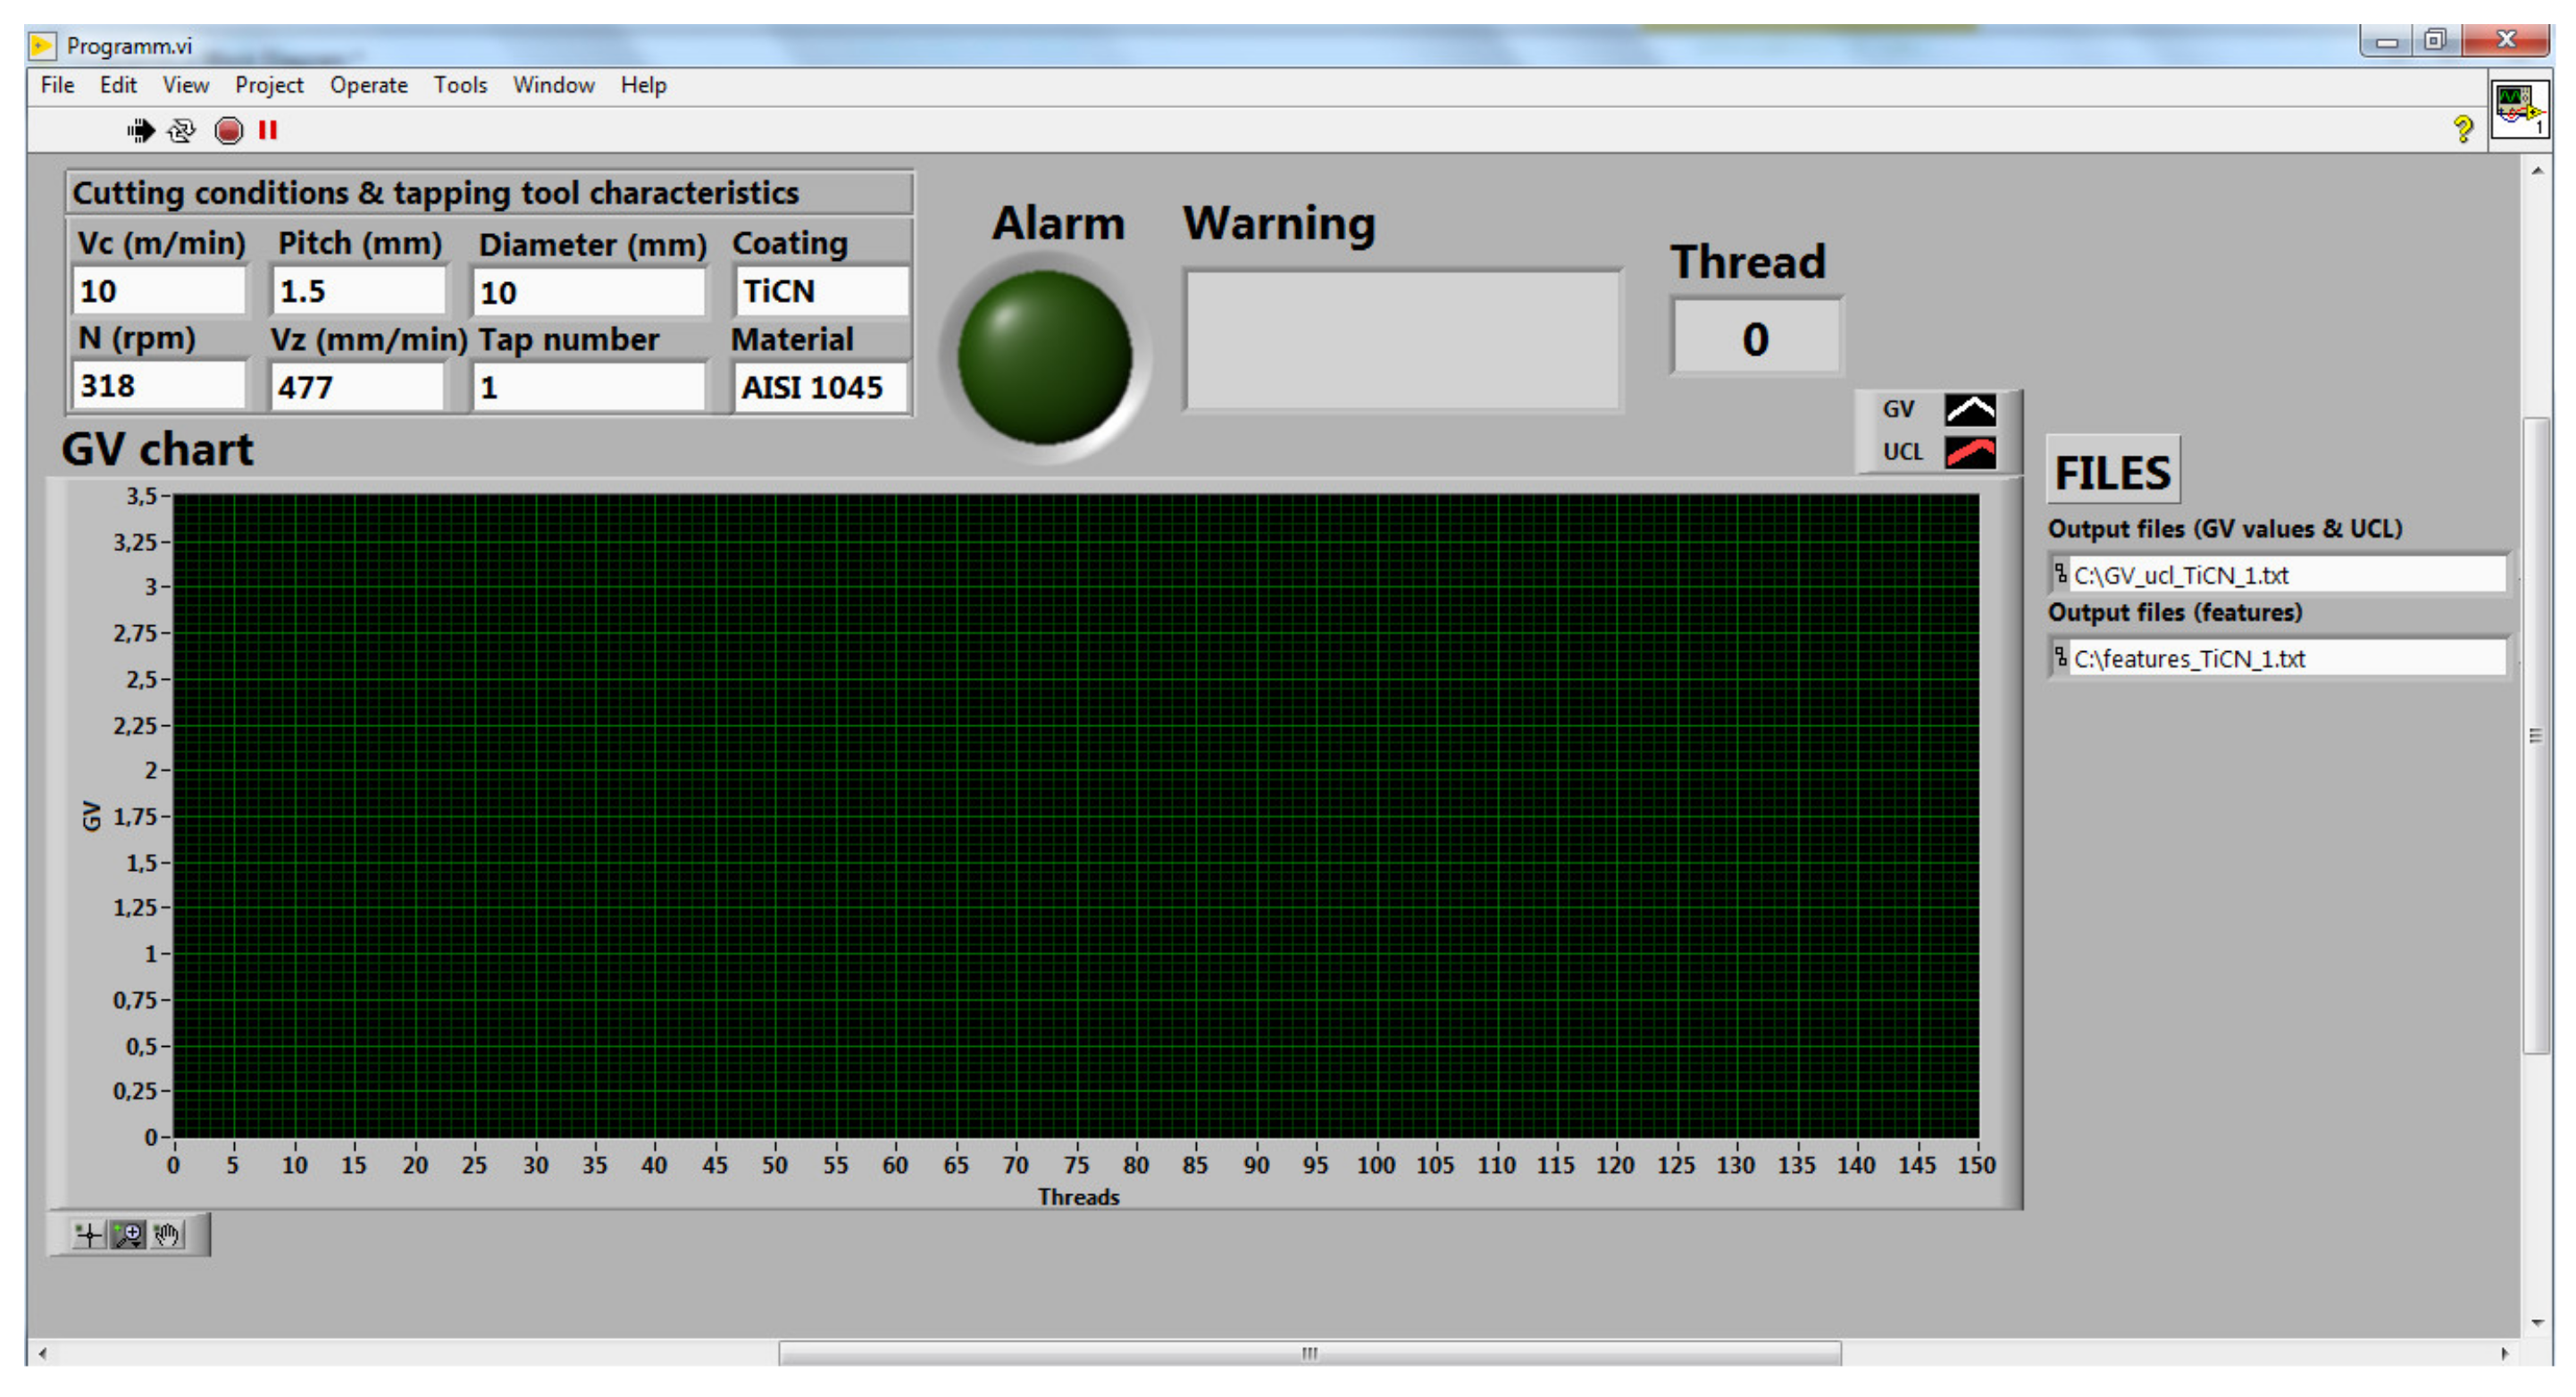
Figure 5 shows the diagnosis interface. Over the GV chart, the user can modify the cutting conditions and the tool and material characteristics. Additionally, the program provides the information about the process. On one hand, the alarm is switched in color red when the tapping process is out of control and the warning describes the need to stop the process.
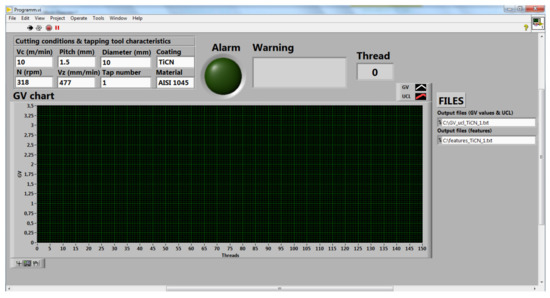
Figure 5.
Diagnosis interface developed in LabviewTM software.
On the other hand, the approach provides the number of thread that it is mechanized in that moment. Finally, the system plots the GV statistic against mechanized threads and provides the file direction to register the data of tapping process.
5. Results
5.1. Measurement Results
Table 1 shows the results of 12 tested taps of the same batch. The first, second, third and fourth columns are the number of taps, work piece material, coating, and cutting velocity, respectively. The cutting conditions were selected by the knowledge of tool manufacturers. The last column is the number of thread when the alarm was switched on. Consequently, the strategy warns about the out of process control. To determine the quality of the threaded hole, it was checked by means of a go/no-go gauge, following the norm, for each of the holes. Thus, if the part passes it does not enter or if the part does not pass it is able to enter freely through the hole, it is considered not ok.

Table 1.
Tapping process measurement specifications.
The dispersions of tap lives are common in tapping operations and this value is higher, see Table 1, when the cutting conditions are increased [24].
5.2. PCA Results
In most of the cases it was possible to reduce dimensionality to two common PCs to all taps (Equations (11) and (12)) in the measurements, explaining at the same time more than 90% percent of the variability for each tap:
Additionally, the values for the first (w1 = w3 = w4 = w6) and second PC (w2 = w5) are 0.5 and 0.25, respectively.
5.3. Results of Diagnosis System
Two taps per work-piece material have been selected to describe the effective of monitoring system to diagnosis the thread quality during a tapping operation. To illustrate the lack of quality, the thread when the process is out of control and the previous one have been selected as more representative to explain the working of this approach. In addition to this, the tapping process has been continued until appearing the lack of thread (oversizing) to show the efficacy of diagnosis system.
5.3.1. Multivariate Control Chart Tapping in AISI 1045
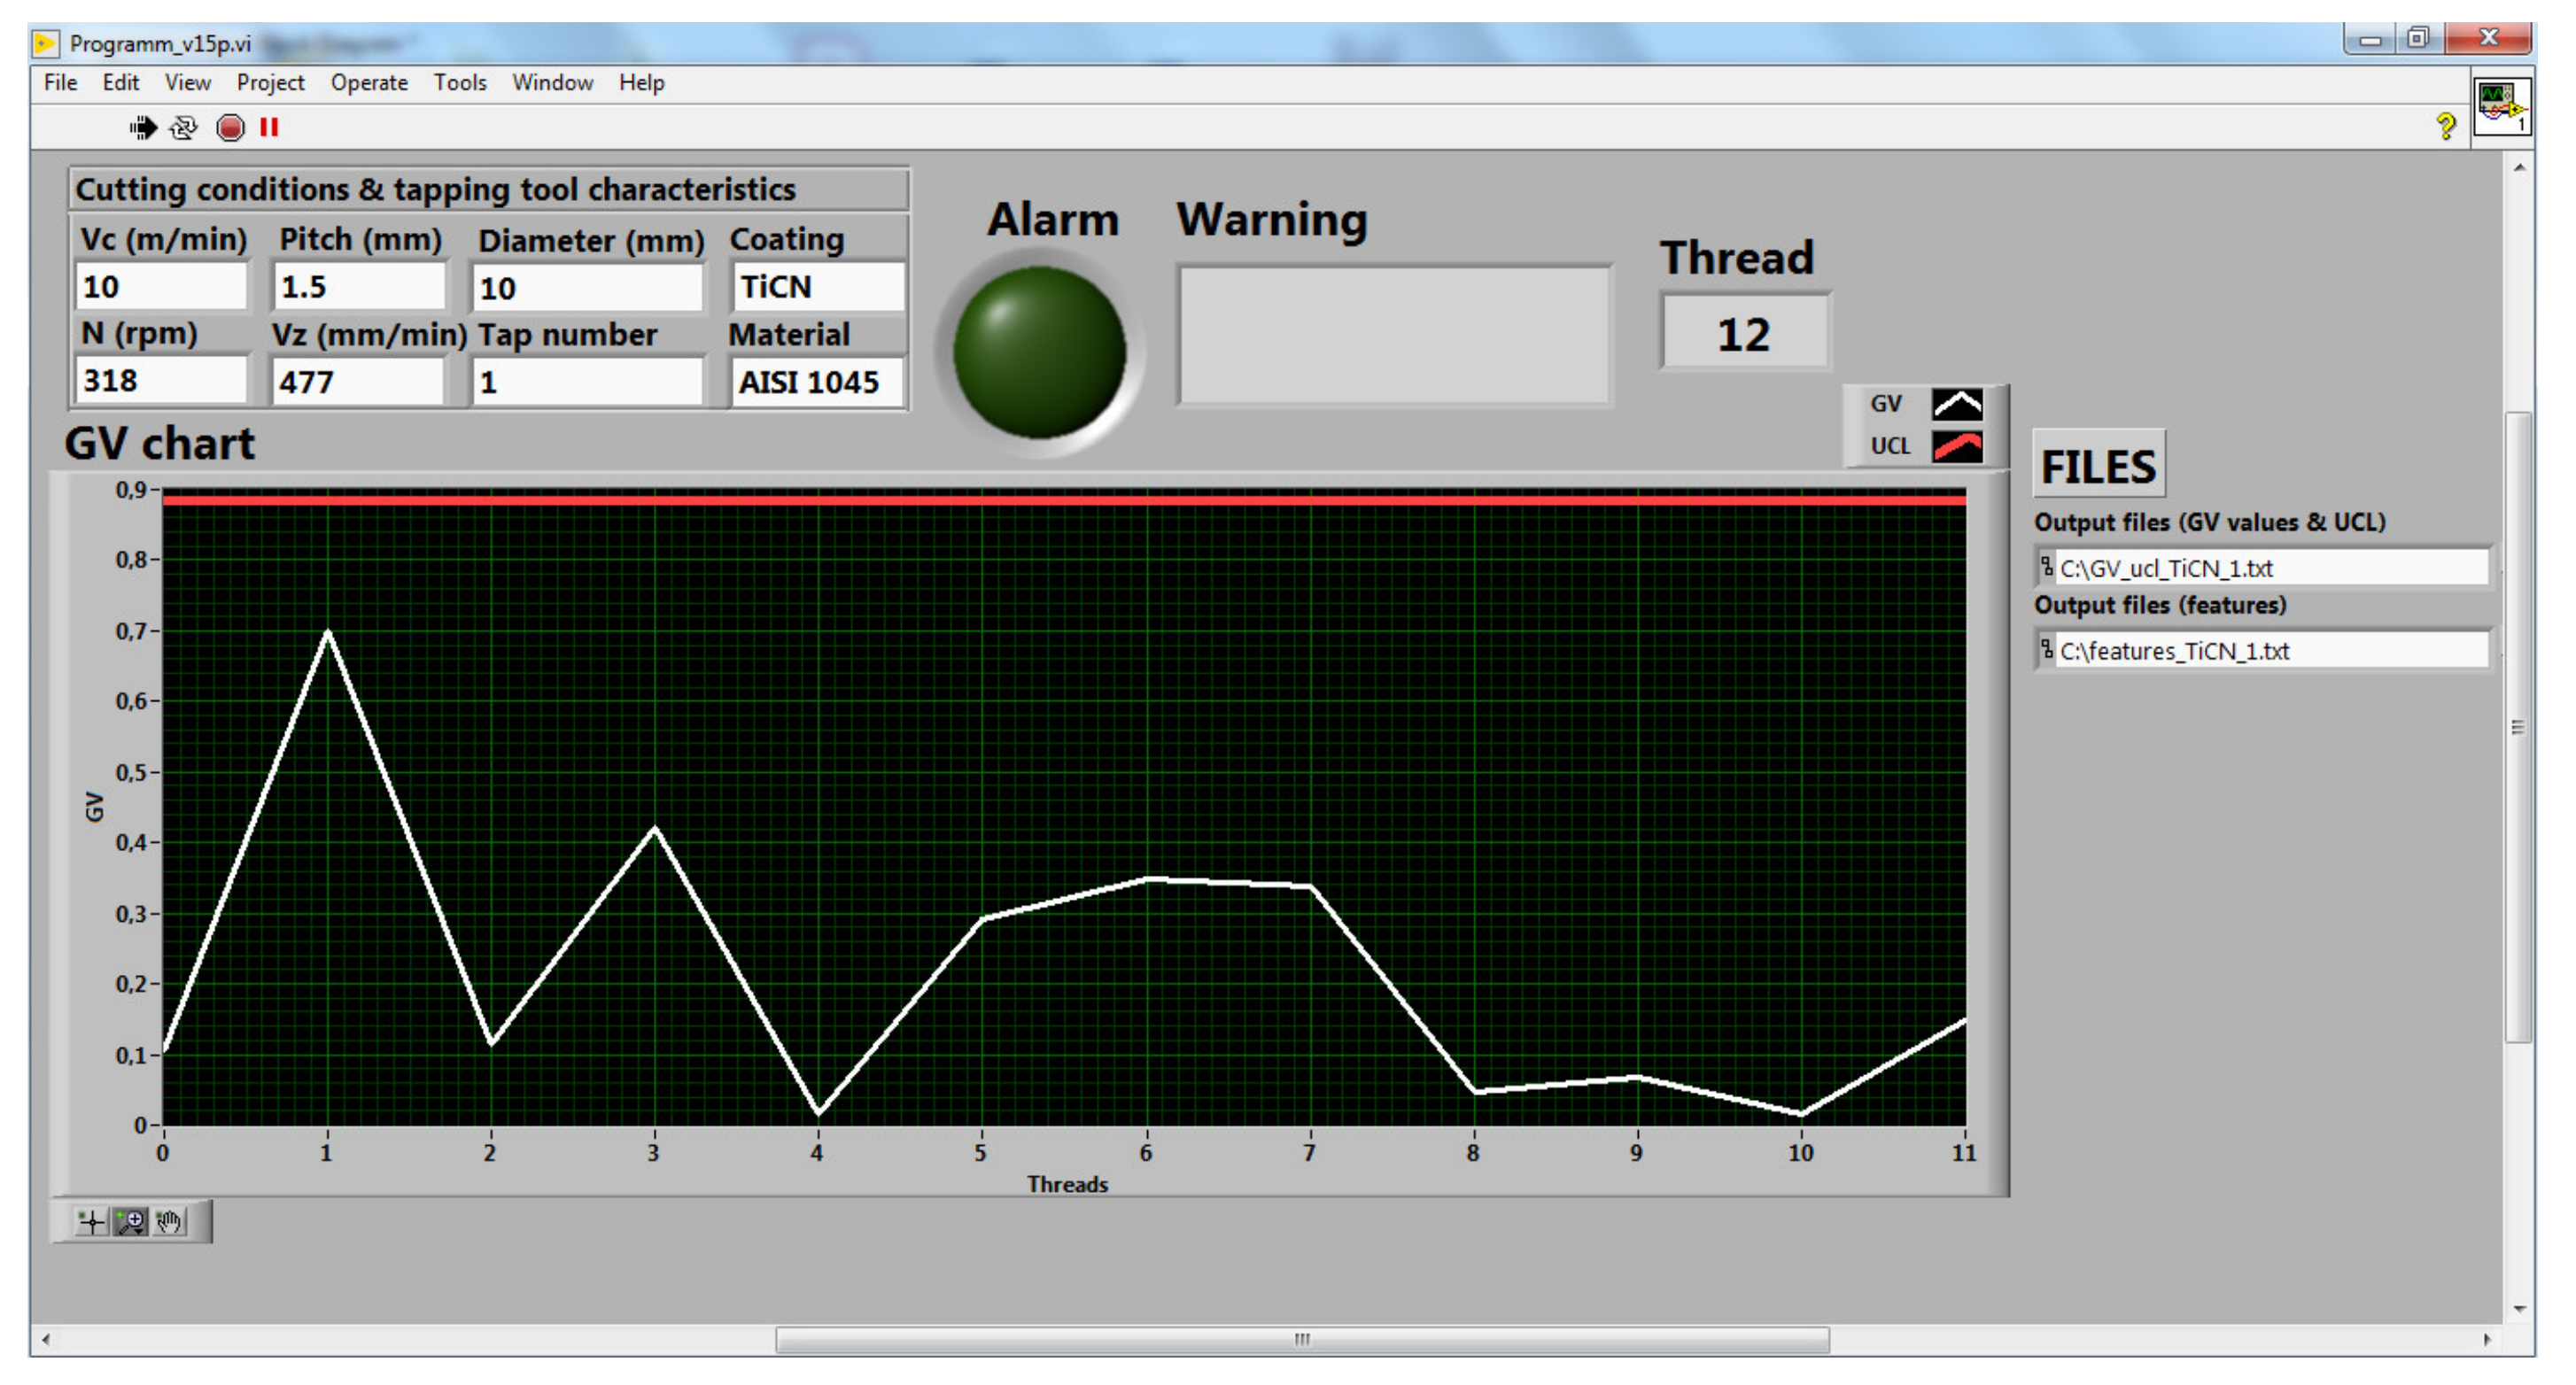
Figure 6 shows the multivariate control chart using the first training period (m1) of the tap 1 when threading on AISI 1045. The GV chart plots the GV statistic against the number of threads and the red horizontal line is the UCL calculated with the first learning period. All the GV values are lower than UCL value and, therefore, the tapping process is in control and the process safety is guaranteed with these cutting conditions. This initial stage is similar for all the taps and, therefore, these figures are not included in this draft. After Figure 6, all the figures are illustrated using the second learning period (m2).

Figure 6.
Multivariate control chart using the first learning period (m1) along the 12 first threads.
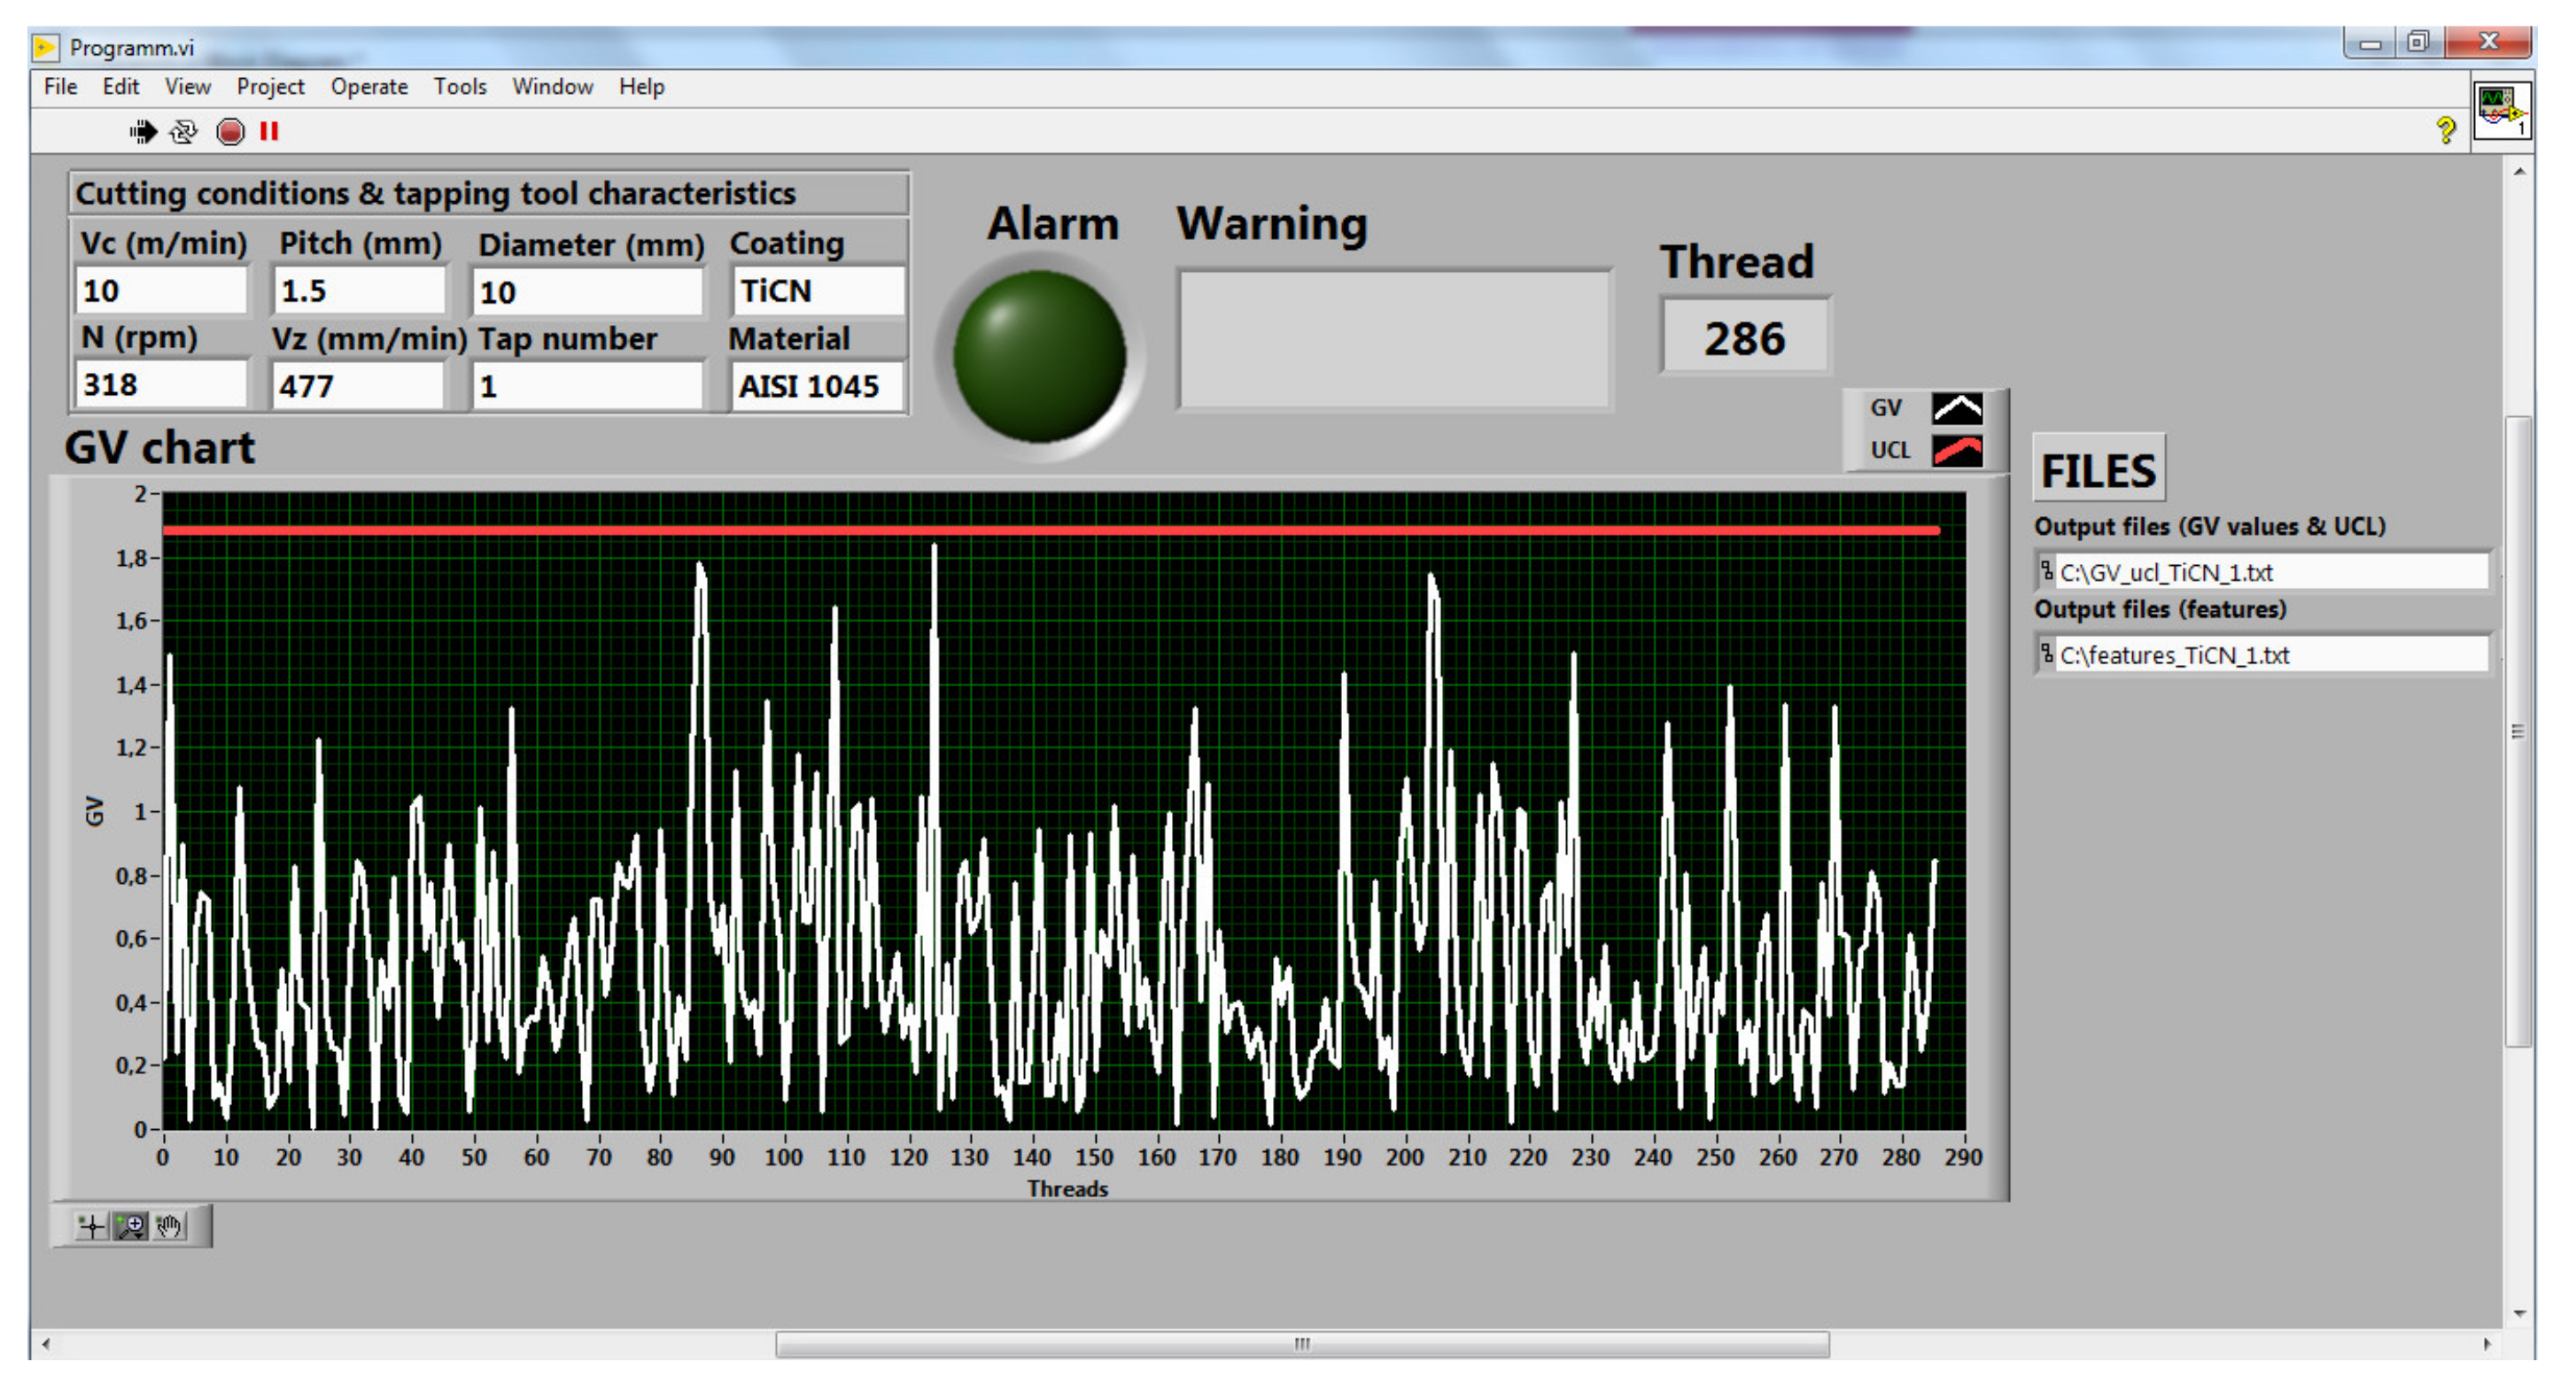
Figure 7 shows the tap 1 GV control chart using the second training period (m2). The GV values declare that the process is in control along the 286 threads.
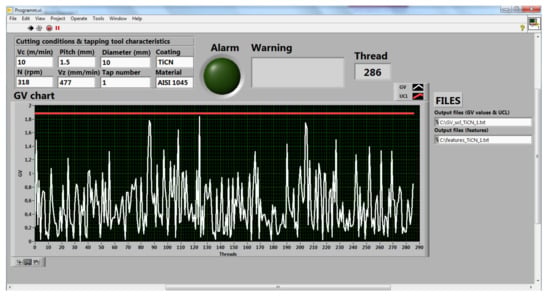
Figure 7.
Multivariate control chart, using the second training period (m2), when 286th thread has been tapped before switching on the alarm.
Figure 8 illustrates the tapping process out of control. The GV value of 287th thread is seven times the UCL value. The diagnosis system switches on the alarm and warns to the operator the need of replacing the tool.
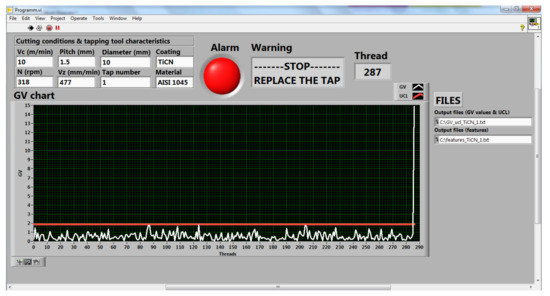
Figure 8.
Tap 1 multivariate control chart when 287th thread has been tapped and the alarm is switched on.
The threads are inspected by “go/non-go” gauge and all the threads pass the quality control, even, the thread which switches on the alarm. Therefore, the diagnosis approach states that the tapping operation is out of control due to some faults (micro-chipping, micro-tooth breakage, material removing on thread flanks, etc.) before machining an unacceptable thread.
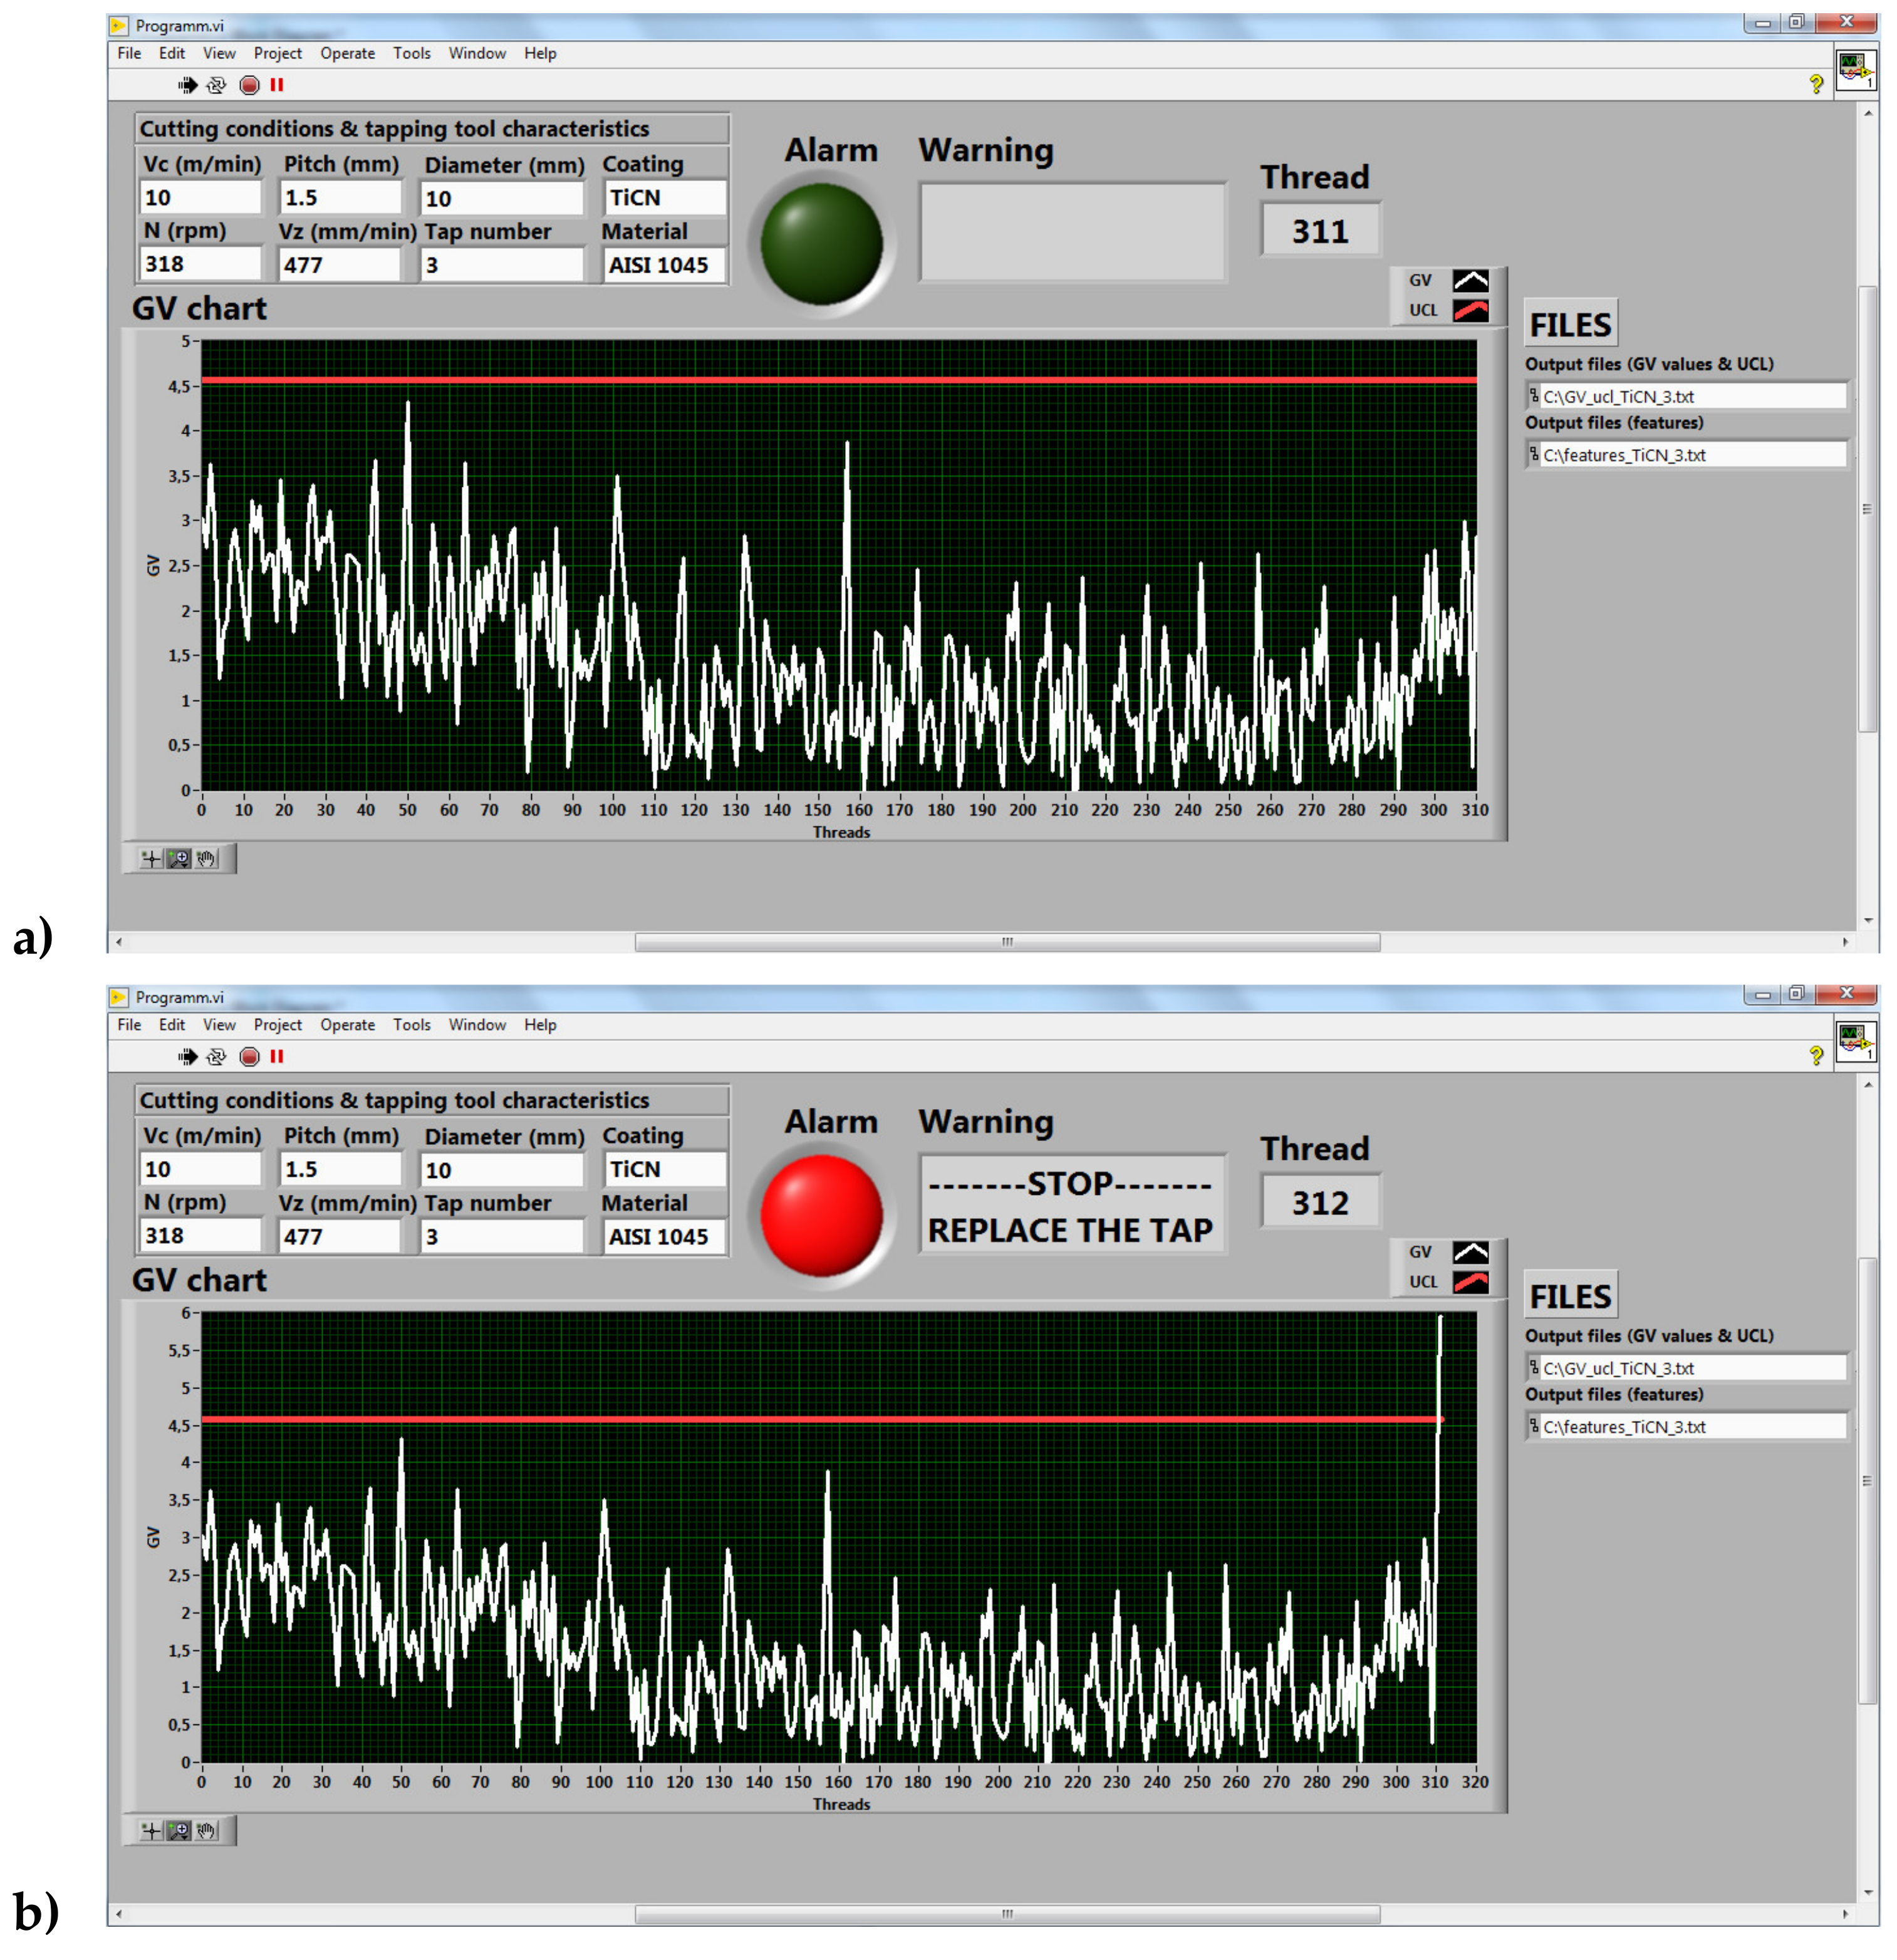
Figure 9a,b show the tapping process in control after having mechanized 311 threads and the out of control in the following thread, respectively.
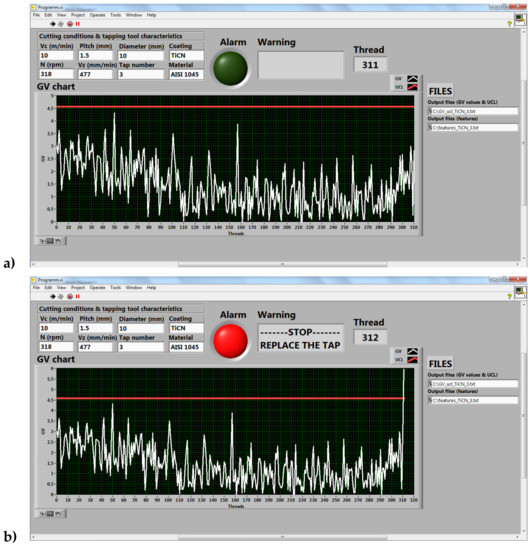
Figure 9.
Tap 3 multivariate control chart when AISI 1045 tapping is (a) in control and (b) out of control.
In this case, the 312th thread GV value is higher the previous one. Focusing on UCLs and the alarm GV values of taps 1 and 3, the increments are 7 and 1.3 times, respectively. A high level could mean a severe fault (micro-chipping or micro-tooth breakage) and a low level would be worn.
5.3.2. Multivariate Control Chart Tapping in Grey Cast Iron (GG25)
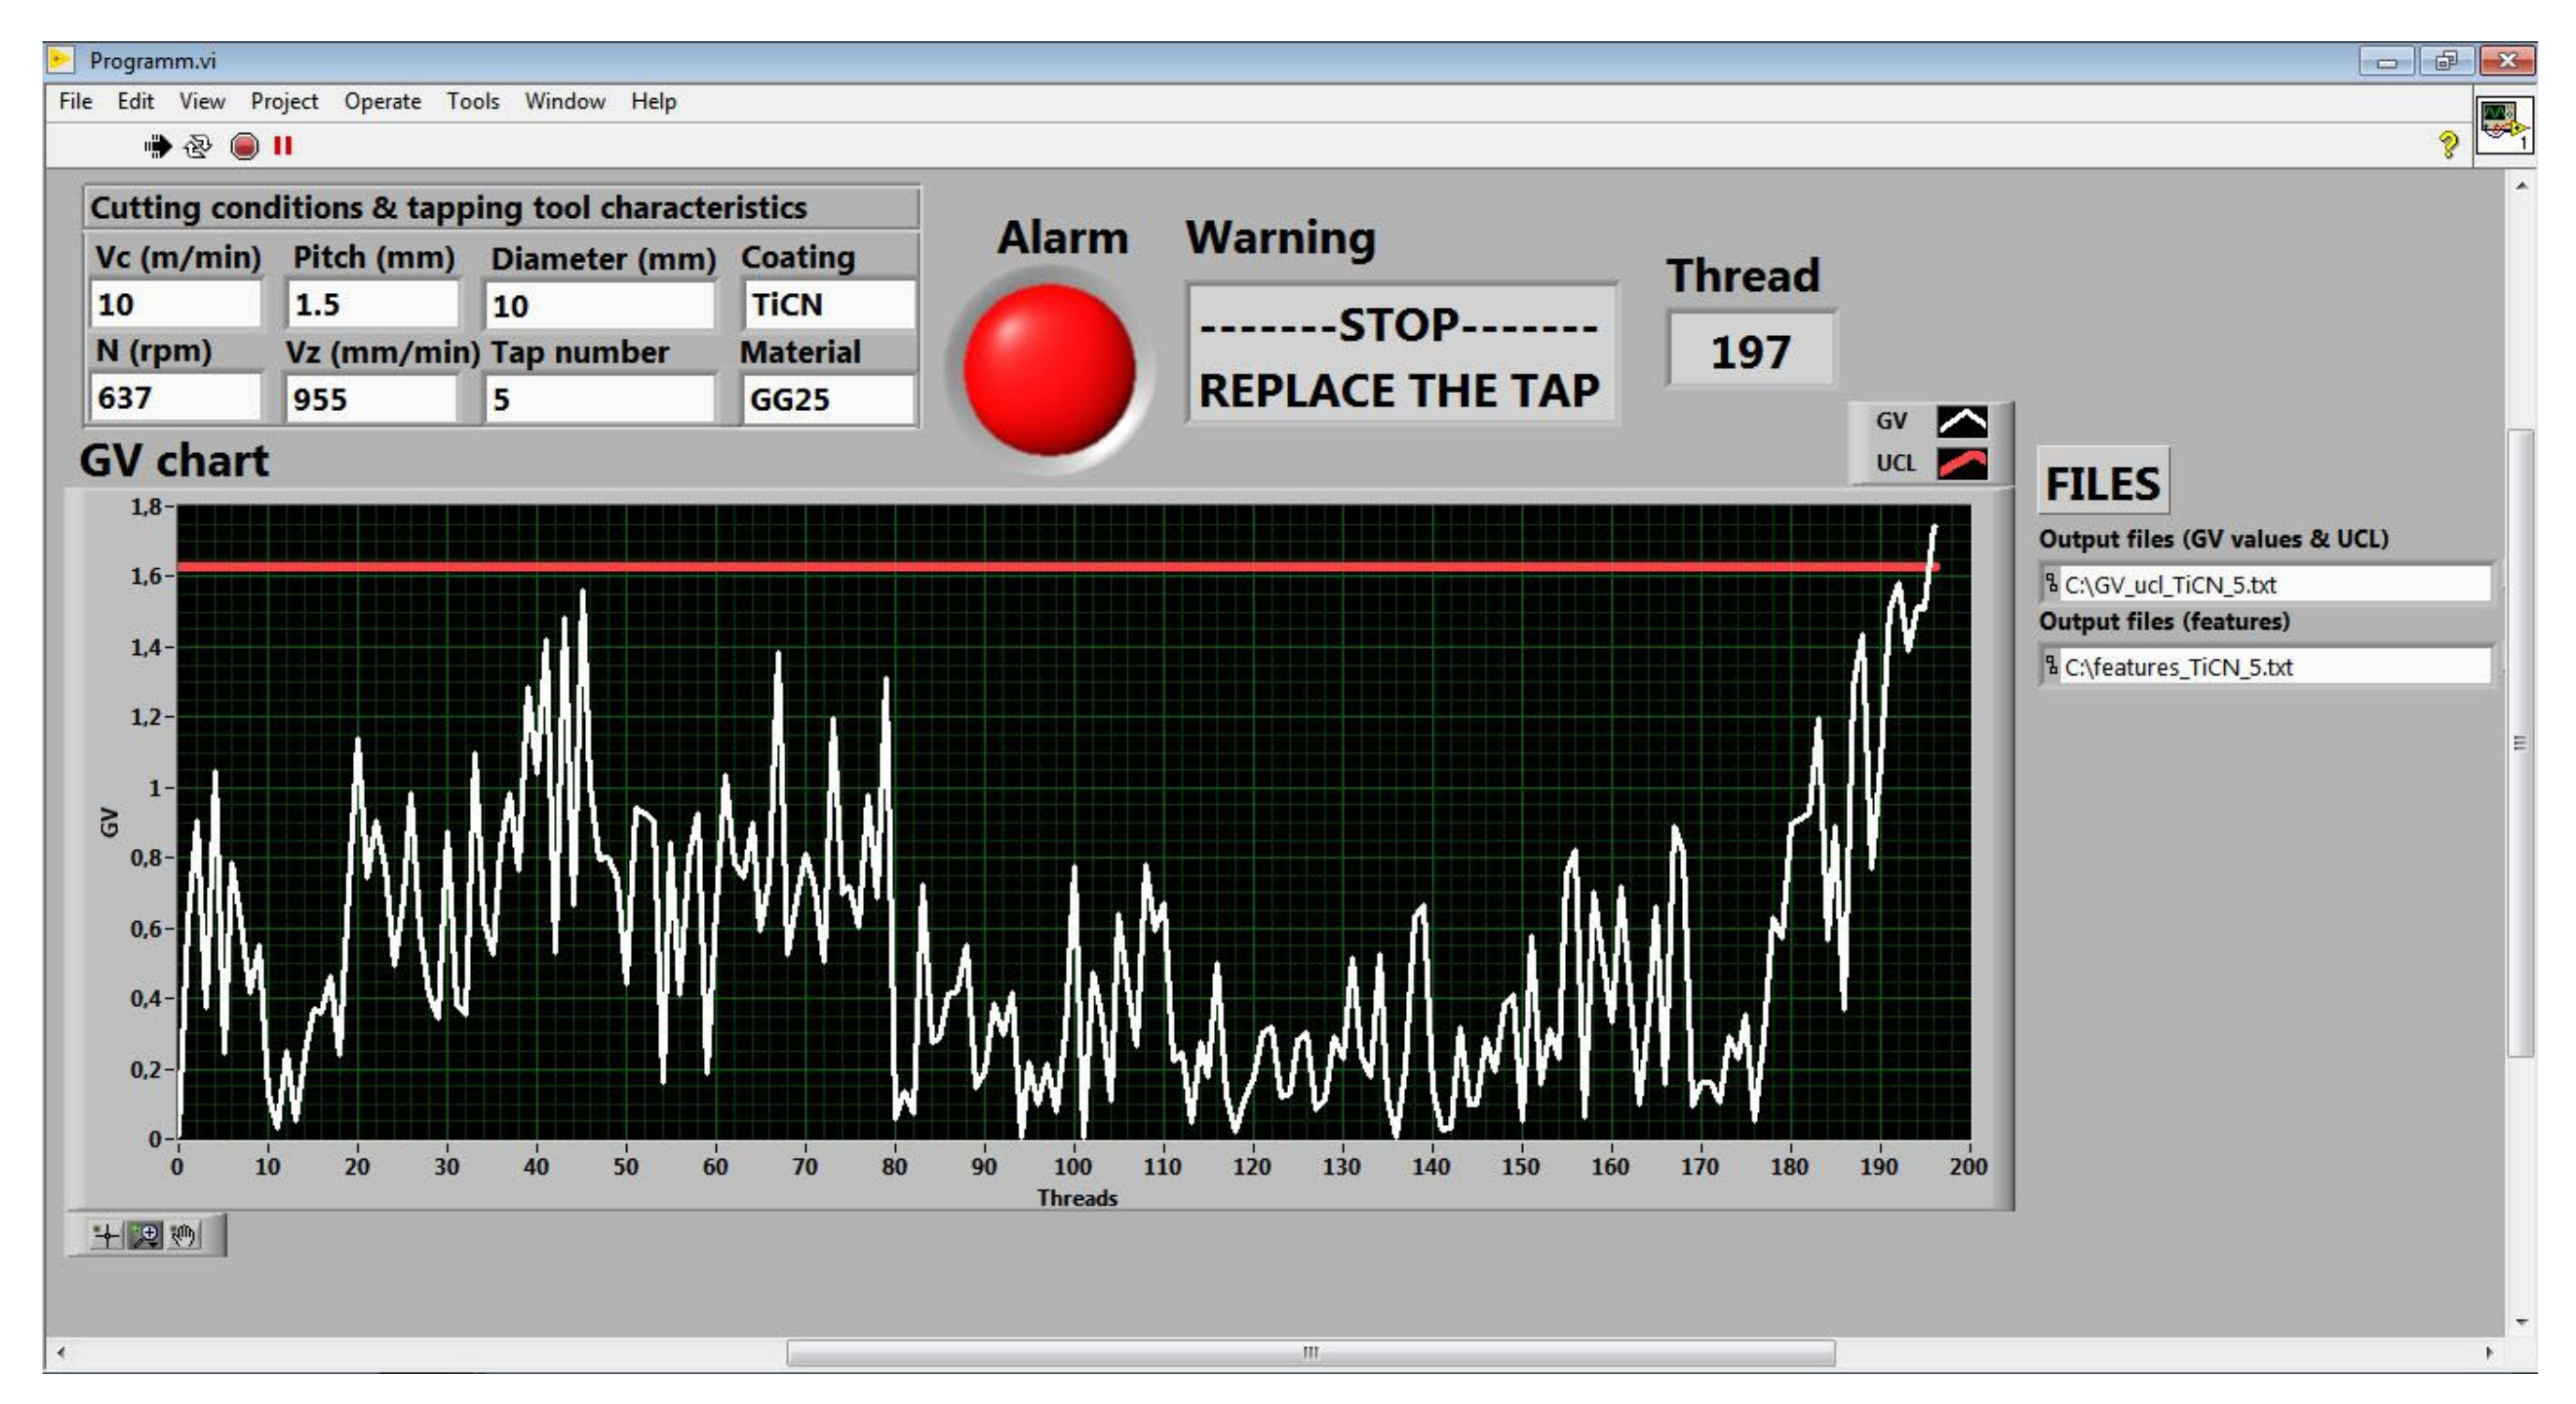
Two taps (5 and 8) have been selected to validate the diagnosis approach when tapping grey cast iron (GG25). Figure 10 illustrate the concept of in control and out of control during a tapping process. In this case, the increase is smooth due to a progressive level of wear.
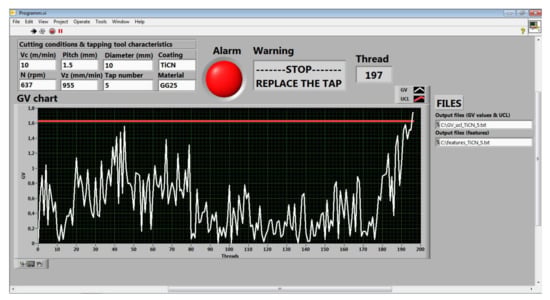
Figure 10.
Tap 5 multivariate control chart when GG25 tapping is out of control.
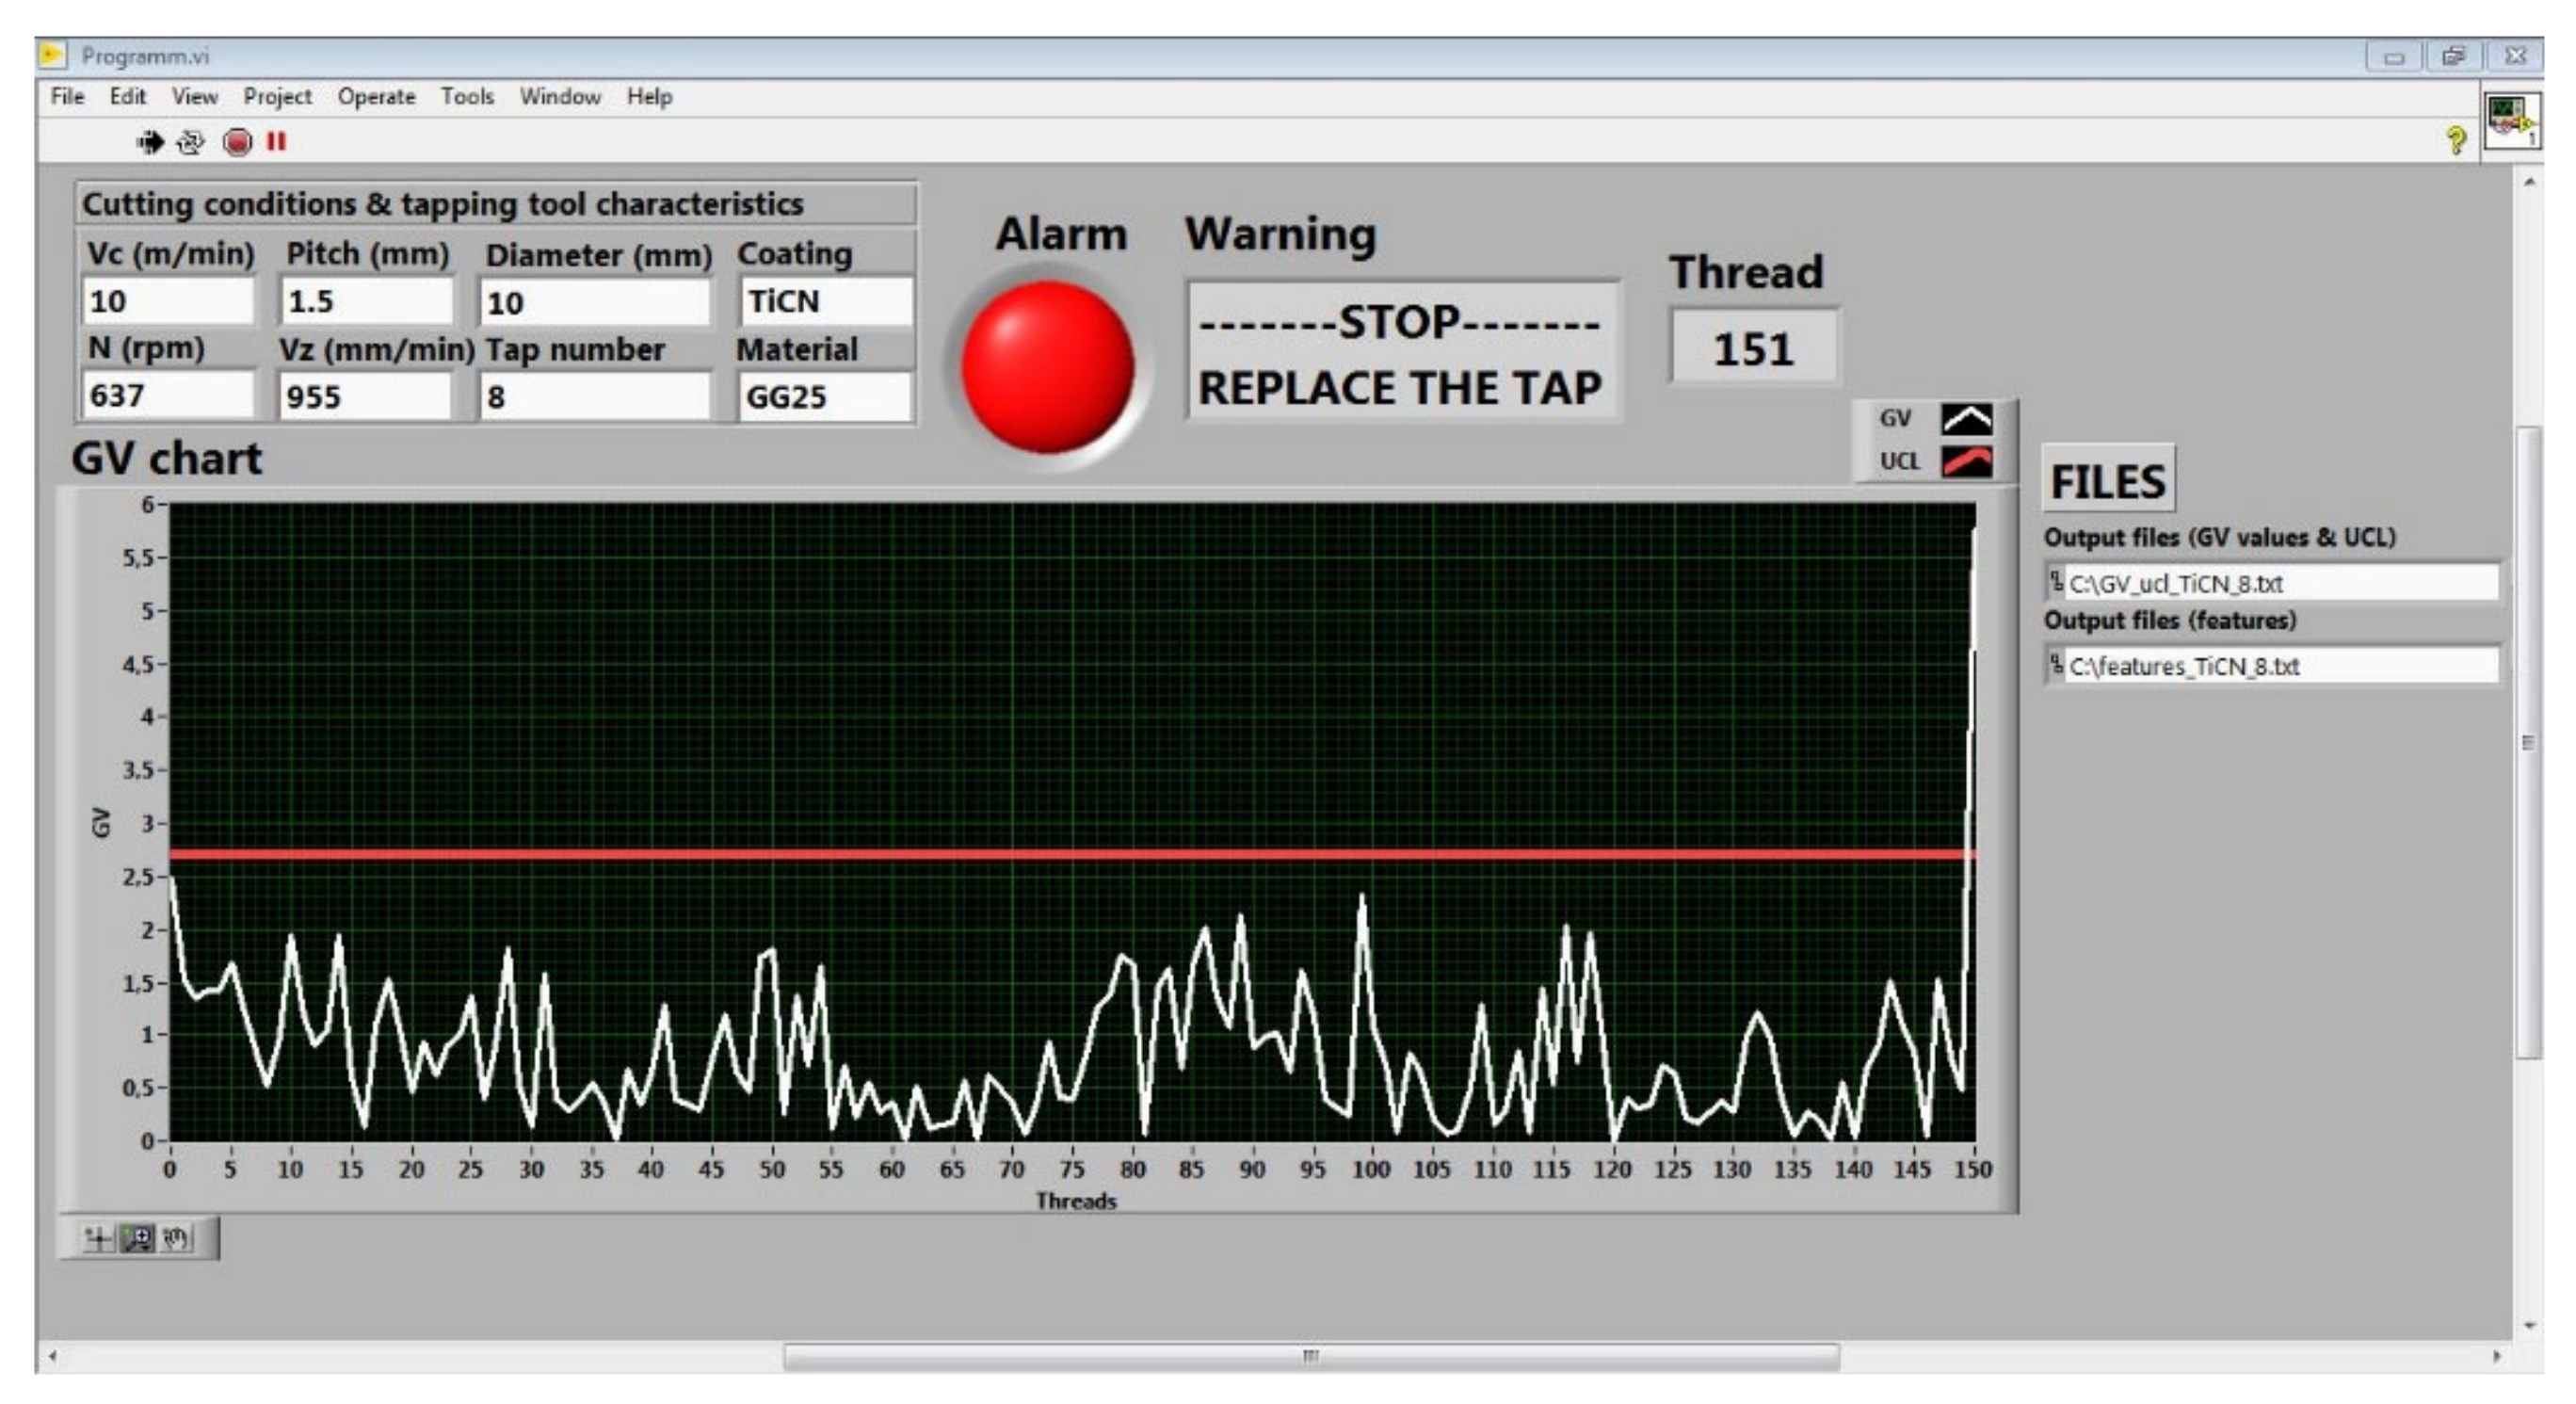
Figure 11 show the tap 8 GV control chart when GG25 tapping operation is out of control.
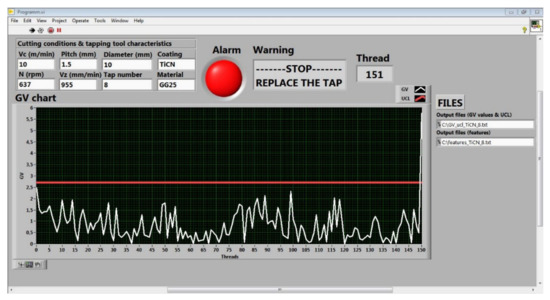
Figure 11.
Tap 8 multivariate control chart when GG25 tapping is out of control.
The increment of 151st thread GV value is two times the UCL value. This out of control could be a micro-tooth breakage or material removing of the thread flanks in the reverse stage.
5.3.3. Multivariate Control Chart Tapping in Nodular Cast Iron (GGG50)
Figure 12 and Figure 13 illustrate the process in control and out of control of taps 10 and 12 when machining GGG50, respectively.

Figure 12.
Tap 10 multivariate control chart when GGG50 tapping is out of control.
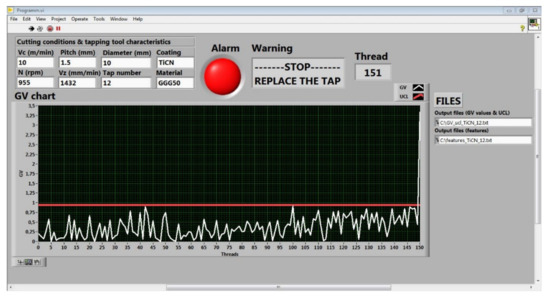
Figure 13.
Tap 12 multivariate control chart when GGG50 tapping is out of control.
The differences between 219th thread and the previous one in tap 10 and 151st thread and previous one in tap 12 are more than seven and four times, respectively.
These high increments could be owing to a micro-tooth breakage or micro-chipping or damages on the thread flanks. These faults concern on thread quality and, therefore, the diagnosis system informs that the tap tool should be replaced.
5.3.4. Discussion on Quality Loss: Thread Oversizing
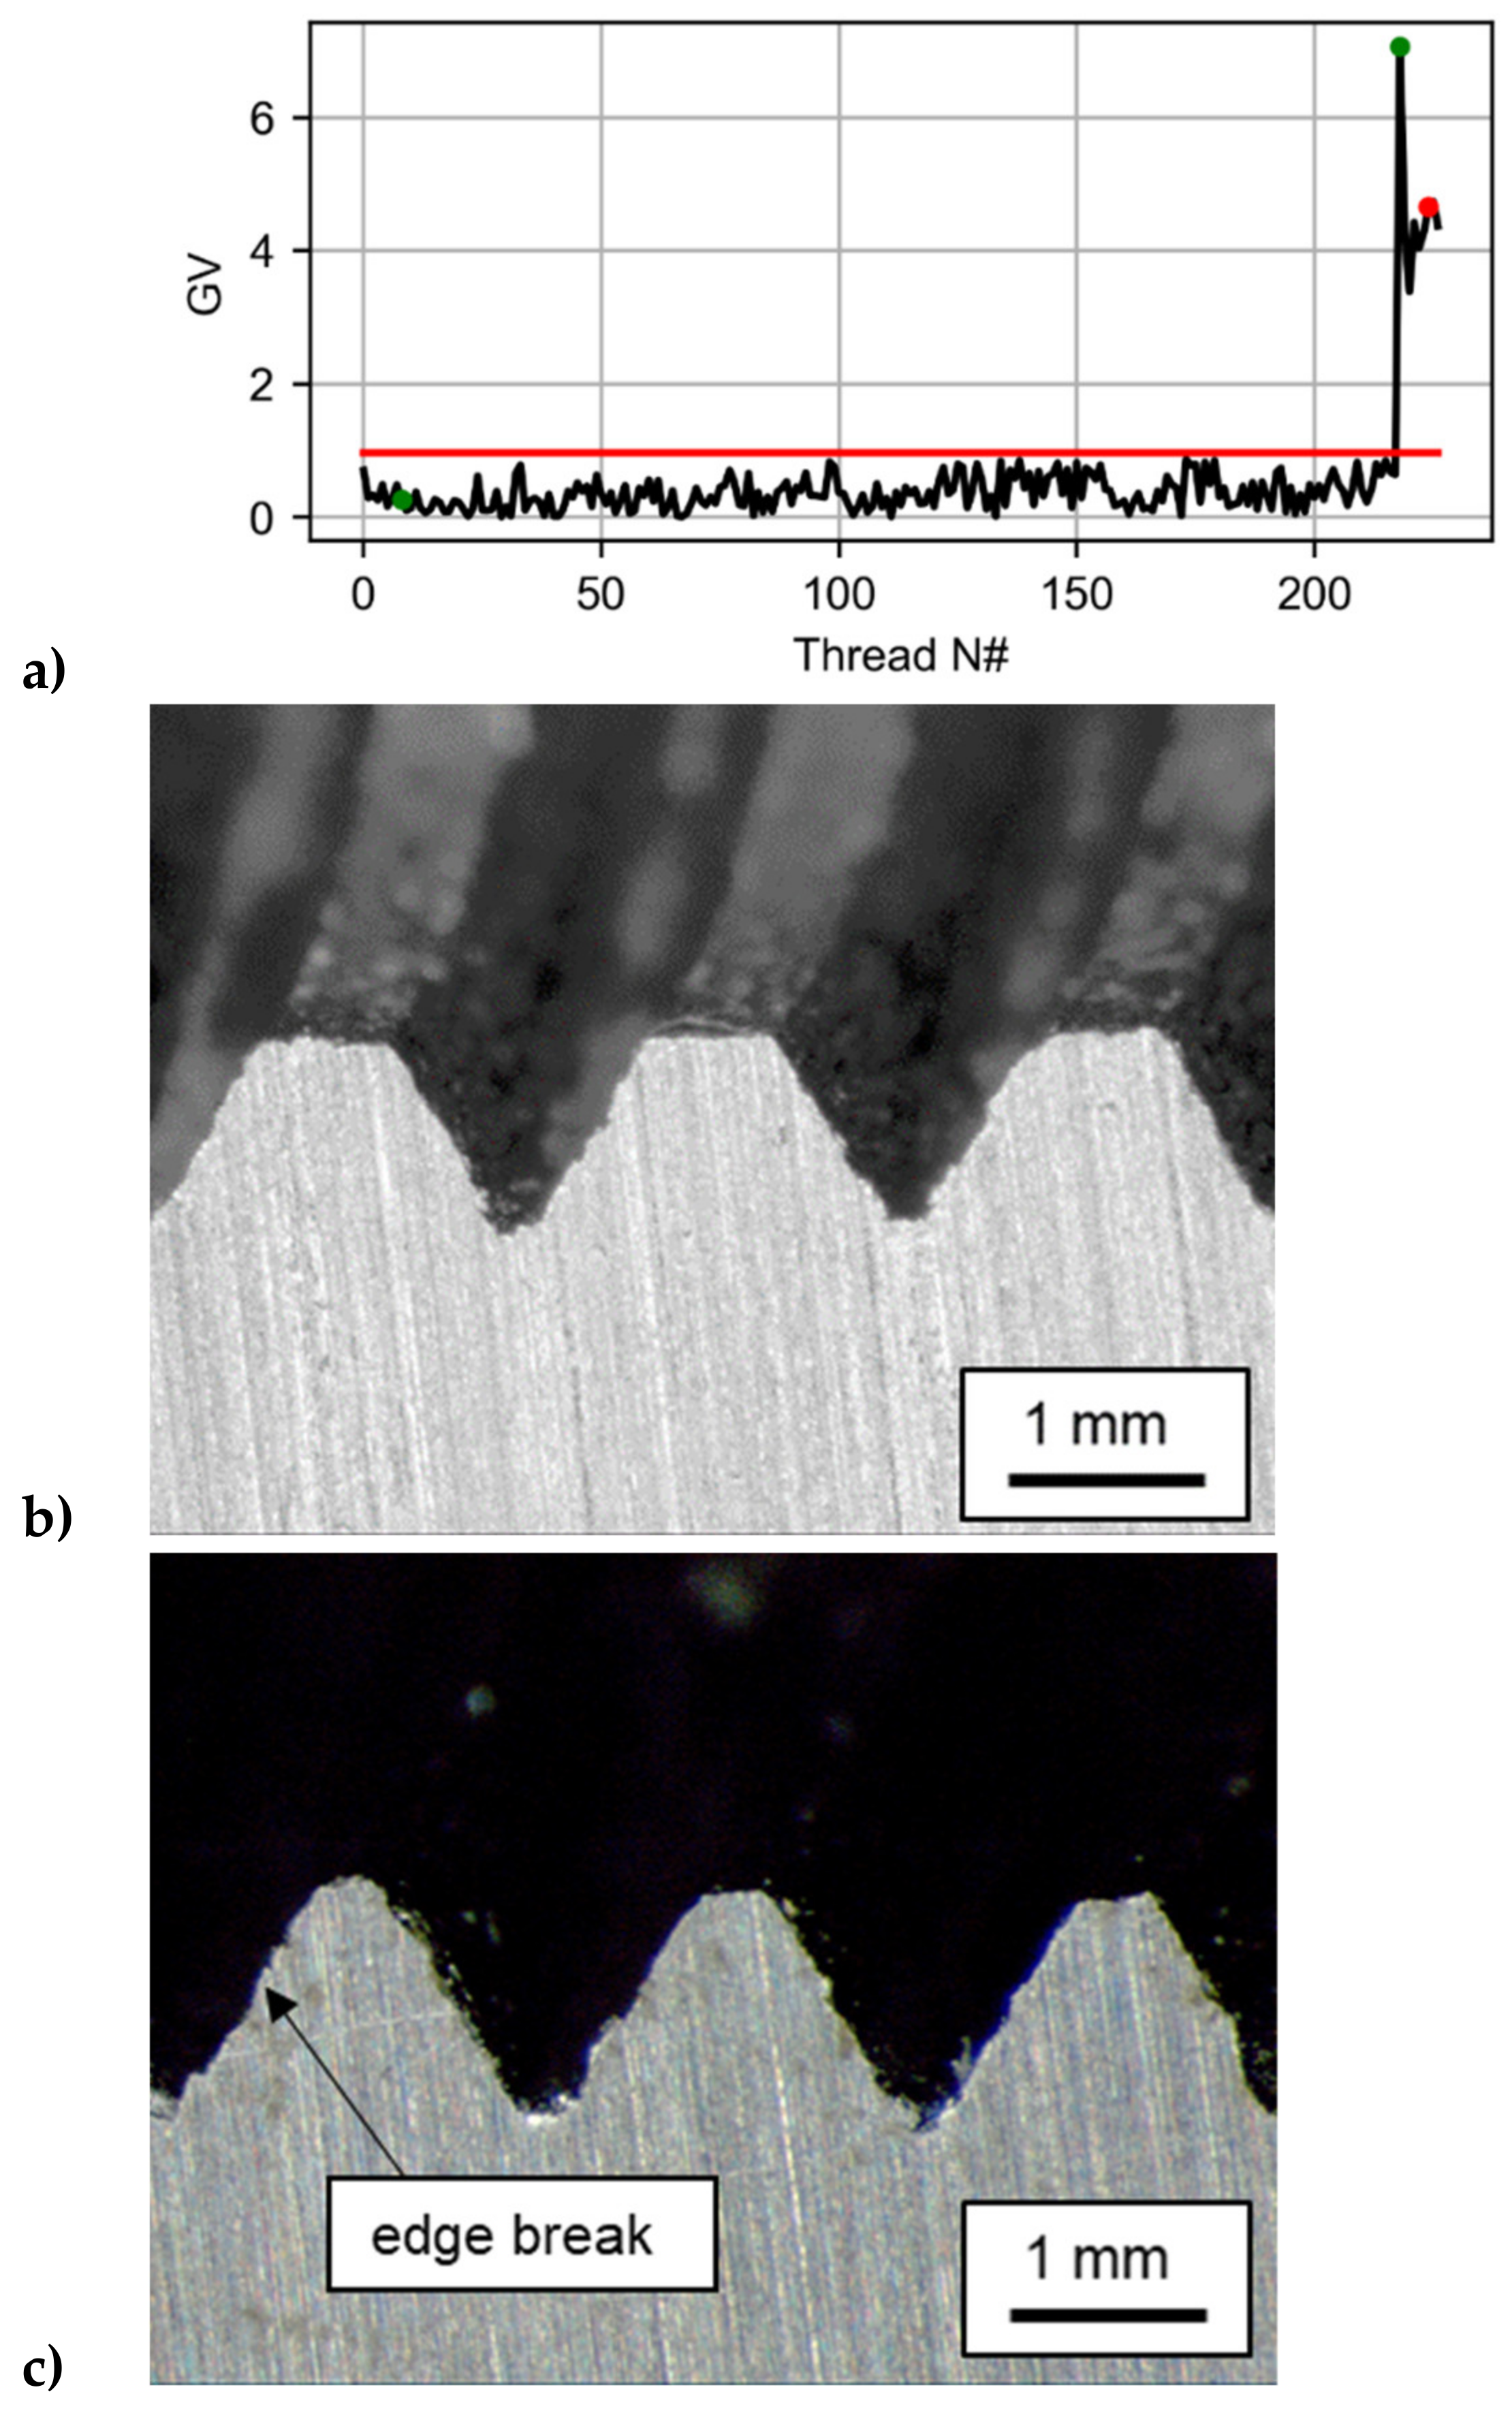
In this subsection a brief discussion is made about the origin of the loss of quality due to oversizing. Figure 14a shows the evolution of the GV calculated in all the threaded holes, like what was previously shown in Figure 13. In this tap, an alert was detected by the monitoring system in hole 219. At that moment the operator would be recommended not to continue threading.
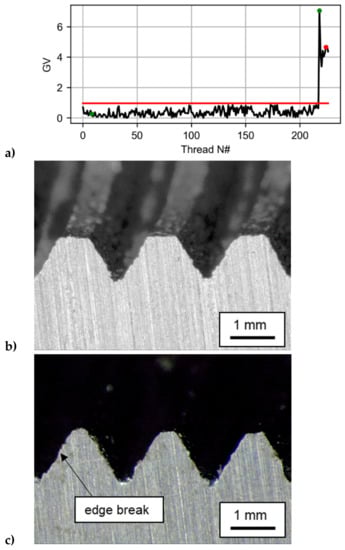
Figure 14.
(a) Evolution of GV for Tap 12 multivariate control chart where (b) is the first alarm thread profile and (c) is the first defected thread profile.
As can be seen in Figure 14b, this thread profile has good quality. According to the measurement made with the go no go gauge, the loss of quality occurs in the thread number 223 where the edge has broken. This breaking of the edge is due to a failure in the synchronism of the forward and turning movement that produces a concentrated effort on the edge that produces micro-breaks of the edge, as it can be seen on Figure 14c. For this reason, the cutting edge has an uneven surface.
5.3.5. Penalization Study of Diagnosis System
To study the penalization of the diagnosis system, the tapping process continues after the alarm until the first defected thread happens. The lack of quality is the oversizing for all the threads because the head of “non-go” gauges enters throughout the thread profile. The penalty is calculated as:
Table 2 illustrates the thread quality inspected by “go/non-go” gauge and the penalization to stop the process when the diagnosis approach switches the alarm. The first and second columns indicate the number of tap and the total number of threads which are in control of tolerances. The next columns provide the number of first tapped holes which do not pass the “go/non-go” gauge test and the thread quality. Finally, the last column is the percentage of penalty.
Table 2.
Penalization of diagnosis system.
The penalization of the diagnosis system over the tapping operation oscillates between 1.4% and 12.7%. The penalization average is 5.5%. The manufacturing users assumes this penalty over the tap tools knowing without diminishing the process competitiveness because the tapping process is in control and the operation safety is guaranteed.
6. Conclusions
An oversizing diagnosis manufacturing system has been developed to guarantee the thread quality during tapping operation. The strategy is based on multivariate control chart using an internal signal (torque) of the CNC machine spindle motor drive. In addition to this, some specific conclusions can be described:
- The system warns to the worker when the tapping process is out of control. The system prevents to continue making threaded holes with the same tool, recommending its replacement.
- The out of control in tapping process means wear and faults (micro-chipping, micro-tooth breakage or material removing on the thread flanks) on the tap tool geometry. The system detects errors originating from an oversize of the threaded hole, which means that the no go gauge passes through the hole because the tooth geometry is not well sculpted.
- The strategy assures the thread quality along the tapping operation. The penalization average (5.5%) can be assumed because the tapping safety is guaranteed. Penalization is defined as the number of threaded holes that could have been made until the loss of thread quality.
- The strategy is independent of the tool life and each tap is monitored against its own threshold. Also, the diagnosis approach works with different cutting conditions and workpiece materials.
- The strategy can work as an automatic tapping manufacturing approach with total manufacturing security because it could stop the operation without operator inspection.
- The developed strategy is reliable and could be implemented in a manufacturing environment.
Author Contributions
A.G.D.V. and F.V. conceived, performed, and designed the experiments; A.G.D.V., M.P., and M.A. analyzed the data; A.G.D.V., and F.V. developed the program; A.G.D.V., F.V., M.P., and M.A. wrote the paper, and A.G.D.V., M.P., and M.A. supervised the results and the paper. All authors have read and agreed to the published version of the manuscript.
Funding
This research was funded by the vice-counselling of technology, innovation and competitiveness of the Basque Government grant agreements IG-2011/0000392, ZL-2019/00720 (HARDCRAFT project) and KK-2019/00004 (PROCODA project). The work done in this paper has also received funding from the European Union’s Horizon 2020 research and innovation program under grant agreement no. 723698 (ForZDM). Besides, this project, called IDI-20100674, was supported by the Centre for the Development of Industrial Technology answering to the Ministry of Economy, Industry and Competitiveness (Spanish Government). This paper reflects only the author’s views and the Commission is not responsible for any use that may be made of the information contained therein.
Institutional Review Board Statement
Not applicable.
Informed Consent Statement
Not applicable.
Data Availability Statement
Data available on request from the authors.
Conflicts of Interest
The authors declare no conflict of interest.
References
- Urbikain, G.; Perez, J.M.; De Lacalle, L.N.L.; Andueza, A. Combination of friction drilling and form tapping processes on dissimilar materials for making nutless joints. Proc. Inst. Mech. Eng. Part B J. Eng. Manuf. 2018, 232, 1007–1020. [Google Scholar] [CrossRef]
- Ahn, J.H.; Lee, D.J.; Kim, S.H.; Cho, K.K. Effects of synchronizing errors in cutting performance in the ultrahigh- speed tapping. Ann. CIRP 2003, 52, 53–56. [Google Scholar] [CrossRef]
- Elosegui, I.; Alonso, U.; De Lacalle, L.N.L. PVD coatings for thread tapping of austempered ductile iron. Int. J. Adv. Manuf. Technol. 2017, 91, 2663–2672. [Google Scholar] [CrossRef]
- Rodríguez-Barrero, S.; Fernández-Larrinoa, J.; Azkona, I.; De Lacalle, L.N.L.; Polvorosa, R. Enhanced Performance of Nanostructured Coatings for Drilling by Droplet Elimination. Mater. Manuf. Process. 2016, 31, 593–602. [Google Scholar] [CrossRef]
- International Organization for Standardization (ISO). ISO1502:1996 ISO General-Purpose Metric Screw Threads. Gauges and Gauging; International Organization for Standardization: Geneva, Switzerland, 1996. [Google Scholar]
- Corne, R.; Nath, C.; El Mansori, M.; Kurfess, T. Study of spindle power data with neural network for predicting real-time tool wear/breakage during inconel drilling. J. Manuf. Syst. 2017, 43, 287–295. [Google Scholar] [CrossRef]
- Yao, C.; Chien, Y. A diagnosis method of wear and tool life for an endmill by ultrasonic detection. J. Manuf. Syst. 2014, 33, 129–138. [Google Scholar] [CrossRef]
- Kan, C.; Yang, H.; Kumara, S. Parallel computing and network analytics for fast Industrial Internet-of-Things (IIoT) machine information processing and condition monitoring. J. Manuf. Syst. 2018, 46, 282–293. [Google Scholar] [CrossRef]
- Armarego, E.J.A.; Chen, M.N.P. Predictive models for the forces and torque in machine tapping with straight flute taps. CIRP Ann. 2002, 51, 75–78. [Google Scholar] [CrossRef]
- Oezkaya, E.; Biermann, D. Development of a geometrical torque prediction method (GTPM) to automatically determine the relative torque for different tapping tools and diameters. Int. J. Adv. Manuf. Technol. 2018, 97, 1465–1479. [Google Scholar] [CrossRef]
- Lenz, J.; Wuest, T.; Westkämper, E. Holistic approach to machine tool data analytics. J. Manuf. Syst. 2018, 48, 180–191. [Google Scholar] [CrossRef]
- Chen, Y.B.; Sha, J.L.; Wu, S.M. Diagnosis of tapping process by information measure and probability voting approach. J. Eng. Ind. 1990, 112, 319–325. [Google Scholar] [CrossRef]
- Liu, T.; Ko, E.J.; Sha, S.L. Diagnosis of tapping processes using an AI approach. J. Mater. Shap. Technol. 1991, 9, 39–46. [Google Scholar] [CrossRef]
- Li, W.; Li, D.; Ni, J. Diagnosis of tapping process using spindle motor current. Int. J. Mach. Tools Manuf. 2003, 43, 73–79. [Google Scholar] [CrossRef]
- Lorentz, G. Principal component analysis in technology. Ann. CIRP 1989, 38, 107–109. [Google Scholar] [CrossRef]
- Liu, T.-I.; Lee, J.; Liu, G.; Wu, Z. Monitoring and diagnosis of the tapping process for product quality and automated manufacturing. Int. J. Adv. Manuf. Technol. 2013, 64, 1169–1175. [Google Scholar] [CrossRef]
- Zawada-Tomkiewicz, A.; Wierucka, I. A case study in technological quality assurance of a metric screw thread. Measurement 2018, 114, 208–217. [Google Scholar] [CrossRef]
- De Freitas, S.A.; Vieira, J.T.; Filho, S.L.M.R.; Brandão, L.C. Experimental investigation of tapping in CFRP with analysis of torque-tension resistance. Int. J. Adv. Manuf. Technol. 2019, 104, 757–766. [Google Scholar] [CrossRef]
- Monka, P.; Monkova, K.; Modrak, V.; Hric, S.; Pastucha, P. Study of a tap failure at the internal threads machining. Eng. Fail. Anal. 2019, 100, 25–30. [Google Scholar] [CrossRef]
- Pereira, I.C.; Vianello, P.I.; Boing, D.; Guimarães, G.; Da Silva, M.B. An approach to torque and temperature thread by thread on tapping. Int. J. Adv. Manuf. Technol. 2020, 106, 4891–4901. [Google Scholar] [CrossRef]
- Polvorosa, R.; de Lacalle, L.L.; Egea, A.J.S.; Fernandez, A.; Esparta, M.; Zamakona, I. Cutting edge control by monitoring the tapping torque of new and resharpened tapping tools in Inconel 718. Int. J. Adv. Manuf. Technol. 2020, 106, 3799–3808. [Google Scholar] [CrossRef]
- Gil Del Val, A.; Veiga, F.; Pereira, O.; De Lacalle, L.N.L. Threading Performance of Different Coatings for High Speed Steel Tapping. Coatings 2020, 10, 464. [Google Scholar] [CrossRef]
- Brandão, G.L.; Silva, P.M.D.C.; De Freitas, S.A.; Pereira, R.B.D.; Lauro, C.H.; Brandão, L.C. State of the art on internal thread manufacturing: A review. Int. J. Adv. Manuf. Technol. 2020, 110, 3445–3465. [Google Scholar] [CrossRef]
- Gil Del Val, A.; Fernandez, J.R.; Del Castillo, E.; Arizmendi, M.; Veiga, F.G. Monitoring of thread quality when tapping nodular cast iron with TiN-coated HSS cutting taps. Int. J. Adv. Manuf. Technol. 2013, 69, 1273–1282. [Google Scholar] [CrossRef]
- Jackson, J.E.A. User´s Guide to Principal Components; John Wiley & Sons: New York, NY, USA, 1991. [Google Scholar] [CrossRef]
- Sullivan, J.H.; Woodall, W.H. A comparison of multivariate control chart for individual observations. J. Qual. Tecnol. 1996, 28, 398–408. [Google Scholar] [CrossRef]
- Montgomery, D.C. Introduction to Statistical Quality Control, 3rd ed.; John Wiley & Sons: New York, NY, USA, 1996. [Google Scholar]


Publisher’s Note: MDPI stays neutral with regard to jurisdictional claims in published maps and institutional affiliations. |
© 2021 by the authors. Licensee MDPI, Basel, Switzerland. This article is an open access article distributed under the terms and conditions of the Creative Commons Attribution (CC BY) license (http://creativecommons.org/licenses/by/4.0/).