Article

Studies of Post-Fabrication Heat Treatment of L-PBF-Inconel 718: Effects of Hold Time on Microstructure, Annealing Twins, and Hardness

Department of Mechanical and Structural Engineering and Materials Science, Faculty of Science and Technology, University of Stavanger, 4036 Stavanger, Norway
*
Author to whom correspondence should be addressed.
Metals 2021, 11(2), 266; https://doi.org/10.3390/met11020266
Submission received: 5 January 2021 / Revised: 22 January 2021 / Accepted: 29 January 2021 / Published: 4 February 2021
(This article belongs to the Section Additive Manufacturing)

Abstract

:
The widely adopted temperature for solid solution heat treatment (ST) for the conventionally fabricated Inconel 718 is 1100 °C for a hold time of 1 h or less. This ST scheme is, however, not enough to dissolve Laves and annihilate dislocations completely in samples fabricated with Laser metal powder bed fusion (L-PBF) additive manufacturing (AM)-Inconel 718. Despite this, the highest hardness obtained after aging for ST temperatures (970–1250 °C) is at 1100 °C/1 as we have ascertained in our previous studies. The unreleased residual stresses in the retained lattice defects potentially affect other properties of the material. Hence, this work aims to investigate if a longer hold time of ST at 1100 °C will lead to complete recrystallization while maintaining the hardness after aging or not. For this study, L-PBF-Inconel 718 samples were ST at 1100 °C at various hold times (1, 3, 6, 9, 16, or 24 h) and aged to study the effects on microstructure and hardness. In addition, a sample was directly aged to study the effects of bypassing ST. The samples (ST and aged) gain hardness by 43–49%. The high density of annealing twins evolved during 3 h of ST and only slightly varies for longer ST.

1. Introduction

Inconel 718 is a high-strength corrosion-resistant nickel-based superalloy used in the temperature range of −252 to 704 °C [1]. The alloy is mainly used in aeronautics and in energy industries where high strength and corrosion resistance properties are prior requirements in severe environments. The optimum microstructure and mechanical strength of Inconel 718 is generally achieved after performing two steps of post-fabrication heat treatments. These are solid solution heat treatment (ST) and aging (also known as precipitation hardening). The solid solution heat treatment is often performed in the temperature range of 970 to 1250 °C (the fusion temperature of Inconel 718 is ≈1300 °C) for a few hours to dissolve Laves phase in order to release age-hardening constituents (Nb, Ti, and Al) into solid solution in the matrix [2,3,4,5,6]. Laves phase is an Nb and Ti-rich intermetallic compound represented as (Ni, Cr, Fe)2(Nb, Mo, Ti). In addition, the dissolution of Laves phase is important since Laves is detrimental to the material tensile ductility, fatigue, and creep rapture properties [1]. Dislocations and other lattice defects are also annihilated during solid solution heating depending on the temperature and/or hold time. Aging is usually performed in two successive steps. The solution heat-treated sample is first aged at 704–899 °C for a few minutes to several hours, and then at a lower temperature (593–704 °C) for another hold time [7]. Aging results in precipitation of ellipsoidal γ″ and spherical γ′ phases into the Ni-rich γ-matrix. These two phases are expressed by the same formulation, given as Ni3M. The γ″ phase is a D022 body-centered tetragonal (Ni3Nb), whereas the γ′ phase is a primitive cubic L12-ordered intermetallic Ni3(Nb, Ti, Al). In a thoroughly homogenized and aged Inconel 718, the volume fraction of γ″ precipitate is about four times larger than that of the γ′ precipitate [8]. The γ″ precipitate is thus considered as the major strengthening phase. The volume fraction of the γ″ phase precipitated, however, varies based on the quantity of Nb present in the solid solution [9]. It is therefore important to dissolve the Laves phase completely through solution heat treatment to make enough Nb available in the γ-matrix to realize the precipitation of a large quantity of γ″ phase during aging.
To understand the changes after the heat treatments, it is important to revisit the microstructure of the as-printed Inconel 718. The fabrication process of additive manufacturing (AM), in general, and laser metal powder bed fusion (L-PBF) in particular, involves very rapid heating and cooling process as compared to the conventional techniques. Consequently, the microstructure of L-PBF-Inconel 718 is quite different from the as-cast or wrought ones. The grain morphology of the L-PBF fabricated-Inconel-718 can be columnar, equiaxed, or irregular [10]. All the grains, however, consist of columnar and cellular subgrains. The cellular subgrains are the most dominant subgrains in Inconel 718 in the as-printed state. A typical scanning electron microscopy (SEM) image of the as-printed L-PBF-Inconel 718 is shown in Figure 1a. The size of the cellular subgrains lies in the range of 0.3–1 µm. The columnar subgrains have a high aspect ratio, but their average width is about the same size as that of the cellular subgrains. The subgrain boundaries are decorated with segregated phases, mainly the Laves phase. These phases are shown as white contrast along the subgrain boundaries of the electron backscatter diffraction (EBSD) image of Figure 1a.
In addition, the subgrain boundaries consist of high-density dislocation networks as revealed by the TEM micrograph shown in Figure 1b. Because of these components, the subgrain boundaries usually appear diffused and thick. The classical theory of the growth of subgrains explains the formation of subgrains in terms of dislocation motion. According to Verhoeven [11], when dislocations are able to cross slips (high stacking fault energy), they tend to condense into tangles, which results in the creation of high- and low-density dislocation regions. The regions with low-density dislocations are misoriented slightly (<5°) from each other and they are referred to as subgrains whereas the narrow region with high-density dislocations form the subgrain boundaries. The origin of subgrains in 3-D-printed material is not yet clearly understood, apart from associating it with the repeated high heating/cooling rates the material experiences during the solidification process.
Lattice defects, primarily dislocations in the L-PBF-Inconel 718, are also potentially threatening mechanical properties since they are sites of high stress. However, a short hold time (1 h) of ST at 1100 °C, at which the maximum hardness is attained [12], is not long enough to completely dissolve the Laves phase and annihilate the lattice defects. The features of the initial microstructure are generally retained after the ST for 1 h. It means, the hold time for ST at 1100 °C must be long enough to eliminate the defects and release the stresses. Obviously, hardness decreases with decreasing stress during solid solution heat treatment. Hence, this study analyzes hardness in relation to the recrystallization behavior (less loosely with hold time). Furthermore, it analyzes whether the optimal hardness can be maintained or not while attaining complete recrystallization (strain-free) through solid solution heat treatment and standard aging.
Annealing twins evolve in large quantities when Inconel 718 is ST at and close to 1100 °C [9,13] for hold times longer than 1 h [12]. Twin boundaries are low-energy defects compared to grain boundaries but reports in the literature showed that they do have both detrimental and beneficial effects on material properties. Improved tensile strength is one of the major beneficial effects observed due to the formation of annealing twins [14,15]. According to Li and his co-workers [14], the improved tensile strength of austenitic (Fe-10Mn-4Al-0.3C) is due to the combined effects of grain refinement and the formation of high-density annealing twins. Similarly, Chuang and his colleagues [15] showed a simultaneous increment of the tensile strength and elongation due to the large number of annealing twins in Ag-8Au-3Pd wire. Furthermore, the twin boundaries’ interaction with dislocation in Fe-Mn-C steel was found to strengthen the material since the impeding process reduces the mean free path of dislocations [13]. On the negative side, twin boundaries are regarded as the initiation sites of fatigue cracks in nickel-based superalloys [16,17], in which case the formation of annealing twins is undesirable. A review of the impacts of twin boundaries on various technological materials, specifically that of the Ni-based alloys, can be found in [18]. Considering the different effects of twins on material properties, it is essential to understand the parameters that influence the formation of annealing twins.
The aim of this study was thus to investigate if longer hold times of ST at 1100 °C will result in complete recrystallization while maintaining the hardness of L-PBF-fabricated Inconel 718 or not. Likewise, the effects of hold time on the twin formation in relation to recrystallization and grain growth were analyzed. The hardness and microstructure of directly aged sample were analyzed, using by-passing solid solution heat treatment as an option or not. Microstructure and phase analysis were studied using scanning electron microscopy, transmission electron microscopy, and X-ray diffractogram. A Vickers hardness tester was used for hardness measurement.

2. Materials and Experimental Methods

Inconel 718 cylindrical parts (12 cm long and 1.2 cm in diameter) were fabricated by a PROMET AS, (Stavanger, Norway) using L-PBF 280HL machine (SLM Solutions, Lübeck, Germany) equipped with a 400-W fiber laser. Pre-alloyed powder with the nominal composition (Table 1) adopted from the standard specification for AM of Ni alloy (UNS N07718) [1] was used for the printing of the parts. The particle size of the powder lies between 10 and 45 μm. The values of the basic printing parameters applied were a laser beam power of 175 W, scanning speed of 619 mm/s, hatching distance of 0.08 mm, and layer thickness of about 0.03 mm based on the recommendation by the machine manufacturer (SLM Solutions, Lübeck, Germany). We also noted that the energy density calculated using these values realizes the optimal material density for Inconel 718 [19]. The printing was done in an argon atmosphere to reduce oxidation of the molten pool. The building platform was preheated to 200 °C to reduce stresses that may develop during printing. The printing direction was parallel to the Z-axis (vertical plane) whereas the deposited layers were parallel to the XY (horizontal) plane.
The as-printed (AP) samples were heat treated (solid solution and precipitation hardening) to investigate changes in the microstructure and hardness as a function of ST hold time. Before aging, the samples were solid solution heat treated at 1100 °C for 1, 3, 6, 9, 16, or 24 h of hold time, aiming to study the extent of stress relief and recrystallization. In addition, a sample was directly aged (DA) to analyze the effects of bypassing the solid solution heat treatment. All the heat treatments were done in a Nabertherm furnace equipped with a K-type thermocouple. For the ST, the samples were introduced after stabilizing the furnace to the target temperature to avoid undesirable phase transformations at the lower temperatures. At the end of the hold time, the samples were removed from the furnace and quenched in cold water.
Following previous works [5,7], the precipitation of the hardening phases was obtained after two successive steps of heat treatments adopted for conventionally fabricated Inconel 718. The furnace was pre heated to the aging temperature prior to introducing the AP or ST samples. The aging treatment was done, first at 760 °C for 10 h, after which the samples were furnace cooled to 650 °C and held for another 10 h. At the end of the holding period, the samples were removed from the furnace and then cooled in air. Here after, ST refers to solid solution heat treatment and STA refers to the combined treatments of ST and aging. A list of the specimens investigated, and heat treatment schemes are given in Table 2.
Hardness tests were performed using a Vickers Struers DuraScan testing machine (Struers, Ballerup, Denmark) under a 5-kg load. Phase analysis was done using powder X-ray diffractograms recorded with Bruker D8 X-ray diffraction (XRD) equipment (Bruker, Karlsruhe, Germany) with Cu radiation (λ = 1.54060 Å). The XRD was operating at 40 kV and 25 mA. The diffractograms were recorded between 35° and 100° 2θ at a step size of 0.034°. The microstructures of the specimens were analyzed with scanning electron microscopy (SEM), Gemini SUPRA 35VP (ZEISS) (Carl Zeiss, Jena, Germany) equipped with EDAX energy dispersive X-ray spectroscopy (EDS). For orientation mapping and quantitative analysis related to the microstructure, the electron backscatter diffraction (EBSD) system equipped on the SEM was implemented. Several scans of the samples were recorded and the EBSD acquired data were analyzed with Orientation Imaging Microscopy (OIM) software (EDAX-Jarle, version 7.5, Trondheim, Norway). Phase and lattice defects were further investigated with transmission electron microscopy (TEM), JEOL-2100 (LaB6 filament) (JEOL, Tokyo, Japan), operating at 200 kV. For TEM analysis, thin foils were prepared, first by thinning down mechanically to a thickness of about 100 µm, and then 3-mm disks were punched from the thin foils. These disks were then electropolished using a dual jet polishing system Struers TENUPOL-5 (Struers, Ballerup, Denmark) operated at 13 V and −30 °C in an electrolyte solution of 80% methanol and 20% perchloric acid. Sample preparation for investigation with SEM consisted of mechanical grinding, fine polishing, and ultra-polishing with OP-S colloidal silica. After investigation with SEM, the samples were used for measurement of Vickers hardness testing.

3. Results and Discussions
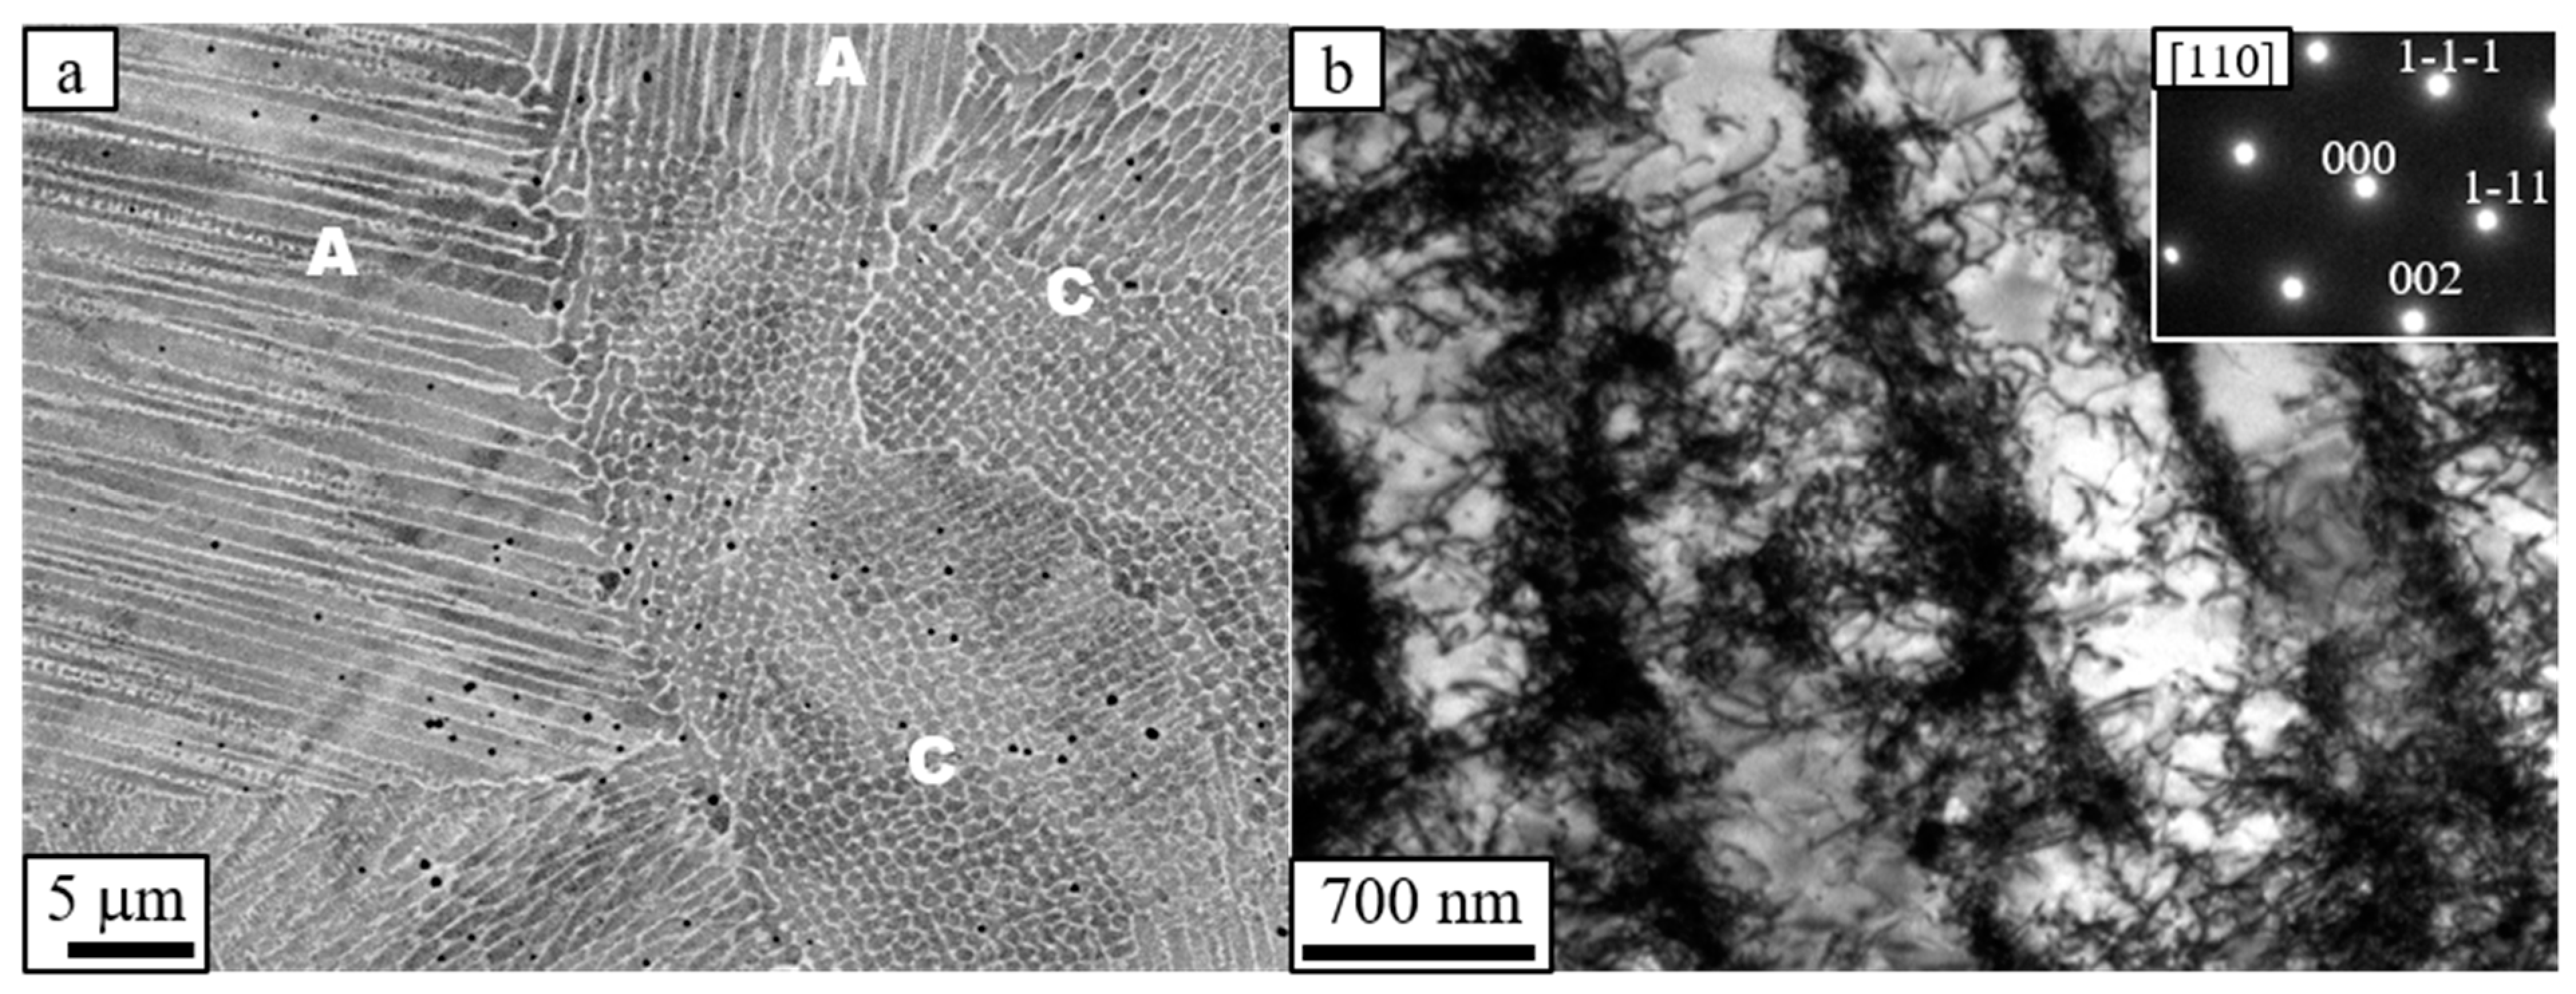
3.1. Microstructure

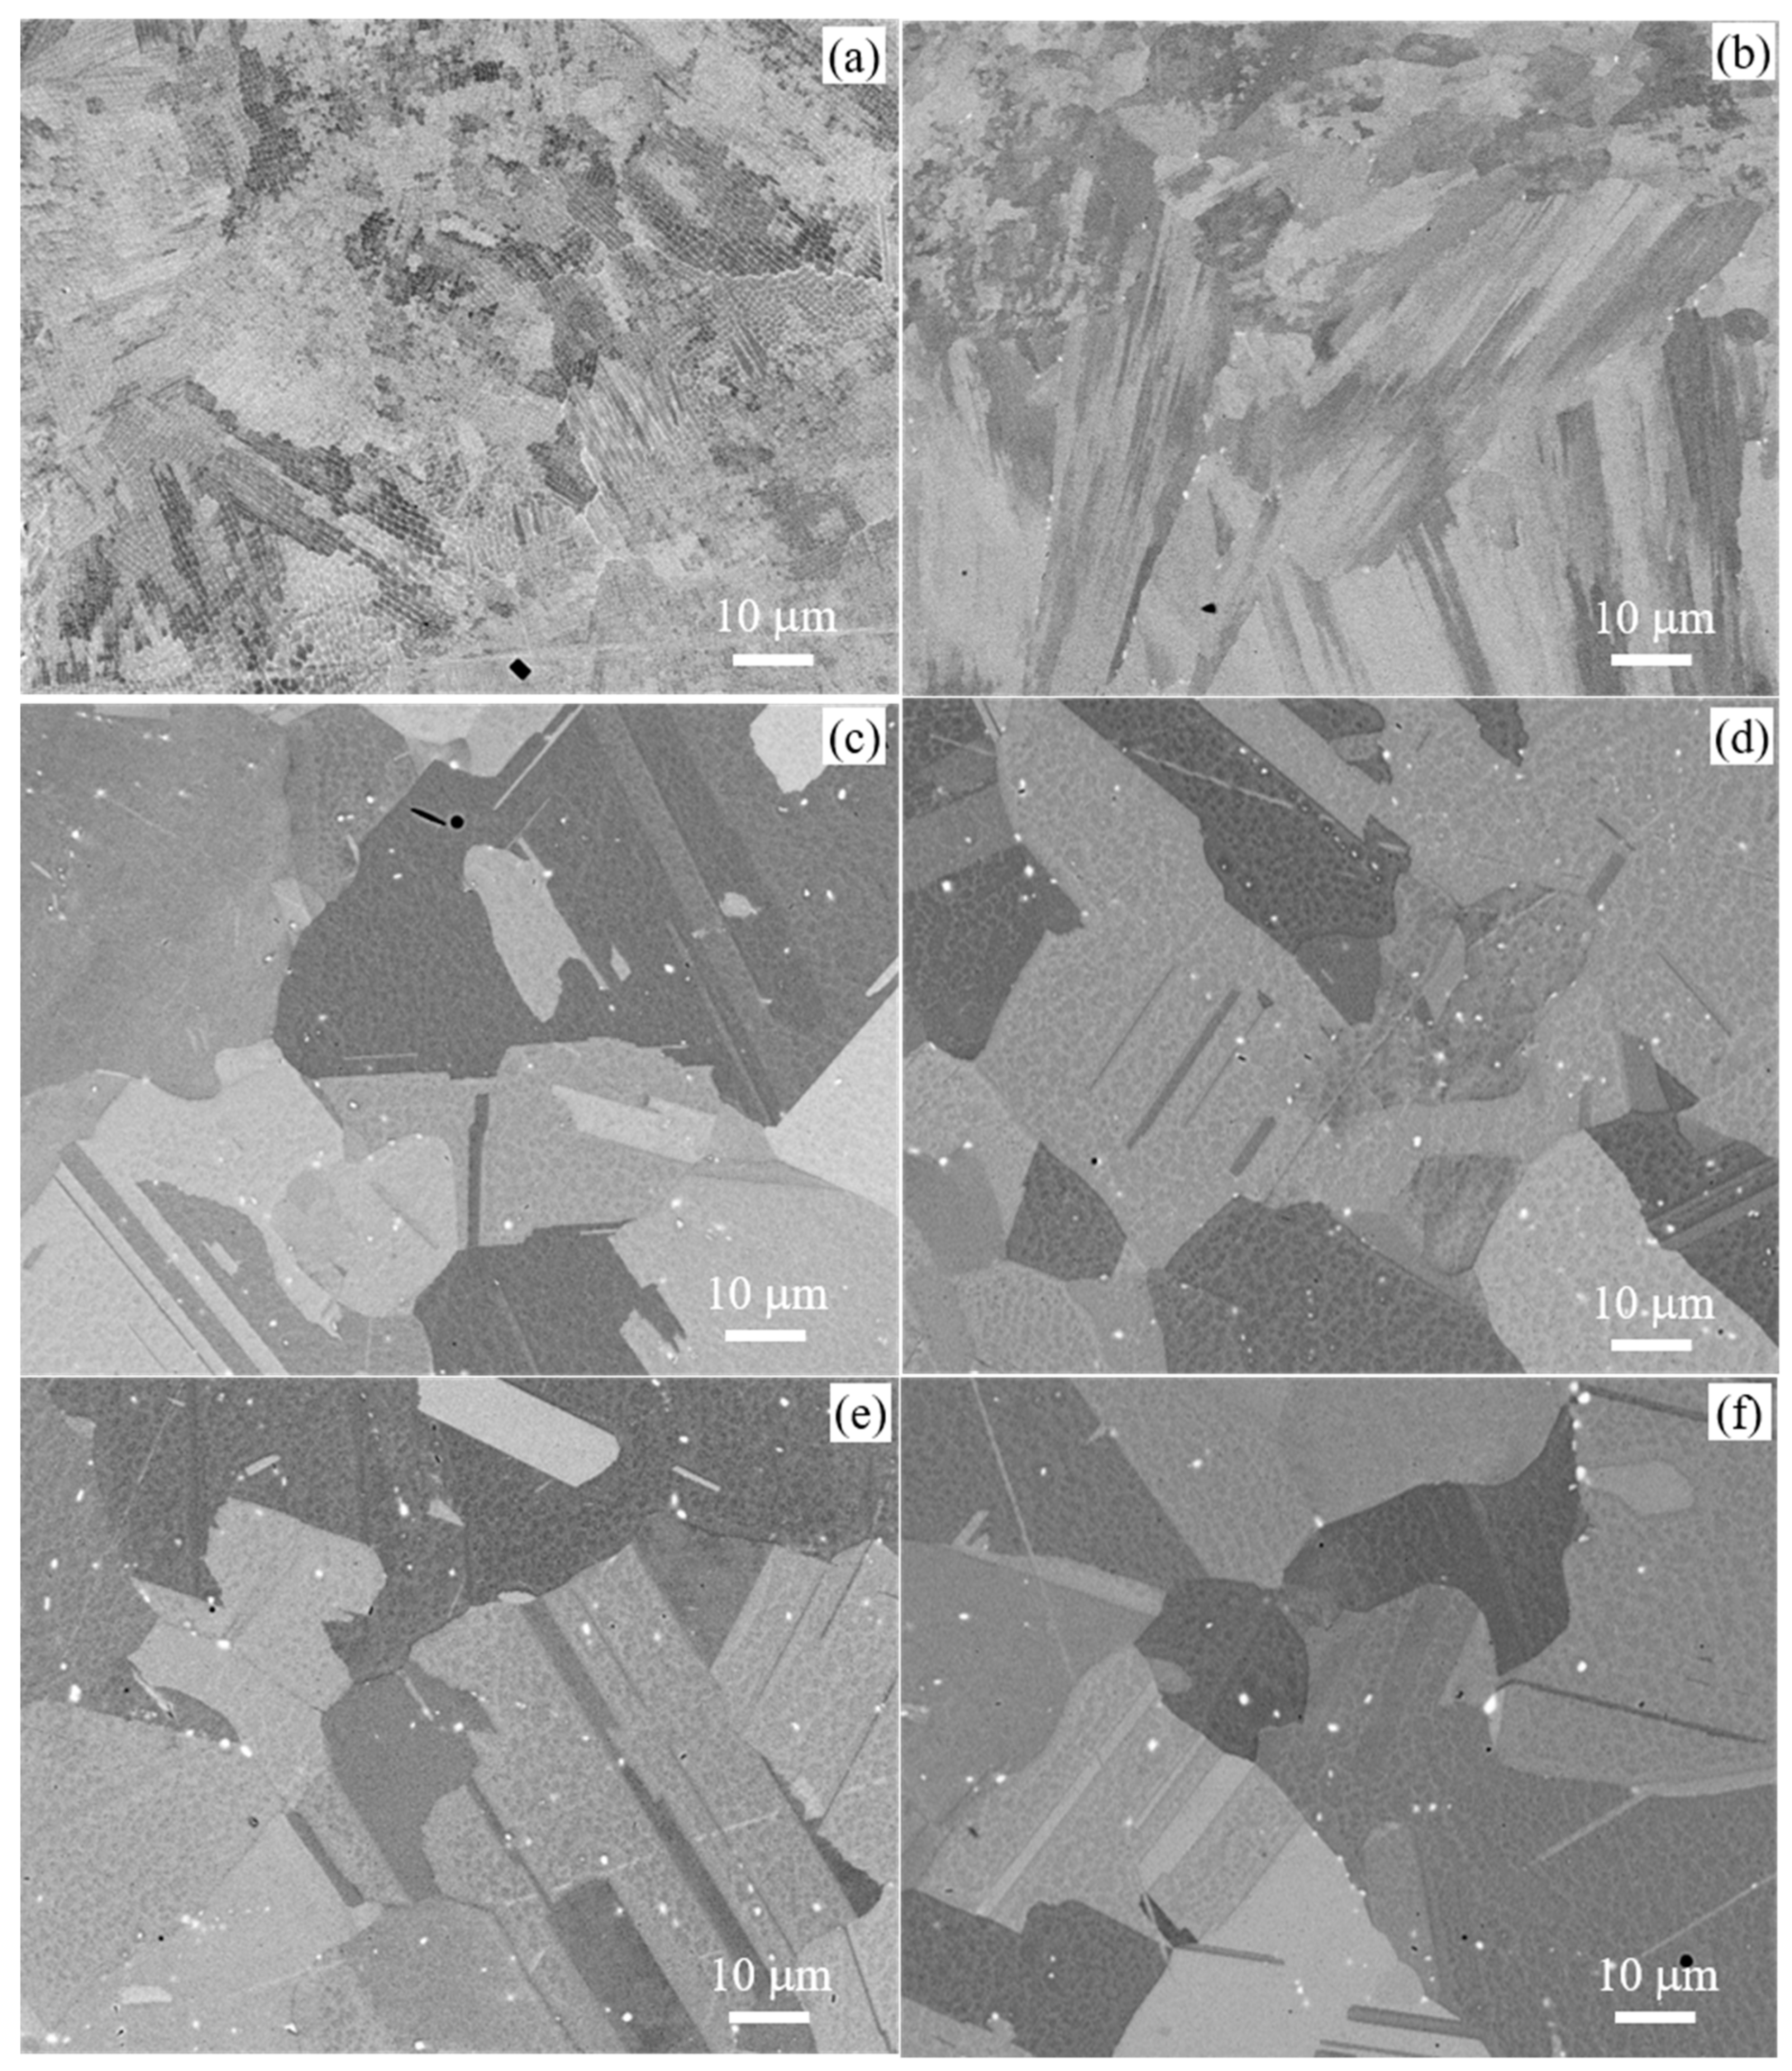
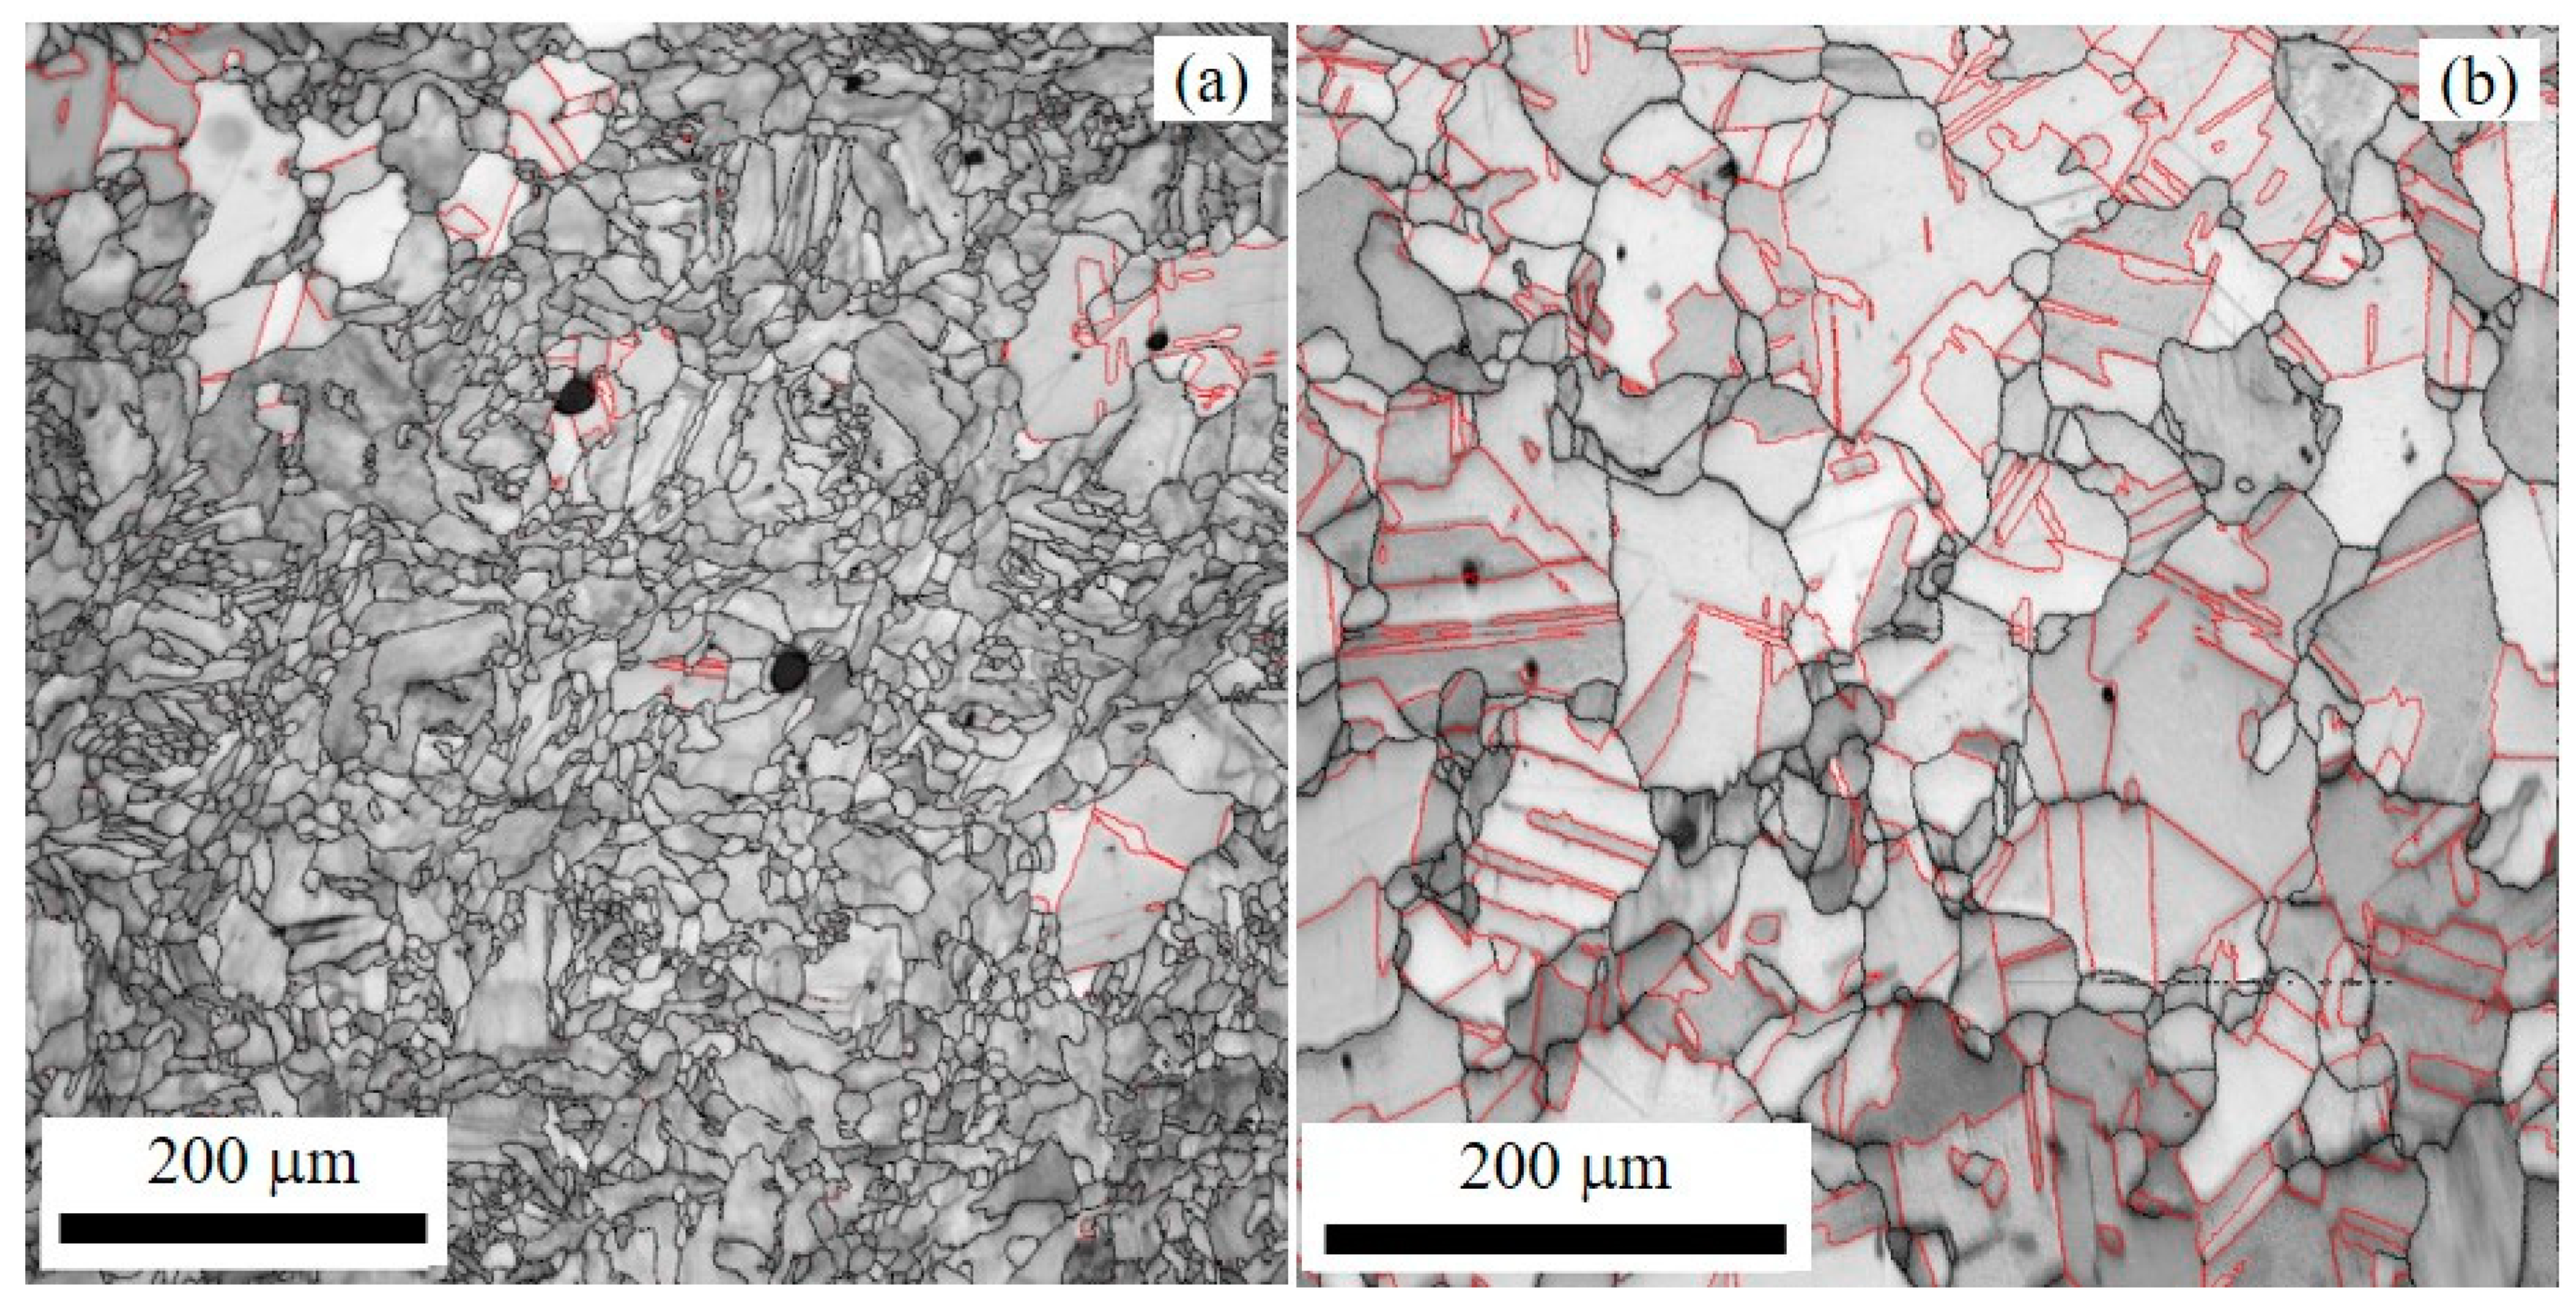
3.1.1. Effects of Solid Solution Heat Treatment

Solid solution heat treatment can lead to recovery, recrystallization, and grain growth depending on the temperature and/or hold time. This sub-section presents and discusses the effects of heat treatments at different hold times on the as-printed microstructure. Figure 2 shows the SEM image that exhibits the microstructure of the samples ST at 1100 °C but with different hold times. For comparison, the microstructure of the as-printed sample is also presented. The grain structure of the as-printed L-PBF-Inconel 718 consists of columnar and cellular subgrains with a diameter ranging from 0.3 to 1 µm as shown in Figure 1. The subgrain boundaries are enriched in high-density dislocation networks and primary phases that give rise to higher strength than the as-cast material. The extent of the changes in the microstructure and dissolution of the primary phases are dependent on the hold time of solid solution heat treatment. After 1 h of ST at 1100 °C, the sample underwent recovery and at the starting phase of recrystallization. Most of the sub-structures, such as subgrains, maintained their initial features. The Laves largely dissolved, but not completely as shown in the high-magnification image of Figure 3a. Compared to the as-printed, the subgrain boundaries of ST1 appear very thin, because of the lower concentration of segregated phases and dislocations. This shows that most of the subgrain boundaries were sustained after the 1 h solutioning at 1100 °C. Generally, the dissolution of the Laves phase and the annihilation of most of the dislocations preceded the elimination of the subgrain boundaries.
Although the SEM image of ST3 shown in Figure 2c is identical to the images of ST6, ST9, and ST16, there are still some remnant subgrains that are revealed by TEM analysis. The BF-TEM image in Figure 3b shows some of the subgrains in certain regions of the sample that persisted the 3 h of solid solution heat treatment. Like ST1 (Figure 3a), the subgrain boundaries of STA3 appear more well-defined than that of the as-printed state. As it has been pointed out [10,12] and shown in Figure 1, the subgrain boundaries of the as-printed Inconel 718 are decorated with high-density entangled dislocations and segregated phases. The thermal energy supplied during the 3 h ST could dissolve most of the segregated phases and annihilate most of the dislocations. In addition, a greater number of the subgrains were eliminated, and some others were grown by coalescence as shown in Figure 3. The 3 h of ST is thus not long enough to supply enough energy for elimination of the subgrains completely.
The formation of subgrains in L-PBF-Inconel 718 is believed to be a consequence of the local thermal cycles that occurred during printing. Due to the layer-by-layer fabrication of the material, each of the deposited layers experiences rapid heating and cooling cycles that build up residual stresses in the material. The formation mechanism of residual stress in AM materials was explained by Mercelis and Kruth [20] using a cool-down phase model. It is indicated that part of the previously melted material experiences remelting and re-solidification cycles. After re-solidification of the material, the cooling-down cycle leads to material shrinkage, which is partially restrained by the previously deposited material. The process then forms a stress state in the newly deposited material. The resulting high strains normally leads to the emergence of high-density dislocations, which are proportional to the amount of stresses. Under the prevailing stresses, the dislocations tend to organize themselves into low-energy states that form walls of dislocations inside a given grain. These walls of dislocation thus divide the grains into sections that differ from each other by low angle misorientation to form subgrains. The dislocations are also entangled around the Laves particles formed by segregation of heavier elements, such as Nb, Mo, and Ti. Most of the dislocations are annihilated during the solid solution heat treatment and leave behind thinner subgrain boundaries than before as shown in Figure 3. As stated above, the 3 h hold time at 1100 °C of ST is not long enough to eliminate the entire subgrains. This substructure cannot be eliminated even after 7 h of ST as we reported previously [10,12]. On the other hand, we did not observe the remnants of the subgrains in the sample ST for 9 h after having examined multiples of TEM images. The complete elimination of the subgrains in L-PBF deposited Inconel 718 is thus believed to be between 7 and 9 h of ST at 1100 °C.
Precipitates that are mainly rich in Nb, Mo, Ti, and C with variable dimensions and quantities were observed in the samples of solid solution heat treated along the grain boundaries as well as inside the grains. Generally, the primary phases of MC (M stands for Nb, Ti, Cr, etc.) and TiN in Inconel 718 cannot be dissolved at the ST temperature as pointed out by Radavich [7]. These phases are also found in AP and in all the ST samples. The carbide phases are stable at the ST temperature since their fusion temperatures are higher than that of the ST. The Ti-rich particles are mostly irregular in shape but with straight edges as they appear in electron-backscattered SEM images. The concentration level of Ti in such particles is around 80-weight percent. The rest of the composition is mainly nitrogen and it can thus be a phase-containing Ti-N system. The Nb-rich particles preferentially form carbide phases. The particles with a circular shape are usually rich in Al, O, and Ti. These particles/phases in the L-PBF-Inconel 718 are practically undissolved even at 1250 °C/7 h of solid solution heating [10].

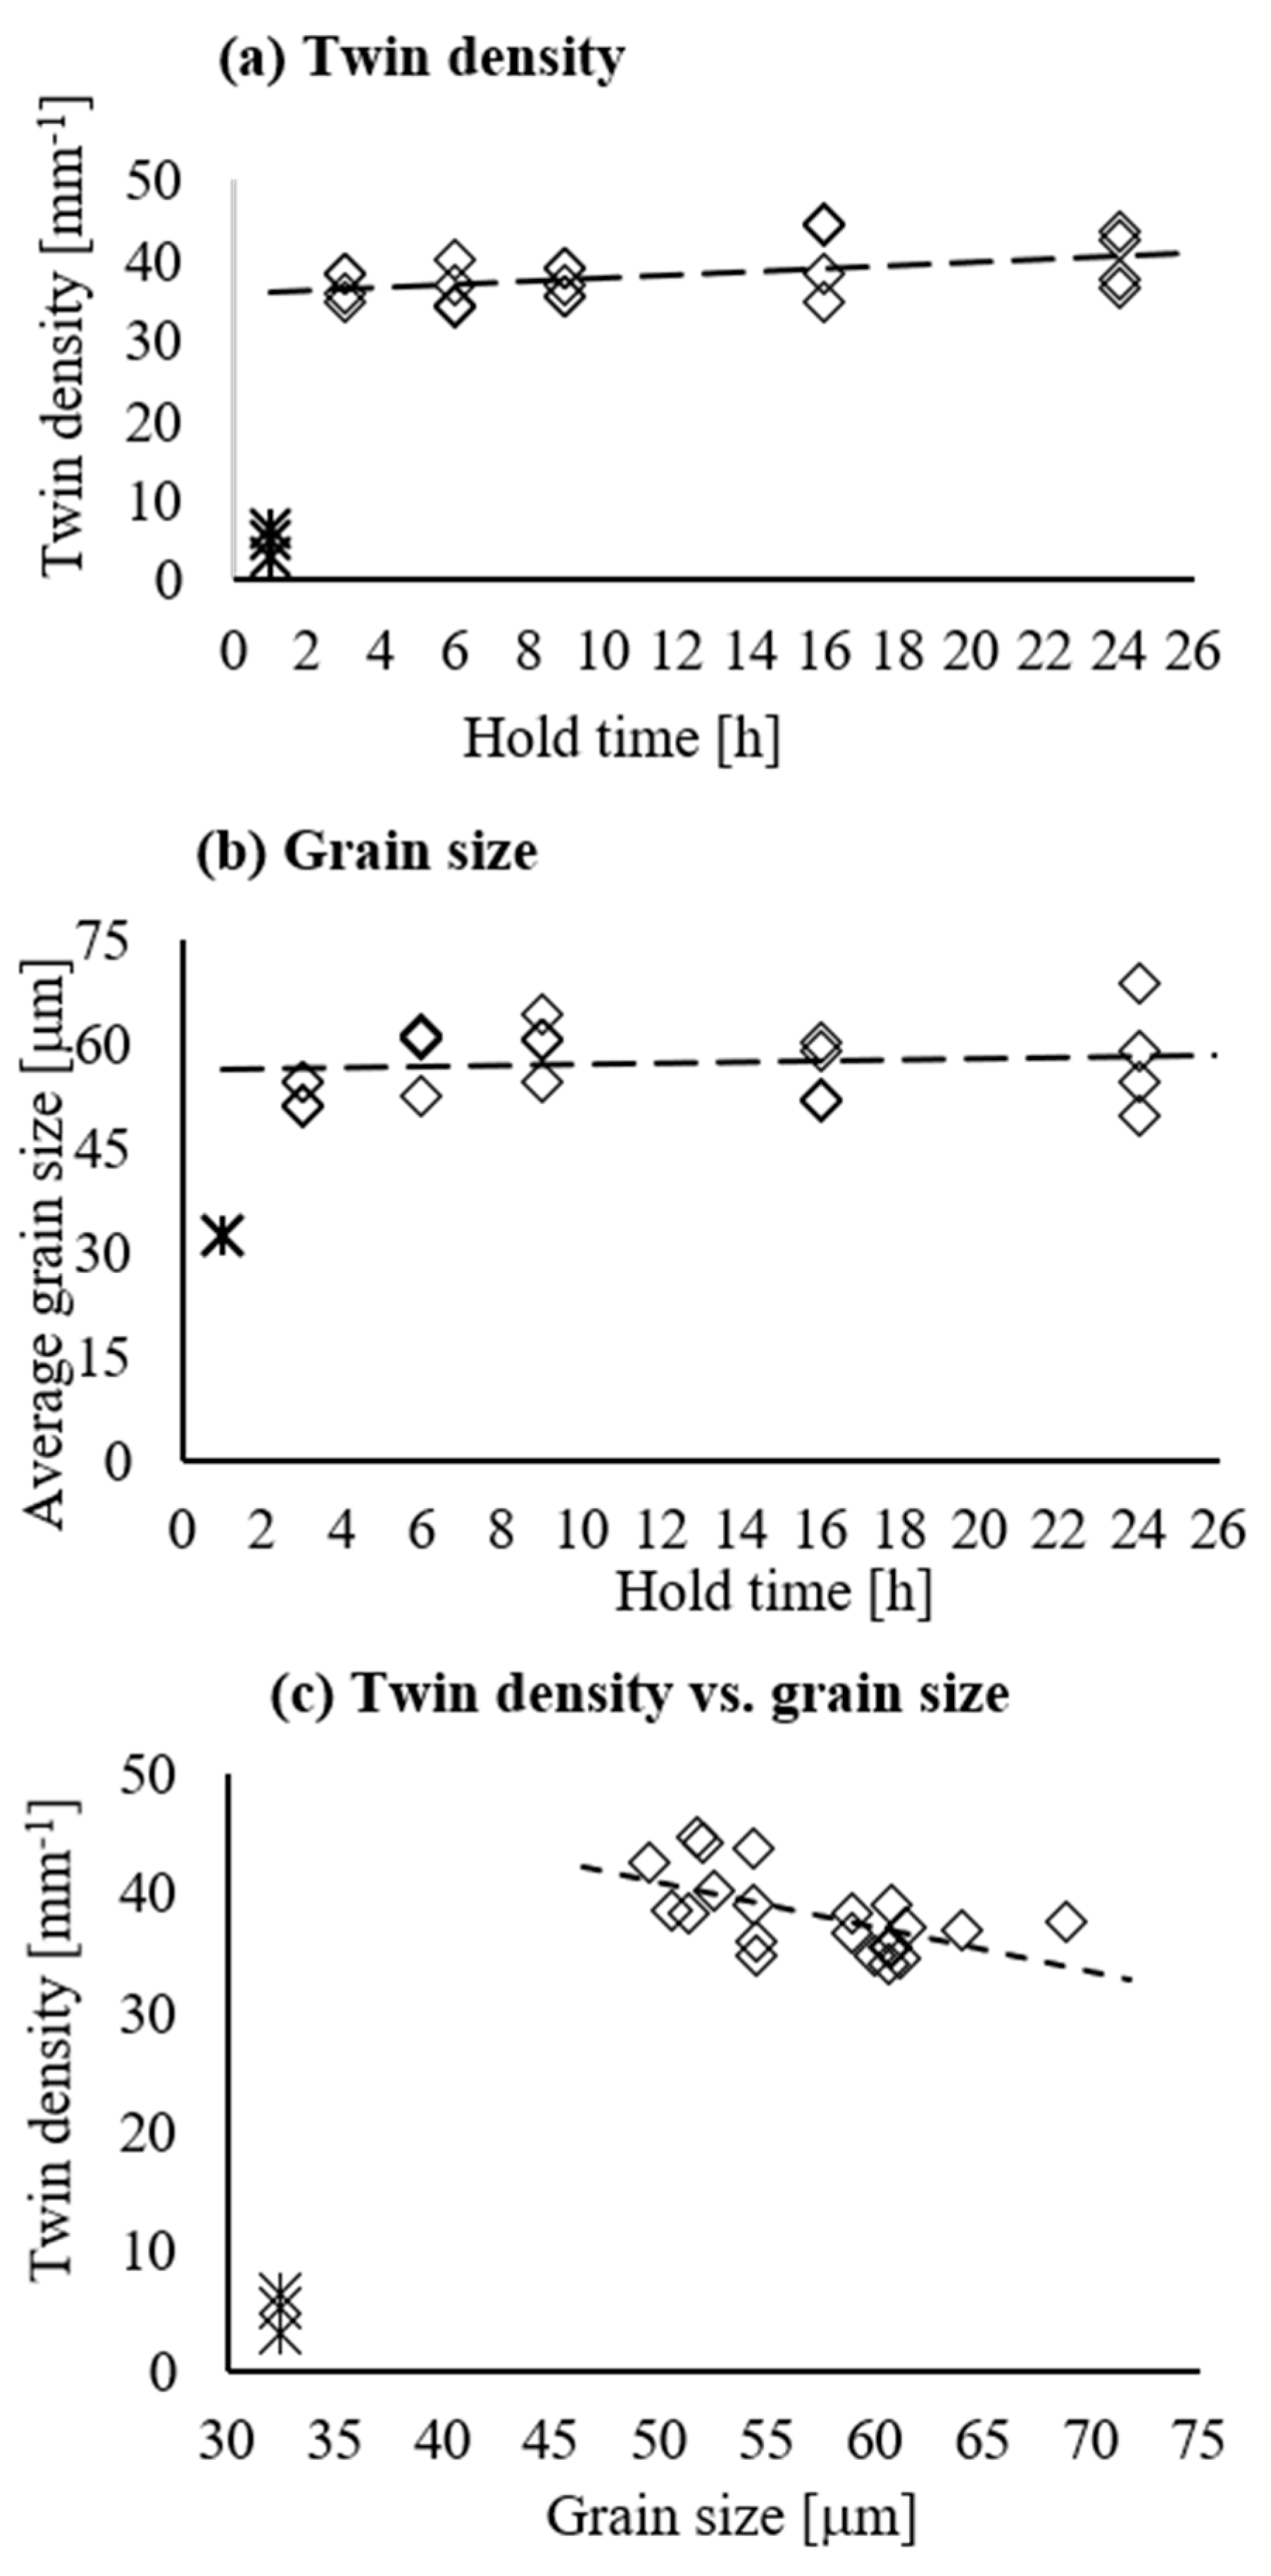
Annealing Twins in STA Samples

The samples that were solid solution heat treated for 3–24 h at 1100 °C appear to have similar grain structures as shown in Figure 2c–f. The images in general illustrate changes in the microstructure compared to the as-printed state. Consequently, the grains were grown substantially but accompanied by the evolution of large quantities of annealing twins during ST. Further study of the annealing twins is thus important since they have positive or negative impacts on the material properties. Annealing twins in the fcc materials can be described as a 60-degree rotation about a <111> crystal axis of the parent grain, with a tolerance angle of 8.66°, as proposed by Brandon’s criterion for twin boundaries [21]. Quantification of the annealing twin density (NL) can be calculated according to Equation (1):
N L = L t b · 2 A · π
where Ltb is the total twin boundary length in each section of area A. The image quality (IQ) of the EBSD maps for two of the STA samples that exhibit grain boundaries and twin boundaries is shown in Figure 4. The twin boundaries are shown in red lines, whereas the black lines are for grain boundaries. The average grain size estimation is based on the histogram analysis data used by TSI/OIM software in the EBSD system. The average grain size, diameter (D), can be computed using Equation (2) [22]:
D = i A i · D i i A i
where Di is the average diameter of the ith grain from a certain section of the image with an area Ai. The calculated annealing twin densities as a function of the hold time for all the samples that were solid solution heat treated at 1100 °C are presented in Figure 5. As shown here, only a few twins formed after one hour of ST heating (STA1). These twins formed near/inside bigger grains, which evolved during the merging of the smaller grains with the bigger ones. However, the quantity of the annealing twins formed tremendously increased during the 3 h (STA3) of solid solution heat treatment (Figure 4b and Figure 5b).
Figure 5a depicts the sharp rise of the annealing twin density from about 5 to 35 mm−1, corresponding to 1 h (STA1) and 3 h (STA3) solid solution heat treatments. The grain growth behavior is also so large from 1 to 3 h as shown in Figure 5b. This, however, does not show a dependency of the twin density on the hold time. The dramatic increment of the twin density is mainly dependent on the recrystallization behavior of the material. Much of the stresses are released through dislocation annihilation and dissolution of the primary phases during the 3 h of solutioning heat treatment. As pointed out in a previous report [10], the solid solution heat-treated L-PBF-Inconel 718 at 1100 °C is in a recovery stage and possess high stored energy due to unreleased stresses. Because of this, the grain structures of STA1 are identical to that of AP (see Figure 2). The twins formed in STA1 as shown in Figure 4a are only near or inside bigger grains. It seems that the merging of the nearby smaller grains with the existing bigger grains is believed to be the onset sites for the twining in STA1. After 3 h of annealing, however, much of the stresses are released and lead to a recrystallized microstructure, grain growth, and twin formation. It means that a 1 h (STA1) heat treatment is not long enough to promote the formation of annealing twins significantly. Nevertheless, the twin density nearly remains the same for the hold time of ST between 6 and 24 h (Figure 5a). This may indicate that solid solution heat treatment longer than 6 h has little to do with increasing the number of annealing twins. Consequently, most of the annealing twins were formed by the recrystallization process [23] during the 3 h of ST, which involved much of the relaxation of the stresses.
Metals/alloys fabricated with AM methods are known to have high residual stresses that contain a high amount of energy. Hence, the microstructure of the as-printed state is a favorable condition for recrystallization and formation of annealing twins during ST. As a driving force, the high energy gradient stored in the strained microstructure allows higher grain boundary (GB) migration, which promotes the formation of twins [23,24]. The driving force is thus considered one of the key factors that affects the twinning process during annealing. Further annealing longer than 3 h induced little increment in the number of twins as compared to that of STA3 as shown in Figure 5a. With a reduction of the stresses by heat treatment, the recrystallization rate is reduced, and the rate of twin formation becomes very slow too. This effect is illustrated in the plot of the twin density as a function of the grain size shown in Figure 5c. The data points shown in the plot are due to the 1 h ST (STA1). Here, the twin density is proportionally increasing with the grain size from 1 to 3 h during which the rate of recrystallization is high. However, once recrystallization is close to completion (after 3 h of ST), the rate of twin evolution reduces tremendously, which is in agreement with the literature [18,23,25]. For the samples ST for 3 to 24 h, the trend line shows a decreasing tendency of the twin density as the grain size increases. Two possible mechanisms are stated by Yuan and co-authors [25] to show the inverse correlation between twin density and average grain size. Smaller grains contain several twin boundaries that could be consumed by bigger grains during grain growth, which clearly reduces the number of twins. In addition, twin density can be reduced due to the migration of incoherent twin boundaries in a direction that reduces the twin length and total interfacial energy.
Like the twin density, the samples ST longer than 6 h did not show significant variations in the average grain sizes as it is revealed in Figure 5b. In other words, solid solution heat treatment of L-PBF-Inconel 718 at 1100 °C from about 6 to 24 h of hold time does not lead to significant grain coarsening. Of course, STA24 exhibits more grain coarsening than the rest of the samples as shown in the wider variations of the average grain diameters for different regions in the sample (Figure 5b), although the average size is nearly the same as that of the rest of the samples. It should also be noted that the twins were formed entirely during the solid solution heat treatment, and not during the aging process. Twins are less likely to form when aging since the temperature is not high enough to induce such structural changes in the L-PBF-Inconel 718. Hence, the quantity of twins in the ST sample generally remains the same after aging treatment (STA). Furthermore, the current study illustrates that at 1100 °C of ST and hold times longer than 6 h, the annealing twins maintain their thermal stability. So, in order to suppress the formation of annealing twins, the ST temperature should be set the furthest from 1100 °C or ST for a short duration (~1 h) at 1100 °C.

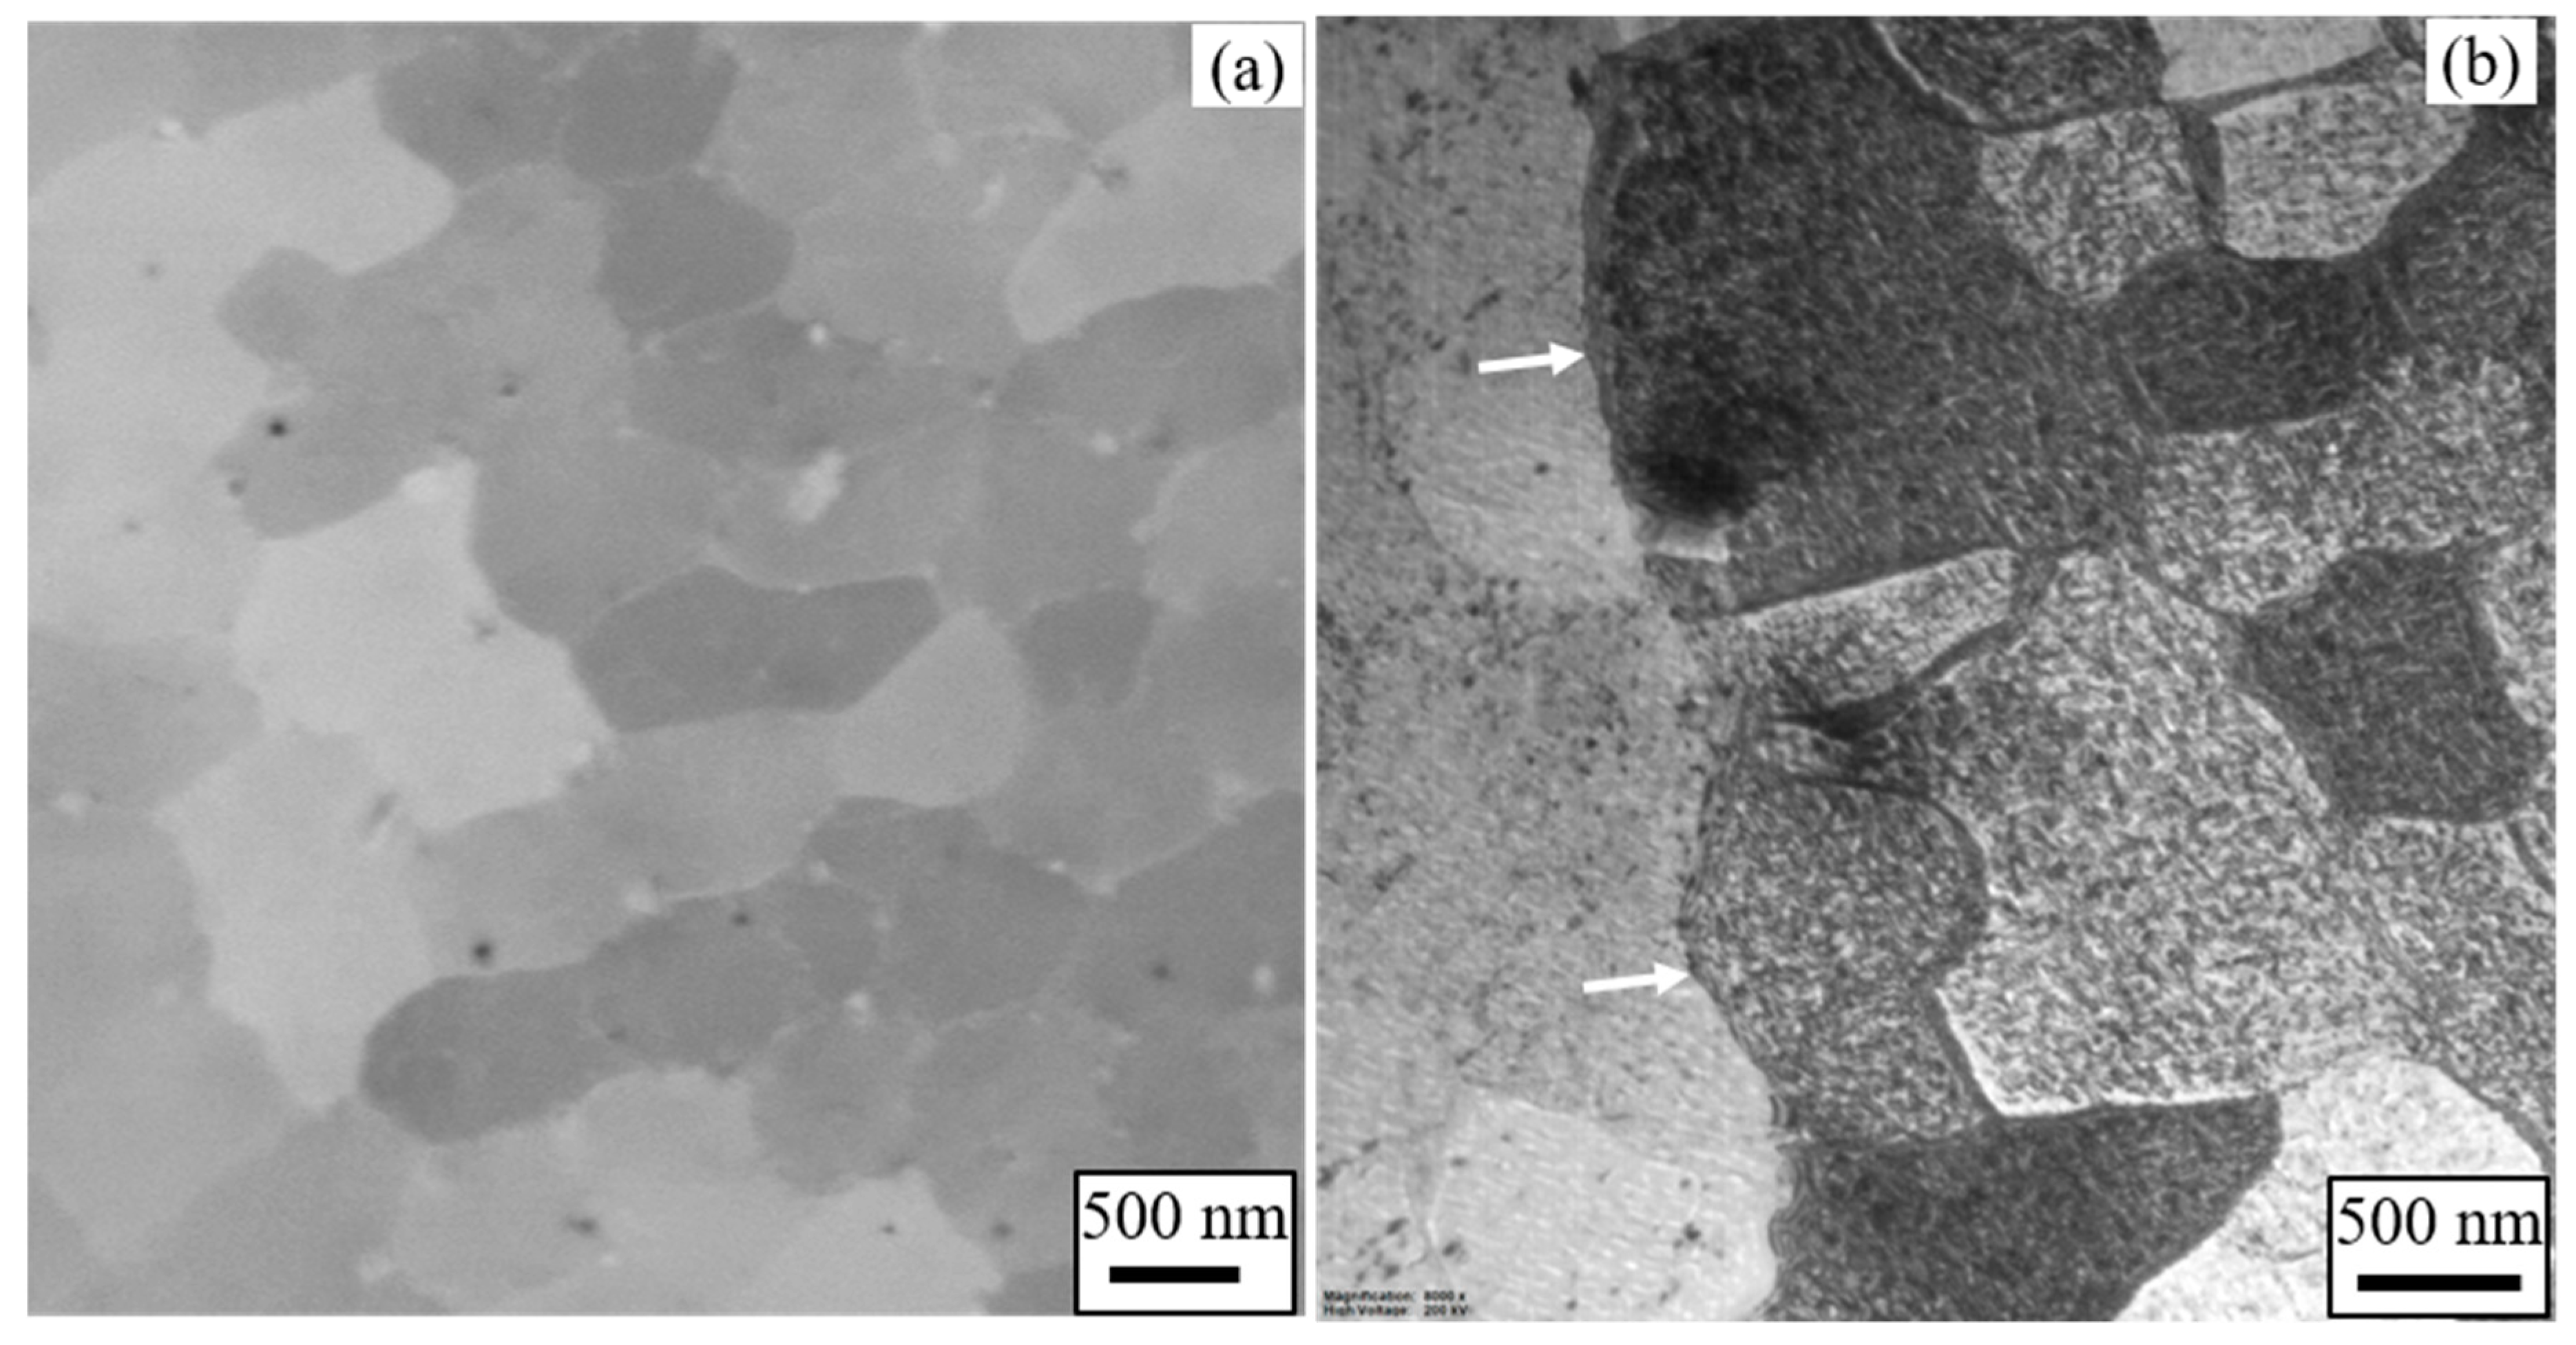
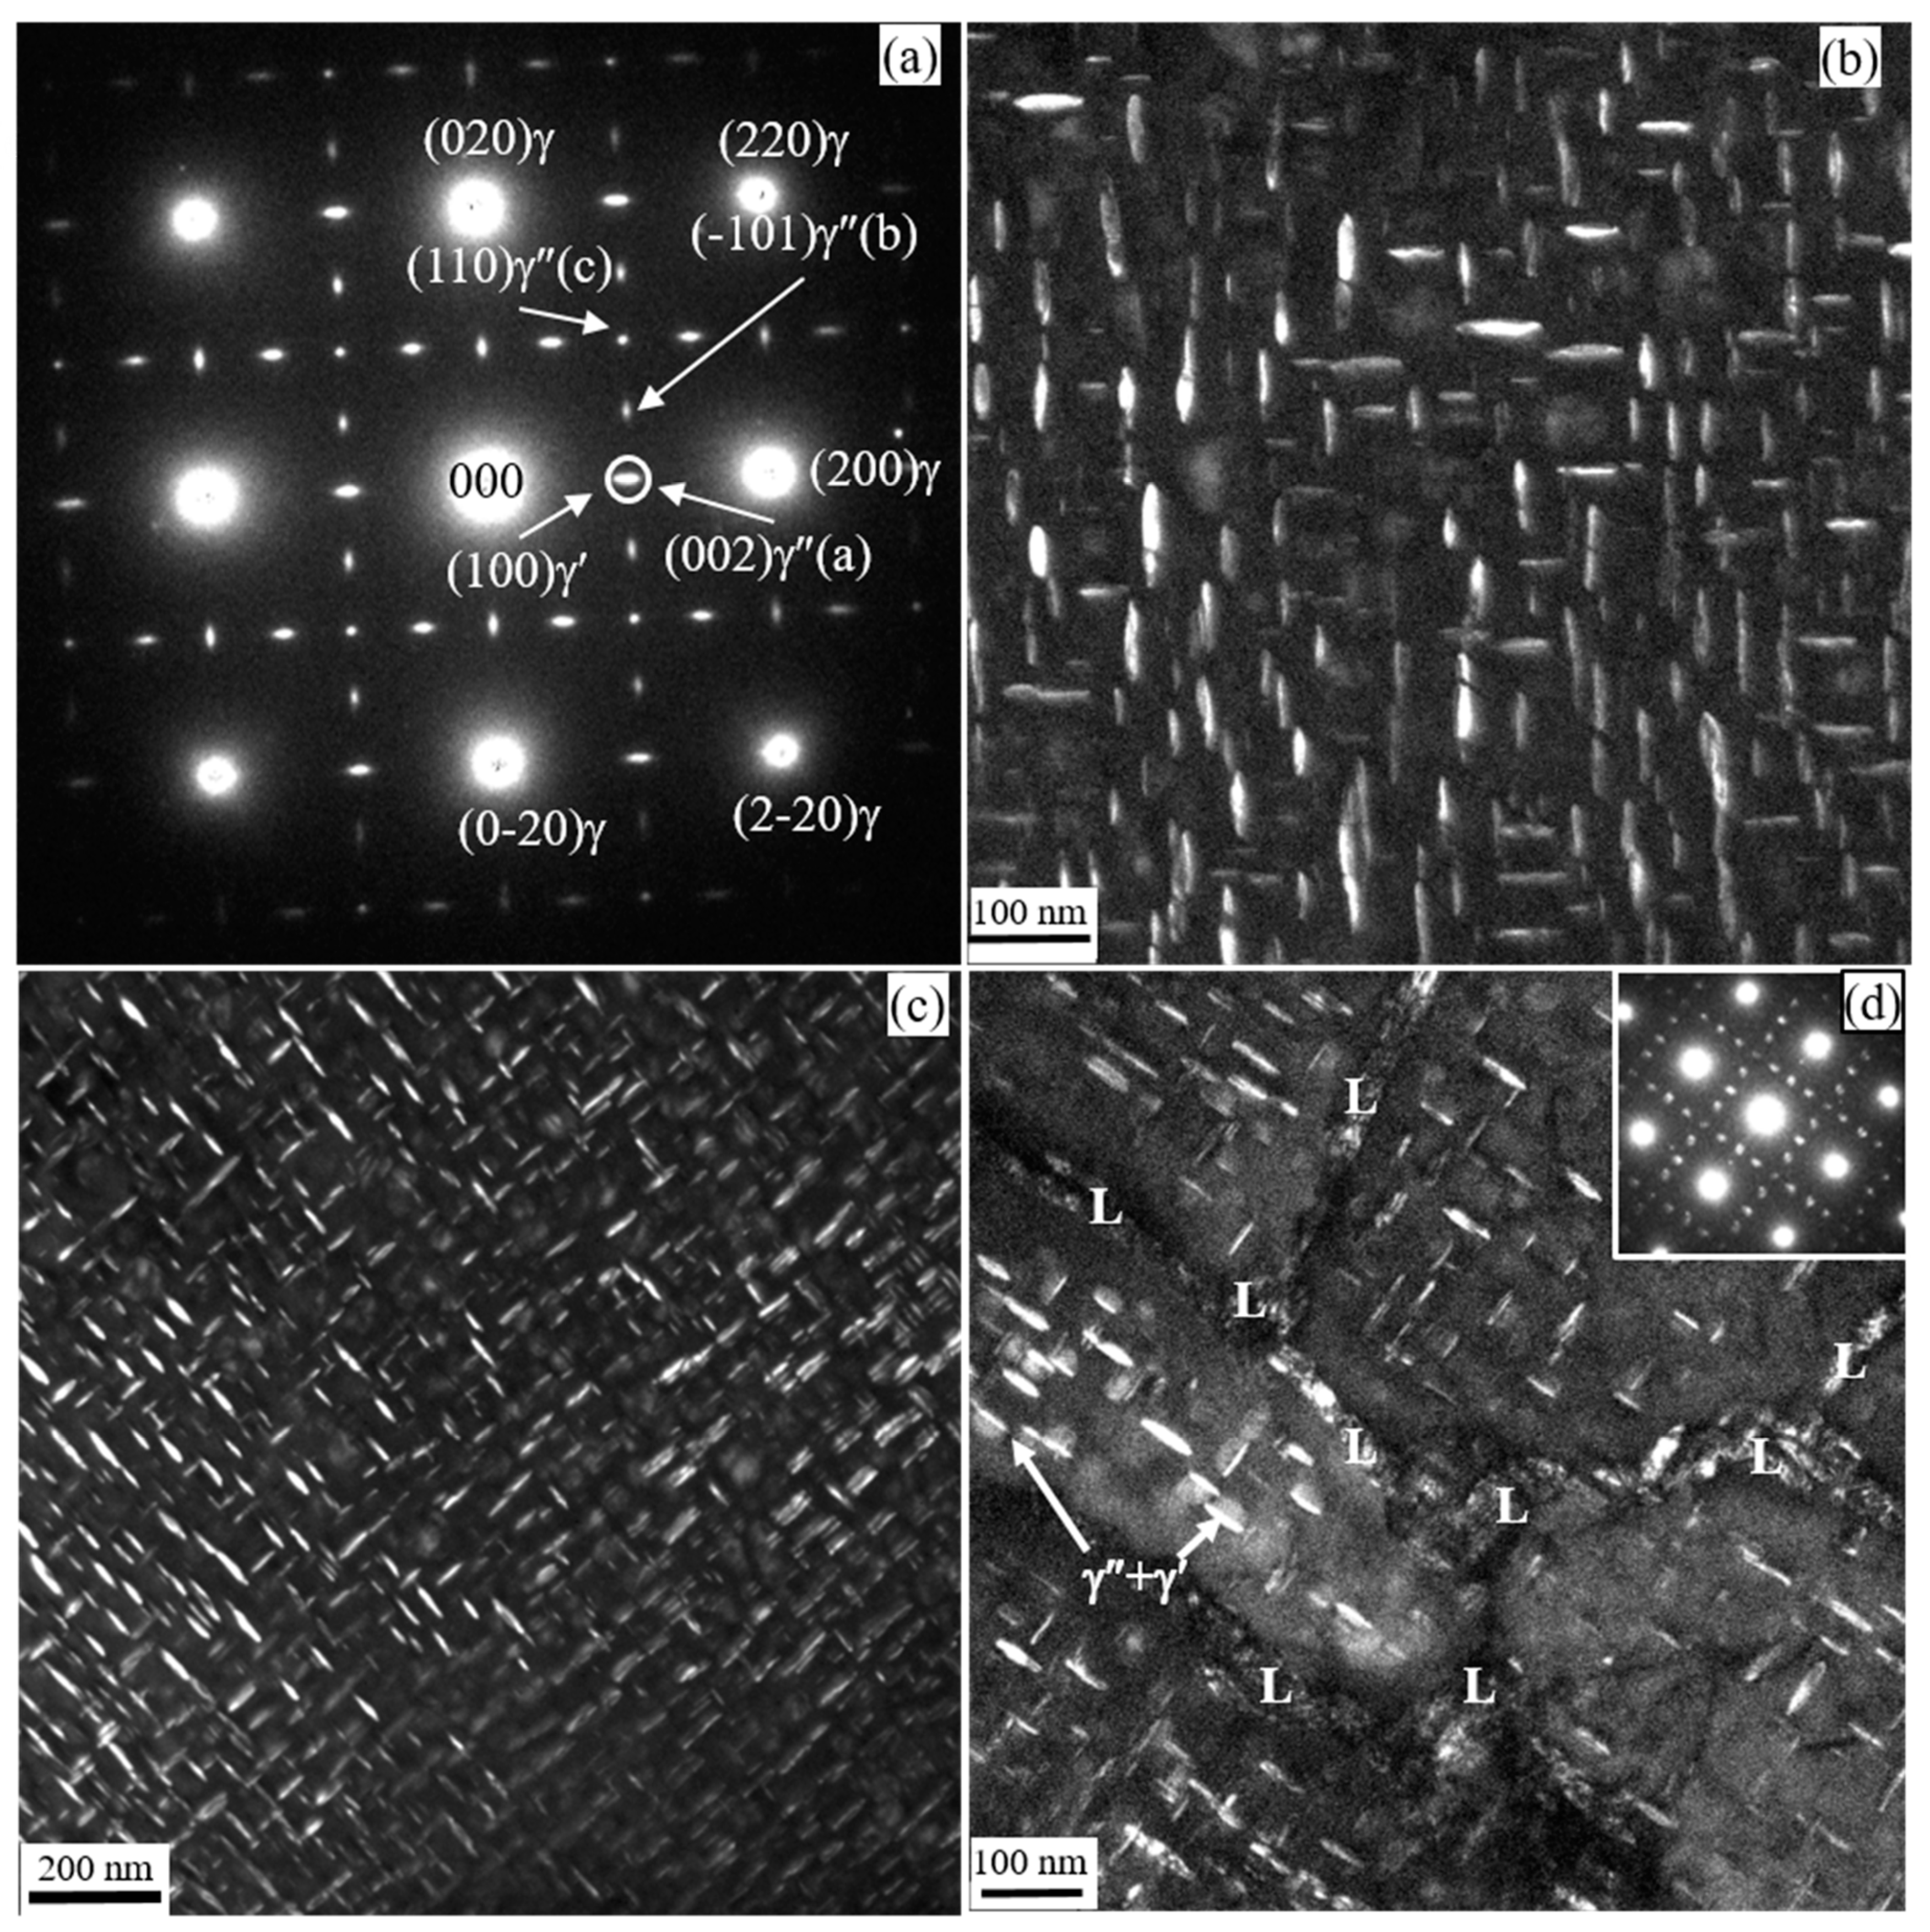
3.1.2. Effects of Aging

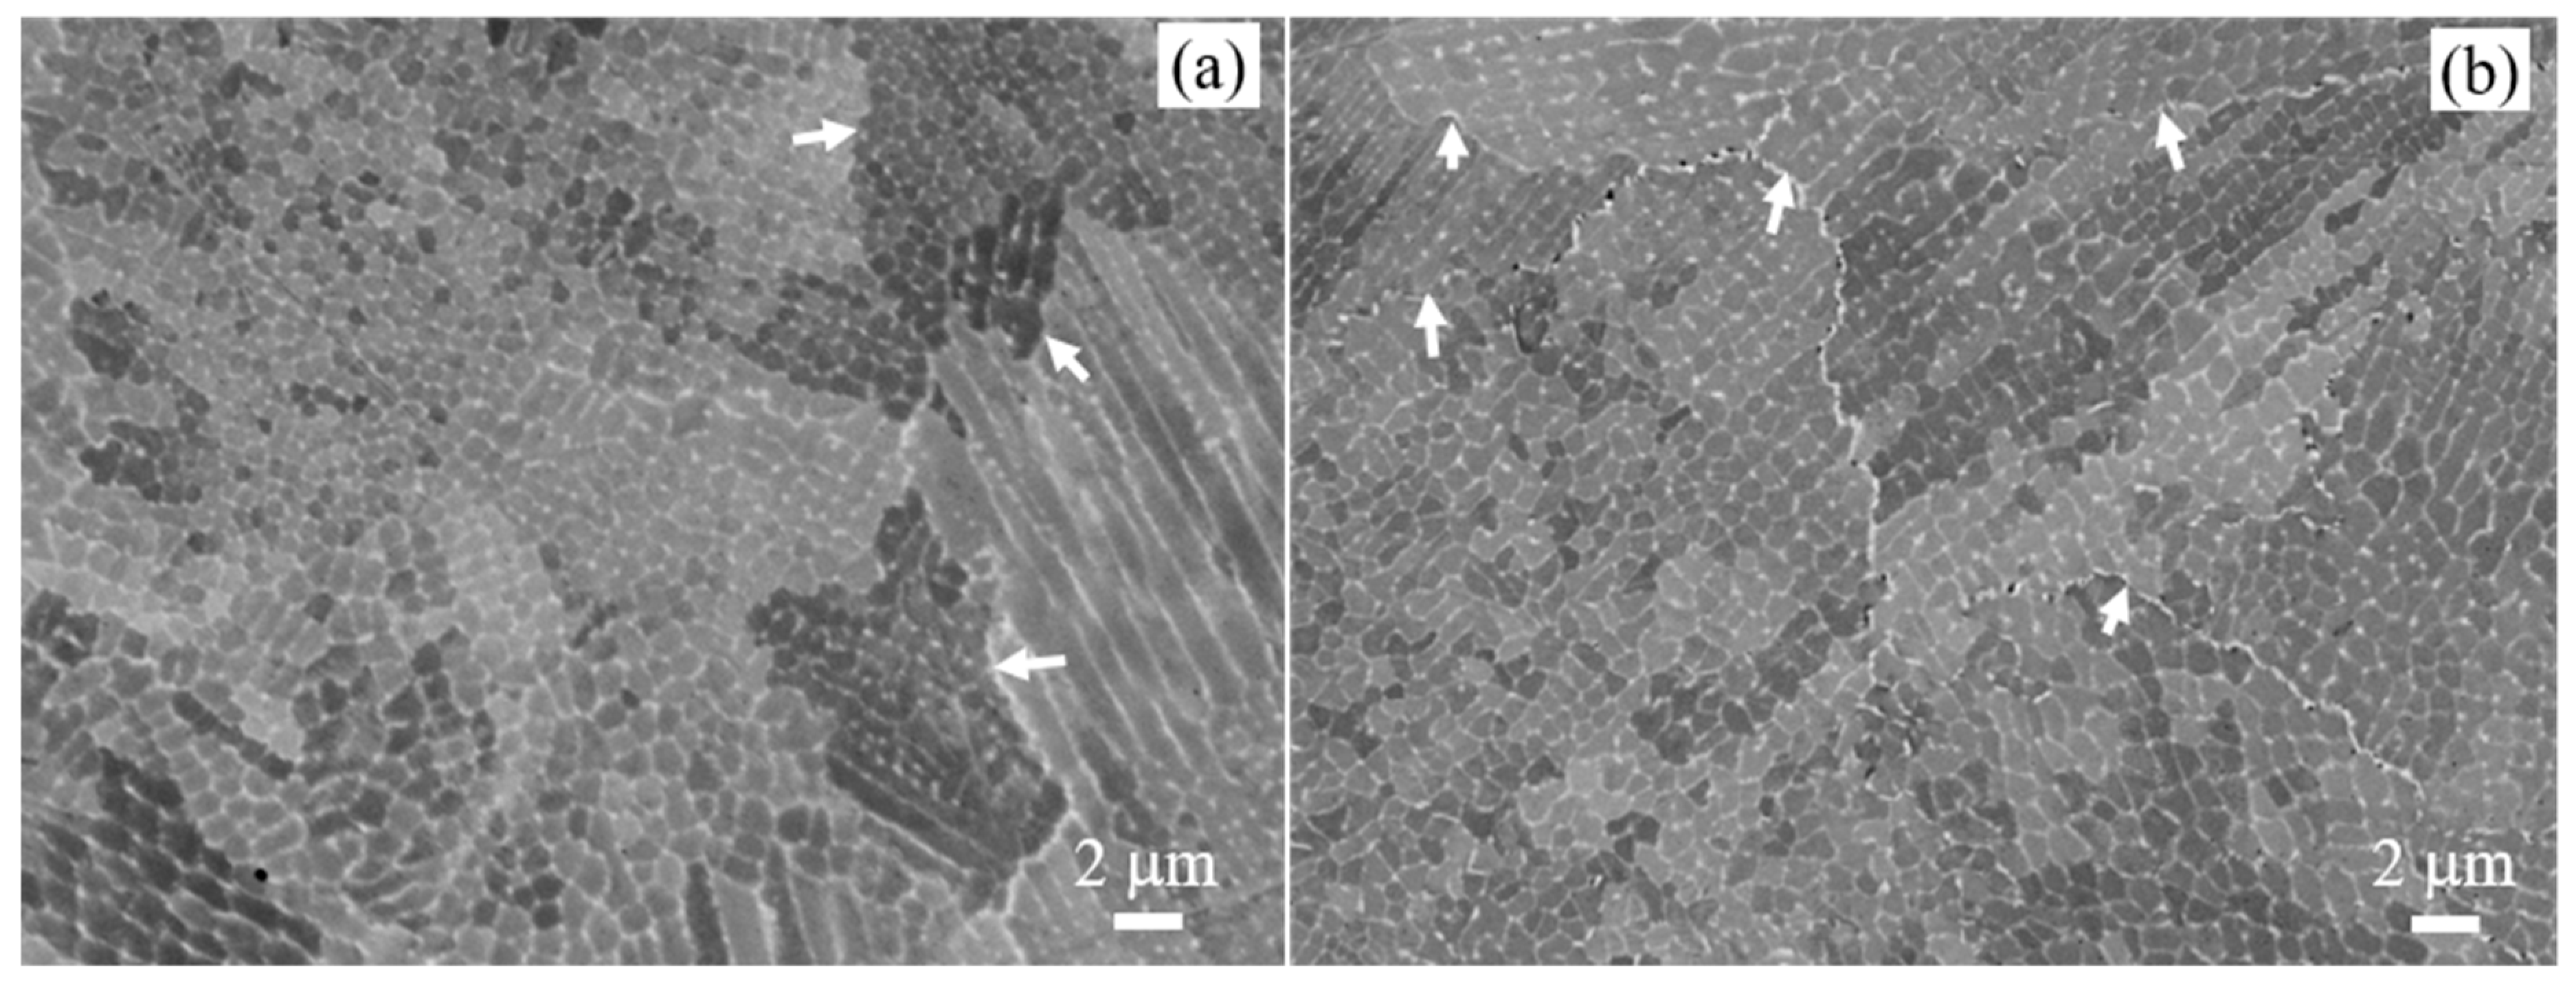
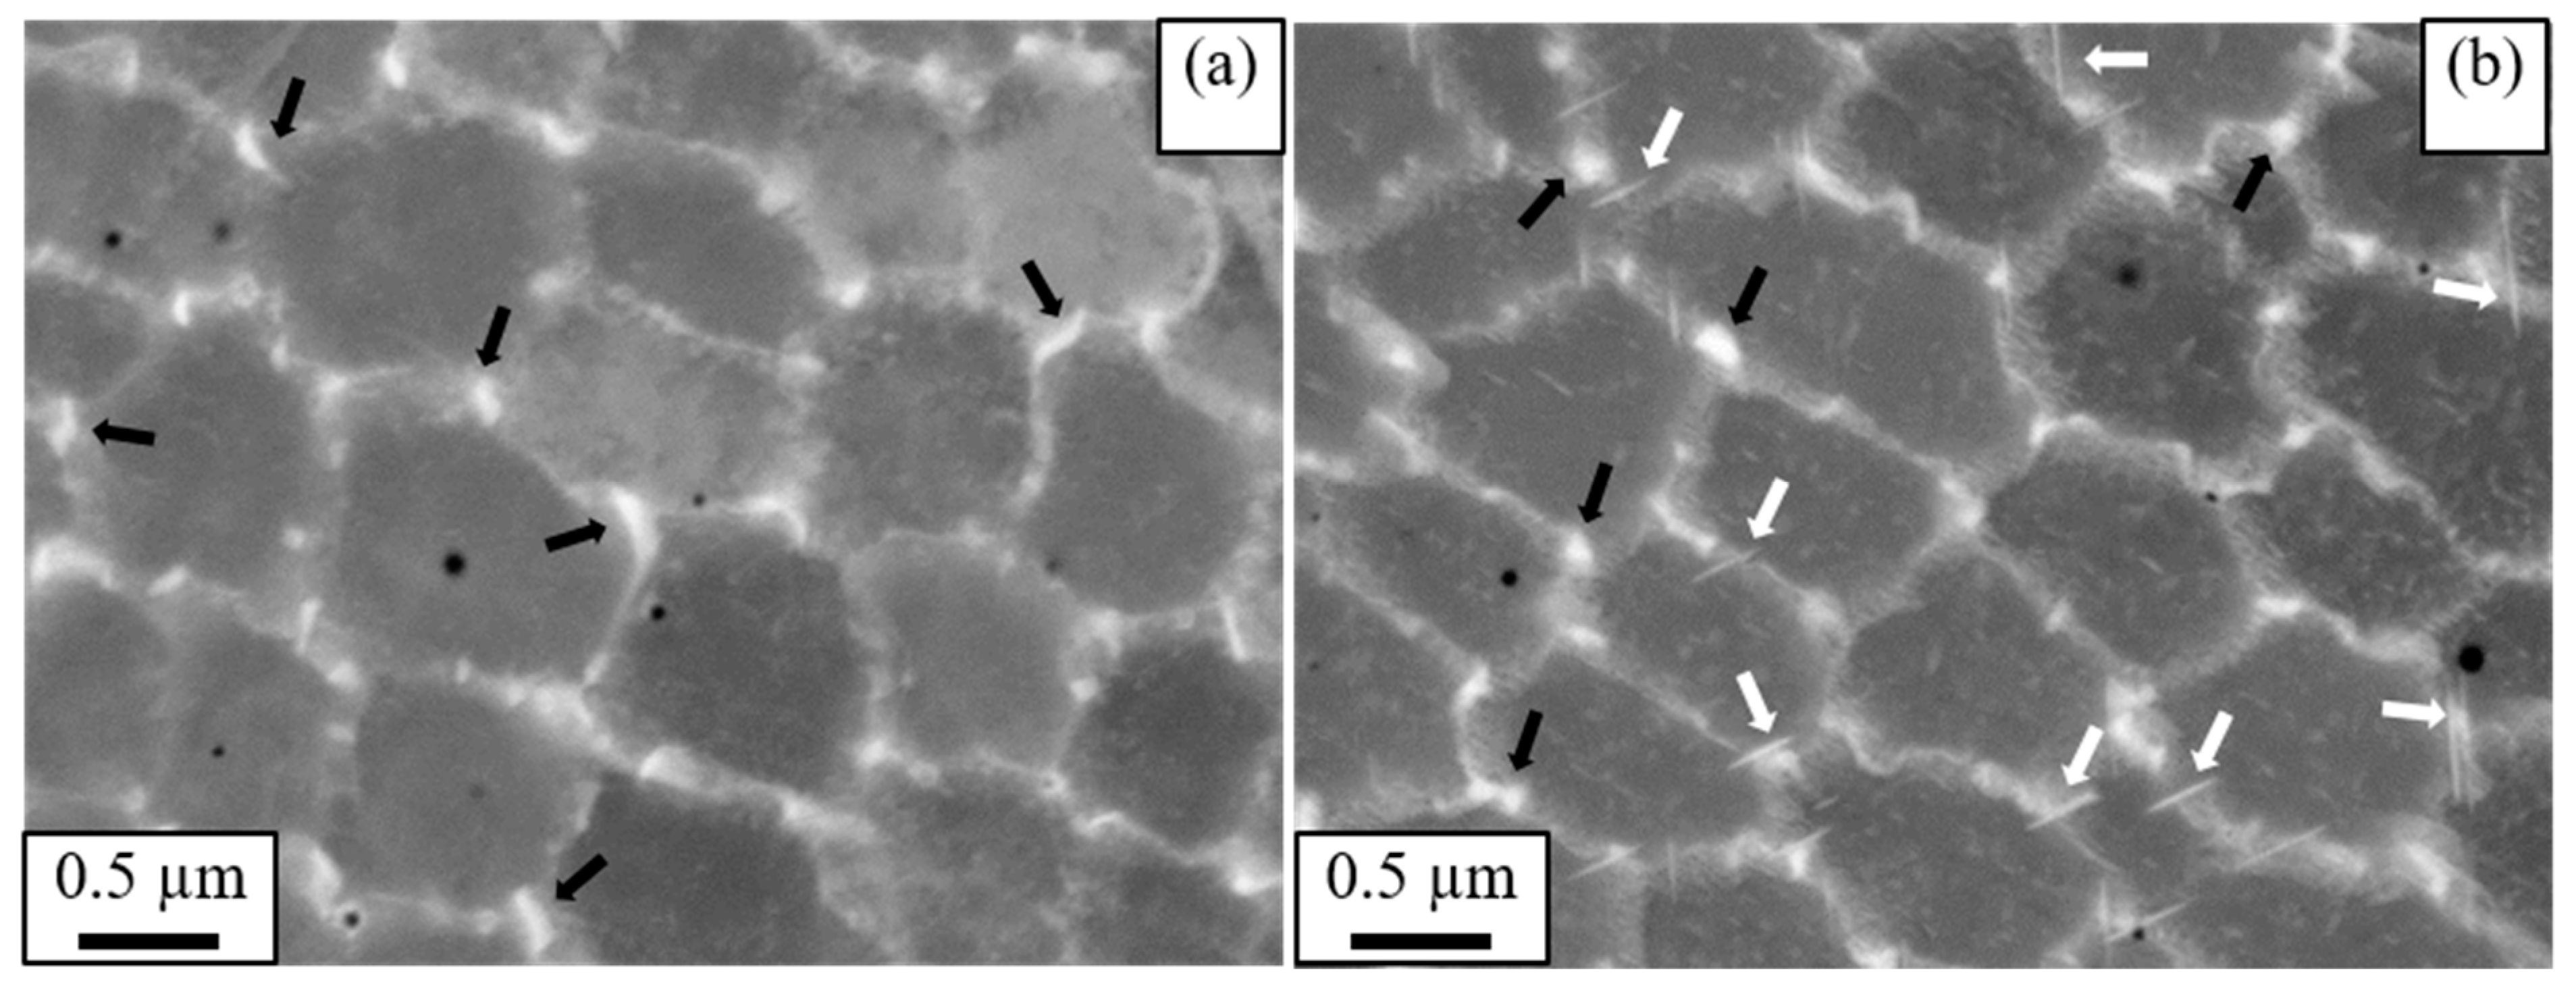
Solid Solution and Aging Heat Treatments (STA)

Following the solid solution heat treatments at 1100 °C, the samples were subjected to two-step aging (at 760 °C for 10 h and then at 650 °C for another 10 h). The grain structures of the ST and STA samples analyzed with SEM are quite similar since the thermal energy supplied at the aging temperature is not enough for promoting grain growth. However, new phases are precipitated during the aging heat treatment regime. These are γ″ (Ni3Nb) and γ′ Ni3(Nb, Ti, Al), which are mostly elliptical and spherical, respectively, in morphology. The temperature range for precipitation of γ″ and γ′ phases is 704–899 °C and 593–704 °C, respectively [7]. Similarly, nucleation of γ″ requires at least 4 wt. % of Nb, while γ′ can be formed with an Nb concentration below 4 wt. % [7].
Typical TEM images that reveal details of the microstructure of the STA samples are shown in Figure 6. The SAD pattern shown in Figure 6a was recorded with the matrix oriented in the <001> zone axis. The strong spots in the diffraction pattern are reflections from the austenite (γ) matrix. The superimposed weaker spots are super lattice reflections of the γ″ and γ′ phases. Three variants of γ″ precipitate on the {100} planes from the superposition of the different patterns in the SAD. These variants are based on <100>γ″, <010>γ″, and <001>γ″ orientations. The dark field (DF) image of Figure 6b is from the {002}γ″ reflection in <100>γ″ and the {101}γ″ reflection in the <010>γ″ zone axis. Similarly, the DF images shown in Figure 6c,d were recorded from similar spots of the same SAD. The reflections from the γ′ precipitates (primitive cubic) overlapped with the γ (fcc) reflections. For the reasons explained in [5,26], only a few of the super lattice reflections are common to both γ″ and γ′ precipitates. In this case, the {100}γ′- and {002}γ″-type reflections in the <001>γ orientation are superimposed. The DF image obtained from the circled spot shown in Figure 6d belongs to the reflections from both precipitates. The two precipitates can then be distinguished from the DF image without ambiguity. The γ′ precipitates are spherical whereas the γ″ precipitates are mostly elliptical in morphology. The two phases sometimes fuse together and form a compact morphology. The white arrows in Figure 6d indicate examples of composite γ′ and γ″ precipitates. A large quantity of fused γ″ and γ′ is obtained after a longer aging time [27]. Detailed analysis is available in [12,26,28].
The distribution of the γ″ precipitate appears homogeneous and in a large quantity for the STA samples as shown in Figure 6b,c. On the other hand, the hardening precipitates in the DA sample (Figure 6d) are rare in quantity and the subgrain boundary regions contain Laves and other defects. The subgrain boundaries of the DA sample are labeled with the letter ‘L’ in Figure 6d. Similarly, the microstructure of the DA and AP samples is compared in Figure 7. The subgrains of DA were retained and most of the components in the subgrain boundaries also remain undissolved.

Direct Aging (DA)

Aging temperature is generally not high enough to initiate recrystallization in L-PBF-Inconel 718 and its effects on grain growth are thus insignificant. The grain structure of the direct aged sample is qualitatively the same as that of the as-printed as shown in Figure 7. The sub grains and the segregated particles in the subgrain boundaries remain undissolved after aging. The white spots seen in both images are largely the Laves phase. There are, however, some slight differences in the microstructure between AP and DA based on the analysis of the high-magnification SEM images shown in Figure 8. The black arrows point to some of the bigger Laves particles located along the subgrain boundaries in both (a) for AP and (b) for DA. After aging, very fine and needle-like precipitates evolved from the segregated phases located along the subgrain and grain boundaries. The white arrows in Figure 8b indicate that some of these needle-like precipitates formed near/along the subgrain boundaries. The Laves phase, whose Nb concentration is high, appears as the nucleation site for the needle-like delta (δ) precipitates. The δ phase is an orthorhombic structure with the same formulation (Ni3Nb) as that of the γ″ phase. The precipitation of the δ-phase could start at relatively lower temperatures (700–900 °C) [7], but the optimum precipitation temperature is somewhere between 870 and 1010 °C [7,12]. Slama et. al. [8] also observed similar growth of the δ precipitates even at lower temperature (550 °C), but after a very long hold time (50 h). Nucleation of the δ phase requires 6–8 wt. % Nb [7], and it is therefore reasonable to observe δ precipitates in the subgrain boundaries than inside subgrains. The formation of δ can potentially reduce ductility and toughness due to its embrittlement nature [7] besides depleting Nb [8,29] that is otherwise consumed for precipitation of strengthening phases. Furthermore, the formation of δ particles weakens the creep strength of Inconel 718 in the elevated temperature test [30].
To assess the distribution of Nb in different regions of the samples, numerous EDS data were recorded, and average values were calculated. The result shows that the local concentration of Nb is different for the AP and DA samples. The average concentration of Nb along the subgrain boundaries is more than 7 wt. % for both AP and DA but showed different concentrations inside their subgrains. Nb inside the subgrains of AP and DA is 2.61 and 2.96 wt. %, respectively. The level of Nb in DA is larger than in the AP by about 0.35 wt. %. Nb tends to diffuse from the high-concentration region in the subgrain boundaries to the core of the subgrain region during aging. This makes the non-boundary regions of DA richer in Nb (where γ″ and γ′ precipitated) than that of the AP. On the other hand, the average concentrations of Nb in the non-intergranular region of the ST and STA samples are larger than AP or DA samples. For example, the average Nb level in the non-intergranular region of ST16 is 3.84 wt. %, which is about 1 wt. % larger than that of AP. The increment of the Nb level inside the grains after the ST is due to the dissolution (partially or completely) of the Laves phase from the subgrain boundaries. Obviously, the amount of Nb that is readily available for precipitation in ST16 is more than that of AP. Similarly, the concentration of Nb in the non-intergranular region of STA16 is 3.84 wt. % (more than by about 0.9 wt. % compared to that of DA). The composition difference in Nb between the STA and DA samples is clearly proportional to the corresponding quantities of the hardening precipitates formed. Evidently, the distribution difference visualized in the hardening precipitates shown in Figure 6b (STA16) and Figure 6d (DA) agrees well with the relative concentration differences in Nb.
Direct aging is not a preferred way of hardening L-PBF-Inconel 718 although it is beneficial economically as it bypasses the solid solution heat treatment stage because of the prevailing high stresses in the microstructure. The optimum mechanical property is thus realized when large quantities of hardening precipitates are formed and distributed evenly in the matrix. This can be achieved by performing solid solutioning heat treatments at an appropriate temperature and hold time before aging.

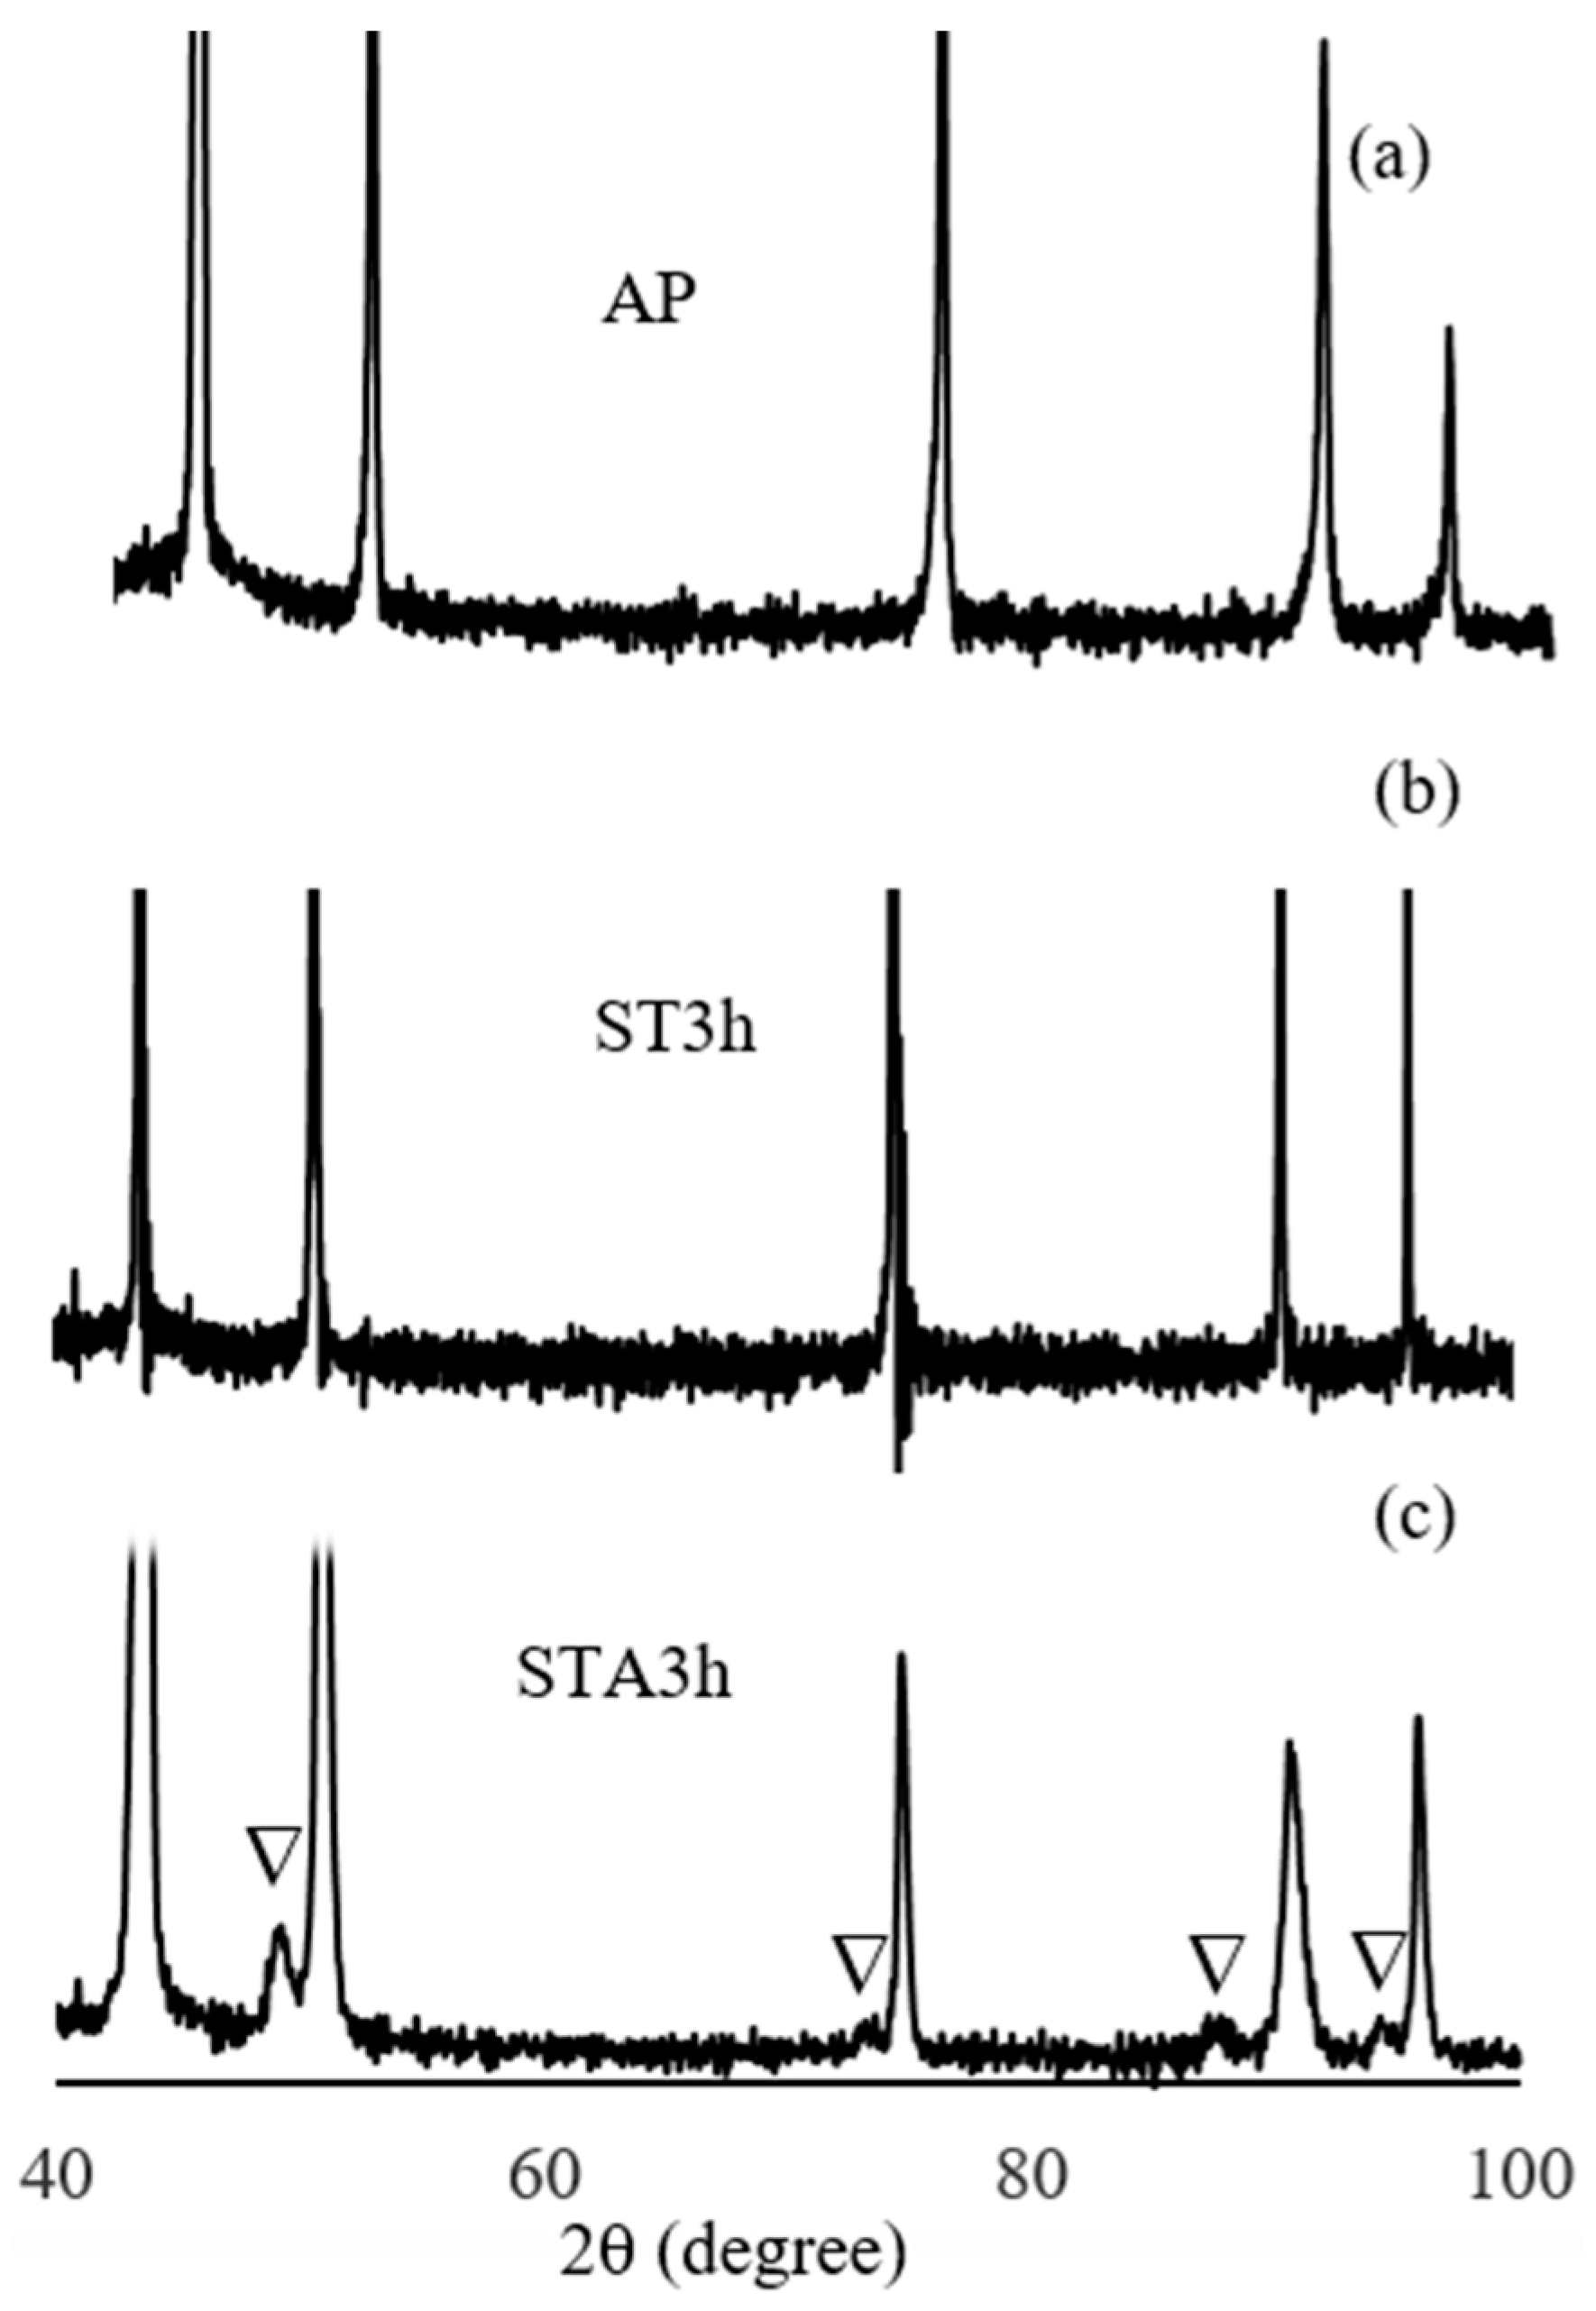
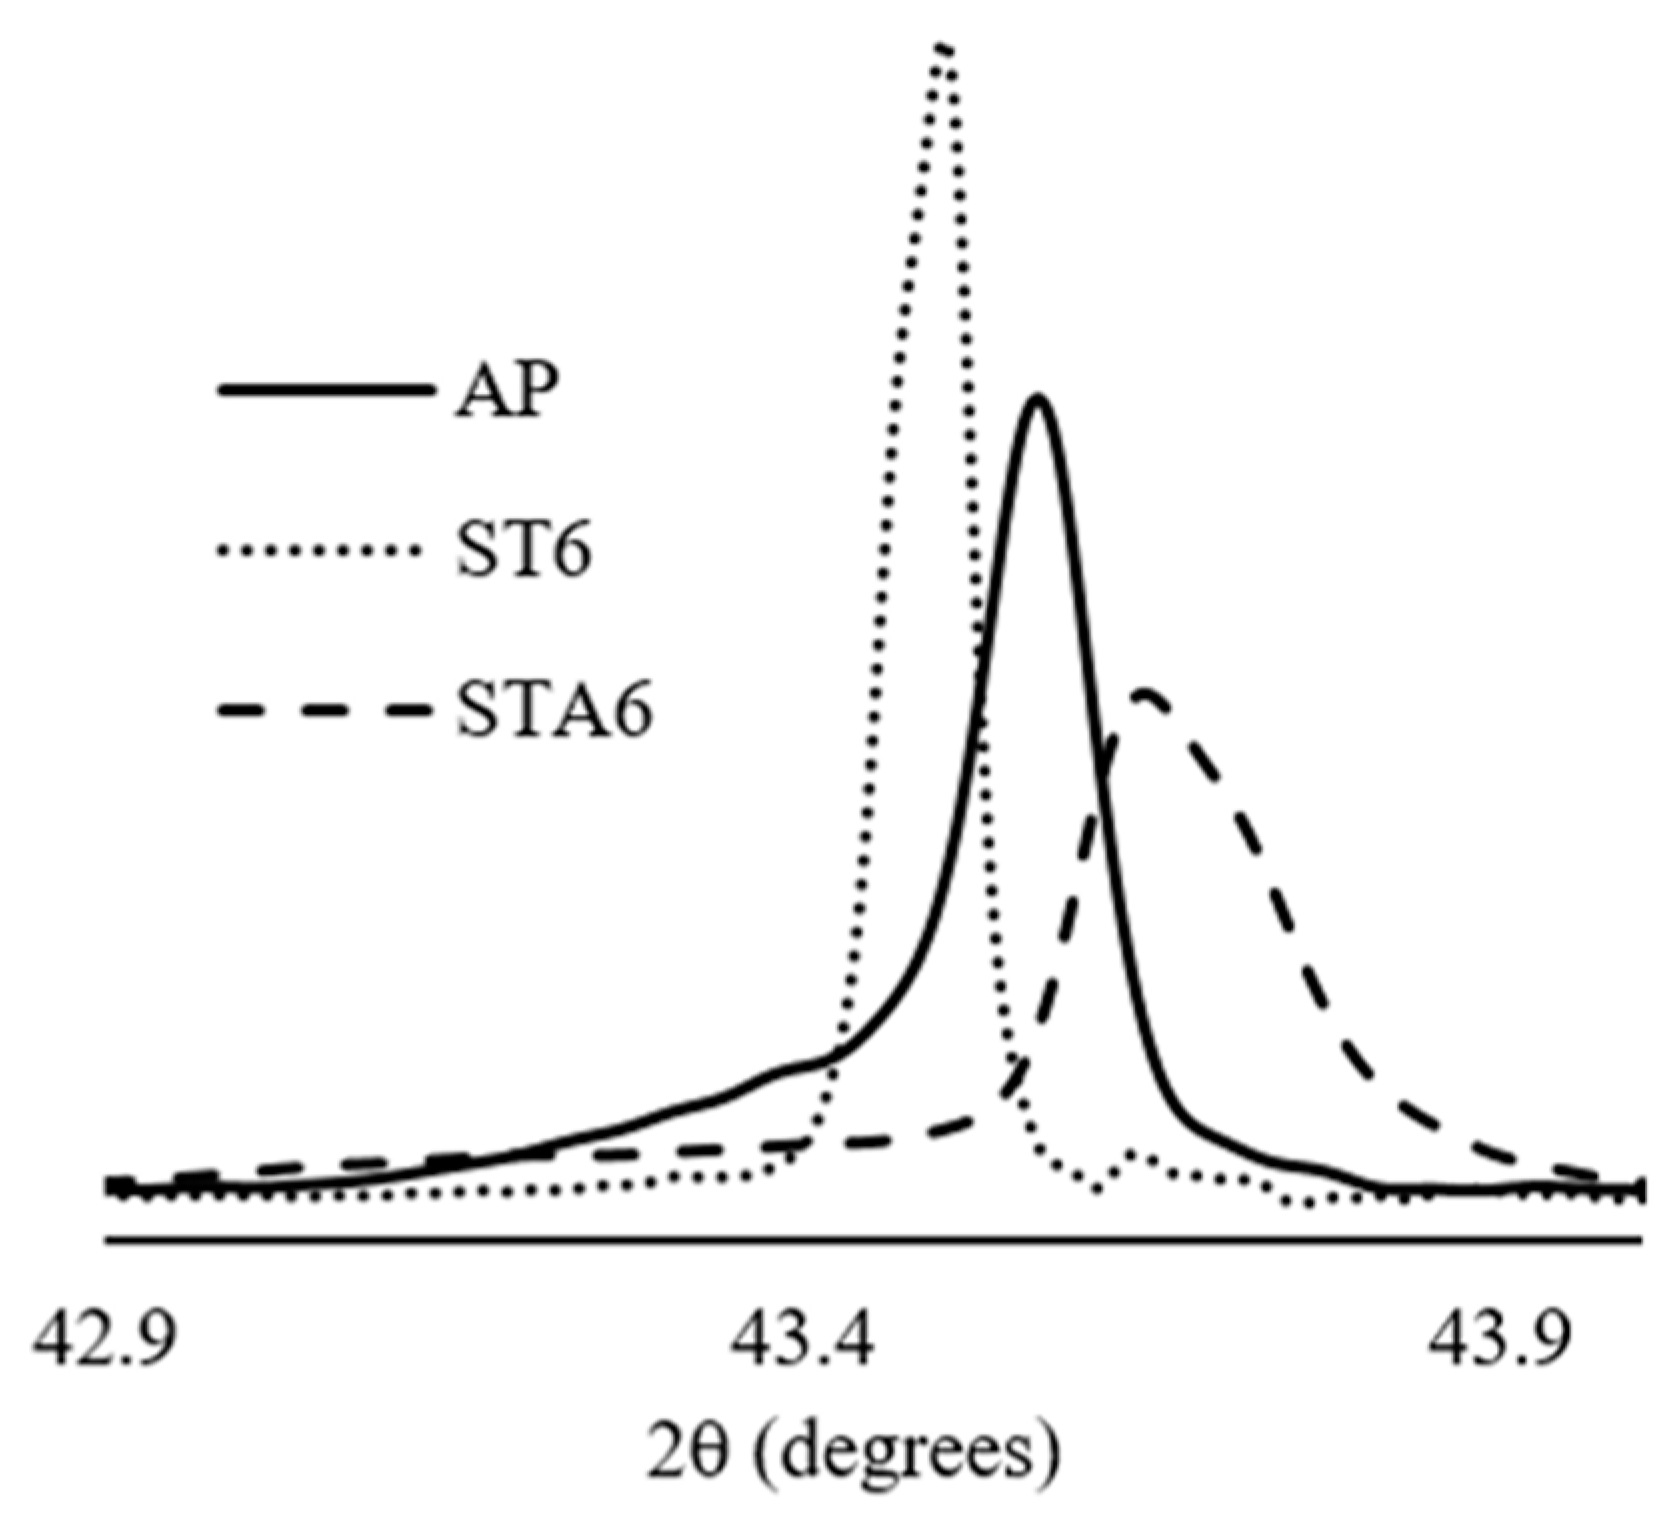
3.2. Phase Identification with X-ray Diffraction

The X-ray diffractograms for the AP, ST3, and STA3 samples are shown in Figure 9a–c, respectively. The strong peaks are indexed to the fcc structure, 111, 200, 220, 311, and 222, corresponding to the austenite (γ) phase. The primary phases in AP, such as Laves and carbides, are too small in the volume fraction compared to the austenite phase, so that the resulting peaks are too weak. The reflections from the γ″ appear on the lower angle side of the γ-fcc peaks of STA3. These are indicated with inverted triangles in Figure 9c, which are indexed to a bct structure. The Miller indices of these peaks are 004, 204, 224, and 116. The 112γ″ diffraction peak is, however, very close (overlapped) to the 111γ peak. The γ′ phase is smaller in size and in quantity compared to the γ″ phase and consequently their peaks are too weak. In addition, since γ′ is a primitive cubic structure, most of its peaks overlap with the strong fcc (γ) peaks. In general, the X-ray result agrees well with the TEM analysis, which unambiguously identified the γ″ and γ′ phases using a combination of diffraction patterns and dark filed images.
Additional information can be obtained by examining the position and width of the X-ray diffraction peaks. The hump/shoulder seen on the lower angle side of (111)γ of the AP peak, for example, could be due to Laves and/or carbide phases. The residual stresses in the lattice defects may also contribute to the hump. Apparently, these humps disappeared after the solid solution heat treatment as shown in Figure 10 (ST6 vs. AP). The peak of the solid solution heat-treated sample (ST6) became narrower compared to that of the AP, mainly due to relief of stresses following recrystallization. The shift of the STA6 peak to the high angle side relative to AP is also depicted in Figure 10. The shift is clearly due to the formation of the tiny strengthening precipitates (γ′ and γ″) that enhance the strain in the matrix. Furthermore, redistribution of the alloy composition due to dissolution of the segregated primary phases may also contribute to the shift of the peaks. In addition, the STA6 peak is broader than the AP as well as the ST6 peaks. Further broadening of the STA6 peak is believed to be due to the formation of the nano-sized precipitates (γ′ and γ″) after aging, which agrees with Scherrer’s equation, what shows the inverse relationship between X-ray peak broadening and crystal size.

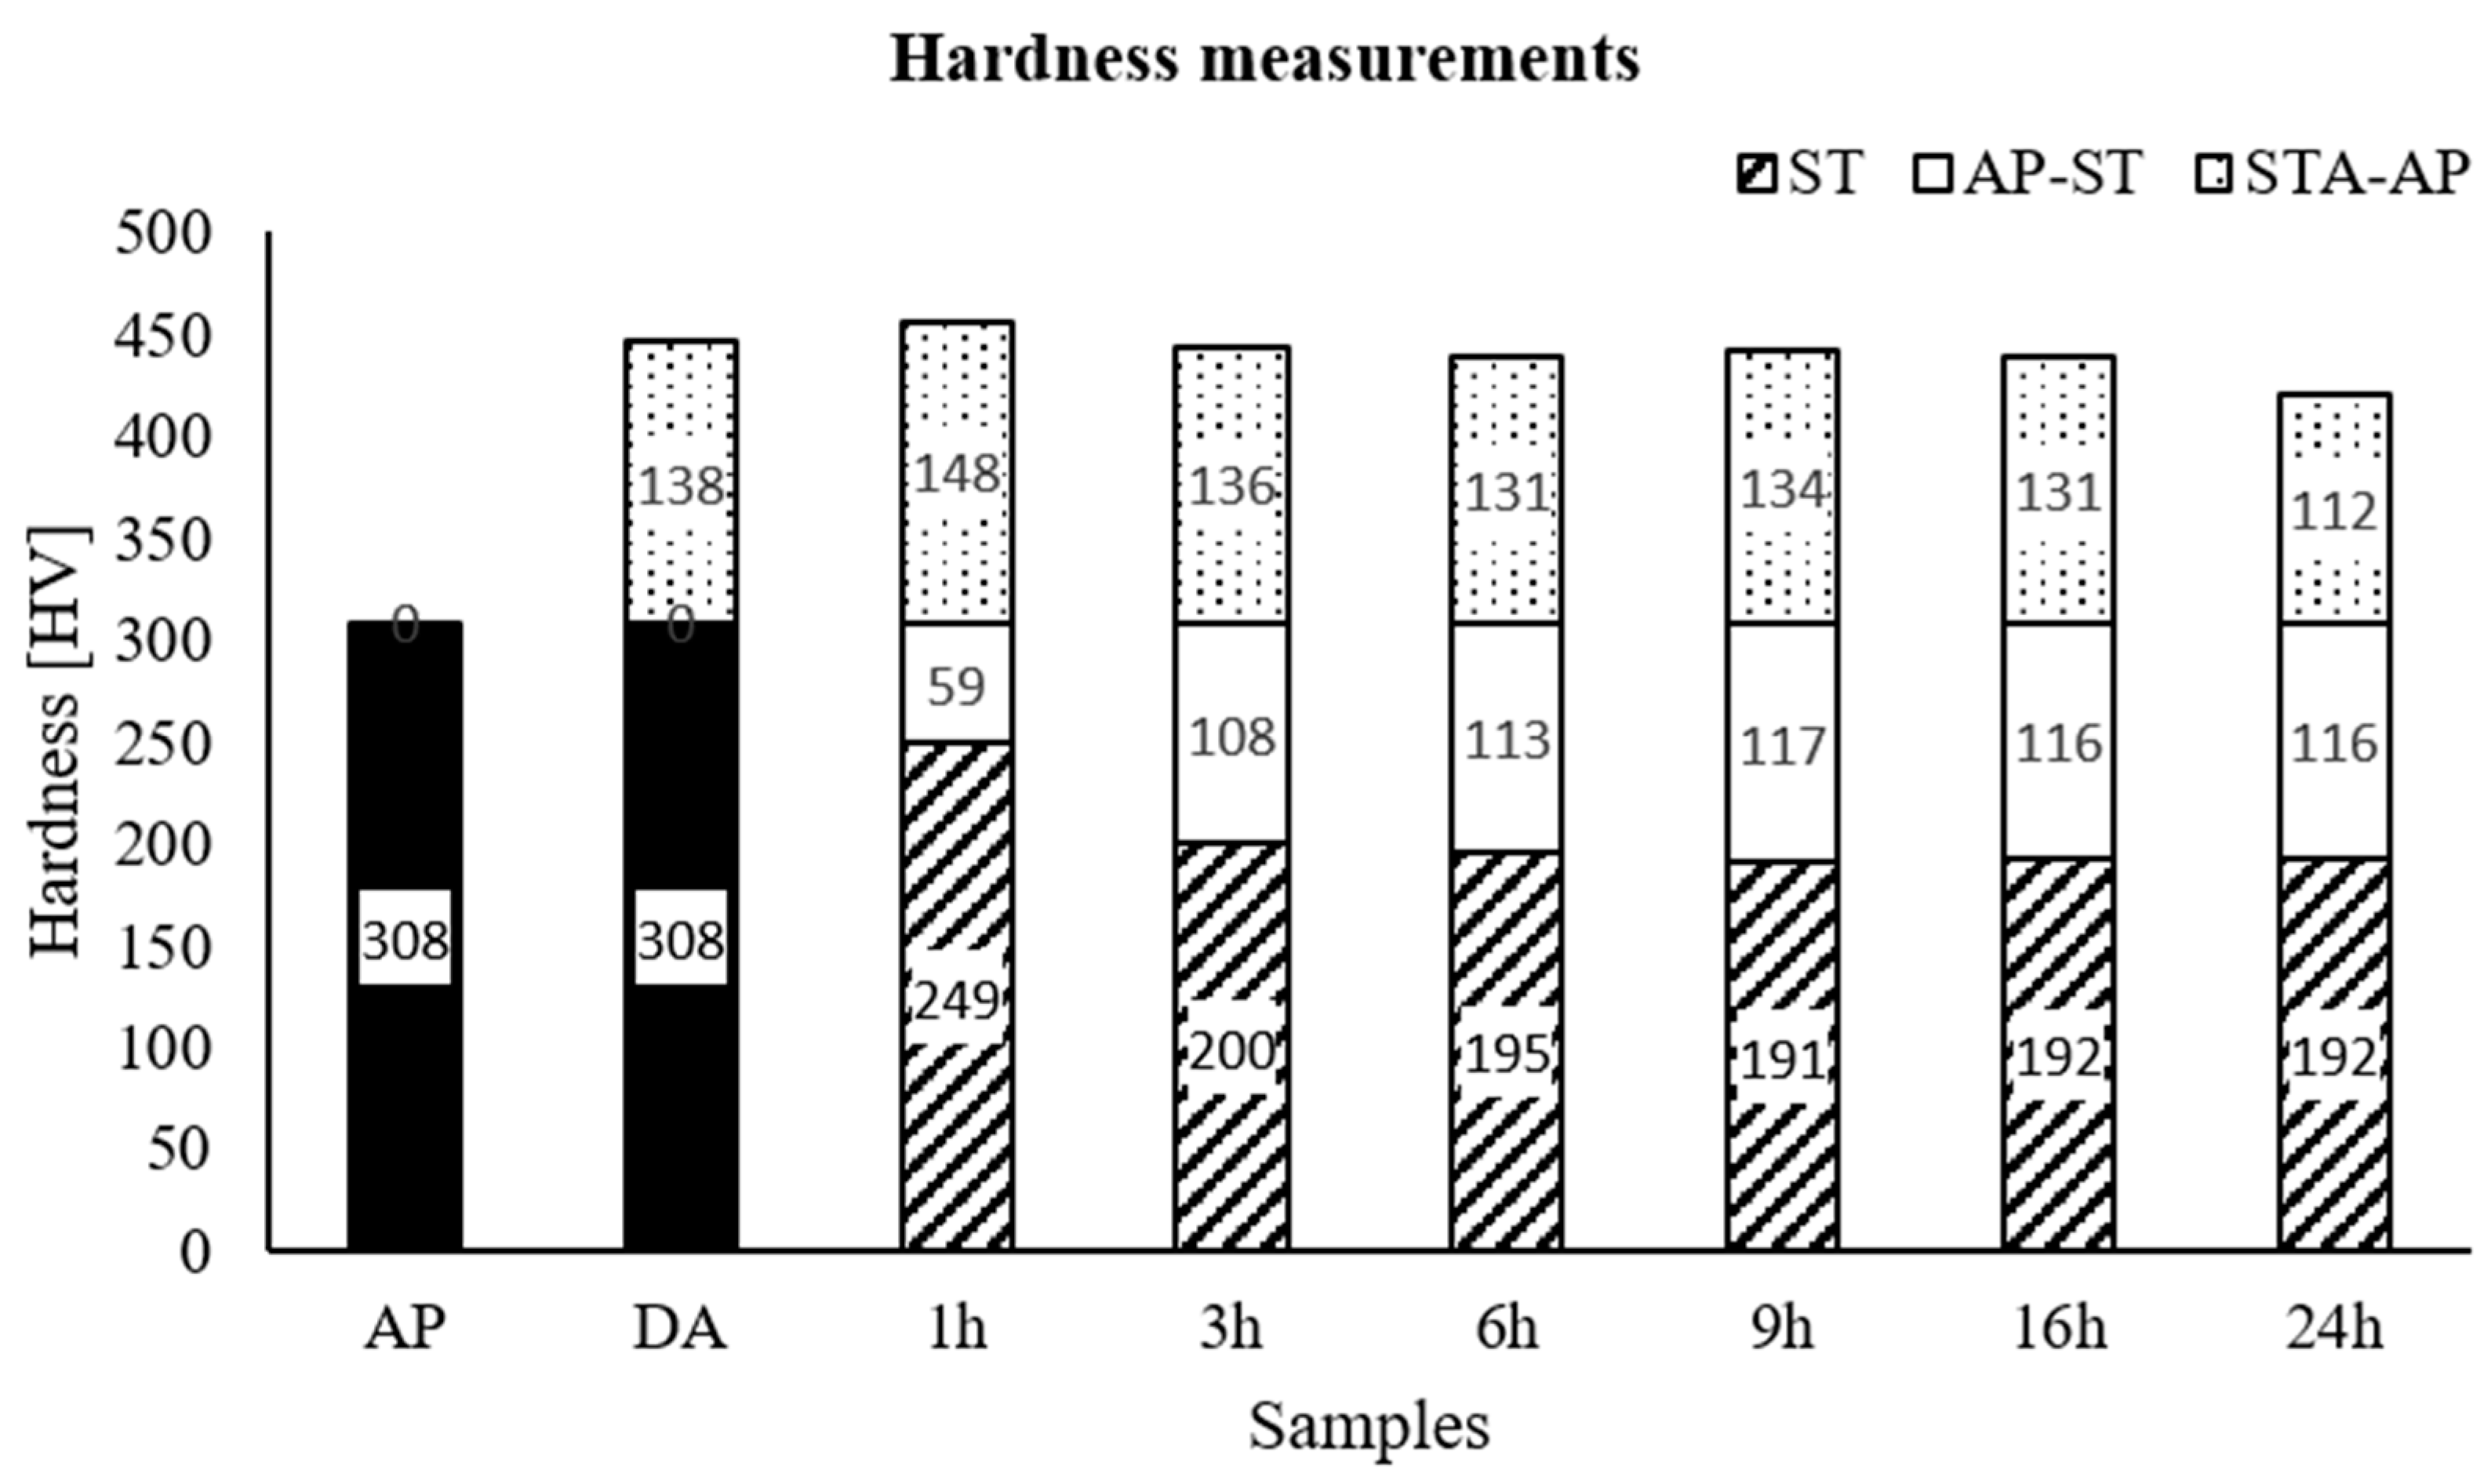
3.3. Vickers Hardness Measurement

The average hardness of both the ST and STA samples is given in Table 3. The data are also plotted and shown in Figure 11 to visualize the variation of the hardness as a function of the hold time. The hardness decreases with increasing hold time but tends to be the same for hold times longer than 6 h. The hardness of the sample solution heat treated for 3 h is 200 HV but is lower for the other samples with longer hold times. The variation in hardness is associated with changes in the microstructure following solid solution heat treatment. ST dissolves undesirable phases, such as Laves, releasing age-hardening constituents (Nb, Ti, and Al) into the matrix. In addition, ST eliminates crystal defects, primarily dislocation networks. As a result, the as-printed specimen (black bar) in Figure 11 is harder than all the specimens that were subjected to ST. Clearly, the variation in hardness is proportional to the changes in the microstructure as discussed elsewhere in the previous section. The hardness decreased with the increasing hold time of ST and became nearly the same from 6 to 24 h. Depending on the hold time, the hardness decreased between 19% to 37% relative to that of AP. This is clearly associated with the degree of recrystallization that involves rearrangement and annihilation of dislocations and other lattice defects.
The direct aged sample exhibits an increment in hardness by about 45% relative to the as-printed state. The gain in hardness is clearly due to the precipitation of hardening phases, γ″ and γ′. Since DA was not solution heat treated, Nb tends to diffuse slowly from the high-concentration region (Laves inside the subgrain boundaries) into the solid solution matrix during aging heat treatment. This would raise the level of Nb slightly inside subgrains, readily available for the precipitation of γ″ and γ′ precipitates.
To assess the contribution of age hardening, it is interesting to compare the increment in hardness (sum of the white and dotted bars in Figure 2) between the samples. After aging, a maximum increment in hardness was obtained for STA9, the sample that was subjected to 9 h of ST and aged. Comparing the different STA samples, the smallest increment in hardness reinforced by the precipitation hardening is due to STA1. The difference between these two samples (STA1 and STA9) in hardness is assumed to be the result of the differences in the degree of recrystallization. After 6 h of ST, the hardness dropped slightly up to 9 h, but there was no significant difference between that of 9 h and 24 h. It means that the quantity of dislocation dropped considerably, and recrystallization essentially attained a strain-free state after 9 h of solid solution heating. Therefore, based on the microstructure analysis and hardness measurement, complete elimination of subgrains in L-PBF-Inconel 718 can be achieved after solid solution heat treatment for longer than 7 h, but most likely less than 9 h at 1100 °C.
After aging, the gain in hardness is clearly due to the precipitation of the strengthening phases formed during aging. The effect of ST, as stated elsewhere, is to release residual stresses in the material and to dissolve Laves phase, which contains elements, such as Nb and Al. The resulting effect is recrystallization and grain growth depending on the hold time, which affects the hardness negatively as shown in Figure 11 (black bar vs. patterned bars). The direct aged samples, however, exhibit an increment in hardness without undergoing solid solution heat treatment. Clearly, the increment in hardness is due to the phases precipitated during age hardening. As shown in Figure 11, the hardness gained after aging is larger for longer hold times than for the shorter hold times. The increment in hardness due to hardening precipitates generally increases with the ST hold time, which could be related to the quantity of the hardening precipitates. STA24, however, showed slightly lower hardness compared to the other aged samples. This might be due to grain coarsening in certain regions of the sample, and it could also be due to other reasons that were not investigated in this study. The hardness of the sample subjected to ST for a shorter duration (example STA1) is due to the combined effects of the undissolved lattice defects (e.g., dislocations) and the aging precipitates. Such samples are, however, known to have lower ductility due to a large amount of stresses and lattice defects compared to those samples that are well recrystallized after sufficient solid solution heat treatment. To attain a stress-free microstructure, it is therefore recommended to perform ST of L-PBF-Inconel 718 for a hold time longer than 6 h at 1100 °C before aging.

4. Conclusions

The effects of solid solution heat treatment of L-PBF-Inconel 718 at 1100 °C at various hold times (1, 3, 6, 9, 16, or 24 h) on the microstructure and hardness were investigated. Significant changes in grain structure occurred after 3 h and longer hold times. Complete annihilation of the subgrains was, however, observed after about 9 h of hold time. A complete strain-free (without subgrains) recrystallized microstructure can be obtained after solid solution heat treatment for longer than 7 h, but most likely less than 9 h at 1100 °C. Generally, dissolution of the Laves phase and annihilation of dislocations preceded the elimination of the subgrain boundaries.
Depending on the amount of recrystallization and grain growth, the hardness of ST samples decreased with increasing hold time up to 6 h but became nearly the same for longer hold times. As expected, hardness increased after aging up to 49% compared to that of as-printed. The maximum increment pertaining to the precipitation of the strengthening phases (γ″ and γ′) was obtained at the hold time of 9 h of ST. A considerable amount of dislocations was annihilated, and strain-free recrystallization was essentially attained at the 9-h-and-longer solid solution heat treatment.
The microstructure of solid solution heat-treated L-PBF-Inconel 718 at 1100 °C for more than 1 h hold time is characterized by high-density annealing twins. The annealing twins observed are largely recrystallization twins that formed during the first few hours of ST and remained nearly constant when a longer hold time is considered. To inhibit the formation of the annealing twins, the ST temperature should be furthest from 1100 °C.
Direct aged sample is nearly as hard as the STA samples, but it exhibits a similar microstructure to that of the as-printed. The microstructure is nearly retained since the aging temperature is not high enough to undergo significant recrystallization. Direct aging is thus not recommended because of the retained lattice defects and phases that can potentially threaten the other properties of the material.
The continuation of this work includes systematic investigations of the effects of annealing twins on the mechanical properties in connection with optimization of the heat treatment process. Tensile strength, ductility, and creep behavior analysis will be performed to determine if annealing twins are beneficial or not for the L-PBF-fabricated Inconel 718. Based on the results, the temperature and hold time of solid solution heat treatment for achieving optimum microstructure and mechanical properties can then be proposed for further study.

Author Contributions

W.M.T. and V.H. conceptualized the study; W.M.T. performed the experimental investigations; data analysis and discussions were done by both; W.M.T. wrote the manuscript while V.H. revised and provided suggestions. All authors have read and agreed to the published version of the manuscript.

Funding

This research received no external funding.

Data Availability Statement

The data is contained within the article.

Acknowledgments

The authors would like to thank Eivind Strømland and Tor Nordheim from PROMET AS for supplying the samples.

Conflicts of Interest

The authors declare that they have no conflict of interest.

References

  1. ASTM F3055-14a, Standard Specification for Additive Manufacturing Nickel Alloy (UNS N07718) with Powder Bed Fusion. 2014. Available online: www.astm.org (accessed on 19 December 2019).
  2. Amato, K.; Gaytan, S.; Murr, L.; Martinez, E.C.; Shindo, P.; Hernandez, J.; Collins, S.F.; Medina, F.S. Microstructures and mechanical behavior of Inconel 718 fabricated by selective laser melting. Acta Mater. 2012, 60, 2229–2239. [Google Scholar] [CrossRef]
  3. Popovich, A.A.; Borisov, E.; Sufiiarov, V.; Masaylo, D.; Alzina, L. Impact of heat treatment on mechanical behaviour of Inconel 718 processed with tailored microstructure by selective laser melting. Mater. Des. 2017, 131, 12–22. [Google Scholar] [CrossRef]
  4. Chlebus, E.; Gruber, K.; Kuźnicka, B.; Kurzac, J.; Kurzynowski, T. Effect of heat treatment on the microstructure and mechanical properties of Inconel 718 processed by selective laser melting. Mater. Sci. Eng. A 2015, 639, 647–655. [Google Scholar] [CrossRef]
  5. Paulonis, D.F.; Oblak, J.M.; Duvall, D.S. Pricipitation in Nickel-Base Alooy 718; Defense Technical Information Center: Fort Belvoir, VA, USA, 1969. [Google Scholar]
  6. Metals, S. Inconel Alloy 718. 2007. Available online: https://www.specialmetals.com/assets/smc/documents/inconel_alloy_718.pdf. (accessed on 19 January 2021).
  7. Radavich, J.F. The physical metallurgy of cast and wrought alloy 718. Superalloy 1989, 718, 229–240. [Google Scholar]
  8. Slama, C.; Servant, C.; Cizeron, G. Aging of the Inconel 718 alloy between 500 and 750 °C. J. Mater. Res. 1997, 12, 2298–2316. [Google Scholar] [CrossRef]
  9. Sui, S.; Tan, H.; Chen, J.; Zhong, C.; Li, Z.; Fan, W.; Gasser, A.; Huang, W. The influence of Laves phases on the room temperature tensile properties of Inconel 718 fabricated by powder feeding laser additive manufacturing. Acta Mater. 2019, 164, 413–427. [Google Scholar] [CrossRef]
  10. Tucho, W.M.; Cuvillier, P.; Sjolyst-Kverneland, A.; Hansen, V. Microstructure and hardness studies of Inconel 718 manufactured by selective laser melting before and after solution heat treatment. Mater. Sci. Eng. A 2017, 689, 220–232. [Google Scholar] [CrossRef]
  11. Verhoeven, J.D. Fundamentals of Physical Metallurgy; John Wiley & Sons: New York, NY, USA, 1975. [Google Scholar]
  12. Tucho, W.M.; Hansen, V. Characterization of SLM-fabricated Inconel 718 after solid solution and precipitation hardening heat treatments. J. Mater. Sci. 2019, 54, 823–839. [Google Scholar] [CrossRef]
  13. Cao, Y.; Bai, P.; Liu, F.; Hou, X.; Guo, Y. Effect of the Solution Temperature on the Precipitates and Grain Evolution of IN718 Fabricated by Laser Additive Manufacturing. Materials 2020, 13, 340. [Google Scholar] [CrossRef] [Green Version]
  14. Li, C.-S.; Ma, B.; Song, Y.; Li, K.; Dong, J. The Annealing Twins of Fe-20Mn-4Al-0.3C Austenitic Steels during Symmetric and Asymmetric Hot Rolling. Metals 2018, 8, 882. [Google Scholar] [CrossRef] [Green Version]
  15. Chuang, T.H.; Tsai, C.H.; Wang, H.C.; Chang, C.C.; Chuang, C.H.; Lee, J.D.; Tsai, H.H. Effects of Annealing Twins on the Grain Growth and Mechanical Properties of Ag-8Au-3Pd Bonding Wires. J. Electron. Mater. 2012, 41, 3215–3222. [Google Scholar] [CrossRef]
  16. Miao, J.; Pollock, T.M.; Jones, J.W. Crystallographic fatigue crack initiation in nickel-based superalloy René 88DT at elevated temperature. Acta Mater. 2009, 57, 5964–5974. [Google Scholar] [CrossRef]
  17. Stein, C.; Cerrone, A.; Ozturk, T.; Lee, S.B.; Kenesei, P.; Tucker, H.; Pokharel, R.; Lind, J.; Hefferan, C.; Suter, R.M.; et al. Fatigue crack initiation, slip localization and twin boundaries in a nickel-based superalloy. Curr. Opin. Solid State Mater. Sci. 2014, 18, 244–252. [Google Scholar] [CrossRef]
  18. Bozzolo, N.; Bernacki, M. Viewpoint on the Formation and Evolution of Annealing Twins during Thermomechanical Processing of FCC Metals and Alloys. Met. Mater. Trans. A 2020, 51, 2665–2684. [Google Scholar] [CrossRef]
  19. Kumar, P.; Farah, J.; Akram, J.; Teng, C.; Ginn, J.; Misra, M. Influence of laser processing parameters on porosity in Inconel 718 during additive manufacturing. Int. J. Adv. Manuf. Technol. 2019, 103, 1497–1507. [Google Scholar] [CrossRef]
  20. Mercelis, P.; Kruth, J. Residual stresses in selective laser sintering and selective laser melting. Rapid Prototyp. J. 2006, 12, 254–265. [Google Scholar] [CrossRef]
  21. Brandon, D. The structure of high-angle grain boundaries. Acta Met. 1966, 14, 1479–1484. [Google Scholar] [CrossRef]
  22. Bozzolo, N.; Souaï, N.; Logé, R.E. Evolution of microstructure and twin density during thermomechanical processing in a γ-γ’ nickel-based superalloy. Acta Mater. 2012, 60, 5056–5066. [Google Scholar] [CrossRef] [Green Version]
  23. Jin, Y.; Lin, B.; Rollett, A.D.; Rohrer, G.S.; Bernacki, M.; Bozzolo, N. Thermo-mechanical factors influencing annealing twin development in nickel during recrystallization. J. Mater. Sci. 2015, 50, 5191–5203. [Google Scholar] [CrossRef]
  24. Wang, W.; Lartiguekorinek, S.; Brisset, F.; Helbert, A.L.; Bourgon, J.; Baudin, T. Formation of annealing twins during primary recrystallization of two low stacking fault energy Ni-based alloys. J. Mater. Sci. 2015, 50, 2167–2177. [Google Scholar] [CrossRef]
  25. Jin, Y.; Bernacki, M.; Agnoli, A.; Lin, B.; Rohrer, G.S.; Rollett, A.D.; Bozzolo, N. Evolution of the Annealing Twin Density during δ-Supersolvus Grain Growth in the Nickel-Based Superalloy Inconel™ 718. Metals 2015, 6, 5. [Google Scholar] [CrossRef] [Green Version]
  26. Hong, S.J.; Chen, W.P.; Wang, T.W. A diffraction study of the γ″ phase in INCONEL 718 superalloy. Metall. Mater. Trans. A 2001, 32, 1887–1901. [Google Scholar] [CrossRef]
  27. Cozar, R.; Pineau, A. Morphology of y’ and y” precipitates and thermal stability of inconel 718 type alloys. Metall. Trans. 1973, 4, 47–59. [Google Scholar] [CrossRef]
  28. Sundararaman, M.; Mukhopadhyay, P.; Banerjee, S. Some aspects of the precipitation of metastable intermetallic phases in INCONEL 718. Met. Mater. Trans. A 1992, 23, 2015–2028. [Google Scholar] [CrossRef]
  29. Qi, H.; Azer, M.; Ritter, A. Studies of Standard Heat Treatment Effects on Microstructure and Mechanical Properties of Laser Net Shape Manufactured INCONEL 718. Met. Mater. Trans. A 2009, 40, 2410–2422. [Google Scholar] [CrossRef]
  30. Kuo, Y.-L.; Nagahari, T.; Kakehi, K. The Effect of Post-Processes on the Microstructure and Creep Properties of Alloy 718 Built up by Selective Laser Melting. Materials 2018, 11, 996. [Google Scholar] [CrossRef] [Green Version]
Figure 1. Microstructure of as-printed L-PBF-Inconel 718. (a) SEM electron backscatter image showing cellular and columnar subgrains. The labels A and C indicate columnar and cellular subgrains, respectively. (b) TEM bright field image showing entangled high-density dislocations along the columnar subgrain boundaries. The inset is a selected area diffraction (SAD) pattern.
Metals 11 00266 g001
Figure 2. SEM electron backscatter images: (a) as-printed, (b) ST1 (1100 °C/1 h), (c) ST3 (1100 °C/3 h), (d) ST6 (1100 °C/6 h), (e) ST9 (1100 °C/9 h) and (f) ST16 (1100 °C/16 h). The white spots in the images are carbides (mainly NbC) particles; the darker spots are most likely TiN or Al-rich particles, depending on the morphology. Al-rich particles are usually circular in shape (note that all the images were recorded at the same magnification).
Metals 11 00266 g002
Figure 3. Subgrain boundaries after heat treatment (a) electron backscatter image of ST1 and (b) TEM BF image of STA3. The tiny white spots in the subgrain boundaries in (a) are the undissolved Laves/carbide phase. The arrows in (b) indicate a grain boundary. The rest are subgrain boundaries.
Metals 11 00266 g003
Figure 4. EBSD-IQ maps showing grain boundaries (black lines) and twin boundaries (red lines): (a) STA1100-1 h (STA1), (b) STA1100-3 h (STA3).
Metals 11 00266 g004
Figure 5. Annealing twin density (a,b) average grain diameter as a function of the hold time and (c) twin density vs. grain size.
Metals 11 00266 g005
Figure 6. TEM images of aged samples: (a) SAD in [001] zone (b) DF image of STA16 using the circled superlattice spot in (a), (c) DF image of STA9 and (d) DF image of DA. The inset in (d) is the corresponding diffraction pattern of the image. The subgrain boundary regions with undissolved Laves and lattice defects are indicated by the letter ‘L’ in (d). The labels (ac) in the SAD in (a) refer to the orientations of [001], [010], and [001], respectively.
Metals 11 00266 g006
Figure 7. Electron backscatter SEM images: (a) as-printed and (b) direct-aged samples. The arrows are pointing to the grain boundaries in both images.
Metals 11 00266 g007
Figure 8. High-magnification image of SEM: (a) as-printed and (b) direct aged samples. Black arrows indicate Laves phase. The white arrows point to the δ precipitates.
Metals 11 00266 g008
Figure 9. X-ray diffractograms of (a) AP, (b) ST3, and (c) STA3. The strong peaks are indexed to the fcc structure (γ), whereas the inverted triangles are pointing to the peaks indexed to the tetragonal structure (γ″ phase).
Metals 11 00266 g009
Figure 10. High magnification plot of the (111)γ peak showing a shift of peaks and variation of breadth after heat treatment.
Metals 11 00266 g010
Figure 11. Average Vickers hardness: The black bar represents the hardness of the as-printed sample. The patterned bars show the hardness after ST, whereas the white bars represent the amount of hardness that decreased due to ST. The dotted bars represent the increment in hardness relative to AP after aging. The increment in hardness due to the hardening precipitates is the sum of the white and dotted bars. The numbers in the bars are the average values of the hardness in HV.
Metals 11 00266 g011
Table 1. Composition of Inconel 718.
ElementNiCrFeNbMoTiAlCoMnSiCu
wt. %Min5017114.82.80.70.2----
Max552122.45.53.31.20.810.40.40.3
Table 2. Heat treatment scheme of the investigated samples.
Specimen Solid Solution Heat TreatmentPrecipitation Hardening
T (°C) Hold Time (h)Cooling1st Aging2nd AgingCooling
T (°C)Time (h)T (°C)Time (h)
ST111001quenched in cold water (16–18 °C)
ST33
ST66
ST99
ST1616
ST2424
STA117601065010air
cooled
STA33
STA66
STA99
STA1616
STA24 24
DADirect aged
APAs-printed (not heat treated)
Table 3. Average hardness (HV) of as-printed, direct-aged, ST and STA samples.
SchemeHardness [HV]
APSTSTA%ΔHV
AP308 ± 5
DA 446 ± 445
1 h 249 ± 4456 ± 449
3 h 200 ± 3444 ± 545
6 h 195 ± 3439 ± 343
9 h 191 ± 3442 ± 644
16 h 192 ± 3439 ± 343
24 h 192 ± 5420 ± 536
Note: %ΔHV is the percentage increment in hardness after aging compared to the hardness of the as-printed.
Publisher’s Note: MDPI stays neutral with regard to jurisdictional claims in published maps and institutional affiliations.

