Article

First-Principles Calculations of Thermal and Electrical Transport Properties of bcc and fcc Dilute Fe–X (X = Al, Co, Cr, Mn, Mo, Nb, Ni, Ti, V, and W) Binary Alloys

1
Faculty of Materials Science and Engineering, Kunming University of Science and Technology, Kunming 650093, China
2
College of Optoelectronics Technology, Chengdu University of Information Technology, Chengdu 610225, China
3
National Joint Engineering Research Center for Abrasion Control and Molding of Metal Materials, Henan University of Science and Technology, Luoyang 471003, China
*
Author to whom correspondence should be addressed.
Metals 2021, 11(12), 1988; https://doi.org/10.3390/met11121988
Submission received: 1 November 2021 / Revised: 25 November 2021 / Accepted: 6 December 2021 / Published: 9 December 2021
(This article belongs to the Section Computation and Simulation on Metals)

Abstract

:
The adiabatic shear sensitivity of ultra-high-strength steels is closely related to their thermal conductivity. Therefore, it is essential to investigate the effects of alloying elements on the thermal conductivity of ultra-high-strength steel. In this study, the variation in the scattering behavior of electrons with respect to temperature and the mechanism of three-phonon scattering were considered for obtaining the contributions of electrons and phonons, respectively, to the thermal conductivity of alloys while solving the Boltzmann transport equation. By predicting the effect of ten alloying elements on the electronic thermal conductivity (κe), it was found that, at 1200 K, the doping of iron with Ni and Cr endowed iron with κe values of 24.9 and 25.7 W/m K, respectively. In addition, the prediction for the lattice thermal conductivity (κL), which was performed without considering point defect scattering, indicated that elements such as Al, Co, Mn, Mo, V, and Cr demonstrate a positive effect on the lattice thermal conductivity, with values of 3.6, 3.7, 3.0, 3.1, 3.9, and 3.8 W/m K, respectively. The contribution of κL is only 5–15% of the total thermal conductivity (κtotal). The alloying elements exhibited a similar effect on κtotal and κe. Δκi; the change in thermal conductivity with respect to κ0 owing to the alloying element i was evaluated according to the total thermal conductivity. These values were used to understand the effect of the concentration of alloying elements on the thermal conductivity of iron. The Δκi values of Ni, Co, and W were 6.44, 6.80, and 6.06, respectively, indicating a reduction in the thermal conductivity of iron. This paper provides theoretical guidance for the design of ultra-high-strength steels with a high thermal conductivity.

1. Introduction

Ultra-high-strength steels are widely used in the military industry and engineering machinery owing to their excellent balance of strength and toughness [1]. The strengthening mechanism of ultra-high-strength steels is a secondary hardening effect from the interaction of precipitated carbides, such as dispersed MC, M2C, or intermetallic compounds, with dislocations [2,3,4,5]. One of the most typical ultra-high-strength steels is Ferrium M54 steel, in which carbide formation and grain coarsening are promoted and suppressed, respectively, by the addition of Ti, V, and W during high-temperature austenitization.
When ultra-high-strength steel is utilized under extreme conditions, such as high strain and impact rates, it experiences adiabatic shear damage, which is characteristic of dynamic loading situations [6]. This damage is usually in the form of deformation damage, which occurs in a short duration over a small area. Owing to its short duration, it is an adiabatic process and is accompanied by a significant increase in the temperature. Zener and Hollom [7] have proposed that adiabatic shear band (ASB) [8] occurs owing to the combination of material hardening under strain and softening effects because of an increase in the temperature. Furthermore, the concept of adiabaticity implies the absence of heat transfer, which means that the rate of heat transfer is less than the rate of heating in the local area where plastic deformation of the material occurs. This rapid increase in the temperature inhibits the work hardening and softening of the material, thereby resulting in material failure [9,10].
The potential for localized adiabatic shear deformation is high in materials with low strain rate sensitivity, thermal conductivity, and thermal capacity [11,12]. Therefore, the alloy composition of ultra-high-strength steels that are used under extreme conditions must be designed in such a manner as to avoid or decrease the adiabatic shear phenomenon. Furthermore, it is very important to explore the influence of alloying elements on the thermal conductivity of ultra-high-strength steels for solving the problem of their adiabatic shear failure under high strain rates and realizing their application under extreme conditions [13,14].
The thermal and electrical conductivities of metallic materials are mainly attributed to free electrons. Therefore, investigating the effect of alloying elements on the transport properties is of immense importance to the study of the thermal conductivity of alloys [15,16,17]. This paper provides a theoretical basis and data support for the alloy composition design of ultra-high-strength steels used under conditions involving high strain rates [18,19,20].

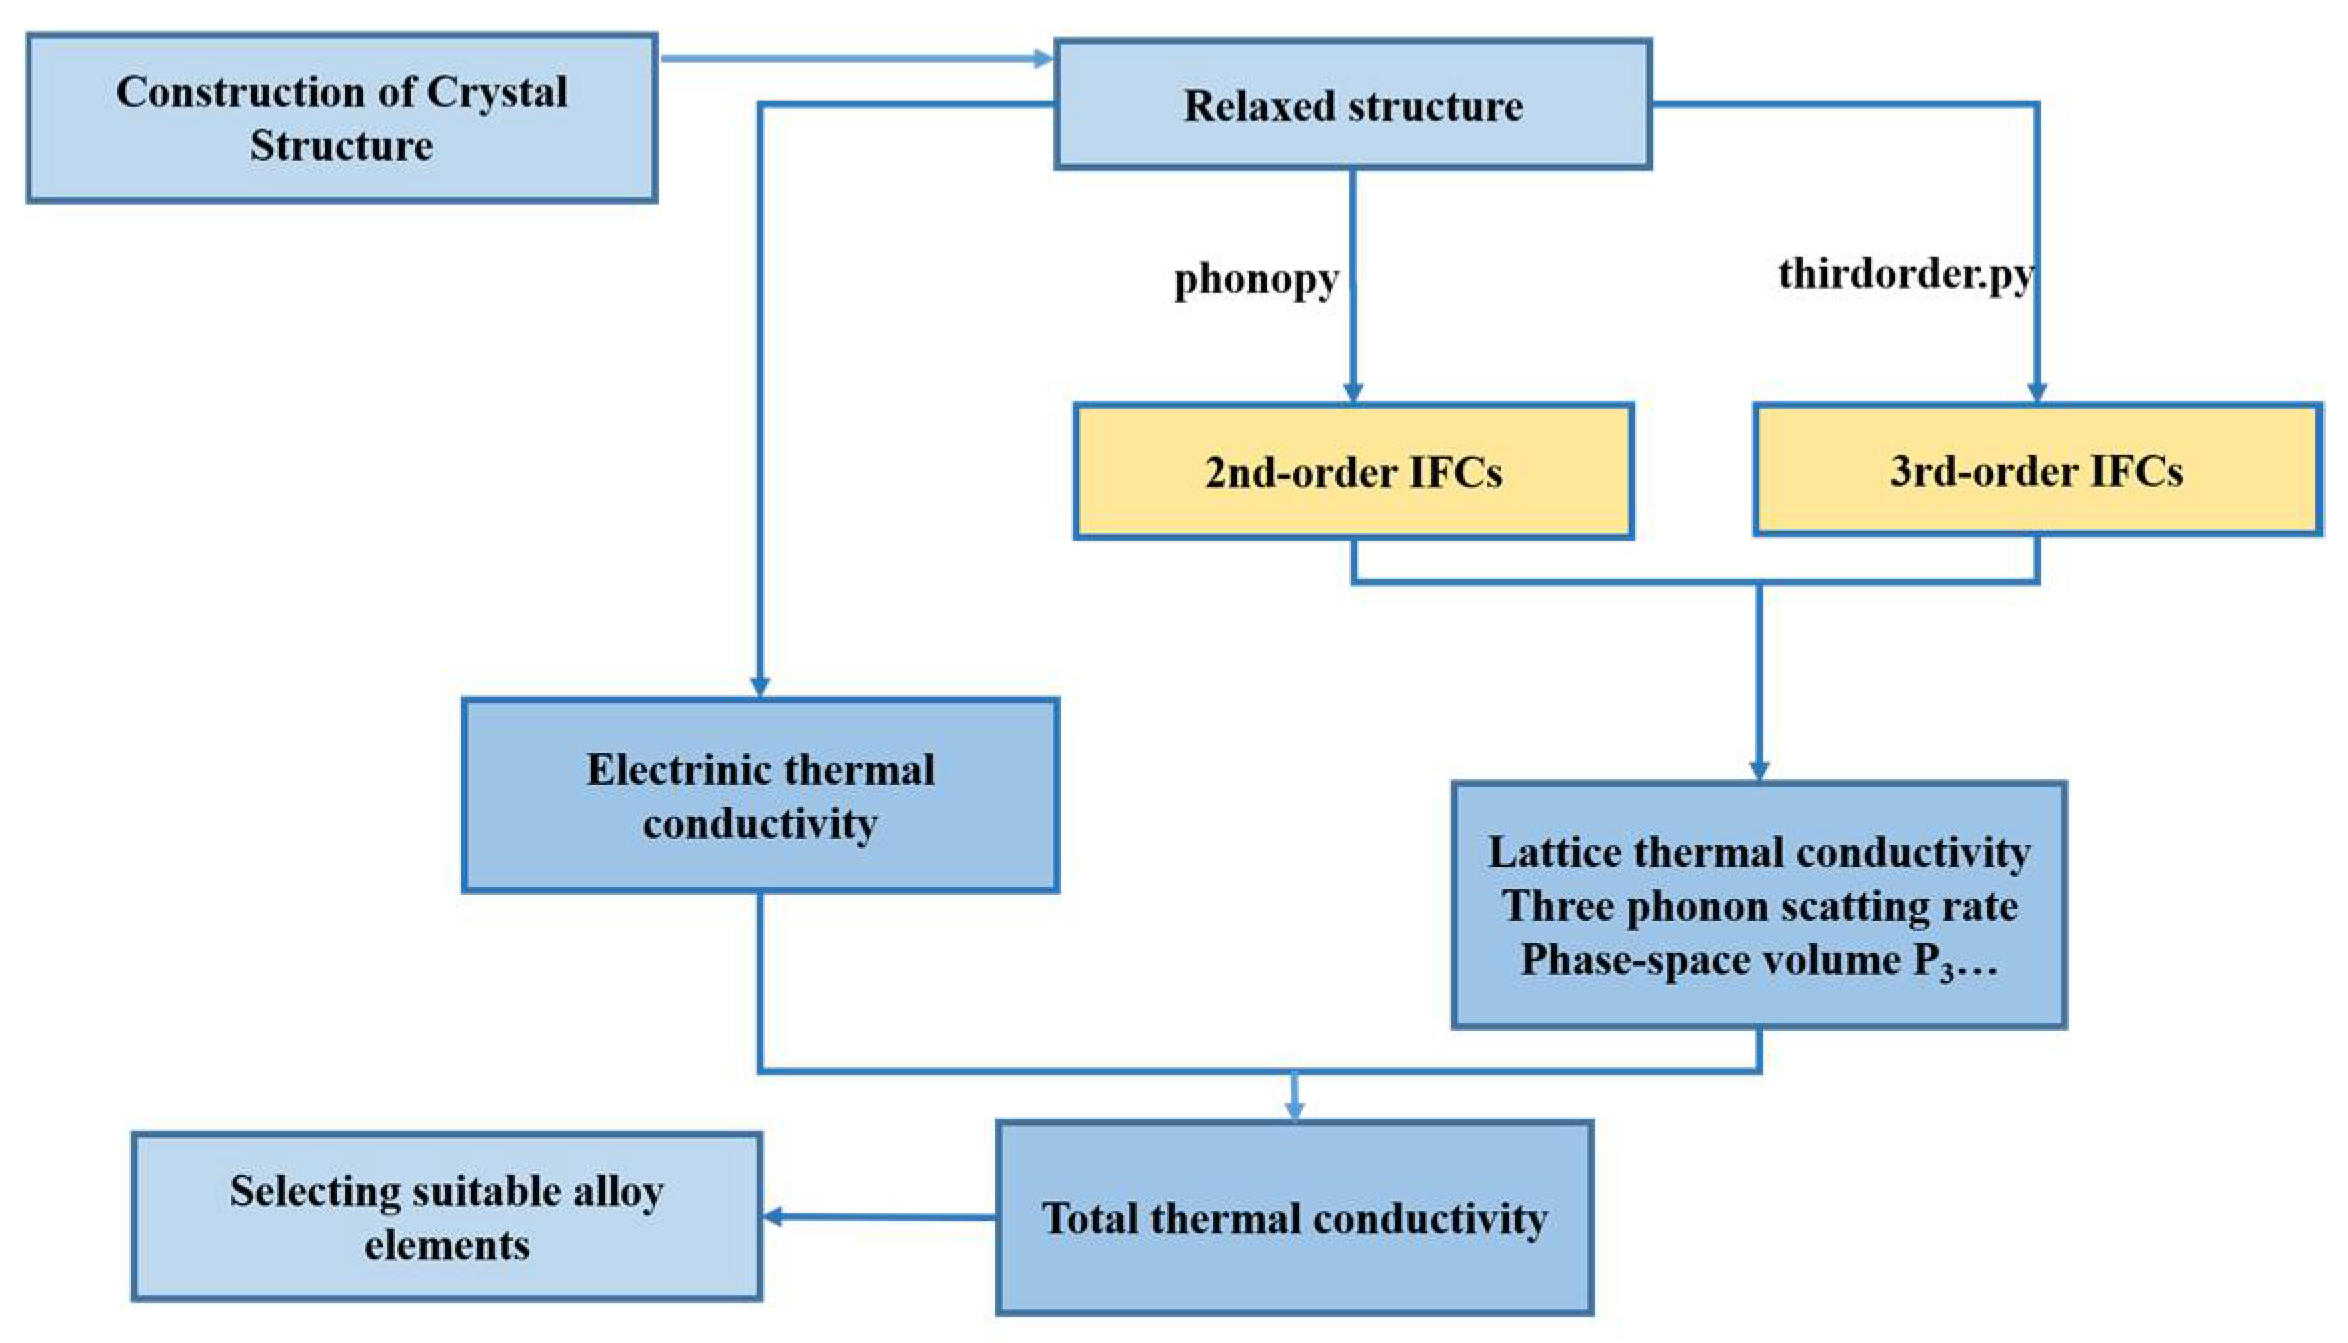
2. Computational Methodology

First-principles calculations were performed via the projector augmented wave (PAW) method [21] and the Perdew–Burke–Ernzerhof (PBE) generalized gradient approximation (GGA) [22] based on density functional theory (DFT) [23]. The calculation process was realized in the VASP [23,24] and VASPKIT packages [25]. For the calculation, the chosen plane-wave cut-off energy was 500 eV, and the k-mesh was 9 × 9 × 9 in the Brillouin zone. The electronic self-consistent iteration convergence criterion was 10−8 eV and the forces on each atom were less than 0.001 eV/Å. A flow chart for calculating the thermal conductivity of the alloys is shown in Figure 1.
The electronic thermal conductivity (κe) and conductivity (σ) of electrons were calculated using the BoltzTraP code [26] for the Boltzmann transport equation. The electrical and thermal conductivities were obtained by integrating the following equations:
σ ( T ; μ ) τ = 1 Ω + σ ( ε ) f ( ε , μ , T ) ε d ε
κ ( T ; μ ) τ = 1 q 2 T Ω + σ ( ε ) ( ε μ ) 2 f ( ε , μ , T ) ε d ε
where Ω is the volume, and σ ( k ) is the dimensionless transport distribution expressed by
σ ( ε ) = 1 N k σ ( k ) δ ( ε ε k )
where N is the number of k-points and σ ( ε ) is the conductivity tensor. Carrier concentrations of 1021–1023 cm−3 were chosen for the calculations.
Lattice transport properties, such as the phonon thermal conductivity (κL) and phonon scattering rate, were obtained using the ShengBTE package [27]. For the calculations, a 2 × 2 × 2 supercell and 7 × 7 × 7 k-mesh were used for the bcc structure and a 2 × 2 × 1 supercell and 7 × 7 × 7 k-mesh were used for the fcc structure. The 2 × 2 × 1 supercell for fcc structure to ensure the same alloying element concentrations for both bcc and fcc structures; at the same time, it can avoid the increase of cost and calculation inaccuracy caused by oversized structure. The concentration of alloying elements is 6.25%, the solubility of each alloying element in the actual steel is Ni 10%, Co 76%, Mn 3%, Mo 4%, W 33% at 1813K, Ti2.5%, Nb 1.8%, Cr, and V is an unlimited solid solution for bcc structure, and Cr 12.8%, V 1.4%, Mo 3%, W 3.2%, Ti 0.68%, Nb 2%, Ni, Co, and Mn is an unlimited solid solution for fcc structure [28]. Second-order force constants were obtained via the Phonopy [29] package after the complete relaxation of the supercell structure by using VASP, and the symmetric displacements are used for calculations of forces necessary for dynamical matrices. The third-order force constants (3rd IFCs) were calculated using the same supercells via the thirdorder.py package [27]. The 3rd IFCs consider the interactions, including those with the sixth nearest neighbor atoms. Here, the convergence of the lattice thermal conductivity (κL) was carefully tested with respect to k-grids.

3. Results and Discussion

3.1. Electron Relaxation Time

The relaxation time of electrons (τe) is usually used to evaluate the scattering rate of electrons; they are inversely proportional to each other. The electron-transport properties were calculated using the BoltzTraP code, and the results were in the form of σ/τe. Therefore, to accurately calculate the conductivity of dilute Fe-based alloys, it is necessary to evaluate τe according to the scattering mode rather than by using the constant relaxation time value [30].
In this study, we consider the scattering effects of defects, electrons, and elements; therefore, the relaxation time is mainly related to the temperature, and its relationship is τ~Tr. Therefore, the relaxation time was fitted approximately by using the semi-empirical formula and the experimental value of conductivity (σexp) [31,32,33,34]. The semi-empirical formula is
τ = A T r
where A is a proportionality constant, T is the temperature, and r is the scaling factor.
The fitted τe results for the bcc and fcc structures are shown in Figure 2. The results of the fitting parameters are listed in Table S1 and the order of their magnitude is 10−14–10−15. This is consistent with the range of τe for metallic materials, and the values of τe at high temperatures are much lower than those at room temperature because, with an increase in the temperature, the electron-scattering ability of phonons increases and free electrons are scattered by a greater extent. Furthermore, the constant value of relaxation time is significantly different from the fitted value. Therefore, the semi-empirical fitting method offers greater accuracy in the evaluation of the κe and σ of dilute Fe-based alloys at different temperatures. However, owing to the lack of experimental values for some alloy components, the relaxation time of pure iron was used to calculate the approximate conductivity. Therefore, there is a difference between the calculated and actual values; however, the calculated result can still reflect the influence of alloying elements on the κe and σ of iron alloys.
Upon comparing the relaxation times for different electron concentrations, it was found that the electrons have higher relaxation times at a concentration of 1023 cm−3, indicating that the higher the concentration, the lesser the scattering of electrons and the higher the electronic thermal conductivity. From Figure 2, it is evident that, at temperatures above 1100 K, the relaxation times of doped Cr and Ni are greater than that of pure iron; that is, the scattering ability decreases, which is consistent with the higher electronic thermal conductivity of doped Cr and Ni compared with that of pure iron at temperatures above 1100 K.

3.2. Electrical Thermal Conductivity

The κe and σ of the metallic materials are mainly attributed to the electrons. Therefore, we first calculated the κe and σ values of iron based on the fitted electron–relaxation time. The σ values are presented in Figures S1 and S2. For the bcc structure, the σ values of pure iron are 10.0 × 10⁶ and 0.9 × 10⁶ S/m at 300 and 1200 K, respectively. At 300 K, the σ values of Fe15Al, Fe15Co, Fe15Mo, Fe15V, Fe15W, Fe15Ti, Fe15Nb, Fe15Ni, and Fe15Cr are 1.0 × 10⁶, 4.3 × 10⁶, 2.3 × 10⁶, 2.4 × 10⁶, 2.1 × 10⁶, 1.6 × 10⁶, 1.5 × 10⁶, 4.9 × 10⁶, and 4.7 × 10⁶ S/m, respectively. Furthermore, at 1200 K, the σ values of Fe15Al, Fe15Co, Fe15Mo, Fe15V, Fe15W, Fe15Ti, Fe15Nb, Fe15Ni, and Fe15Cr are 0.1 × 10⁶, 0.4 × 10⁶, 0.2 × 10⁶, 0.23 × 10⁶, 0.2 × 10⁶, 0.2 × 10⁶, 0.15 × 10⁶, 0.9 × 10⁶, and 1.0 × 10⁶ S/m, respectively. For the fcc structure, the σ values of pure iron are 10.0 × 10⁶ and 0.8 × 10⁶ S/m at 300 and 1200 K, respectively. At 300 K, the σ values of Fe15Al, Fe15Co, Fe15Mo, Fe15V, Fe15W, Fe15Ti, Fe15Nb, Fe15Ni, and Fe15Cr are 2.5 × 10⁶, 8.1 × 10⁶, 4.3 × 10⁶, 4.6 × 10⁶, 4.1 × 10⁶, 3.4 × 10⁶, 2.6 × 10⁶, 4.9 × 10⁶, and 5.0 × 10⁶ S/m, respectively. Furthermore, at 1200 K, the σ values of Fe15Al, Fe15Co, Fe15Mo, Fe15V, Fe15W, Fe15Ti, Fe15Nb, Fe15Ni, and Fe15Cr is 0.2 × 10⁶, 0.7 × 10⁶, 0.4 × 10⁶, 0.4 × 10⁶, 0.35 × 10⁶, 0.3 × 10⁶, 0.28 × 10⁶, 0.7 × 10⁶, and 1.3 × 10⁶ S/m, respectively.
As the scattering effect increased with temperature, the conductivity of the iron-based dilute solid solution decreased. Furthermore, owing to the different electron-scattering capabilities of the defects produced by the different elements and the different forces of attraction between the atoms and electrons, the conductivity varies according to the alloying-element composition. Moreover, the different alloying elements have different atom-to-electron collision abilities, which result in the different conductivity values of Fe-based dilute alloys.
Furthermore, the values of κe were obtained based on software calculations, as shown in Figure 3. By changing the electron concentration, we can study the influence of crystal defects on the thermal conductivity to a certain extent. Owing to the scattering effect, the electronic thermal conductivity of the Fe-based dilute alloy is lower than that of pure iron at high temperatures. The κe of Fe15Al, Fe15Co, Fe15Mn, Fe15Mo, Fe15Nb, Fe15Ti, Fe15V, Fe15W, and pure iron in the bcc structure are 3.1, 13.6, 10.4, 6.5, 5.4, 5.8, 8.6, 6.3, and 29.8 W/m·K, respectively, at 1200 K. The κe of Fe15Al, Fe15Co, Fe15Mn, Fe15Mo, Fe15Nb, Fe15Ti, Fe15V, Fe15W, and pure iron in the fcc structure are 10.8, 18.0, 17.8, 9.6, 7.5, 8.1, 10.1, 9.0, and 24.3 W/m·K, respectively, at 1200 K. However, the κe of Fe15Ni and Fe15Cr are 25.9 and 24.7 W/m·K, respectively, in the fcc structure, and 24.8 and 25.0 W/m·K, respectively, in the fcc structure, which effectively ensure the thermal conductivity of ferroalloys at high temperatures.
Theoretically, κe represents the phenomenon of energy transfer via the collisions of electrons among themselves and with atoms; thus, the increase in the temperature induces an increase in the electronic collisions and the different electron–collision effects of the alloying atoms, which results in the temperature-and composition dependence of κe. The obtained values for the electrical conductivity and electronic thermal conductivity are in accordance with the Wiedemann–Franz law [35,36,37]. Although electronic heat transfer is the primary mode of thermal conductivity in metallic materials, lattice vibrations make a significant contribution at lower temperatures; therefore, an accurate assessment of the lattice thermal conductivity of iron-based alloys is required.

3.3. Phonon Spectral Analysis

Because Co and Ni are the main alloying elements in high-strength steel, we calculated the lattice thermal conductivities of alloys doped with Ni and Co and used the ShengBTE code to assess the accuracy of the method. Figure 4 shows the phonon dispersions of iron and dilute Fe-based alloys doped with Ni and Co, which were calculated using the Phonopy code [36]. The phonon spectra of the bcc and fcc structures were along the paths G (0 0 0)-Z (0 0 0.5)-G (0 0 0)-X (0.25 0.25 0) and Г (0 0 0)-L (0.5 0.5 0.5)-W (0.5 0.25 0.75)-X (0.5 0 0.5)-Г (0 0 0), respectively. By comparing the phonon spectra of different alloying elements, it is evident that the phonon frequencies of Ni-doped alloys are similar to those of Co-doped alloys. This suggests that the two elements exhibit analogous bonding with iron. This is consistent with the DOS results. Furthermore, the calculated phonon spectrum of pure iron is in good agreement with that of the bcc structure and the experimental values. In addition, all the structures are stable according to the phonon spectra calculations.

3.4. Phonon-Relaxation Time

The phonon–phonon (τp) relaxation times are shown in Figure 5. Phonons are generated by lattice vibrations, and their scattering rate is inversely proportional to their lifetime. Since lattice thermal conductivity is obtained by three phonon scattering, the solution of scattering rate needs to consider two processes, that is, three-phonon absorption ( Γ λ λ λ + ) and emission ( Γ λ λ λ ) which can be expressed as:
Γ λ λ λ + = π 4 | V λ λ λ + | 2 δ ( ω λ + ω λ ω λ ) ( f 0 f 0 ω λ ω λ ω λ )
Γ λ λ λ = π 4 | V λ λ λ | 2 δ ( ω λ ω λ ω λ ) ( f 0 + f 0 + 1 ω λ ω λ ω λ )
where V λ λ λ ± is a matrix obtained by third IFCs, and ω λ is the angular frequency. Only the phonon-phonon scattering is considered in the calculations in this paper. In Figure 5, the yellow, purple, and blue circles are the acoustic phonon modes, and the green circles are the optic modes. The phonon relaxation times indicate that the acoustic branch was the main contributor to the lattice thermal conductivity. Furthermore, the τp of Fe15Co is slightly higher than that of the bcc-Fe structure, which means that Co reduced phonon scattering in the U-process of ferroalloys. Moreover, Ni doping does not affect the phonon scattering of pure iron significantly; therefore, there is only a minor difference between the thermal conductivities of the two. For the fcc structure, Ni and Co doping significantly decrease and increase the phonon scattering rate, respectively, of the iron alloy, which results in a considerable difference in the lattice thermal conductivity of the fcc structure. Furthermore, the calculated phase space (Figures S9–S14) supports this result. This is because the phase space shows the interaction channel of phonon heat conduction. The greater the limitation of phase space, the stronger the thermal conductivity of phonons. A less limitation of phase space leads to a large scattering rate.

3.5. Lattice Thermal Conductivity

We calculated the second-order and third-order force constants of Fe15Ni, Fe15Co, and pure iron by using Phonopy and thirdorder.py codes. Furthermore, we investigated the effect of Ni and Co, the main alloying elements in ultra-high-strength steel, on the lattice thermal conductivity of the iron matrix by using ShengBTE codes. Based on the calculated values of elasticity, as shown in Table 1 and Figure 6, we obtained the Debye temperature of an iron-based dilute solid solution doped with different alloying elements and estimated the lattice thermal conductivity in the temperature interval of 300–1500 K via the Slack model [38] which proposes the following relationship between the lattice thermal conductivity and Debye temperature:
κ p h ( θ a ) = 0.849 × 3 4 3 20 π 3 ( 1 0.514 γ 1 + 0.228 γ 2 ) ( k B θ a ) 2 k B M V 1 3 γ 2
θ a = n 1 3 θ D
γ = 3 2 ( 1 + σ 2 3 σ )
θ D = k B [ 3 n 4 π ( N A ρ M ) ] 1 3 v m
where θ a is the acoustic Debye temperature, M is the average atomic mass, V is the volume of crystals, kB is the Boltzmann constant, is the Planck constant, θ D is the Debye temperature that can be obtained from the elastic modulus, and γ is the Grüneisen coefficient, which is calculated using Poisson’s ratio (σ). By comparing the Debye temperatures obtained, it is found that the doping of alloying elements increases and decreases the Debye temperature of iron in the bcc and fcc structures, respectively (Table 2). Figure 7 shows a comparison of the results calculated using the ShengBTE code and those calculated using the empirical formula. In this study, we mainly considered the scattering effect between phonons and excluded the effects of boundaries and isotopes [19,30,39]. Extrinsic scattering owing to defects and boundaries, which depends on the microstructures of the materials, is not included [40].
When the temperature increases, the U-process mainly affects the magnitude of the phonon free range and, consequently, that of the thermal conductivity values. As the temperature increases, the number of phonons increases, and the scattering effect between phonons is enhanced. Thus, the lattice thermal conductivity of the alloy decreases with an increase in the temperature. This is consistent with the trend of the results obtained using the Slack model; both demonstrate a temperature dependence. Because the fcc structure is usually present as a high-temperature phase in Fe-based alloys, the results obtained for its lattice thermal conductivity are biased in favor of the bcc structure. In addition to the mean free path, the relaxation time and group velocities, which are calculated as shown in Figures S3–S8, prove this. Iron-based alloys with fcc structures exhibit larger phonon scattering rates and almost identical group velocities compared with those of the bcc structure, thereby resulting in a higher lattice thermal conductivity for the fcc structure. We calculated the lattice thermal conductivity of the lower alloying elements in the ultra-high-strength steel according to the Slack model (Figure 8) and found that their values were only 10–15% of the electronic thermal conductivity values, and their ratio is smaller at temperatures above the Debye temperature. Therefore, the lattice thermal conductivities of these alloying elements demonstrate only a minor influence on the iron matrix.

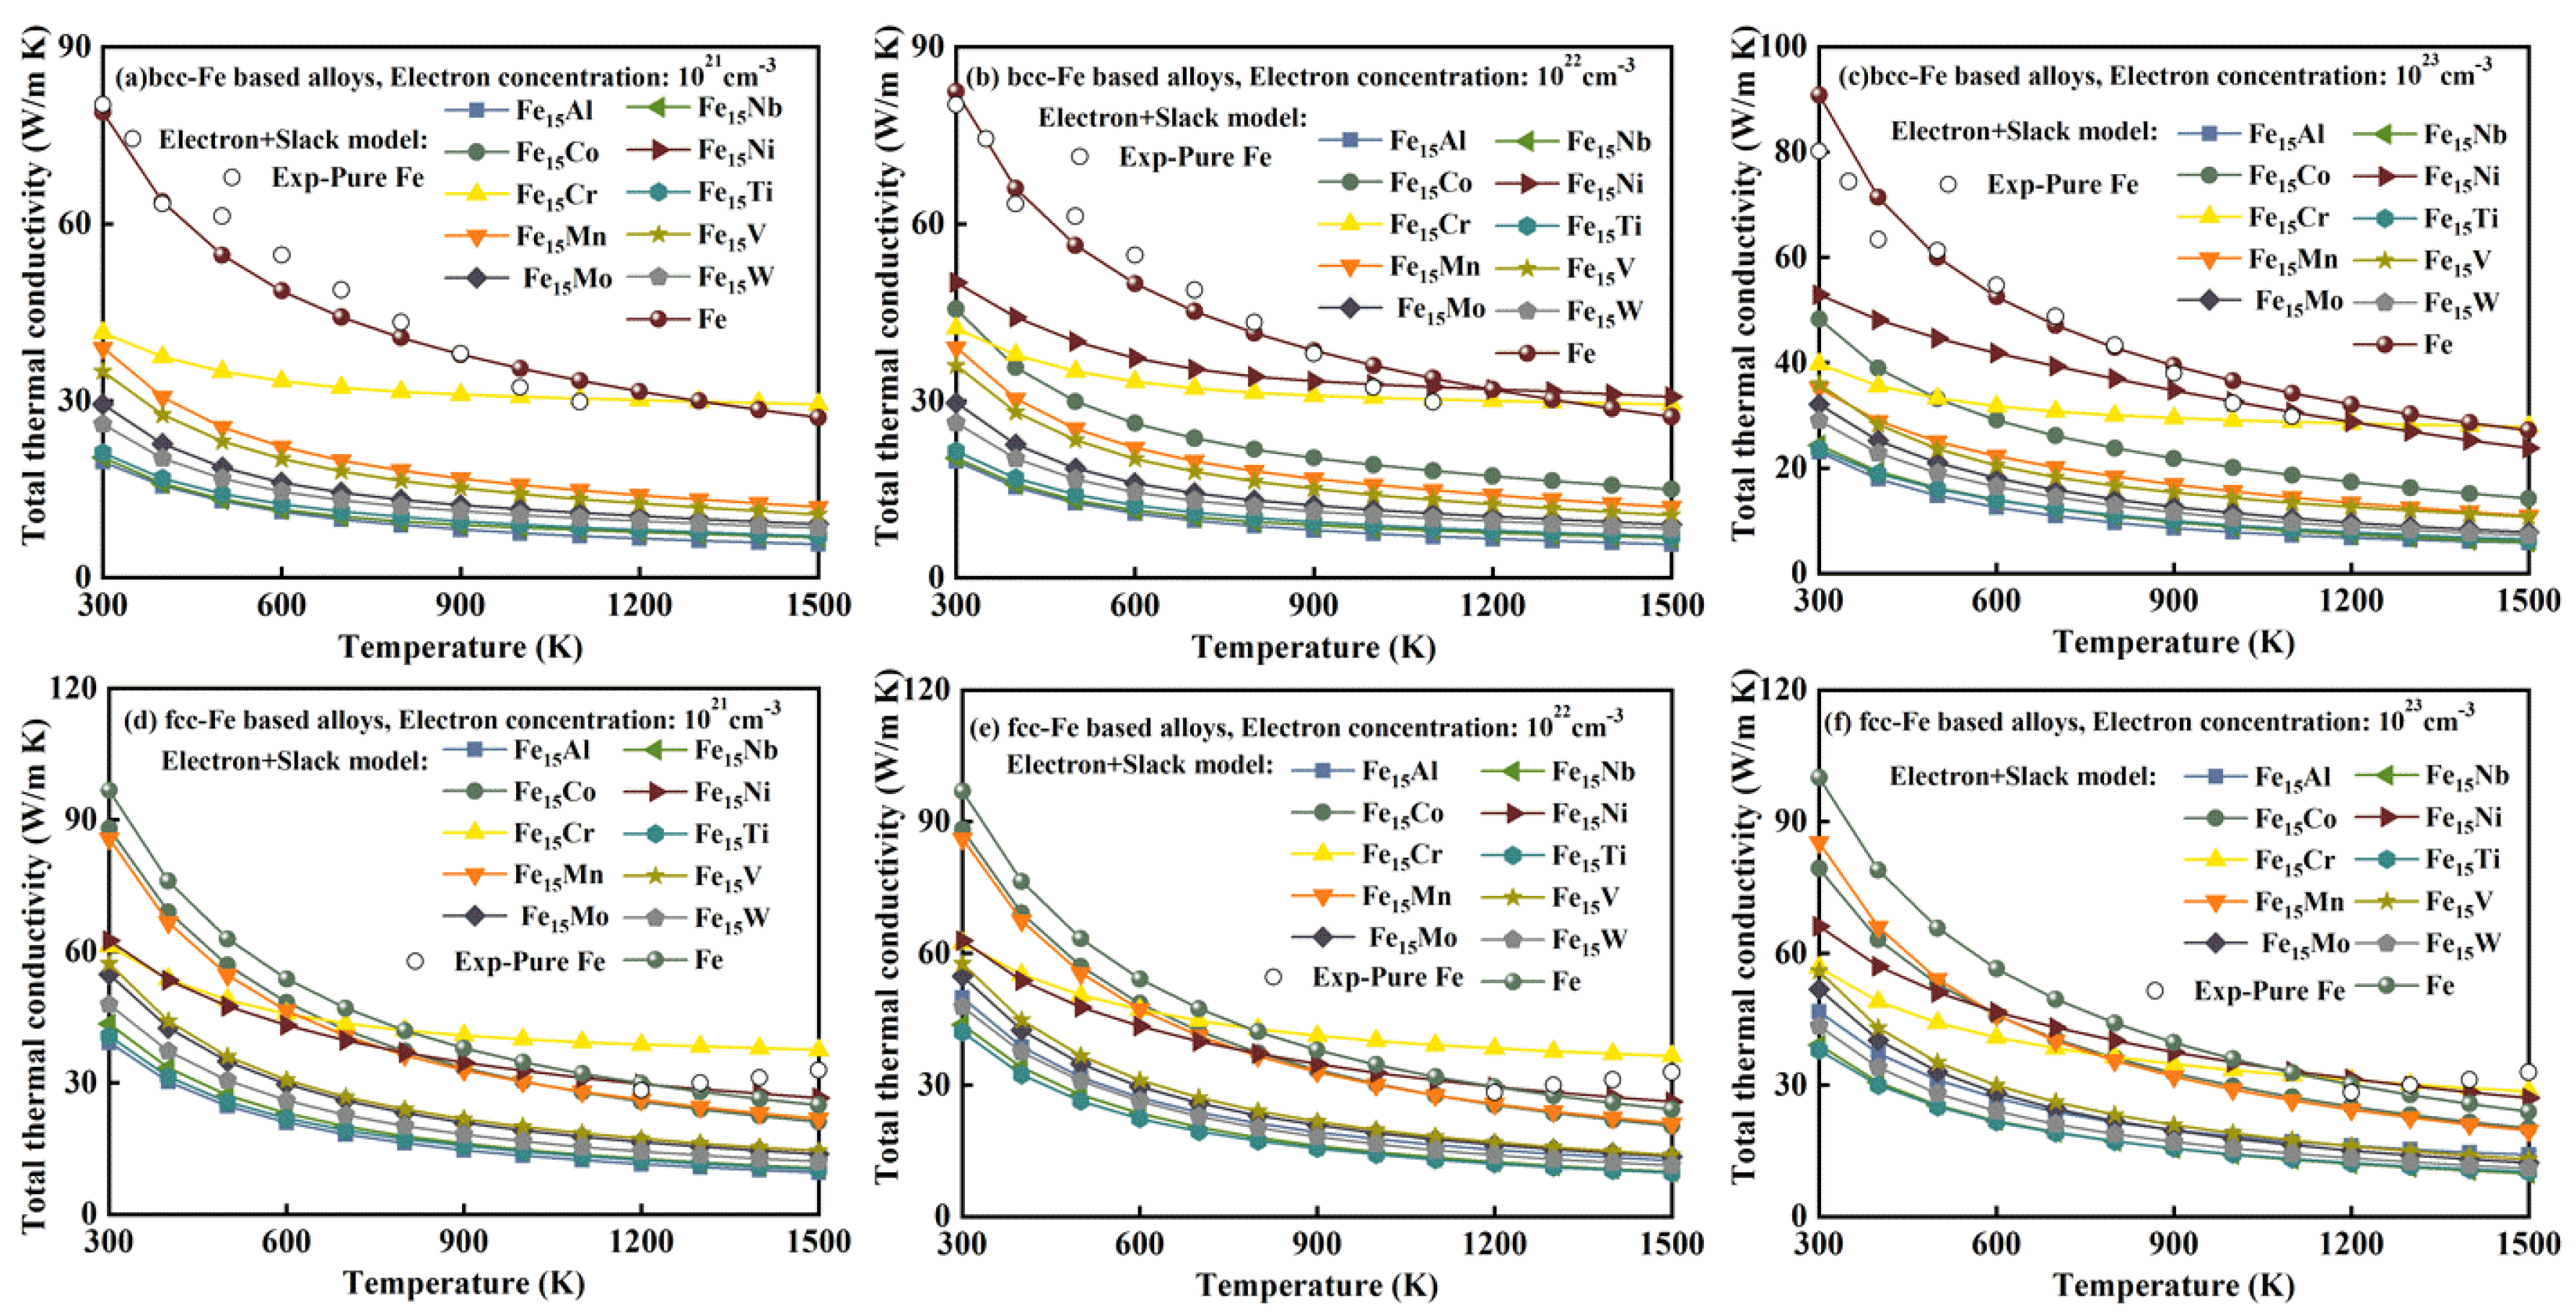
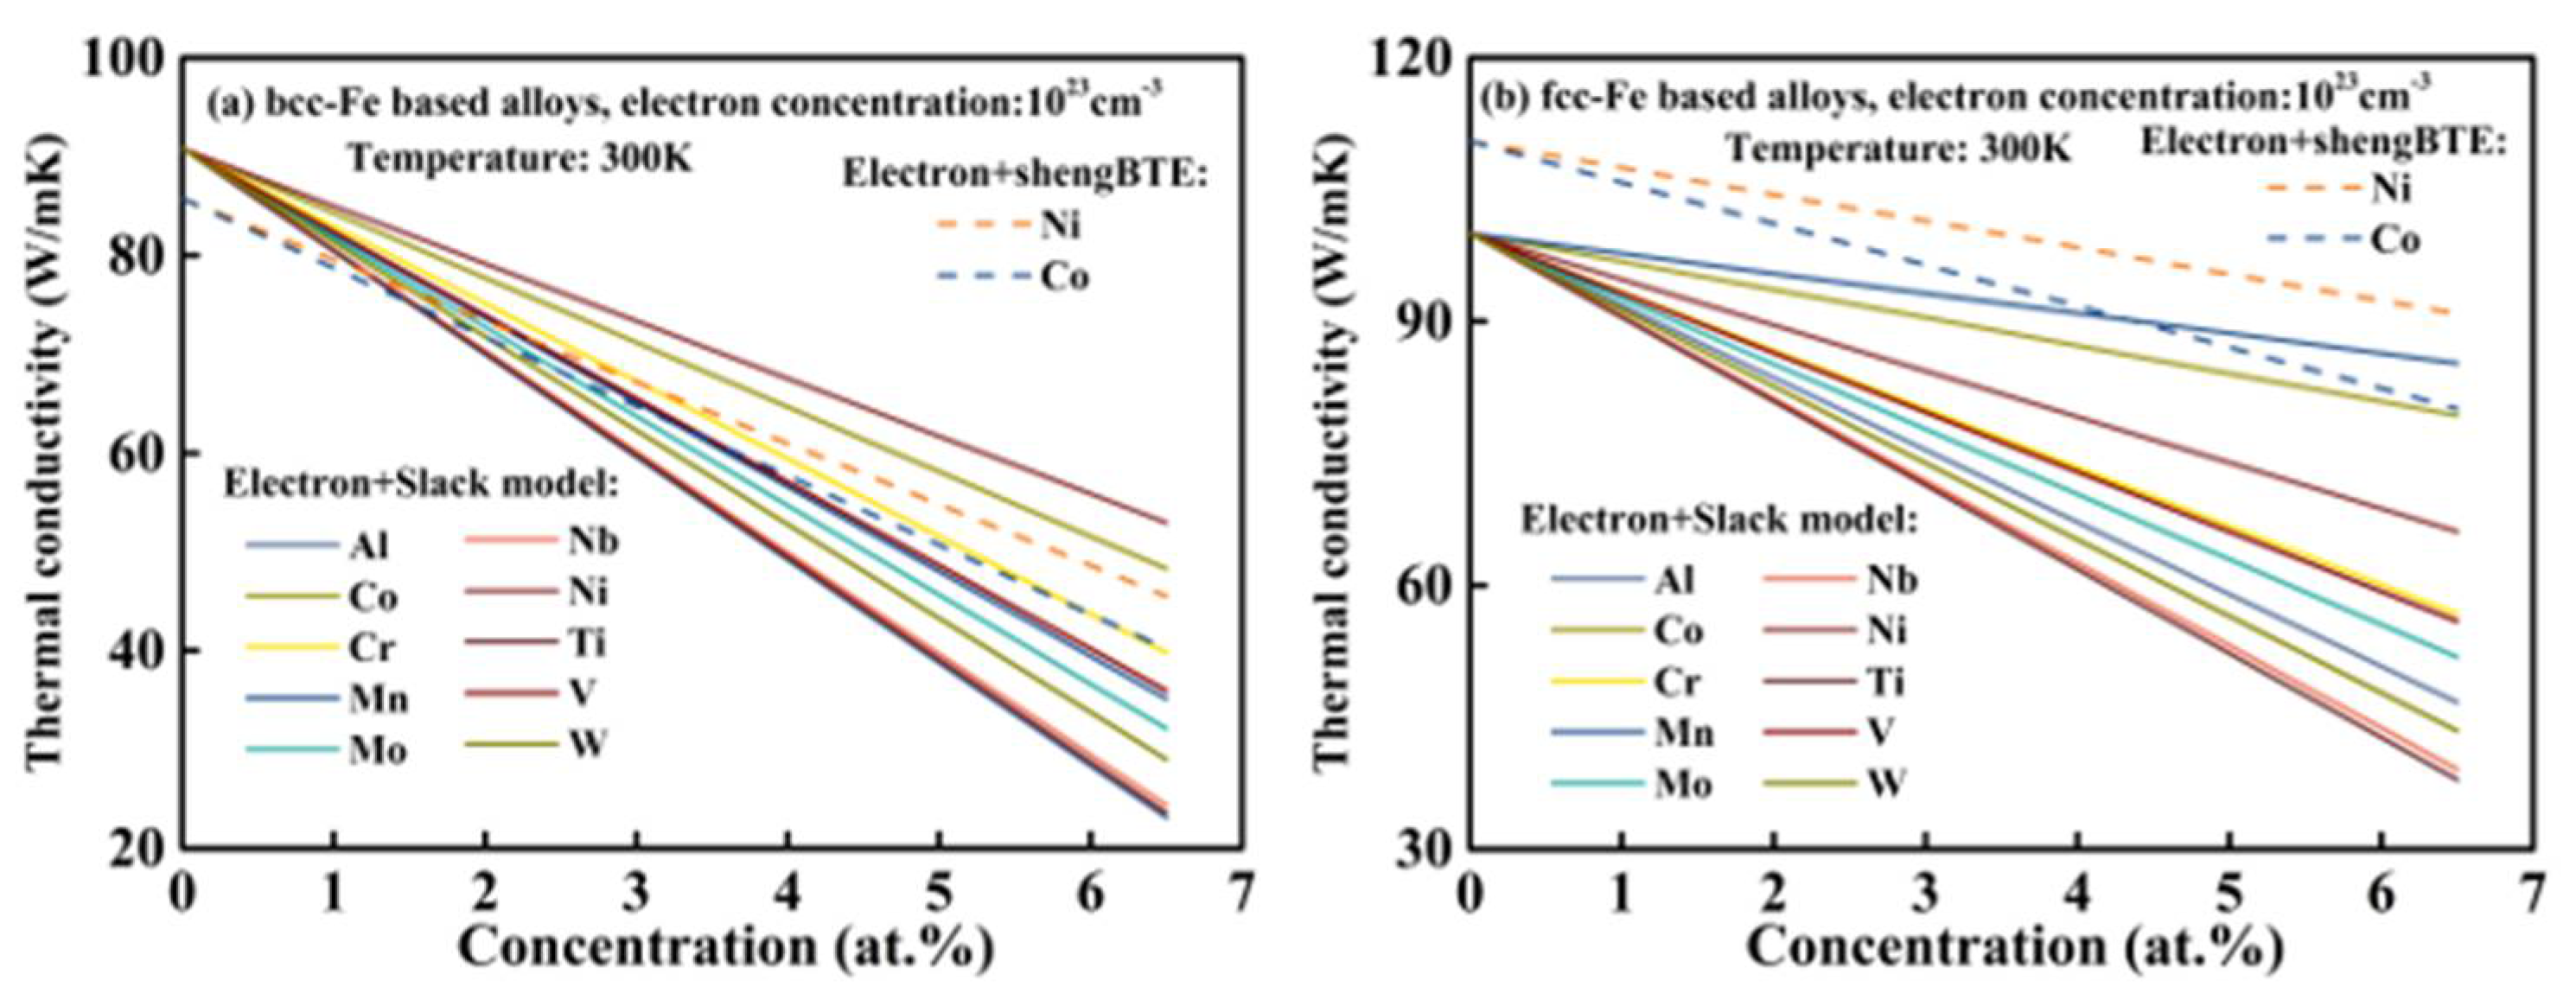
3.6. Total Thermal Conductivity

The calculated κtotal values are shown in Figure 9 and Figure 10. Figure 9 shows the differences in the results obtained by adding electronic thermal conductivity to the lattice thermal conductivity obtained via the Slack model and that obtained via the ShengBTE code. The difference between the results obtained by the two methods was minor, as shown in Figure 9. This is because both methods of predicting the lattice thermal conductivity are accurate and the lattice vibrations contribute only a small fraction to the total thermal conductivity. Furthermore, a comparison of the first-principles predictions for pure iron and the experimental measurements is shown in Figure 9. The predicted values of κtotal for both fcc and bcc structures of pure iron are in good agreement with the experimental values [44,45,46], which validate the correctness of the method. Moreover, by comparing the values of total thermal conductivity obtained for different electron concentrations, it was found that the results for 1023 cm−3 are most consistent with the experimental values, whereas those for concentrations of 1021 and 1022 cm−3 are lower than those for 1023 cm−3; therefore, the volume change owing to vacancy defects and doping with alloying elements will decrease the thermal conductivity of the iron-based alloy. By comparing pure iron with iron-based alloys doped with alloying elements, we found that, although some of these alloying elements increase the lattice thermal conductivity of the alloy, they decrease the total thermal conductivity of the iron-based alloy to varying degrees. This indicates that, for metallic structures, the thermal conductivity is mainly owing to electron heat transfer. We compared the thermal conductivity of pure iron with that of an iron-based alloy containing Ni and Co, the main elements of ultra-high-strength steel, and found that at 1000 K, the κtotal of Fe15Ni and pure iron were 28.9 and 32.7 W/m·K, respectively, and at 1500 K, the κtotal of Fe15Ni and pure iron were 28.4 and 25.3 W/m·K, respectively. Therefore, Ni can improve the κtotal of ferroalloys to a certain extent at high temperatures. However, the κtotal of the Fe15Co alloy (14.5 W/m·K @ 1000 K, 12.0 W/m·K @ 1500 K) is lesser than the κtotal of the ferroalloy at high temperatures. In the fcc structure, Ni and Co have the same influence on ferroalloys. The κtotal of Fe15Ni was 24.8 and 21.3 W/m·K @ 1000 and 1500 K, respectively, that of Fe15Co was 21.9 and 15.5 W/m·K @ 1000 and 1500 K, respectively, and that of pure iron was 27.8 and 20.3 W/m·K @ 1000 and 1500 K, respectively. Because the fcc structure is a high-temperature phase, the predicted volume is lower than the actual volume; therefore, its thermal conductivity values are higher than those of the bcc structure at lower temperatures. The addition of lower alloying elements in ultra-high-strength steel significantly decreases its thermal conductivity, as shown in Figure 10.

4. Outlook

Engineering alloys are complex multicomponent and multiphase alloys. For designing high-strength steel that exhibits high thermal conductivity, it is essential to understand the relationship between the composition and thermal conductivity. It is noteworthy that the present data for dilute Fe-based alloys can be used to understand and model complex steels such as M54 and A100 using a general calculation of phase diagrams (CALPHAD) modeling approach as follows [47,48,49]: the thermal conductivity (κ) of multicomponent alloys is the sum of the mechanical mixing term of individual species (oκ) and the excess term from the interactions among the species (Δκ):
κ = o κ + Δ κ
o κ = x i o κ i
Δ κ = i j > i x i x j n = 0 n l i j ( x i x j ) n
n l i j = n a i j + n b i j T
where n l i j is the nth-order binary interaction parameter for species i and j, naij and nbij are the fitting parameters, xi is the mole fraction of the alloying element i, and 0κi is the thermal conductivity of species i.
In addition to the CALPHAD method, a linear combination approach can be adopted as follows:
κ = κ 0 + i Δ κ i x i
where κ0 is the thermal conductivity of pure iron, and Δκi is the change in the thermal conductivity with respect to κ0 owing to alloying element i. Note that Equation (5) is valid only for dilute alloying elements. In the present study, based on the results of previous thermal conductivity calculations, we analyzed the effect of alloying elements with a molar fraction of 6.25% on the thermal conductivity of the iron matrix, and the Δκi are shown in Table 3. Based on the results shown in Figure 11, it was found that, for Ni and Co, the main alloying elements in ultra-high-strength steel, the reduction in the thermal conductivity of iron-based alloys owing to Ni is less than that owing to Co. Furthermore, for the lower alloying elements in ultra-high-strength steel, we found through the analysis of their thermal conductivity that elements with valence electron structures different from that of Fe, such as Al, W, Ti, Nb, and Mo, decrease the thermal conductivity of the Fe matrix to a greater extent.

5. Conclusions

The κL and κe of dilute Fe–X (X = Al, Co, Cr, Mn, Mo, Nb, Ni, Ti, V, and W) binary alloys were predicted separately. τe was estimated using a semi-empirical method, which provides a reliable trend of transport properties in terms of temperature and alloying elements. It is evident that the doping of Ni and Cr can endow iron with κe values of 24.9 and 25.7 W/m·K, respectively, at 1200 K. This indicates that Ni and Cr can increase the κe of the matrix, whereas the other elements decrease κe by 60–80%. In this study, the lattice thermal conductivity of iron-based alloys was calculated based on the elasticity and the results obtained via the Slack model. To accurately determine the contribution of lattice thermal conductivity to the total thermal conductivity of the major elements Ni and Co in high-strength steels, we obtained the second- and third-order force constants and the lattice thermal conductivity of Fe15Ni, Fe15Co, and pure iron via the ShengBTE code. The results show that the contribution of lattice thermal conductivity to the total thermal conductivity is small at high temperatures and that the Slack model demonstrates a larger error in the prediction for the fcc high-temperature phase. Finally, we calculated κtotal from κL and κe and investigated Δκi, which is the change in the thermal conductivity with respect to κ0 owing to alloying element i. From Δκi, we found that elements such as Al, W, Ti, Nb, and Mo significantly decrease the thermal conductivity of the iron matrix owing to the considerable difference in their valence electron structures compared with that of iron.

Supplementary Materials

The following are available online at https://www.mdpi.com/article/10.3390/met11121988/s1, Figure S1: Electrical conductivity of bcc Fe15X (X = Ni, Al, Co, Cr, Mn, Mo, Nb, W, Ti, V) in the range of 300–1500 K. Figure S2: Electrical conductivity of fcc Fe15X (X = Ni, Al, Co, Cr, Mn, Mo, Nb, W, Ti, V) in the range of 300–1500 K. Figure S3: Group velocity of bcc Fe15X (X = Ni, Co) and pure iron in the x direction. Figure S4: Group velocity of bcc Fe15X (X = Ni, Co) and pure iron in the y direction. Figure S5: Group velocity of bcc Fe15X (X = Ni, Co) and pure iron in the z direction. Figure S6: Group velocity of fcc Fe15X (X = Ni, Co) and pure iron in the x direction. Figure S7: Group velocity of fcc Fe15X (X = Ni, Co) and pure iron in the y direction. Figure S8: Group velocity of fcc Fe15X (X = Ni, Co) and pure iron in the z direction. Figure S9: Frequency-dependence of three-phonon-scattering phase space of bcc Fe15Co at 300 K for (a) absorption processes, (b) emission processes, and (c) all three-phonon processes. Figure S10: Frequency-dependence of three-phonon-scattering phase space of fcc Fe15Co at 300 K for (a) absorption processes, (b) emission processes, and (c) all three-phonon processes. Figure S11: Frequency-dependence of three-phonon-scattering phase space of bcc iron at 300 K for (a) absorption pro-cesses, (b) emission processes, and (c) all three-phonon processes. Figure S12: Frequency-dependence of three-phonon-scattering phase space of fcc iron at 300 K for (a) absorption pro-cesses, (b) emission processes, and (c) all three-phonon processes. Figure S13: Frequency-dependence of three-phonon-scattering phase space of bcc Fe15Ni at 300 K for (a) absorption processes, (b) emission processes, and (c) all three-phonon processes. Figure S14: Frequency-dependence of three-phonon-scattering phase space of fcc Fe15Ni at 300 K for (a) absorption processes, (b) emission processes, and (c) all three-phonon processes. Table S1: Experimental value used for calculations of electron relaxation time. References [30,31,32,33,34,43,47,50] are cited in the supplementary materials.

Author Contributions

Methodology, Y.L., X.C. and Y.D.; Formal analysis Y.L. and L.X.; Investigation, Y.L.; Writing—Original draft, Y.L.; Conceptualization, X.C.; Supervision, X.C. and Y.Z.; Writing—Review & editing, X.C., J.F. and M.G.; Data curation, Y.D. and L.X.; Validation, Y.Z.; Visualization M.G.; Resources, S.W.; Software, S.W.; Project—Administration, J.F. All authors have read and agreed to the published version of the manuscript.

Funding

This work is supported by the National Natural Science Foundation of China (Nos. 51861018 and 52001150), Youth Project of Yunnan Basic Research Program (No. 202001AU070033), Open Fund of National Joint Engineering Research Center for abrasion control and molding of metal materials (No. HKDNM201904) and Scientific Research Fund of Education Department of Yunnan Province (No. 2019J0031).

Institutional Review Board Statement

Not applicable.

Informed Consent Statement

Not applicable.

Data Availability Statement

The data used to support the findings of this study are available from the corresponding author upon reasonable request.

Conflicts of Interest

The authors declare no conflict of interest.

References

  1. Sperle, J.-O.; Olsson, K. High strength and ultra high strength steels for weight reduction in structural and safety-related applications. In Proceedings of the 29th International Symposium on Automotive Technology and Automation, Florence, Italy, 3–6 June 1996; Volume 1, pp. 115–125. [Google Scholar]
  2. Veerababu, R.; Satya Prasad, K.; Phani, S.K.; Balamuralikrishnan, R.; Karthikeyan, S. Austenite stability and M2C carbide decomposition in experimental secondary hardening ultra-high strength steels during high temperature austenitizing treatments. Mater. Charact. 2018, 144, 191–204. [Google Scholar] [CrossRef]
  3. Jones, W.B.; Swearengen, J.C. Mechanical stability of ultrahigh strength steels. Mater. Sci. Eng. 1979, 41, 225–235. [Google Scholar] [CrossRef]
  4. Ban, H.Y.; Shi, G.; Shi, Y.J.; Wang, Y.Q. Research Progress on the Mechanical Property of High Strength Structural Steels. Adv. Mater. Res. 2011, 250, 640–648. [Google Scholar] [CrossRef]
  5. Thomas, R.L.S.; Li, D.; Gangloff, R.P.; Scully, J.R. Trap-governed hydrogen diffusivity and uptake capacity in ultrahigh-strength AERMET 100 steel. Metall. Mater. Trans. A 2002, 33, 1991–2004. [Google Scholar] [CrossRef]
  6. Bäcklund, N.G. An experimental investigation of the electrical and thermal conductivity of iron and some dilute iron alloys at temperatures above 100°K. J. Phys. Chem. Solids 1961, 20, 1–16. [Google Scholar] [CrossRef]
  7. Zener, C.; Hollomon, J.H. Effect of Strain Rate Upon Plastic Flow of Steel. J. Appl. Phys. 1944, 15, 22–32. [Google Scholar] [CrossRef]
  8. Xi, J.; Long, M.; Tang, L.; Wang, D.; Shuai, Z. First-principles prediction of charge mobility in carbon and organic nanomaterials. Nanoscale 2012, 4, 4348–4369. [Google Scholar] [CrossRef]
  9. Meyers, M.A.; Xu, Y.B.; Xue, Q.; Pérez-Prado, M.T.; McNelley, T.R. Microstructural evolution in adiabatic shear localization in stainless steel. Acta Mater. 2003, 51, 1307–1325. [Google Scholar] [CrossRef]
  10. Lee, S.; Cho, K.; Lee, C.; Choo, W. Microstructural study of adiabatic shear band formed by ballistic impact in an HY-100 steel. Metall. Trans. A 1993, 24, 2217–2224. [Google Scholar] [CrossRef]
  11. Rogers, H. Adiabatic Plastic Deformation. Annu. Rev. Mater. Sci. 2003, 9, 283–311. [Google Scholar] [CrossRef]
  12. Walley, S.M. Shear Localization: A Historical Overview. Metall. Mater. Trans. A 2007, 38, 2629–2654. [Google Scholar] [CrossRef]
  13. Yan, N.; Li, Z.; Xu, Y.; Meyers, M.A. Shear localization in metallic materials at high strain rates. Prog. Mater. Sci. 2020, 119, 100755. [Google Scholar] [CrossRef]
  14. Baik, S.-I.; Gupta, R.K.; Kumar, K.S.; Seidman, D.N. Temperature increases and thermoplastic microstructural evolution in adiabatic shear bands in a high-strength and high-toughness 10 wt.% Ni steel. Acta Mater. 2021, 205, 116568. [Google Scholar] [CrossRef]
  15. Zheng, X.; Cahill, D.; Krasnochtchekov, P.; Averback, R.; Zhao, J. High-throughput thermal conductivity measurements of nickel solid solutions and the applicability of the Wiedemann–Franz law. Acta Mater. 2007, 55, 5177–5185. [Google Scholar] [CrossRef]
  16. Yu, W.; Zhou, Y.; Chong, X.; Wei, Y.; Hu, C.; Zhang, A.; Feng, J. Investigation on elastic properties and electronic structure of dilute Ir-based alloys by first-principles calculations. J. Alloys Compd. 2021, 850, 156548. [Google Scholar] [CrossRef]
  17. Chong, X.; Hu, M.; Wu, P.; Shan, Q.; Jiang, Y.; Li, Z.; Feng, J. Tailoring the anisotropic mechanical properties of hexagonal M7X3 (M = Fe, Cr, W, Mo; X = C, B) by multialloying. Acta Mater. 2019, 169, 193–208. [Google Scholar] [CrossRef]
  18. Das, A.; Kumar, A.; Banerji, P. First principles study of electronic structure and thermoelectric transport in tin selenide and phase separated tin selenide-copper selenide alloy. J. Phys. Condens. Matter 2020, 32, 265501. [Google Scholar] [CrossRef]
  19. Tong, Z.; Bao, H. Decompose the electron and phonon thermal transport of intermetallic compounds NiAl and Ni3Al by first-principles calculations. Int. J. Heat Mass Transf. 2018, 117, 972–977. [Google Scholar] [CrossRef]
  20. Ding, Y.; Xiao, B.; Tang, G.; Hong, J. Transport Properties and High Thermopower of SnSe2: A Full Ab-Initio Investigation. J. Phys. Chem. C 2016, 121, 225–236. [Google Scholar] [CrossRef]
  21. Blochl, P.E. Projector augmented-wave method. Phys. Rev. B Condens. Matter 1994, 50, 17953–17979. [Google Scholar] [CrossRef] [PubMed] [Green Version]
  22. Kresse, G.; Joubert, D. From Ultrasoft Pseudopotentials to the Projector Augmented-Wave Method. Phys. Rev. B 1999, 59, 1758. [Google Scholar] [CrossRef]
  23. Kresse, G.; Furthmüller, J. Efficiency of ab-initio total energy calculations for metals and semiconductors using a plane-wave basis set. Comput. Mater. Sci. 1996, 6, 15–50. [Google Scholar] [CrossRef]
  24. Chong, X.; Paz Soldan Palma, J.; Wang, Y.; Shang, S.-L.; Drymiotis, F.; Ravi, V.; Star, K.; Fleurial, J.-P.; Liu, Z.-K. Thermodynamic properties of the Yb-Sb system predicted from first-principles calculations. Acta Mater. 2021, 217, 117169. [Google Scholar] [CrossRef]
  25. Wang, V.; Xu, N.; Liu, J.; Tang, G.; Geng, W. VASPKIT: A User-friendly Interface Facilitating High-throughput Computing and Analysis Using VASP Code. Comput. Phys. Commun. 2019, 267, 108033. [Google Scholar] [CrossRef]
  26. Madsen, G.K.H.; Singh, D.J. BoltzTraP. A code for calculating band-structure dependent quantities. Comput. Phys. Commun. 2006, 175, 67–71. [Google Scholar] [CrossRef] [Green Version]
  27. Li, W.; Carrete, J.; Katcho, N.A.; Mingo, N. ShengBTE: A solver of the Boltzmann transport equation for phonons. Comput. Phys. Commun. 2014, 185, 1747–1758. [Google Scholar] [CrossRef]
  28. Shea, J.J. Smithells Metal Reference Book, 8th ed.; Institute of Electrical and Electronics Engineers: Piscataway, NJ, USA, 2005. [Google Scholar]
  29. Togo, A.; Tanaka, I. First principles phonon calculations in materials science. Scr. Mater. 2015, 108, 1–5. [Google Scholar] [CrossRef] [Green Version]
  30. Ahmad, S.; Mahanti, S.D. Energy and temperature dependence of relaxation time and Wiedemann-Franz law on PbTe. Phys. Rev. B 2010, 81, 165203. [Google Scholar] [CrossRef]
  31. Choi, G.; Kim, H.S.; Lee, K.; Park, S.H.; Cha, J.; Chung, I.; Lee, W.B. Study on thermal conductivity and electrical resistivity of Al-Cu alloys obtained by Boltzmann transport equation and first-principles simulation: Semi-empirical approach. J. Alloys Compd. 2017, 727, 1237–1242. [Google Scholar] [CrossRef]
  32. Zhang, C.; Lin, J.F.; Liu, Y.; Feng, S.; Jin, C.; Hou, M.; Yoshino, T. Electrical Resistivity of Fe-C Alloy at High Pressure: Effects of Carbon as a Light Element on the Thermal Conductivity of the Earth’s Core. J. Geophys. Res. Solid Earth 2018, 123, 3564–3577. [Google Scholar] [CrossRef]
  33. Rossiter, P.L. Order-disorder and the electrical resistivity of FeCo. J. Phys. F Met. Phys. 1981, 11, 615–621. [Google Scholar] [CrossRef]
  34. Ingersoll, L.R. Some Physical Properties of Nickel-Iron Alloys. Phys. Rev. 1920, 16, 126–132. [Google Scholar] [CrossRef]
  35. Mermin, N.D. Lindhard Dielectric Function in the Relaxation-Time Approximation. Phys. Rev. B 1970, 1, 2362–2363. [Google Scholar] [CrossRef]
  36. D’Humieres, D.; Ginzburg, I.; Krafczyk, M.; Lallemand, P.; Luo, L.S. Multiple-relaxation-time lattice Boltzmann models in three dimensions. Philos. Trans. R. Soc. Lond. Ser. A Math. Phys. Eng. Sci. 2002, 360, 437–451. [Google Scholar] [CrossRef]
  37. Chester, G.V.; Thellung, A. The Law of Wiedemann and Franz. Proc. Phys. Soc. 1961, 77, 1005–1013. [Google Scholar] [CrossRef]
  38. Kim, H.-S.; Gibbs, Z.M.; Tang, Y.; Wang, H.; Snyder, G.J. Characterization of Lorenz number with Seebeck coefficient measurement. APL Mater. 2015, 3, 041506. [Google Scholar] [CrossRef] [Green Version]
  39. Marzo, A.; Trigo-Gonzalez, M.; Alonso-Montesinos, J.; Martínez-Durbán, M.; López, G.; Ferrada, P.; Fuentealba, E.; Cortés, M.; Batlles, F.J. Daily global solar radiation estimation in desert areas using daily extreme temperatures and extraterrestrial radiation. Renew. Energy 2017, 113, 303–311. [Google Scholar] [CrossRef]
  40. Slack, G.A. The Thermal Conductivity of Nonmetallic Crystals. J. Phys. C Solid State Phys. 1979, 34, 1–71. [Google Scholar]
  41. Wu, Y.Y.; Zhu, X.L.; Yang, H.Y.; Wang, Z.G.; Li, Y.H.; Wang, B.T. First principles calculations on the thermoelectric properties of bulk Au2S with ultra-low lattice thermal conductivity. Chin. Phys. B 2020, 29, 087202. [Google Scholar] [CrossRef]
  42. Wen, S.; Ma, J.; Kundu, A.; Li, W. Large lattice thermal conductivity, interplay between phonon-phonon, phonon-electron, and phonon-isotope scatterings, and electrical transport in molybdenum from first principles. Phys. Rev. B 2020, 102, 064303. [Google Scholar] [CrossRef]
  43. Fulkerson, W.; Moore, J.P.; McElroy, D.L. Comparison of the Thermal Conductivity, Electrical Resistivity, and Seebeck Coefficient of a High-Purity Iron and an Armco Iron to 1000 °C. J. Appl. Phys. 1966, 37, 2639–2653. [Google Scholar] [CrossRef]
  44. Powell, R. Further Measurements of Thermal and Electrical Conductivity of Iron at High Temperatures. Proc. Phys. Soc. 2002, 51, 407. [Google Scholar] [CrossRef]
  45. Ghosh, G.; Olson, G. The isotropic shear modulus of multicomponent Fe-base solid solutions. Acta Mater. 2002, 50, 2655–2675. [Google Scholar] [CrossRef]
  46. Adams, J.; Agosta, D.; Leisure, R.; Ledbetter, H. Elastic constants of monocrystal iron from 3 to 500 K. J. Appl. Phys. 2007, 100, 113530. [Google Scholar] [CrossRef]
  47. Peet, M.J.; Hasan, H.S.; Bhadeshia, H.K.D.H. Prediction of thermal conductivity of steel. Int. J. Heat Mass Transf. 2011, 54, 2602–2608. [Google Scholar] [CrossRef] [Green Version]
  48. Liu, Z.-K. Computational thermodynamics and its applications. Acta Mater. 2020, 200, 745–792. [Google Scholar] [CrossRef]
  49. Liu, Z.-K. First-Principles Calculations and CALPHAD Modeling of Thermodynamics. J. Phase Equilibria Diffus. 2009, 30, 517–534. [Google Scholar] [CrossRef]
  50. Ho, C.Y.; Ackerman, M.W.; Wu, K.Y.; Havill, T.N.; Bogaard, R.H.; Matula, R.A.; Oh, S.G.; James, H.M. Electrical Resistivity of Ten Selected Binary Alloy Systems. J. Phys. Chem. Ref. Data 1983, 12, 183–322. [Google Scholar] [CrossRef] [Green Version]
Figure 1. Workflow for calculation of thermal conductivity of alloys by first-principles calculations.
Metals 11 01988 g001
Figure 2. Relaxation time for calculating electrical thermal conductivity of bcc-Fe and fcc-Fe based alloy in the temperature range of 300–1500 K.
Metals 11 01988 g002
Figure 3. Electronic thermal conductivity of bcc-Fe and fcc-Fe based alloys in the temperature range of 300–1500 K with different electron concentration.
Metals 11 01988 g003
Figure 4. The phonon spectrum and density of states of the bcc-Fe and fcc-Fe based alloy.
Metals 11 01988 g004
Figure 5. Three-phonon relaxation time of each phonon branch as a function of frequency for bcc-Fe and fcc-Fe based alloys.
Metals 11 01988 g005
Figure 6. Elastic properties of bcc-Fe and fcc-Fe based alloys at 0 K, (a,b) is the elastic constant; (c,d) is the elastic modulus.
Metals 11 01988 g006
Figure 7. Calculated lattice thermal conductivity by shengBTE code and Slack model of iron alloy doped Ni and Co in different crystal structure: (a) bcc-Fe alloy; (b) fcc-Fe alloy in the temperature range of 300–1500 K.
Metals 11 01988 g007
Figure 8. Lattice thermal conductivity of iron alloy in different crystal structure: (a) bcc-Fe alloy; (b) fcc-Fe alloy in the temperature range of 300–1500 K.
Metals 11 01988 g008
Figure 9. Total thermal conductivity of bcc-Fe and fcc-Fe based alloys, where the lattice thermal conductivity is obtained by both ShengBTE and Slack model in the temperature range of 300–1500 K with different electron concentration.
Metals 11 01988 g009
Figure 10. Total thermal conductivity of bcc-Fe and fcc-Fe based alloys, where the lattice thermal conductivity is obtained by Slack model in the temperature range of 300–1500 K with different electron concentration.
Metals 11 01988 g010
Figure 11. Reduction of thermal conductivity with the concentration of alloying elements increasing.
Metals 11 01988 g011
Table 1. Calculated elastic properties of bcc-Fe and fcc-Fe based alloys and Poisson’s ratio.
StructureC11 (GPa)C12 (Gpa)C44 (GPa)B/G (GPa)E (GPa)ν
bcc-Fe15Ni290.0180.9139.82.27250.60.308
bcc-Fe15Co336.9183.6140.42.13285.70.297
bcc-Fe279.8177.0124.62.42230.40.318
bcc-Fe a233.1135.4117.82.1208
bcc-Fe15Mn441.5213.8113.12.51297.10.324
bcc-Fe15Cr323.5181.1143.92.11281.10.295
bcc-Fe15V324.7173.0139.32.05281.60.290
bcc-Fe15Mo330.2192.6136.32.30271.40.310
bcc-Fe15W309.1174.9119.22.32248.10.312
bcc-Fe15Al237.1127.1113.11.82227.90.268
bcc-Fe15Nb397.7210.694.62.85247.40.343
bcc-Fe15Ti395.0206.692.72.80246.00.340
fcc-Fe15Ni392.9179.8217.51.49416.90.226
fcc-Fe15Co397.6177.1219.81.54406.30.234
fcc-Fe401.9179.9222.11.54410.40.233
fcc-Fe15Mn399.0185.2216.61.60402.60.242
fcc-Fe15Cr401.2199.5211.91.69394.70.252
fcc-Fe15V411.0202.2212.61.73395.90.258
fcc-Fe15Mo440.1221.5221.51.78420.40.263
fcc-Fe15W449.8227.7230.31.90407.10.276
fcc-Fe15Al399.3197.0218.11.68395.80.251
fcc-Fe15Nb438.8225.0220.81.83391.10.269
fcc-Fe15Ti411.0208.6210.21.91370.40.277
a Experimental values of bcc-Fe at 300 K [41,42,43].
Table 2. Calculated Debye temperature of bcc-Fe and fcc-Fe based alloys.
Debye Temperature (K)
Fe15NiFe15CoFeFe15MnFe15CrFe15VFe15MoFe15WFe15AlFe15NbFe15Ti
bcc498533477540532534510466490483494
fcc657647651644637639643603649638617
Table 3. The change of thermal conductivity due to alloying element (Δκi).
Ni aCo aMn aCr aV aMo aW aAl aNb aTi aNi bCo b
bcc10.846.808.178.919.4010.646.0610.768.789.896.447.29
fcc8.533.316.912.367.719.745.429.937.059.053.144.87
a Electrons + Slack model. b Electrons + ShengBTE.
Publisher’s Note: MDPI stays neutral with regard to jurisdictional claims in published maps and institutional affiliations.

