Article

Improvement of Shape Error for Slender Parts in Cylindrical Traverse Grinding by Part-Deformation Modelling and Compensation

1
IDEKO, Member of Basque Research and Technology Alliance, Arriaga Kalea 2, 20870 Elgoibar, Spain
2
Department of Mechanical Engineering, University of the Basque Country UPV/EHU, Plaza Torres Quevedo 1, 48013 Bilbao, Spain
*
Author to whom correspondence should be addressed.
Metals 2021, 11(12), 1990; https://doi.org/10.3390/met11121990
Submission received: 22 October 2021 / Revised: 30 November 2021 / Accepted: 5 December 2021 / Published: 9 December 2021
(This article belongs to the Special Issue Study of Grinding Processes for Metals and Alloys)

Abstract

:
Achieving geometrical accuracy in cylindrical traverse grinding for high-aspect slender parts is still a challenge due to the flexibility of the workpiece and, therefore, the resulting shape error. This causes a bottleneck in production due to the number of spark-out strokes that must be programmed to achieve the expected dimensional and geometrical tolerances. This study presents an experimental validation of a shape-error prediction model in which a distributed load, corresponding to the grinding wheel width, is included, and allows inclusion of the effect of steady rests. Headstock and tailstock stiffness must be considered and a procedure to obtain their values is presented. Validation of the model was performed both theoretically (by comparing with FEM results) and experimentally (by comparing with the deformation profile of the real workpiece shape), obtaining differences below 5%. Having determined the shape error by monitoring the normal grinding force, a solution was presented to correct it, based on a cross-motion of the grinding wheel during traverse strokes, thus decreasing non-productive spark-out strokes. Due to its simplicity (based on the shape-error prediction model and normal grinding force monitoring), this was easily automatable. The corrective compensation cycle gave promising results with a decrease of 77% in the shape error of the ground part, and improvement in geometrically measured parameters, such as cylindricity and straightness.

1. Introduction

Grinding is an abrasive machining process carried out in the last step of manufacturing due to its capability to obtain smooth surfaces and precise geometrical tolerances. Traverse grinding is an extended type of the cylindrical grinding process used for parts such as electric motor shafts, pneumatic cylinders and hydraulic cylinders and is based on the kinematics of plunge grinding with a cross-feed motion parallel to the workpiece axis. This process comes with several non-controlled variables that change during the operation, producing defects in the workpiece topography [1], including shape errors [1] and chatter [1,2,3]. This study is focused on the shape error of slender parts because shape form for these parts must be very accurate. For this purpose, the grinding machine’s structural stiffness must be very high because the system flexibility will determine the part’s geometrical accuracy. The forces produced in the contact between tool and workpiece generate relative displacements between them, affecting the workpiece geometry [4]. In the case of slender parts, the main stiffness problem is with the part itself, due to its high flexibility (which varies depending on its geometry along its length). Although, for slender parts, the part itself is the least rigid element of the system, system stiffness and headstock-center eccentricity must be considered to determine the shape error in slender parts [5]. Several studies have demonstrated that the main cause of workpiece deformation during the traverse grinding cycle is the normal force [6,7]. The grinding wheel pushes the workpiece, and the part is not ground to the required diameter because of its elastic deformation, so the material removal rate decreases at the point where the flexibility is the highest [8]. A representative scheme of this process is shown in Figure 1a, where vt is the traverse speed, Ft is the tangential or axial force, and Fn is the radial or normal force. Shape error is presented in Figure 1b, where tolerances of diameter dimension, straightness, or cylindricity can be out of order. In other machining processes, such as turning, where the machine configuration is based on a cross-slide, a follower rest is a comprehensive solution for avoiding slender-part deformation [9]. Nonetheless, in a machine configuration where the table is movable, a follower rest is not viable due to its complexity. In a movable-table machine configuration, the element that significantly controls the deformation of the workpiece is the steady rest.
This geometrical issue comes with a poor productivity index because the shape error must be corrected in the spark-out due to the shape quality requirements for ground workpieces. Depending on the shape-error magnitude, the number of spark-out strokes can be excessive and, in the case of slender workpieces, the wheel must translate long distances end-to-end, which involves an increase in machining time.
Some research has been conducted to clarify and predict the deformation behavior of slender parts during the traverse grinding process, based on the radial force induced by the wheel pushing the workpiece, both in external [7,10] and internal [11] grinding processes. Having presented the prediction model, various solutions have been described to minimize the predicted shape error. Intelligent artificial monitoring of the traverse operation has been developed to correct the shape error, by stabilizing the motion trajectory of the grinding wheel [1]. High-frequency oscillations are induced in the radial depth of the wheel in the workpiece. Modifying wheel transversal speed along the workpiece is another technique [6] that has been proposed for turning operations [12]. Due to a decrease in the zone of the workpiece, where the stiffness is most critical, the normal forces decrease, thus decreasing the shape error. Ding et al. [13] presented an intelligent optimization control for the shape-error correction by varying the transversal speed, as reported by Onishi et al. [6]. Based on the elastic deformation equation, variation in the traverse speed and workpiece speed were combined to optimally affect the normal force, and therefore the real depth of cut, decreasing the shape error. Automation for this solution is complicated, particularly as with a different transversal speed, topography and geometric parameters will change throughout the length of the workpiece. The same approach was presented by Fujii et al. [14], but also took into consideration the use of steady rest, which leads to a more expensive- and difficult-to-set-up solution.
In this paper, a new model is presented to simplify the prediction of the shape error in a traverse grinding operation for long slender parts. The effect of steady rests on the deformation of the workpiece can be considered if required by the application. The position and the number of steady rests are considered, along with a proposal for the optimal position of the steady rests. This model is based on the computer simulation of the deformation of slender multi-diameter rollers developed by Gao [10]; in this case, the model required normal-force data as an input. Other variables were analyzed, such as center eccentricity [1]. However, the main reason for observing the shape error of the part during traverse grinding operations is the elastic deformation of the workpiece due to grinding normal force [6,7]. Thus, the depth of cut is affected due to the deflection of the workpiece, and this varies along the length of the ground workpiece. The present experimental study examines slender parts in the traverse grinding cycle without steady rests to validate the estimation of the shape error based on grinding normal force. Stiffness of headstock and tailstock was measured and considered within the model. An improvement was included by also considering a distributed load, corresponding to the grinding wheel width. A solution for correcting the shape error based on the normal grinding force was then presented by applying a cross-compensation of the grinding-wheel trajectory based on the part deformation predicted by the model. Automating this solution is easy because the only variable input needed from the process is the normal force, which can be readily measured. Thus, more complicated solutions based on steady rests can be avoided. This automatization will reduce excessive machine times due to the number of spark-outs needed to correct the shape error produced in the workpiece.

2. Theoretical Approach

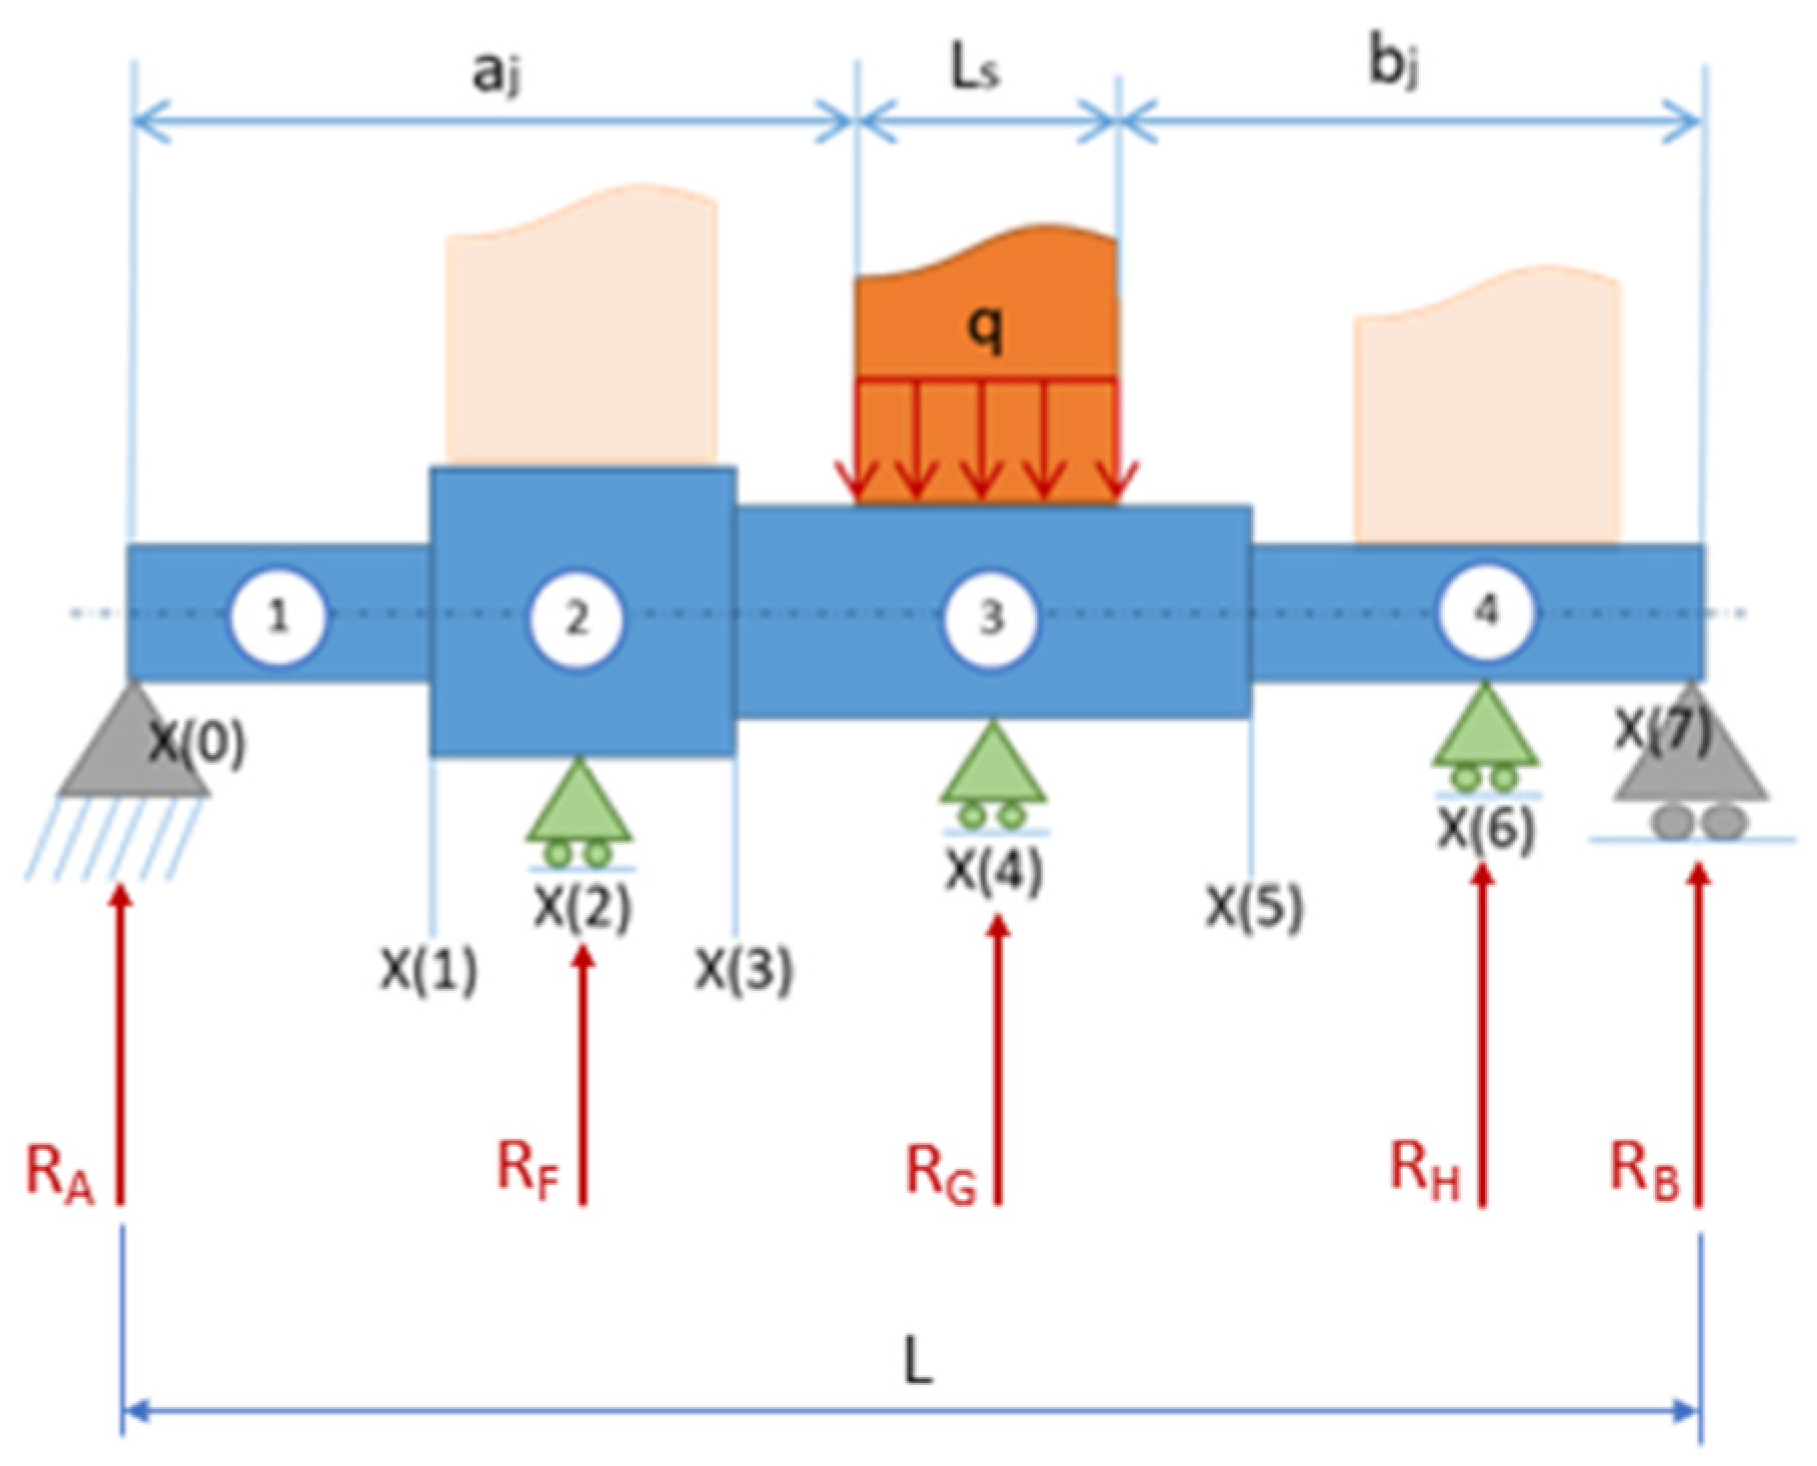
Based on previous work by Gao et al. [10], a theoretical approach for the prediction of shape error in traverse grinding is presented. The case study for the model was based on a multi-diameter part, with various diameters and lengths divided into four different sections. The part was clamped between two points; point A was a static support, and B a movable support. A distributed load, q, was applied in a length, Ls, corresponding to the grinding wheel width. In this paper, q is considered as a distributed force. However, Gao et al. [10] considered the grinding force to be punctual. Therefore, the expression for the distributed load, without considering steady rests, is presented in this study.
X [ i 1 ] x X [ i ]     E I [ i ] y = q ( L a j ) 2 x 2 L                   for   i = 1 ,   2 ,   3
X [ i 1 ] x X [ i ]     E I [ i ] y = q ( L a j ) 2 x L + q ( x a j ) 2 2                 for   i = 4 ,   5
where E is the elasticity modulus of the material, I is the inertial moment point for the described section, L is the workpiece length, aj is the distance between the static support A and the distributed load q.
The model allowed for the introduction of steady rests into the system. In the case study, three steady rests were distributed between diameters 2, 3, and 4. A scheme is presented in Figure 2, including the support reactions. Finally, the system was divided into the study of each reaction produced by the steady rests.
First, every isostatic case, produced by every support and force, was solved, considering q, RF (reaction of the steady rest in the second diameter), RG (reaction of the steady rest in the third diameter), and RH (reaction of the steady rest in the fourth diameter). Bj is the distance between the movable support and the distributed load, q. RA is the static support reaction (headstock), and RB is the movable support reaction (tailstock). A and B support reactions were calculated, and the horizontal component for the A reaction was zero.
R A = R F b 1 L
R B = R F a 1 L
Applying the general elastic equation for each section, the following two expressions were obtained: (5) for the section in front of the load and (6) for the section behind the load.
E I [ i ] y 1 = R F b 1 x L
E I [ i ] y 2 = R F b 1 x L + R F ( x a 1 )
Integrating twice:
E I [ i ] y 1 = R F b 1 x 3 6 L + C 1 F [ i ] x + C 2 F [ i ]                 for   i = 1 ,   2
E I [ i ] y 2 = R F b 1 x 3 6 L + R F ( x a 1 ) 3 6 + C 1 F [ i ] x + C 2 F [ i ]         for   i = 3 ,   4 ,   5 ,   6 ,   7
Fourteen integration constants needed to be calculated (i times for C1 and i times for C2). For calculation of the integration constants, it needed to be assumed that, for every section changing point and every load application point, the derivation of the deformation must be the same for both sections:
y ( X [ i ] ) = y ( X [ i ] )     C 1 F [ i ] I [ i ] = R F K [ i ] + C 1 F [ i + 1 ] I [ i + 1 ]                 for   i = 1 ,   2 ,   3 ,   4 ,   5 ,   6 ,   7
K is dependent on whether the section is in front (10) or behind (11) the load application point.
K [ i ] = b 1 X 2 [ i ] 2 L ( 1 I [ i + 1 ] 1 I [ i ] )         for   i = 1 ,   2
K [ i ] = ( b 1 X 2 [ i ] 2 L ( X [ i ] a 1 ) 2 2 ) ( 1 I [ i + 1 ] 1 I [ i ] )         for   i = 3 ,   4 ,   5 ,   6 ,   7
For each section changing point and every load application point, the deformation must be the same for both sections:
( X [ i ] ) = y ( X [ i ] )       C 2 F [ i ] I [ i ] = X [ i ] R F ( C 1 F [ i + 1 ] I [ i + 1 ] C 1 F [ i ] I [ i ] ) + R F K 1 [ i ] + C 2 F [ i + 1 ] I [ i + 1 ]
K1 is dependent on whether the section is in front (13) or behind (14) the load application point:
K 1 [ i ] = b 1 X 3 [ i ] 6 L ( C 1 F [ i + 1 ] I [ i + 1 ] 1 I [ i ] )         for   i 1 ,   2
K 1 [ i ] = ( b 1 X 3 [ i ] 6 L ( X [ i ] a 1 ) 3 6 ) ( 1 I [ i + 1 ] 1 I [ i ] )         for   i = 3 ,   4 ,   5 ,   6 ,   7
Boundary conditions were applied:
x = 0 { y AC ( 0 ) = R A K A = R F b 1 L K A y 1 ( 0 ) = R F b 1 6 L 0 3 + C 1 F [ 1 ] 0 + C 2 F [ 1 ] E I [ 1 ] } C 2 F [ 1 ] = R F b 1 E I [ 1 ] L K A
x = L { y DB ( L ) = R B K B = R F a 1 L K B y DB ( L ) = R F a 1 6 L L 3 R F 6 ( L a 1 ) 3 + C 1 F [ 7 ] L + C 2 F [ 7 ] E I [ 7 ] }     C 1 F [ 7 ] = R F a 1 E I [ 7 ] L K B R F a 1 6 L L 3 + R F ( L a 1 ) 6 C 2 F [ 7 ] L
Resolution of the linear equation system was carried out:
C 2 F [ 1 ] = R F b 1 E I [ 1 ] L K A
C 2 F [ i ] = I [ i ] ( C 2 F [ i 1 ] I [ i 1 ] K 1 [ i 1 ] + K [ i 1 ] X [ i 1 ] )         for   i = 2 ,   3 ,   4 ,   5 ,   6 ,   7
C 1 F [ 7 ] = ( E I [ 7 ] a 1 / ( L K A ) ) ( b 1 L 3 / ( 6 L ) ) + ( ( L a 1 ) 3 / 6 ) C 2 F [ 7 ] L
C 1 F [ i ] = I [ i ] ( K [ i ] + C 1 F [ i + 1 ] I [ i + 1 ] )         for   i = 6 ,   5 ,   4 ,   3 ,   2 ,   1
For calculation of the integration constants of the reactions produced by the steady rest in the third diameter (RG) and fourth diameter (RH), the same calculation must be made as for that of the second diameter steady rest reaction (RF).
For the solution of the hyperstatic system, three compatibility equations and the degree of system hyperstaticity were considered. The compatibility equation for the deformation in the steady rest application point F is as follows:
δ F = δ F q + δ F R F + δ F R G + δ F R H = R F K F
The following terms comprise the compatibility equation:
δ F q = y r e s u l t a n t ( x = a 1 )
δ F R F = y 11 ( x = a 1 ) = R F b 1 a 1 3 6 L E I [ i F ] + R F C 1 F [ i F ] a 1 + R F C 2 F [ i F ]
δ F R G = y 12 ( x = a F ) = R G b 2 a 1 3 6 L E I [ i F ] + R G C 1 G [ i F ] a F + R G C 2 G [ i F ]
Replacing each term in the compatibility equation for the F point:
δ F = y r e s u l t a n t ( x = a 1 ) + R F ( b 1 a 1 3 6 L E I [ i F ] + C 1 F [ i F ] a 1 + C 2 F [ i F ] 1 K F ) + R G ( b 2 a 1 3 6 L E I [ i F ] + C 1 G [ i F ] a 1 + C 2 G [ i F ] ) + R H ( b 3 a 1 3 6 L E I [ i F ] + C 1 H [ i F ] a 1 + C 2 H [ i F ] ) = 0
For the deformation due to RG and RH, the same calculation must be made as in the case of the RF reaction. The result is an equation system with three unknowns (RG, RH, and RF):
y r e s u l t a n t ( x = a 1 ) + R F M 11 + R G M 12 + R H M 13 = 0
y r e s u l t a n t ( x = a 2 ) + R F M 21 + R G M 22 + R H M 23 = 0
y r e s u l t a n t ( x = a 3 ) + R F M 31 + R G M 32 + R H M 33 = 0
The equation system can be represented as a matrix:
( M 11 M 12 M 13 M 21 M 22 M 23 M 31 M 32 M 33 ) × ( R F R G R H ) = ( y r e s u l t a n t ( x = a 1 ) y r e s u l t a n t ( x = a 2 ) y r e s u l t a n t ( x = a 3 ) )
This example is applicable for n number of steady rests:
( m 11 m 21 m 12 m 22 m n 1 m n 2 m 1 n m 2 n m n n ) × ( R 1 R 2 R n ) = ( y q ( x = a 1 ) y q ( x = a 2 ) y q ( x = a n ) )
yq is the result of the positive and negative deformation. The expression for the elements of the M matrix is as follows:
m j j = ( b j a j 3 6 L E I [ i j ] + C 1 j [ i j ] a j + C 2 j [ i j ] 1 K j )
m j k = ( b k a j 3 6 L E I [ i j ] + C 1 k [ i j ] a j + C 2 k [ i j ] )
m k j = ( b j a k 3 6 L E I [ i k ] ( a k a j ) 3 6 E I [ i k ] + C 1 j [ i k ] a k + C 2 j [ i k ] )
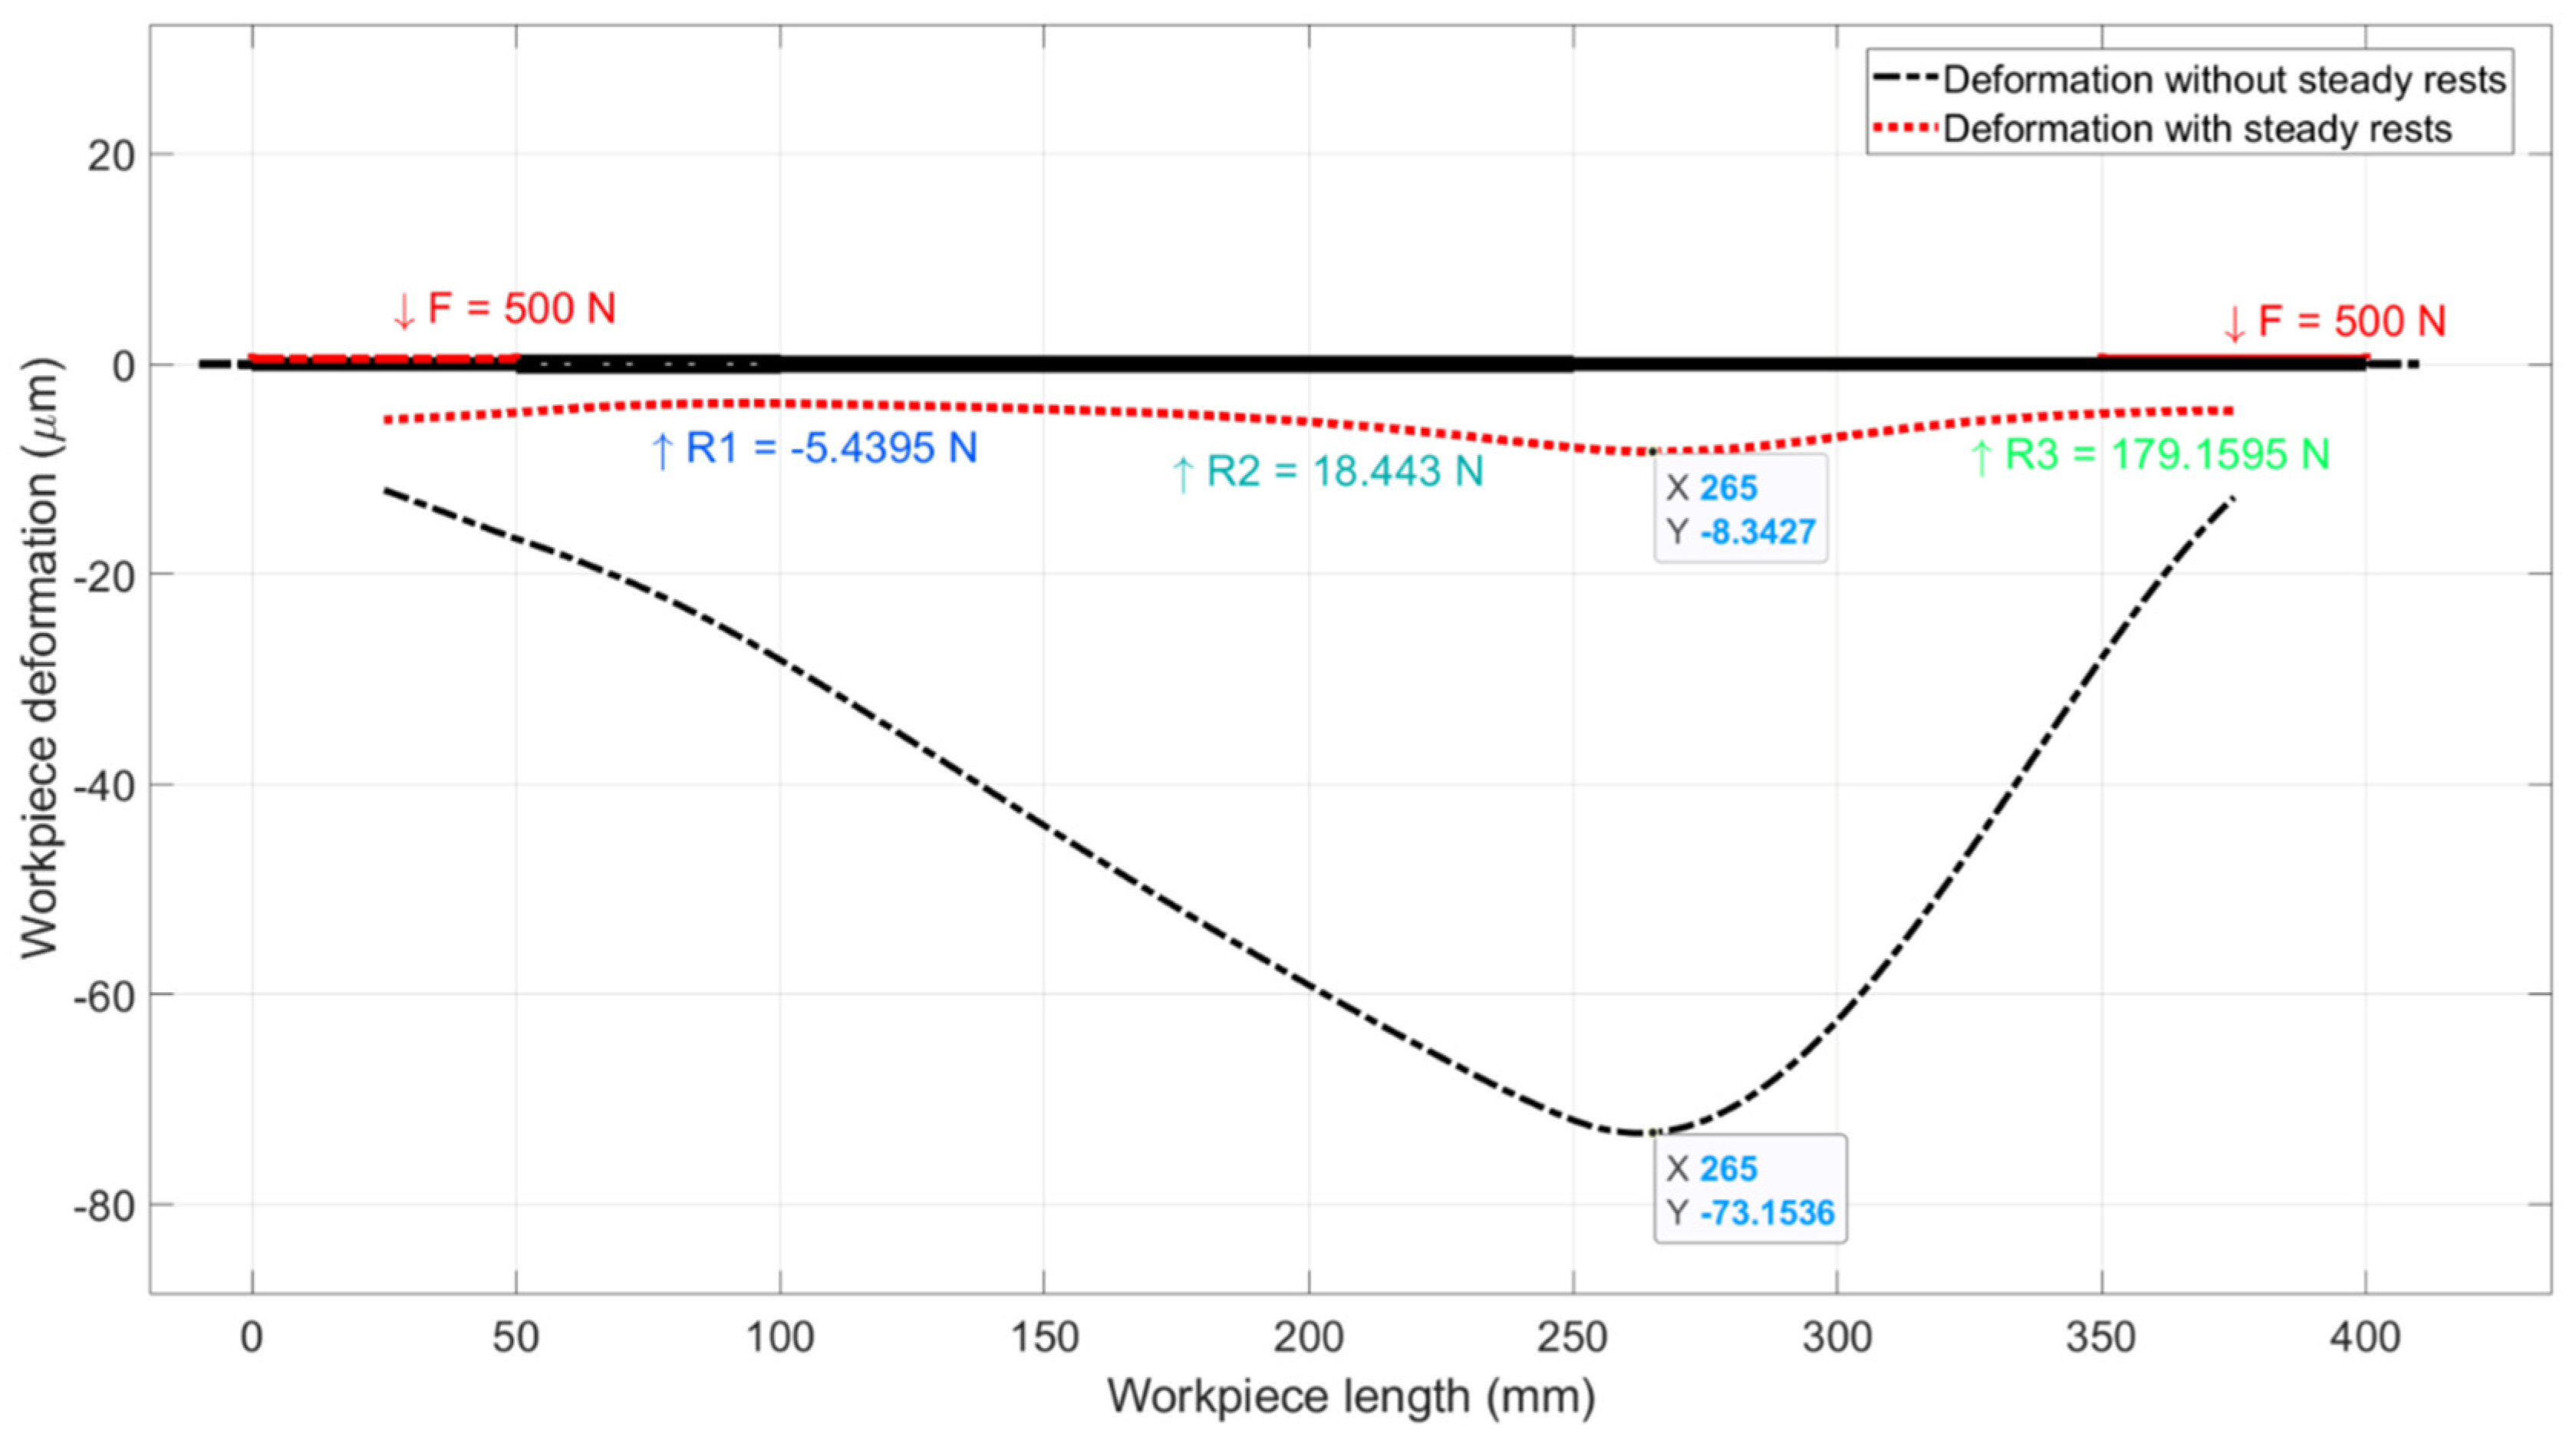
The (30) equation system must be solved following the presented steps to resolve the three unknown reactions. An example of the model output is presented in the Figure 3, where the deformation of the workpiece without steady rests (dotted–dashed line) and with steady rests (dotted line) is shown. The example case was similar to the workpiece and steady rest location shown in Figure 2. Steady rests reduced the deformation of the workpiece from 73.15 µm to 8.343 µm. Table 1 shows the input data used for the model.

3. Results

3.1. Validation of the Theoretical Approach

3.1.1. Validation of the Deformation Prediction Approach with Steady Rests

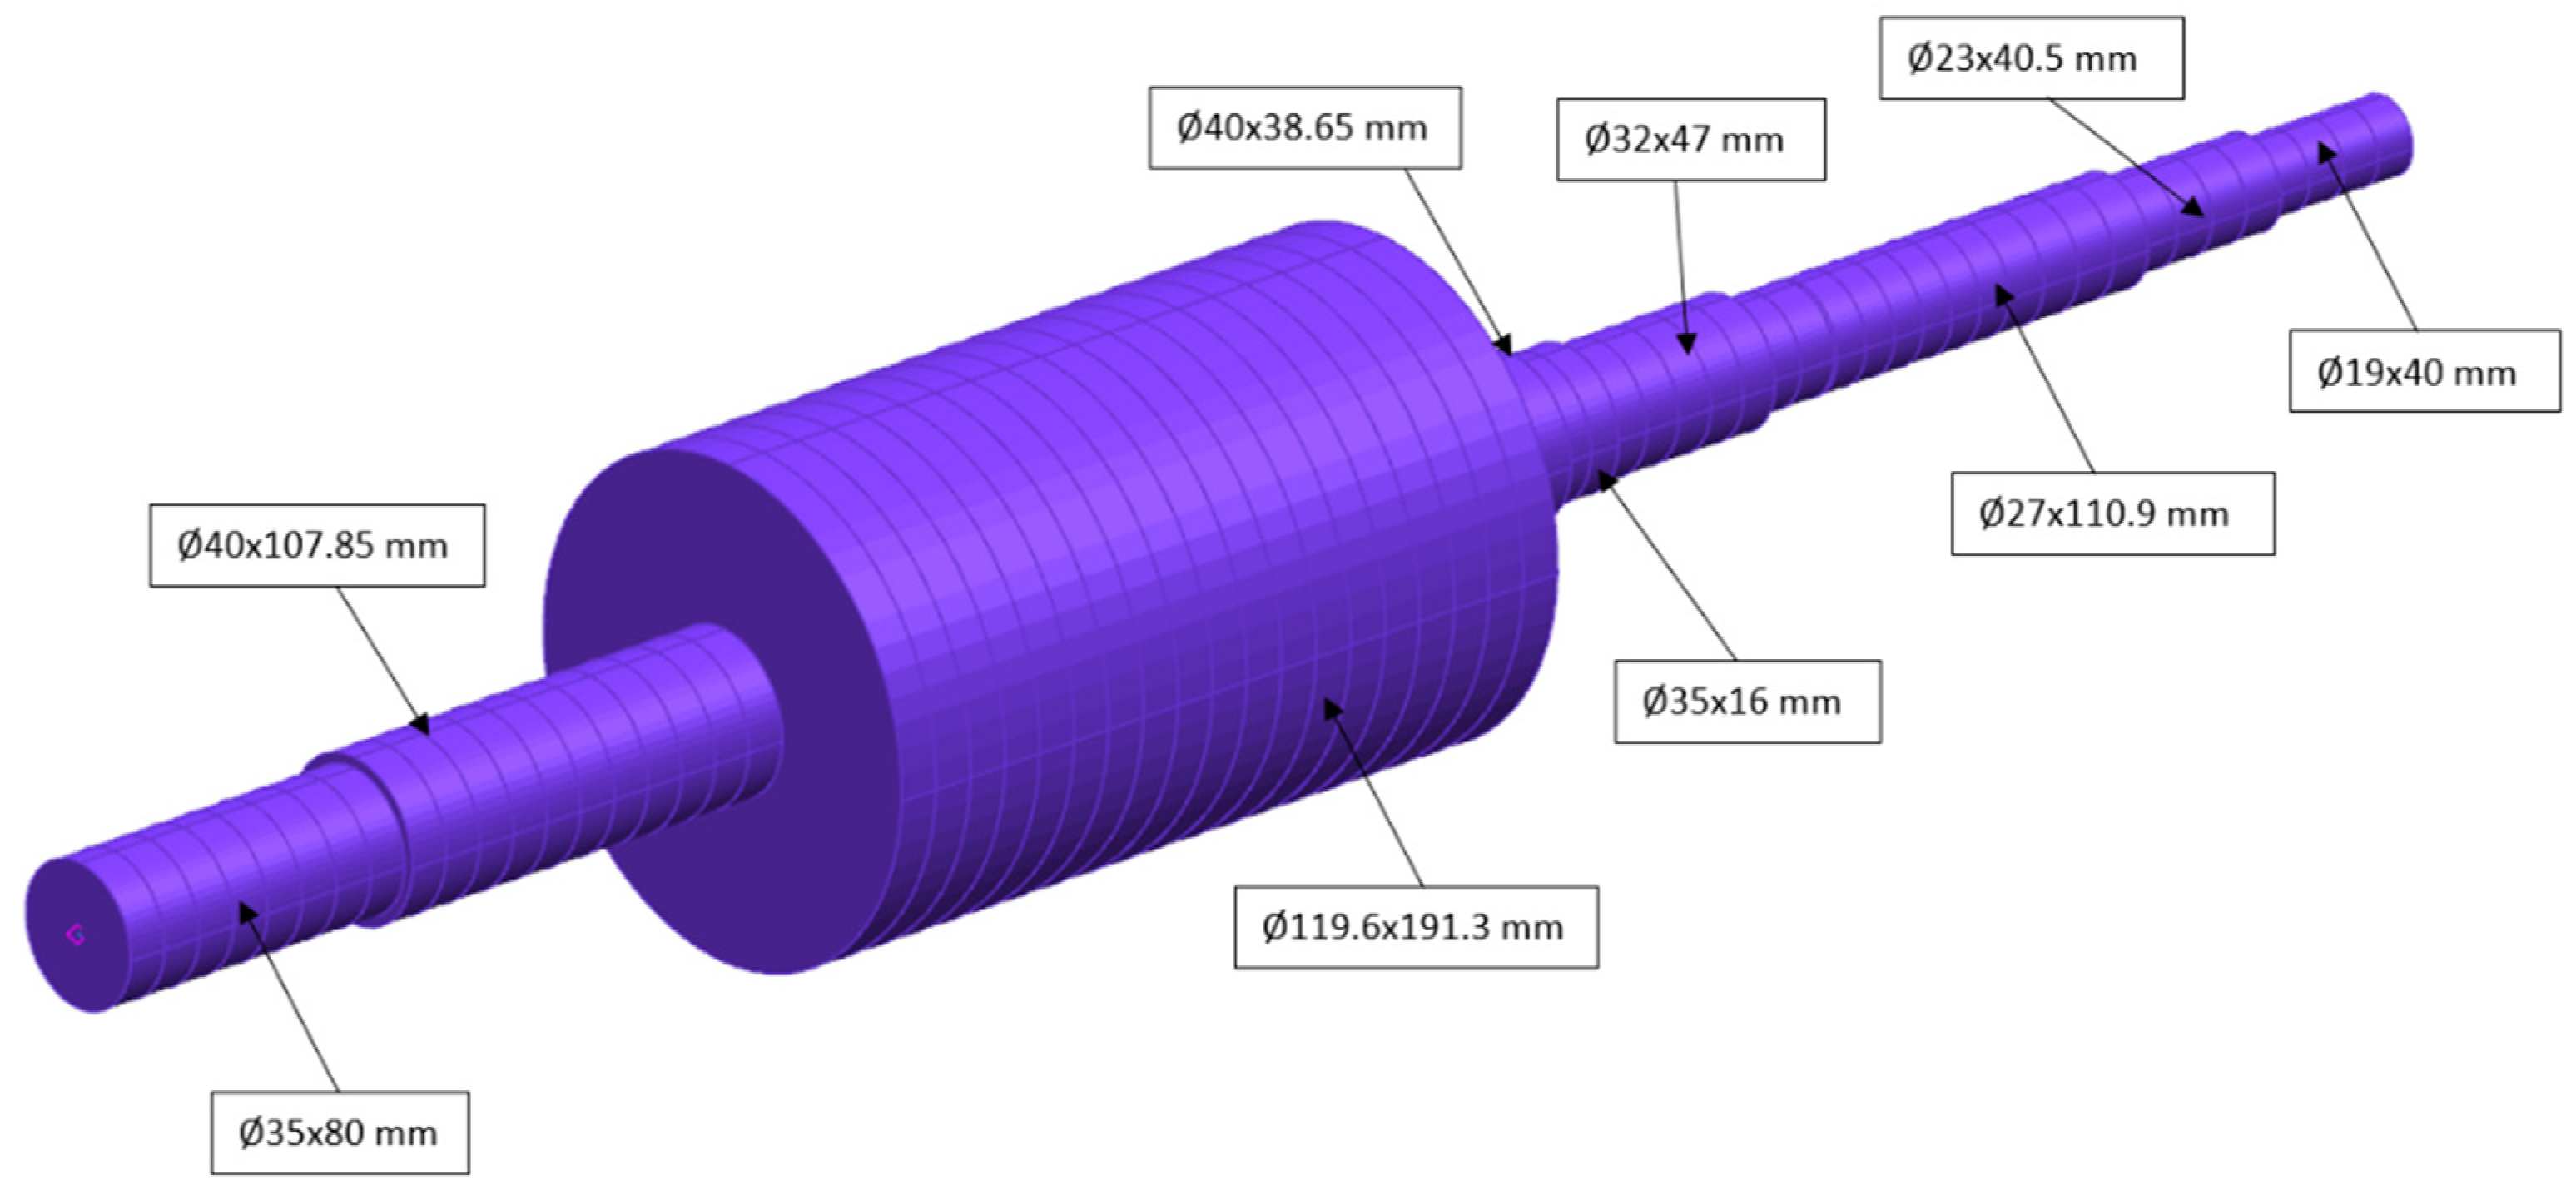
The model validation presented was based on comparing the analytical model results with those obtained from the finite element method. The study was based on the workpiece shown in Figure 4.
For the analytical calculation, apart from the geometric parameters, parameters related to the material and system stiffness were introduced, and are detailed in Table 2. Both workpiece rests were articulated, the left-side rest was non-movable in the axial direction (headstock), and the right-side rest was movable (tailstock).
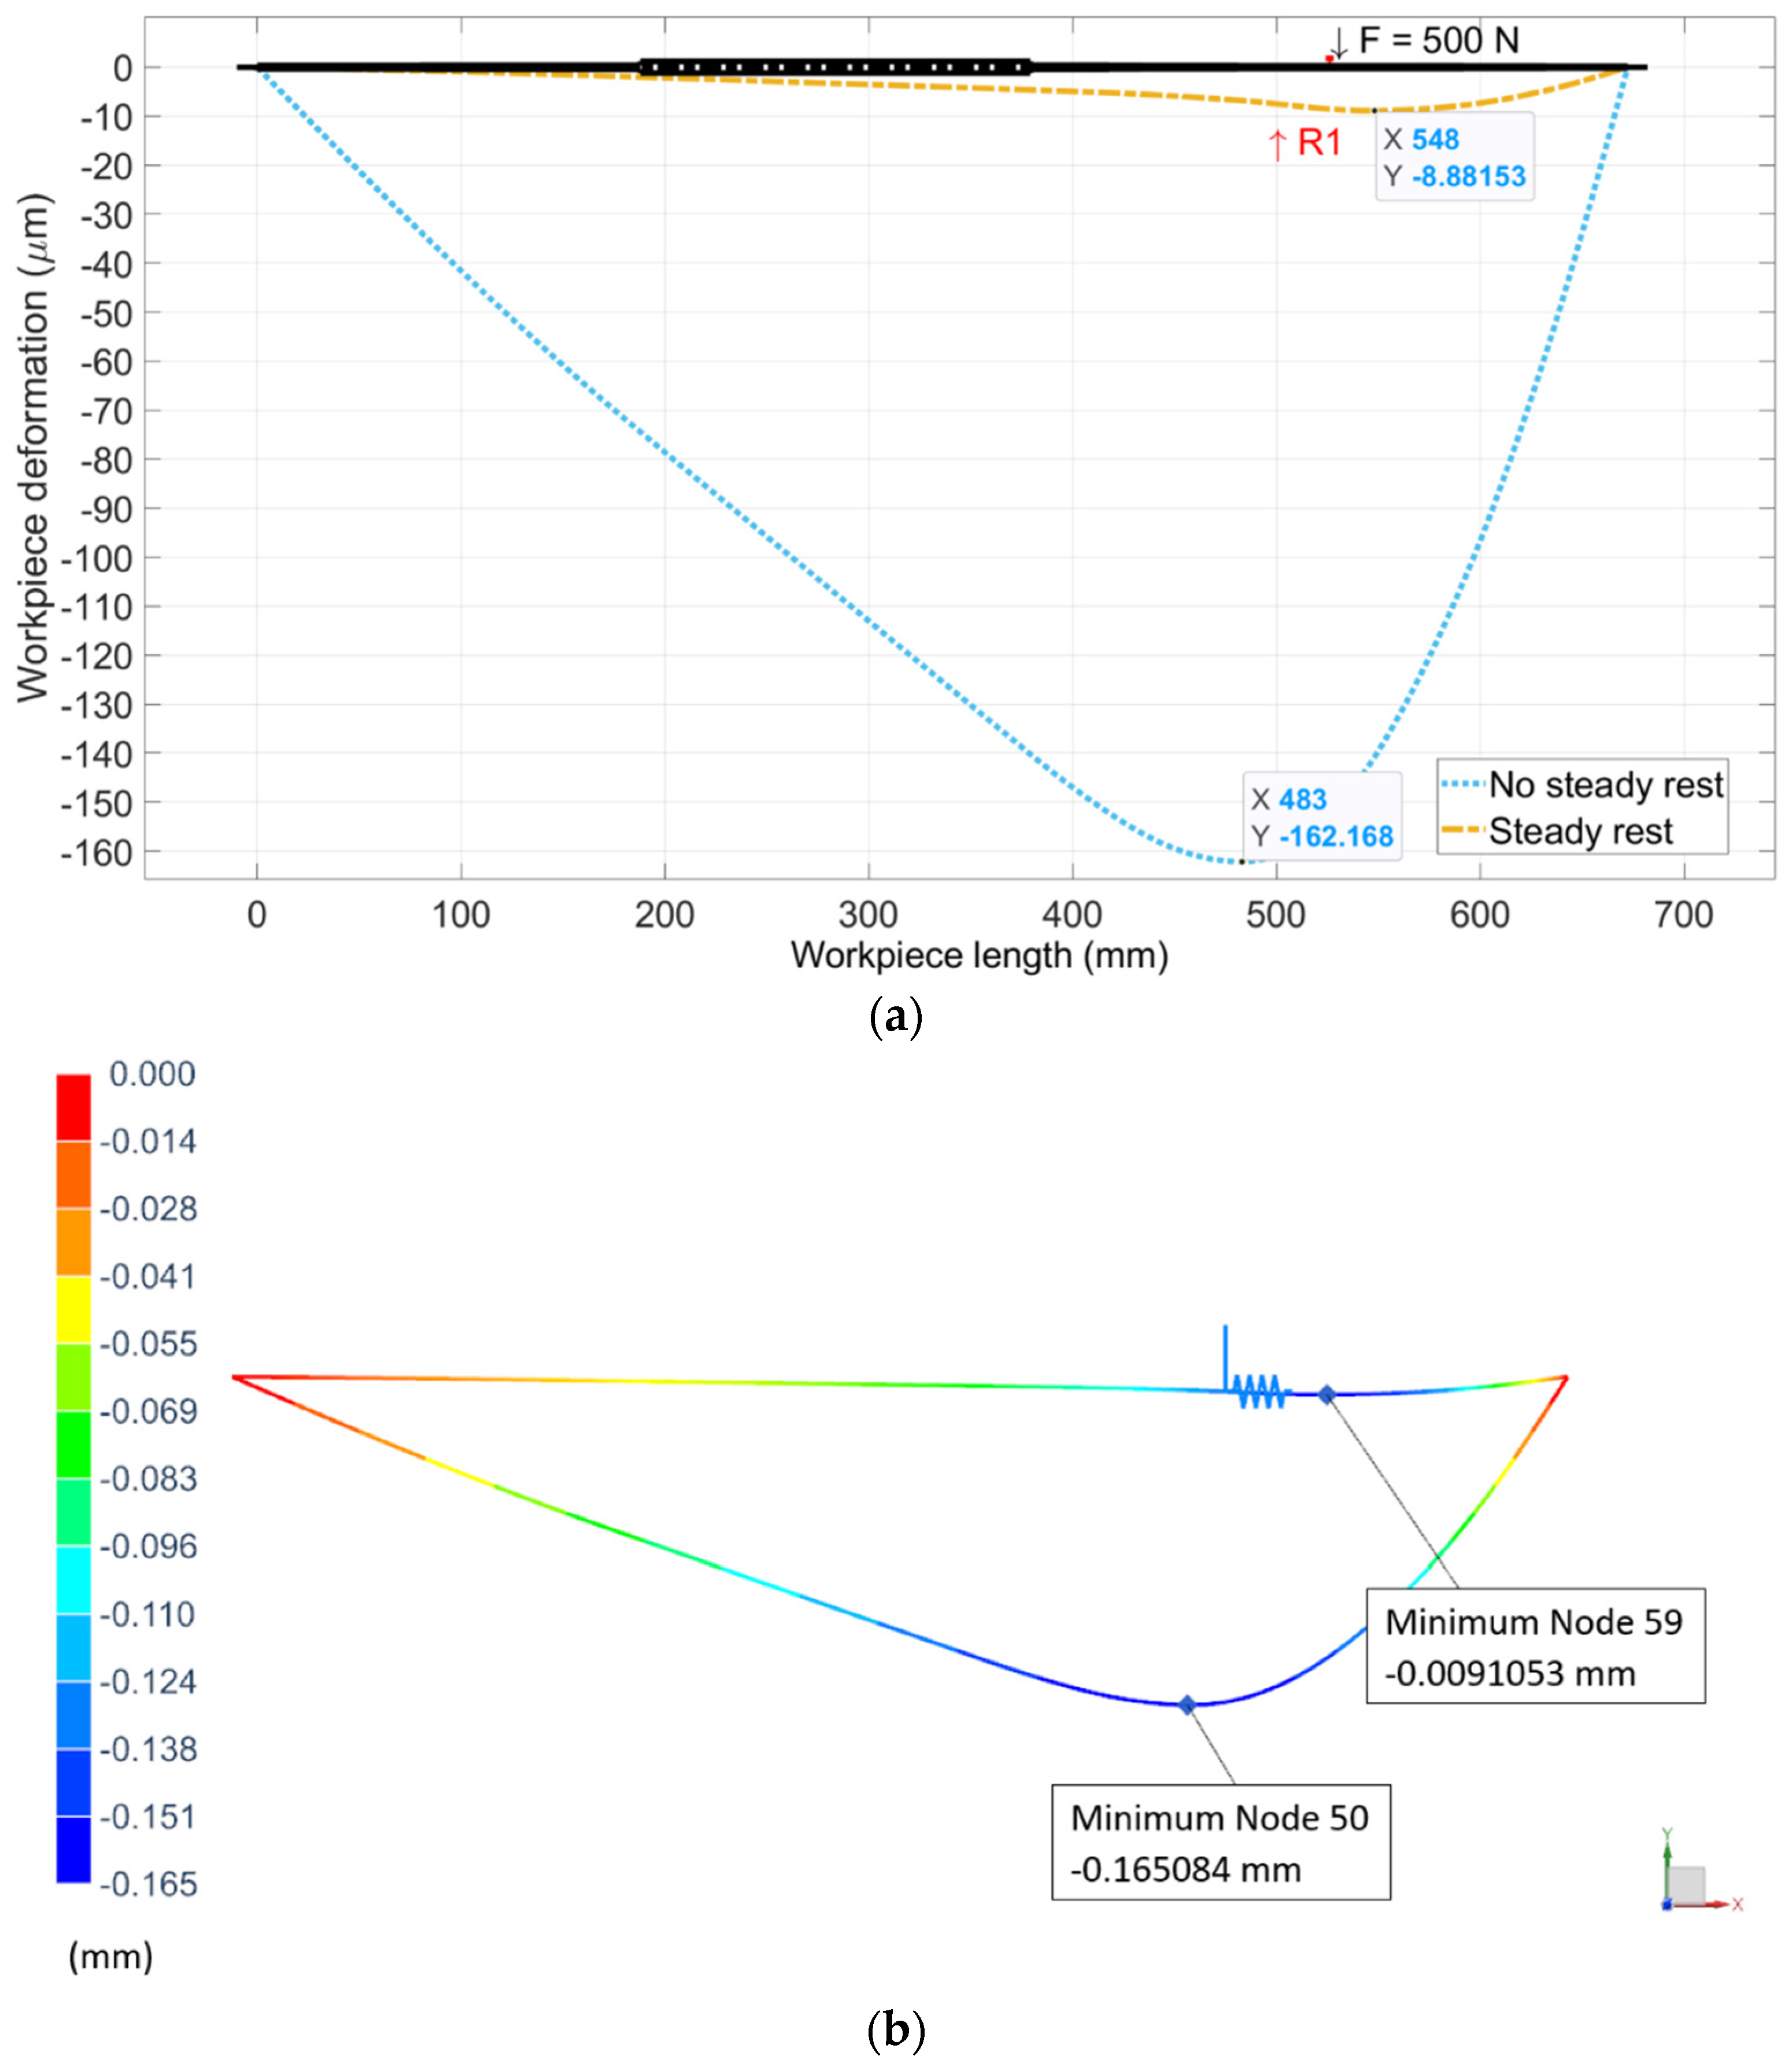
A scheme of the FEM analysis is shown in Figure 4. Analytical model output and finite element results are shown in Figure 5.
The values and the error between the analytical model and FEM are presented in Table 3.
The results showed a good correlation between both calculation methods, thus validating the proposed analytical approach for calculation of the workpiece deformation in the case where steady rests are used.

3.1.2. Experimental Validation of the Theoretical Approach

Experimental work was conducted to validate the flexion model presented in the previous section. This work was carried out in a Danobat LG600 B6 cylindrical grinding machine, a Tyrolit grinding wheel of 474 mm in diameter, and a blade dressing tool. The setup conditions are shown in Table 4.
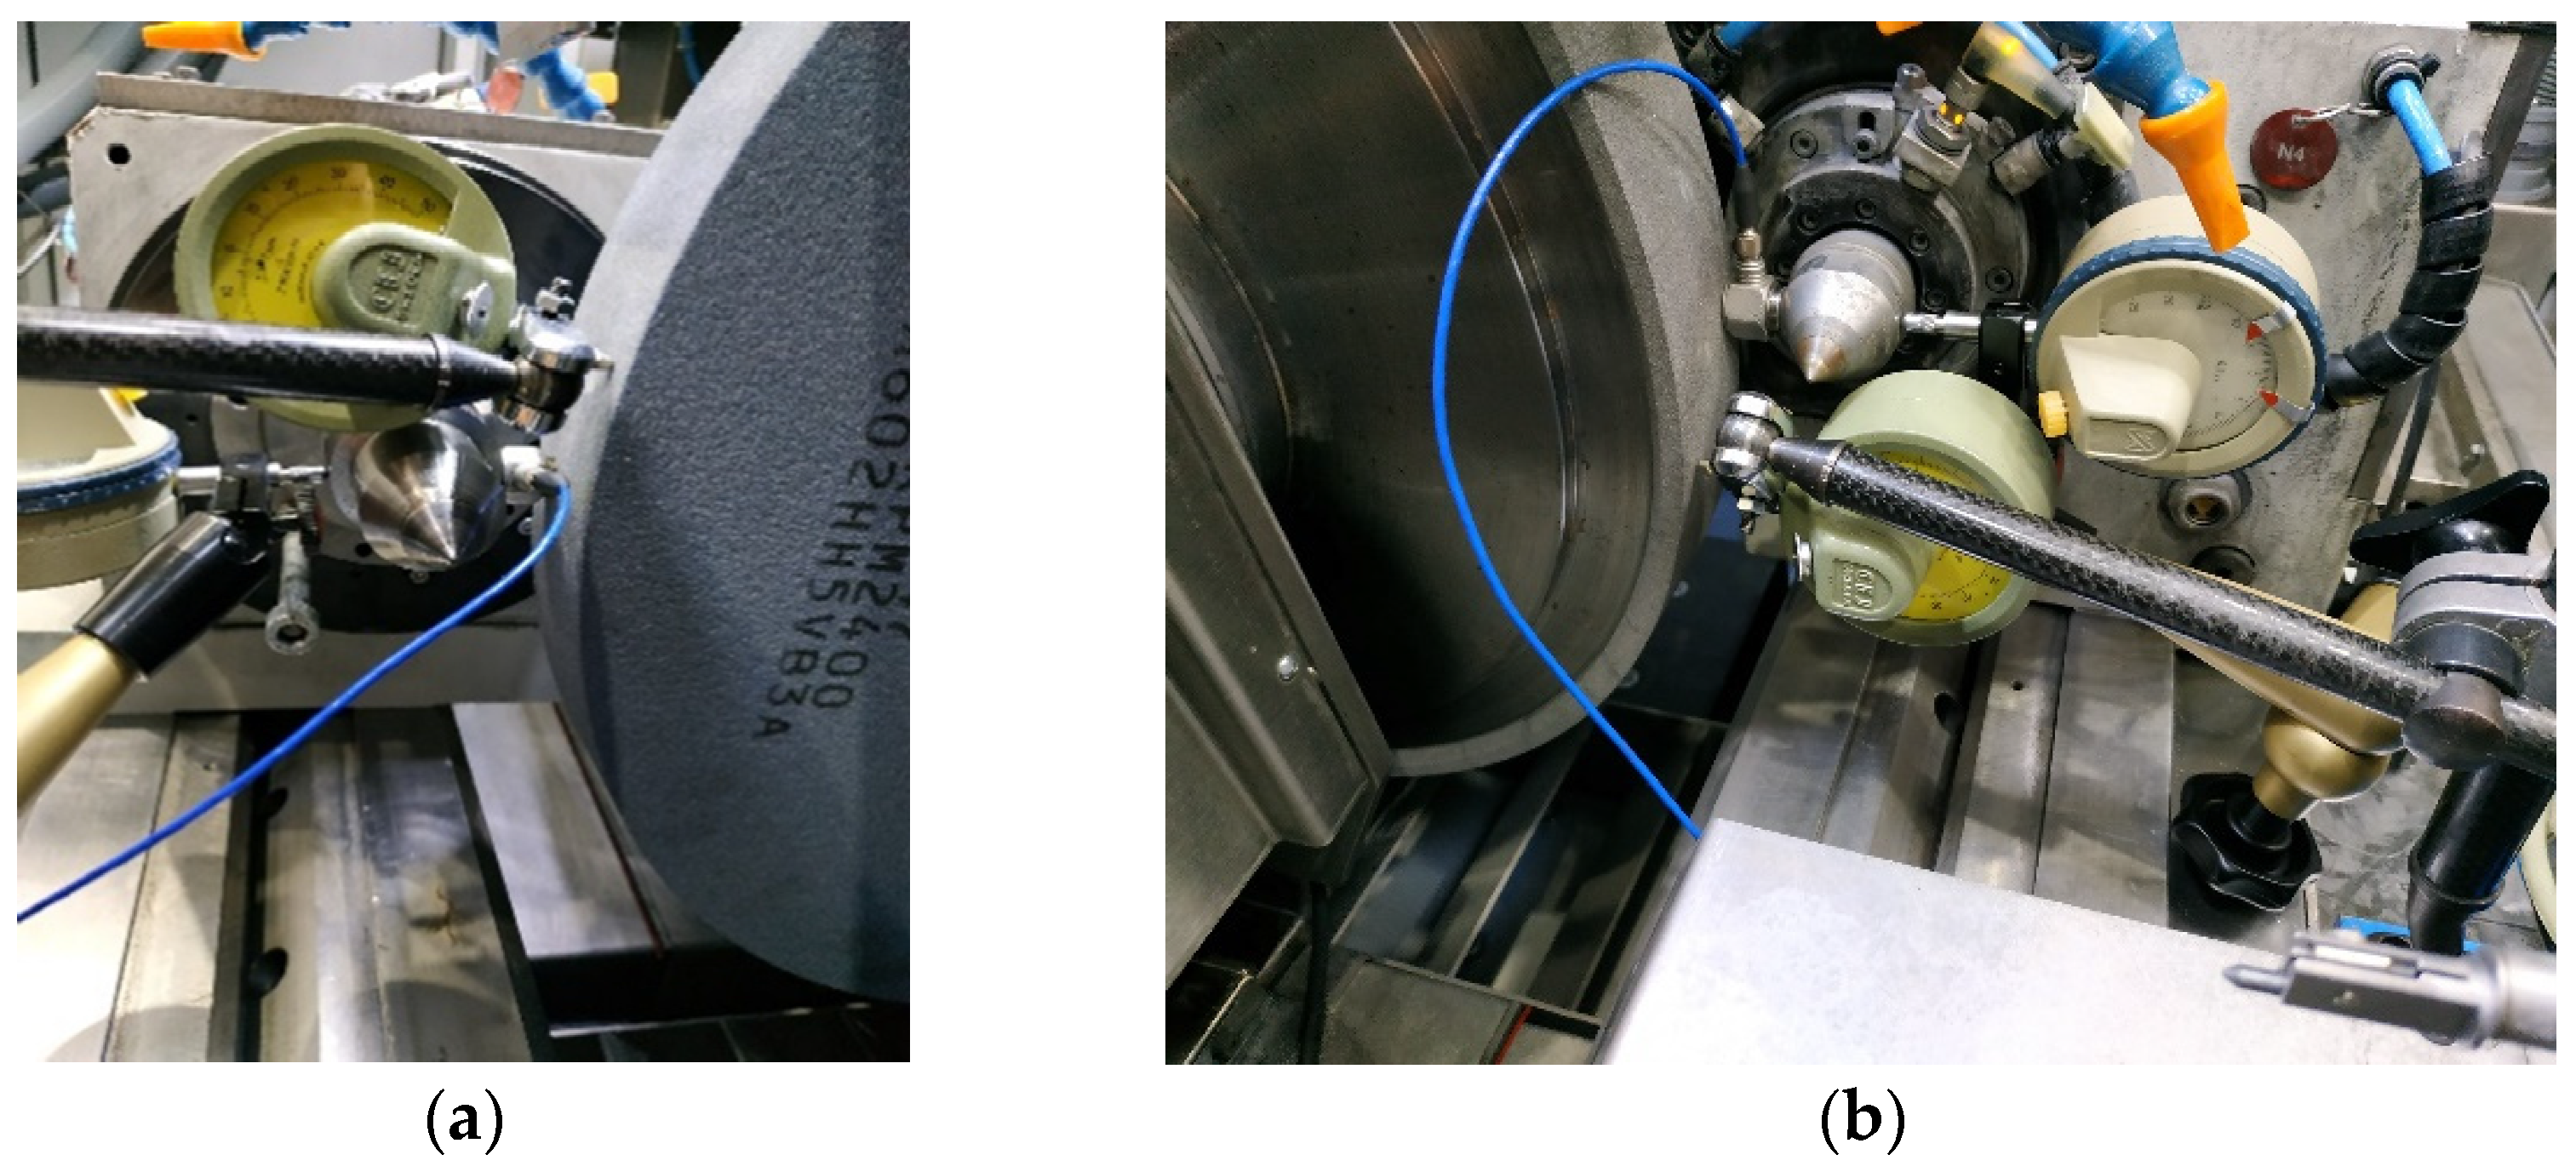
Tailstock pressure was sufficiently low to avoid the buckling effect due to excessive axial load in the piece. The workpiece material was hardened steel, with a full tempered process with a known Young’s modulus (210 GPa) and density (7850 Kg/m3). Tailstock and headstock stiffness were measured for the experimental tests (tailstock was 20 mm away from its repose position). A magnetic base was placed against the point, and a load cell was placed between the magnetic base and the grinding wheel (in this study, a corundum wheel was used). Magnetic base stiffness was assumed to be much greater than headstock stiffness. A dial gauge was placed against the grinding wheel and another at the other side of the magnetic base. With increments of 10 µm, the displacements and forces were registered (from 0 to 60 µm). Figure 6 shows the setup for the stiffness measurement for headstock (a) and tailstock (b).
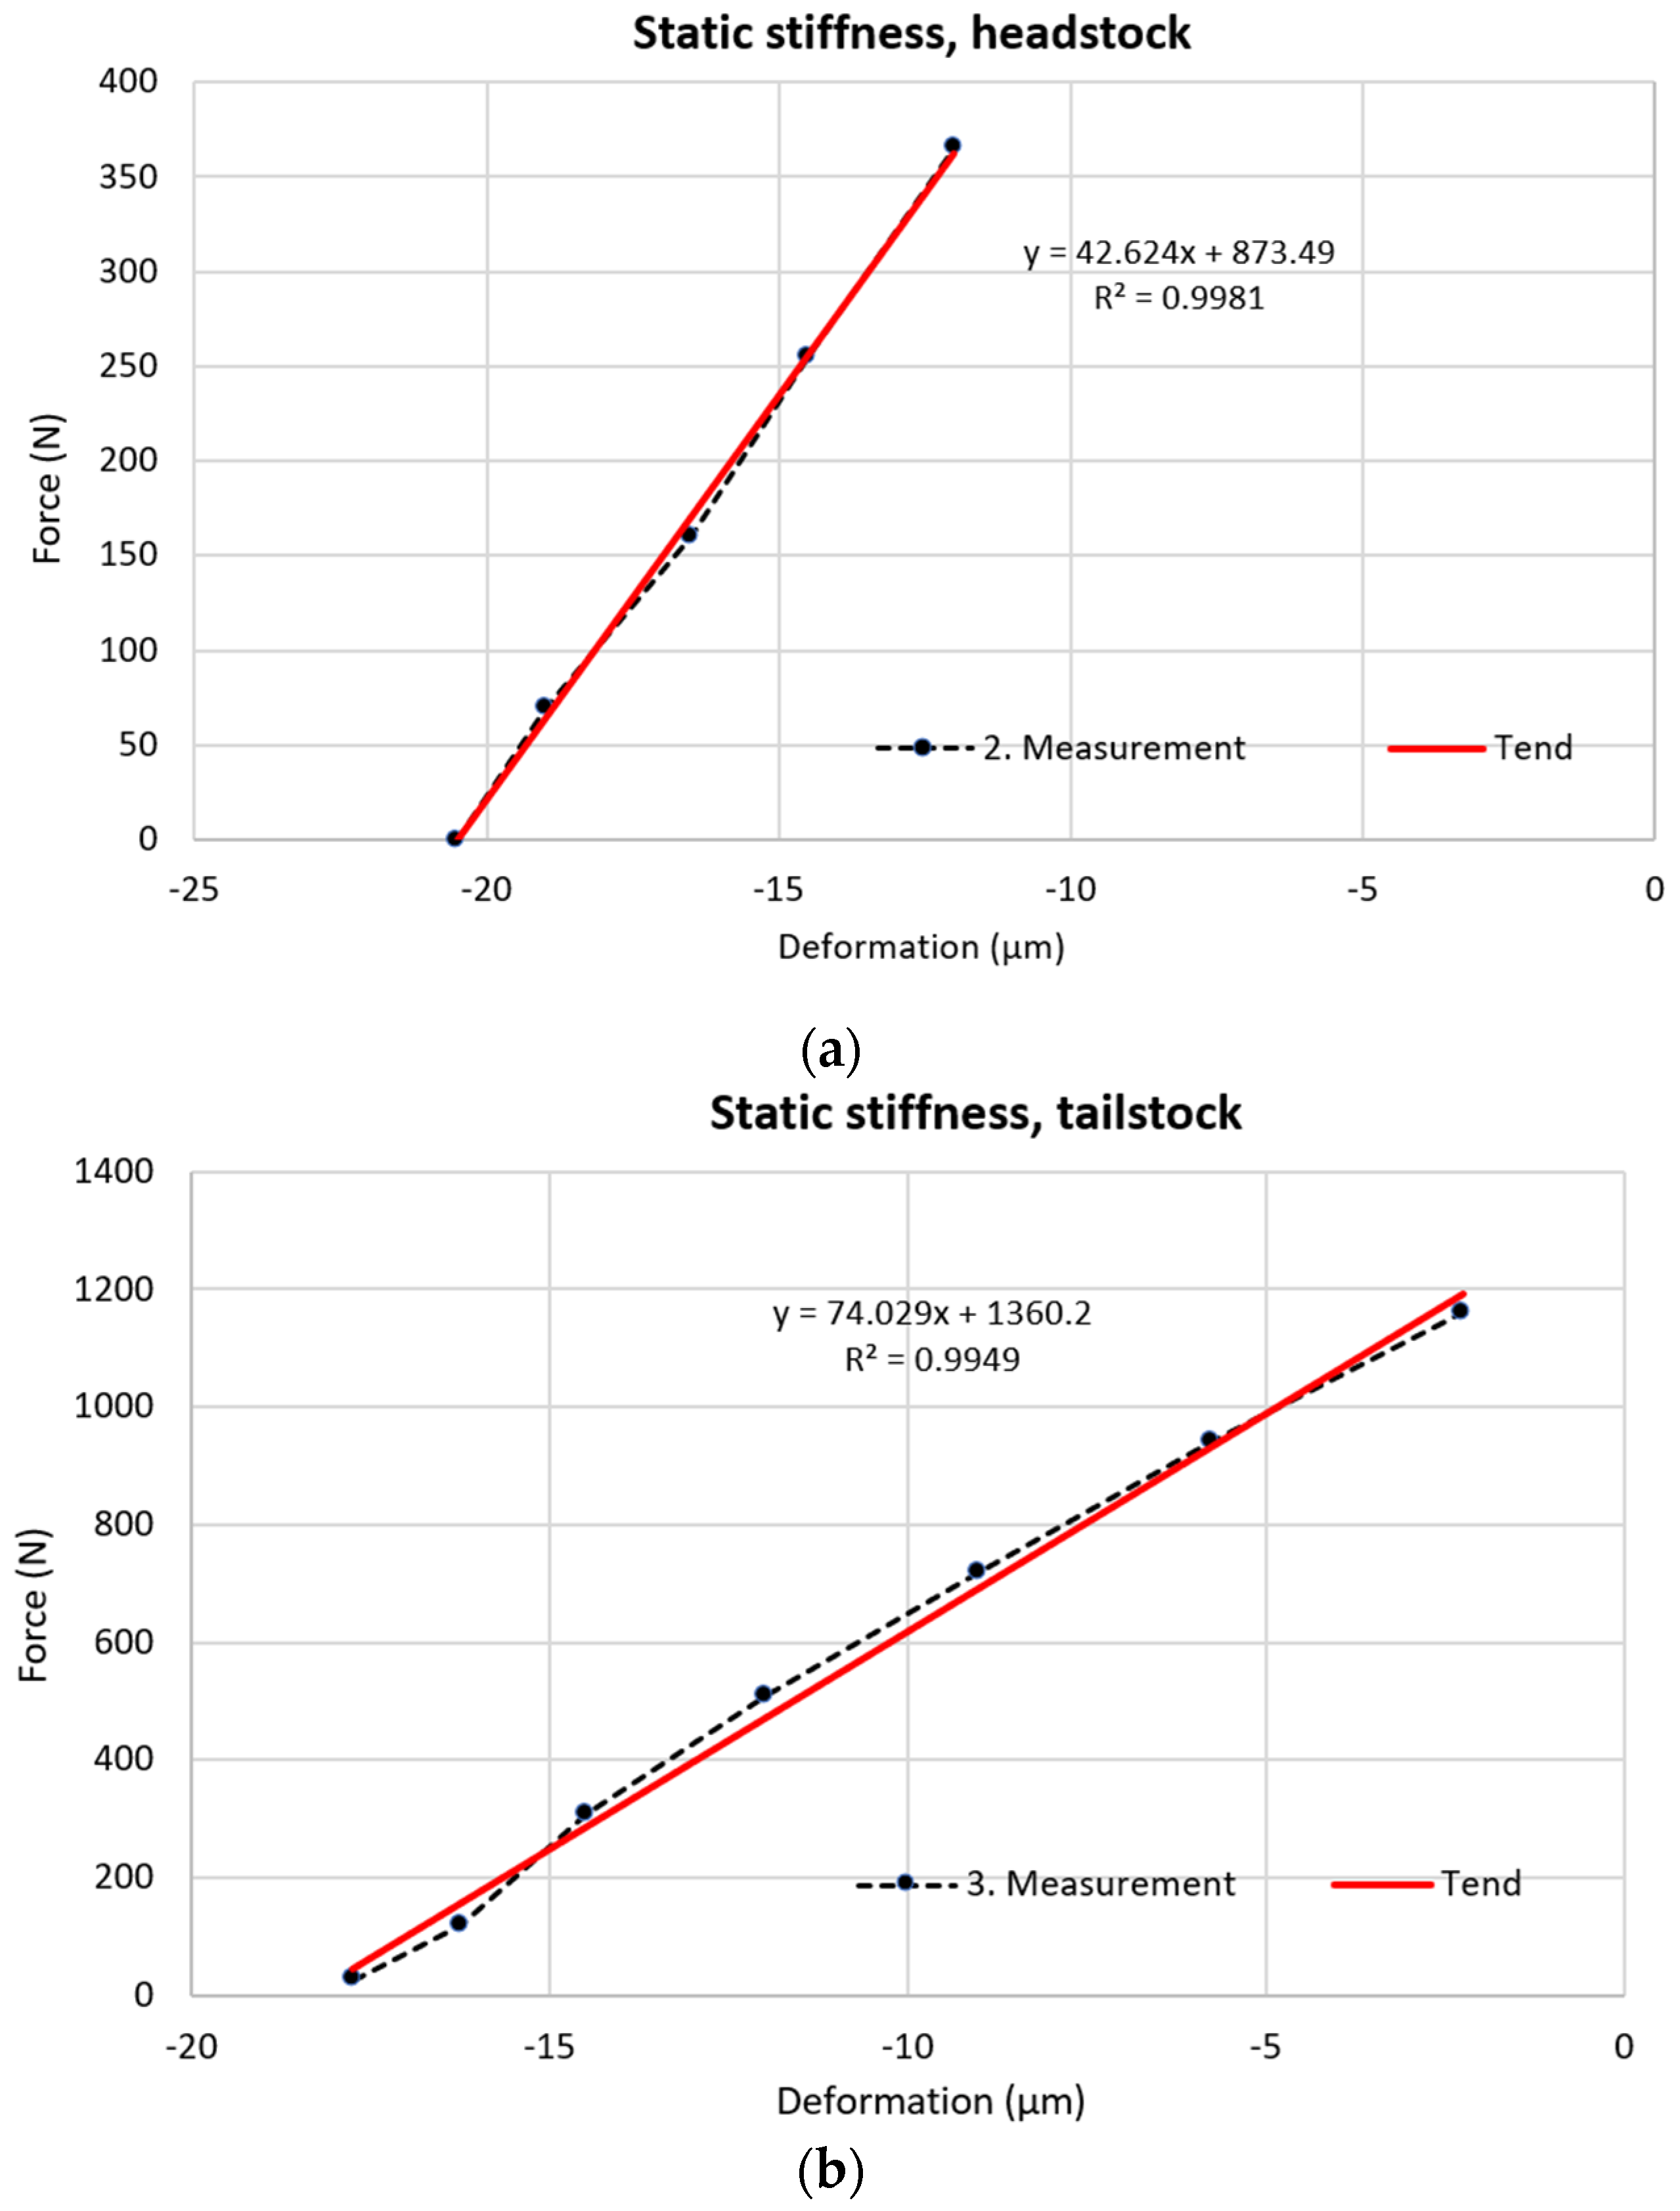
Five measurements were taken to ensure accuracy. Figure 7 shows one measurement for the headstock (a) and the tailstock (b).
The averages of 5 measurements were calculated and used for this test:
  • KTailstock = 74 N/µm;
  • KHeadstock = 50 N/µm;
In this analysis, accuracy of the flexion model was validated in comparison with the measurement of the grounded workpiece diameters. Diameter measurements were taken with a micrometer. For this work, two grinding conditions were tested, as shown in Table 5:
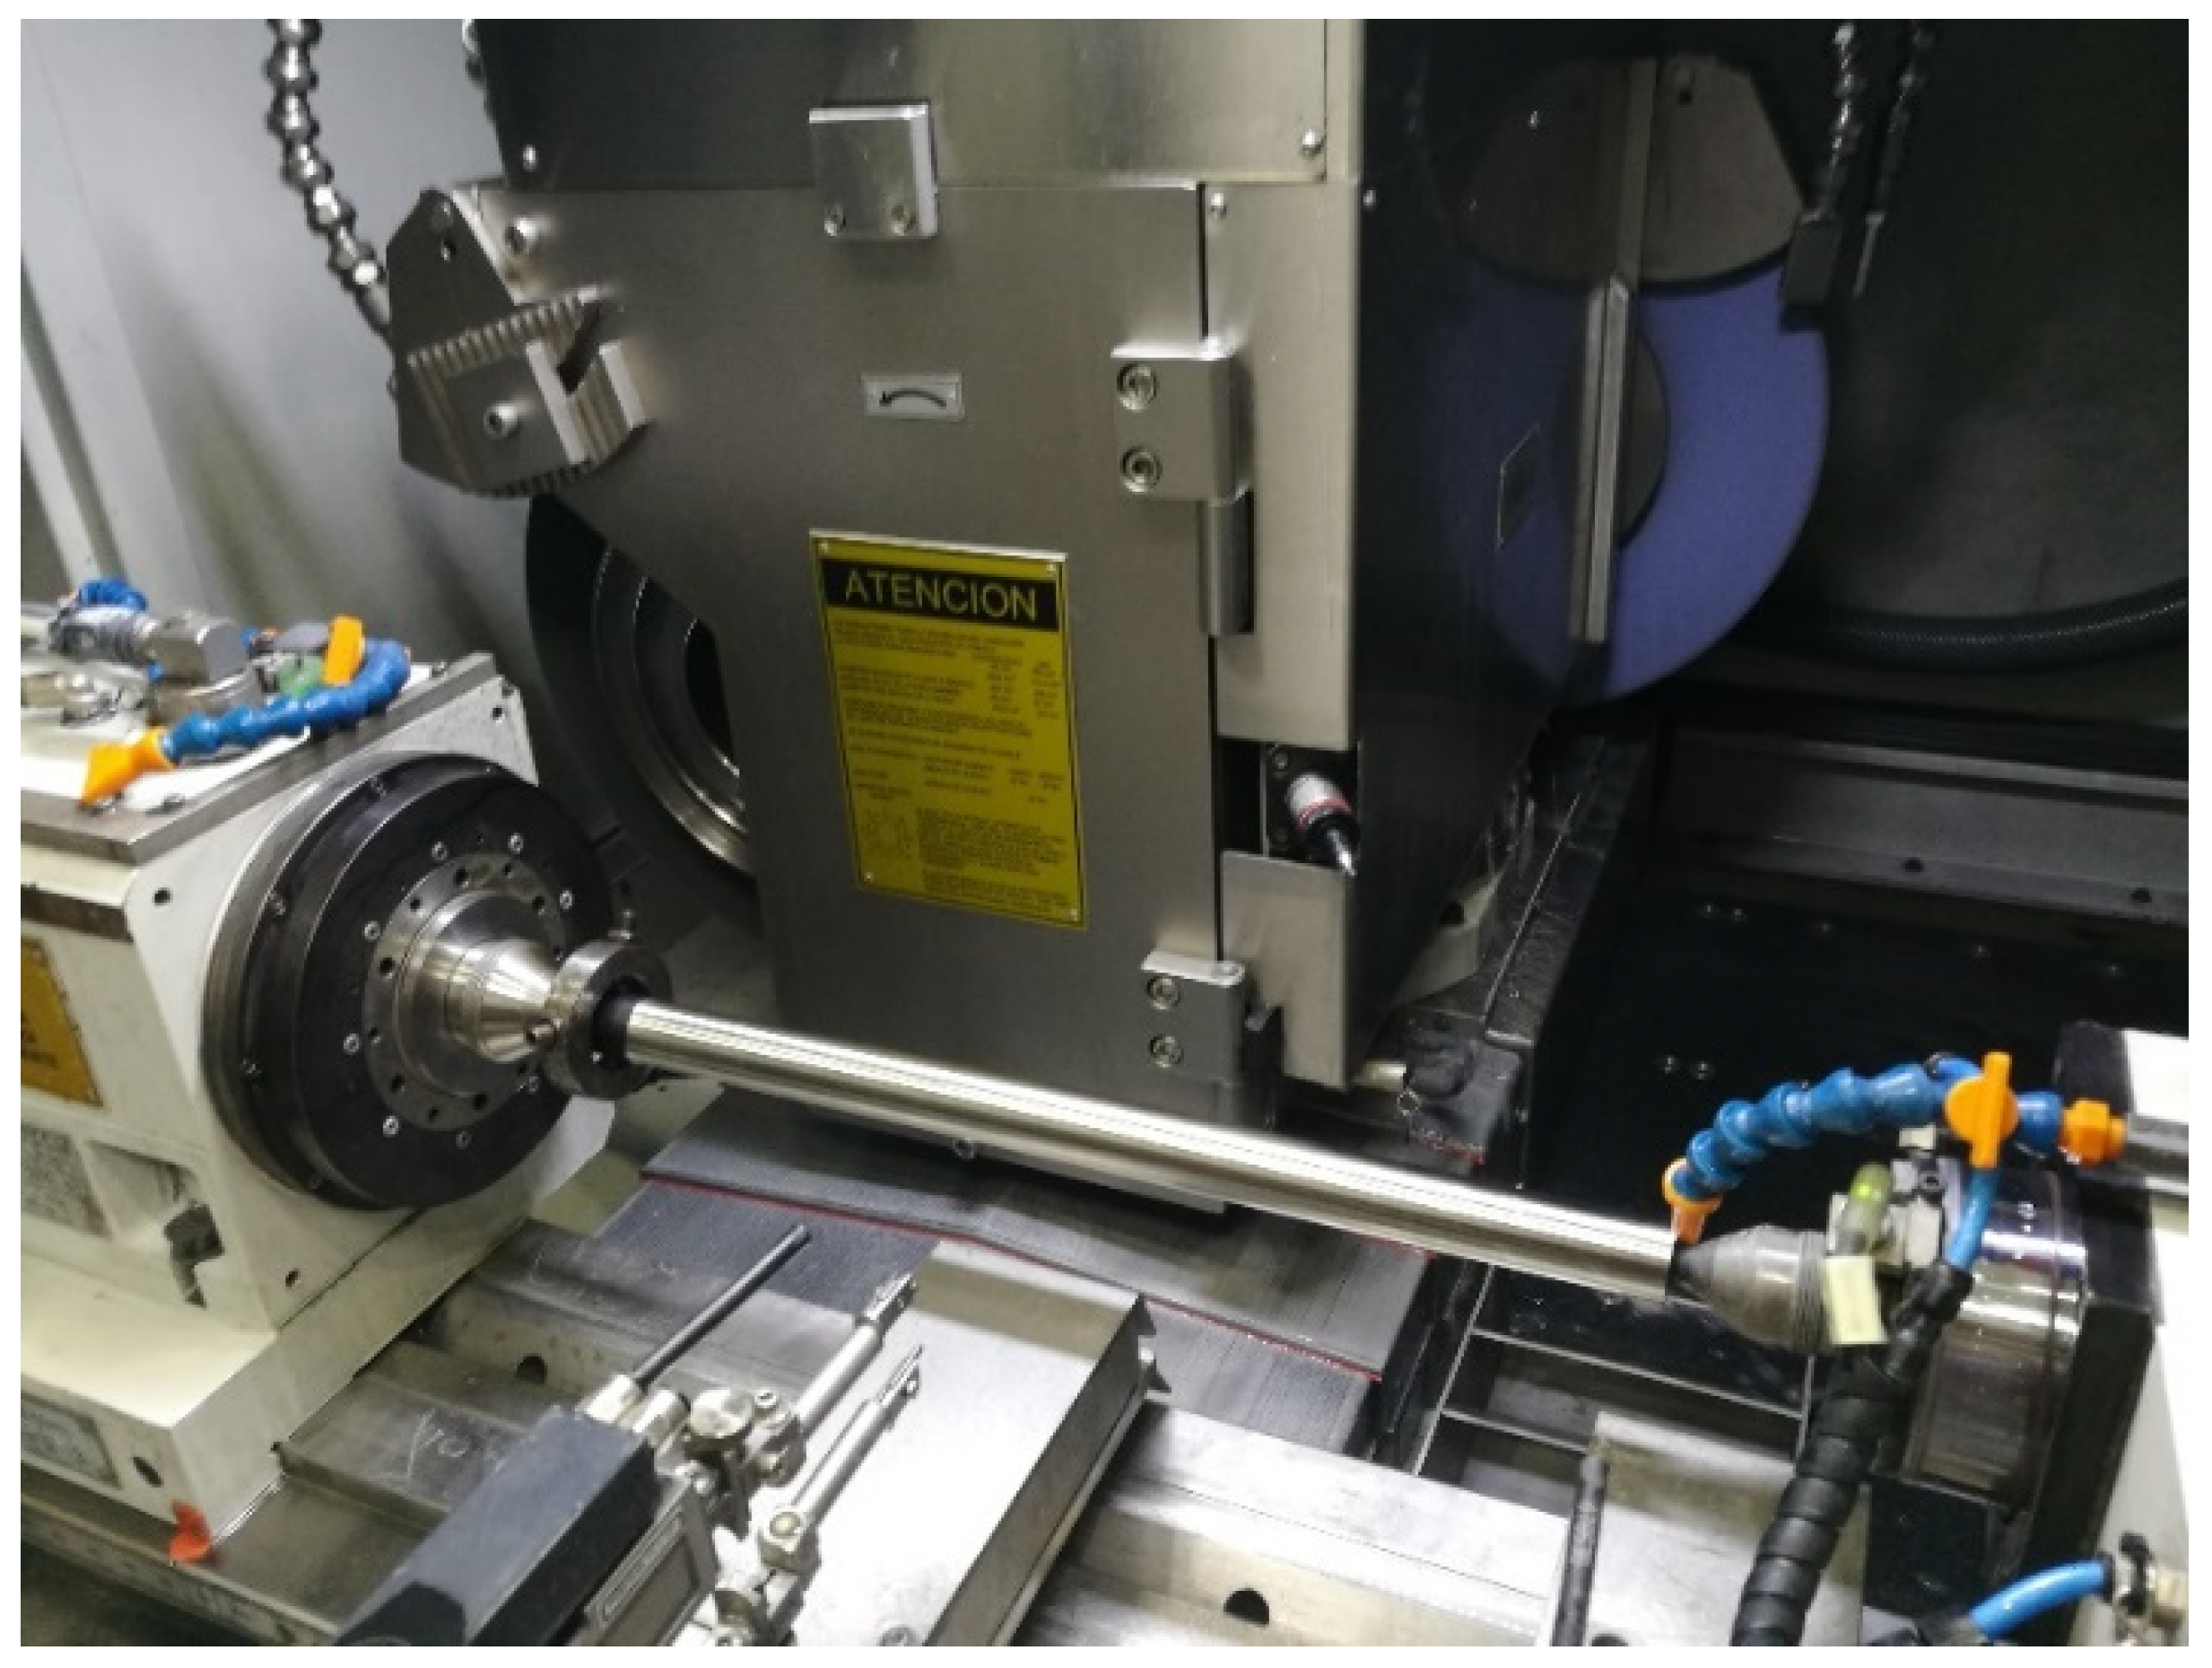
Figure 8 shows the analysis scheme for the part. The part was 400 mm in length, but was limited to 374 mm; the rest of the part was used to support the drive bolt, which ensured the part would drive. The measurement length was divided into 12 equidistant measurement points, i.e., distance between measurement points was 34 mm. The diameter of the part was 25 mm. According to the length and the workpiece diameter, the slenderness ratio was 16.
The normal force (X-axis force) in the traverse stroke of each cycle was measured by the Servotrace system integrated into the machine CNC. The signal was obtained from the machine and processed in MATLAB. Before starting to grind the part, it was necessary to determine the grinding force and to consider idle force (130.8 N in Figure 9) produced by the coolant pressure between the grinding wheel and the workpiece. Figure 9 shows the analysis of the net normal force during the traverse grinding cycle. Stable values of the force in the middle of the traverse stroke were considered in order to avoid force peaks at the beginning of the signal caused by the in-feed movement of the grinding wheel into the workpiece.
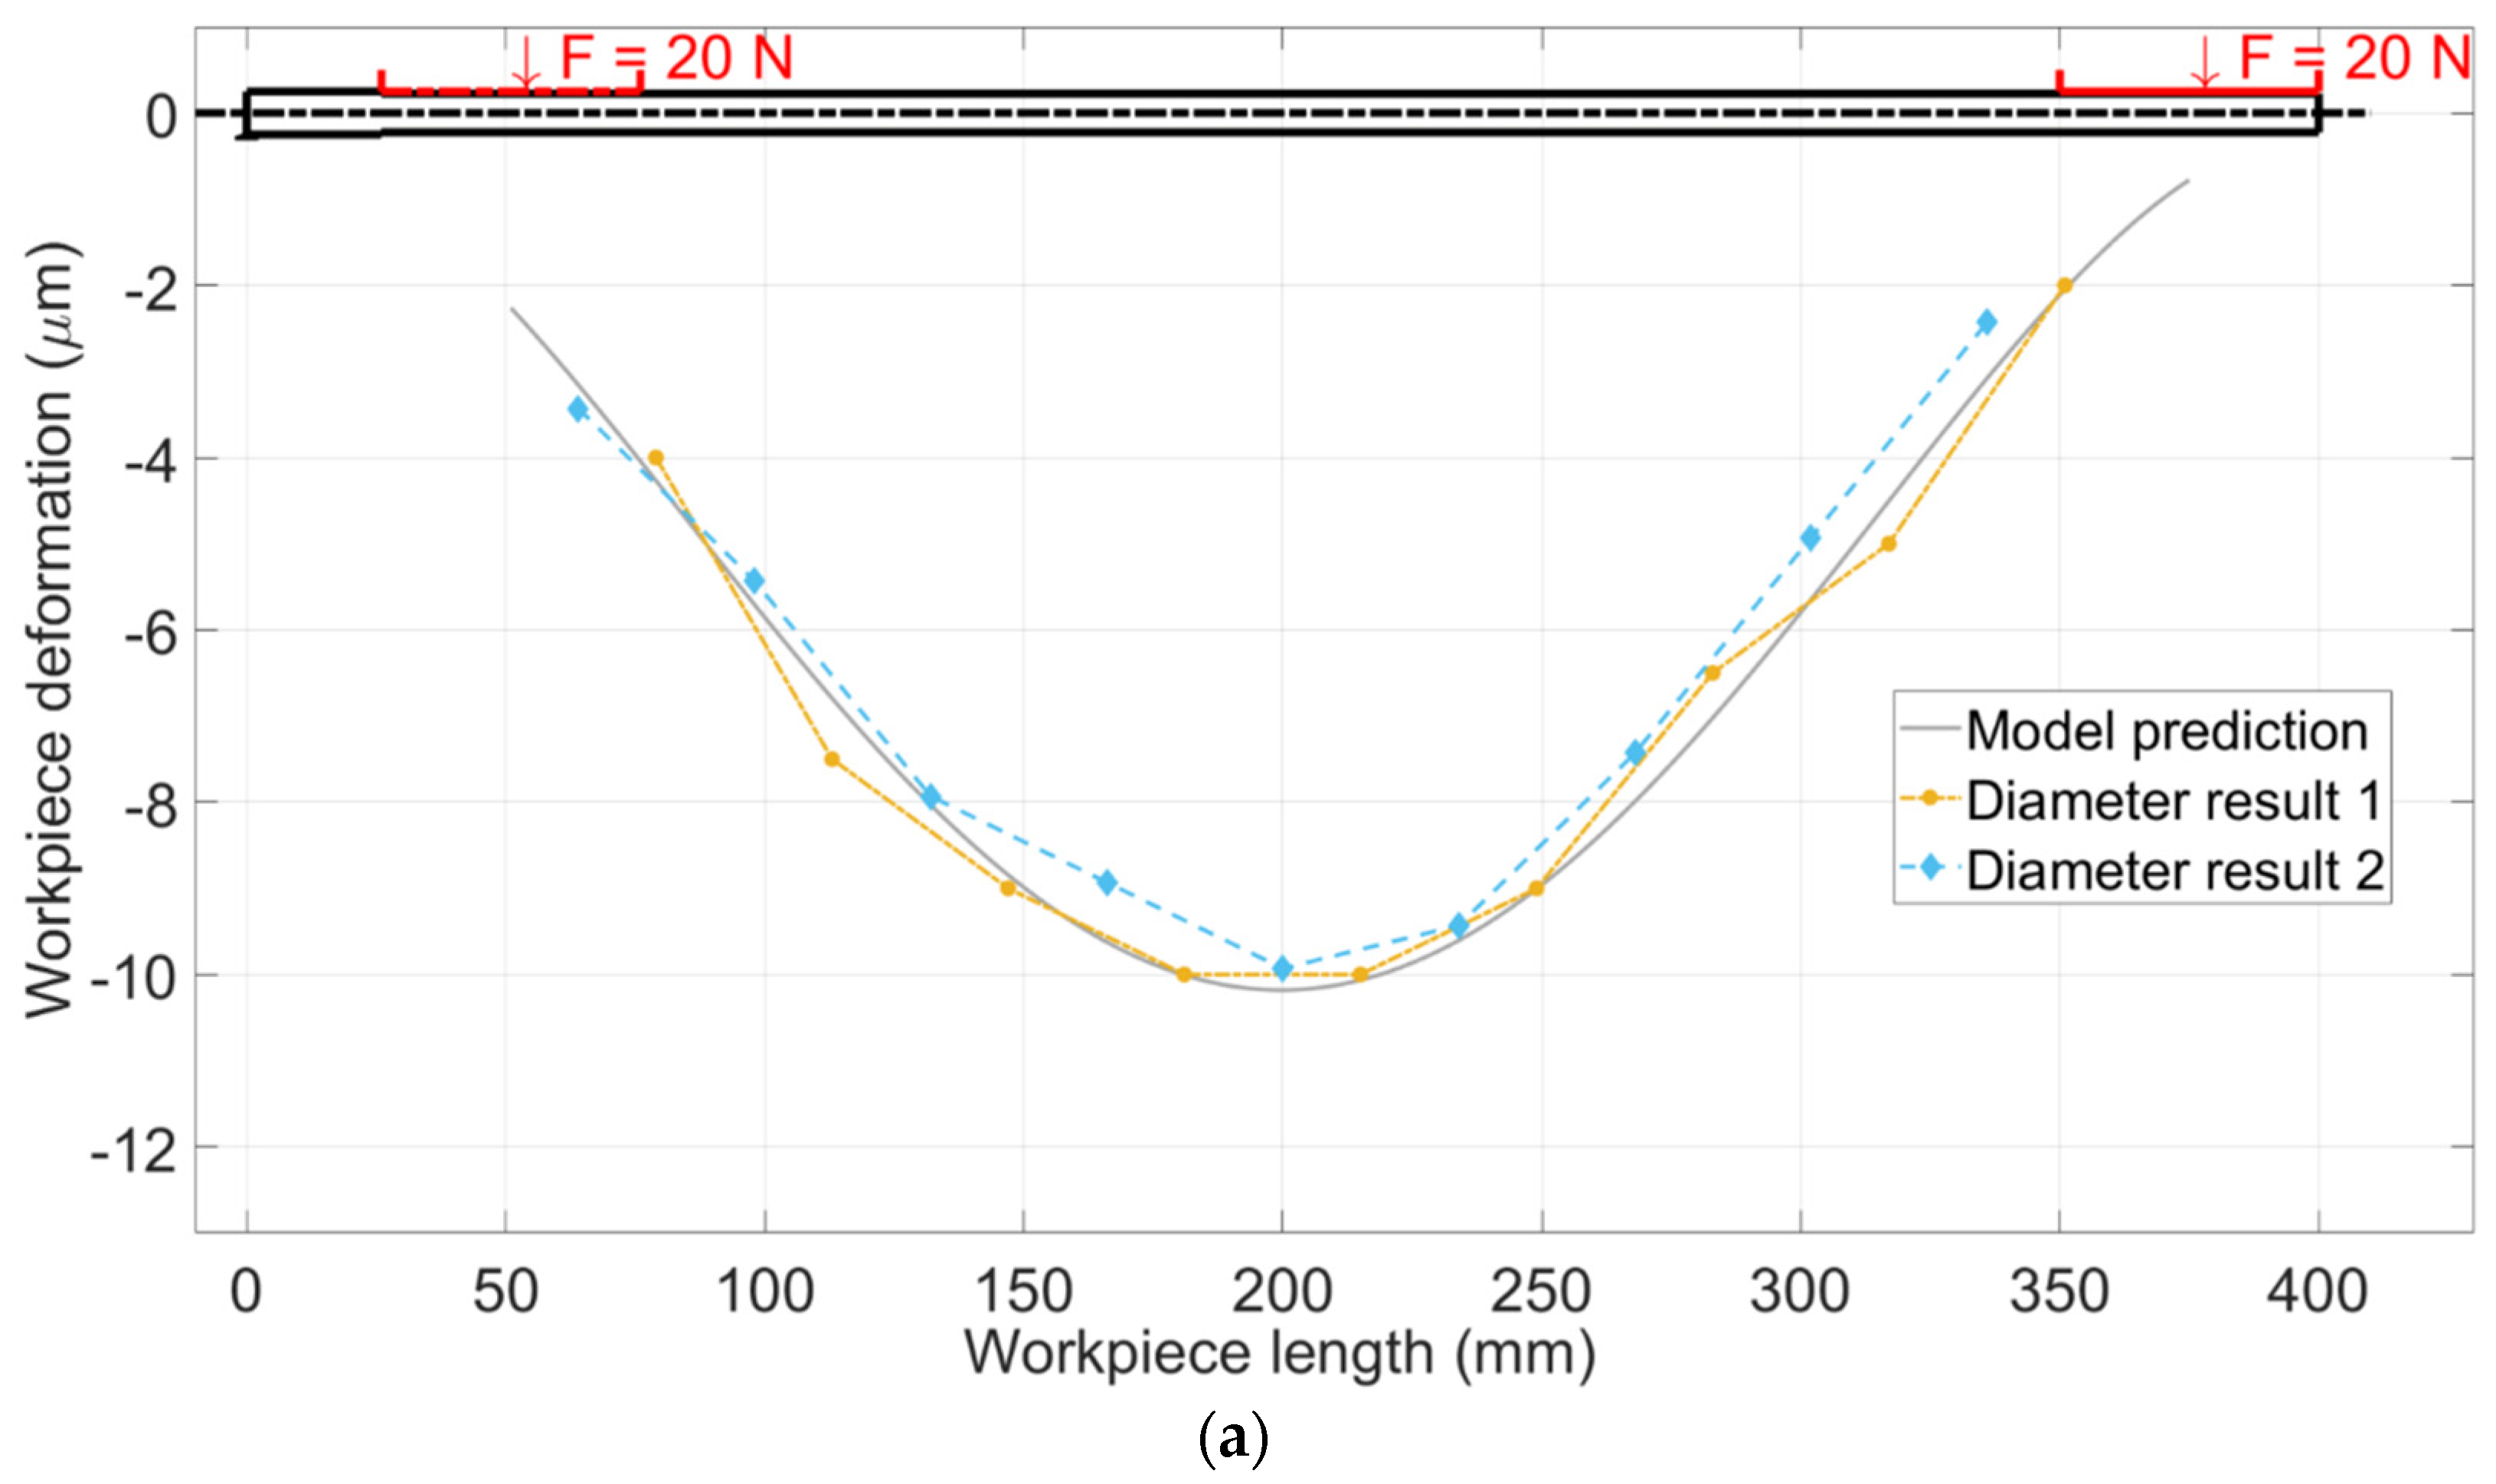
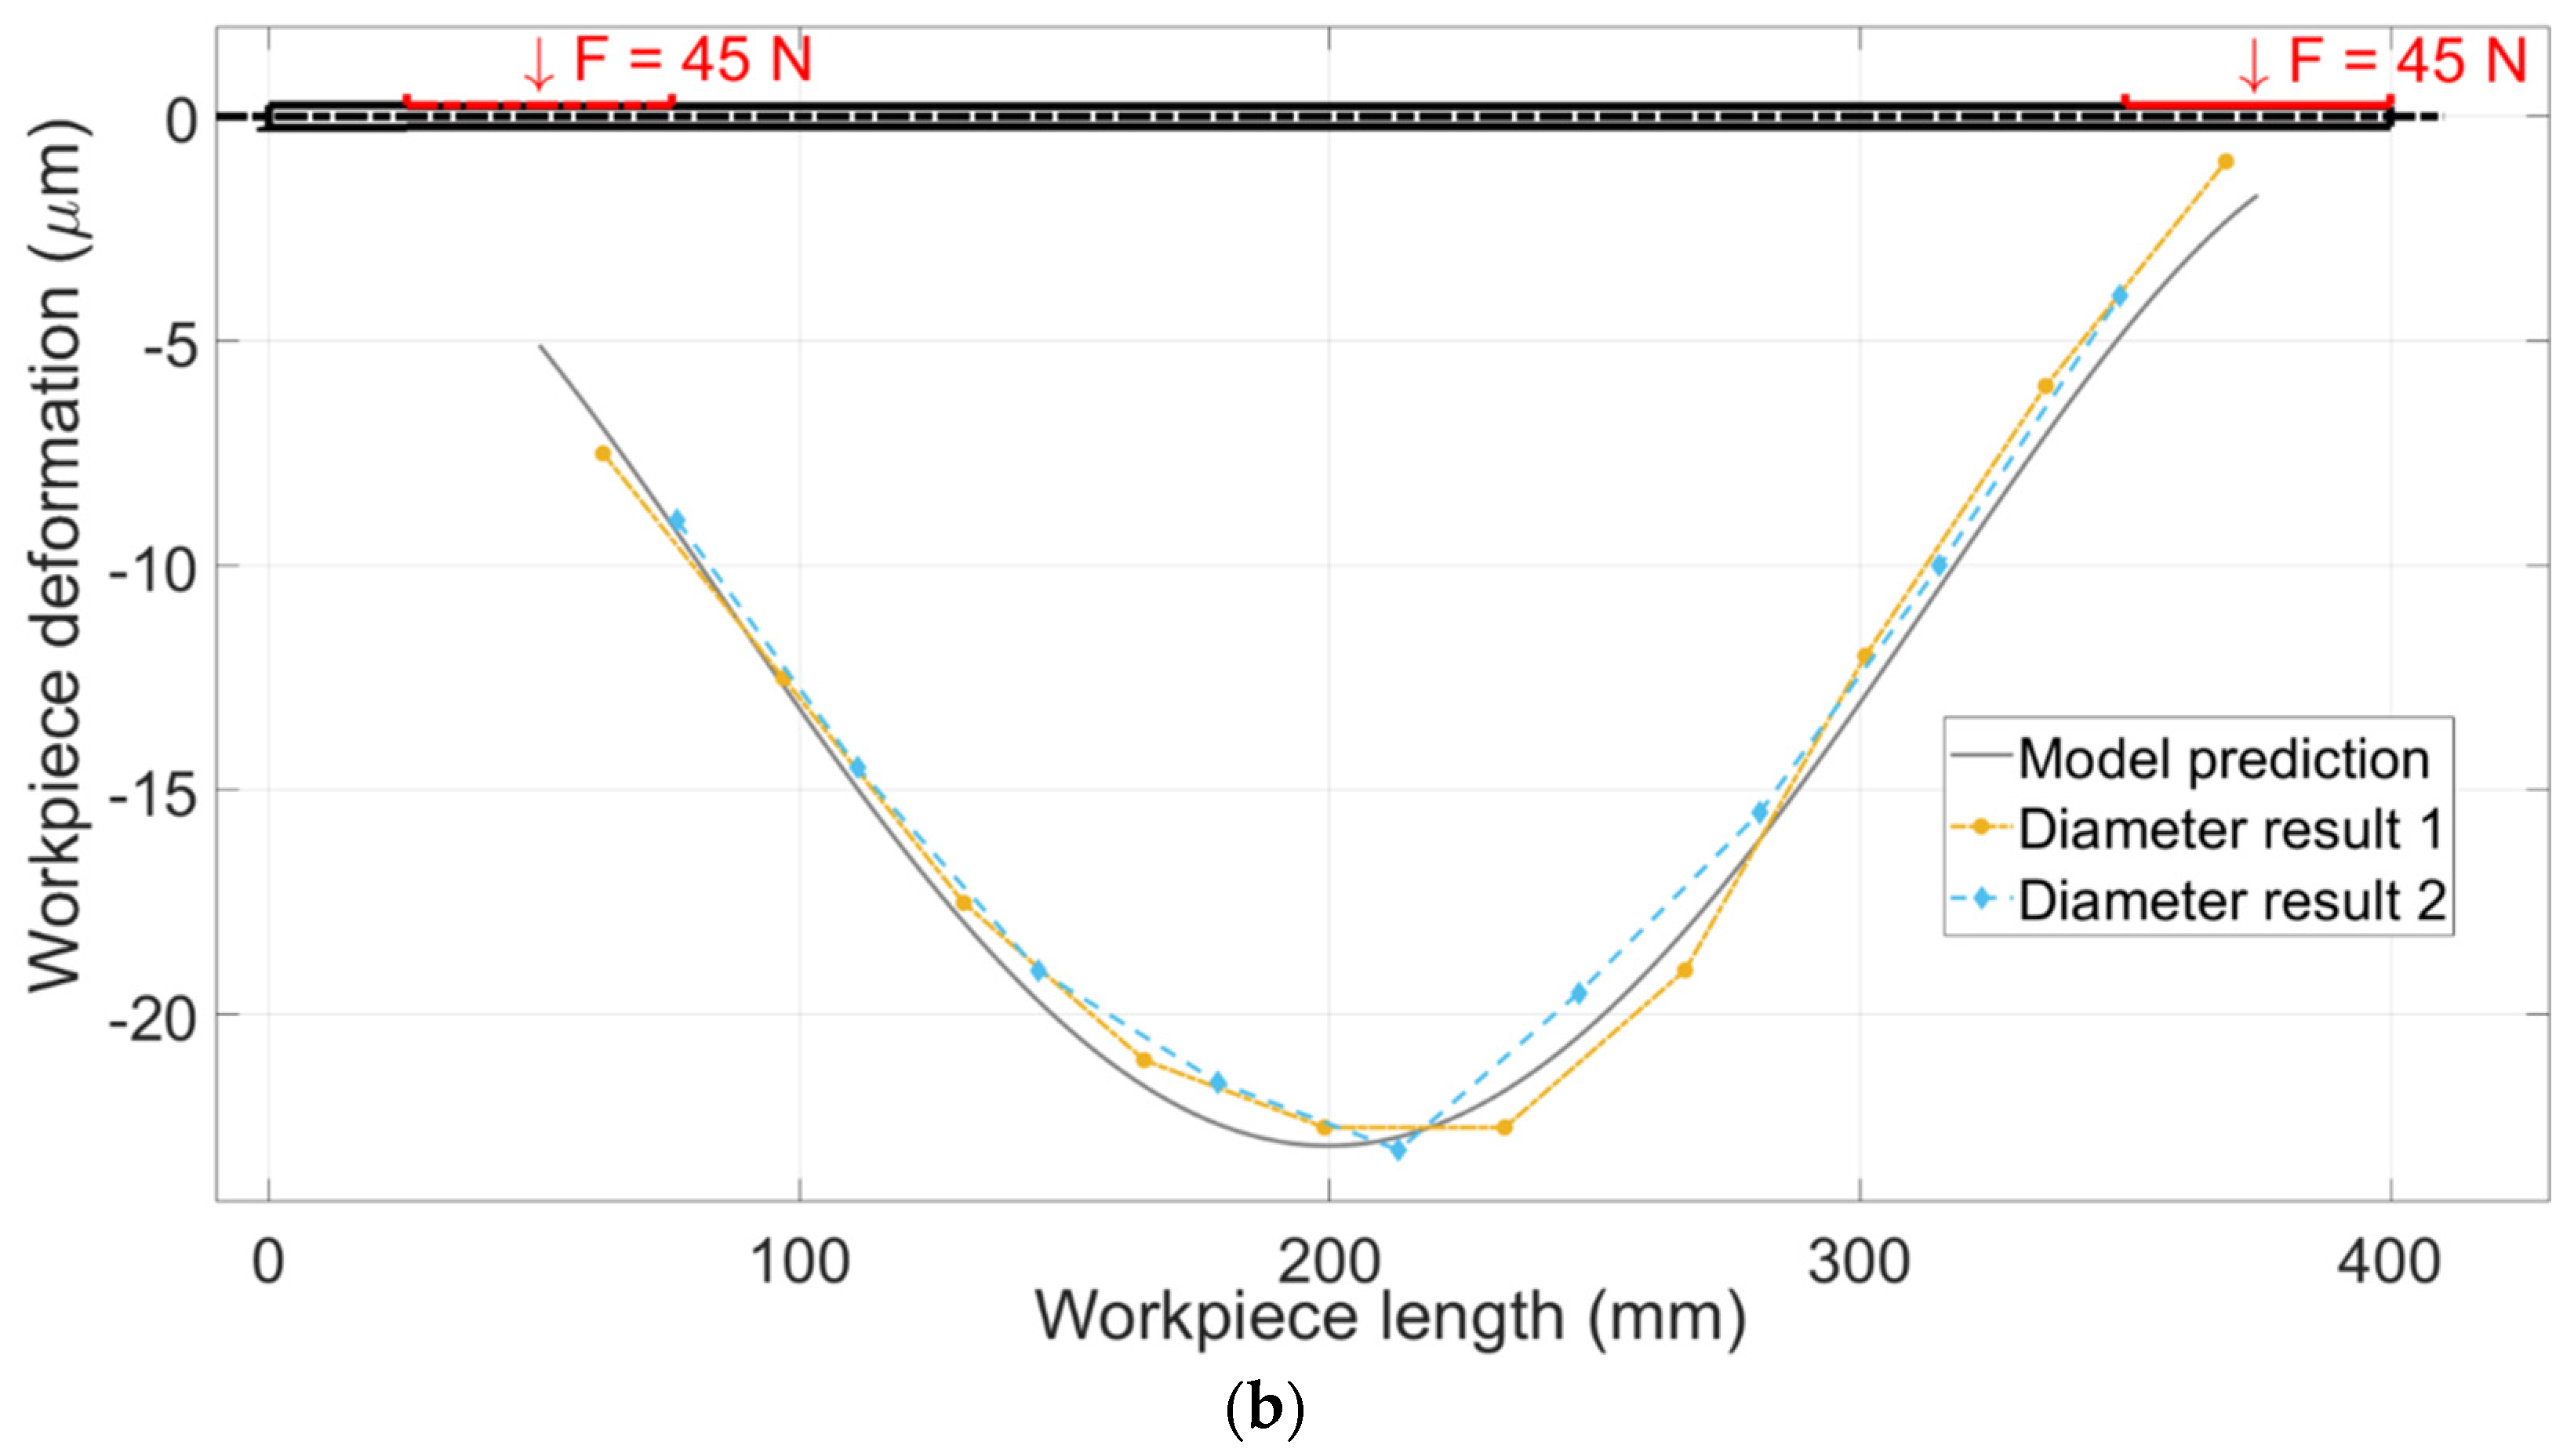
Once the normal grinding force was obtained, the inputs of the model could be determined. A maximum deformation and a deformation graphic were obtained from the output of the model. A fit between model output and profile of the measured diameters was made to quantify the model’s predictive accuracy. Some examples of the comparison between model flexion prediction and the differences in diameters are presented in Figure 10. Two finishing conditions and two roughing conditions are presented in Figure 10: (a) belongs to finishing grinding conditions, and (b) belongs to roughing conditions. The solid line refers to the model prediction, and the dashed and dashed–dotted lines denote the measured diameter difference. Since the model gave the deformation of the part, the measured diameters were divided by two to obtain the corresponding radial difference for each analyzed axial point. The vertical axis represents the deformation in µm, and the horizontal axis the position in the workpiece in mm. The force remained stable in both conditions (±1 N).
Model prediction accuracy (obtained by comparing with the diameter measurement) is shown in Table 6. Four finishing condition results and seven roughing conditions were considered for the presented results. The average and deviation included every point of the predicted shape form.

3.2. Solution for the Shape Error

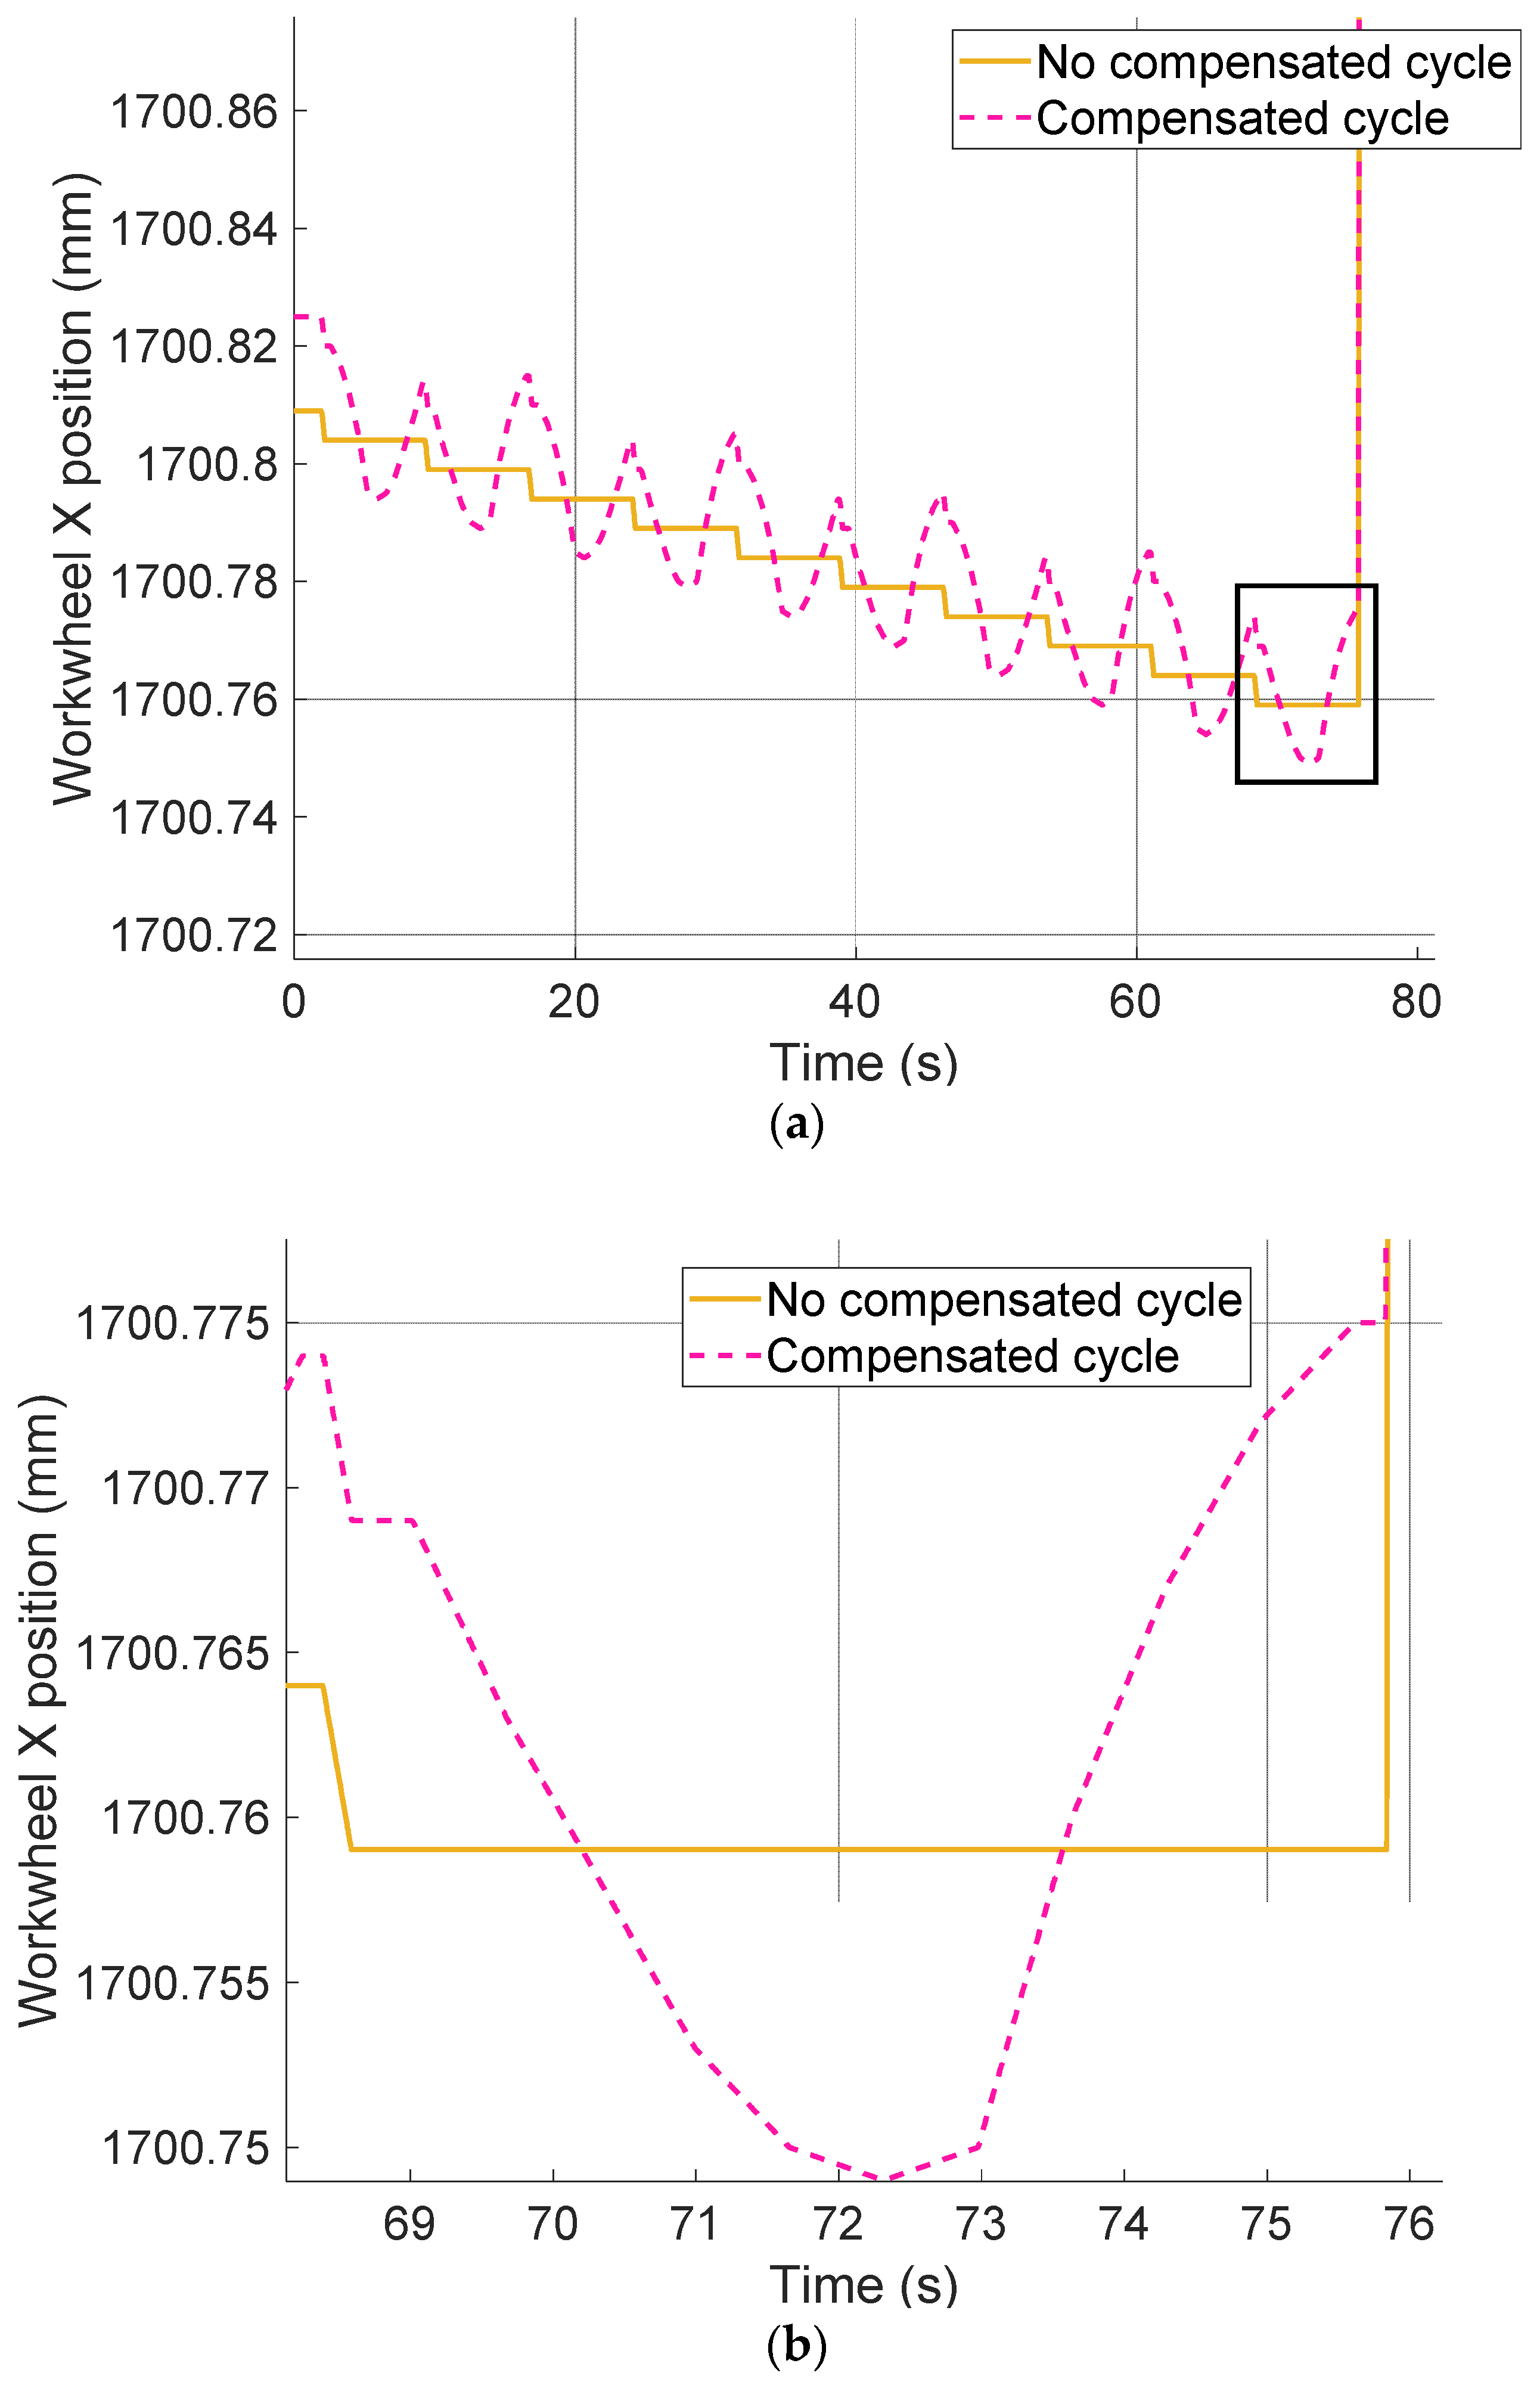
A solution was presented for correcting the workpiece shape error produced in the traverse operation. A cross-compensation cycle was applied to change wheel trajectories. The wheel drive was not linear because the main objective was to apply different forces at every point of the workpiece. The trajectory was commanded by an ISO code for each condition, depending on the normal force. Traverse linear trajectory (solid line) and cross-compensation trajectory (dash line) are both shown in Figure 11. Since the traverse movement was performed in both axial directions, the compensation trajectory was axially symmetrical for every two traverse strokes.
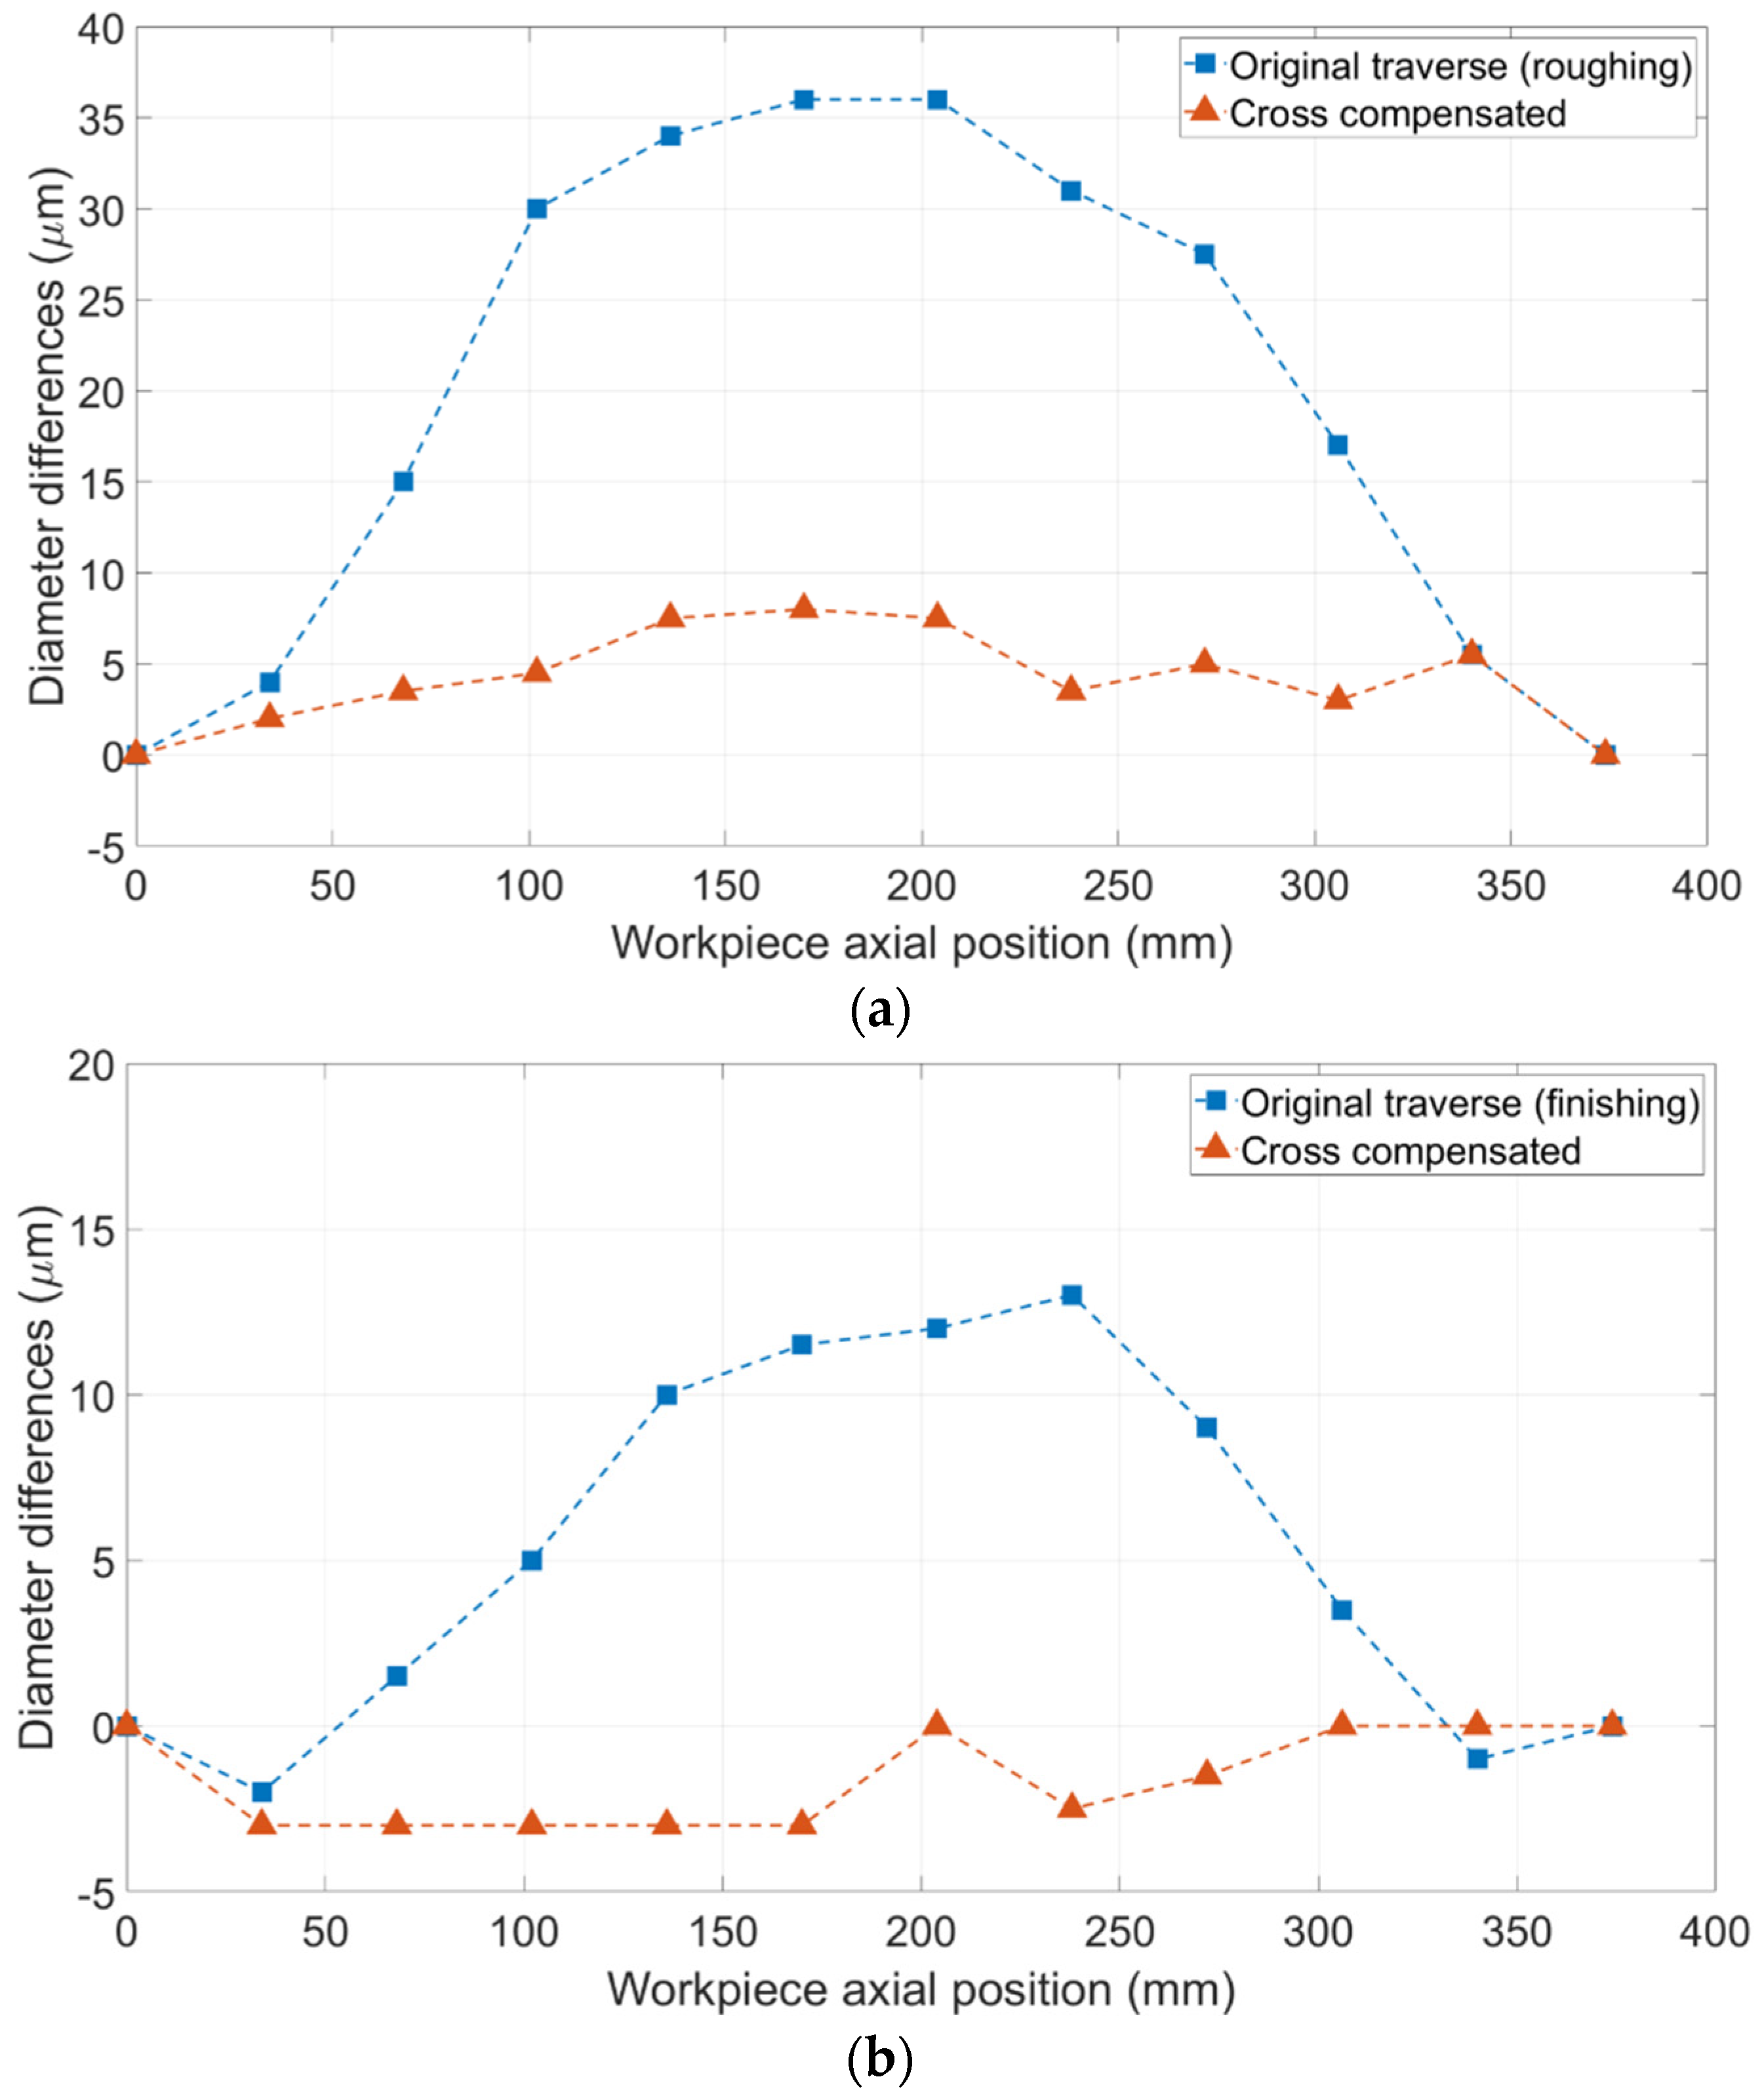
Shape-error model curves were used as an input for the trajectories in the cross-compensation cycle. As shown in Table 4, the same conditions were used for roughing and finishing without spark-out strokes to validate the solution in both conditions. Figure 12 displays the results for both (a) roughing conditions and (b) finishing conditions.
The results are shown in Table 7.
The improvement percentage of around 77% is near the value of 82% obtained by Fujii et al. [14] for a workpiece with a similar slenderness of around 18, but without the need of using a steady rest and with variation in the traverse feed rate.
Furthermore, geometric parameters were measured to compare the nominal cycles and the compensation cycle, in order to have an overall analysis of the impact of this solution in an industrial application. Previous solutions for shape-error improvement proposed in the literature have omitted this important analysis. Measurements were made using a Jenoptik Roundscan 555HR. Roundness, cylindricity, and straightness were measured in three parts of the workpiece. While roundness was measured in three different axial positions of the workpiece along its ground length, straightness was measured in three different angular positions, taking into account the whole ground length. The results, as mean values of the different measurements, are shown in Table 8.
Straightness and cylindricity showed an improvement in the compensated cycle, while roundness remained stable (with a slight decrease in the roughing condition) for both conditions. Geometrical results match with those of the diameter differences along the workpiece length, concluding that the workpiece shape deformation can affect dimensional and geometric tolerances in the same way.

4. Conclusions

The main conclusions of this work can be summarized as follows:
  • First, a new prediction model for characterizing the deformation of the slender workpiece was presented, updating previous models by including a distributed load (corresponding to the grinding wheel width) and the capacity to use different steady rests. Second, validation of the analytical model was achieved by comparison with FEM, with high accuracy. The difference between analytical model prediction and FEM was 2.7%. In future analyses, this will be validated in a real process.
  • A procedure to experimentally obtain the stiffness of the headstock and the tailstock was presented. The addition of this input to the model was necessary to achieve a good correlation between theoretical and experimental results.
  • The accuracy of the shape error prediction model was validated experimentally by comparing this with the measured diameters. Differences in results between theoretical and experimental approaches were below 5%.
  • A solution for improving the shape error in the slender workpiece in the traverse cycle was presented, reducing the shape error by 77% without the need to include steady rests in the solution, as in previous proposals. Moreover, the number of spark-out strokes could be reduced by applying cross-compensation. This could considerably reduce the cycle time.
  • The automation of shape-error correction was simplified by using the model output (shape error defined by the normal force) and cross-compensation cycle. The main reason for the simplicity of the solution for the shape error was that the only input needed for the model was the normal force, which was easily measurable by the Servotrace acquisition system of the Siemens CNC.
  • Workpiece geometric measurements from the nominal and compensated roughing and finishing cycles were presented, so an overall analysis of the influence of the solution in the grinding process was performed. Cylindricity and straightness decreased, as expected, in a similar fashion to shape error, while roundness remained stable. Thus, it is feasible to integrate this solution into real processes to improve geometrical characteristics of the workpiece.

Author Contributions

Conceptualization, I.M. and J.A.; methodology, I.M. and J.A.; software, I.M.; validation, I.M., J.A. and D.B.; formal analysis, J.A., D.B. and L.G.; investigation, I.M.; resources, J.A.; writing—original draft preparation, I.M.; writing—review and editing, I.M., J.A. and L.G.; visualization, I.M.; supervision, J.A., D.B. and L.G.; project administration, J.A.; funding acquisition, D.B. All authors have read and agreed to the published version of the manuscript.

Funding

This research was funded by The Basque Government and ELKARTEK program within the project OPTICED “Process optimization for Zero Defect Manufacturing of Big Parts”, grant number KK-2021/00003.

Data Availability Statement

Not applicable.

Conflicts of Interest

The authors declare no conflict of interest. The funders had no role in the design of the study; in the collection, analyses, or interpretation of data; in the writing of the manuscript, or in the decision to publish the results.

References

  1. Kruszynski, B.W.; Lajmert, P. An Intelligent Supervision System for Cylindrical Traverse Grinding. CIRP Ann. 2005, 54, 305–308. [Google Scholar] [CrossRef]
  2. Alvarez, J.; Zatarain, M.; Marquinez, J.I.; Ortega, N.; Gallego, I. Avoiding Chatter in Traverse Cylindrical Grinding by Continuous Workpiece Speed Variation. ASME J. Manuf. Sci. Eng. 2013, 135, 051011. [Google Scholar] [CrossRef]
  3. Shimizu, T.; Inagaki, I.; Yonetsu, S. Regenerative Chatter during Cylindrical Traverse Grinding. Bull. JSME 1978, 21, 317–323. [Google Scholar] [CrossRef] [Green Version]
  4. Cropping, L.; Grossi, N.; Scipa, A.; Campatelli, G. Fixture Optimization in Turning Thin-Wall Components. Machines 2019, 7, 68. [Google Scholar] [CrossRef] [Green Version]
  5. Park, C.W.; Kim, D.E.; Lee, S.J. Shape prediction during the cylindrical traverse grinding of a slender workpiece. J. Mater. Process. Technol. 1999, 88, 23–32. [Google Scholar] [CrossRef]
  6. Onishi, T.; Kodani, T.; Ohashi, K.; Sakakura, M.; Tsukamoto, S. Study on the Shape Error in the Cylindrical Traverse Grinding of a Workpiece with High Aspect Ratio. Adv. Mater. Res. 2014, 1071, 78–81. [Google Scholar] [CrossRef]
  7. Sakamoto, K.; Onishi, T.; Sakakura, M.; Kawaguchi, N.; Ohashi, K. Estimation of the shape error in the long workpiece from the normal grinding force of cylindrical traverse grinding. In Proceedings of the 21st International Symposium on Advances in Abrasive Technology, ISAAT 2018, Toronto, ON, Canada, 14–16 October 2018. [Google Scholar]
  8. Wang, J.; Feng, P.; Zha, T. Process monitoring in precision cylindrical traverse grinding of slender bar using acoustic emission technology. J. Mech. Sci. Technol. 2017, 31, 859–864. [Google Scholar] [CrossRef]
  9. Jianliang, G.; Rong, H. A united model of diametral error in slender bar turning with a follower rest. Int. J. Mach. Tools Manuf. 2006, 46, 1002–1012. [Google Scholar] [CrossRef]
  10. Gao, Y.; Foster, K. Computer simulation of the deformation of slender multi-diameter rollers during grinding. Int. J. Mach. Tools Manuf. 1991, 31, 83–93. [Google Scholar] [CrossRef]
  11. Tsagkir Dereli, T.; Schmidt, N.; Furlan, T.; Holtermann, R.; Biermann, D.; Menzel, A. Simulation Based Prediction of Compliance Induced Shape Deviations in Internal Traverse Grinding. J. Manuf. Mater. Process. 2021, 5, 60. [Google Scholar] [CrossRef]
  12. Mehta, P.; Mears, L. Model-based Prediction and Control of Machining Deflection Error in Turning Slender Bars. ASME J. Manuf. Sci. Eng. 2011, 2, 263–271. [Google Scholar] [CrossRef]
  13. Ding, N.; Wang, L.S.; Li, G.F.; Meng, F.Y.; Chen, D.M. Intelligent Optimization Control of Workpiece Deformation for Traverse Grinding. Key Eng. Mater. 2004, 259–260, 333–337. [Google Scholar] [CrossRef]
  14. Fujii, H.; Onishi, T.; Lin, C.; Sakakura, M.; Ohashi, K. Improvement of form accuracy in cylindrical traverse grinding with steady rest by controlling traverse speed. J. Adv. Mech. Des. Sys. Manuf. 2021, 15, 20–00505. [Google Scholar] [CrossRef]
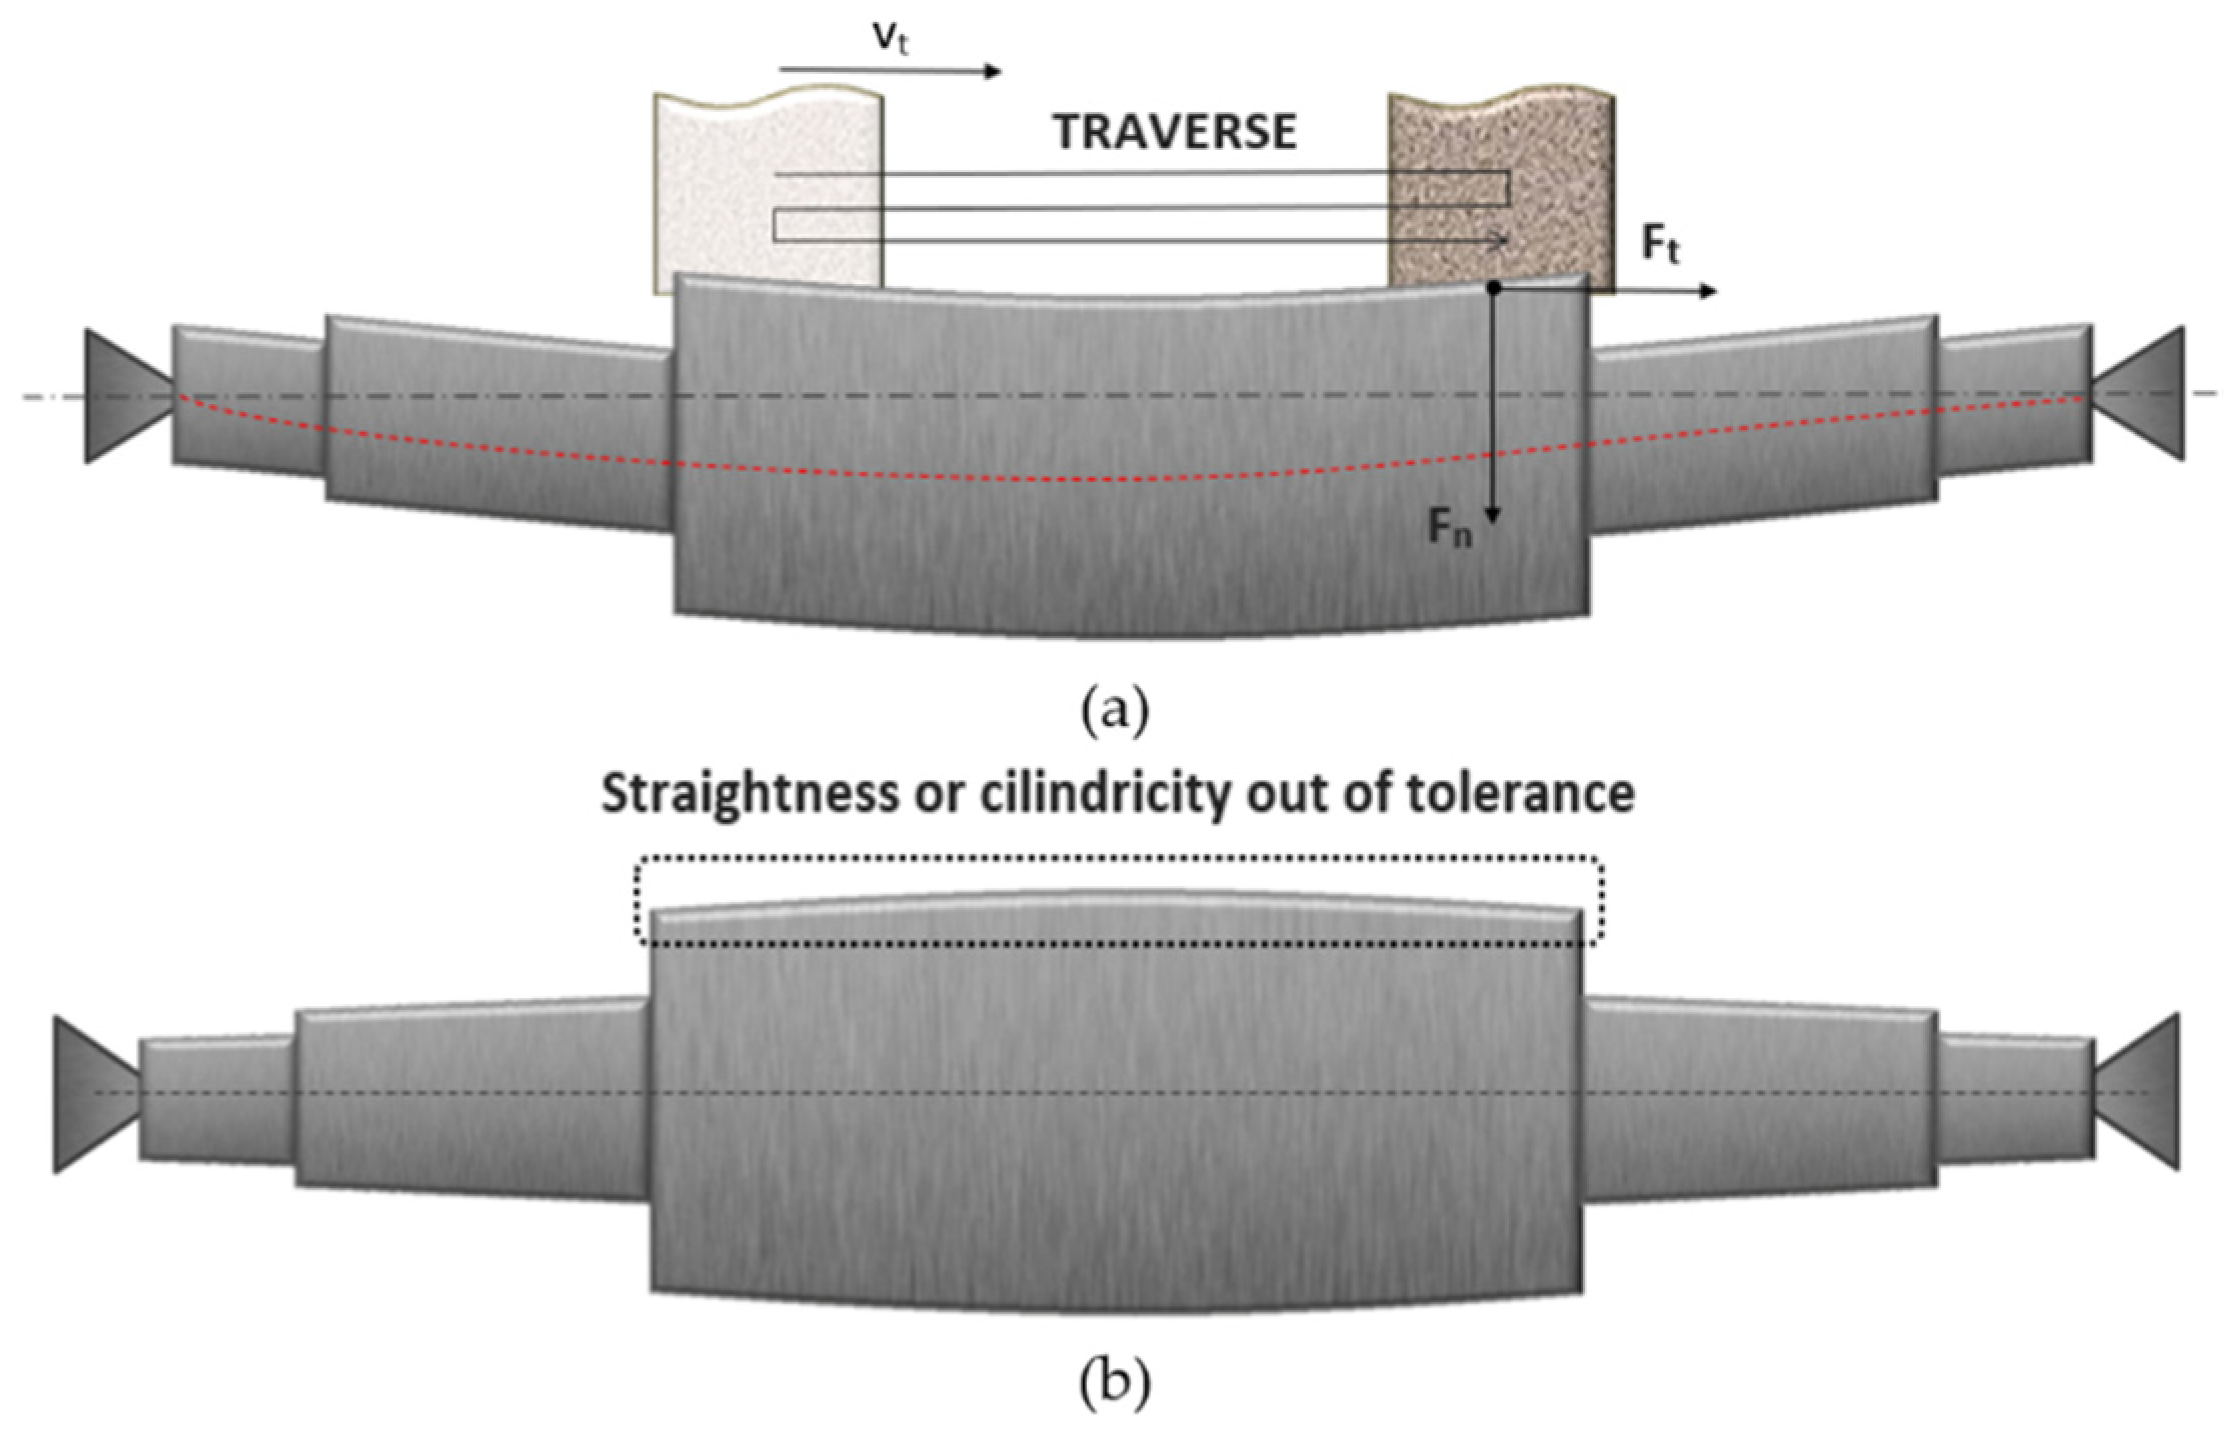
Figure 1. Elastic deformation of the workpiece: (a) during the grinding cycle; (b) the resulting form.
Metals 11 01990 g001
Figure 2. Multidiameter workpiece with steady rests.
Metals 11 01990 g002
Figure 3. Model output example with and without steady rests.
Metals 11 01990 g003
Figure 4. Case study for validation of the analytical model.
Metals 11 01990 g004
Figure 5. Deformation results for: (a) analytical model with and without steady rests; (b) finite element method with and without steady rests.
Metals 11 01990 g005
Figure 6. Stiffness measurement for: (a) headstock; (b) tailstock.
Metals 11 01990 g006
Figure 7. Static stiffness measurement results for: (a) headstock; (b) tailstock.
Metals 11 01990 g007
Figure 8. Experimental set up for a workpiece with a slenderness ratio of 16.
Metals 11 01990 g008
Figure 9. Normal-force measurement profile.
Metals 11 01990 g009
Figure 10. Comparison between flexion model and diameter difference for: (a) the finishing condition and (b) the roughing condition.
Metals 11 01990 g010aMetals 11 01990 g010b
Figure 11. Work wheel X displacement: (a) in normal traverse cycle and cross compensated complete traverse cycle and (b) a single pass.
Metals 11 01990 g011
Figure 12. Results of the deformation correction for:(a) roughing; and (b) finishing conditions.
Metals 11 01990 g012
Table 1. Model input parameters.
Workpiece density (Kg/m3)7850 (steel)
Workpiece Young modulus (GPa)210 (steel)
Workpiece diameters (mm)25, 50, 40 and 25 mm
Workpiece lengths (mm)50, 50, 150 and 150 mm
Distributed load (N)500 N applied in 400 mm
Wheel width (mm)50
Supports stiffness (N/µm)54–32
Steady rest stiffness (N/µm)60 applied in 75, 175 and 325 mm
Table 2. Model input parameters.
Density (Kg/m3)7850 (steel)
Young modulus (GPa)210 (steel)
Distributed load500 N applied in 526 mm
Wheel width (mm)50
Supports stiffness (N/µm)54–32
Steady rest stiffness (N/µm)60 applied in 500 mm
Table 3. Deformation results for both methods.
No Steady RestWith Steady Rest
Analytical162.2 µm8.9 µm
FEM165 µm9.1 µm
Difference1.7%2.1%
Table 4. Set up of the grinding cycle tests.
Grinding machineDanobat LG600 B6
Wheel specificationsCS65A 60.2 HH5 VB3
Wheel dimensions (mm)475 × 50 × 50.2
Workpiece materialHardened F5520 (53 HRC)
Workpiece dimensions (mm)Ø25 × 400
Grinding fluid Castrol 75EF coolant (4%)
Tailstock pressure (bar)5
Table 5. Grinding and dressing conditions for a traverse cycle.
Grinding ConditionsRoughingFinishing
Cutting speed (m/s)6060
Part rotational speed (RPM)171161
Stock Ø (mm)0.050.02
Traverse speed (mm/min)30001318
Grinding pass (mm)0.010.002
Spark-out strokes00
Infeed positionBoth sidesBoth sides
Dressing conditions
Cutting speed (m/s)60
Feed rate (mm/min)241
Dressing pass (mm)0.015
Strokes2
Table 6. Model prediction accuracy.
ConditionRoughingFinishing
Average error (µm)0.9690.404
Deviation (µm)1.7240.472
Table 7. Results obtained from the solution for deformation improvement.
ConditionNon-Compensated Maximum Error (µm)Compensated Maximum Error (µm)Improvement Percentage (%)
Roughing36877.8%
Finishing13376.9%
Table 8. Geometric results.
ConditionCompensationg
(µm)
e
(µm)
Straightness (µm)
Finishing Nominal (no compensation)9.980.599.06
conditionCompensated6.950.631.82
Roughing Nominal (no compensation)20.431.1519.01
conditionCompensated11.680.947.57
Publisher’s Note: MDPI stays neutral with regard to jurisdictional claims in published maps and institutional affiliations.