Abstract
Cement mortar composite has a wide range of applications on construction sites, including masonry, plastering and concrete repair. In construction sites, scabbling process is a method to remove from a few millimeters to several centimeters of defect concrete surfaces. As a result, it is essential to investigate the scabbling characteristics for cement mortar with different silica sand proportion in laser scabbling process. In this study, 5 types of cement mortar with different silica sand proportions in mixing were fabricated and scabbled by using a high-density power laser beam. The effects of silica sand proportion in color changing and penetration depth of the samples after laser scabbling process were studied. Furthermore, the generation of micro-cracks and pores were observed by using scanning electron microscopy (SEM). In addition, chemical composition changes between processed zone and non-processed zone were also evaluated by Energy Dispersive X-ray (EDX) analysis. The results of this study are expected to provide valuable knowledge in understanding of the laser scabbling process for cement-based materials.
1. Introduction
Scabbling method is a technique for removing thin layers of stone or concrete that can range in thickness from a few millimeters to several centimeters. Scabbling has also been used in many applications, including the decontamination of radioactive surface layers in nuclear power plants removing road markings, many other applications in traffic and construction works. There are several scabbling methods such as electro-hydraulic scabbling (EHS), robotic wall scabbler, piston scabbler, and handle scabbler. The EHS method achieves a scabbling depth of up to 1 inch and a scabbling rate of 30 ft2/h, whereas the piston scabbler method achieves a depth of 1/8 inch and a scabbling rate of 130 ft2/h [1,2]. However, there are several drawbacks, including the massive weight of the working system, high current, high voltage, mechanical reaction force, wear down of equipment, and negative environment impact, as well as the operator’s health [3].
Laser-aided manufacturing (LAM) has been widely employed to overcome the disadvantages of previous techniques in various fields, including car manufacturing, aerospace, and semiconductor [4,5,6]. Due to its advantages (e.g., high precision, high speed, non-contact method, remote control capabilities), the applicability of LAM has also been investigated on concrete. Numerous studies on the interaction between laser beam and concrete were carried out. For instance, Seo et al. [7] employed a high-power fiber laser cutting for 50 mm thick cement-based material. The results demonstrated that a line energy of 1.22 × 10¹⁴ J/m3 was required to fully cut the 50 mm thick cement paste. On the other hand, the effect of material composition on penetration depth, microstructural characteristic and chemical changes in the laser cutting of cement-based material were also studied [8,9]. Muto et al. [10] used a 7 kW fiber laser at a scanning speed of 2.5 mm/s, and a spot size of 10 mm. The results pointed out that 100 mm in thickness of concrete slabs was completely cut after 21 passes. In laser drilling concrete field, Kaori et al. [11] obtained drilling diameters of 4 mm to 6 mm and depths of around 50 mm in concrete samples with a compressive strength of 20–100 N/mm2 by using the appropriate laser settings. Meanwhile, the use of laser for scabbling on cement-based materials has not seemed to be attractive. In addition, to examine the effect of concrete composition, curing regime and aging on the laser scabbling process, Peach et al. [12,13,14,15] exploited IPG Photonics YPS-5000 5 kW-Continuous wave laser with nominal beam diameter of 60 mm to scabble on several concrete types, the effect curing regime, aging concrete composition were reported. The authors revealed that two major mechanism of this scabbling method were thermal stress and pore stress spalling of concrete. These results were obtained due to low power density laser. However, the using of high-power density laser in scabbling concrete has not been reported.
Several studies have carried out to investigate the interaction of laser with cement-based materials including laser cutting, laser drilling, laser glazing and laser scabbling. However, the effect of silica sand proportion in laser scabbling on cement-based material has not been studied yet. As a result, it is critical to comprehend the impact of silica sand composition in laser scabbling process. The aim of this study is obtaining a fundamental understanding of the interaction between laser and cement mortar with the differences of silica sand proportions. The formation of the glassy layer and heat-affected zone (HAZ) are the major results in the laser scabbling process on cement mortar. Thus, the study of changes in each region are needed. After laser scabbling process, all samples were evaluated in morphological changes such as color changing and scabbling penetration depth. In addition, the changes in the microstructure of each region of the scabbled samples were also determined by using a scanning electron microscope (SEM). Energy dispersive X-ray (EDX) analysis was also used to analyze changes in the chemical composition and the chemical distribution in each zone. According to the findings of this study, it is believed that the using of laser scabbling on cement based materials is applicable for walls and floor at construction sites, as well as for removing the radioactive layers in nuclear facilities.
2. Materials and Mix Design
A series of cement mortars (CM) were prepared to study the effect of the proportion of silica sand in laser scabbling. The materials involved in this study were Ordinary Portland Cement (OPC), silica sand containing about 93% SiO2 weight with a median size range of 0.15~0.53 mm. Mineral admixtures consist of cement and silica sand whose chemical compositions are shown in Table 1. In addition, Table 2 shows the proportions of the mortar samples. The label of the samples was given the same as the silica sand to cement ratio. The specimens were fabricated by mixing cement and silica sand in a laboratory mixer for 60 s before adding water and mixing for 3 min. After mixing, the mixtures were then poured into a cylindrical shape with a diameter and thickness of 53 ± 0.5 mm and 12 ± 0.35 mm, respectively. To improve hydration, the cast samples were enclosed in a plastic sheet. The specimens were removed from the mold after 24 h of storage at room temperature and immersed in a water tank for 28 days of curing. After that, the samples were then taken out and dried to eliminate the remaining water.

Table 1.
Chemical compositions of cement and silica sand measured by XRF analysis.
Table 2.
Mix compositions of the mortar specimens (proportions by weight).
3. Experimental Setup
The experimental schematic for the scabbling process of cement mortar is illustrated in Figure 1a. The laser source exploited in this study was ytterbium-pulsed fiber laser (IPG-YLPM, IPG photonics, model YLP-HP IPG photonics, Southbridge, MA, USA) with a wavelength of 1065 nm, the laser pulse duration of 30 ns, and laser spot size of 40 µm. This laser has a beam quality M2 of 1.3. Furthermore, The F-theta lens are designed to focus the laser beam transmitted through fibers from a laser source. The focal distance from the F-Theta lens to scabbling area is 180 mm. In this study, the laser power was set at 180 W and 2 mm/s for scanning speed. In Table 3, the details of each parameter are presented. In addition, depending on dimension and minimizing the cracking of tested samples, the scabbled area was chosen 10 × 10 mm2 (Figure 1b). To ensure that laser irradiation could cover the working area, the scabbling path was divided into two sections: (1) a square boundary line and (2) zigzag hatching lines. The pitch of the zigzag hatching lines was chosen at 0.05 mm to advance this scabbling method, as shown in Figure 1b.
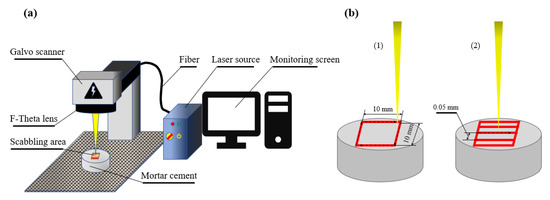
Figure 1.
(a) Experimental setup, (b) scabbling path (while (1) a square boundary line and (2) zigzag hatching lines).
Table 3.
Laser parameters of the scabbling experiment.
4. Results and Discussions
4.1. Morphological Analysis
Most of the OPC has a large composition of Al2O3, SiO2, and Fe2O3, which are the fundamental elements for creating an amorphous glassy layer at high-temperature conditions [16]. The evaporation of free water molecules and the phase transition of the specimen’s composition were caused by the thermal effect of laser irradiation on the surface of cement mortar, resulting in the formation of the glassy layer. Through observing the top, bottom and cross-section surfaces as shown in Figure 2 and Figure 3, respectively. The glassy layer formed on the specimens’ processed zone. Moreover, the color of the glassy layer changed from scorched (Figure 2a) to green and even turquoise as seen in Figure 2d,e, respectively. One explanation for this phenomenon could be the presence of metal transition ions in oxidation states, especially ferric ions in the Al3+ and Fe2+ oxidation states. At high temperatures, the Al3+ and Fe2+ exposed green and blue, respectively [17]. Furthermore, Wignarajah et al. [18] reported that the presence of metallic oxides in cement samples contributed to color changes on the processed zone impacted by the laser. Table 4 shows the color of the glassy layer that correspond to the metallic oxides in the material composition.
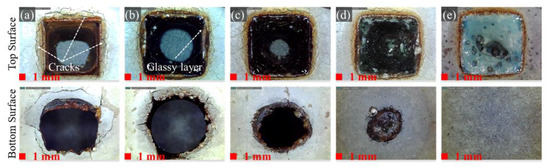
Figure 2.
Photographs of the top and bottom surfaces: (a) CM0.2; (b) CM0.4; (c) CM0.6; (d) CM0.8; (e) CM1.5.
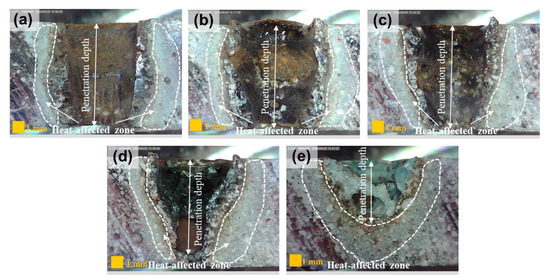
Figure 3.
Photographs of cross section: (a) CM0.2; (b) CM0.4; (c) CM0.6; (d) CM0.8; (e) CM1.5.
Table 4.
Example of colorful glassy layers produced by laser irradiation on the surface of zeolite mortar [18].
During the laser process, a thermal gradient between the melting zone and the substance material was generated, resulting in the development of thermal stress. In addition, the significant temperature gradient between the laser irradiation temperature and the ambient temperature after the scabbling process caused crack formation. Furthermore, the significant reduction of cracks in the top and bottom surfaces with increasing in silica sand proportions of samples was visually observed, as can be seen in the Figure 2.
After the scabbling experiment, the samples were cut in a cross-section to observe the three main material sections: (1) non-processed zone, (2) heat affected zone (HAZ), and (3) processed zone. Furthermore, glassy layer was generated in processed zone. The procedure for obtaining the section view is shown in Figure 4.
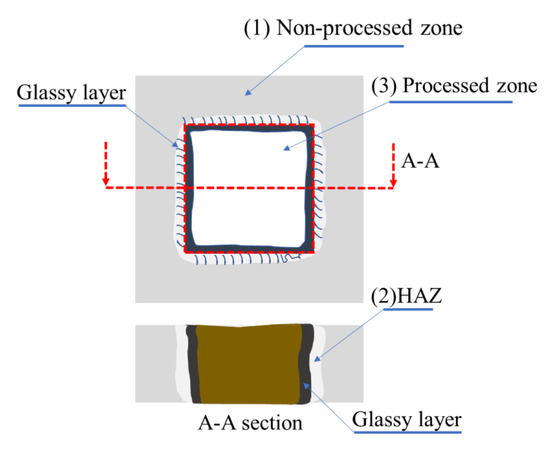
Figure 4.
Illustrating image of three main material sections.
Seo et al. [8] also confirmed that adding silica sand into basic cement-based materials results in decreasing the penetration depth. Meanwhile, Figure 4 reveals a significant decrease in penetration depth while increasing silica sand in proportion from 0.2 to 1.5. In another words, thermal conductivity (қ) describes how quickly heat flows through a material from the hotter side to the colder side under steady-state conditions, and thermal diffusivity (dt) describes how well a material can spread heat [19]. The relationship between thermal conductivity and thermal diffusivity is proportional, as shown by Equation (1). As a result, a decrease in thermal conductivity leads to a decrease in thermal diffusivity.
where, cp [J·Kg−1·k−1] is specific heat, қ [W·m−1·K−1] is thermal conductivity, dt [m2·s−1] is thermal diffusivity and [Kg·m−3] is density. According to Ganeev et al. [20] the Equation (2) expresses the relationship between thermal penetration depth by laser beam energy and the thermophysical properties of the specimen surface as equation below.
where, Ld [m] is thermal penetration depth, and τ [s] is pulse duration. Furthermore, higher silica proportion reduced the thermal conductivity of cement mortar [21]. As a result, increasing the silica sand proportions in cement-based materials lowered the scabbling penetration depth. Along with that, the laser beam was absorbed and limited due to the rapid formation of melting layer induced by the heat effect of laser irradiation.
Peach et al. [12] reported that two main mechanisms for laser scabbling of concrete are pore pressure spalling and thermal stress spalling. Pore pressure spalling was caused by the rapid increase in pore pressure caused by the vaporization of free water, while the formation of thermal stress as a result of severe thermal gradients induced by high heat rates and low thermal conductivity of concrete causes thermal stress spalling. However, they were able to achieve those results by using a low-power density laser of 1.768 W/cm2. On the other hand, in present study employed a laser with a high-power density laser of 1.432 × 10⁷ W/cm2. the evaporation of material was the major process when using this scabbling method. In addition to the evaporation of the material in the processed zone and the formation of the glassy laser were described above.
The heat affected zone (HAZ) is a zone of the base material that was not melted but impacted by the heat generated during the laser scabbling process. According to Maruyama et al. [22], the temperature for the dehydration reaction of Ca(OH)2 is 400 °C or higher. From this study it was reported that microcracks occurred in cement-based materials due to the breaking of chemical and physical bonds caused by temperature. The dehydration of calcium hydroxide is shown in Equation (3) [22]:
Ca(OH)2 + heat→CaO + H2O
As mentioned earlier, increasing the proportion of silica sand in the specimen decreased the thermal conductivity of the samples. As a result, heat transfer from the processed zone was limited. Along with that, the rapid development of the glassy layer absorbed heat energy and reduced the transmission of the heat energy generated by the laser beam. As a result, the heat generated in the samples containing higher silica sand proportion focused on the processed zone, resulting in a larger HAZ. Moreover, the heat of laser process caused the dehydration and decomposition of cement-based materials, thus the color in the HAZ changed and appeared in a whitish grey [23,24]. In all cases, the heat-affected zone can be clearly observed in a grey-white color, as can be seen in Figure 3.
4.2. Microstructural Analysis
Scanning electronic microscopy (SEM) was used to investigate changes in microstructure in samples subjected to different silica sand proportions. As shown in Figure 5a–e, micro-cracks found by SEM on the cement paste region might explain the apparent surface cracks in samples such as CM0.2 (Figure 2a), CM0.4 (Figure 2b), and CM0.6 (Figure 2c). The dehydration of cement paste was generated by heat affected by laser irradiation. Micro-cracks were generated in the cement hydrate region as can be seen Figure 5a,b. More cracks were formed in cement paste region of samples with low silica content, such as CM0.2 and CM0.4. Furthermore, Figure 5d,e show that micro-cracks formed more densely in the silica sand particles and less densely in the cement paste region, indicating that the occurrence of the cracks on the top surface (Figure 2e) decreased as the increasing of silica sand proportion in the cement mortar. Due to the higher melting temperature of silica sand, the generation of a glassy layer with the major component being silicon in the silica sand restricted the heat transmission of laser beam.
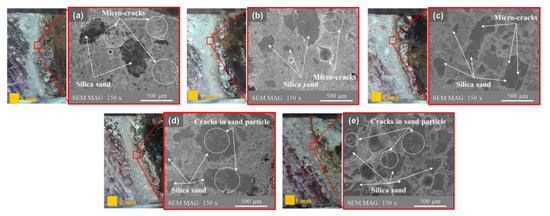
Figure 5.
SEM images of heat-affected zone: (a) CM0.2; (b) CM0.4; (c) CM0.6; (d) CM0.8; (e) CM1.5.
Figure 6 shows the SEM images in the processed zone of cement mortar samples. The size of the pores grew with increasing of silica sand proportions in the cement mortar. Furthermore, samples with a higher silica sand content had a denser appearance of micro-cracks near the pores. Due to that, it can be assumed that the porosity of the glassy layer in samples CM0.8 and CM1.5 is higher than in other samples. It also implies that the glassy layer’s strength is decreased and easily removed with an increasing of silica sand proportion.
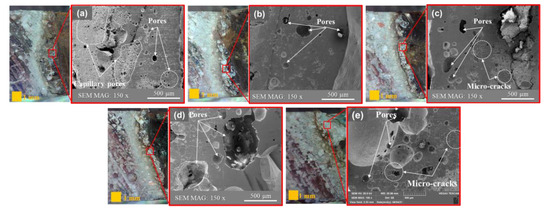
Figure 6.
SEM images of processed zone: (a) CM0.2; (b) CM0.4; (c) CM0.6; (d) CM0.8 and (e) CM1.5.
4.3. EDX Analysis
The analytical method of energy-dispersive X-ray spectroscopy (EDX) was also used to determine the elements (elemental composition) present on any given material sample. In addition, when used in combination with SEM, allows for the analysis of near-surface elements and their amount at different positions providing a map of the sample [25]. Since the glassy layer is the zone directly affected by laser irradiation, this study investigated the changes in the chemical composition of cement-based materials by analyzing two zones, (1) the non-processed zone and (2) the processed zone (glassy layer), as shown in Figure 7. The decrease in calcium and the increase in silicon percentage are the two major changes in the specimens when comparing the chemical composition of the glassy layers and non-processed zones in the CM series, respectively. The most significant change in calcium element was observed in sample CM0.6, where the percentage of calcium element in the non-processed zone was 81.75% and decreased to 39.77% in the processed zone. In addition, at specimen CM0.8, the percentage of silicon element in the non-processed zone increased from 8.75 to 40.59% in the processed zone. Since the evaporation temperature of calcium is 1484 °C and that of silicon is 3265 °C, a part of the calcium has evaporated after solidification, which can explain the above-mentioned phenomenon. As a result of calcium evaporation, the percentage of silicon has increased while the percentage of calcium has dropped.
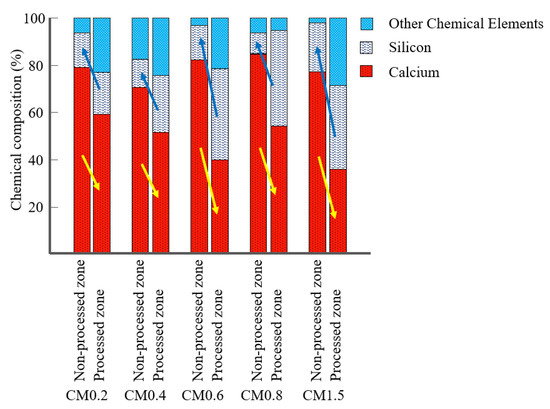
Figure 7.
Energy dispersive X-ray (EDX) analysis of chemical composition change.
EDX mapping was also exploited to determine the distribution of silicon and calcium composition in non-processed and processed zone. Before the EDX mapping process, the specimens were ground after cross section cutting to achieve a high surface quality. Figure 8 shows the EDX mapping images of 2 main chemical components of silicon and calcium in each sample. The chemical mapping in non-processed zone in each sample shows the distribution of silica sand and cement paste. Meanwhile, the heat effect of laser irradiation generated a glassy layer whose major components were silica sand and cement paste, which was melted and resolidified. As a result, the heat effect of laser irradiation caused the redistribution of the element composition between the processed and non-processed zone. Furthermore, the mixing of silicon and calcium component is the obvious difference between the processed and non-processed zone. Under the direct effect of the laser beam in the processed zone, the sample components which included cement and silica sand were melted and redistributed. Thus, silica sand particles were not found in the processed zone. As can be observed in Figure 8, there is a mixing of silicon and calcium components in the processed zone. In contrast, there is no mixing or redistribution of silicon and calcium components in the non-processed zone. Silica sand particles with silicon as the major component could be detected. In addition, the chemical redistribution is significantly greater in high silica sand proportion samples such as CM0.8 and CM1.5 than in CM0.2 and CM0.4 samples. Furthermore, when comparing the distribution of silicon and calcium, the density of silicon was densely distributed in non-processed zone as the proportion of silica sand increased in high silica sand proportion samples such as CM0.8 and CM1.5.
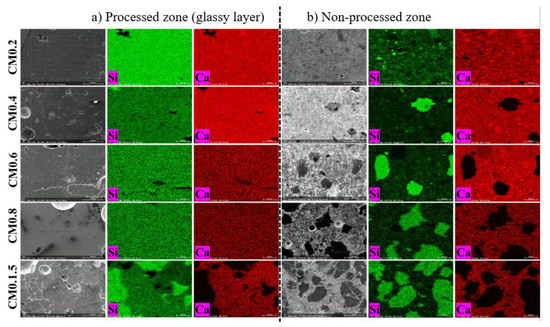
Figure 8.
Elemental mapping for Ca and Si on the specimens after the laser scabbling.
5. Conclusions
Laser scabbling, which advances beyond the limitations of the previous methods, might be one of the better options for scabbling cement-based materials. Understanding the effects of silica sand on the composition of materials used in scabbling is essential to study. A pulsed laser was used in this study with a power density of 1.45 × 10⁵ W/mm2. Experiments on cement mortar samples CM0.2, CM0.4, CM0.6, CM0.8, and CM1.5 were conducted to investigate the effect of silica sand proportion in laser scabbling on cement mortar. Furthermore, SEM/EDX analysis explored changes in the microstructure and chemical composition of cement-based materials under the influence of laser. The main observations and results of this study are summarized as follows:
- Increasing the silica sand proportion during laser scabbling process resulted in two primary results: (1) decreased scabbling penetration depth, and (2) fewer surface cracks on the top and bottom surfaces.
- Samples with lower silica sand proportions such as CM0.2, CM0.4 appeared more surface-cracks than CM0.8, CM1.5 which can be explained by the more generation of microcracks in the cement paste of the HAZ.
- Microcracks and pores were more apparent and denser in the glassy layer of the samples with higher silica sand proportions.
- The evaporation of material was the dominant mechanism of this scabbling method due to high power density laser.
- In laser scabbling, the chemical changes in the cement mortar were an increase in silicon percentage and a decrease in calcium percentage when compared between the processed zone and non-processed zone. The main reason for this phenomenon is that the evaporation temperature of silica sand is greater than cement.
Due to the laboratory scale, the use of silica sand and cement types was limited in this study. On the other hand, laser scabbling on cement-based material is a work that is dependent on specific silica sand and cement types in specific locations. So that, in future work, the various types of silica sand and cement in making cement mortar is needed to investigate. Furthermore, experiments are required to determine the effects of silica sand proportion on the influence of volume removal, the surface temperature of samples scabble using a high-power density laser. Furthermore, the optimization of laser parameters is considered to achieve the optimal result in depth penetration and volume removal.
Author Contributions
D.L. and Y.S. conceived and designed the experiment; D.L. and Y.S. performed the experiments; D.L., Y.S. and T.-V.H. analyzed the data; D.L., Y.S. and T.-V.H. wrote the paper. All authors have read and agreed to published version of the manuscript.
Funding
The research described herein was sponsored by the National Research Foundation of Korea (NRF) grant funded by the Korean government (MSIT; Ministry of Science and ICT) (No. 2019R1A2C1089644) and by the Korea Innovation Foundation grant funded by the Korea government (MSIT) (No. 2020-DD-SB-0159). This work was also supported by the research grant of the Kongju National University in 2021.
Institutional Review Board Statement
Not applicable.
Informed Consent Statement
Not applicable.
Data Availability Statement
Data is contained within the article.
Conflicts of Interest
The authors declare no conflict of interest.
References
- International Atomic Energy Agency. State of the Art Technology for Decontamination and Dismantling; IAEA: Vienna, Austria, 1999; p. 81. [Google Scholar]
- Information Concerning Nuclear Installations Decommissioning Projects. In Decontamination Techniques Used in Decommissioning Activities; Nuclear Energy Agency: Paris, France, 1999; p. 51.
- Feltcorn, E. Technology Reference Guide for Radiologically Contaminated Surfaces; United States Environmental Protection Agency: Washington, DC, USA, 2006. [Google Scholar]
- Trinh, L.N.; Lee, D. The characteristics of laser welding of a thin aluminum tab and steel battery case for lithium-ion battery. Metals 2020, 10, 842. [Google Scholar] [CrossRef]
- Trinh, L.N.; Lee, D. The effect of using a metal tube on laser welding of the battery case and the tab for lithium-ion battery. Materials 2020, 13, 4460. [Google Scholar] [CrossRef] [PubMed]
- Lee, D.; Mazumder, J. Effects of laser beam spatial distribution on laser-material interaction. J. Laser Appl. 2016, 28, 032003. [Google Scholar] [CrossRef]
- Seo, Y.; Lee, D.; Pyo, S. High-Power fiber laser cutting for 50-mm-thick cement-based materials. Materials 2020, 13, 1113. [Google Scholar] [CrossRef] [PubMed] [Green Version]
- Lee, D.; Seo, Y.; Pyo, S. Effect of laser speed on cutting characteristics of cement-based materials. Materials 2018, 11, 1055. [Google Scholar] [CrossRef] [PubMed] [Green Version]
- Seo, Y.; Lee, D.; Pyo, S. Microstructural characteristics of cement-based materials fabricated using multi-mode fiber laser. Materials 2020, 13, 546. [Google Scholar] [CrossRef] [PubMed] [Green Version]
- Muto, S.; Tei, K.; Masuda, Y.; Miyagawa, N.; Jyosui, K.; Yamaguchi, S.; Fujioka, T. Cutting Technique for Civil Engineering Using a High-Power Laser. Rev. Laser Eng. 2008, 36, 1203–1205. [Google Scholar] [CrossRef] [Green Version]
- Nagai, K.; Beckemper, S.; Poprawe, R. Laser Drilling of Small Holes in Different Kinds of Concrete. Civ. Eng. J. 2018, 4, 766. [Google Scholar] [CrossRef] [Green Version]
- Peach, B.; Petkovski, M.; Blackburn, J.; Engelberg, D.L. An experimental investigation of laser scabbling of concrete. Constr. Build. Mater. 2015, 89, 76–89. [Google Scholar] [CrossRef] [Green Version]
- Peach, B.; Petkovski, M.; Blackburn, J.; Engelberg, D.L. Laser scabbling of mortars. Constr. Build. Mater. 2016, 124, 37–44. [Google Scholar] [CrossRef] [Green Version]
- Peach, B.; Petkovski, M.; Blackburn, J.; Engelberg, D.L. The effect of concrete composition on laser scabbling. Constr. Build. Mater. 2016, 111, 461–473. [Google Scholar] [CrossRef]
- Peach, B.; Petkovski, M.; Blackburn, J.; Engelberg, D.L. The effect of ageing and drying on laser scabbling of concrete. Constr. Build. Mater. 2018, 188, 1035–1044. [Google Scholar] [CrossRef] [Green Version]
- Lawrence, J.; Li, L. A comparative study of the surface glaze characteristics of concrete treated with CO2 and high power diode lasers Part II: Mechanical, chemical and physical properties. Mater. Sci. Eng. A 2000, 287, 25–29. [Google Scholar] [CrossRef] [Green Version]
- Mungchamnankit, A.; Kittiauchawal, T.; Kaewkhao, J.; Limsuwan, P. The color change of natural green sapphires by heat treatment. Procedia Eng. 2012, 32, 950–955. [Google Scholar] [CrossRef] [Green Version]
- Wignarajah, S.; Sugimoto, K.; Nagai, K. Effect of laser surface treatment on the physical characteristics and mechanical behaviour of cement base materials. Laser Inst. Am. 1993, 75, 383–392. [Google Scholar]
- Bouguerra, A.; Aït-Mokhtar, A.; Amiri, O.; Dio, M.B. Measurement of thermal conductivity, thermal diffusivity and heat capacity of highly porous building materials using transient plane source technique. Int. Commun. Heat Mass Transf. 2001, 28, 1065–1078. [Google Scholar] [CrossRef]
- Ganeev, R.A. Periodic Nanoripples Formation on the Semiconductors Possessing Different Bandgaps; Elsevier Ltd: Amsterdam, The Netherlands, 2018; Volume 1, pp. 1–38. [Google Scholar]
- Demirboǧa, R.; Gül, R. The effects of expanded perlite aggregate, silica fume and fly ash on the thermal conductivity of lightweight concrete. Cem. Concr. Res. 2003, 33, 723–727. [Google Scholar] [CrossRef]
- Maruyama, A.; Kurosawa, R.; Ryu, J. Effect of Lithium Compound Addition on the Dehydration and Hydration of Calcium Hydroxide as a Chemical Heat Storage Material. ACS Omega 2020, 5, 9820–9829. [Google Scholar] [CrossRef] [PubMed]
- Khoury, G.A. Compressive strength of concrete at high temperatures: A reassessment. Mag. Concr. Res. 1992, 44, 291–309. [Google Scholar] [CrossRef]
- Hager, I. Colour Change in Heated Concrete. Fire Technol. 2014, 50, 945–958. [Google Scholar] [CrossRef] [Green Version]
- Yesilkir -Baydar, S.; Oztel, O.N.; Cakir-Koc, R.; Candayan, A. Evaluation Techniques; Elsevier Ltd: Amsterdam, The Netherlands, 2017. [Google Scholar]
Publisher’s Note: MDPI stays neutral with regard to jurisdictional claims in published maps and institutional affiliations. |
© 2021 by the authors. Licensee MDPI, Basel, Switzerland. This article is an open access article distributed under the terms and conditions of the Creative Commons Attribution (CC BY) license (https://creativecommons.org/licenses/by/4.0/).