Article

Laser Micro Polishing of Tool Steel 1.2379 (AISI D2): Influence of Intensity Distribution, Laser Beam Size, and Fluence on Surface Roughness and Area Rate

by
André Temmler
1,*,
Magdalena Cortina
2,
Ingo Ross
2,
Moritz E. Küpper
3 and
Silja-Katharina Rittinghaus
2
1
Fraunhofer Institute for Applied Optics and Precision Engineering (IOF), Albert-Einstein-Straße 7, 07745 Jena, Germany
2
Fraunhofer Institute for Lasertechnology (ILT), Steinbachstraße 15, 52074 Aachen, Germany
3
Chair for Lasertechnology, RWTH Aachen University, Steinbachstraße 15, 52074 Aachen, Germany
*
Author to whom correspondence should be addressed.
Metals 2021, 11(9), 1445; https://doi.org/10.3390/met11091445
Submission received: 5 July 2021 / Revised: 27 August 2021 / Accepted: 7 September 2021 / Published: 13 September 2021
(This article belongs to the Special Issue Advances in Laser Materials Processing)

Abstract

:
Within the scope of this study, basic research was carried out on laser micro polishing of the tool steel 1.2379 (AISI D2) using a square, top-hat shaped intensity distribution. The influence of three different quadratic laser beam sizes (100 µm, 200 µm, 400 µm side length) and fluences up to 12 J/cm2 on the resulting surface topography and roughness were investigated. Surface topography was analyzed by microscopy, white light interferometry, spectral roughness analysis, and 1D fast Fourier transformation. Scanning electron microscopy and electrical discharge analyses indicate that chromium carbides are the source of undesired surface features such as craters and dimples, which were generated inherently to the remelting process. Particularly for high laser fluences, a noticeable stripe structure was observed, which is typically a characteristic of a continuous remelting process. Although the micro-roughness was significantly reduced, often, the macro-roughness was increased. The results show that smaller laser polishing fluences are required for larger laser beam dimensions. Additionally, the same or even a lower surface roughness and less undesired surface features were created for larger laser beam dimensions. This shows a potential path for industrial applications of laser micro polishing, where area rates of up to several m2/min might be achievable with commercially available laser beam sources.

1. Introduction

Manual polishing of metallic surfaces is still a widespread and common manufacturing process, which primarily aims to significantly reduce the surface roughness. However, the polishing result often depends heavily on the condition and skill of the person who conducts the manual polishing. Additionally, the manual polishing process gets increasingly cost intensive and time consuming when the surface to be polished is not a plane but an arbitrarily formed surface with small surface features and small curvature radii. Laser polishing is a new manufacturing process with the potential to at least partially replace manual polishing for small and complex shaped surfaces [1]. This is underscored e.g., by the proven potential for full automation, by the flexible use of wear-free “polishing tools”, and by the high spatial resolution of the laser polishing process [2]. Therefore, it is understandable that an increasing number of researchers and studies aim to strengthen the fundamental understanding of the laser polishing process.
The special research focus of this study lies on the surface roughness evolution after laser micro polishing (LµP) of cold working steel 1.2379 (DIN X153CrMoV12, AISI D2) using square intensity distributions of different sizes. D2 is typically used for deep drawing tools since it contains high amounts of carbon and chromium. Adapted heat treatment cycles usually lead to the precipitation of M23C6 and M7C3 carbides within the martensitic steel matrix [3]. In conventional forming operations, this results in a high resistance against the adhesive and abrasive wear of deep drawing tools made from this material (Sing et al. [3]). Within a DFG priority program of the German Research Association SPP 1676 (“Dry metal forming”), the cold working steel was selected as one ‘standard material’. Therefore, laser processing and its effects on surface topography, mechanical properties, and wear received broad attention and were investigated, e.g., for rotary swaging [4,5], cold massive forming [6], cold extrusion [7,8], or deep drawing [9,10,11,12].
Since laser polishing is a highly localized process including extraordinary temperature gradients of up to 109 K s−1, an intense interaction of radiation and material is typical for this energy beam-based process [13]. An introduction to the topic of energy beams for surface modifications including laser polishing was given by Deng et al. [14]. The review article of Krishnan and Fang [15] focuses more on the specifics of the laser-polishing process and presents a decent collection of relevant studies and works on laser polishing. Although already a few years old, Bordatchev et al. [16] also delivers a systematic evaluation of achieved laser polishing results for a wide range of metals. Bhaduri et al. [17] lists some key publications on laser polishing (using cw and pulsed laser radiation) for various materials with high relevance in industrial applications. Concerning specifically LµP, the studies of Temmler et al. [18,19] include a more detailed introduction to the specifics and characteristics of LµP for metals. A more general introduction on the interaction of pulsed laser radiation and material was recently compiled by Li and Guan [20] and gives a good overview on theoretical fundamentals, which are also partially relevant for pulsed laser remelting. However, LµP typically aims not to work in the ablation regime, so that a reduction of surface roughness is achieved by the redistribution of molten material [21]. Thus, the melt duration is decisive for the effective reduction of spatial frequencies or wavelengths in LµP [22]. Kuisat et al. [8] found even for the direct laser interference patterning (DLIP on Ti64 and Scalmalloy©) process using ns laser pulses that this smoothing effect is inherent to the remelting process and occurs simultaneously to the DLIP process. This is similar to the WaveShape process, which achieves structuring and polishing in one process step [23] or even utilizes a spatially adapted laser power modulation for the reduction of waviness on a surface (Oreshkin et al. [24]). Overall, the laser polishing process can be seen as a spatial low-pass filtering of a surface [25,26], resulting in an effective reduction of surface roughness. Therefore, the reduction of surface roughness in LµP is specifically pronounced for the micro-roughness, while the waviness of the surface stays typically unaffected [27]. Thus, special tools for surface roughness analysis are usually required such as spatial frequency [28] or spatial wavelength analysis [27] based on an adapted fast Fourier transformation. The longest spatial wavelength or smallest spatial frequency that is effectively reduced by LµP is referred to as critical wavelength [29] and critical frequency [30], respectively. Nonetheless, a fundamental and complete understanding of the specific roughness evolution for an arbitrary material is still not in sight.
In addition to surface roughness, specifically, the mechanical properties after LµP have been the focus of many studies. A detailed and extensive study on material properties after laser remelting (continuous wave (cw) and pulsed) of tool steel was presented by Temmler et al. [27]. Guan et al. [31] investigated the effect of pulse duration and heat transfer for laser pulses in the microsecond domain on Mg alloy AZ91D and found that discrete laser remelting occurs with a characteristic, homogeneous microstructure. In addition to surface structuring, Ma et al. [32] showed for additively manufactured Ti alloys that laser polishing is an effective method to reduce surface roughness, increase gloss, and enhance microhardness. Morrow and Pfefferkorn [13] found local hardness variations due to a heterogenic microstructure after pulsed laser remelting on tool steel S7. In the context of surface hardening in pulsed surface treatment, Maharjan et al. [33] compared the hardness of 50CrMo4 steel after laser treatment using fs, ps, ns, ms, and cw laser radiation and found that the most pronounced hardening effect was achieved for longer pulse duration and cw laser radiation. Furthermore, alone, the change in microstructure leads to characteristic surface features resulting from the track overlap of the scanning strategy. Both Morrow and Pfefferkorn [13] as well as Ma et al. [33] found a characteristic backtempering effect from overlapping laser pulses due to carbon diffusion [27]. Li et al. [34] found through a thermal history analysis of the laser-polishing process that martensitic phase formation in the remelted layer leads to significant effects on fatigue, residual stress, and strength. Temmler et al. [27] found particularly high residual stresses after LµP of tool steel H11 in an Argon environment, while Bhaduri et al. [35] found high tensile stresses after LµP of AlSi10Mg parts in an atmospheric environment. Liang et al. [36] found for laser polishing of additively manufactured Ti6Al4V an increase in hardness due to reduced porosity, an improved cycle fatigue life, and an improved cell biocompatibility.
Although different approaches for theoretical and FEM models of the LµP process exist [37] (e.g., by Mai et al. [38], Ukar et al. [39], Chow et al. [40], Vadali et al. [25], Ma et al. [41], or Richter et al. [42]), a precise prediction of surface roughness is only possible for a few selected materials and a narrow range of process parameters [25]. A reason for this is the complex interactions between laser beam and material based on their multiple properties, which makes the integration of all aspects into a complete and coherent model a very challenging task [37]. Particularly, process-inherent surface structure formation, resulting from specific material properties or from the selected process parameters and processing strategy as described by Nüsser et al. [43], is not considered in any model. However, these process-inherent surface features often remain on the surface and lead to a considerable surface roughness after laser polishing.
Additionally, the specific shape of the intensity distribution (ID) of a laser beam might be important for a laser-based process. The effects of the laser beam intensity distribution for laser welding were discussed by e.g., Kaplan [44]. If possible, the ID should be specifically tailored to the requirements of the laser process, the material, and its application, so that an adapted time-dependent temperature profile can be created (Völl et al. [45]). With regard to squared IDs in laser-based processing, Khare et al. [46] came to the conclusion that squared IDs enable higher process speeds and reduce the risk of centerline solidification cracking. Furthermore, in comparison to circular laser beams, the squared ID leads to changes in the microstructural growth, which is dominantly axial instead of columnar (Kou [47]). More specifically regarding laser polishing, Nüsser et al. [48] found that a squared ID might be beneficial for LµP of Ti6Al4V.
In this context, this study contributes to expand and strengthen the empirical data basis for laser micro polishing of high-carbon steels. This study provides an in-depth analysis of an LµP polished surfaces of 1.2379+ tool steel and demonstrates the transition from a discrete, pulsed to continuous remelting process for high fluences. Additionally, it provides a systematical analysis by directional 1D FFT analyses and shows different smoothing behaviors in the x and y directions. Furthermore, this study investigates a correlation between carbides and the formation of craters in pulsed laser processing. Finally, this study contains results and discussion regarding achievable area rates in LµP, and regarding a correlation of micro-hardness evolution and process characteristics in laser polishing (LµP or cw laser polishing). Overall, the material 1.2379+ poses multiple challenges for laser polishing, which were systematically identified, and potential mechanisms were discussed. Therefore, this work joins the steadily increasing list of experimental studies on laser polishing over the past decade.

2. Materials and Methods

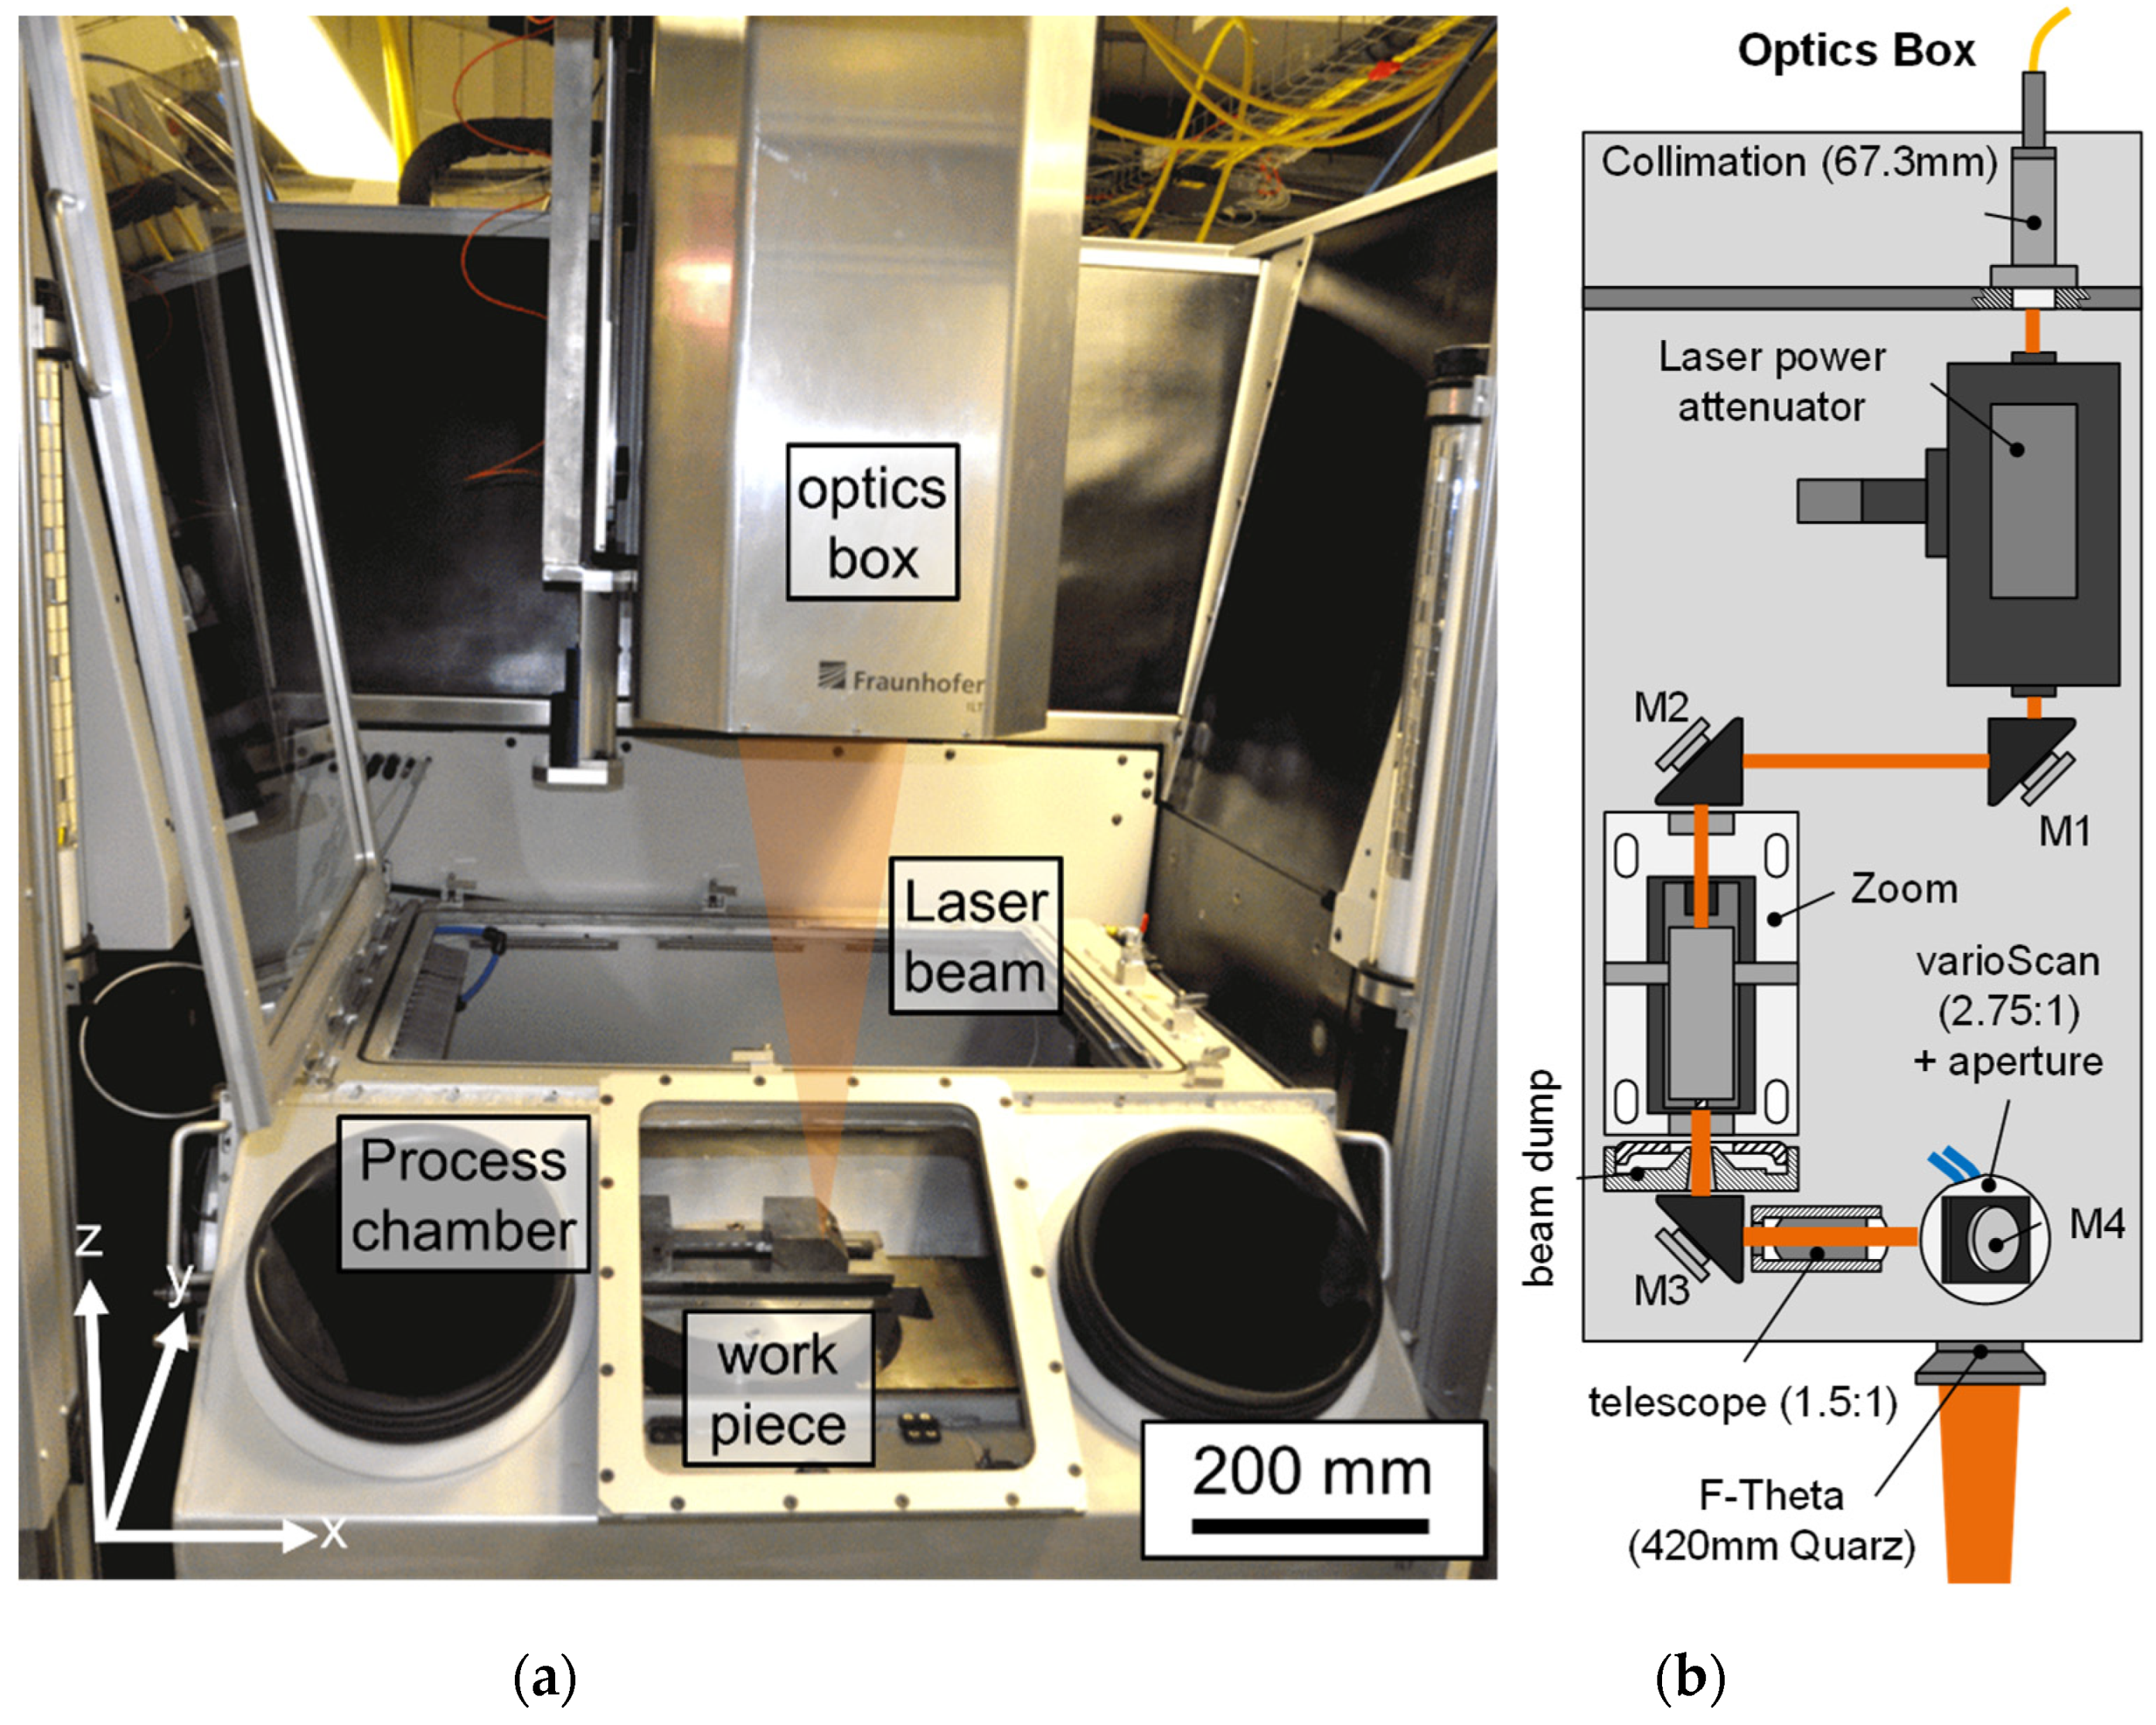
2.1. Opto-Mechanical Set-Up

The “POLAR” laser polishing machine (Figure 1a) is a prototype and was set up by Fraunhofer ILT (Aachen, Germany) and Maschinenfabrik Arnold (Ravensburg, Germany) as part of a publicly funded project. The mechanical basis for this machine was a 5-axis milling center C600U from Hermle (Gosheim, Germany), in which an optical set-up for laser materials processing was integrated (Figure 1b).
A diode-pumped Yb:YAG disk laser (TruMicro 7051, Trumpf GmbH, Ditzingen, Germany) was used in the POLAR machine for the experimental investigation. The maximum average laser power of the TruMicro 7051 is approximately PL,max,TM = 550 W at λem = 1030 nm for pulse repetitions rates between fP = 5 and 20 kHz. In the pulsed mode, Q-Switch controlled laser pulses were generated with pulse durations ranging from tP = 1 µs to approximately 3 µs, which strongly depends on laser power. The square laser beam results from an optical transport fiber with a square, step-index fiber core and edge lengths of dfiber = 100 µm, which was projected onto the work piece. Different laser beam dimensions were achieved by means of a zoom telescope, which offers a 20 mm beam aperture and enables continuous magnification in the range from approximately 0.2–1.8. A laser scanning system from Scanlab AG (Puchheim, Germany) consisting of a VarioScan 30, a HurryScan 25, and an f-theta objective (focal length 420 mm) was used for fast laser beam deflection. Additionally, a laser power attenuator was part of the optical set-up, so that the TruMicro7051 was operated at maximum laser power and the laser power attenuator was used to control the laser power on the workpiece. This was done to maximize the pulse stability of the laser beam source and achieve a fixed pulse duration of approximately tP = 1.2 µs for all laser powers and laser beam sizes. Laser polishing took place in an approximately 200 L process chamber using a closed-loop control to adjust and stabilize the residual oxygen content.

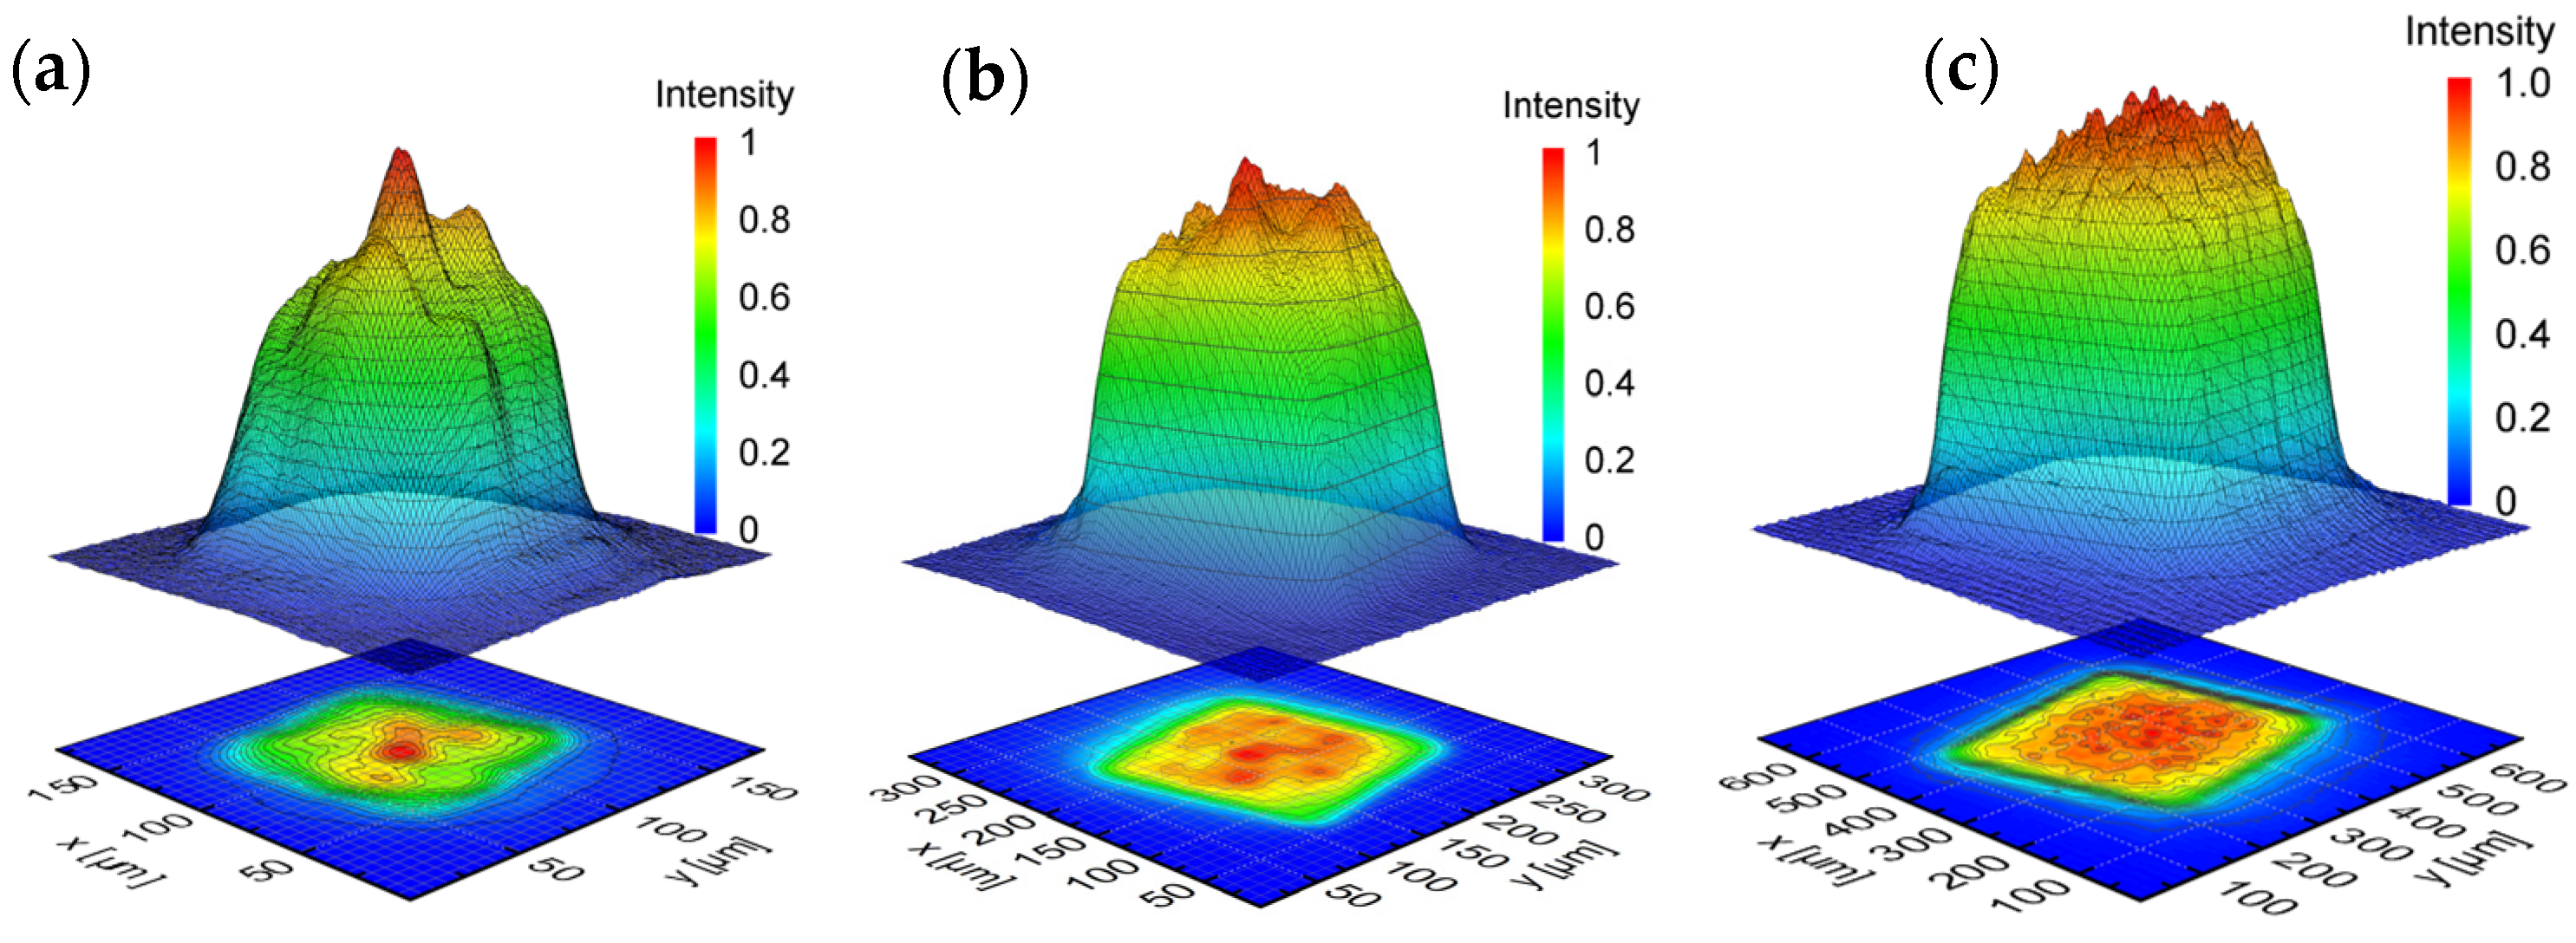
2.2. Intensity Distribution and Laser Beam Characteristics

An optical delivery fiber with a square step-index fiber core (100 µm × 100 µm) was used for beam guidance, delivery, and shaping of the intensity distribution. Using a continuous zoom telescope, three different dimensions of the intensity distribution were realized and measured by a so-called “MicroSpotMonitor” (Primes GmbH, Pfungstadt, Germany). The “LaserDiagnoseSoftware v2.98” (Primes GmbH, Pfungstadt, Germany) (LDS) was used to analyze beam caustic and particularly intensity distribution in the focal plane (Figure 2).
Figure 2 shows intensity distributions for three laser beams with a square basis and side lengths of 100 µm, 200 µm, and 400 µm, respectively. In the following, these will be referred to as Q100, Q200, and Q400. Based on 86% energy inclusion, the LDS analysis delivers the following laser beam characteristics for Q100, Q200, and Q400 (Table 1). Furthermore, a square asymmetric super Gaussian distribution was fitted to the measured intensity distribution Equation (1) [49].
I ( x , y ) = I 0 · e 2 ( ( x a ) M + ( y a ) M ) N = I 0 · e 2 ( ( ( x a ) M + ( y a ) M ) 1 M ) N M .
The main characteristics are the beam diameter a and the numerical parameters M and N · M . A larger parameter M represents an intensity distribution closer to a square shape, while a larger product of N · M represents an intensity distribution closer to a top-hat shape.

2.3. Material and Sample Preparation

Particularly in the fields of solid forming, as well as cutting and punching tools, tool steel 1.2379 (DIN X153CrMoV12, AISI D2) is widely used, since it combines dimensional stability, high wear resistance, and toughness. Furthermore, 1.2379 (D2) is a recommended material for e.g., punches, ejectors, and tool dies [13]. Dörrenberg Edelstahl GmbH (Engelskirchen-Ründeroth, Germany) provided a special variant of 1.2379, which was powder metallurgically (PM) produced and used for all experiments. A special characteristic of the PM variant is a low content of impurities such as sulfur and phosphorus, a high homogeneity in the distribution of chemical elements, and a segregation-free microstructure. In terms of suitability for laser polishing, Ross et al. [8] found that powder metallurgically remelted 1.2379+ is preferable to the standard variant since chromium carbides are more homogenously distributed within the bulk material, on average smaller, and mostly spherically formed.
An overview of the chemical composition (wt %) of D2 is shown in Table 2.
The dimensions of the samples were approximately 50 × 75 × 15 mm³, while the initial heat treatment state was soft annealed. The surface of the samples was ground and showed an initial roughness of Ra = 0.33 ± 0.02 µm. Both sides of the flat samples were prepared in the same way and used for the experimental investigations.

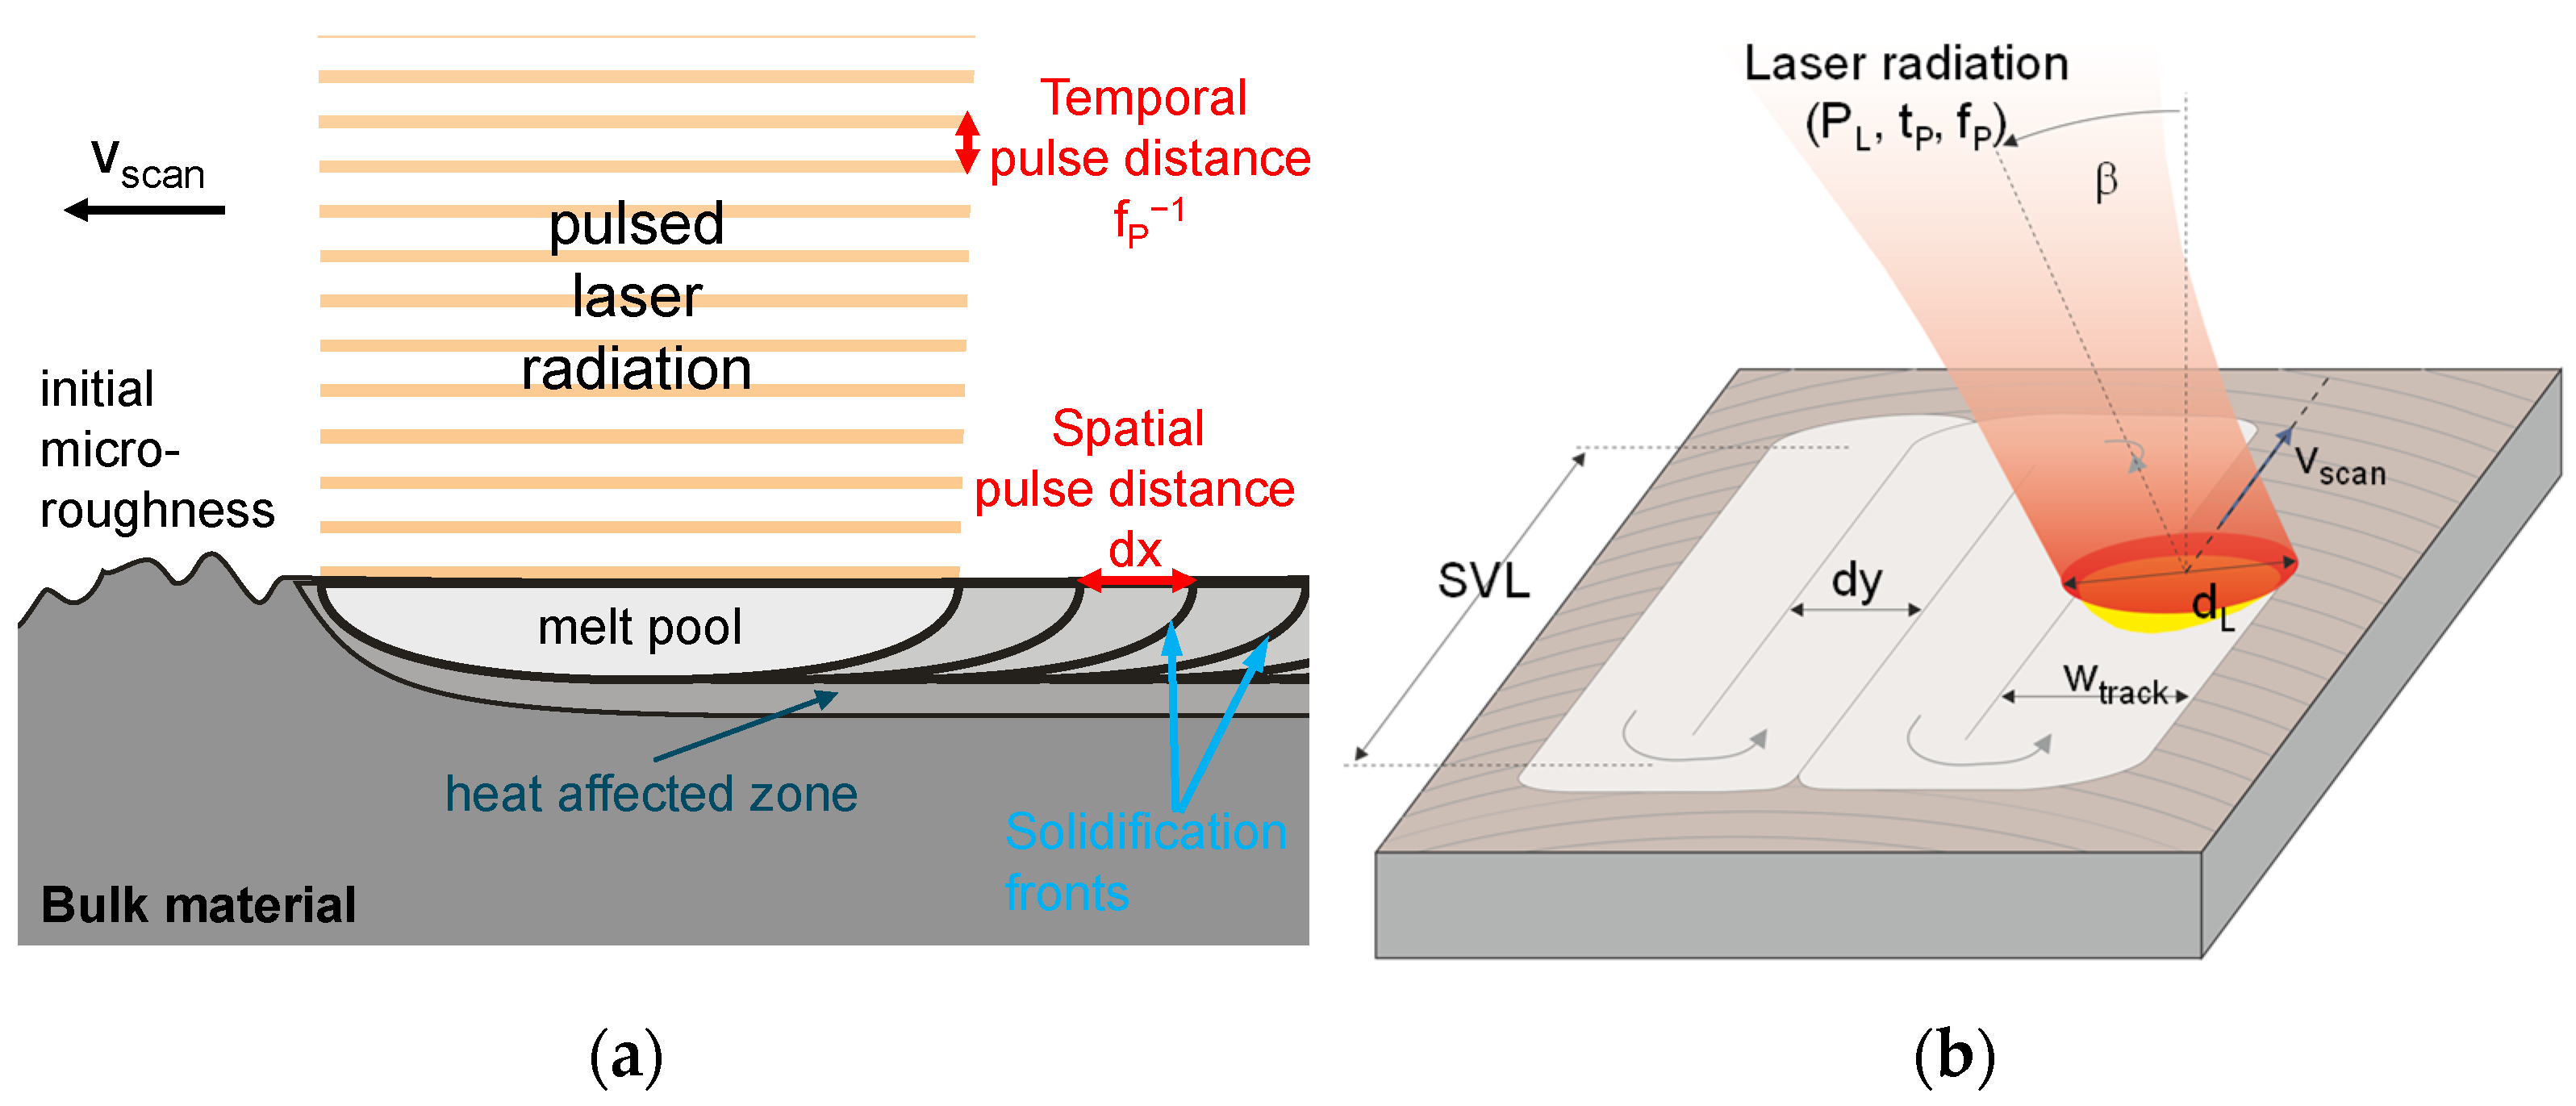
2.4. Process Principle Scan Strategy and Process Parameters

Laser remelting of a surface shows a high degree of similarity to a micro-welding process with the exception that no additional material is required in the remelting process. Laser remelting not only requires no additional materials, but it is also non-subtractive, which means that no material is lost during the process. In contrast to additive and subtractive processes, laser remelting redistributes the material at the material’s surface while it is molten. Typically, capillary, thermo-capillary, and gravitational forces lead to a smoothing of the surface. Particularly, the surface tension leads to a smooth melt pool surface and effective damping of capillary surface waves. Laser micro polishing (LµP) is a specific variant of laser remelting in which pulsed laser radiation is used to remelt a surface. (Figure 3a). The combination of pulse frequency and scan speed determines the pulse distance on the work piece. LµP is typically characterized as a discrete remelting process, which means that the melt duration is shorter than the temporal distance between laser pulses (reciprocal pulse frequency). This usually results in melt pool dimensions that show a high ratio of width to depth [21,22]. Areal processing is typically achieved by a meandering scanning strategy with a defined track offset between antiparallel remelting tracks (Figure 3b).
Laser micro polishing utilizes pulsed laser radiation and was conducted using a laser beam source from Trumpf (TruMicro 7051, Ditzingen, Germany). Three similar investigations were conducted using different square laser beam sizes Q100, Q200, and Q400 and compared among each other. The experimental approach was based on an investigation on the influence of laser fluence on surface topography and surface roughness. An overview, a short description of the investigated process parameters, and the range of investigation is given in Table 3.
The process parameters for the different laser beam dimensions were chosen based on the following considerations. The pulse frequency of 20 kHz was the maximum available at the laser beam source. Scanning velocity was adapted to the laser beam sizes and repetitions rate, so that the spot overlap (dL/dx) in the scanning direction was 90% for all laser beams. Track offset was determined in the same way, so that track overlap was also 90%. This results in approximately 100 remelting cycles per irradiated area and strongly different area rates (polished area per unit time). Fluence is typically a decisive process parameter in LµP and was investigated in the same range for all laser beam dimensions. Therefore, the investigated range of pulse energy (and average laser power) was adapted to the laser beam dimensions. For all experiments, the inclination angle was β = 0°, and the shielding gas atmosphere was a mixture of Argon and 1000 ppm residual oxygen from the ambient air in the process chamber.

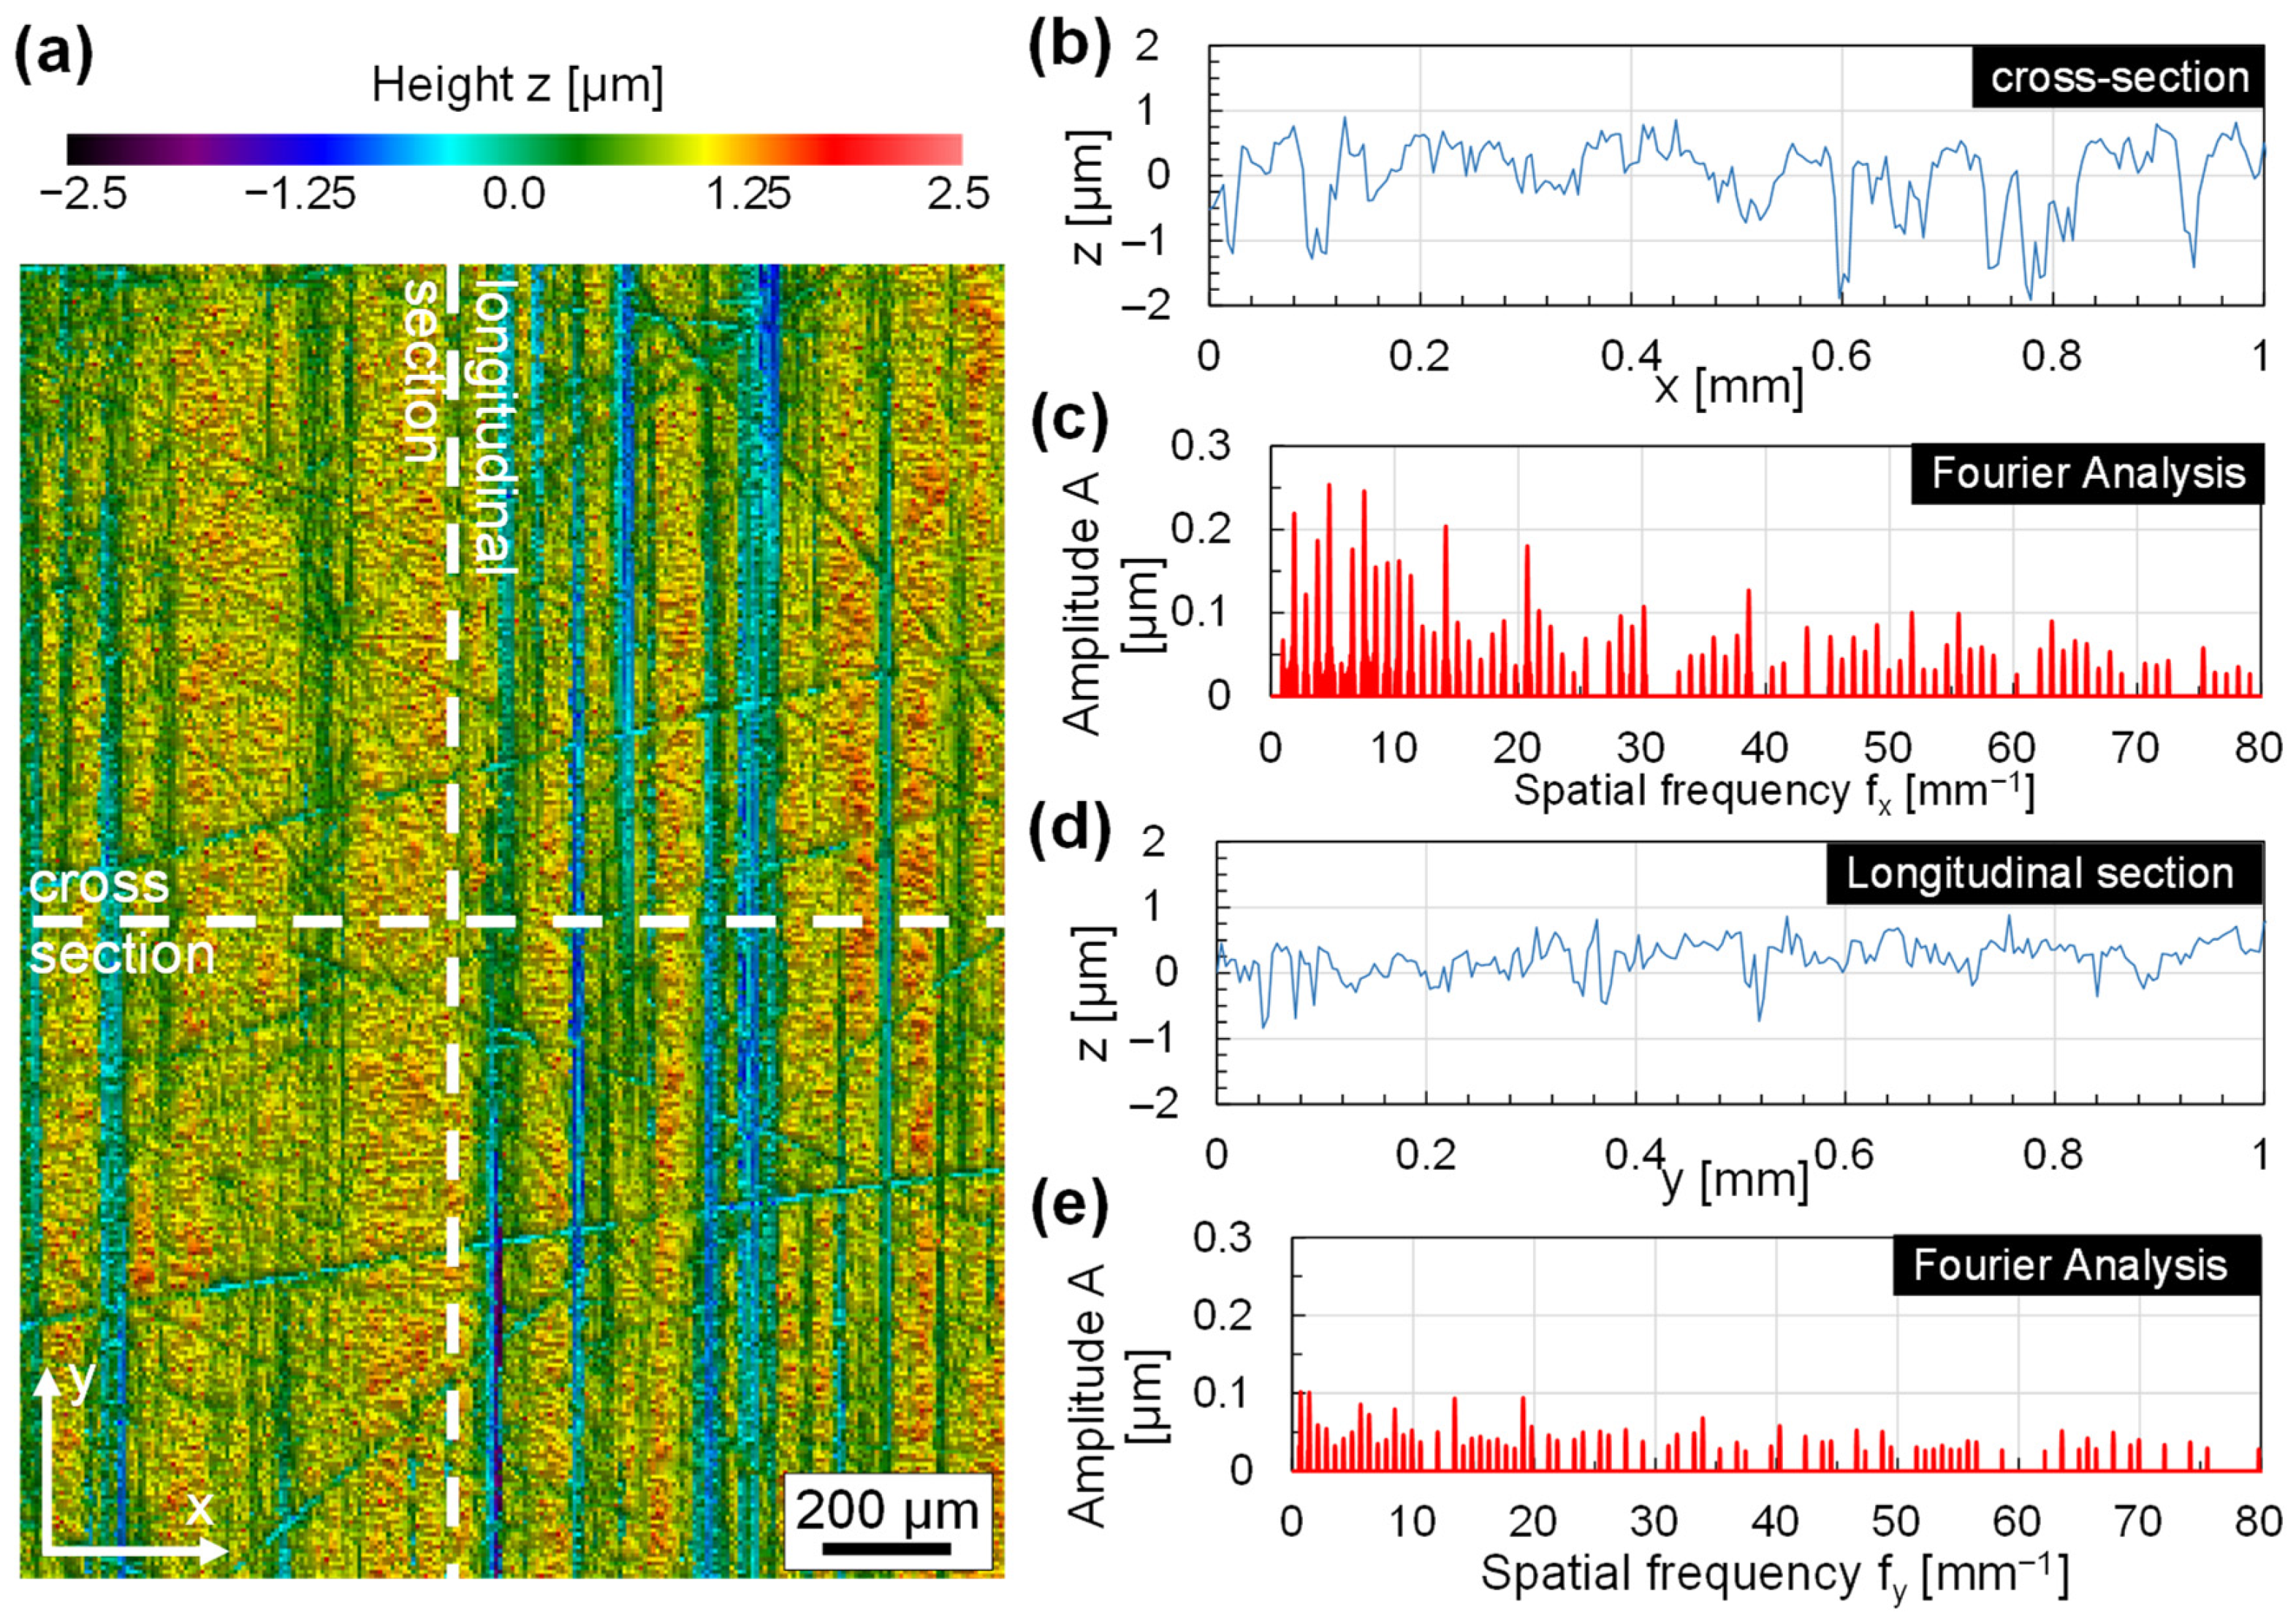
2.5. Surface Analysis

Surface analysis was done by micrographs of the surface using a stereo microscope M205 C by Leica Microsystems. An objective with a numerical aperture of 0.35 and a maximum optical resolution of up to 1050 LP/mm (line pairs per millimeter) was used.
Since stylus roughness measurements are often not meaningful to determine the effect of LµP on surface roughness [27], systematic white light interferometry (WLI) measurements of laser-polished areas were conducted. Surface analysis was done by an analysis of the spectral composition of surface roughness, which is typically presented as a roughness spectrum (Sa spectrum) [18,27,50,51]. The WLI measurements for these Sa spectra were conducted with a “Newview 7300” (Ametek-Zygo, Berwyn, PA, USA). The maximum vertical resolution was approximately 0.1 nm, while the spatial resolution ranged between 0.36 and 9.50 µm. The control and analysis software Zygo MetroPro (V10.3) was used for all measurements.

3. Results

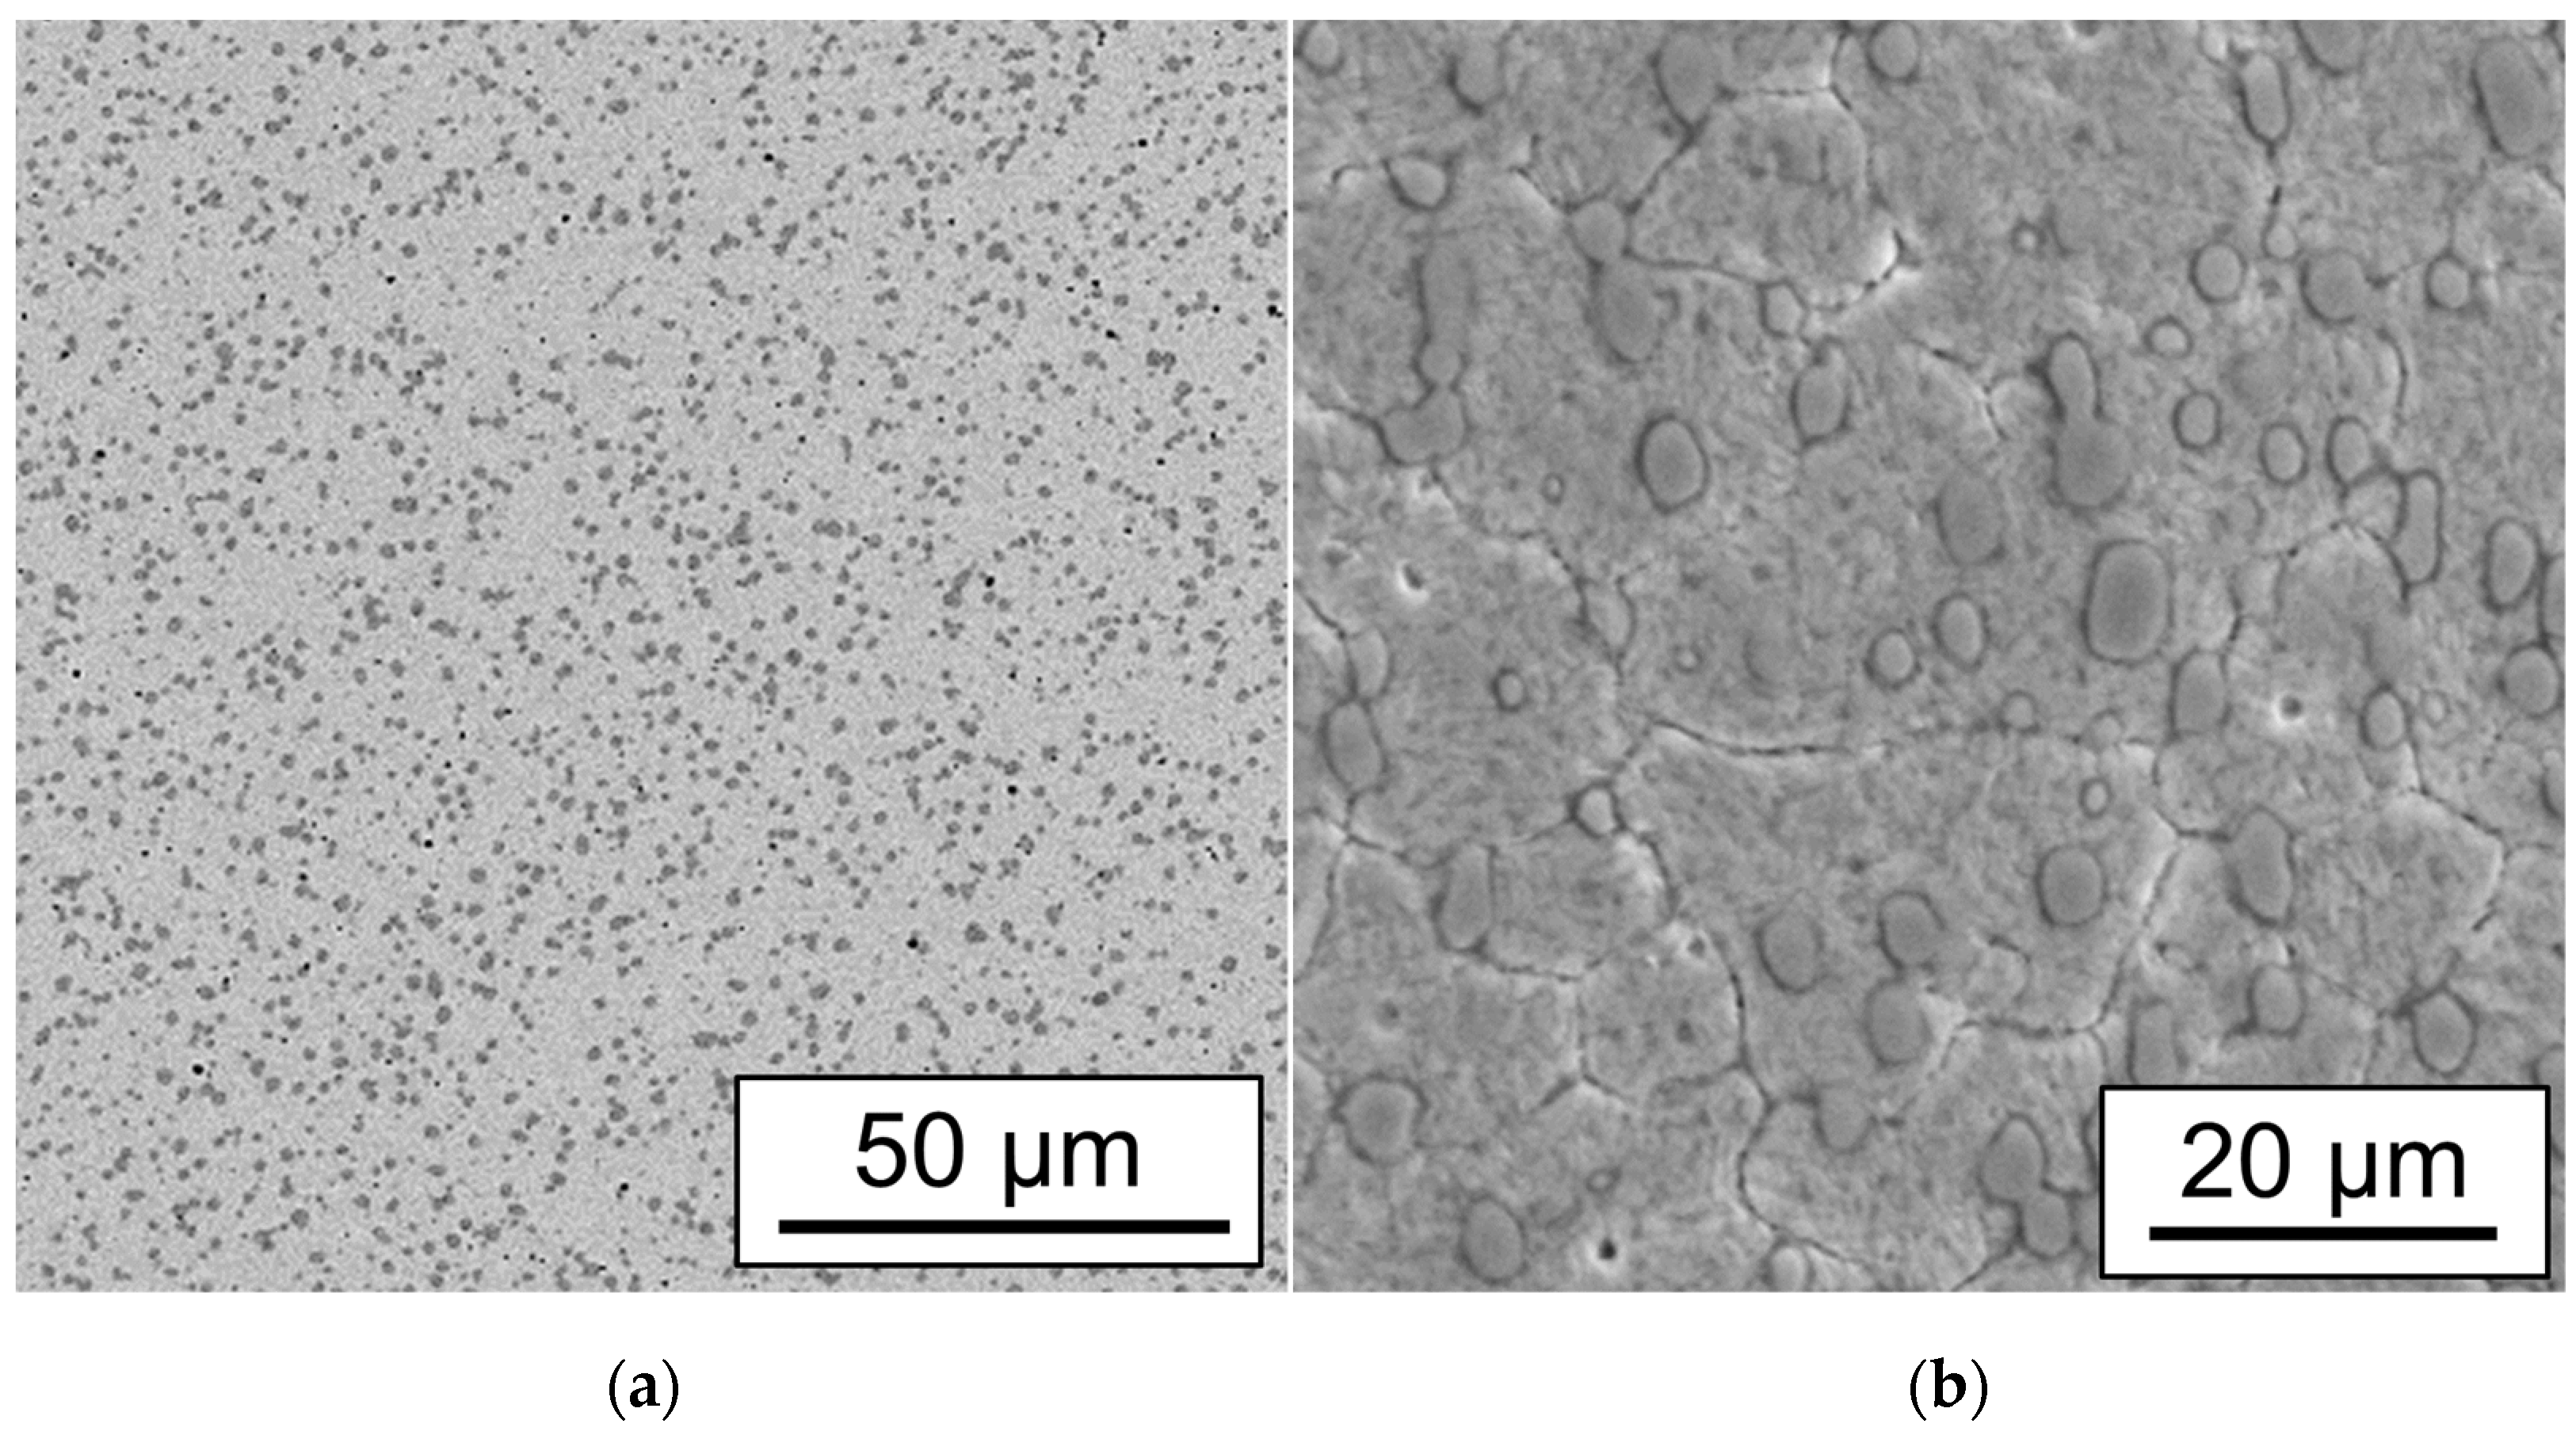
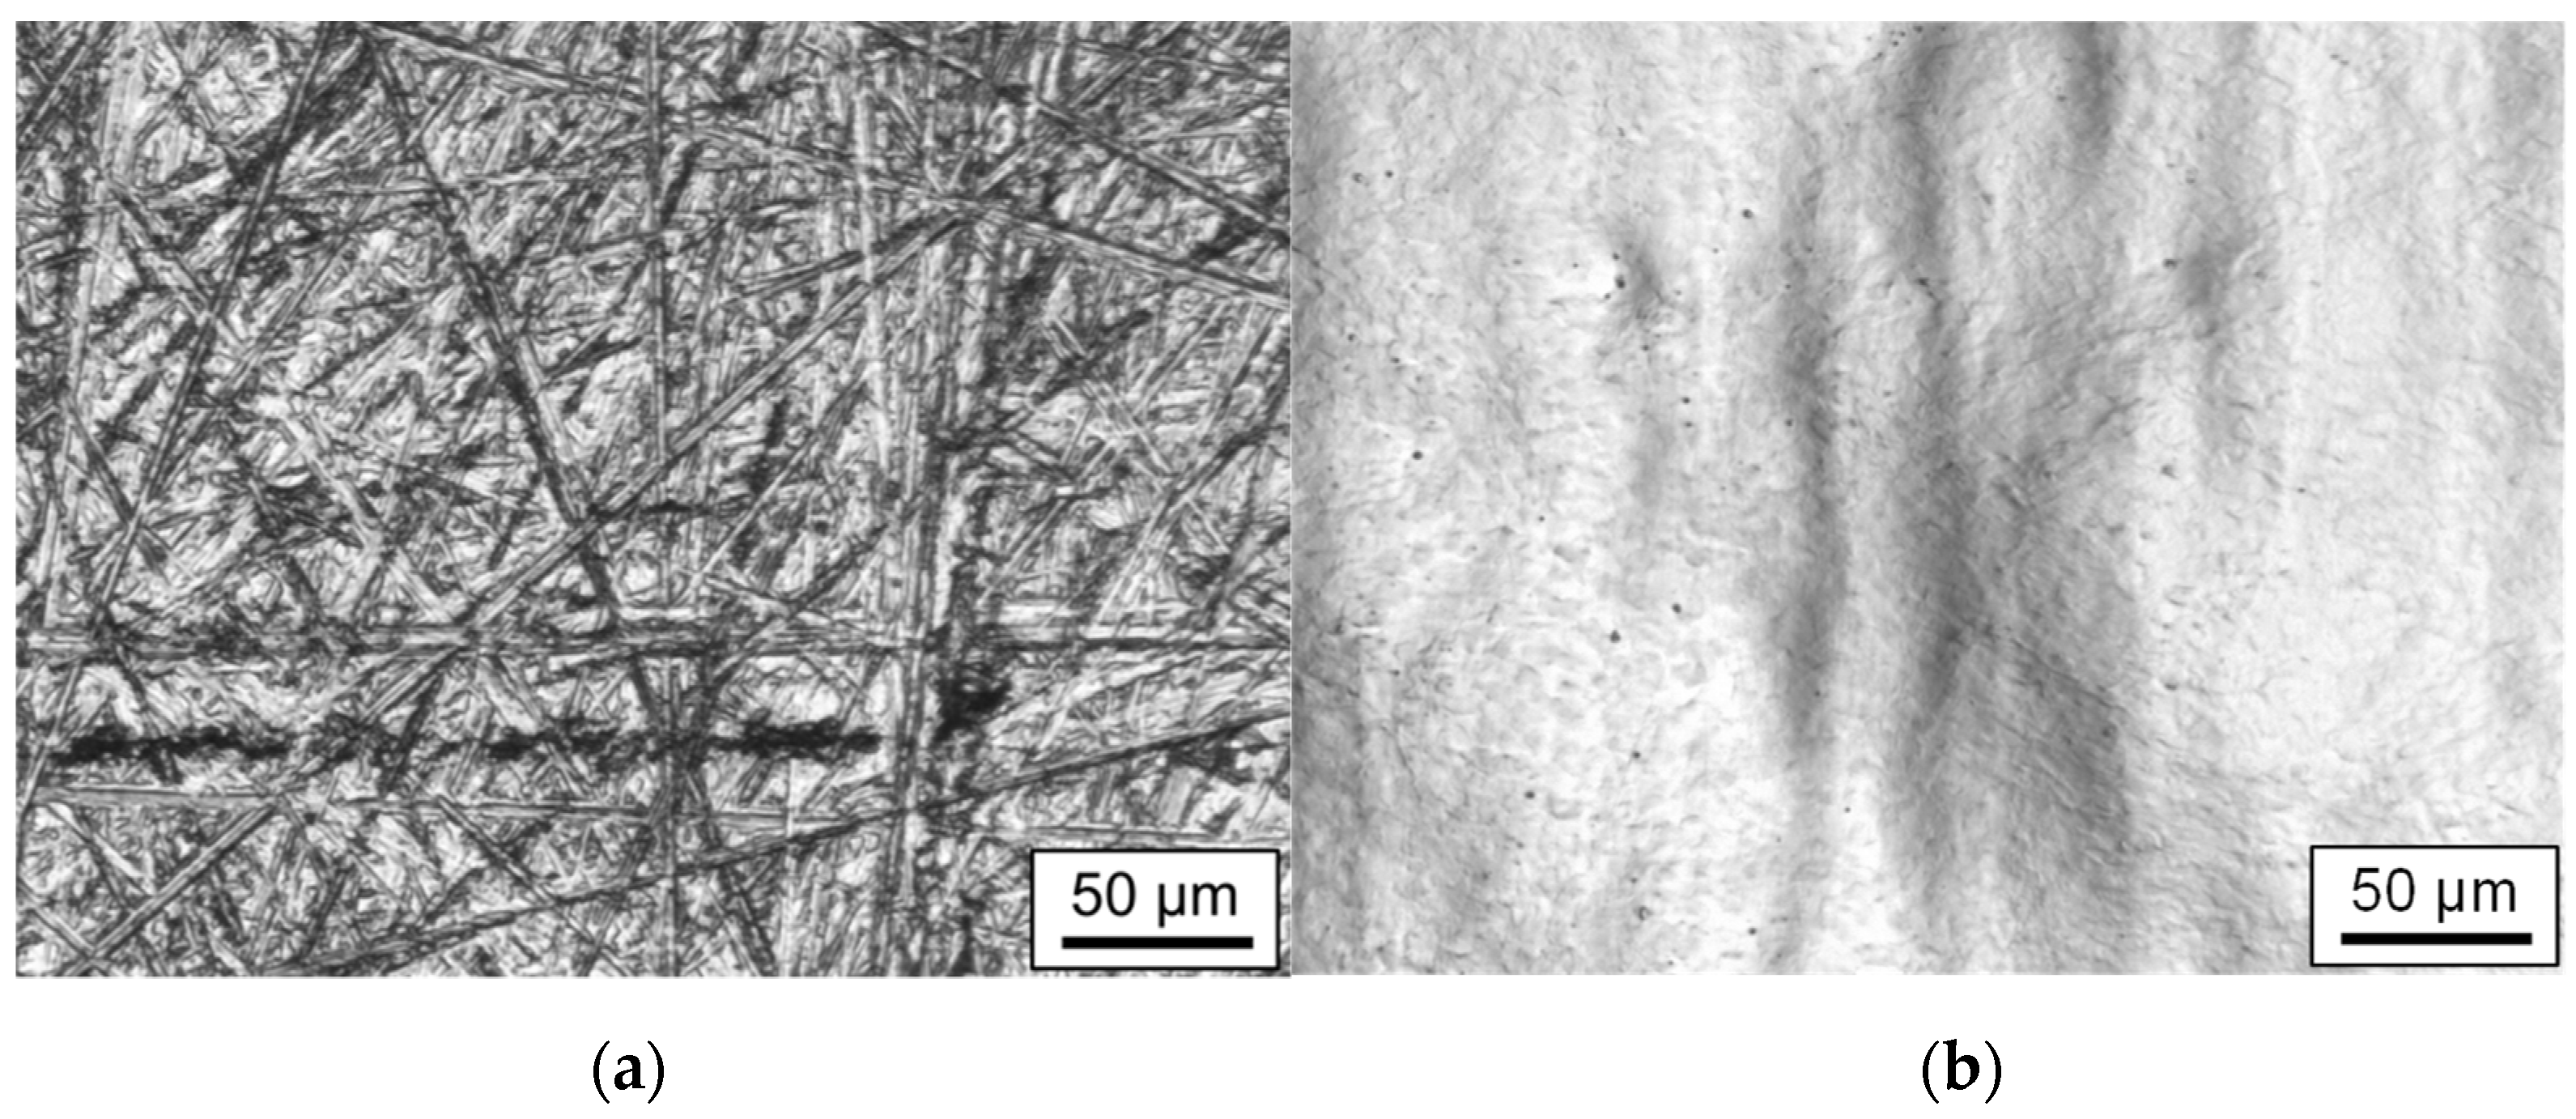
3.1. Initial Surface and Material Analysis

The initial surface was measured by WLI, and characteristic sections were analyzed by fast Fourier transformation (FFT). The surfaces exhibit two kinds of marks, which are a result of the mechanical preparation process. The directions of the grinding marks are strongly heterogeneous but exhibit a clearly dominant orientation. Therefore, the profile analysis shows significant differences in the spatial frequency spectrum for horizontal or vertical sections through the initial surface. While Figure 4 focuses primarily on the macro-roughness of the surface at spatial frequencies smaller than 50 mm−1, Figure 5 primarily highlights the micro-roughness up to spatial frequencies of 200 mm−1. Figure 4 gives a representative impression of the initial surface, while the results displayed in Figure 5 will be used for an in-depth analysis of changes in micro-roughness and their corresponding spatial frequencies and wavelengths, respectively.
In addition to surface roughness, the initial microstructure and distribution of chemical elements at the surface was investigated by scanning electron microscopy (SEM) and energy-dispersive X-ray spectroscopy (EDX). In contrast to the experimental investigation, the surface was manually polished before SEM and EDX to get a clearer picture and less errors in measurement.
Figure 6 shows SEM images in different magnifications. While Figure 6a gives an overview of the overall distribution of chromium carbides (dark gray) in the steel matrix (light gray), Figure 6b provides a close-up of chromium carbides regarding sizes and geometrical shapes.
Firstly, the dark and light gray phases were characterized by EDX, and it was confirmed that the dark gray spots were chromium-enriched carbides (C39.55; Si 0; V3.69; Cr 31.83; Mn 0.39; Mo 1.04; Fe Bal.; in weight %), while the lighter gray areas were the steel matrix of AISI D2 containing less chromium (C 14.37; Si; 0.91; V 0.35; Cr 7.06; Mn 0.18; Mo 0.44; Fe Bal. in weight %). The size of the chromium carbides was primarily in the range from one to three micrometers, while the shape was predominantly ellipsoid and often spherical (Figure 6b). However, also, agglomerations of multiple chromium carbides as well as areas with a smaller density of chromium carbides were observed (Figure 6a). The size, shape, and distribution of chromium carbides are a characteristic feature of the powder metallurgical production process of 1.2379 (AISI D2). Therefore, this enhanced version of the material is typically referred to as 1.2379+ in comparison to 1.2379 (standard).

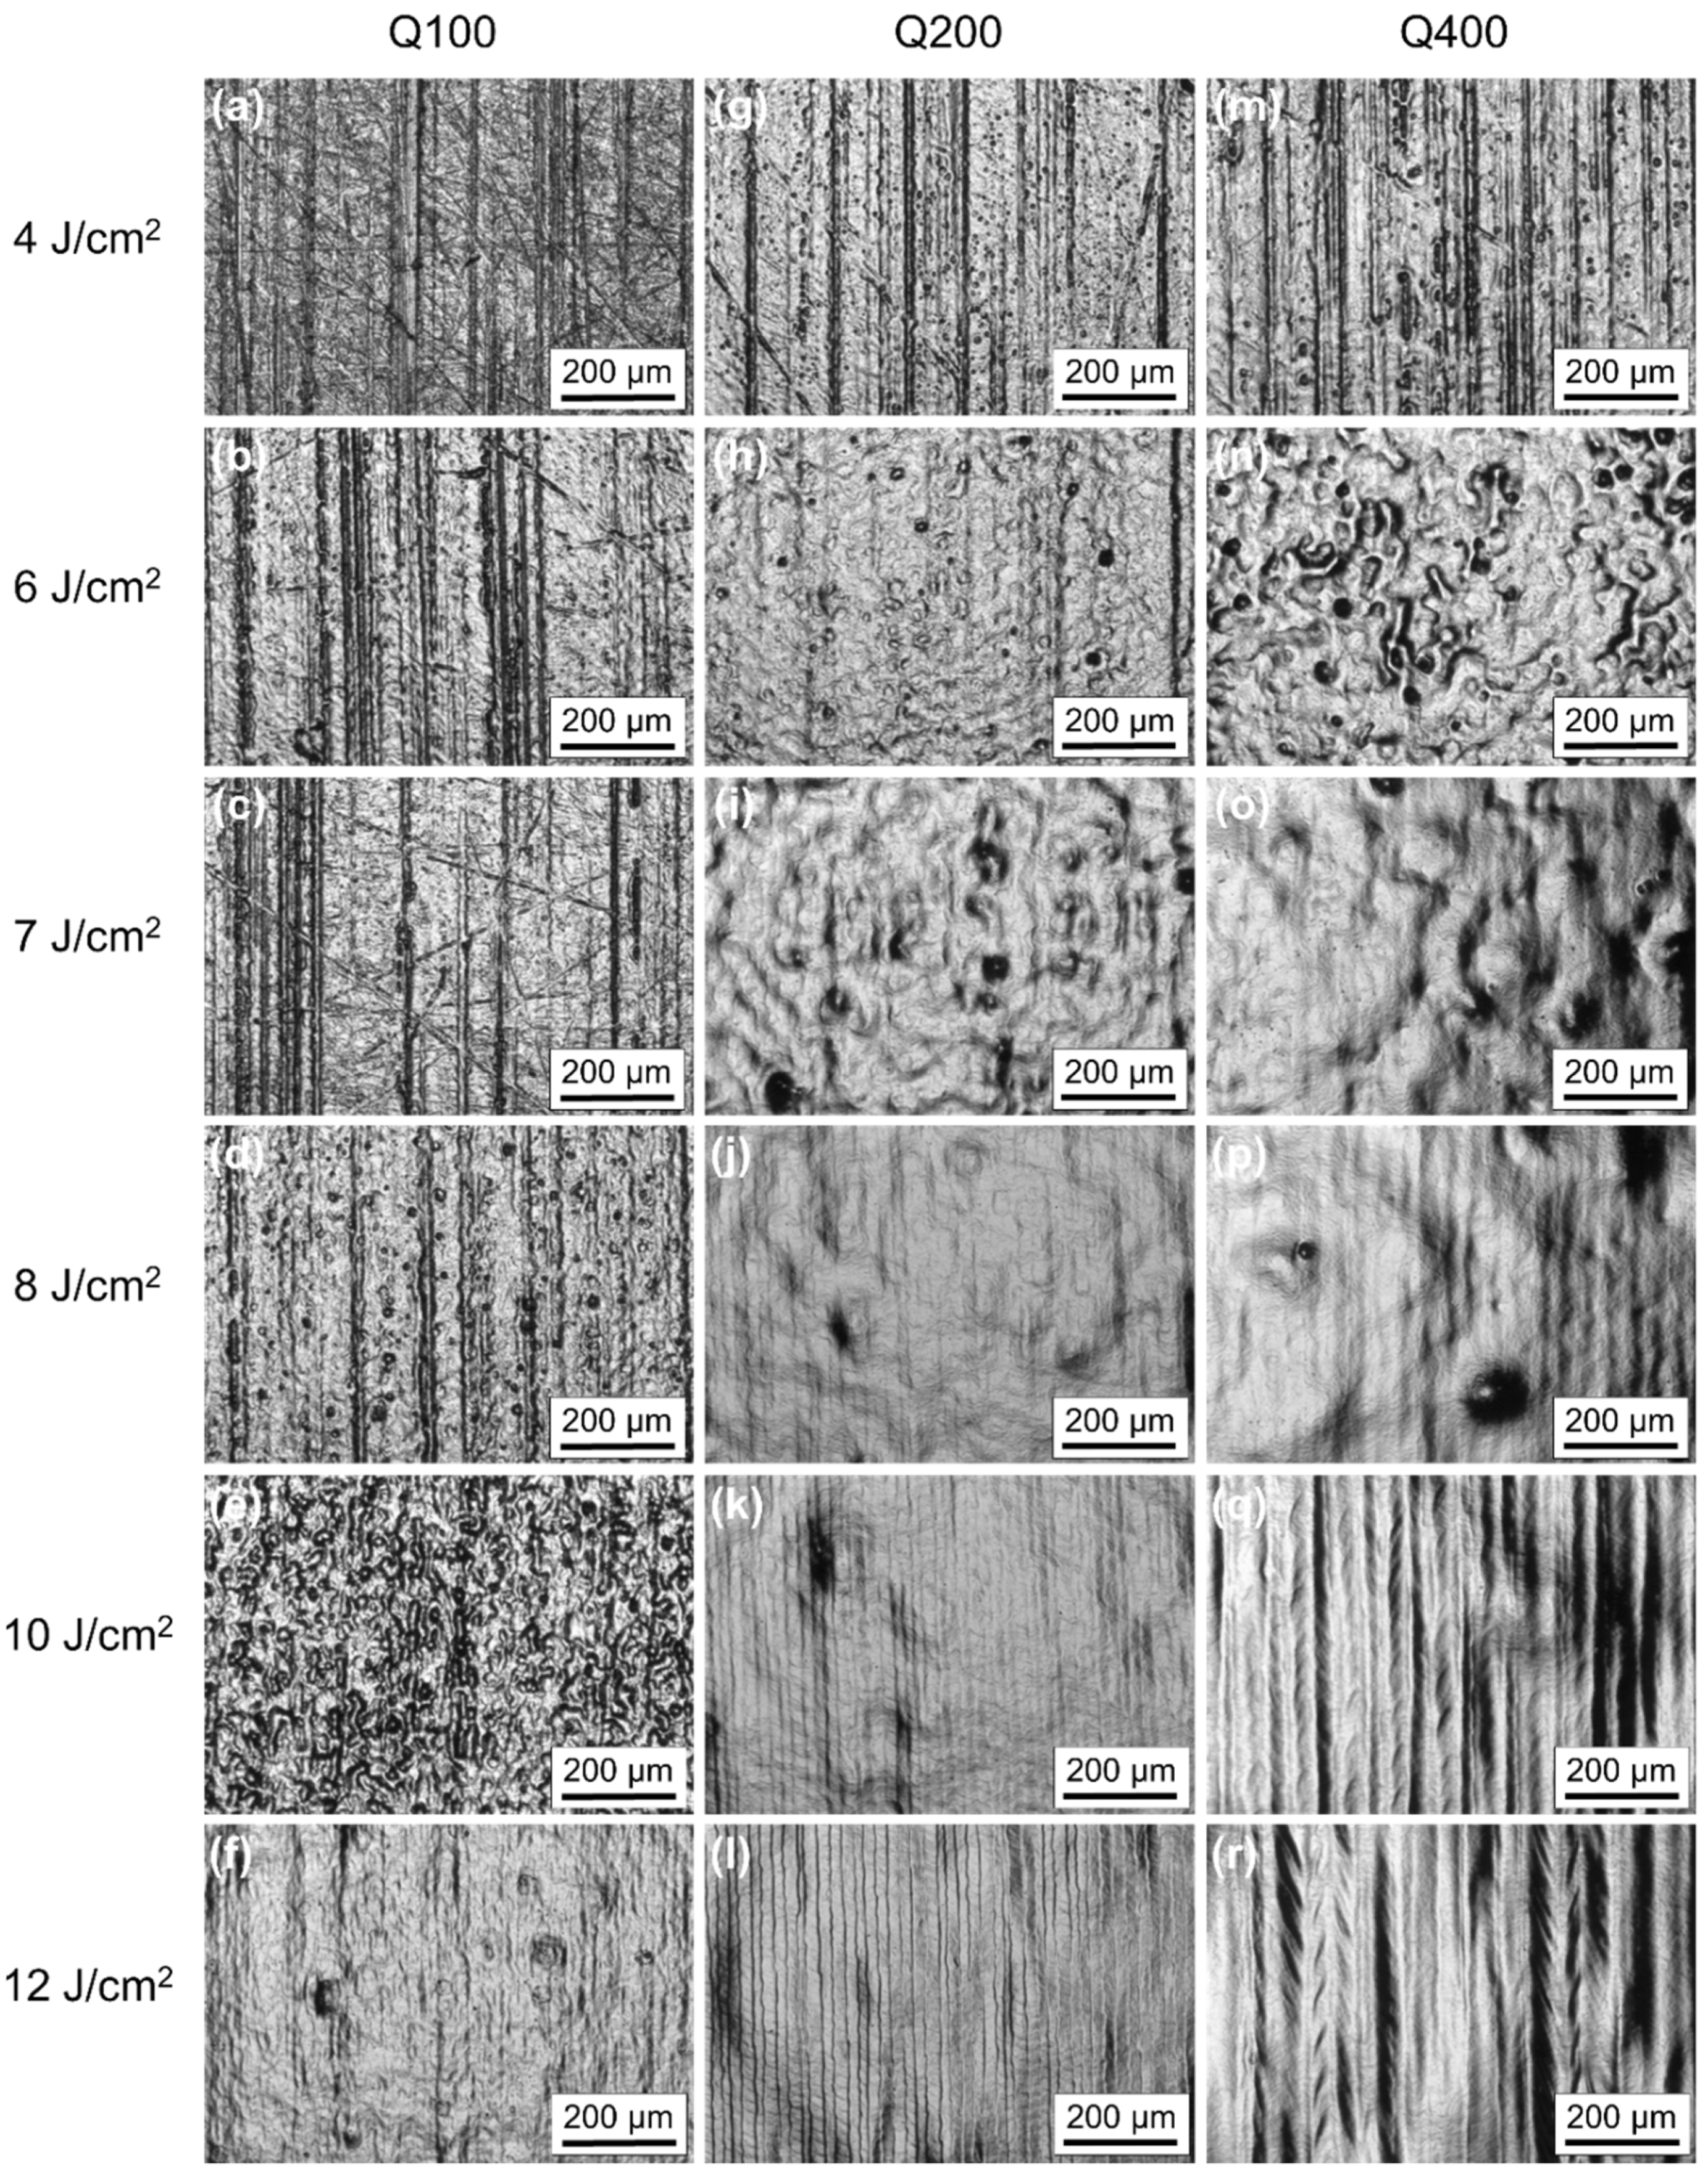
3.2. Surface Topography after Pulsed Laser Remelting

The surface topography and thus surface roughness after laser polishing were investigated in a full factorial design for three different laser beam dimensions—Q100, Q200, and Q400—and ten different laser fluences ranging from 3 to 12 J/cm2 in equidistant steps of 1 J/cm2. Figure 7 shows micrographs in a matrix form for selected laser fluences and for the laser beams Q100, Q200, and Q400. Figure 7a represents the initial surface topography since a fluence of 4 J/cm2 at Q100 was not sufficient to introduce any topographical change in the initial surface.
The smallest laser fluence investigated was F = 3 J/cm2, but this fluence was not sufficient for any of the laser beam dimensions to remelt the surface at least partially. Remelting starts at a fluence of approximately F = 4 J/cm2 for Q200 and Q400, while a fluence of approximately F = 6 J/cm2 is required for Q100. The micrographs for these fluences show that various small, circular craters were formed during the remelting process. In general, it is observed that surface topography is significantly different for the same fluence at different laser beam dimensions (e.g., Figure 7b,h,n). A purely topographical description shows that small craters are preferably observed for smaller laser beams and fluences (Figure 7b,g,m). Larger laser beams and higher fluences, on the other hand, tend to produce dents, i.e., comparatively long-wavelength dimples or depressions (Figure 7j,o,p), which clearly differ in their topology from the craters at small beam sizes. At small fluences, basically only comparatively small, circular craters are visible in the laser-polished surface. A very large crater density was observed particularly at Q100 and 10 J/cm2 (Figure 7e). Using larger beam sizes, surfaces with wavy depressions were formed. In particular, at large laser beam sizes and high fluences, surface ripples are formed in addition to the characteristic stripe texture (Figure 7q,r).
Additionally, visual process observation enables identifying certain characteristic process regimes and points toward different mechanisms of surface structure formation in the remelting process. Particularly, material ablation is a significant effect that is visible for all laser beam sizes at high fluences. However, the fluence required for material ablation strongly depends on the laser beam dimensions. Significant evaporation is visible for Q100 at approximately 12 J/cm2, in comparison to approximately 10 J/cm2 at Q200, and approximately 9 J/cm2 at Q400. Laser ablation often coincides with clearly visible, parallel stripes on the surface (Figure 7k,l,q,r). The distance between the stripes corresponds to the track offset and is typically an indication for a continuous remelting process. These characteristic stripes get only visible for Q100 at the highest fluence of 12 J/cm2 (Figure 7f). For Q200, these stripes are already hardly observable at 8 J/cm2 (Figure 7j) but get clearly visible at 10 J/cm2 (Figure 7k). Qualitatively, the same is true for Q400, but for lower fluences. Remelting stripes get hardly visible at approximately 7 J/cm2 (Figure 7o) but get more pronounced for fluences of approximately 8–10 J/cm2 (Figure 7p,q).
In particular, the surfaces remelted at high laser fluence appear to radiate a greater gloss (Figure 7q,r), i.e., to be significantly smoother at the micro-roughness level. The observed evaporation might lead to a comparatively small micro-roughness at the same time.

3.3. Micro-Roughness

In the following, the evolution of the micro-roughness of the laser remelted surfaces is presented in detail based on WLI images. The image size is 640 × 480 pixels, which corresponds to a spatial resolution of approximately 0.1 µm. This resolution and image size were chosen, because micro polishing particularly achieves or intends to achieve a reduction of micro-roughness in this range. Remelting has already started at 4 J/cm2 for Q200 and Q400 (Figure 8g,m), which is evident from the rounded shape of the visible surface structures. In the case of Q100, effective remelting begins at fluences greater than 4 J/cm2. At a fluence of 6 J/cm2 (Figure 8b), a rounding of surface features can already be seen. However, in addition, crater-like depressions are observed with increasing frequency (Figure 8c,d,g,h). These tend to become deeper and wider with increasing fluence (Figure 8e,i,j). Furthermore, significant micro-porosity is visible at different laser beam dimensions and fluences (Figure 8i,j,o,p).
A comparatively small micro-roughness is observed at fluences of more than 8 J/cm2 for large beam dimensions Q200 and Q400 (Figure 8j,k,o,p,q). At the same time, as the fluence increases, the stripe structure at the distance of the track offset also becomes more pronounced at increasing fluences (Figure 8k,l,q,r). In all cases, a certain waviness remains on the surface or cannot be smoothed by micro polishing.
In addition to a general overview of the resulting micro-roughness (Figure 8), indications for the origin of crater-like features were found at selected process parameters. Figure 9a shows a WLI image of the surface topography after laser remelting (Q200, F = 4 J/cm2) in comparison to a representative SEM image of the surface near chromium carbide distribution in the initial bulk material (Figure 9b).
Even though an unambiguous correlation is difficult, Figure 9 reasonably suggests that the size, agglomeration, and distribution of chromium carbides are most likely the cause and starting point for randomly distributed craters of different sizes after laser remelting.

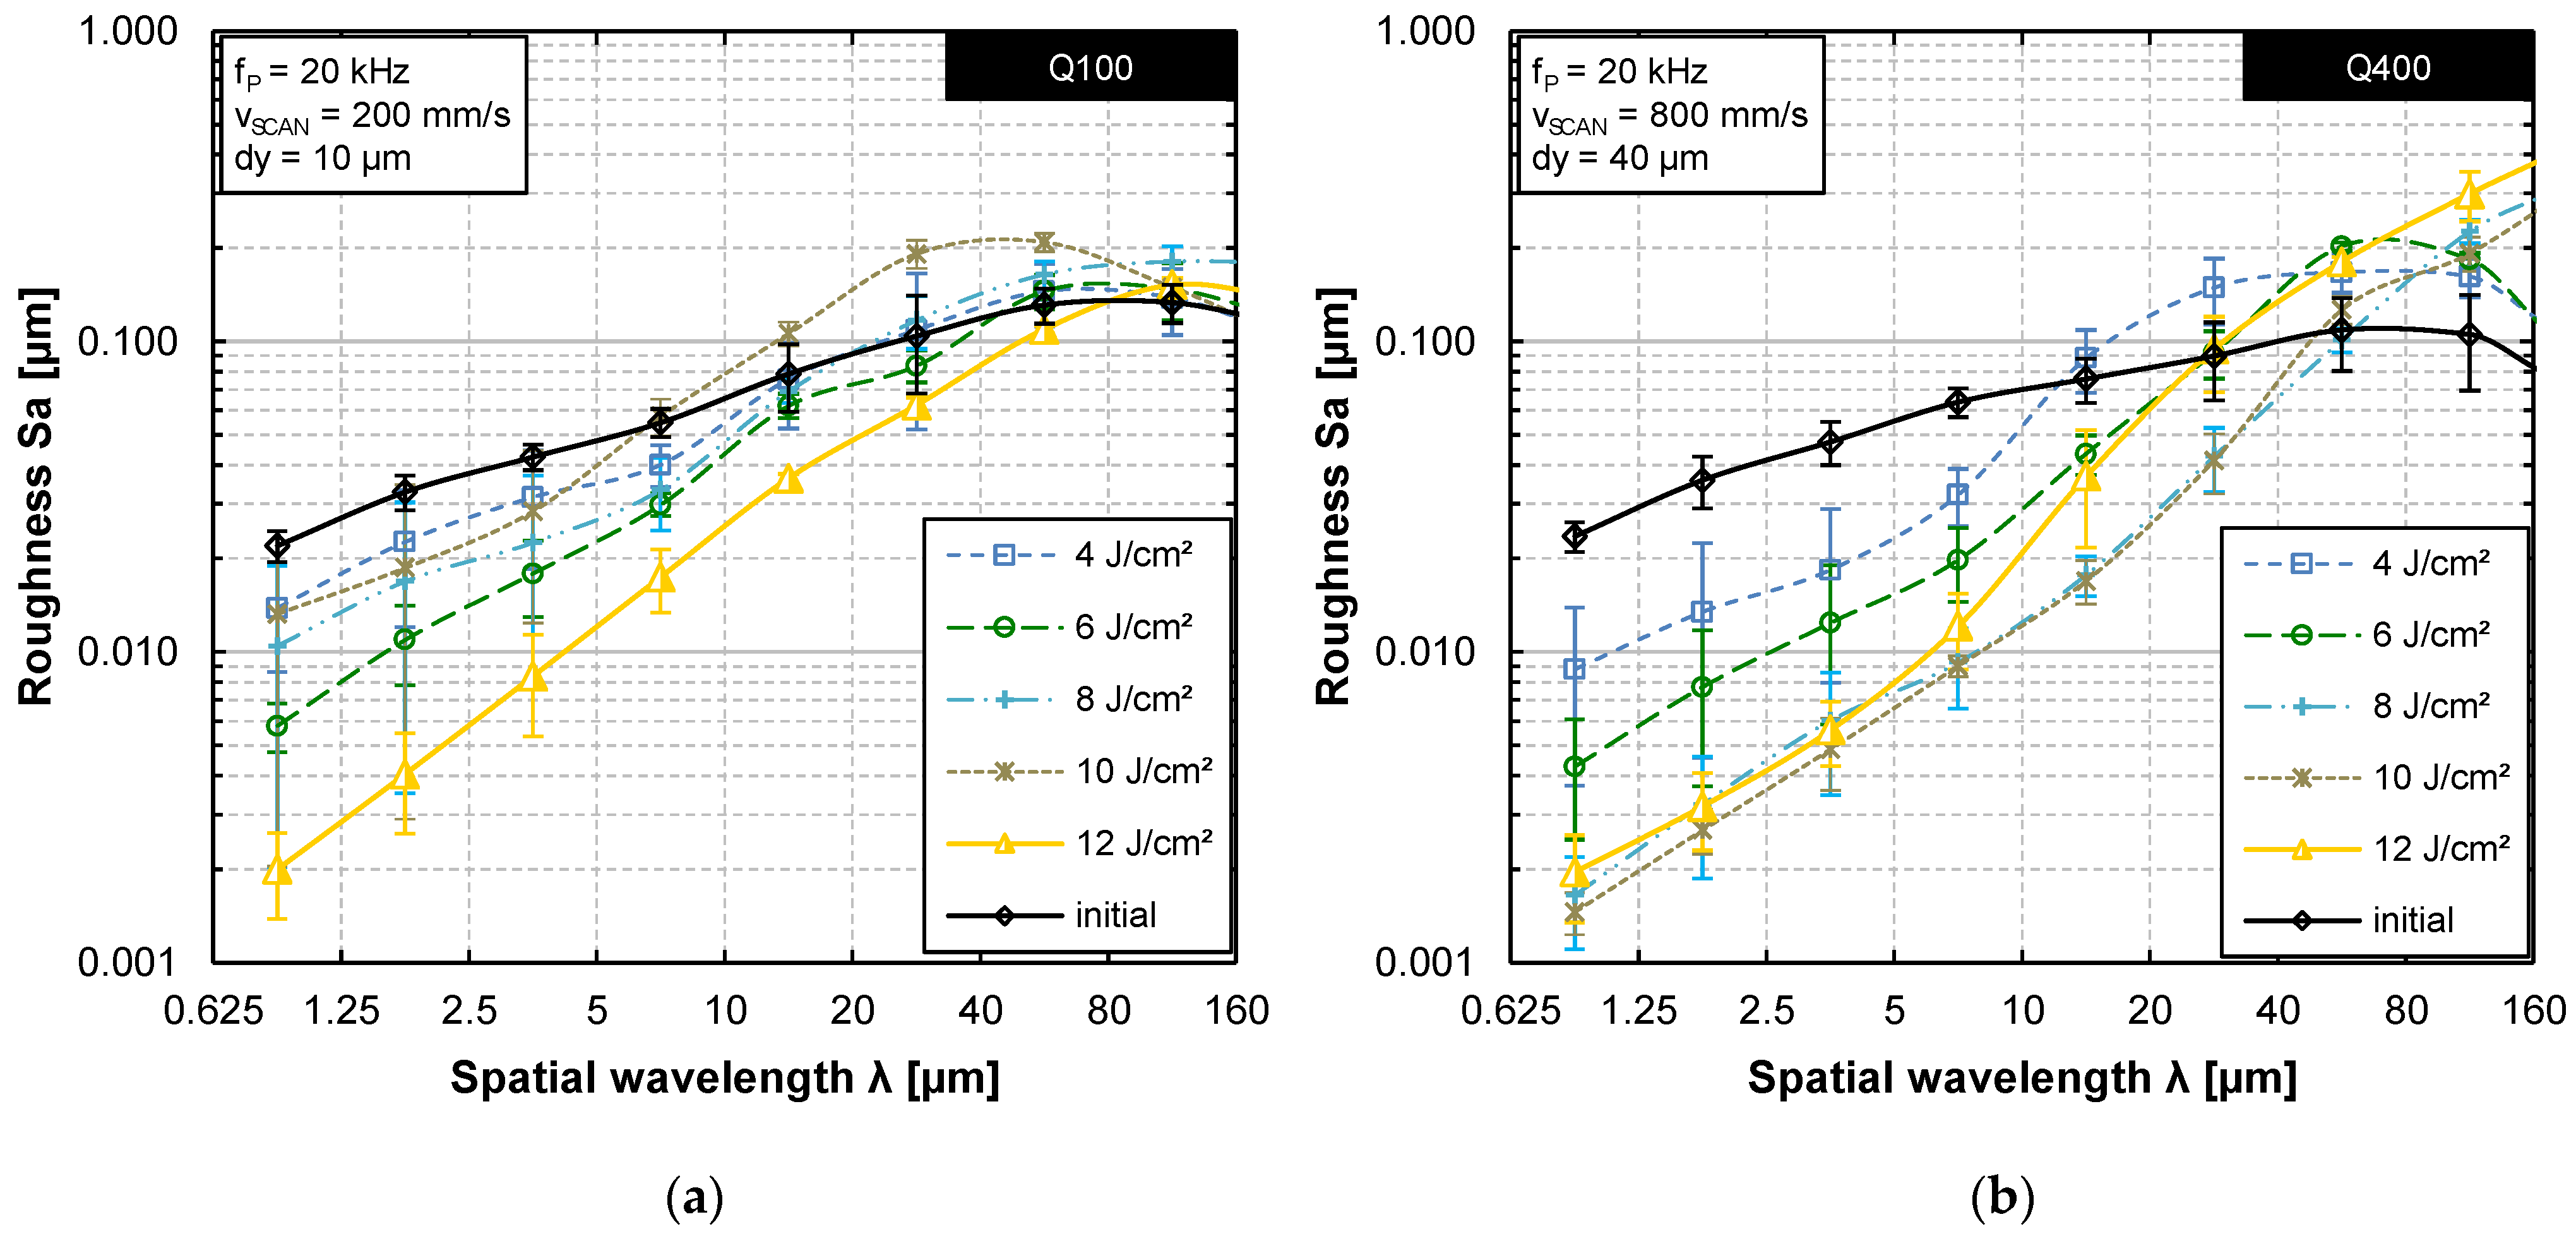
3.4. Surface Roughness
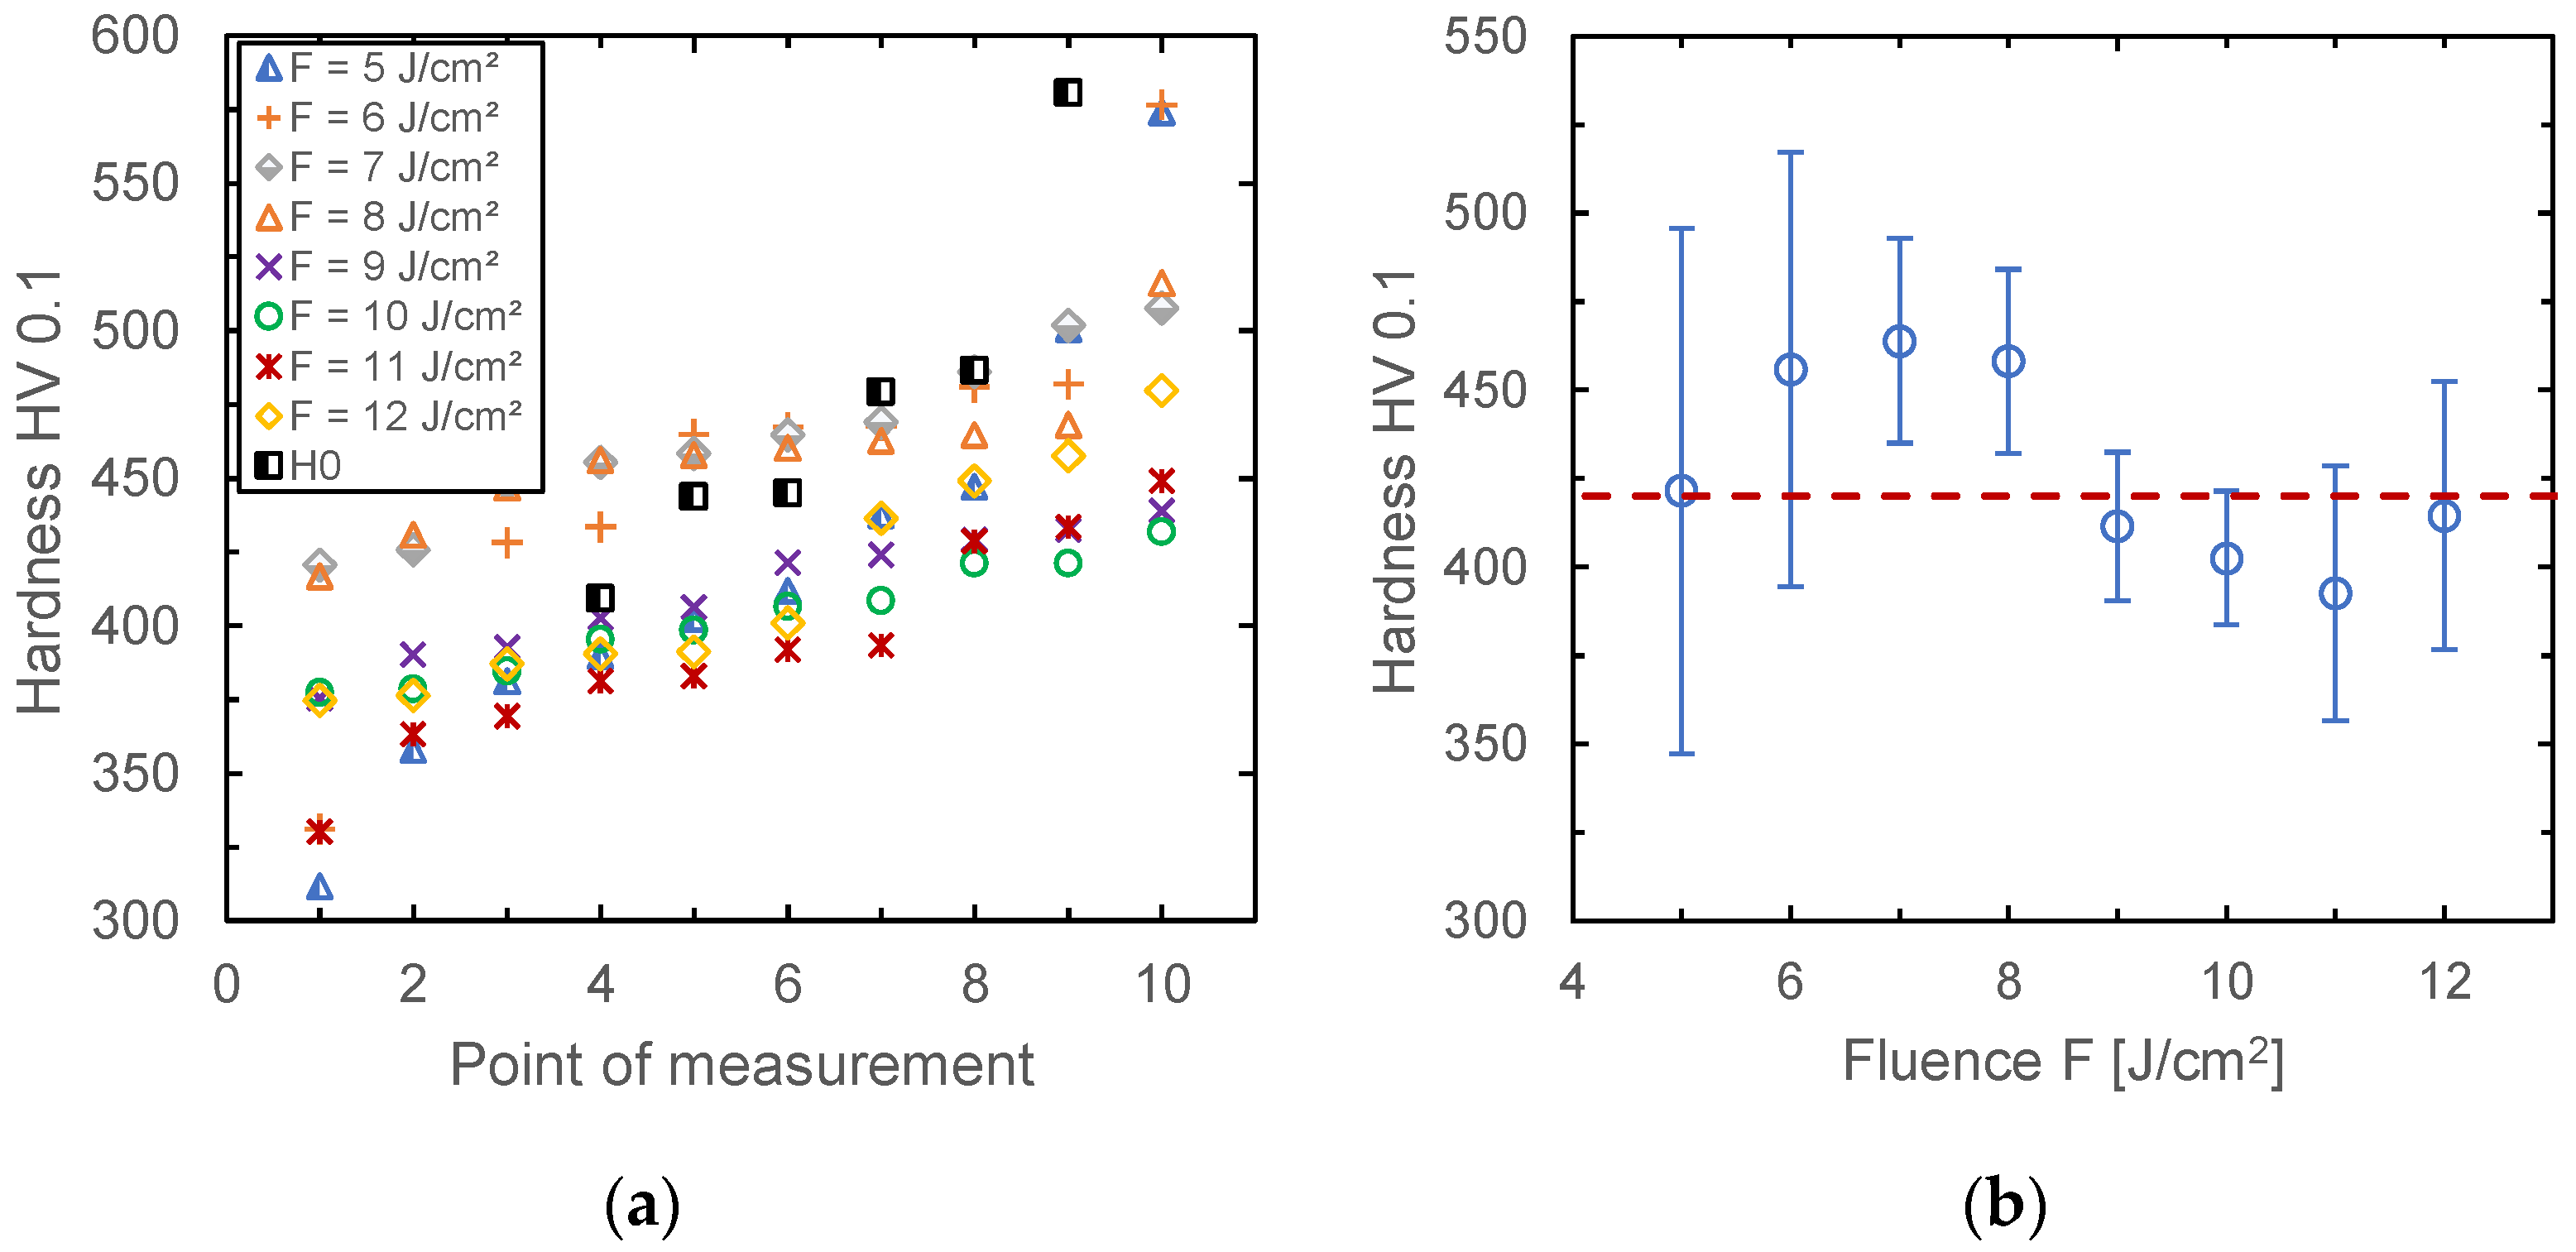
A detailed examination of the resulting surface roughness is carried out based on a systematic analysis of WLI data for each set of process parameters investigated. Figure 10a shows the surface roughness Sa as a function of the spatial wavelength (Sa spectrum) for the laser fluences investigated. Several observations are directly apparent for the smallest laser beam size Q100. The high standard deviation is due to the large number of craters on the surface (Figure 7b–e), so that the evaluation strongly depends on the number and the geometrical dimensions of the craters. Since the WLI data were measured at five randomly selected positions, this very high standard deviation results from large differences in the measured surface topographies. Furthermore, for fluences up to about 10–11 J/cm2, only a small reduction in micro-roughness up to a spatial wavelength of approximately 10 µm was obtained. In contrast to the other fluences, a high number of craters were formed for these fluences, which even led to a significant increase in macro-roughness. A significant reduction in micro-roughness up to a critical wavelength of approximately 80 µm was achieved only for the highest fluence of F = 12 J/cm2. However, this laser remelting process was accompanied by a significant evaporation of material. Furthermore, a characteristic stripe structure is visible in the micrograph (Figure 7f), which indicates that the remelting process had changed from a discrete pulsed process to a continuous remelting process. Nonetheless, the lowest surface roughness was achieved for Fpol = 12 J/cm2, so that this was determined as laser polishing fluence Fpol.
The Sa spectrum for Q400 is significantly different in comparison (Figure 10b). At a fluence of approximately 4 J/cm2, remelting of the surface started, and a reduction of micro-roughness was achieved for spatial wavelengths up to 10 µm. The reduction in micro-roughness and the critical wavelength were continuously increased for larger fluences. The critical wavelength was increased up to approximately 80 µm for fluences in the range of approximately 8–10 J/cm2. However, at 10 J/cm2, the visible evaporation of material already accompanies the remelting process, and characteristic stripes in the distance of the track offset are visible again on the remelted surface (Figure 7q). Laser polishing fluence at which the minimal roughness was achieved is approximately at Fpol = 8 J/cm2
The series of Sa spectra is completed by Q200 (not shown) and exhibits qualitatively the same interdependencies as the Sa spectrum for the larger laser beam Q400. For Q200, the minimal roughness was achieved at Fpol = 9 J/cm2. To conclude the analysis by Sa spectra, the lowest surface roughness for their respective beam dimensions and laser polishing fluence are compared in Figure 11a, while Figure 11b shows roughness evolution as a function of area rate for different spatial wavelength intervals. These comparisons reveal several insights. Firstly, it is revealed that the critical wavelength (λcr = 80 µm) is almost the same for all laser beam dimensions investigated. Secondly, laser polishing fluence increases for decreasing laser beam dimensions. Thirdly, for the larger laser beam size, a greater reduction particularly in micro-roughness was achieved. Fourthly, the achieved surface roughness for Q200 and Q400 are almost the same. Finally, macro-roughness was not reduced by any combination of process parameters, but process-inherent surface features were generated, which led even to an increase in macro-roughness. Furthermore, Figure 11b demonstrates explicitly that the minimal roughness achieved does not depend on area rate. This result is principally the same for each specific spatial wavelength interval up to 40 µm. Therefore, the results indicate that the area rate can be increased without an increase in resulting surface roughness after LµP. In this study, the area rate was increased by a factor of 16 from 1.2 cm2/min to 19.2 cm2/min (Figure 11b), while the required laser polishing fluence was reduced from approximately 12 to 8 J/cm2 at the same time (Figure 11a). This led to an overall reduction of energy input by approximately 33%.
Sa spectra analyze the areal surface roughness but do not allow for any differentiation regarding a reduction in roughness depending on the orientation of surface features, such as grinding or milling grooves. The initial surface showed a strong heterogeneity regarding the directional roughness, since the milling grooves had a dominant direction, so that the roughness perpendicular to the grooves was significantly higher than parallel to them (cf. Figure 4 and Figure 5). Therefore, a representative WLI measurement of the surface showing the lowest roughness after laser polishing was analyzed by 1D FFT analysis along two perpendicular sections (Figure 12a). The 1D FFT analysis provides a frequency spectrum for each section, which was then compared to a similar analysis of the initial surface (Figure 5).
Figure 12a shows a WLI image of the surface with the lowest micro-roughness (Q400; F = 8 J/cm2). A cross-section along the white dashed line is shown in Figure 12b, while the profile of a representative longitudinal section is shown in Figure 12d. The corresponding frequency spectra are displayed in Figure 12c,d, respectively. A similar analysis is shown in Figure 12f,g for a representative cut-out of the initial surface (Figure 5).
A comparison of sections and their corresponding FFT analyses clearly visualizes the effect of LµP on surface roughness. Micro-roughness is significantly reduced along both sections down to spatial frequencies of approximately fy ≈ 83 mm−1 (λcr,y ≈ 12 µm) for the cross-section (Figure 12c) and even down to fy ≈ 33 mm−1 (λcr,y ≈ 30 µm) for the longitudinal section (Figure 12e). The comparison of an LµP surface (Figure 12b) and initial surface (Figure 12f) along the cross-section perpendicular to the milling grooves shows that these could not be completely smoothed out. This is also visualized and quantified in the corresponding FFT analyses (Figure 12c,g), which show that the amplitudes of characteristic spatial frequencies in the range of approximately 1–10 mm−1 could not be reduced. The profiles and FFT analyses for the comparison along the longitudinal section show that these low spatial frequencies were not only not reduced but significantly increased (Figure 12d,e,h,i). Therefore, roughness at low spatial frequencies (long spatial wavelengths) undergoes a directional homogenization, so that the amplitudes for the corresponding spatial frequencies in the x and y direction are almost equalized after LµP (Figure 12c,e).

3.5. Micro-Hardness

The influence of fluence on micro-hardness was exemplarily investigated for Q400. In this case, the micro-hardness HV0.1 (20s) was investigated by means of nano-indentation (Picodentor HM500, Helmut Fischer GmbH, Sindelfingen, Germany) for fluences ranging from 5 to 12 J/cm2 (Figure 13). Ten hardness measuring points were examined on each laser-polished surface. The hardness measurements were sorted from the smallest to largest and are shown in Figure 13a. The initial hardness H0 of the initial surface was measured the same way, and a micro-hardness of 420 (±210) HV0.1 was determined (red, dashed line in Figure 13b). The standard deviation on this measurement was very large, depending on whether chromium carbides were completely or partially hit during the measurement (cf. Figure 6b). The maximum micro-hardness on the initial surface was approximately 827 HV0.1 (chromium carbides), while the minimum hardness was only 101 HV0.1 (steel matrix; not shown in Figure 13a).
Figure 13b shows the average micro-hardness and standard deviation as a function of laser fluence. At fluences of up to approximately 8 J/cm2, the hardness was thereby increased, and the standard deviation was significantly reduced to approximately ±29 HV0.1. For all laser remelted surfaces, a micro-hardness between approximately 382–464 HV was achieved. The maximum was reached at 464 (±29) HV0.1 (F = 8 J/cm2), the minimum average micro-hardness was approximately 382(±36) HV0.1 (F = 8 J/cm2). There is a tendency for greater hardness to be achieved on the discretely remelted surfaces (F < 9 J/cm2) compared to the presumably continuously remelted surfaces, on which the characteristic remelting stripes were also observed. This might be a result of the different characteristics of the remelting process and higher cooling rates associated with the discrete, pulsed LµP process.

4. Discussion

4.1. Surface Roughness Evolution

In general, surface roughness reduction is achieved, particularly a reduction of micro-roughness. This reduction depends among others on the initial roughness, which is clearly visible if the spatial frequency profile along a longitudinal and a cross-section are compared to each other (cf. Figure 12). Due to the mechanical preparation of the surfaces, characteristic grinding grooves were created on the surface (cf. Figure 4 and Figure 5). The roughness perpendicular to these grooves (cross-section) was considerably higher than that parallel to these grooves (longitudinal section). Accordingly, the smoothing effect is different for these two directions. Although roughness spectra enable an evaluation of surface roughness, directional differences are not visible in these spectra. The spectral analysis along a longitudinal section shows that almost all spatial frequencies larger than approximately fy ≈ 33 mm−1 (λcr,y ≈ 30 µm) are completely reduced to almost zero. In contrast, only spatial frequencies larger than approximately fy ≈ 83 mm−1 (λcr,y ≈ 12 µm) were effectively smoothed out along the cross-section. The main reason for this is that the initial surface features are much more pronounced perpendicular to the milling grooves than parallel to them. Furthermore, the scanning strategy creates surface features perpendicular to the scanning direction, such as a stripe-like structure due to the track offset (Figure 7l,q). Therefore, although it seems that spatial frequencies smaller than approximately fy ≈ 83 mm−1 and fy ≈ 33 mm−1 were not completely smoothed, it is more likely that the initial roughness within this range was actually smoothed, but additional process-inherent surface features were created. This would explain the heterogeneity in the micro-roughness for these specific spatial frequencies.

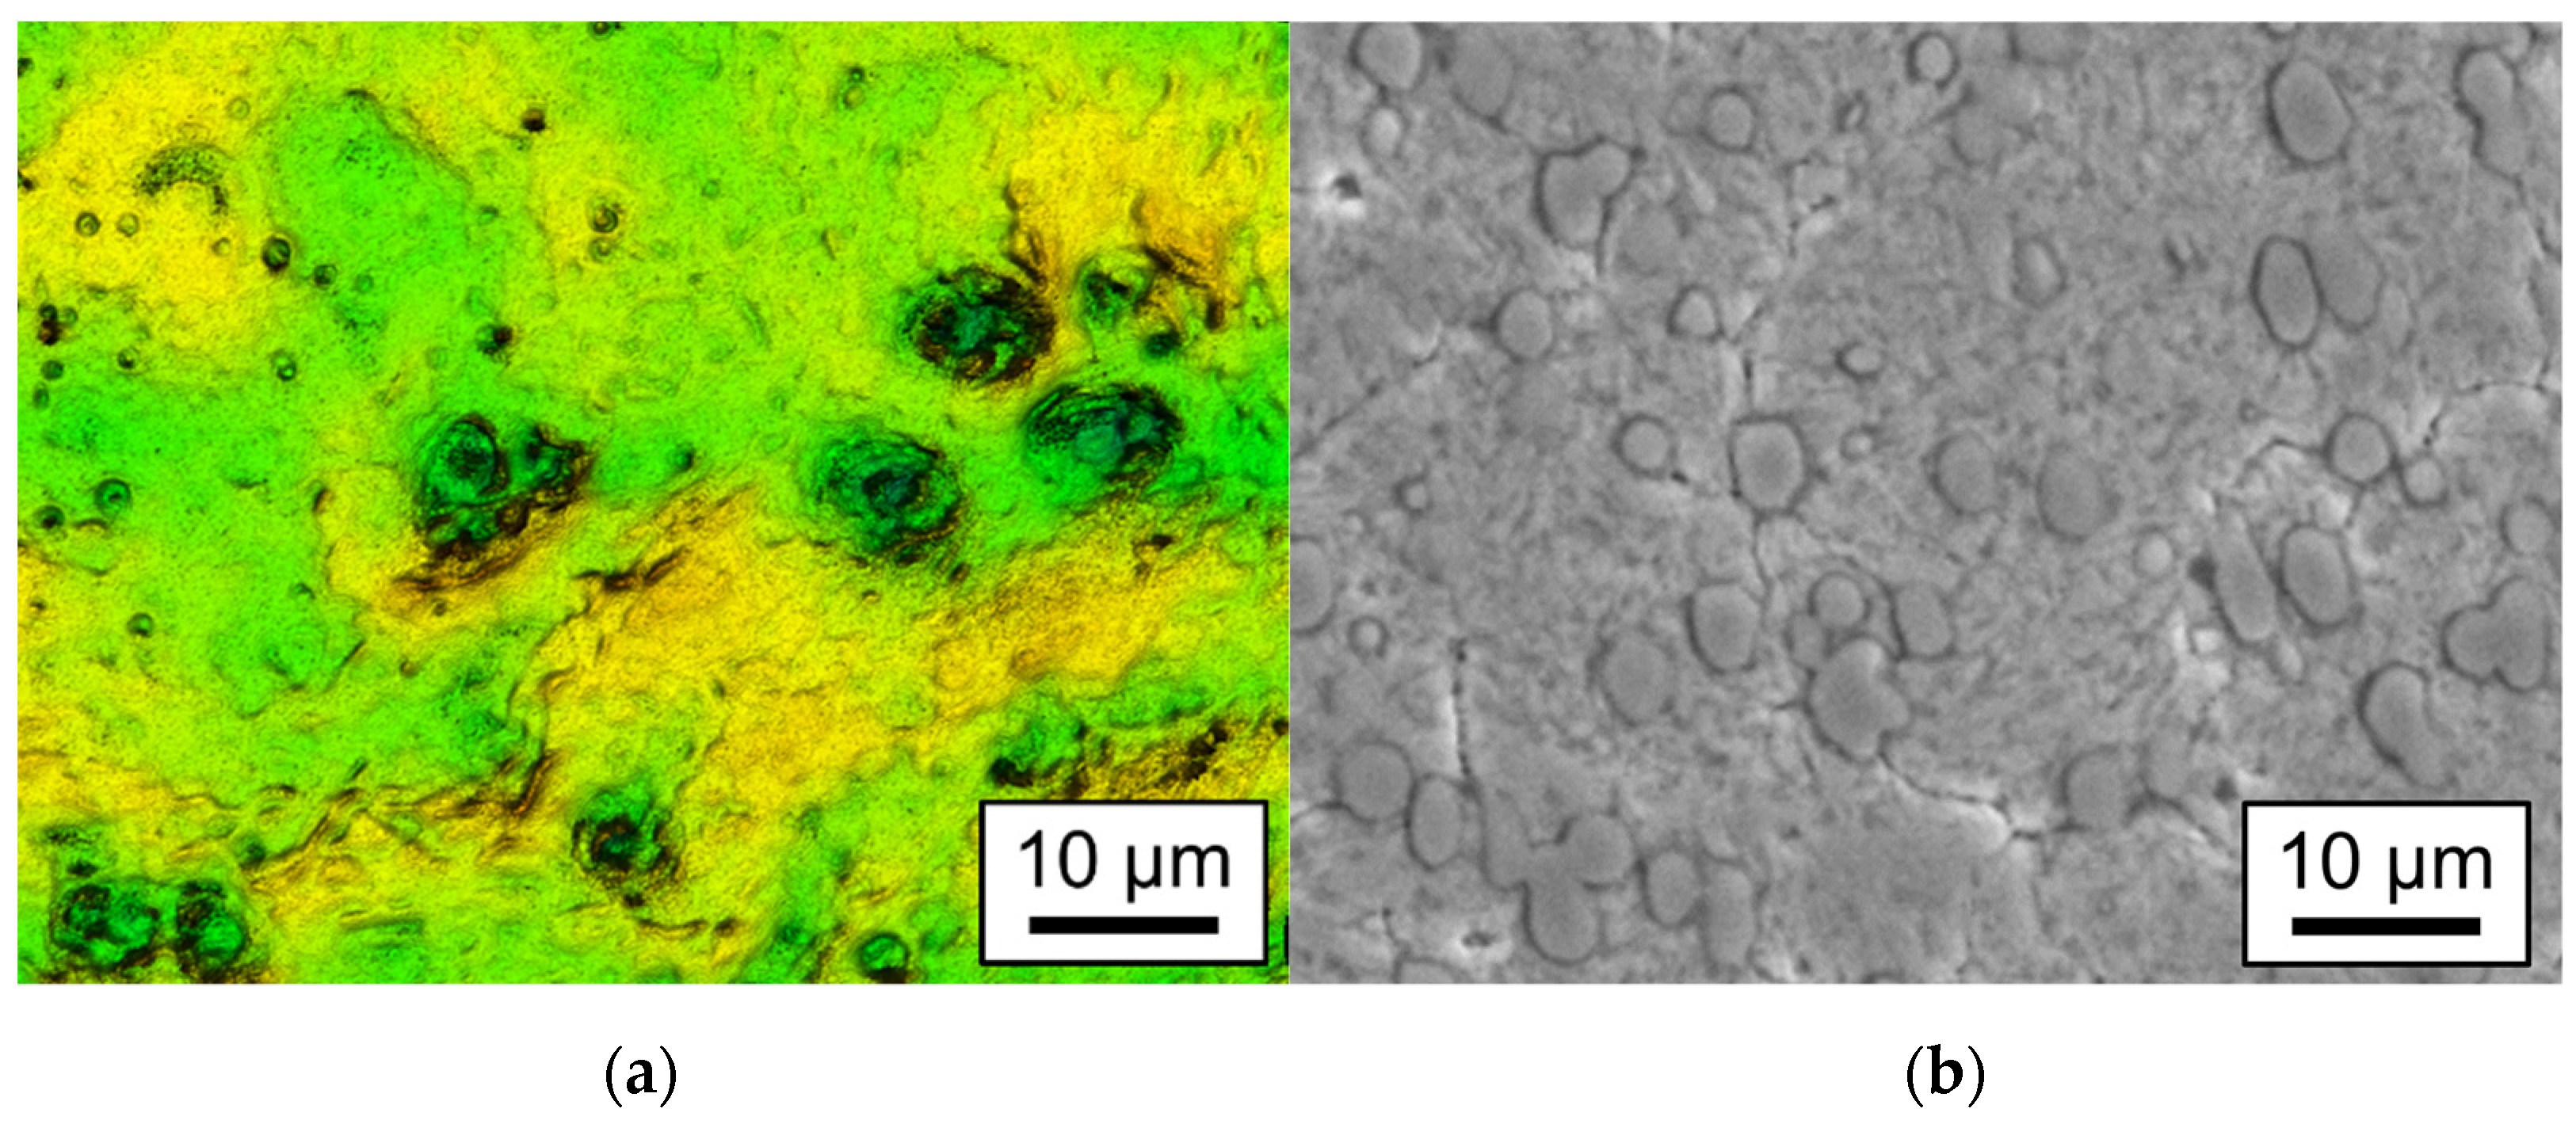
4.2. Formation of Craters and Dimples

The formation of crater-like features in the surface was observed for many sets of process parameters but was particularly pronounced for Q100. As the initial analysis of microstructure regarding the size and distribution of chromium carbides indicates, it can be assumed that these chromium carbides are the source or at least the initiation side for these craters. The number of craters seems to correlate approximately with the carbides near the surface (cf. Figure 6). The formation of crater-like features is not unknown in LµP, but it was intensely investigated by Liebing [52] for bearing steel 100Cr6. However, Liebing [52] primarily identified oxides and sulfides as sources for melt pool disturbances or evaporation that lead to pronounced crater formation. According to the combined works of Tolochko et al. [53] and Boley et al. [54], the conclusion can be drawn that the absorption coefficient of chromium carbides at the laser wavelength is significantly larger than that of the surrounding steel matrix. Additionally, the intensity distribution for Q100 shows a significant intensity peak in the center of the distribution (cf. Figure 2a). Both effects in combination are assumed to result in the increased number of craters after laser remelting. This demonstrates that a top-hat-shaped intensity distribution or at least an intensity distribution without pronounced peaks is preferable for laser micro polishing. Additionally, it can be assumed that the chromium carbides also influence the surface topography evolution for the larger laser beam sizes. However, instead of pronounced craters, preferably long-wave dimples or depressions were created. Due to larger laser beam dimensions and thus larger melt pools, the influence of an evaporating chromium carbide of a certain size is relatively smaller than for a smaller melt pool. Additionally, larger melt pools lead to longer melt durations and increase the available time for the effective damping of capillary surface waves [28]. Capillary surface waves may result from disturbances of the melt pool such as localized evaporation [55]. On the other hand, larger melt pools lead to the remelting of more chromium carbides at the same time. However, an evolution mechanism of similar features was discussed by Nüsser et al. [43], who assume that these dimples result from macro ripple formation and the repeated remelting of these ripples. An additional effect might result from a low pulse stability of the laser beam source, which might lead to additional, undesired surface features with the approximate dimensions of the laser beam [19]. Furthermore, Spranger and Hilgenberg [56] found that a significant dissolution of carbides was a result of pulsed laser remelting of AISI D2. In sum, we assume that all these effects play a role in the formation of long-wave dimples. The partial evaporation and partial dissolution of chromium carbides are assumed to be the key reasons for disturbances of the melt pool volume, changes in melt pool dynamics, and deformation of the melt pool surface. These lead to the formation of craters at small laser beam dimensions and to long wave dimples when remelting with larger laser beams. Multiple remelting cycles (approximately 100 times per spot) lead to a partial smoothing and directional homogenization of the specific spatial roughness frequencies, as it is shown in the roughness spectra (Figure 10, Figure 11 and Figure 12).

4.3. Transition to Continous Remelting Process and Micro-Hardness

This stripe-like structure with continuous boundary lines between the individual tracks (Figure 7l,q) is typically a feature of a continuous remelting process [27]. This is to be expected for long pulse duration, for large track and pulse overlap, and for high laser fluences. This effect is essentially due to heat accumulation (Weber et al. [57,58]), so that the molten pool no longer solidifies before the following laser pulse impinges on the surface. This is an effect that was observed in LµP particularly by Temmler et al. [18] at high pulse repetition frequencies for ns laser pulses. The authors defined an empirical formula for an estimation of a threshold scan speed vscan,th as a function of laser beam diameter dL, pulse duration tP, and pulse repetition frequency frep, at which the discrete pulsed remelting process changes to a continuous one (Equation (2)).
v s c a n , t h d L · t P · f r e p 2
Although the criterion from Equation (2) is not fulfilled for the process parameters used, the threshold scan speed (vscan, th = 192 mm/s; tP = 1.2 µs) is just smaller than the used scan speed by a factor of approximately 4. Additionally, it must be added that the introduced criterion was established on an empirical basis and should be valid for a quasi-continuous remelting process at laser polishing fluence without material ablation. However, as already determined from the microscope images and visual observations during the process, a continuous remelting process occurs only at a fluence level, where significant material evaporation is already clearly observable without optical aids. Therefore, it is reasonable to assume that the stripes are a clear indication for a continuous remelting process. This would particularly help to explain that almost no craters were visible anymore for a small laser beam size Q100 and very high fluences (F = 12 J/cm2).
The effect of surface ripple formation (cf. Figure 7q,r) is probably due on the one hand to the formation of a continuous melt pool and on the other hand to the irradiation of the surface in reoccurring, discrete time intervals of 50 µs (20 kHz). This leads to periodic fluctuations of the melt pool volume, which results in a periodic structuring of the surface. This principle is typically known from the WaveShape process, where it is specifically used to generate mostly periodic surface structures [7,59,60]. Furthermore, a low pulse stability of the laser beam source probably causes the generated ripples to fluctuate in shape and structure. A similar effect was specifically used by Pfefferkorn and Morrow [61] to achieve surface structuring by the spatial and temporal control of laser fluence.
The transition to the continuous remelting process also tends to be reflected in the results of the micro-hardness measurements (Figure 13). A dissolution and/or partial evaporation of chromium carbides is assumed to lead to a significant reduction of standard deviation in the micro-hardness measurements. This is presumably because only fewer, smaller, or no chromium carbides were hit in the micro-hardness measurements. Thus, the largest micro-hardness measured was approximately 550 HV instead of approximately 830 HV0.1 on the initial surface. However, at the same time, no areas of the comparatively soft steel matrix were hit any more (≈100 HV 0.1), but the minimal micro-hardness in the laser-polished fields was approximately 320 HV0.1. This indicates that carbon from the chromium carbides was increasingly dissolved in the steel matrix. It is assumed that the entire surface boundary layer was hardened through the formation of martensite and achieved an average micro-hardness of up to approximately 464 HV0.1 with significantly smaller standard deviations (partially < 30 HV0.1). Additionally, the micro-hardness of the discretely, remelted LµP surface tends to be higher than for the continuously remelted surface. This is presumably due to the higher cooling rates in the LµP process in comparison to the continuous remelting process. A similar effect has been observed in earlier works on other steels e.g., H11 (Preußner et al. [62]), or S7 (Morrow and Pfefferkorn [13]). However, Maharjan et al. [33] found for 50CrMo4 steel that the most pronounced hardening effect was achieved for longer pulse duration and cw laser radiation, i.e., in principle for smaller cooling rates. The reason for these contradictory results is unclear, but it is most likely a consequence of the different chemical composition of these steels or the specifics of the temperature evolution during the laser treatment.

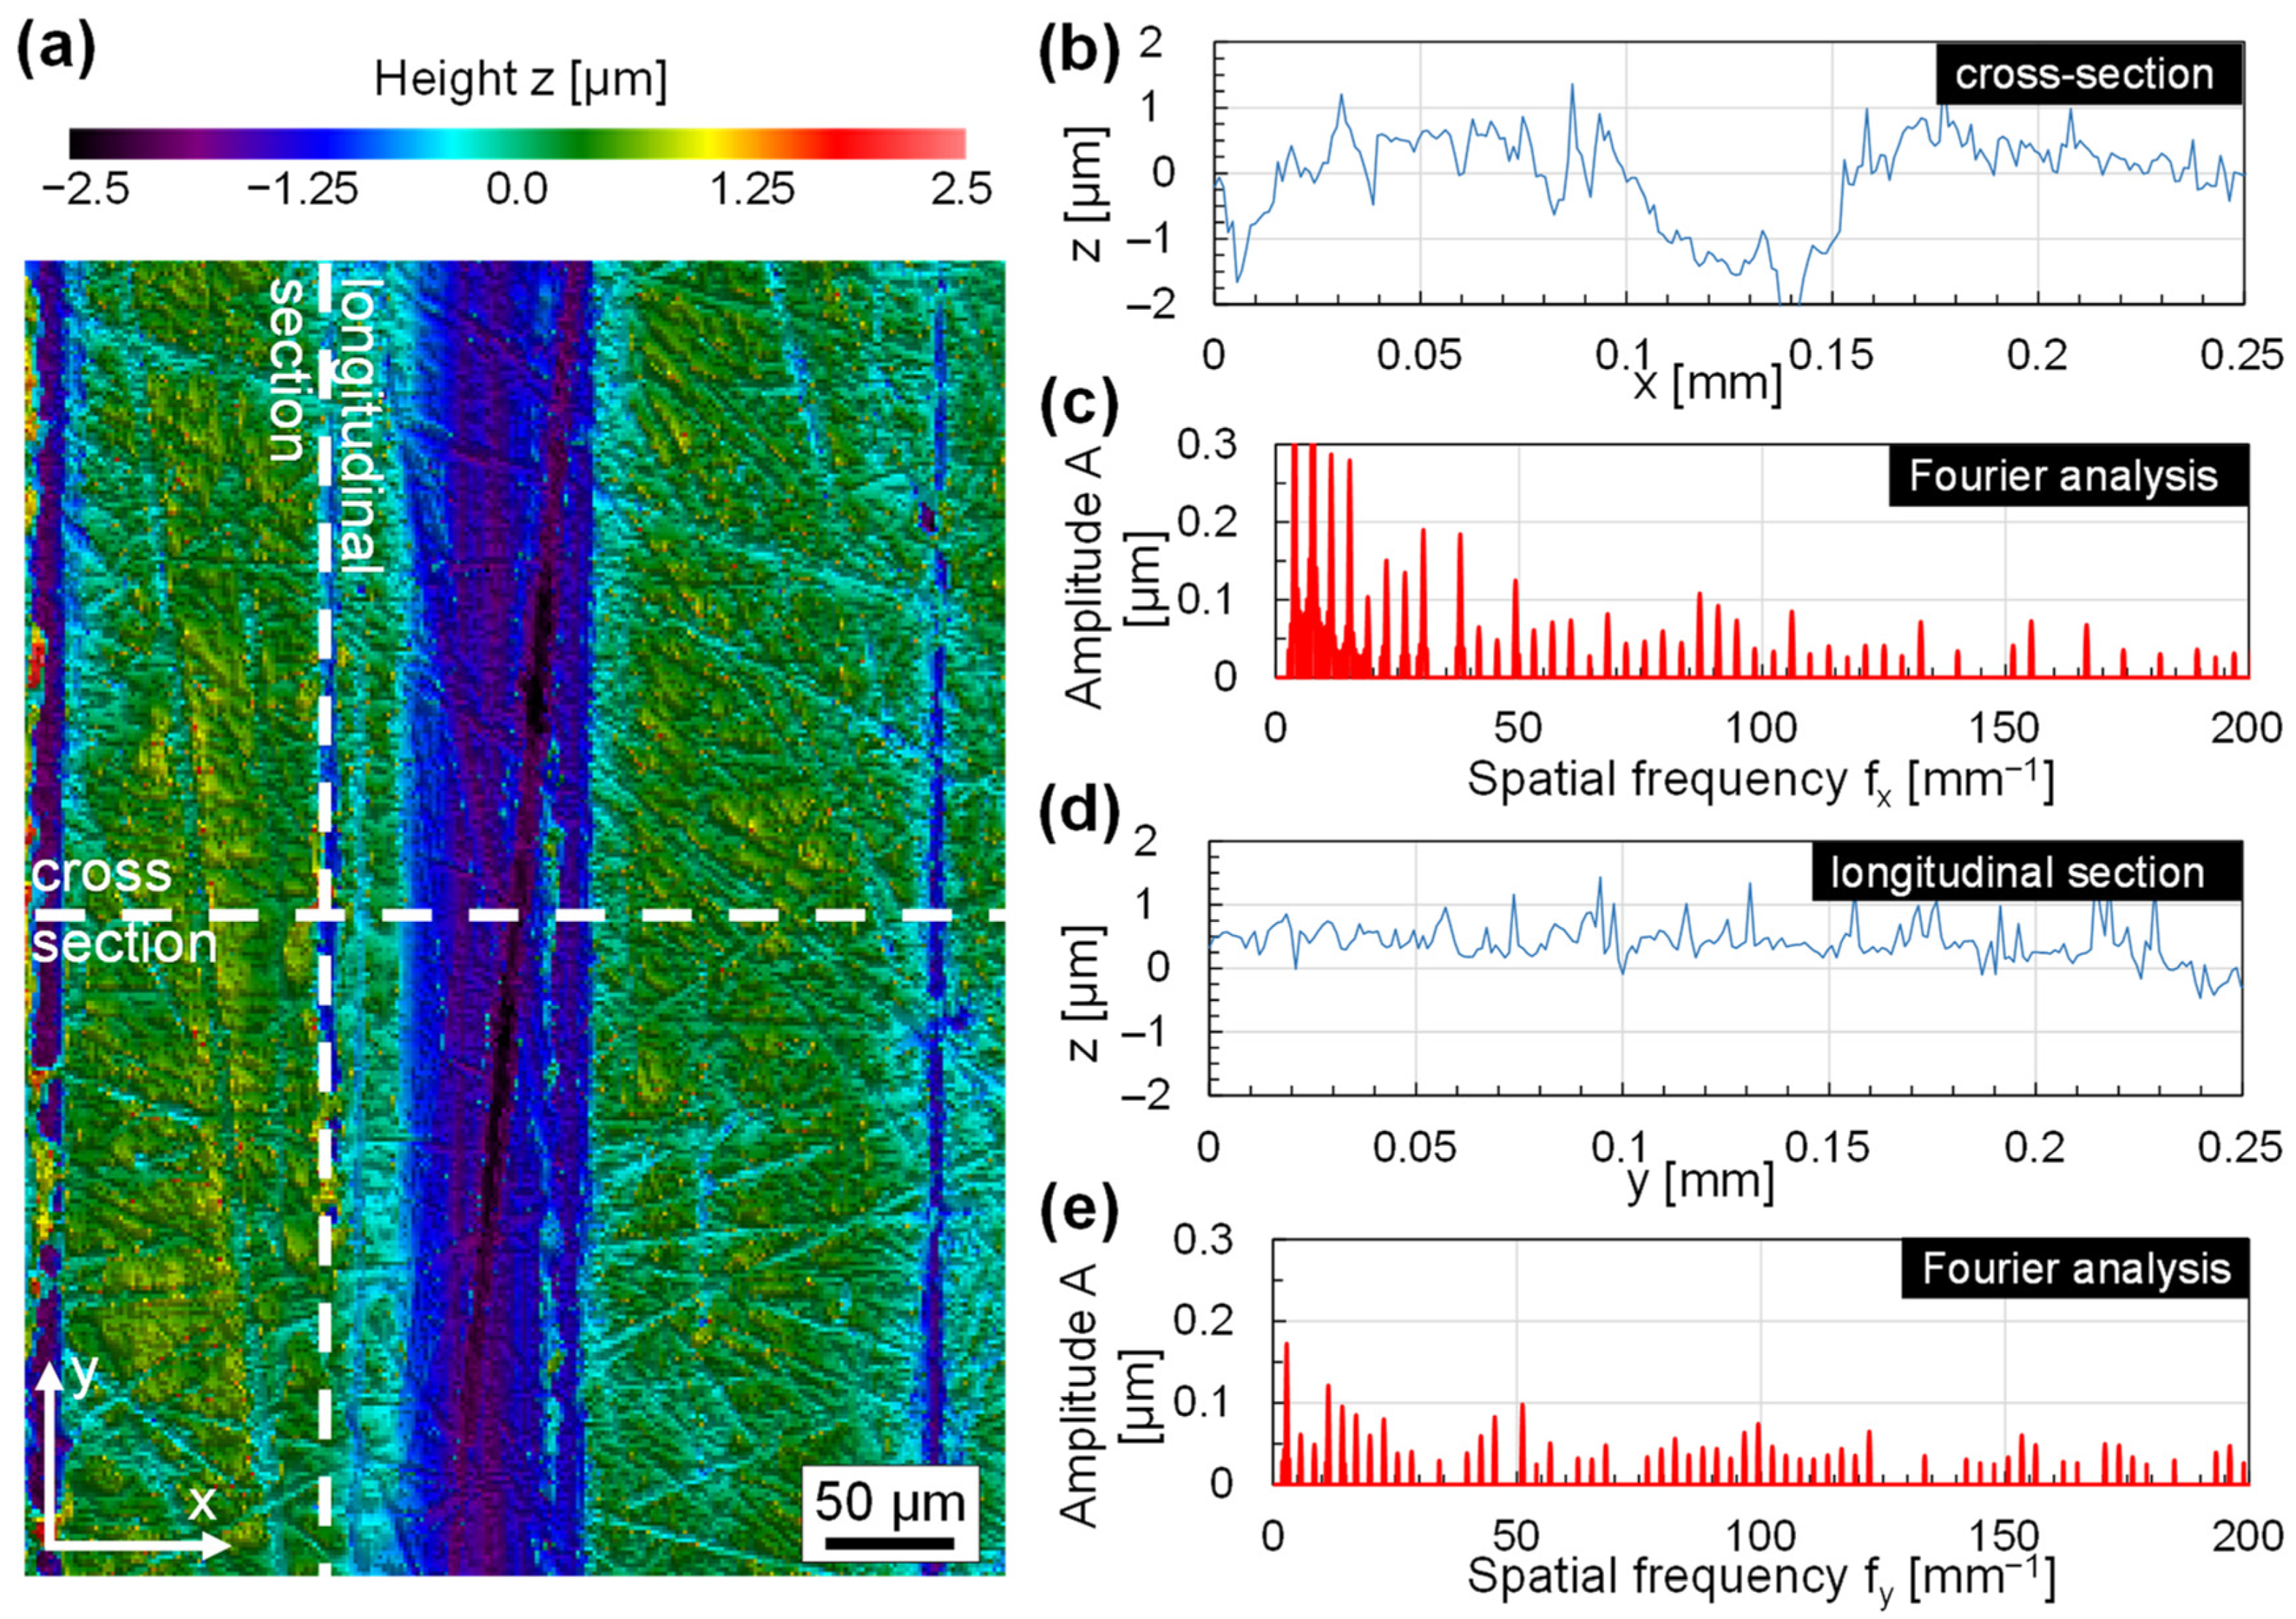
4.4. Critical Wavelength/Frequency

The critical wavelength or critical frequency was almost the same for all laser beam sizes. This underscores the importance of the pulse duration and that the laser beam size is of secondary importance. However, the laser beam dimensions are assumed to be at least twice as large as the critical wavelength. The critical wavelength for Q100 and F = 12 J/cm2 is of special interest since a change to a continuous process is assumed. In a continuous remelting process, melt duration is typically approximated by the interaction time of the laser beam and material [39], which is typically calculated by tint = dL·vscan−1 and is approximately tint = 0.5 ms for Q100. This is two orders of magnitude larger than the pulse duration (tP = 1.2 µs), but the critical wavelength was not significantly increased to more than 80 µm (in comparison to Q200 and Q400). This is a little bit surprising, but in this case, the critical wavelengths are presumably strictly limited by the laser beam dimensions, since no roughness with larger dimensions than the laser beam can effectively be smoothed in cw laser polishing. Additionally, melt pool disturbances due to the partial evaporation and dissolution of chromium carbides counteract a more effective smoothing. This is particularly imminent for Q200 and Q400, where also a continuous remelting process is assumed for high fluences of F > 10 J/cm2. This critical wavelength is not only further increased but even reduced, since the process-inherent formation of surface structures, e.g., ripples or boundary lines at the edges of the laser tracks, counteracts the smoothing effect of surface remelting.

4.5. Laser Polishing Fluence and Area Rate

Another important result of this study is that the laser polishing fluence decreases for larger laser beam dimensions (Figure 11a). A possible explanation results from an energetic point of view. At fixed laser fluence, a larger laser-irradiated area absorbs more laser energy in total. An increase in absorbed energy not only results in larger melt pool dimensions but also in longer melt durations. Additionally, temperature gradients in larger melt pools are less steep, and thus, cooling to ambient temperature takes longer. Particularly for multi-pulse processing, this has several consequences. Firstly, if the temporal distance between subsequent laser pulses is the same as for smaller laser beam dimensions, heat accumulation is more pronounced due to larger energy input per pulse and smaller temperature gradients in the melt pool. Heat accumulation not only leads to a reduction in the threshold fluence for laser ablation [57] but also to a reduction in laser polishing fluence [18]. Secondly, particularly noteworthy at this point is that the overall energy input for a larger laser beam size is reduced. This prevents the global heat accumulation of the whole sample and should reduce thermal effects such as distortion and deformation. Since the laser polishing fluence is reduced and local heat accumulation is increased for larger laser beams, locally induced thermal stresses should also be reduced [63]. Based on the insights of Spranger at al. [64], one could also assume that the very high cooling rates lead to a very fine microstructure in each case; however, this was not particularly investigated in this study.
The results already show that larger laser beam sizes lead to higher area rates without increasing the resulting surface roughness if the number of remelting cycles is kept constant (Figure 11b). In principle, the influence of laser beam dimensions sL2, repetition rate frep, and number of remelting cycles n on an achievable area rate AR can be discussed based on Equation (3).
A R = s L 2 · f r e p n ; w i t h   n = s L 2 d x · d y ;   s L , m a x 2 = E P , m a x F p o l ;   P L , m a x = E P , m a x · f r e p , m a x
The maximum area rate AR is the product of the remelted area per pulse (A = sL2) and the pulse repetition rate frep divided by the number of remelting cycles per spot n (effectively resulting from pulse and track overlap). Thus, for example, the side length sL of a square laser spot has a quadratic effect on the area rate AR. However, the required pulse energy EP scales almost linearly with the remelted area A (EP ~ A). Increasing the pulse frequency leads to a linear increase in the area rate. Therefore, preferably, the dimensions of the focused laser beam should be maximized if the pulse repetition rate is crucially limited. The maximum laser beam dimensions depend on the available maximum pulse energy EP,max and on the laser polishing fluence Fpol. In turn, the laser polishing fluence Fpol tends to decrease with increasing dimensions of the laser beam (Figure 11a). Furthermore, the maximum pulse frequency depends on the maximum available laser power PL,max at maximum pulse energy EP,max. Applied specifically to LµP, and taking into account this and other studies on LµP, a reasonably achievable area rate can be estimated for a commercially available laser system. In this work, a spot on the surface was remelted on average approximately n = 100 times. However, typically, only approximately n = 20 remelting cycles are required to achieve a minimal surface roughness in LµP of steels [18,27]. Using the example of a commercially available laser system (e.g., IPG YLPN-HP tP = 120 ns, PL,max = 5 kW; EP,max = 100 mJ; frep,max = 50 kHz), a realistic area rate can be estimated. The selected laser beam source already provides a square fiber cross-section. The maximum pulse energy of approximately EP,max = 100 mJ enables a laser focus with an area of sL2 = 20 mm2 at a required laser polishing fluence of approximately Fpol = 5 J/cm2. The maximum pulse frequency of the laser system is 50 kHz, so that a maximum laser power of PL,max = 5 kW is available. Thus, considering n = 20 remelting cycles per spot, area rates of up to AR = 3 m2/min might be achievable. Area rates of this order of magnitude are already remarkably interesting for industrial applications, even for large-area polishing of flat components.
Larger laser beam dimensions lead to larger area rates with reduced energy input, since the required laser polishing fluence decreases (Figure 11). If high spatial resolution is of secondary importance in LµP and large pulse energies are available, then large area rates are easily achievable. However, a similar effect of decreasing laser polishing fluence was observed for high pulse frequencies [18]. Thus, an increase in pulse frequency also leads to a reduced laser polishing fluence and to a reduction of the overall irradiated laser energy. Which effect outweighs the other cannot be said without further studies, but both ways—increasing single pulse energy and increasing pulse repetition frequency, respectively—are viable ways to significantly increase the area rate in LµP. Since the product of single pulse energy EP and pulse frequency frep equals the average laser power PL, Equation (3) can be boiled down to a simple dependency AR ~ PL,max, which is valid for many laser-based processes. The area rate in LµP basically scales linearly with the average laser power of the laser beam source. Nonetheless, there are limits to consider regarding the maximum single pulse energy (regarding damage thresholds of optical components etc.), pulse duration (maximum pulse peak power), and maximum pulse repetition frequency (maximum deflection speed of laser scanning systems, etc.).
As a visual conclusion of the discussion, Figure 14 shows the laser-polished surface with the lowest roughness achieved in this study (Figure 14b) compared to the initial surface roughness (Figure 14a). A considerable reduction in surface roughness and a particular increase in gloss are the obvious results displayed in these micrographs.

5. Conclusions

This work investigated laser micro polishing (LµP) of tool steel 1.2379 (AISI D2) using a square intensity distribution in three different sizes (Q100, Q200, Q400) and laser fluences ranging from 3 to 12 J/cm2. A laser fluence of 3 J/cm2 was below the melting threshold, while 12 J/cm2 exceeded the evaporation threshold and led to significant material evaporation for all laser beam sizes. Additionally, the experimental results for LµP of 1.2379 led to some noteworthy insights:
  • LµP significantly decreases micro-roughness up to a critical wavelength of approximately 80 µm and increases the gloss of the surface. (e.g., by a factor of ten for Q400 from Sa = 32 nm to Sa = 3 nm in the spatial wavelength regime from 1.25 to 2.5 µm).
  • An increase in laser beam dimensions, while adapting pulse overlap and track offset accordingly, leads to a significant increase in area rate from 1.2 to 19.2 cm2/min without increasing the resulting surface roughness.
  • An increase in laser beam dimensions from Q100 to Q400 leads to a decrease in fluence from 12 J/cm2 to approximately 8 J/cm2 required for laser polishing, which results in an overall reduced energy input (approximately 33%).
  • A significant increase in laser fluence above the polishing laser fluence leads to a change of the discrete, pulsed remelting process to a continuous remelting process. Particularly in the continuous remelting process, macro-roughness was partially increased, and surface rippling was observed.
  • Near-surface chromium carbides are assumed to be partially evaporated during LµP. This presumably leads to melt pool disturbances and the formation of undesired surface features e.g., craters, which increase surface roughness.
  • The dissolution of chromium carbides during the remelting process presumably leads to a homogenization of micro-hardness in the surface boundary layer of approximately 382–464 HV0.1.
  • Intensity distributions with significant peaks are to be avoided since high peak intensities and local heterogeneities in material absorption increase the risk of uncontrolled material evaporation and the formation of undesired surface features.
Overall, it is concluded that an increase in laser beam size enables the use of higher pulse energies and larger average laser power, and it also leads to significantly higher area rates and less overall energy input. Therefore, besides an increase in pulse frequency, larger pulse energies and larger laser beam sizes are a viable way to significantly increase the area rate in LµP. For industrial applications, multi-kW laser systems with suitable pulse energies and pulse frequencies are widely available, which potentially enable area rates of several m2 per minute in LµP.

Author Contributions

Conceptualization, A.T.; methodology, A.T., I.R.; software, A.T.; validation, A.T., M.E.K.; formal analysis, A.T., M.C.; investigation, M.C., M.E.K., S.-K.R.; resources, A.T.; data curation, M.C., A.T.; writing—original draft preparation, M.C., A.T.; writing—review and editing, A.T., M.C., S.-K.R.; visualization, A.T., I.R., M.E.K.; project administration, I.R., A.T.; funding acquisition, A.T., I.R.; supervision, A.T. All authors have read and agreed to the published version of the manuscript.

Funding

This research was partially funded by the Deutsche Forschungsgemeinschaft (DFG) in the collaborative research project “Lubricant-free tribology concepts for cold extrusion by interaction-minimized surface layers and structures“, under grant number PO 591/37-3 within the priority program SPP 1676 “Dry Metal Forming”.

Institutional Review Board Statement

Not applicable.

Informed Consent Statement

Not applicable.

Data Availability Statement

The data presented in this study are available on reasonable request from the corresponding author.

Acknowledgments

The authors would like to personally thank Konrad Wissenbach and Edgar Willenborg from the Fraunhofer Institute for Lasertechnology ILT (Aachen, Germany) for fruitful discussions and acknowledge their passionate drive to push laser polishing to new boundaries. Finally, we thank the anonymous referees for their effort and valuable comments.

Conflicts of Interest

The authors declare no conflict of interest. The funders had no role in the design of the study; in the collection, analyses, or interpretation of data; in the writing of the manuscript, or in the decision to publish the results.

References

  1. Temmler, A.; Graichen, K.; Donath, J. Laser Polishing in Medical Engineering. LTJ 2010, 7, 53–57. [Google Scholar] [CrossRef]
  2. Flemmer, J. CAM-NC-Datenkette für die Laserbearbeitung von Freiformflächen mit Simultaner Bewegung Mechanischer Achsen und Galvanometrischem Laserscanner. Ph.D. Thesis, RWTH Aachen University, 1. Edition, Apprimus. Aachen, Germany, 2018. [Google Scholar]
  3. Singh, K.; Khatirkar, R.K.; Sapate, S.G. Microstructure evolution and abrasive wear behavior of D2 steel. Wear 2015, 328–329, 206–216. [Google Scholar] [CrossRef]
  4. Hasselbruch, H.; Lu, Y.; Messaoudi, H.; Mehner, A.; Vollertsen, F. Tribological Properties of Multi-Layer a-C:H:W/a-C:H PVD-Coatings Micro-Structured by Picosecond Laser Ablation. KEM 2019, 809, 439–444. [Google Scholar] [CrossRef]
  5. Henn, M.; Reichardt, G.; Weber, R.; Graf, T.; Liewald, M. Dry Metal Forming Using Volatile Lubricants Injected into the Forming Tool Through Flow-Optimized, Laser-Drilled Microholes. JOM 2020, 1, 59. [Google Scholar] [CrossRef] [Green Version]
  6. Förster, D.J.; Weber, R.; Holder, D.; Graf, T. Estimation of the depth limit for percussion drilling with picosecond laser pulses. Opt. Express 2018, 26, 11546–11552. [Google Scholar] [CrossRef] [Green Version]
  7. Temmler, A.; Comiotto, M.; Ross, I.; Kuepper, M.; Liu, D.M.; Poprawe, R. Surface structuring by laser remelting of 1.2379 (D2) for cold forging tools in automotive applications. J. Laser Appl. 2019, 31, 22017. [Google Scholar] [CrossRef]
  8. Ross, I.; Temmler, A.; Küpper, M.; Prünte, S.; Teller, M.; Schneider, J.M.; Poprawe, R. Laser Polishing of Cold Work Steel AISI D2 for Dry Metal Forming Tools: Surface Homogenization, Refinement and Preparation for Self-Assembled Monolayers. KEM 2018, 767, 69–76. [Google Scholar] [CrossRef]
  9. Mousavi, A.; Kunze, T.; Roch, T.; Lasagni, A.; Brosius, A. Deep drawing process without lubrication—An adapted tool for a stable, economic and environmentally friendly process. Procedia Eng. 2017, 207, 48–53. [Google Scholar] [CrossRef]
  10. Brosius, A.; Mousavi, A. Lubricant free deep drawing process by macro structured tools. CIRP Ann. 2016, 65, 253–256. [Google Scholar] [CrossRef]
  11. Häfner, T.; Heberle, J.; Hautmann, H.; Zhao, R.; Tenner, J.; Tremmel, S.; Merklein, M.; Schmidt, M. Effect of Picosecond Laser Based Modifications of Amorphous Carbon Coatings on Lubricant-free Tribological Systems. JLMN J. Laser Micro/Nanoeng. 2017, 12, 132–140. [Google Scholar] [CrossRef]
  12. Jähnig, T.; Mousavi, A.; Steinhorst, M.; Roch, T.; Brosius, A.; Lasagni, A.F. Friction reduction in dry forming by using tetrahedral amorphous carbon coatings and laser micro-structuring. Dry Met. Form. 2019, 5, 25–30. [Google Scholar]
  13. Morrow, J.D.; Pfefferkorn, F.E. Local Microstructure and Hardness Variation After Pulsed Laser Micromelting on S7 Tool Steel. J. Micro Nano-Manuf. 2016, 4, 209. [Google Scholar] [CrossRef]
  14. Deng, T.; Li, J.; Zheng, Z. Fundamental aspects and recent developments in metal surface polishing with energy beam irradiation. Int. J. Mach. Tools Manuf. 2020, 148, 103472. [Google Scholar] [CrossRef]
  15. Krishnan, A.; Fang, F. Review on mechanism and process of surface polishing using lasers. Front. Mech. Eng. 2019, 14, 299–319. [Google Scholar] [CrossRef] [Green Version]
  16. Bordatchev, E.V.; Hafiz, A.M.K.; Tutunea-Fatan, O.R. Performance of laser polishing in finishing of metallic surfaces. Int. J. Adv. Manuf. Technol. 2014, 73, 35–52. [Google Scholar] [CrossRef] [Green Version]
  17. Bhaduri, D.; Penchev, P.; Batal, A.; Dimov, S.; Soo, S.L.; Sten, S.; Harrysson, U.; Zhang, Z.; Dong, H. Laser polishing of 3D printed mesoscale components. Appl. Surf. Sci. 2017, 405, 29–46. [Google Scholar] [CrossRef]
  18. Temmler, A.; Liu, D.; Luo, J.; Poprawe, R. Influence of pulse duration and pulse frequency on micro-roughness for laser micro polishing (LµP) of stainless steel AISI 410. Appl. Surf. Sci. 2020, 510, 145272. [Google Scholar] [CrossRef]
  19. Temmler, A.; Ross, I.; Luo, J.; Jacobs, G.; Schleifenbaum, J.H. Influence of global and local process gas shielding on surface topography in laser micro polishing (LμP) of stainless steel 410. Surf. Coat. Technol. 2020, 403, 126401. [Google Scholar] [CrossRef]
  20. Li, X.; Guan, Y. Theoretical fundamentals of short pulse laser–metal interaction: A review. Nanotechnol. Precis. Eng. 2020, 3, 105–125. [Google Scholar] [CrossRef]
  21. Willenborg, E.; Wissenbach, K.; Poprawe, R. Polishing by Laser Radiation. In Proceedings of the 2nd International WLT Conference Lasers in Manufacturing LIM 2003, Munich, Germany, 24–26 June 2003; WLT: Munich, Germany, 2003; pp. 297–300. [Google Scholar]
  22. Perry, T.L.; Werschmoeller, D.; Li, X.; Pfefferkorn, F.E.; Duffie, N.A. The Effect of Laser Pulse Duration and Feed Rate on Pulsed Laser Polishing of Microfabricated Nickel Samples. J. Manuf. Sci. Eng. 2009, 131, 31002. [Google Scholar] [CrossRef]
  23. Temmler, A.; Wei, D.; Schmickler, T.; Küpper, M.E.; Häfner, C.L. Experimental investigation on surface structuring by laser remelting (WaveShape) on Inconel 718 using varying laser beam diameters and scan speeds. Appl. Surf. Sci. 2020, 147814. [Google Scholar] [CrossRef]
  24. Oreshkin, O.; Küpper, M.; Temmler, A.; Willenborg, E. Active reduction of waviness through processing with modulated laser power. J. Laser Appl. 2015, 27, 22004. [Google Scholar] [CrossRef]
  25. Vadali, M.; Ma, C.; Duffie, N.A.; Li, X.; Pfefferkorn, F.E. Pulsed laser micro polishing: Surface prediction model. J. Manuf. Process. 2012, 14, 307–315. [Google Scholar] [CrossRef] [Green Version]
  26. Chow, M.T.C.; Hafiz, A.M.K.; Tutunea-Fatan, O.R.; Knopf, G.K.; Bordatchev, E.V. Experimental Statistical Analysis of Laser Micropolishing Process. In Proceedings of the ISOT 2010 International Symposium on Optomechatronic Technologies, Toronto, ON, Canada, 25–27 October 2010; IEEE: Toronto, ON, Canada, 2010; pp. 1–6. ISBN 9781424476848. [Google Scholar]
  27. Temmler, A.; Liu, D.; Preußner, J.; Oeser, S.; Luo, J.; Poprawe, R.; Schleifenbaum, J.H. Influence of laser polishing on surface roughness and microstructural properties of the remelted surface boundary layer of tool steel H11. Mater. Des. 2020, 192, 108689. [Google Scholar] [CrossRef]
  28. Perry, T.L.; Werschmoeller, D.; Duffie, N.A.; Li, X.; Pfefferkorn, F.E. Examination of Selective Pulsed Laser Micropolishing on Microfabricated Nickel Samples Using Spatial Frequency Analysis. J. Manuf. Sci. Eng. 2009, 131, 21002. [Google Scholar] [CrossRef]
  29. Nüsser, C.; Sändker, H.; Willenborg, E. Pulsed Laser Micro Polishing of Metals using Dual-beam Technology. Phys. Procedia 2013, 41, 346–355. [Google Scholar] [CrossRef]
  30. Perry, T.L. A Numerical and Experimental Study of Pulsed Laser Micro Polishing of Metals at the Meso/Micro Scale. Ph.D. Thesis, University of Wisconsin-Madison, Madison, WI, USA, 2009. [Google Scholar]
  31. Guan, Y.; Zhou, W.; Zheng, H.; Hong, M.; Zhu, Y.; Qi, B. Effect of pulse duration on heat transfer and solidification development in laser-melt magnesium alloy. Appl. Phys. A 2015, 119, 437–442. [Google Scholar] [CrossRef]
  32. Ma, C.P.; Guan, Y.C.; Zhou, W. Laser polishing of additive manufactured Ti alloys. Opt. Lasers Eng. 2017, 93, 171–177. [Google Scholar] [CrossRef]
  33. Maharjan, N.; Zhou, W.; Zhou, Y.; Guan, Y.; Wu, N. Comparative study of laser surface hardening of 50CrMo4 steel using continuous-wave laser and pulsed lasers with ms, ns, ps and fs pulse duration. Surf. Coat. Technol. 2019, 366, 311–320. [Google Scholar] [CrossRef]
  34. Li, Y.-H.; Wang, B.; Ma, C.-P.; Fang, Z.-H.; Chen, L.-F.; Guan, Y.-C.; Yang, S.-F. Material Characterization, Thermal Analysis, and Mechanical Performance of a Laser-Polished Ti Alloy Prepared by Selective Laser Melting. Metals 2019, 9, 112. [Google Scholar] [CrossRef] [Green Version]
  35. Bhaduri, D.; Ghara, T.; Penchev, P.; Paul, S.; Pruncu, C.I.; Dimov, S.; Morgan, D. Pulsed laser polishing of selective laser melted aluminium alloy parts. Appl. Surf. Sci. 2021, 558, 149887. [Google Scholar] [CrossRef]
  36. Liang, C.; Hu, Y.; Liu, N.; Zou, X.; Wang, H.; Zhang, X.; Fu, Y.; Hu, J. Laser Polishing of Ti6Al4V Fabricated by Selective Laser Melting. Metals 2020, 10, 191. [Google Scholar] [CrossRef] [Green Version]
  37. Purushothaman, S.; Ravi Sankar, M. State of the art on atomistic modelling of laser polishing. Mater. Today Proc. 2021, 44, 689–695. [Google Scholar] [CrossRef]
  38. Mai, T.A.; Lim, G.C. Micromelting and its effects on surface topography and properties in laser polishing of stainless steel. J. Laser Appl. 2004, 16, 221–228. [Google Scholar] [CrossRef]
  39. Ukar, E.; Lamikiz, A.; Martínez, S.; Tabernero, I.; Lacalle, L.L.d. Roughness prediction on laser polished surfaces. J. Mater. Process. Technol. 2012, 212, 1305–1313. [Google Scholar] [CrossRef]
  40. Chow, M.; Bordatchev, E.V.; Knopf, G.K. Impact of initial surface parameters on the final quality of laser micro-polished surfaces. In Micromachining and Microfabrication Process Technology XVII; Maher, M.A., Resnick, P.J., Eds.; SPIE: San Francisco, CA, USA, 2012; p. 824809. [Google Scholar]
  41. Ma, C.; Vadali, M.; Li, X.; Duffie, N.A.; Pfefferkorn, F.E. Analytical and Experimental Investigation of Thermocapillary Flow in Pulsed Laser Micropolishing. J. Micro Nano-Manuf. 2014, 2, 21010. [Google Scholar] [CrossRef]
  42. Richter, B.; Chen, S.; Morrow, J.D.; Sridharan, K.; Eriten, M.; Pfefferkorn, F.E. Pulsed laser remelting of A384 aluminum, part II: Modeling of surface homogenization and topographical effects. J. Manuf. Process. 2018, 32, 230–240. [Google Scholar] [CrossRef]
  43. Nüsser, C.; Kumstel, J.; Kiedrowski, T.; Diatlov, A.; Willenborg, E. Process- and Material-Induced Surface Structures During Laser Polishing. Adv. Eng. Mater. 2015, 17, 268–277. [Google Scholar] [CrossRef]
  44. Kaplan, A.F.H. Influence of the beam profile formulation when modeling fiber-guided laser welding. J. Laser Appl. 2011, 23, 42005. [Google Scholar] [CrossRef]
  45. Völl, A.; Vogt, S.; Wester, R.; Stollenwerk, J.; Loosen, P. Application specific intensity distributions for laser materials processing: Tailoring the induced temperature profile. Opt. Laser Technol. 2018, 108, 583–591. [Google Scholar] [CrossRef]
  46. Khare, J.; Kaul, R.; Ganesh, P.; Kumar, H.; Jagdheesh, R.; Nath, A.K. Laser beam shaping for microstructural control during laser surface melting. J. Laser Appl. 2007, 19, 1–7. [Google Scholar] [CrossRef]
  47. Kou, S. Welding Metallurgy; John Wiley & Sons, Inc.: Hoboken, NJ, USA, 2002; ISBN 0471434914. [Google Scholar]
  48. Nüsser, C.; Wehrmann, I.; Willenborg, E. Influence of Intensity Distribution and Pulse Duration on Laser Micro Polishing. Phys. Procedia 2011, 12, 462–471. [Google Scholar] [CrossRef]
  49. Pirch, N.; Linnenbrink, S.; Gasser, A.; Wissenbach, K.; Poprawe, R. Analysis of track formation during laser metal deposition. J. Laser Appl. 2017, 29, 22506. [Google Scholar] [CrossRef]
  50. Willenborg, E. Polieren von Werkzeugstaehlen mit Laserstrahlung. Ph.D. Thesis, RWTH Aachen University, Shaker. Aachen, Germany, 2006. [Google Scholar]
  51. Nüsser, C. Lasermikropolieren von Metallen: Laser Micro Polishing of Metals. Ph.D. Thesis, RWTH Aachen University, First Edition, Apprimus. Aachen, Germany, 2018. [Google Scholar]
  52. Liebing, C. Beeinflussung Funktioneller Oberflächeneigenschaften von Stahlwerkstoffen durch Laserpolieren. Ph.D. Thesis, RWTH Aachen University, Aachen, Germany, 2010. [Google Scholar]
  53. Tolochko, N.K.; Khlopkov, Y.V.; Mozzharov, S.E.; Ignatiev, M.B.; Laoui, T.; Titov, V.I. Absorptance of powder materials suitable for laser sintering. Rapid Prototyp. J. 2000, 6, 155–161. [Google Scholar] [CrossRef]
  54. Boley, C.D.; Mitchell, S.C.; Rubenchik, A.M.; Wu, S.S.Q. Metal powder absorptivity: Modeling and experiment. Appl. Opt. 2016, 55, 6496–6500. [Google Scholar] [CrossRef] [PubMed]
  55. Temmler, A.; Liu, D.; Drinck, S.; Luo, J.; Poprawe, R. Experimental investigation on a new hybrid laser process for surface structuring by vapor pressure on Ti6Al4V. J. Mater. Process. Technol. 2020, 277, 116450. [Google Scholar] [CrossRef]
  56. Spranger, F.; Hilgenberg, K. Dispersion behavior of TiB2 particles in AISI D2 tool steel surfaces during pulsed laser dispersing and their influence on material properties. Appl. Surf. Sci. 2019, 467–468, 493–504. [Google Scholar] [CrossRef]
  57. Weber, R.; Graf, T.; Berger, P.; Onuseit, V.; Wiedenmann, M.; Freitag, C.; Feuer, A. Heat accumulation during pulsed laser materials processing. Opt. Express 2014, 22, 11312–11324. [Google Scholar] [CrossRef] [Green Version]
  58. Weber, R.; Graf, T.; Freitag, C.; Feuer, A.; Kononenko, T.; Konov, V.I. Processing constraints resulting from heat accumulation during pulsed and repetitive laser materials processing. Opt. Express 2017, 25, 3966–3979. [Google Scholar] [CrossRef] [PubMed]
  59. Temmler, A.; Pirch, N. Investigation on the mechanism of surface structure formation during laser remelting with modulated laser power on tool steel H11. Appl. Surf. Sci. 2020, 526, 146393. [Google Scholar] [CrossRef]
  60. Temmler, A.; Pirch, N.; Luo, J.; Schleifenbaum, J.H.; Häfner, C.L. Numerical and experimental investigation on formation of surface structures in laser remelting for additive-manufactured Inconel 718. Surf. Coat. Technol. 2020, 403, 126370. [Google Scholar] [CrossRef]
  61. Pfefferkorn, F.E.; Morrow, J.D. Controlling surface topography using pulsed laser micro structuring. CIRP Ann. 2017, 66, 241–244. [Google Scholar] [CrossRef]
  62. Preußner, J.; Oeser, S.; Pfeiffer, W.; Temmler, A.; Willenborg, E. Microstructure and Residual Stresses of Laser Structured Surfaces. AMR 2014, 996, 568–573. [Google Scholar] [CrossRef] [Green Version]
  63. Preußner, J.; Oeser, S.; Pfeiffer, W.; Temmler, A.; Willenborg, E. Microstructure and residual stresses of laser remelted surfaces of a hot work tool steel. IJMR 2014, 105, 328–336. [Google Scholar] [CrossRef]
  64. Spranger, F.; de Oliveira Lopes, M.; Schirdewahn, S.; Degner, J.; Merklein, M.; Hilgenberg, K. Microstructural evolution and geometrical properties of TiB2 metal matrix composite protrusions on hot work tool steel surfaces manufactured by laser implantation. Int. J. Adv. Manuf. Technol. 2020, 106, 481–501. [Google Scholar] [CrossRef]
Figure 1. (a) Photo of processing chamber and optics box of the POLAR machine, and (b) schematic of the optical set-up and beam path.
Metals 11 01445 g001
Figure 2. Normalized intensity distribution of square laser beams in their focal plane with side lengths of (a) 100 µm (Q100), (b) 200 µm (Q200), and (c) 400 µm (Q400).
Metals 11 01445 g002
Figure 3. (a) Schematic of the process principle of laser micro polishing (LµP), and (b) schematic of a standard scanning pattern for areal laser processing.
Metals 11 01445 g003
Figure 4. (a) WLI image of initial surface roughness; (b) Profile of cross-section along horizontal white dashed line; (c) One-dimensional (1D) Fourier analysis of profile along cross-section; (d) Profile of longitudinal section along vertical white dashed line; (e) One-dimensional (1D) Fourier analysis of longitudinal section.
Metals 11 01445 g004
Figure 5. (a) WLI image of initial micro-roughness; (b) Profile of cross-section along horizontal white dashed line; (c) One-dimensional (1D) Fourier analysis of profile along cross-section; (d) Profile of longitudinal section along vertical white dashed line; (e) One-dimensional (1D) Fourier analysis of longitudinal section.
Metals 11 01445 g005
Figure 6. (a,b) SEM images of manually polished surface in two different magnifications to visualize size and distribution of chromium carbides (dark gray spots).
Metals 11 01445 g006
Figure 7. Micrographs of surfaces after laser micro polishing using tools Q100 (af), Q200 (gl), and Q400 (mr) for laser fluences ranging from 4 to 12 J/cm2.
Metals 11 01445 g007
Figure 8. (ar) WLI images of representative surface topographies as a function of laser beam dimension (Q100, Q200, Q400) and six selected laser fluence used for LµP (4, 6, 7, 8, 9, 10, 12 J/cm2).
Metals 11 01445 g008
Figure 9. (a) WLI image of surface after laser remelting (Q200; F = 4 J/cm2) and (b) SEM images of size and distribution of chromium carbides of initial surface.
Metals 11 01445 g009
Figure 10. (a) Sa spectrum for Q100 and (b) Sa spectrum for Q400 each for fluences ranging from 4 to 12 J/cm2.
Metals 11 01445 g010
Figure 11. (a) Sa spectrum for the lowest surface roughness and laser polishing fluences achieved with each tool Q100, Q200, and Q400; (b) roughness Sa as a function of area rate and spatial wavelength at laser polishing fluence.
Metals 11 01445 g011
Figure 12. (a) WLI image of LµP surface exhibiting the lowest surface roughness (Q400, F = 8 J/cm2); (b) cross-section along the marked line in WLI image and corresponding (c) Fourier analysis; (d) longitudinal section along marked line in WLI image and corresponding (e) Fourier analysis; in direct comparison to a representative (f) cross-section, (h) longitudinal, and their corresponding Fourier analyses (g,i).
Metals 11 01445 g012
Figure 13. (a) Micro-hardness HV0.1 for ten individual measurements, and (b) average micro-hardness HV0.1 of laser polished surfaces for fluences ranging from 5 to 12 J/cm2 (Q400).
Metals 11 01445 g013
Figure 14. Micrographs of (a) initial surface roughness in comparison to (b) laser-polished surface with lowest surface roughness (Q400, F = 8 J/cm2).
Metals 11 01445 g014
Table 1. Tabular overview of laser beam characteristics.
Material/
Element
M2zR [mm]Φ [mmrad]DoF [mm]MN·M
Q1005.903.1650.271.04.504.61
Q2009.314.1555.121.36.896.93
Q40016.410.745.443.48.238.44
Table 2. Tabular overview of chemical composition for AISI D2 (in wt %).
Material/
Element 1
CSiCrMoMnVFe
AISI D21.560.411.860.830.380.84Bal.
Dev.±0.1±0.1±0.45±0.2±0.1±0.1-
1 Based on supplier information.
Table 3. Overview of relevant process parameters and range of investigation.
Process ParameterQ100Q200Q400
Repetition rate frep20 kHz20 kHz20 kHz
Side length of laser beam dL [µm]100200400
Scanning velocity vscan [mm/s]200400800
Spot offset dx [µm]102040
Track offset dy [µm]102040
Fluence F [J/cm2]4–124–124–12
Pulse energy EP [mJ]0.4–1.21.6–4.86.4–19.2
Laser power PL [W]8–2432–96128–384
Area rate [cm2/min]1.24.819.2
Inclination angle β [°]000
Shielding gasAr + O2Ar + O2Ar + O2
Residual oxygen c(O2) [ppm]100010001000
Publisher’s Note: MDPI stays neutral with regard to jurisdictional claims in published maps and institutional affiliations.

