Article

Permeability Measurements of 3D Microstructures Generated by Phase Field Simulation of the Solidification of an Al-Si Alloy during Chill Casting

1
ACCESS e.V, Intzestrasse 5, D-52072 Aachen, Germany
2
Institut of Aerodynamics (AIA), RWTH Aachen University, Wüllnerstrasse 5a, D-52062 Aachen, Germany
3
Institute of Plastics Processing (IKV), RWTH Aachen University, Seffenter Weg 201, D-52064 Aachen, Germany
*
Author to whom correspondence should be addressed.
Metals 2021, 11(12), 1895; https://doi.org/10.3390/met11121895
Submission received: 26 October 2021 / Revised: 17 November 2021 / Accepted: 22 November 2021 / Published: 25 November 2021
(This article belongs to the Special Issue Numerical Simulation of Solidification Processes)

Abstract

:
The permeability of the semi-solid state is important for the compensation of volume shrinkage during solidification, since insufficient melt feeding can cause casting defects such as hot cracks or pores. Direct measurement of permeability during the dynamical evolution of solidification structures is almost impossible, and numerical simulations are the best way to obtain quantitative values. Equiaxed solidification of the Al-Si-Mg alloy A356 was simulated on the microscopic scale using the phase field method. Simulated 3D solidification structures for different stages along the solidification path were digitally processed and scaled up to generate 3D models by additive manufacturing via fused filament fabrication (FFF). The Darcy permeability of these models was determined by measuring the flow rate and the pressure drop using glycerol as a model fluid. The main focus of this work is a comparison of the measured permeability to results from computational fluid flow simulations in the phase field framework. In particular, the effect of the geometrical constraint due to isolated domain walls in a unit cell with a periodic microstructure is discussed. A novel method to minimize this effect is presented. For permeability values varying by more than two orders of magnitude, the largest deviation between measured and simulated permeabilities is less than a factor of two.

1. Introduction

In casting processes, the formation of defects such as shrinkage porosity [1] or hot tears [2,3] depend on melt flow through the mushy zone, and hence on its permeability. Due to the small scale of length of the melt-filled structures, the Reynolds number is typically very low. The Reynolds number describes the ratio of the inertial forces over the viscous forces in a flow, therefore, for a very low Reynolds number the contribution of the inertial term in the Navier–Stokes equations can be considered negligible. Omitting this term leads to the Stokes equations, which, for an incompressible fluid and a steady state solution, take the form:
μ 2 u p + f = 0
u = 0
where u stands for the vector field of the velocity, f for that of external forces, and p for the scalar field of the pressure. The Stokes equations describe creeping flows and, for an incompressible fluid, constitute a linear differential equation system. Since solutions ( u , p ) of the associated homogeneous system can be superimposed linearly, this implies a linear correlation between the averaged pressure gradient p ¯ and the averaged flow velocity u ¯ (the superficial velocity) for a region. This linear correlation is described by Darcy’s law:
u ¯ = K μ p ¯
Here, K is the Darcy permeability, which in the case of anisotropy must be expressed as a tensor. This tensor allows for a homogenized description of the permeability of the mushy zone on a mesoscopic scale.
In this research paper, permeabilities resulting from CFD simulations on different microstructures are compared to measurements performed on scaled models of the same microstructures. In this case, the microstructures were generated by the multi-phase-field simulation [4] of the equiaxed solidification of a hypoeutectic Al-Si alloy during chill casting. For four different selected time steps, the generated phase field data were digitalized and written as an STL file. Scaled models were built from the STL data by additive manufacturing. Permeability measurements were performed on these models.
The results of these measurements are compared with results from CFD simulations on the same unscaled melt-filled dendrite networks.

Related Works

Several approaches have been used to directly measure the Darcy permeability of the mushy zone, e.g., by measuring the flow of eutectic melt in carefully temperature-controlled samples or by removing the melt during solidification and forcing water through the remaining porous microstructure [5,6].
In other approaches, the microstructure at some stage of solidification was preserved, either by quenching, or by removal of melt, then analysed by metallographic methods including serial sectioning [7] and microtomography [8] to generate virtual 2D [9] or 3D [7,8,10] models which were then investigated aided by CFD simulations to determine the permeability.
Microstructures generated, e.g., by phase field simulations, offer the opportunity to take virtual snapshots of the same structure at several stages of the solidification progress with clearly defined regions of solid and liquid. The permeability of such structures was also investigated in CFD simulations [10,11,12].
Takaki et al. [13] performed a succession of phase field and lattice Boltzmann flow large scale simulations in order to predict the permeability of melt flow normal to directionally solidified columnar dendrite structure. Li et al. [14] achieved 3D phase field simulation of the solidification of the hot tear sensitive Al-Cu 4.5% alloy. At selected fraction solids, they extracted 300 2D slices of the predicted equiaxed microstructure in order to reconstruct a 3D model suitable for the subsequent fluid flow analysis and permeability prediction. Recently, Zhang et al. [15] studied the influence of the forced flow on the permeability of dendritic networks by using a combined phase field lattice Boltzmann method. They saw that for columnar dendrite networks, the permeability decreases exponentially to the incoming velocity due to impingement or interlocking of secondary arms; whereas for equiaxed networks, their permeability tensors become more anisotropic with increasing melt velocity, and their networks tend to become columnar. Khajeh and Maijer [16] generated 3D models of microstructures by X-ray microtomography and compared permeabilities resulting from Kozeny–Carman, CFD simulations and flow measurements on scaled models. James et al. [17] compared CFD results with permeability measurements for a structure constructed of layered, slotted plates. Moreover, Bodaghi et al. [18] recently compared three additive manufacturing techniques (fused deposition method, stereolithography (SLA) and multi jet fusion) to produce referenced porous media for permeability measurements and show that the SLA process yields the highest integrity in the printed samples with tolerances well below 2% of nominal thickness.

2. Materials and Methods

2.1. Phase Field Model

The phase field simulation started from a pure melt of Al, 7% Si, 0.3% Mg and 0.1% Cu. The latter chemical element was added to mimic the effect of trace elements in a technical A356 casting alloy. The solidification was simulated at a resolution of 0.5 μm, using the finite difference method implemented in MICRESS [19]. This resolution was chosen to adequately represent features such as narrow channels and tip radii of dendrites, with feature sizes in the range of several micrometers. To represent a statistically homogeneous, isotropic mushy zone in an adequate manner [20], it was desirable to choose a large RVE (representative volume element) that included multiple grains, but processing power and memory size of the available computational hardware limited the feasible RVE dimensions. Since it is statistically unlikely to find grains with the same orientation next to each other in an equiaxially solidified region, then a grain that has another representation of itself as a direct neighbour under periodic boundary conditions should also be avoided. This avoids artificial contributions to the anisotropy of the permeability.
For the aforementioned reasons, an RVE size of 150 × 150 × 150 μm3 was chosen and for primary solidification, six fcc-Al nuclei were placed randomly in the RVE, corresponding to an average grain diameter of 83 μm. The multi-phase-field approach used in MICRESS assigns a phase field to each grain, allowing different anisotropy functions for the solid–liquid interface corresponding to different grain orientations, as well as material properties such as diffusivities and individual concentration fields depending on the physical phase [21]. The aluminium based thermodynamic database from Thermo–Calc [22,23] was linked to account for the thermodynamics of phase transitions.
To represent solidification conditions in the bulk of a part produced by chill casting, periodic boundary conditions together with a superimposed heat extraction rate of 240 W/cm3 were chosen. The temperature evolution was derived from the energy balance, taking into account enthalpy, heat capacity and the heat extraction. In the RVE, a uniform temperature was assumed. Then, the simulation resulted in a cooling rate of 15 K/s during primary solidification, close to cooling curves measured in a chill cast axisymmetric A356 bowl [24].
At a solid fraction of fS = 0.50 eutectic solidification was started by additional solidification of silicon in diamond structure from silicon nuclei, which were allowed to nucleate at 4 K undercooling in the melt or at 10 K undercooling at the interface between melt and the fcc-Al-phase. While the resolution of the simulation was insufficient to fully resolve fine silicon lamellae growing during eutectic solidification due to computational limitations, it was sufficient to simulate the effect of eutectic growth on the solid–liquid interface, and hence the permeability of the microstructure.
The eutectic solidification resulted in a strong recalescence, as shown in Figure 1. This was due to the assumption of a constant heat extraction rate in the simulation. The effect could have been avoided, e.g., by a multiscale approach [25,26], which would better reflect the thermal conditions during this phase of solidification, whereby the increased latent heat released from eutectic solidification in the region adjacent to the RVE would reduce the cooling rate and hence the temperature gradient, which locally would lead to a reduced heat extraction rate.
During solidification, a snapshot of the phase field φ was generated at regular intervals to observe the evolving microstructure and analyse the change of its permeability. Additional details of the simulation scenario and analysis of the permeability are described in [4]. Four of these microstructures were chosen for the additive manufacturing of scaled physical samples for which the permeability was measured experimentally.

2.2. Digital Filtering

Several issues emerge when phase field simulation data are used as direct input for the generation of a physical model for an experimental study, as discussed below. An important advantage when determining the permeability of periodic structures in CFD simulations is the ability to also apply periodic boundary conditions to the flow, so that the RVE can be regarded as embedded in a larger mushy region with similar permeability conditions. The flow across “side” boundaries with a normal perpendicular to the pressure gradient can significantly contribute to the permeability in the direction of the gradient. The periodic boundary conditions of the CFD simulation also allow for a net flow across those “side” boundaries from which off diagonal elements of the permeability tensor can be deduced, so the eigenvalues and -vectors of the complete tensor can be determined. These periodic flow conditions cannot be reproduced in experimental measurements, where these boundaries are blocked by an enclosing container, not permitting any flow across the sides of the RVE. To minimize the effect of such limitations, a filtering process was applied to the microstructure phase field data from which the models were generated:
(1)
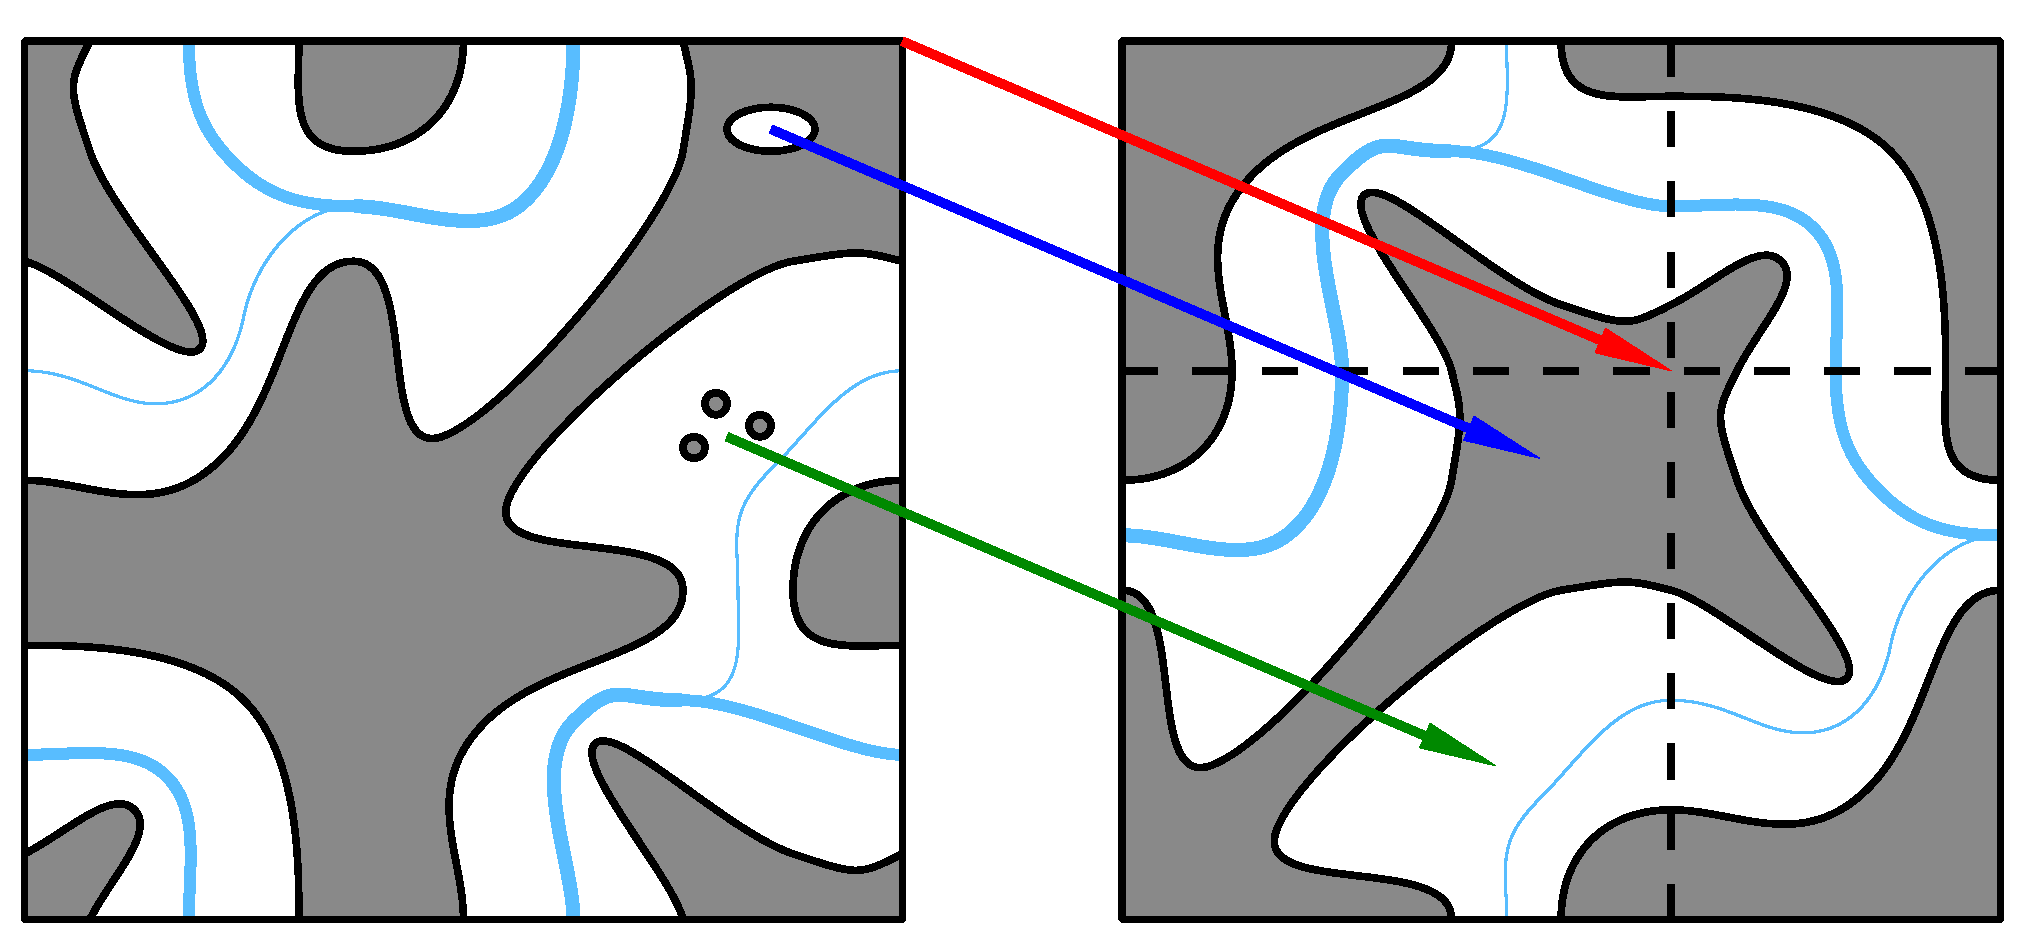
To minimize the effect due to blocked flow at the “sides”, an RVE of the periodic structure was chosen by a translation, such that the flow resulting from CFD simulations was minimal across the RVE boundaries parallel to the pressure gradient. As a criterion, the absolute flow across planes parallel to the boundaries was integrated and new boundary planes chosen, for which this quantity is small;
(2)
A supporting structure was added to keep grains in place. This structure consisted of 1.5 mm wide struts along the edges of the cubic RVE;
(3)
Completely encapsulated liquid, which does not contribute to the permeability, was removed (classified as solid region) to enhance structural stability of the models;
(4)
Isolated solid regions unconnected to the supported structure were removed.
The filtering process is illustrated in Figure 2. The differences between solid fractions due to filtering were small (∆fS < 0.01), figures for fS given below were those of the original structures. From the resulting phase field data, an iso-surface at φ = 0.5 of the phase field variable φ was saved in an STL format. Between the simulation domain of extension 150 × 150 × 150 µm3 and the corresponding thermoplastic sample of 5 cm side length, a scale factor of α = 103/3 was adopted. This scale factor was chosen so that the minimum feature size of the samples was within the resolution of the used additive manufacturing techniques.
Additional Navier–Stokes simulations were performed on the microstructures that resulted from the filtering process, using no slip boundary conditions on boundaries parallel to the pressure gradient and fixed pressure and orthogonal in- and outflow on boundaries perpendicular to the pressure gradient. As for the CFD simulations using periodic boundary conditions, low pressure gradients were applied, resulting in creeping flows with Reynolds numbers R e < 10 5 . For more details concerning the CFD simulations see [4].

2.3. Additive Manufacturing

The prepared samples were manufactured additively via fused filament fabrication (FFF). FFF is an extrusion-based process in which strands of molten thermoplastic material are layer-wise deposited to build up a 3D-part [27].
The layer-wise manufacturing principle of FFF allows for the realization of highly complex structures not otherwise possible to manufacture, as represented by the dendritic grain microstructure [28,29,30]. However, technology-specific limitations must be considered. These include the necessity of support structures during manufacturing and their removal [31]. Support structures are additional geometries separate from the part that provides a base for areas of the part which would otherwise not be supported by previous layers [32]. After the manufacturing process, the support structures are removed. In FFF, support structures are required in areas of the part in which newly deposited beads are not otherwise supported by previous layers. Unsupported strands would otherwise sag, resulting in low geometric part quality or part defects. When manufacturing complex structures, as presented in this work, the mechanical removal of support structures might not be possible due to inaccessibility. However, by using a soluble FFF material for support structures, they can be removed from otherwise inaccessible areas by rinsing in solvent. Based on this assessment, FFF is suitable for the manufacturing of scaled grain microstructure specimens.
For FFF, the X1000 from German RepRap GmbH (Feldkirchen, Germany) was used with a X500 high temperature dual extruder. The dual extrusion set-up enabled the possibility to simultaneously use multiple materials, such as a main material to build up the part in addition to a support material which was required for the complex internal structures. The diameter of the nozzle was 0.4 mm and thus led to a high accuracy and quality of the part. A layer height of 0.2 mm was chosen. For slicing, the Software Simplify3D developed by Simplify3D, Cincinnati, OH, USA, was used. The FFF processing parameters are listed in Table 1. To manufacture the specimens, Polyamide 6 (PA6) was utilized, as it shows good media resistance against a wide range of media, such as glycerol. For the support structures, polyvinyl alcohol (PVA) was used. PVA is water-soluble, therefore the support structures could be removed after manufacturing by soaking and rinsing in water.
During the solidification progress, four equiaxed microstructures, corresponding to fraction solid (fS) varying from 0.61 up to 0.91, were selected, and scaled 3D samples were printed with a side length of 5 × 5 × 5 cm3. Seven polyamide samples (see Figure 3) for 4 equiaxed morphologies were produced by a fused filament deposition process.

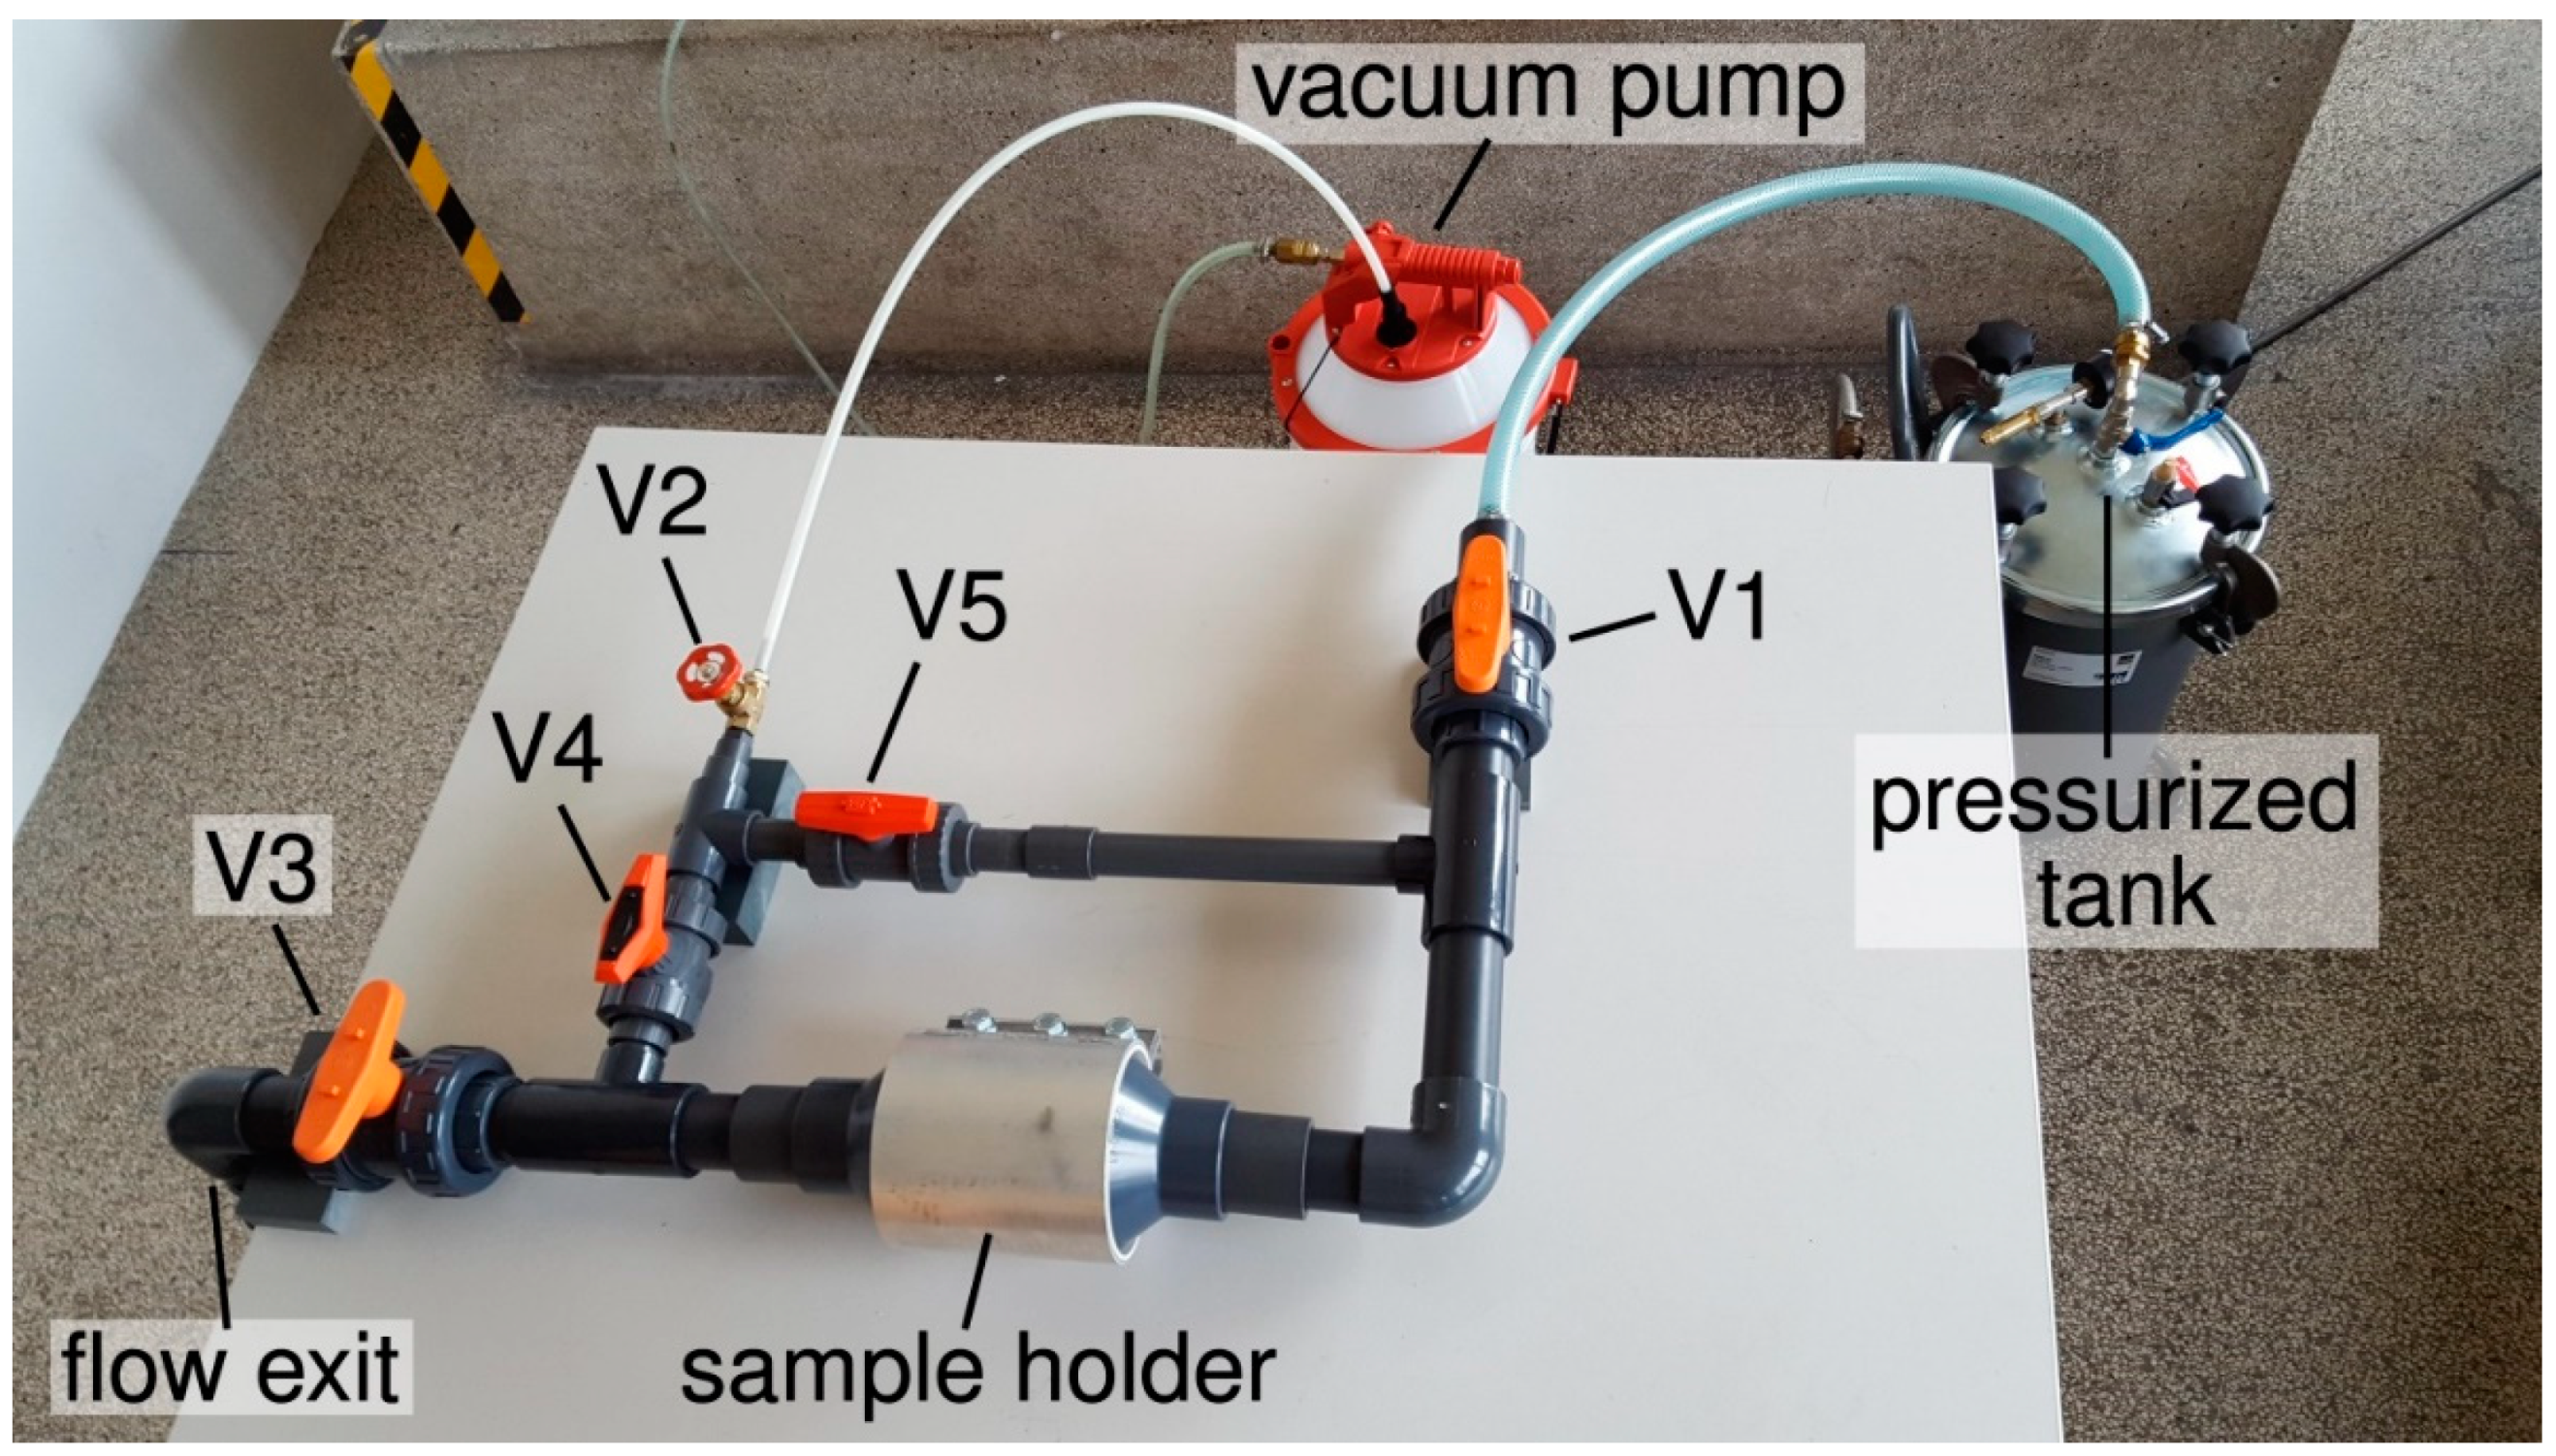
2.4. Permeability Measurements

Measurements of the permeability were performed by using a fluid with similar characteristics to a molten metal. The flow rate and pressure drop through the scaled porous samples Δ p were measured using an experimental set-up that was built according to the set-up described by Khajeh and Maijer [33].
To achieve similarity to the flow conditions occurring in a solidifying alloy (Re < 1), it was necessary to use a liquid with a high viscosity. Therefore, pure glycerol was chosen for these measurements.
According to Darcy’s law [33]:
m / t ρ A = Q A = K μ ( Δ p L )   ,
the permeability K is calculated, where A is the cross-section area of the sample, L is the length of the sample, Q is the volumetric flow rate, ρ is the density of the fluid, and μ is the viscosity of the fluid. Since the fluid properties ρ and μ exhibit temperature dependence, the temperature of the fluid was measured after each test. The properties of glycerol were obtained via interpolation from literature values [34,35].
The experimental set up shown in Figure 4 consisted of a pressurized tank, a vacuum pump, a sample holder, and a pipe configuration with different valves. The 24 L pressurized tank equipped with an external pressure source was used as fluid reservoir. The cube-shaped samples (see Figure 3) were mounted into a sample holder and the measurements were conducted in each axis direction by sequentially reorienting the sample in the holder, while each sample orientation was measured twice. After a vacuum pump was used to evacuate the air from the pores, the fluid was forced through the sample by generating a positive pressure difference of 0.2 bar, which was kept constant during each measurement.
The measurement procedure is described as follows: First, the air was evacuated on both sides of the sample through valve V2 using the connected vacuum pump while the valves V1 and V3 remained closed. In the second step, valve V2 was closed, valve V1 was opened, and the glycerol entered the evacuated pipe system including the sample holder. Then, the valves V4 and V5 were closed. In the last step, valve V3 was opened and the glycerol flowed through the flow exit into a measuring vessel. After steady-flow conditions were reached, the mass m of the glycerol pushed through the sample was measured over a period of time t .
Using the Reynolds number:
R e = ρ K Q μ A   ,
the validity of the flow conditions (Re < 1) was finally calculated. In all experiments, the Reynolds number varied between 0.001 and 0.008.

3. Results

Since the permeability scales proportional to the square of the feature size, the measured results were multiplied by a factor of α−2, to represent the permeability of the original microstructures.
As shown in Figure 5, on a logarithmic scale, a good correlation between experimental and calculated permeabilities was obtained, nevertheless, the periodic boundary of the model cannot be imposed in the experimental set-up, and slightly smaller permeabilities were expected.
Table 2 shows the results for permeabilities resulting from CFD simulations for the original structures with periodic boundary conditions (abbreviated as ‘p’ in the table) discussed in more detail in [4], for the filtered structures with no slip boundary conditions (abbreviated as ‘ns’), and from two measurements performed on the additively manufactured structures.
The inset in Figure 5 shows the relative differences between the permeabilities resulting from the two different CFD simulations and from two measurements performed for each structure. For the periodic simulations, the diagonal terms of the permeability tensor aligned to the X-, Y- and Z-coordinates were used in this comparison. The average permeability resulting from measurements was compared with that resulting from CFD simulations with no slip boundary conditions.

4. Discussion

Due to the limited size of the RVE, an anisotropy of the permeability was observed in the CFD simulations as well as in the measurements. In CFD simulations with periodic boundary conditions, this anisotropy showed up as different eigenvalues, in simulations with no slip boundary conditions and in measurements as different permeabilities in X-, Y- and Z-directions. Measurement and simulation both showed a higher permeability in the Y-direction for the microstructure samples. As can be seen, in most cases the differences between the two CFD simulations were less than 10%. The differences between the two measurements of the same permeability were also below 10% in most cases, while the differences between measured and computed permeabilities spanned a much wider range.
Possible sources for the observed differences between measured permeabilities and those derived from CFD simulations can be separated into three categories:
  • Inaccurate CFD simulations;
  • Structural differences between the physical models and the geometries used in CFD-simulations;
  • Errors in the measurement process.

4.1. Accuracy of CFD Simulations

In tests using structures with known permeabilities the deviations between reference value and calculated permeability were found to be below 2% for the software used in the CFD simulations. To estimate if convergence to a steady state was reached, the change in magnitude of the superficial velocity during the final 1/10th of simulation time was observed and found to be below 2.4% in all cases. The filtering process did not affect the difference between measured and simulated permeability, since the permeabilities of structures after filtering were compared with the measured permeabilities.

4.2. Accuracy of Physical Models

The layer height in the FFF process of 0.2 mm was an order of magnitude smaller than structural length scales such as channel diameters, therefore the accuracy of the process was considered to be sufficiently accurate. Other possible sources of structural differences between digital and physical models may have resulted from deformations of the model that could have occurred, e.g., during the removal of support structures, but also during the measurement process, when the structure was subjected to a force of Δ p A = 50   N . Other structural differences could have resulted from obstacles such as loose filament strands becoming lodged in narrow channels.
Structural differences due to elastoplastic deformation and obstacles lodged in narrow channels could explain the observed larger deviations between measured and computed permeabilities. Unless obstacles become stuck or unstuck during or between measurements, such deviations would also be consistent for multiple measurements under very similar conditions.

4.3. Accuracy of Measurements

The comparison of multiple measurements gave an estimate of statistical errors of the permeability measurements. A systematic error may have resulted from the pressure drop in the pipes connecting the sample holder to the pressurized tank and the flow exit. Since the diameter of the pipes was about an order of magnitude larger than the diameter of channels in the measured structure, and the pressure drop for flow through a pipe of length l and diameter d is Δ p ~ l / d 4 according to the Hagen–Poiseuille equation, this error could be estimated to be about two to three orders of magnitude smaller than the measured pressure drop, even when the length of the pipes is taken into account.

5. Conclusions

The Darcy permeability of microstructures resulting from a phase field simulation of a solidifying A356 alloy was determined by CFD simulations and by measurements of glycerol passing through scaled models of the microstructure. To the authors’ knowledge this is the first work investigating permeability measurements of scaled models of periodic structures resulting from phase field simulations.
A novel filtering method was developed for the microstructures to minimize the effect of known limitations of the physical measurement of the permeability of periodic structures. CFD simulations with the filtered structures, and no slip boundary conditions better reproducing the measurement, showed the differences introduced by the filtering method to be below 10% in most cases. Differences between two measurements of the same permeability fell in the same range.
The comparison between the measurement of the permeability of the 3D-printed samples and the simulations showed a wider range of differences, but was still in good agreement, considering that the permeability varied over several orders of magnitude during the solidification.
The agreement was improved when the experimental data were compared to CFD simulations performed on the filtered structures with boundary conditions more closely matching the experimental conditions, although neither the digital filtering process, nor statistical measurement errors could completely explain the observed deviations between simulated and measured permeabilities.

Outlook

In this work periodic structures were used to represent semi-solid regions that are statistically homogeneous over larger scales. In future research, the impact of gradients in microstructure features such as length scales might be investigated. Such structures can result from different cooling conditions in nearby regions of a cast part.

Author Contributions

Conceptualization, R.B., G.L., M.A., W.J. and J.W.; methodology, R.B., M.A., W.J. and J.A.; software, R.B.; validation, R.B., M.A. and W.J.; formal analysis, R.B. and W.J.; investigation, W.J., J.W. and J.A.; data curation, R.B., W.J. and J.A.; writing—original draft preparation, R.B., G.L., W.J. and J.W.; writing—review and editing, R.B., M.A., G.L., W.J., W.S., J.W., J.A. and C.H.; visualization, R.B. and W.J.; supervision, M.A., W.J. and J.W.; project administration, M.A., W.S. and J.W.; funding acquisition, M.A., W.S., J.W. and C.H. All authors have read and agreed to the published version of the manuscript.

Funding

This research was funded by the German Research Foundation (DFG) in the framework of the Collaborative Research Center SFB-1120–236616214 Precision Melt Engineering.

Institutional Review Board Statement

Not applicable.

Informed Consent Statement

Not applicable.

Conflicts of Interest

The authors declare no conflict of interest. The funders had no role in the design of the study; in the collection, analyses, or interpretation of data; in the writing of the manuscript, or in the decision to publish the results.

References

  1. Dantzig, J.A.; Rappaz, M. Solidification; EPFL Press: Lausanne, Switzerland, 2009. [Google Scholar]
  2. Rappaz, M.; Drezet, J.-M.; Gremaud, M. A new hot-tearing criterion. Metall. Mater. Trans. A 1999, 30, 449–455. [Google Scholar] [CrossRef]
  3. Böttger, B.; Apel, M.; Santillana, B.; Eskin, D.G. Relationship Between Solidification Microstructure and Hot Cracking Susceptibility for Continuous Casting of Low-Carbon and High-Strength Low-Alloyed Steels: A Phase-Field Study. Metall. Mater. Trans. A 2013, 44, 3765–3777. [Google Scholar] [CrossRef]
  4. Berger, R.; Apel, M.; Laschet, G. An analysis of the melt flow permeability for evolving hypoeutectic Al-Si mushy zone microstructures by phase field simulations. Materialia 2021, 15, 100966. [Google Scholar] [CrossRef]
  5. Khajeh, E.; Mirbagheri, S.M.H.; Davami, P. Modeling of permeability with the aid of 3D interdendritic flow simulation for equiaxed dendritic structures. Mater. Sci. Eng. A 2008, 475, 355–364. [Google Scholar] [CrossRef]
  6. Mirbagheri, S.M.H.; Khajeh, E. Modelling and simulation of equiaxed dendritic structures permeability for Pb–Sn alloys. Mater. Sci. Technol. 2008, 24, 1444–1451. [Google Scholar] [CrossRef]
  7. Madison, J.; Spowart, J.E.; Rowenhorst, D.J.; Aagesen, L.K.; Thornton, K.; Pollock, T.M. Fluid flow and defect formation in the three-dimensional dendritic structure of nickel-based single crystals. Metall. Mater. Trans. A Phys. Metall. Mater. Sci. 2012, 43, 369–380. [Google Scholar] [CrossRef] [Green Version]
  8. Khajeh, E.; Maijer, D.M. Numerical determination of permeability of Al-Cu alloys using 3D geometry from X-ray microtomography. Mater. Sci. Technol. 2010, 26, 1469–1476. [Google Scholar] [CrossRef]
  9. Bhat, M.S.; Poirier, D.R.; Heinrich, J.C. Permeability for cross flow through columnar-dendritic alloys. Metall. Mater. Trans. B 1995, 26, 1049–1056. [Google Scholar] [CrossRef]
  10. Ludwig, A.; Kharicha, A.; Hölzl, C.; Domitner, J.; Wu, M.; Pusztai, T. 3D Lattice Boltzmann flow simulations through dendritic mushy zones. Eng. Anal. Bound. Elem. 2014, 45, 29–35. [Google Scholar] [CrossRef]
  11. Böttger, B.; Haberstroh, C.; Giesselmann, N. Cross-Permeability of the Semisolid Region in Directional Solidification: A Combined Phase-Field and Lattice-Boltzmann Simulation Approach. JOM 2016, 68, 27–36. [Google Scholar] [CrossRef]
  12. Mitsuyama, Y.; Takaki, T.; Sakane, S.; Shibuta, Y.; Ohno, M. Permeability tensor for columnar dendritic structures: Phase-field and lattice Boltzmann study. Acta Mater. 2020, 188, 282–287. [Google Scholar] [CrossRef]
  13. Takaki, T.; Sakane, S.; Ohno, M.; Shibuta, Y.; Aoki, T. Permeability prediction for flow normal to columnar solidification structures by large–scale simulations of phase–field and lattice Boltzmann methods. Acta Mater. 2019, 164, 237–249. [Google Scholar] [CrossRef]
  14. Li, L.; Zhang, R.; Hu, S.; Zhang, D.; Yang, S.; Wang, C.; Jiang, H. Prediction of mushy zone permeability of Al–4.5 wt% Cu alloy during solidification by phase field model and CFD simulation. China Foundry 2019, 16, 313–318. [Google Scholar] [CrossRef] [Green Version]
  15. Zhang, X.; Kang, J.; Guo, Z.; Han, Q. Effect of the forced flow on the permeability of dendritic networks: A study using phase-field-lattice Boltzmann method. Int. J. Heat Mass Transf. 2019, 131, 196–205. [Google Scholar] [CrossRef]
  16. Khajeh, E.; Maijer, D.M. Permeability evolution during equiaxed dendritic solidification of Al–4.5 wt%Cu. Model. Simul. Mater. Sci. Eng. 2012, 20, 035004. [Google Scholar] [CrossRef]
  17. James, J.D.; Brown, S.G.R.; Spittle, J.A.; Lavery, N.P. Experimental apparatus for validation of computer models of the permeability of metallic alloys in the mushy zone. In Proceedings of the Modeling of Casting, Welding and Advanced Solidification Processes—XI, Opio, France, 28 May–2 June 2006; pp. 1189–1196. [Google Scholar]
  18. Bodaghi, M.; Ban, D.; Mobin, M.; Park, C.H.; Lomov, S.V.; Nikzad, M. Additively manufactured three dimensional reference porous media for the calibration of permeability measurement set-ups. Compos. Part A Appl. Sci. Manuf. 2020, 139, 106119. [Google Scholar] [CrossRef]
  19. MICRESS®, the Microstructure Evolution Simulation Software. Available online: www.micress.de (accessed on 1 August 2017).
  20. Torquato, S. Random Heterogeneous Materials; Interdisciplinary Applied Mathematics; Springer: New York, NY, USA, 2002; Volume 16. [Google Scholar]
  21. Eiken, J. A Phase-Field Model for Technical Alloy Solidification; Shaker Verlag: Herzogenrath, Germany, 2009. [Google Scholar]
  22. Aluminium-Based Alloys Databases. Available online: https://thermocalc.com/products/databases/aluminum-based-alloys/ (accessed on 23 November 2021).
  23. Thermocalc Software. Available online: www.thermocalc.com (accessed on 1 August 2017).
  24. Laschet, G.; Vossel, T.; Wolff, N.; Apel, M.; Bührig-Polaczek, A. Multiscale Solidification Simulation of an Axisymmetric A356 Component in Die Casting. In Proceedings of the 6th Decennial International Conference on Solidification Processing, Old Windsor, UK, 25–28 July 2017; pp. 576–580. [Google Scholar]
  25. Böttger, B.; Eiken, J.; Apel, M. Phase-field simulation of microstructure formation in technical castings—A self-consistent homoenthalpic approach to the micro–macro problem. J. Comput. Phys. 2009, 228, 6784–6795. [Google Scholar] [CrossRef]
  26. Zhou, B.; Laschet, G.; Eiken, J.; Behnken, H.; Apel, M. Multiscale solidification simulation of Sr-modified Al-Si-Mg alloy in die casting. IOP Conf. Ser. Mater. Sci. Eng. 2020, 861, 012034. [Google Scholar] [CrossRef]
  27. Osswald, T.A. Understanding Polymer Processing: Processes and Governing Equations, 2nd ed.; Carl Hanser Verlag GmbH & Co. KG: München, Germany, 2017. [Google Scholar]
  28. Dizon, J.R.C.; Espera, A.H.; Chen, Q.; Advincula, R.C. Mechanical characterization of 3D-printed polymers. Addit. Manuf. 2018, 20, 44–67. [Google Scholar] [CrossRef]
  29. Dey, A.; Yodo, N. A Systematic Survey of FDM Process Parameter Optimization and Their Influence on Part Characteristics. J. Manuf. Mater. Process. 2019, 3, 64. [Google Scholar] [CrossRef] [Green Version]
  30. Oliveira, J.P.; LaLonde, A.D.; Ma, J. Processing parameters in laser powder bed fusion metal additive manufacturing. Mater. Des. 2020, 193, 108762. [Google Scholar] [CrossRef]
  31. Gebhardt, A.; Kessler, J.; Thurn, L. 3D Printing: Understanding Additive Manufacturing; Carl Hanser Verlag GmbH & Co. KG: München, Germany, 2018. [Google Scholar]
  32. DIN EN ISO/ASTM 52900: Additive Fertigung—Grundlagen—Terminologie; Beuth Verlag GmbH: Berlin, Germany, 2018.
  33. Khajeh, E.; Maijer, D.M. Physical and numerical characterization of the near-eutectic permeability of aluminum–copper alloys. Acta Mater. 2010, 58, 6334–6344. [Google Scholar] [CrossRef]
  34. Bosart, L.W.; Snoddy, A.O. New Glycerol Tables. Ind. Eng. Chem. 1927, 19, 506–510. [Google Scholar] [CrossRef]
  35. Segur, J.B.; Oberstar, H.E. Viscosity of Glycerol and Its Aqueous Solutions. Ind. Eng. Chem. 1951, 43, 2117–2120. [Google Scholar] [CrossRef]
Figure 1. Temperature and solid fraction over time during solidification.
Metals 11 01895 g001
Figure 2. Illustration of the filtering process. Red arrow: a unit cell of the periodic structure is chosen so that obstruction of fluid flow (light blue for a horizontal gradient) at side boundaries is minimized. Blue arrow: enclosed liquid is removed. Green arrow: Small solid particles are removed.
Metals 11 01895 g002
Figure 3. Microstructure geometry with an RVE edge length of 150 μm before (a) and after (b) filtering, and scaled, additively manufactured microstructure sample (c) with an edge length of 5 cm. The structure has a solid fraction fS = 68.1%. The transparent planes in (a) indicate the new boundaries chosen for the filtering process.
Metals 11 01895 g003
Figure 4. Experimental set-up of the permeability measurements. The scaled sample is installed in different orientations in the sample holder.
Metals 11 01895 g004
Figure 5. Comparison of predicted and simulated permeabilities of equiaxed dendritic microstructures at selected fraction solids. Inset: bar plot of relative differences between permeability results (first cited is the reference for relative deviation).
Metals 11 01895 g005
Table 1. FFF process parameters for specimen manufacturing.
SettingPA6PVA
Nozzle temperature [°C]260220
Build plate temperature [°C]80
Nozzle diameter [mm]0.40.4
Layer height [mm]0.2
Extrusion width [mm]0.5
Printing speed [mm/s]30
Infill density [%]100n/a
Table 2. Permeability results [m2].
SamplefS [%]Permeability Measured, ScaledBCPermeability CFD
KXKYKZ KXKYKZ
0561.47.04 × 10−131.09 × 10−129.83 × 10⁻¹³ns1.23 × 10−121.39 × 10−121.18 × 10⁻¹²
7.16 × 10−131.11 × 10−129.23 × 10⁻¹³p1.28 × 10−121.44 × 10−121.27 × 10⁻¹²
0768.17.13 × 10−137.31 × 10−137.27 × 10⁻¹³ns5.67 × 10−137.12 × 10−135.99 × 10⁻¹³
8.92 × 10−137.59 × 10−136.26 × 10⁻¹³p6.11 × 10−137.28 × 10−135.86 × 10⁻¹³
0976.88.38 × 10−141.32 × 10−139.97 × 10⁻¹⁴ns1.16 × 10−131.60 × 10−131.52 × 10⁻¹³
8.06 × 10−141.58 × 10−131.03 × 10⁻¹³p1.30 × 10−131.56 × 10−131.16 × 10⁻¹³
1390.76.35 × 10−157.14 × 10−157.12 × 10⁻¹⁵ns6.46 × 10−156.71 × 10−154.71 × 10⁻¹⁵
6.37 × 10−157.18 × 10−157.67 × 10⁻¹⁵p4.37 × 10−156.00 × 10−154.56 × 10⁻¹⁵
Publisher’s Note: MDPI stays neutral with regard to jurisdictional claims in published maps and institutional affiliations.

