2. Analytical Model
In this model, taking into account the Brody–Flemings model and the modified model suggested by Voller and Beckermann, the governing equations of the model were obtained as follows [
12,
13]:
where
is the concentration of solute element
i in liquid phase (wt. %),
is the initial concentration of solute element
i in liquid phase (wt. %),
is the equilibrium partition coefficient of solute element
i,
is the solid fraction,
is the back-diffusion parameter,
is the modified value of
,
is the diffusion coefficient of solute element
i in solid phase (cm
2/s),
is the local solidification time (s),
is the liquidus temperature (°C),
is the solidus temperature (°C),
is the cooling rate (°C/s), and
is the length scale of the micro-segregation domain (µm).
In the present study, the length scale was the final primary dendrite arm spacing
, which was calculated as a function of cooling rate
and nominal steel carbon content (wt. %) from the following equation [
14]:
The liquidus and solidus temperatures depend on steel composition as follows [
15]:
where
Tpure is the fusion temperature of pure iron (1536 °C), and
mi and
ni denote the slopes of the liquidus and solidus line of each solute element in the pseudo-binary Fe-phase diagram, respectively.
The solid/liquid interface temperature
Tint is obtained by summing the contributions of all alloying elements.
where
CL,i is the interface element concentration in the liquid, corresponding to a given solid/liquid interface. When fs = 1.0,
Tint is just the solidus temperature.
Two solid phases, the δ-ferrite phase and the γ-austenite phase, occur naturally during the solidification of steel [
16]. For carbon contents lower than 0.53%, when the liquid steel cools down slightly below the liquidus temperature, the solid nucleates and grows as the δ phase until solidification is complete at the low carbon content; however, for the intermediate carbon steel, once the carbon content exceeds 0.53% in the residual liquid, the solid γ phase starts to form around the periphery of the δ-phase dendrites until the completed solidification. For carbon contents over 0.53%, the solid nucleates from the melt as the γ phase, which grows until the end of solidification. The enrichment of solute elements in the interdendritic region during solidification causes a switch from δ-phase to γ-phase solidification once the carbon concentration exceeds 0.53%. This change suddenly lowers the diffusion rates, which increases micro-segregation and further lowers the solidus temperature. This behavior has an important effect on the metal properties that control micro-segregation, because of the very different solidification parameters in the two crystal phases (as shown in
Table 1 [
15]).
In order to incorporate the δ/γ transformation into the present model, it is assumed that only the carbon concentration controls this transition and other components do not influence the transition. The solid fraction at which the transition occurs can be calculated by using Equation (1) [
17].
where the ferritic data should be employed for
and
. For getting the segregation distribution corresponding to any solid fraction higher than
, a virtual zero concentration must be obtained. This could lead to the same concentration in residual liquid at the transition point by using Equation (1) and the solidification parameters of the austenitic phase. The corresponding calculation equation is expressed as follows:
where the austenitic data should be employed for
and
.
In order to obtain the accurate liquidus and solidus temperatures, firstly, an estimate of the local solidification time is done by evaluating the equilibrium liquidus temperature and solidus temperature from Equations (8) and (10), respectively. From this initial guess, the value of is improved with a few iterative steps through Equations (1)–(3) and (10) with , until consistent values are obtained for , , and .
If carbon content is less than 0.53% and , then δ-phase properties are used in the previous procedure. If carbon content is greater than 0.53% and , then γ-phase properties are used throughout. If none of these conditions are met, then both phases may exist; thus, the procedure is repeated firstly for the δ phase. Once the carbon concentration of the residual liquid exceeds 0.53%, the virtual zero concentration is obtained, and the following γ-phase properties are adopted until completed solidification of the residual liquid.
After finding , the previous procedure should be repeated to find corresponding to any other desired value without the need for further iteration. In practice, it is often desirable to find the relationship between the entire solid fraction and the temperature. Thus, it can be convenient to solve the above equations by incrementing the solid fraction in steps of 0.01.
4. Analysis of Solute Segregation on the Central Cracking
The etching print of the bloom transverse section with typical central cracks is shown in
Figure 2a. According to the statistical data from the etched prints of massive blooms, it is found that the central cracks all appear at the inner arc side, the distance between the opening point of the crack and the inner radius of the surface mainly concentrates in the scope of 90–105 mm, and the width of the cracks mainly occurs in the range of 0.5–2 mm.
After the typical central crack samples are mechanically ground, polished, and etched using picric acid, they are visualized using a video camera to observe the relationship between the crack and the columnar or equiaxed crystal. As shown in
Figure 2b,c, the columnar crystal of crack samples is developed such that the length of the primary dendrite arm spacing reaches approximately 1000 μm. In addition, the central cracks all occur in the gap between two adjacent primary dendrites at the end of the columnar crystal zone, thus exhibiting typical cracking along the gap between the columnar crystals. Chemical compositions of the crack sample (
Table 3) were detected using XRF (sequential X-ray fluorescence spectrometer, ZSXPrimus IV).
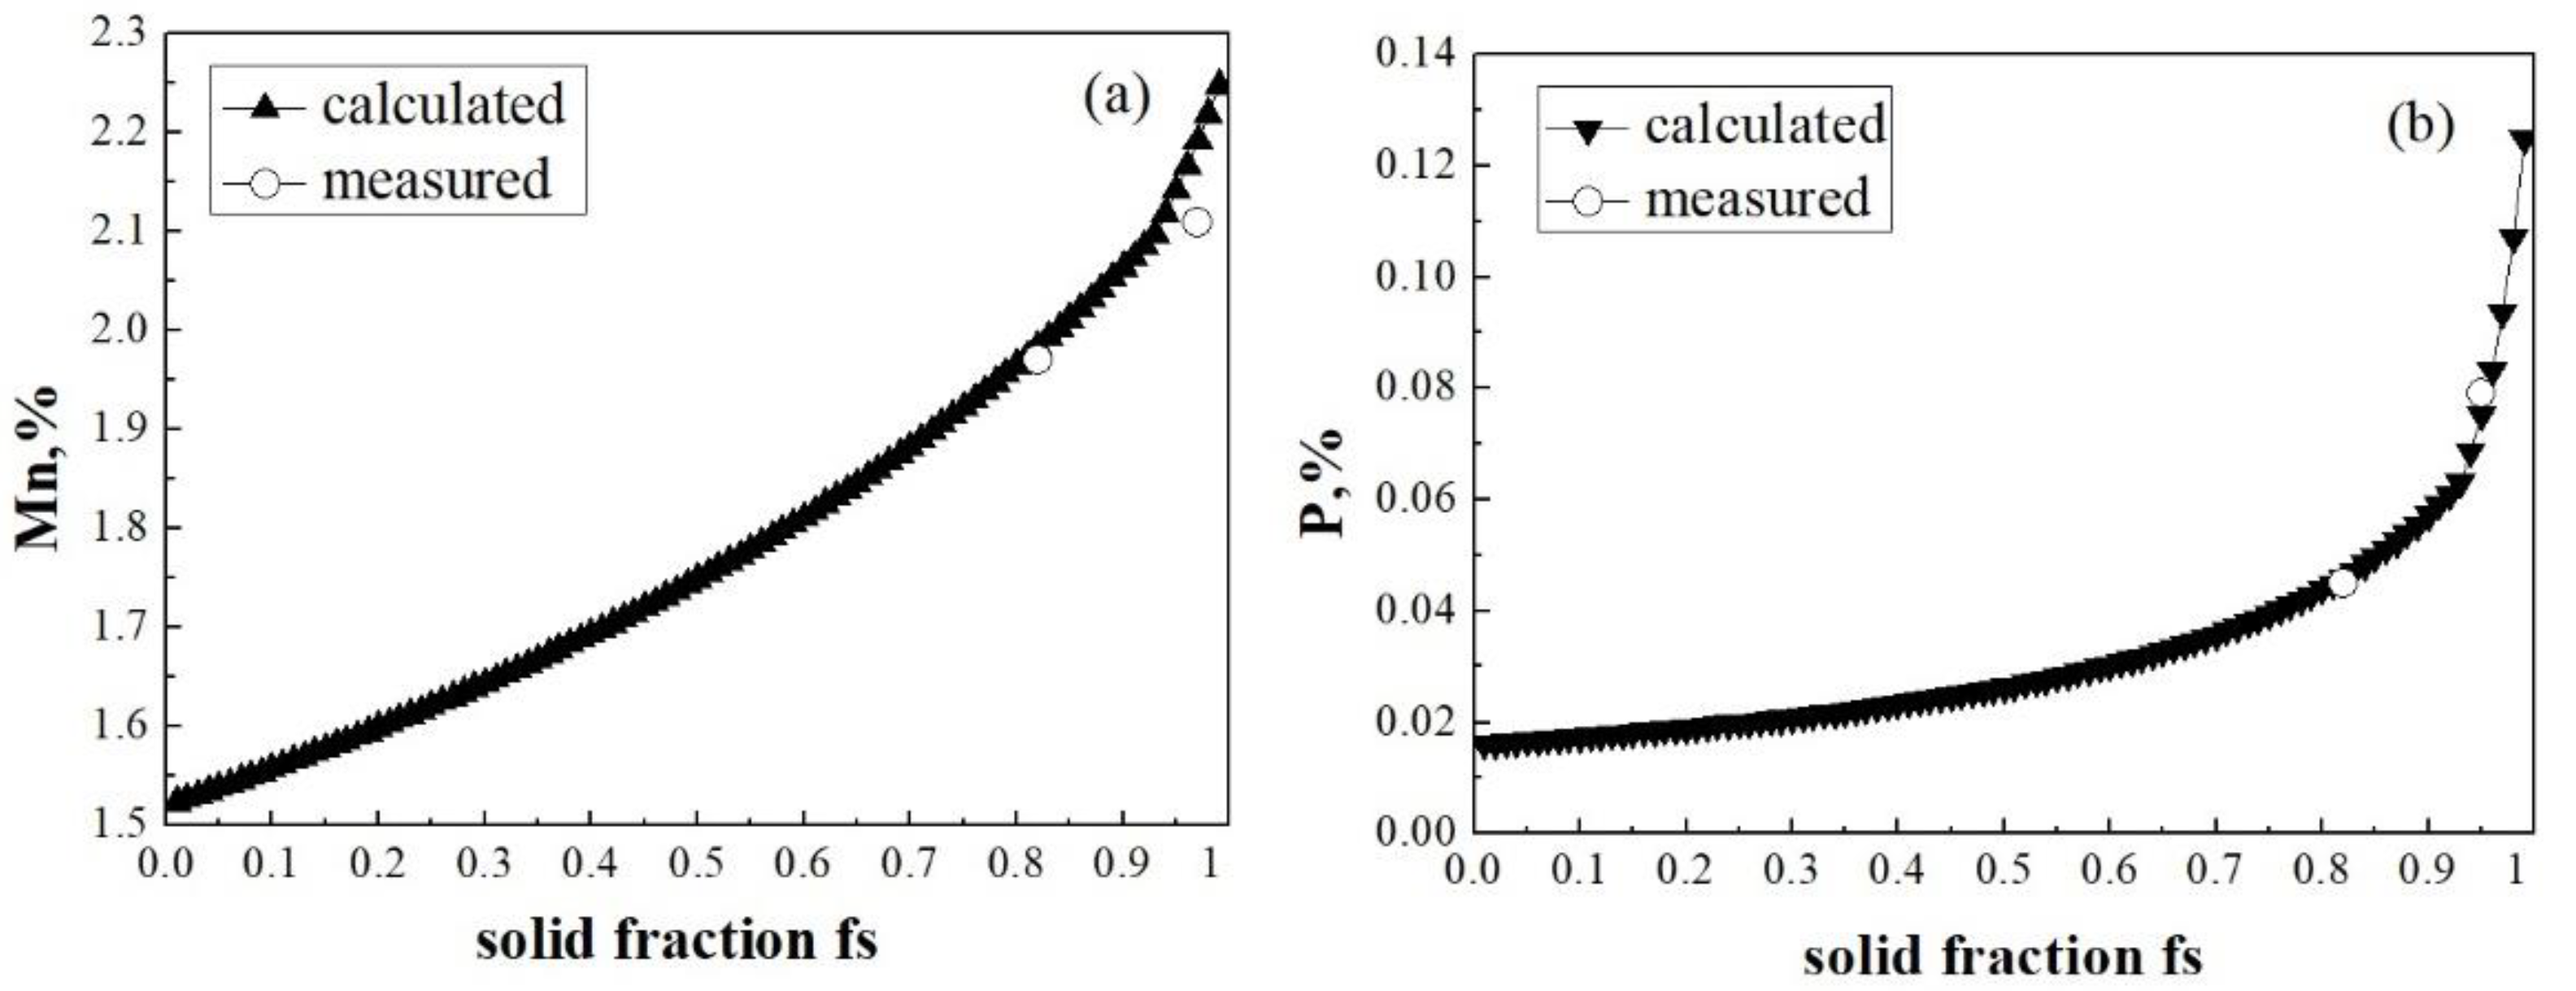
As described in
Figure 3, with the increasing solid fraction, the segregation of both carbon and manganese is quite slight, whereby they only have a little enhancement at the final stages of solidification. However, for phosphorus and sulfur, their segregation is very severe, especially at the final stages of solidification, whereby the maximum index values reach 16.6 and 33.3, respectively. The segregation distributions of elements near the crack are shown in
Figure 4 using the line scanning of SEM (field-emission scanning electron microscopy, Apreo S HiVac). Here, it is clear that the fluctuation peaks of carbon, phosphorus, sulfur, and manganese all appear at the cracking gap, which means that all of these four elements have a certain amount of enrichment at the cracking gap, basically coinciding with the results calculated using the segregation model.
Subsequently, the crack samples were ground, polished, and etched using a nitric acid alcohol solution in which the alcohol occupied 4 wt.%. Then, they were placed in an optical microscope to observe the structure. It can be seen from
Figure 5 that the cracking and extending directions of the crack were always along the grain boundaries, thus exhibiting a typical fracture mode along the grain boundaries.
According to the investigation of previous researchers [
19,
20], central cracks generally form in the temperature range from the LIT to the ZDT under high temperature, and the solute segregation has a significant influence on this temperature range. However, the difference between the LIT and the ZDT is 69.1 °C when segregation of the elements is considered, but it is only 7.9 °C without segregation. Therefore, solute segregation facilitates an enhanced increase in cracking. From the previous line scanning analysis, it can be seen that carbon, phosphorus, sulfur, and manganese all have a certain amount of enrichment at the cracking gap, while the segregations of phosphorus and sulfur are especially serious at the final stages of solidification. Hence, the element segregation leads to an obvious increase in the temperature range of crack formation; thus, the conclusion can be obtained that the solute segregation is the internal reason for crack formation.
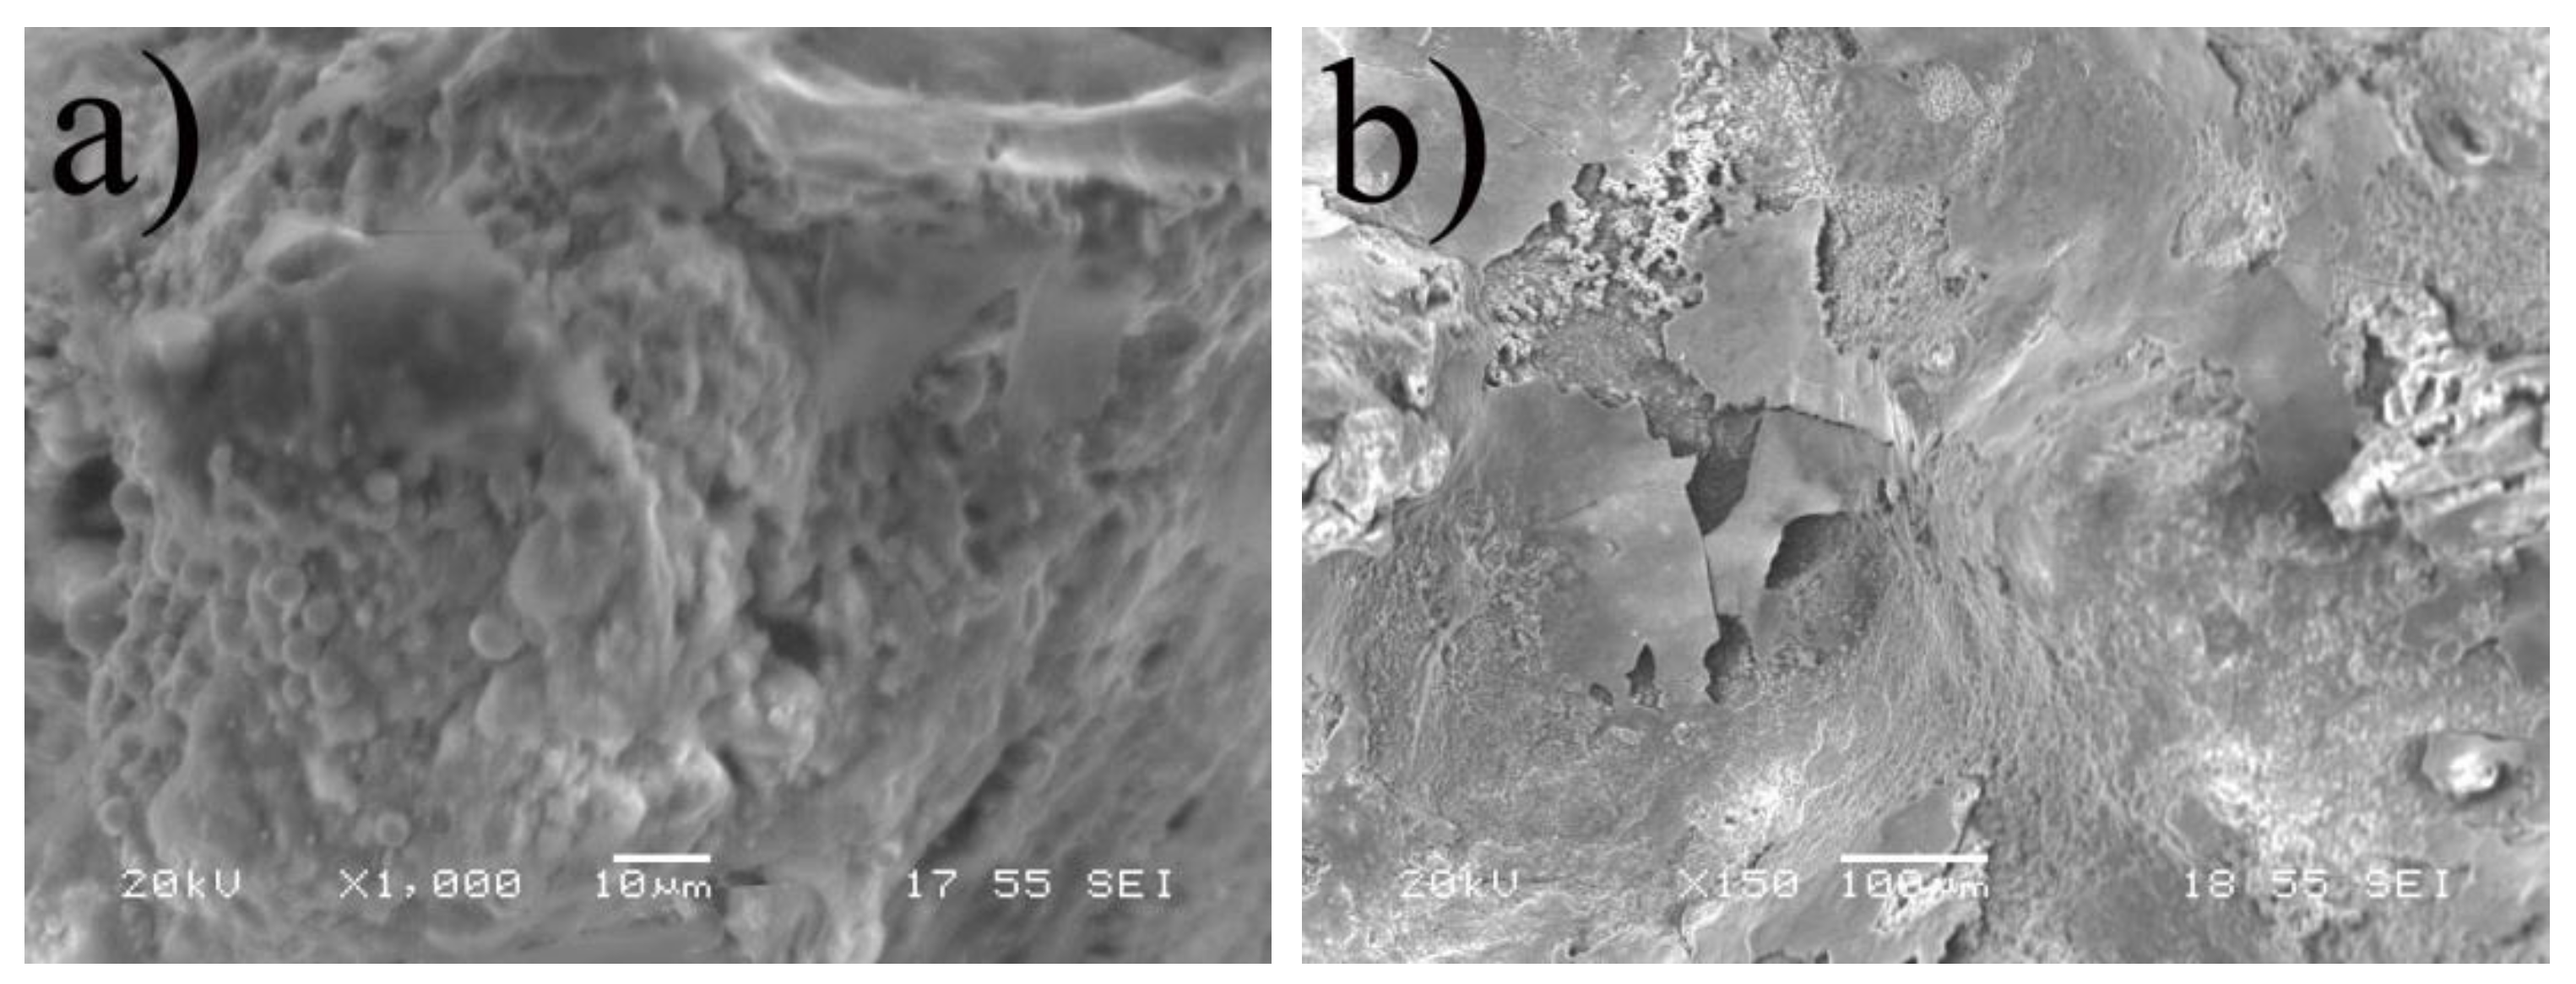
The fracture morphologies of the cracks are of great help to find the formation temperature of cracks. As shown in
Figure 6, it is clear that the fracture surfaces of the cracks are so smooth that there are no dimples to be found, which is very similar to the fracture surface which forms in the mushy zone. This indicates that the temperature range of crack formation should be at the mushy zone, denoting steel cracking with a low melting point.
In order to analyze the mechanism of crack formation, the following assumption is considered: the position with the shortest distance from the inner radius is just the opening point. Depending on the statistical data from the etched prints of massive blooms, when the bloom begins to crack, the solid shell thickness is within the scope of 90–105 mm. At this time, the thickness of 95 mm is selected when the distance from the meniscus is about 13.5 m. Then, the strain of the solid shell is simulated by using finite element software (MSC Marc), where the factors included heat transfer, phase transformation, and metallurgical pressure. The thermo-elastic–plastic constitutive equation is as follows:
where
is the elastic strain,
is the inelastic strain, and
is the thermal strain. In the analysis, the von Mises yield criterion is used to describe the thermo-elastic–plastic property.
As can be seen in
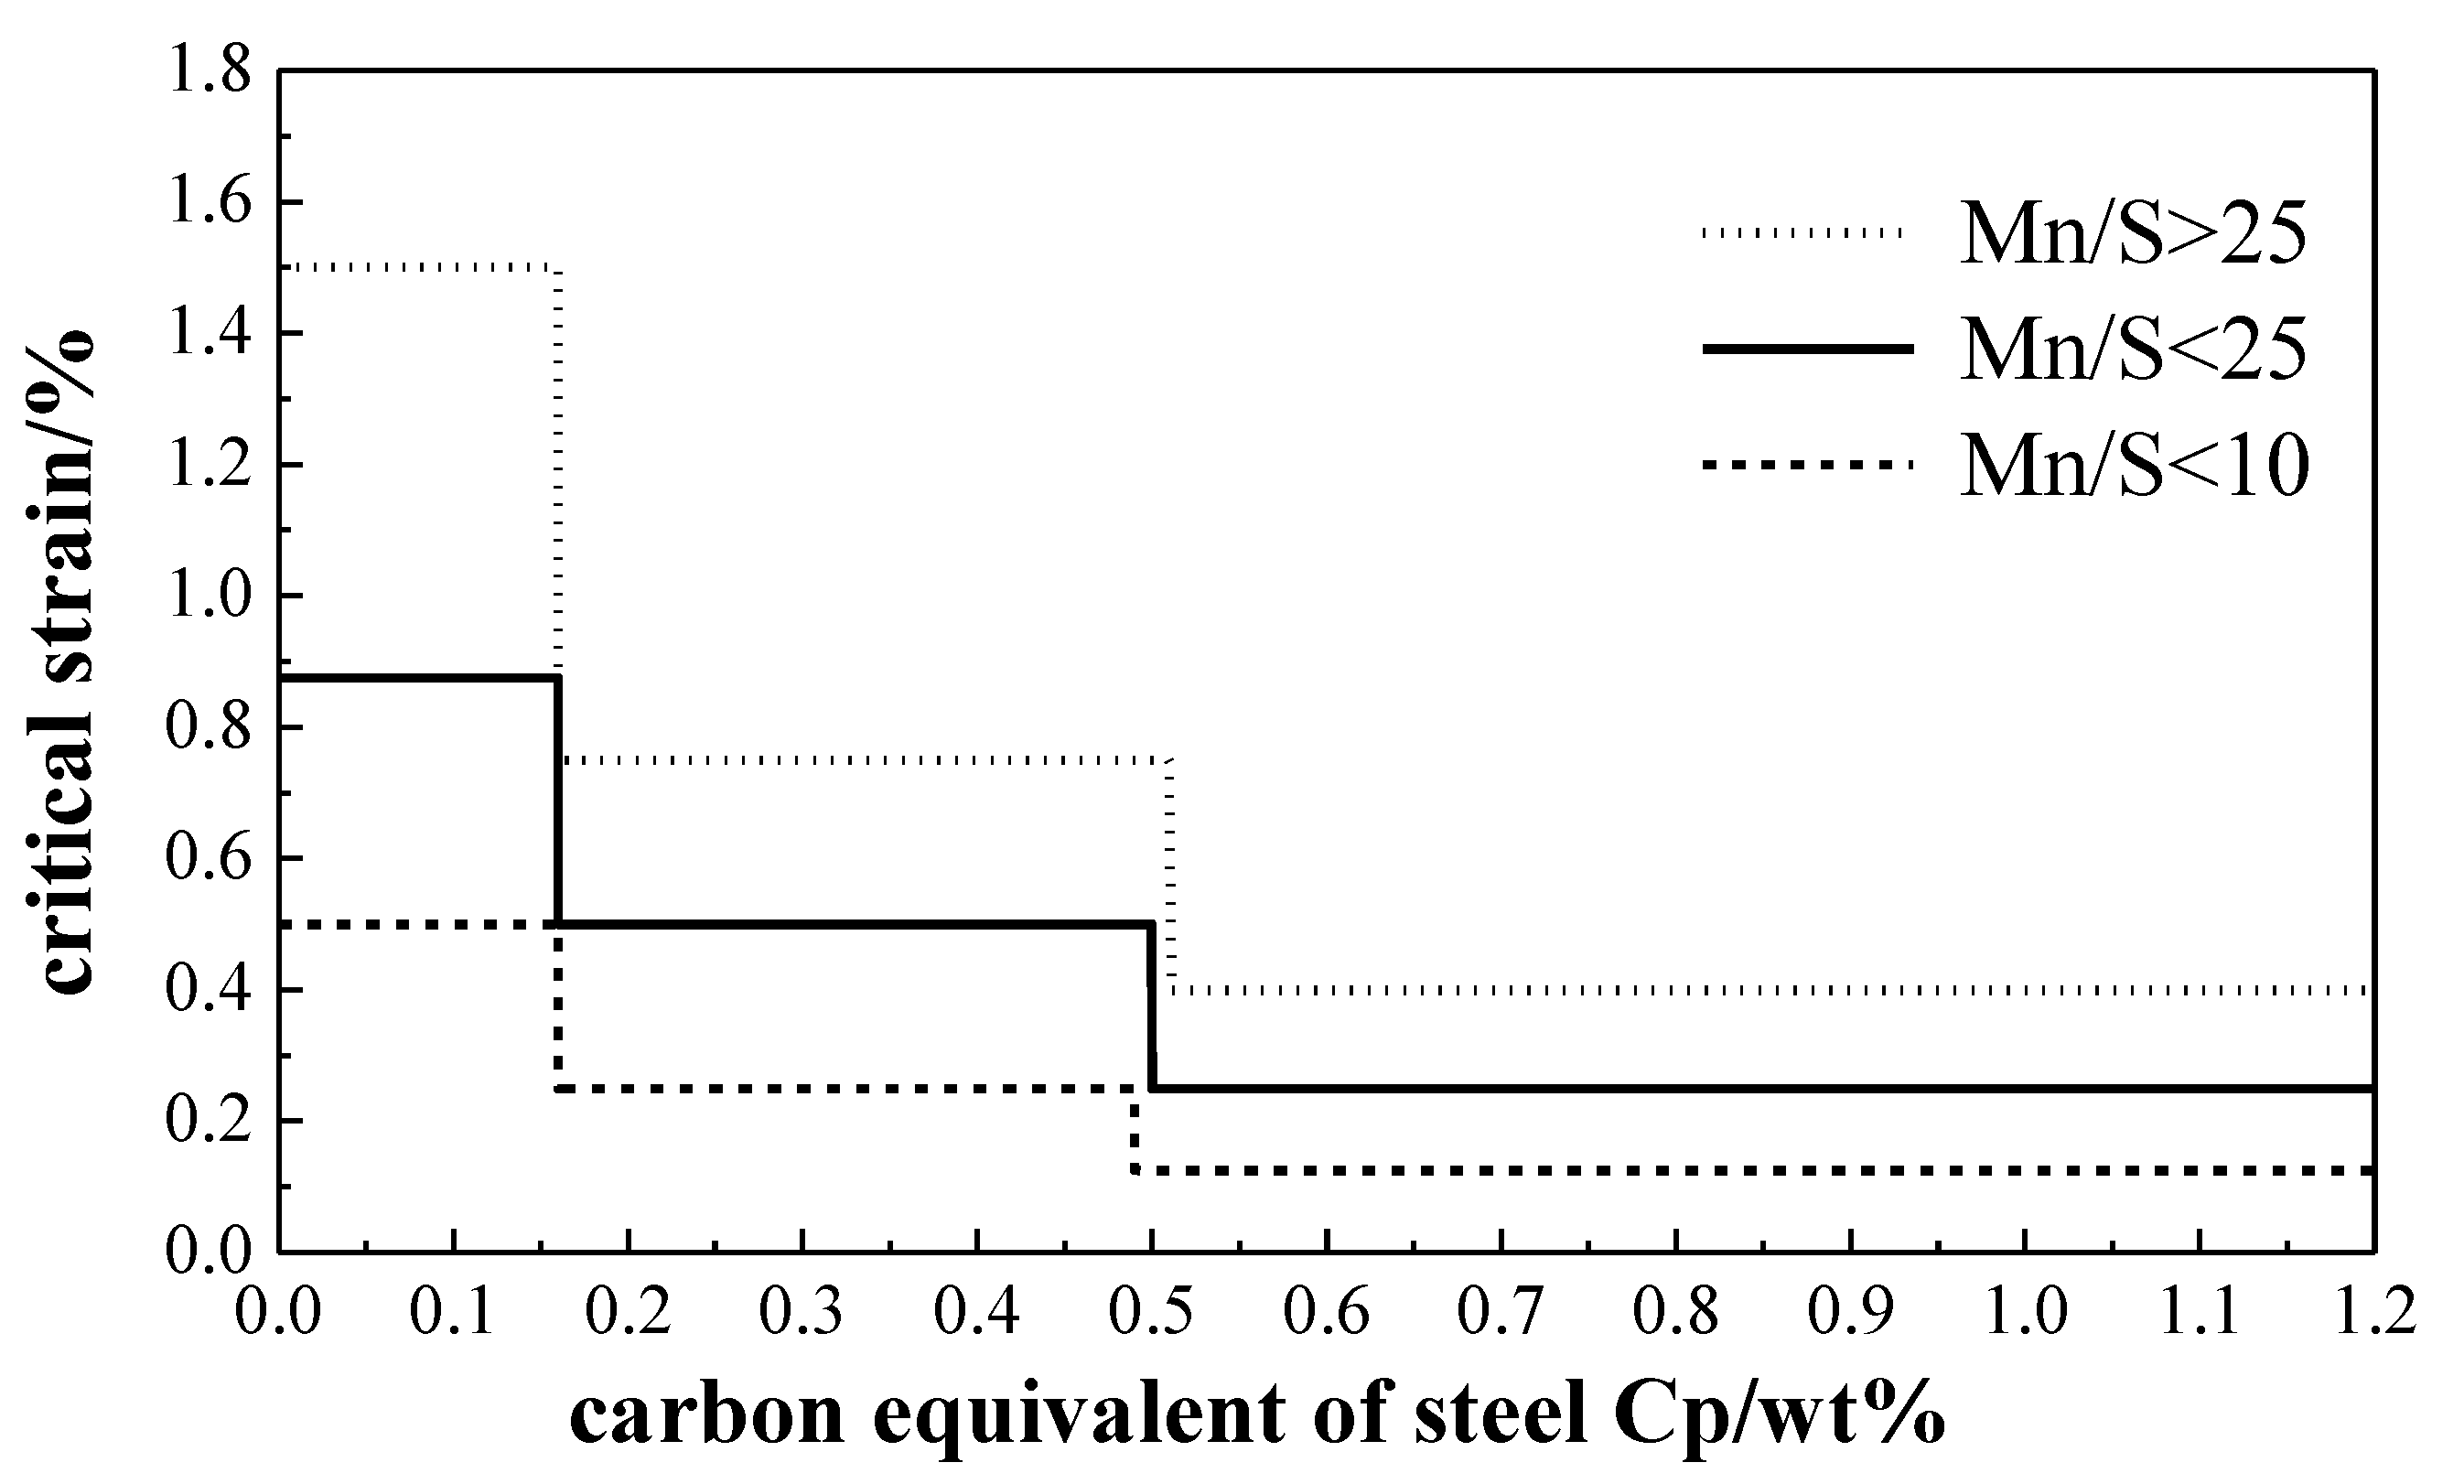
Figure 7, a positive value denotes tensile strain, and a negative value indicates compressive strain. Clearly, tensile strain near the solid front reaches the maximum value of 2.77–3.22%. Otherwise, Hiebler [
21] gave the relationship between the critical strain and the carbon equivalent by summing up the results of previous studies, and the experimental data used in
Figure 8 were obtained under the typical strain rate of a continuous casting process. According to Equation (14) and the chemical composition of steel 49MnVS3, the carbon equivalent content of 0.452% and the Mn/S index of 15.2 are obtained; therefore, the critical strain of this steel grade is approximately 0.50%, which is much smaller than the tensile strain of the solid front. Therefore, it is very easy for tearing to occur, thus forming a central crack. The carbon equivalent can be calculated as follows:
During the solidification process of bloom, columnar crystals are developed such that the interdendritic segregation is quite severe. On the one hand, enriched solute elements exist in the grain boundaries and form inclusions and others, thereby greatly reducing the high-temperature strength and the high-temperature plasticity of the dendrite grain boundaries [
22]. Correspondingly, the critical strain value of steel significantly decreases, thus causing increased brittleness of grain boundaries and extending the path of the crack. On the other hand, interdendritic segregation reduces the melting point of the dendritic liquid film, which leads to the freezing temperature of steel significantly decreasing and the difference between the LIT and the ZDT obviously increasing; thus, the possibility of racking is increased. During the solidification process of bloom, when the solid shell thickness grows to approximately 95 mm, the tensile strain of the solid front becomes much larger than the critical strain of blooms. This easily results in cracking of the solid front, which extends along the grain boundaries. In addition, once cracking of the solid front happens, the solute-rich liquid ahead of the solidification interface is immediately sucked into the cracking gap, accompanied by the solidification of liquid steel. Moreover, due to the effect of negative pressure, the liquid steel containing the enriched impurities is continuously sucked into the cracks, which leads to the cracking gap extending to the center of the bloom, thus forming a severe central crack.
Author Contributions
Conceptualization, C.X. and J.L.; methodology, C.X.; software, Q.Z.; formal analysis, C.X. and Q.Z.; investigation, J.L.; data curation, C.X.; writing—original draft preparation, C.X.; writing—review and editing, Q.Z.; project administration, J.L.; funding acquisition, J.L. All authors have read and agreed to the published version of the manuscript.
Funding
This work was financially supported by the National Natural Science Foundation of China (No. 51974210), the Hubei Provincial Natural Science Foundation (No. 2019CFB697), and the State Key Laboratory of Refractories and Metallurgy, Wuhan University of Science and Technology.
Institutional Review Board Statement
Not applicable
Informed Consent Statement
Not applicable.
Data Availability Statement
Data available on request due to privacy.
Acknowledgments
The authors would like to thank the above funding bodies for this investigation.
Conflicts of Interest
The authors declare no conflict of interest.
References
- Zinigrad, M.; Mazurovsky, V.; Borodianskiy, K. Physico-chemical and mathematical modeling of phase interaction taking place during fusion welding processes. Mater. Sci. Eng. Technol. 2005, 36, 489–496. [Google Scholar] [CrossRef]
- Li, S.; Han, Z.; Zhang, J. Numerical Modeling of the Macrosegregation Improvement in Continuous Casting Blooms by Using F-EMS. JOM 2020, 72, 4117–4126. [Google Scholar] [CrossRef]
- Kim, K.; Han, H.; Yeo, T.; Lee, Y.; Oh, K.; Lee, D. Analysis of surface and internal cracks in continuously cast beam blank. Ironmak. Steelmak. 1997, 24, 249–256. [Google Scholar]
- Thomas, B.; Brimacombe, J.; Samarasekera, I. The formation of panel cracks in steel ingots: A state-of-the-art review, Part I Hot Ductility of Steel. Trans. Iron Steel Soc. 1987, 7, 7–20. [Google Scholar]
- Clyne, T.W.; Wolf, M.; Kurz, W. The effect of melt composition on solidification cracking of steel, with particular reference to continuous casting. Metall. Trans. B 1982, 13, 259–266. [Google Scholar] [CrossRef]
- Kim, K.H.; Yeo, T.J.; Oh, K.H.; Lee, D.N. Effect of Carbon and Sulfur in Continuously Cast Strand on Longitudinal Surface Cracks. ISIJ Int. 1996, 36, 284–289. [Google Scholar] [CrossRef]
- Won, Y.M.; Kim, K.H.; Yeo, T.J.; Oh, K.H. Effect of Cooling Rate on ZST, LIT and ZDT of Carbon Steels Near Melting Point. ISIJ Int. 2007, 38, 1093–1099. [Google Scholar] [CrossRef]
- Won, Y.M.; Yeo, T.J.; Seol, D.J.; Oh, K.H. A new criterion for internal crack formation in continuously cast steels. Metall. Mater. Trans. B 2000, 31, 779–794. [Google Scholar] [CrossRef]
- Yamanaka, A.; Nakajirna, K.; Okamura, K. Critical strain for internal crack formation in continuous casting. Ironmak. Steelmak. 1995, 22, 508–512. [Google Scholar]
- Kobayashi, S.; Nagamichi, T.; Gunji, K. Numerical Analysis of Solute Redistribution during Solidification Accompanying δ/γ Transformation. Trans. Iron Steel Inst. Jpn. 1988, 28, 543–552. [Google Scholar] [CrossRef]
- Ueshima, Y.; Mizoguchi, S.; Matsumiya, T.; Kajioka, H. Analysis of solute distribution in dendrites of carbon steel with δ/γ transformation during solidification. Metall. Trans. B 1986, 17, 845–859. [Google Scholar] [CrossRef]
- Brody, H.D.; Flemings, M.C. Solute Redistribution in Dendritic Solidification. Trans. Metall. Soc. Aime 1966, 236, 615–624. [Google Scholar]
- Voller, V.R.; Beckermann, C. A unified model of microsegregation and coarsening. Metall. Mater. Trans. A 1999, 30, 2183–2189. [Google Scholar] [CrossRef]
- El-Bealy, M.; Thomas, B.G. Prediction of dendrite arm spacing for low alloy steel casting processes. Metall. Mater. Trans. B 1996, 27, 689–693. [Google Scholar] [CrossRef]
- Won, Y.M.; Thomas, B.G. Simple model of microsegregation during solidification of steels. Metall. Mater. Trans. A 2001, 32, 1755–1767. [Google Scholar] [CrossRef]
- Zhiqiang, H.; Kaike, C. Study on A Mathematical Model of Microsegregation in Continuous Cast Slab. Acta Metall. Sin. 2000, 36, 869–873. [Google Scholar]
- Cornelissen, M.C.M. Mathematical Model for Solidification of Multicomponent Alloys. Ironmak. Steelmak. 1986, 13, 204–212. [Google Scholar]
- Matsumiya, T.; Kajioka, H.; Mizoguchi, S.; Ueshima, Y.; Esaka, H. Mathematical analysis of segregations in continuously-cast slabs. Trans. Iron Steel Inst. Jpn. 1984, 24, 873–882. [Google Scholar] [CrossRef]
- Yang, C.; Dong, H.; Hu, Z. Micro-mechanism of central damage formation during cross wedge rolling. J. Mater. Process. Technol. 2018, 252, 322–332. [Google Scholar] [CrossRef]
- Zhou, X.; Shao, Z.; Tian, F.; Hopper, C.; Jiang, J. Microstructural effects on central crack formation in hot cross-wedge-rolled high-strength steel parts. J. Mater. Sci. 2020, 55, 9608–9622. [Google Scholar] [CrossRef]
- Hiebler, H.; Zirngast, J.; Bernhard, C.; Wolf, M.M. Inner crack formation in continuous casting: Stress or strain criterion. In Proceedings of the 1994 Steelmaking Conference Proceedings, Chicago, IL, USA, 20–23 March 1994; pp. 405–416. [Google Scholar]
- Mintz, B. The Influence of Composition on the Hot Ductility of Steels and to the Problem of Transverse Cracking. ISIJ Int. 1999, 39, 833–855. [Google Scholar] [CrossRef]
| Publisher’s Note: MDPI stays neutral with regard to jurisdictional claims in published maps and institutional affiliations. |
© 2021 by the authors. Licensee MDPI, Basel, Switzerland. This article is an open access article distributed under the terms and conditions of the Creative Commons Attribution (CC BY) license (http://creativecommons.org/licenses/by/4.0/).


