Article

3D Modeling of the Solidification Structure Evolution of Superalloys in Powder Bed Fusion Additive Manufacturing Processes

Department of Metallurgical and Materials Engineering, The University of Alabama, P.O. Box 870202, Tuscaloosa, AL 35487, USA
Metals 2021, 11(12), 1995; https://doi.org/10.3390/met11121995
Submission received: 17 October 2021 / Revised: 1 December 2021 / Accepted: 7 December 2021 / Published: 10 December 2021
(This article belongs to the Special Issue Numerical Simulation of Solidification Processes)

Abstract

:
Recently, a few computational methodologies and algorithms have been developed to simulate the microstructure evolution in powder bed fusion (PBF) additive manufacturing (AM) processes. However, none of these have attempted to simulate the grain structure evolution in multitrack, multilayer AM components in a fully 3D transient mode and for the entire AM geometry. In this work, a multiscale model, which consists of coupling a transient, discrete-source 3D AM process model with a 3D stochastic solidification structure model, was applied to quickly, efficiently, and accurately predict the grain structure evolution of IN625 alloys during Laser Powder Bed Fusion (LPBF). The capabilities of this model include studying the effects of process parameters and part geometry on solidification conditions and their impact on the grain structure formation within multicomponent alloy parts processed via AM. Validation was accomplished based on single-layer LPBF IN625 benchmark experiments, previously performed and analyzed at the National Institute of Standards and Technology (NIST), USA. This modeling approach can also be used to quantitatively predict the solidification structure of Ti-6Al-4V alloys in electron beam AM processes.

1. Introduction

The main aim of this study is to validate a multiscale mesoscopic modeling approach to predict the microstructure evolution of alloys during powder bed fusion processes (e.g., Electron Beam Additive Manufacturing (EBAM) and selective laser melting (SLM) processes [1,2]). A review of the effects of the major process parameters on the quality of the Laser Powder Bed Fusion (LPBF) products, including the rapid solidification microstructure of IN718, is presented in [3]. It is well-known [3,4] that solidification maps can serve as a guide for estimating microstructures with respect to temperature gradient (G) and solidification rate (R) parameters. However, due to the complexity of the AM process, solidification maps are not accurate enough to predict the formation of microstructures. Thus, an accurate predictive microstructure model would be an extremely useful tool for assisting in AM product quality control.
The multiscale model used in this study consists of coupling a fully transient 3D Computational Fluid Dynamics (CFD) macro-model with a 3D solidification structure micromodel [4,5,6,7,8]. Figure 1 presents the coupling methodology between the CFD macro-code and the solidification structure evolution stochastic mesoscopic code. The solidification structure model was adapted to SLM process conditions (e.g., rapid solidification regime [8,9]).
SLM single-layer IN625 benchmark experiments using LPBF equipment were performed and analyzed at the National Institute of Standards and Technology (NIST), USA [10]. These experimental results were used to validate the 3D coupled macro-micro model. It is considered in the coupled model that the complex combination of crystallographic requirements, isomorphism, epitaxy, and the changing direction of melt pool motion and thermal gradient direction produced the observed texture and grain morphology. In addition, the entire AM geometry is simulated with this 3D fully transient model; therefore, there are no limitations/assumptions in accounting for rapid solidification kinetics, remelting, epitaxy, isomorphism, etc., as there could be in other recently proposed AM models [11,12,13]. Thus, having a 3D modeling tool would be very useful for interpreting these phenomena. This model can be applied to predict experimental observations then further applied to determine the influence of various process parameters, including the scan path, on the formation of texture and grain morphology in multitrack, multilayer AM components.

2. The Modeling Approach

2.1. The Macro-Model Description

A fully implicit, control-volume method was employed to describe the 3D transient macro-transport phenomena in solidifying AM products. The macro-model accounts for energy transport within the AM product by conduction and to the surroundings by conduction, convection, and thermal radiation. A time-dependent, volumetric heat flux moving source was assumed to account for the SLM process. The evaporation of the alloying elements is ignored in the current model.
In the absence of convective transport, the governing heat conduction equation for a 3D geometry is as follows:
t ( ρ T ) = x   ( K c p   T x   ) + y   ( K c p   T y   ) + z   ( K c p   T z   ) + S T + S L   for   0 z Z ( t ) with   S L = 1 c p A   P 2 π 3 / 2 σ 3   exp ( ( x 2 + y 2 + 1.35 z 2 ) 2 σ 2 )         S T = L c p t   ( ρ   f S )   and   f S = T L T T L T S
where T is the temperature; t is time; ρ is the density; K is the thermal conductivity; cp is the specific heat; SL is the source term associated with the laser power; A is the absorption coefficient; P is the laser power; σ is the laser beam radius; 1.35 is the value of the oblate spheroid parameter in z direction; ST is the source term associated with the change of phases, which describes the rates of latent heat evolution during the liquid/solid transformation; L is the latent heat of solidification; fS is the solid fraction; T L is the liquidus temperature; T S is the solidus temperature; and Z(t) is the expanding domain height up to the maximum AM product height.
For conventional PBF processes such as SLM and EBAM, there is a single continuously scanning energy source (SL), which is deposited during a time scale Δt. Δt must be sufficiently small with respect to the elapsed time required for the source to traverse a distance equal to its 4σ beam diameter. The implementation of this energy source is described in more detail in [2].
As shown in Equation (1), the solid fraction is linearly dependent on the temperature in the mushy region. The source term linearization technique described in [14] was used to implement the ST. Although more sophisticated models [4,15] can be used to describe AM product solidification, the current approach not only describes both columnar and equiaxed solidification, but also accounts for remelting phenomena.
The continuum thermo-physical properties (K, cp, and ρ) are weighted by the solid fraction and liquid fraction (fL) as follows:
c p = f S   c p S + f L   c p L         K = f S   K S + f L   K L         and       ρ = g S   ρ S + g L   ρ L with       f S = g S   ρ S ρ       and       f L = g L   ρ L ρ
For a 3D geometry, the appropriate heat transfer boundary conditions (BCs) for the AM processes are: heat losses by conduction, convection, and radiation at the geometry top, edge and bottom, and AM process-specific BCs at the top of the geometry to account for the heat input due to the moving/scanning volumetric source.

2.2. The Micromodel Description

The present stochastic approach differs from the classical “Cellular Automata” technique [4] in that it uses thermal history results from the deterministic model described in the previous section. The development of the stochastic model for grain structure evolution is described in more detail in [4,5]. This description includes nucleation and growth kinetics, as well as the growth anisotropy and grain selection mechanisms. The required input data for stochastic calculations are provided by the macroscopic model and include: (i) local cooling rates calculated at the liquidus and solidus temperatures, (ii) time-dependent temperature gradients in the mushy zone, also calculated at the liquidus and solidus temperatures, and (iii) local solidification start time and end time. Local cooling rates calculated at the liquidus temperature are used to compute the nucleation parameters. Local average cooling rates, and time-dependent temperature gradients in the mushy zone are used to compute the grain growth parameters.
During the solidification of AM processed products, at least three grain morphologies can be encountered: equiaxed grains, columnar grains solidified under a variable G/V ratio, and columnar grains solidified under a relatively constant G/V ratio, where G and V are the local temperature gradient and solid–liquid (S/L) interface velocity of the mushy region, respectively. All aforementioned morphologies, as well as the columnar-to-equiaxed transition, are driven by more or less the same solidification mechanism, that is, the nucleation and growth competition of various phases in the mushy region.
The stochastic models for equiaxed and columnar grains solidified under a variable G/V ratio are presented in [4,5]. The columnar structure solidified under a relatively constant G/V ratio, which is perhaps the most common morphology encountered during AM, is described below.

2.2.1. Description of the Columnar Interface Tracking

Tracking of the columnar front assumes that, at the columnar front, the growth velocity is equal to the interface velocity of the dendrite tip at the same location. For a 3D domain, the position of the columnar front (Xc, Yc, Zc) at time t + δt can be iteratively computed by
X c t + t = X c t + 1 c o s θ V c t   G x G T   t         Y c t + t = Y c t + 1 c o s θ V c t   G y G T   t and       Z c t + t = Z c t + 1 c o s θ V c t   G z G T   t       with   G T = G X 2 + G y 2 + G z 2
where Vc is the solidification velocity of the columnar front; GT is the local temperature gradient in the mushy zone; G x , G y and G z are the temperature gradients in the x, y, and z directions, respectively; and θ is the angle between the normal to the solidification front, and the preferred [hkl] crystallographic growth direction. The crystallographic growth direction of the columnar grains is randomly chosen during the modeling of the surface nucleation event. The methodology for accounting for the preferential crystallographic growth of cubic crystals in the [100] direction is described in detail in [4,16,17].
The solidification kinetics velocity of the columnar front, Vc, is computed based on growth kinetics as [4]:
V C = D L π 2 Γ   k e   Δ T L S ( Δ T ) 2               with         Δ T = a   G T
where DL is the liquid diffusivity, Γ is the Gibbs–Thomson coefficient, ke is the equilibrium partition coefficient, ΔTLS is the solidification interval, Δ T is the S/L interface undercooling, and a is the mesh size.
The stochastic model described above has to be adapted for rapid solidification conditions, which are encountered in AM processing. At normal cooling rates, the tip radius of the dendrite decreases as the solidification velocity increases. However, as the cooling rate increases in the rapid solidification range, the tip radius increases, which is accompanied by a decrease in branching, and the morphology of the grain changing from dendritic to cellular. To account for the rapid solidification conditions (where solidification velocities typically exceed 0.01 m/s) in Equation (4), the partition coefficient (k*) and liquidus slope ( m L ) of each alloying element need be corrected using Aziz [8], and Baker and Kahn [9] equations, respectively:
k ( V ) = k e + δ i   V / D i 1 + δ i   V / D i               m L ( V ) = m L 1 k e [ 1 k ( 1 ln k k e ) ]
where V is the S/L interface velocity, Di is the interfacial diffusivity, δi is the atomic boundary layer thickness, and mL is the equilibrium liquidus slope.

2.2.2. Computational Aspects for 3D Modeling of AM Products

Following are some important computational aspects related to the stochastic modeling of microstructures in AM products:
The time step, δ t , used in computations is determined by the Courant criterion:
t = a 2 V c  
where a is the mesh size, and Vc is the S/L interface velocity.
Physically, Equation (6) uses the same principle as is applied in free surface fluid flow computations, i.e., growth is not allowed to take place for more than one half of the mesh size during each time step calculation. Note that, as shown in Equation (6), the time step is linearly dependent on the mesh size.
It was determined that the mesh size should be about 2 μm for simulating the solidification structure in AM products. For this mesh size, the simulation results converged and matched experimental observations [10].
The computer memory and CPU time requirements of the current stochastic model are summarized below:
  • The GPU (CUDA) and CPU (C++) were utilized to compile the 3D micromodel code;
  • The CUDA 3D-Micro simulator is at least one order of magnitude faster than the CPU Micro-3D simulator using the Intel Skylake AL supercomputer;
  • The CPU 3D-Micro simulator is fairly fast, typically taking about 8 h for a multilayer, multitrack simulation using a 2 μm mesh size (33 million cells, RAM 6 GB);
  • The CPU 3D-Micro simulator can run 2.75 trillion cells on the Intel Skylake AL supercomputer (RAM 500 GB), which is equivalent of a 1.4 mm3 geometry using a 2 μm mesh size.

3. Results and Discussion

Table 1 shows the thermo-physical and material kinetics properties of IN625 used in the current simulation. A pseudo-phase diagram IN625-Nb is assumed. The isopleth section of the Ni-Cr-Nb-Fe-Mo phase diagram with 21 wt. % Cr, 5 wt. % Fe, 9 wt. % Mo, and 0.8 wt. % Co is shown in Figure 1 in [18]. The Nb composition of IN625 is 4.1 wt. %. The nucleation density of the columnar grains ( N 0 ) is also given in Table 1.
The process conditions used in the NIST experiment and in the current simulation, such as the laser power (P), and the laser scanning speed (Vs) (see Table 2), create cooling rates in the range of 105–106 K/s, and temperature gradients in the range of 105–107 K/m.
The mesh size used in the current simulation is 2 μm for the macro-model and 1 μm for the micromodel. Additional details regarding the geometry and the process conditions are presented in [10].
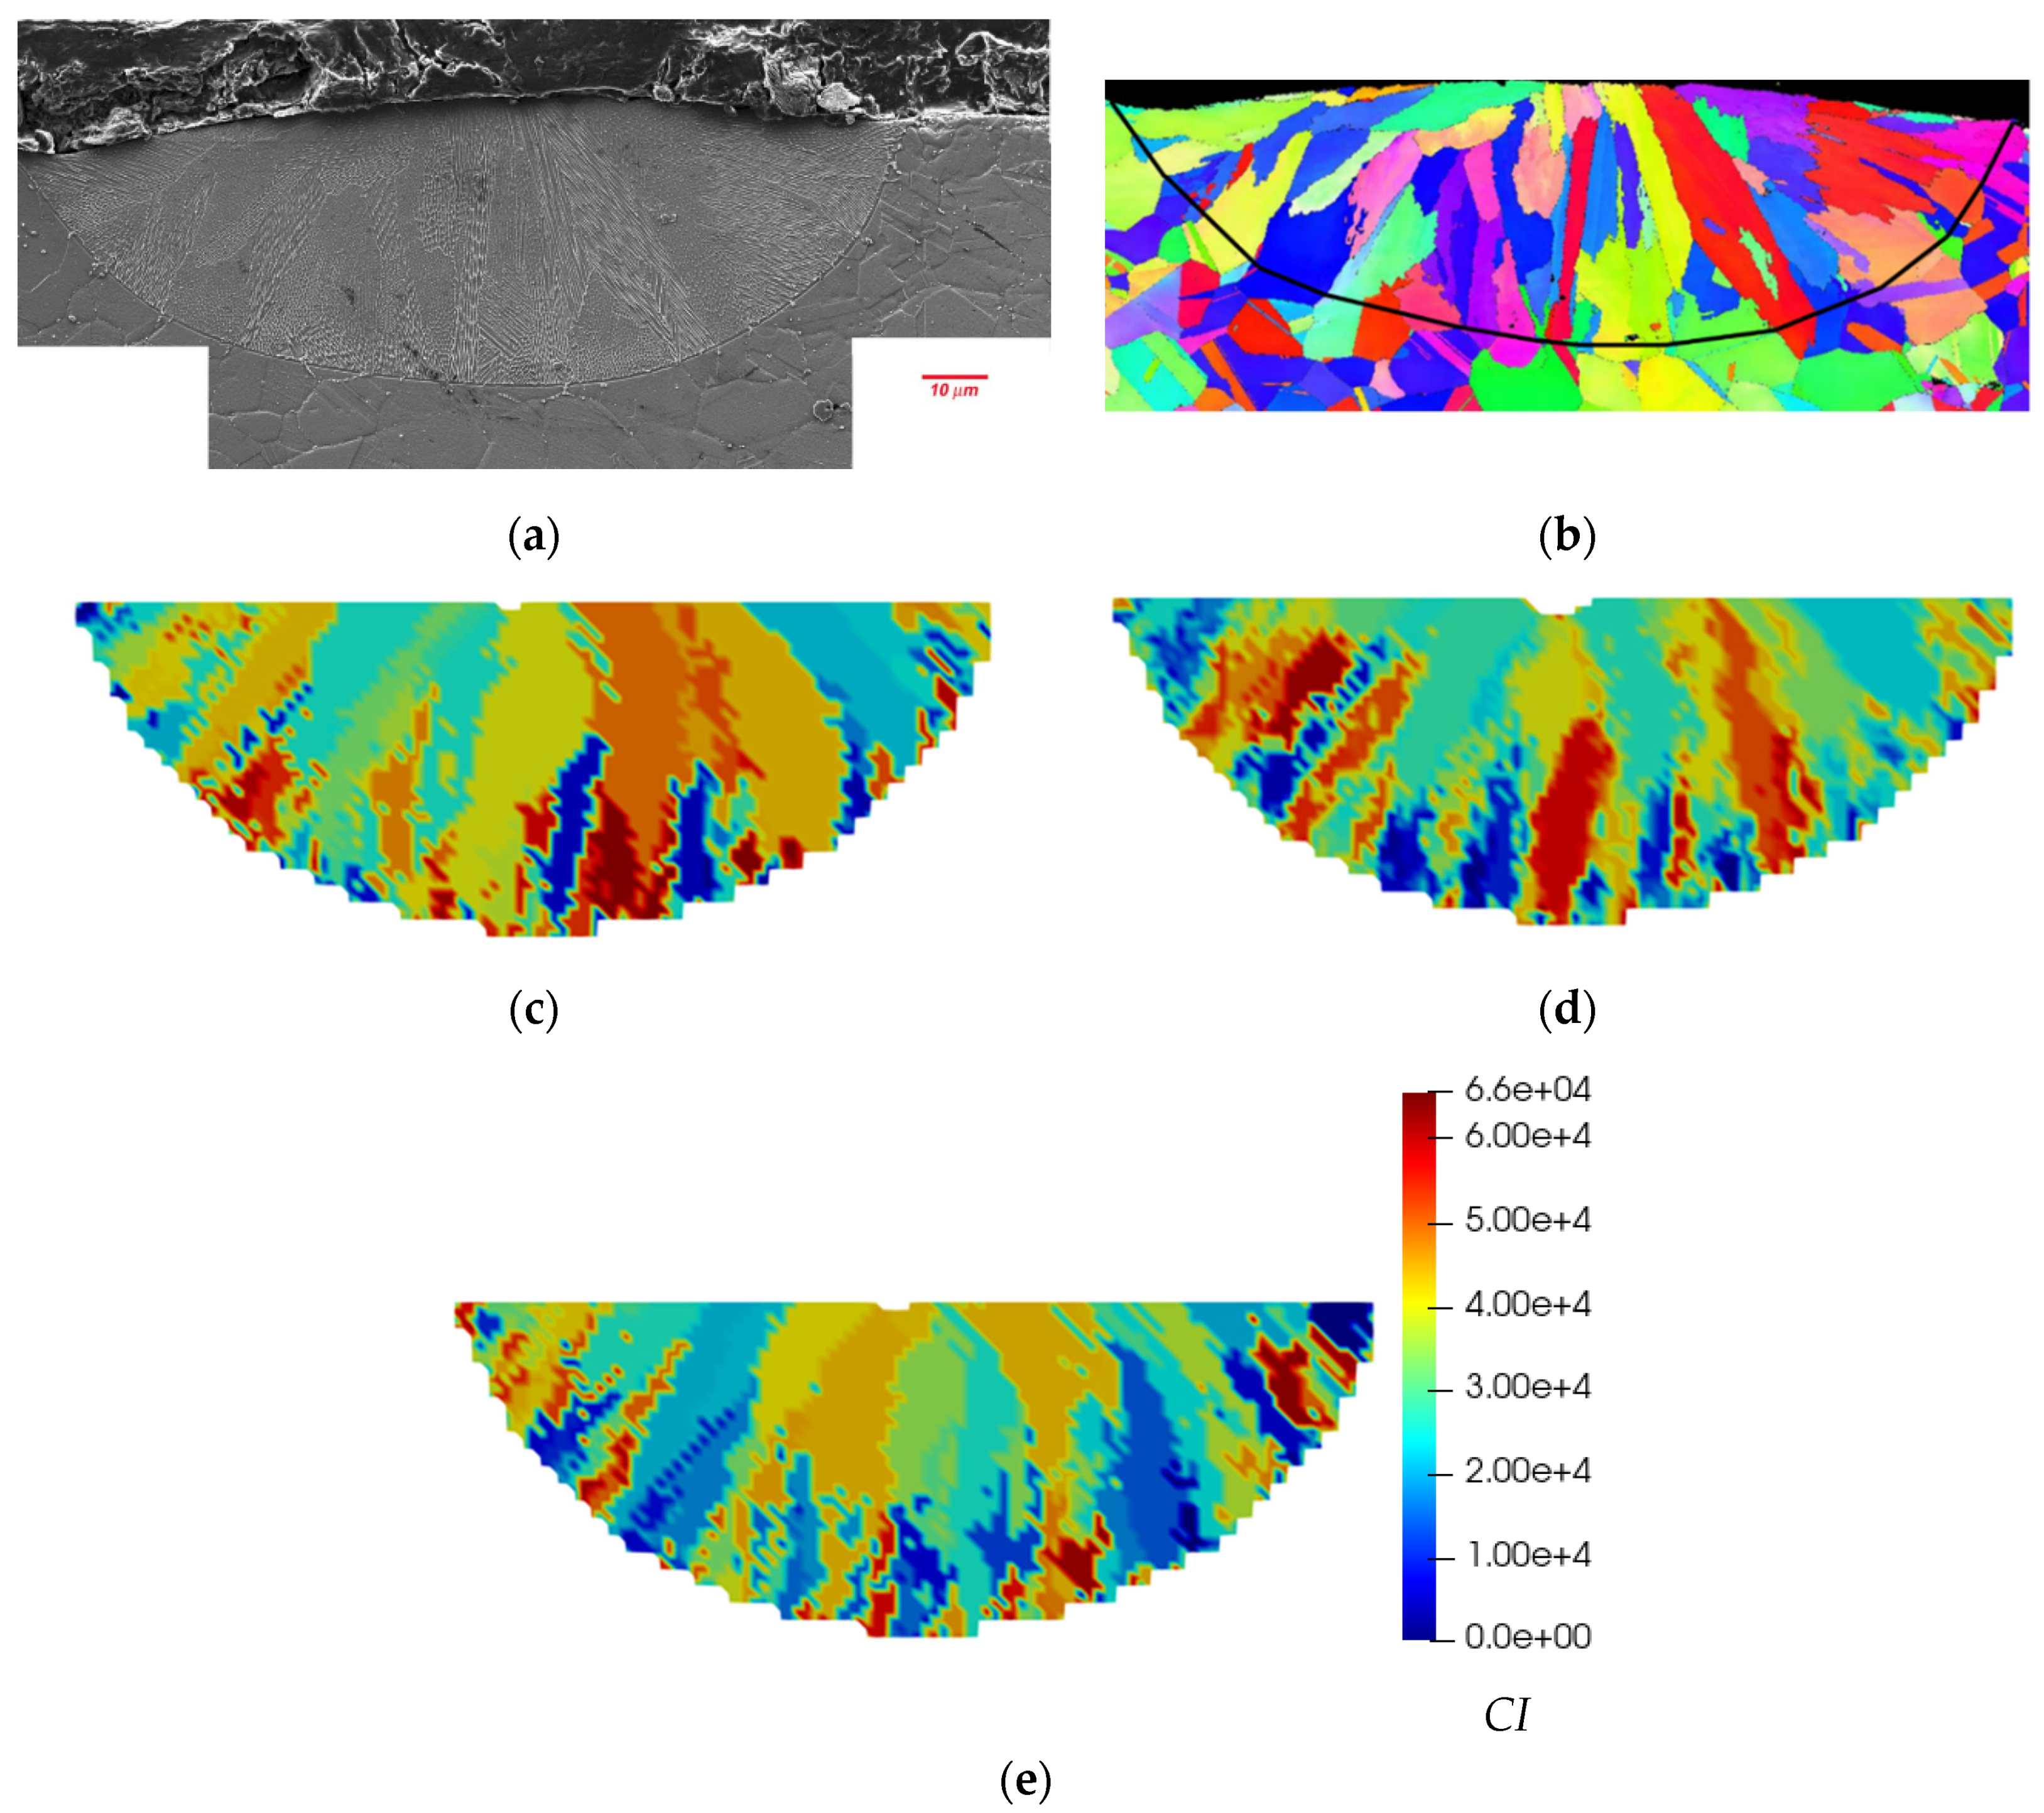
Figure 2 presents a comparison between the experiments [10] and the simulation results for the IN625 LPBF single-layer case. The legend in Figure 2 shows the preferential crystallographic orientation angle of the columnar grains as 65535 color indices (CI). The orientation angles can be extracted from the legend using Equation (7):
θ = π 2   C I 65535     π 4
Thus, when CI/65535 ratio varies from 0 to 1, θ ranges from −π/4 to π/4.
A favorable comparison between the experiment and the simulation results in terms of melt pool dimensions and solidification grain structure can be seen in Figure 2. The height and diameter of the experimental melt pool, as shown in Figure 2a,b, are about 40 μm and 130 μm, respectively. The predicted height and diameter of the melt pool shown in Figure 2c–e are about 44 μm and 128 μm, respectively. The experimental average columnar grain size at the top of the pool in Figure 2b is about 10 μm. The predicted average columnar grain size at the top of the pool in Figure 2c–e is about 11 μm. In addition, the predicted and experimental grain orientations in Figure 2 match quite well. The comparison of the predicted and experimental grain selection mechanism is also remarkable. Figure 2 shows that there are 28 predicted grains and 27 experimental grains at the bottom of the pool and only 14 predicted grains and 13 experimental grains at the top of the pool.
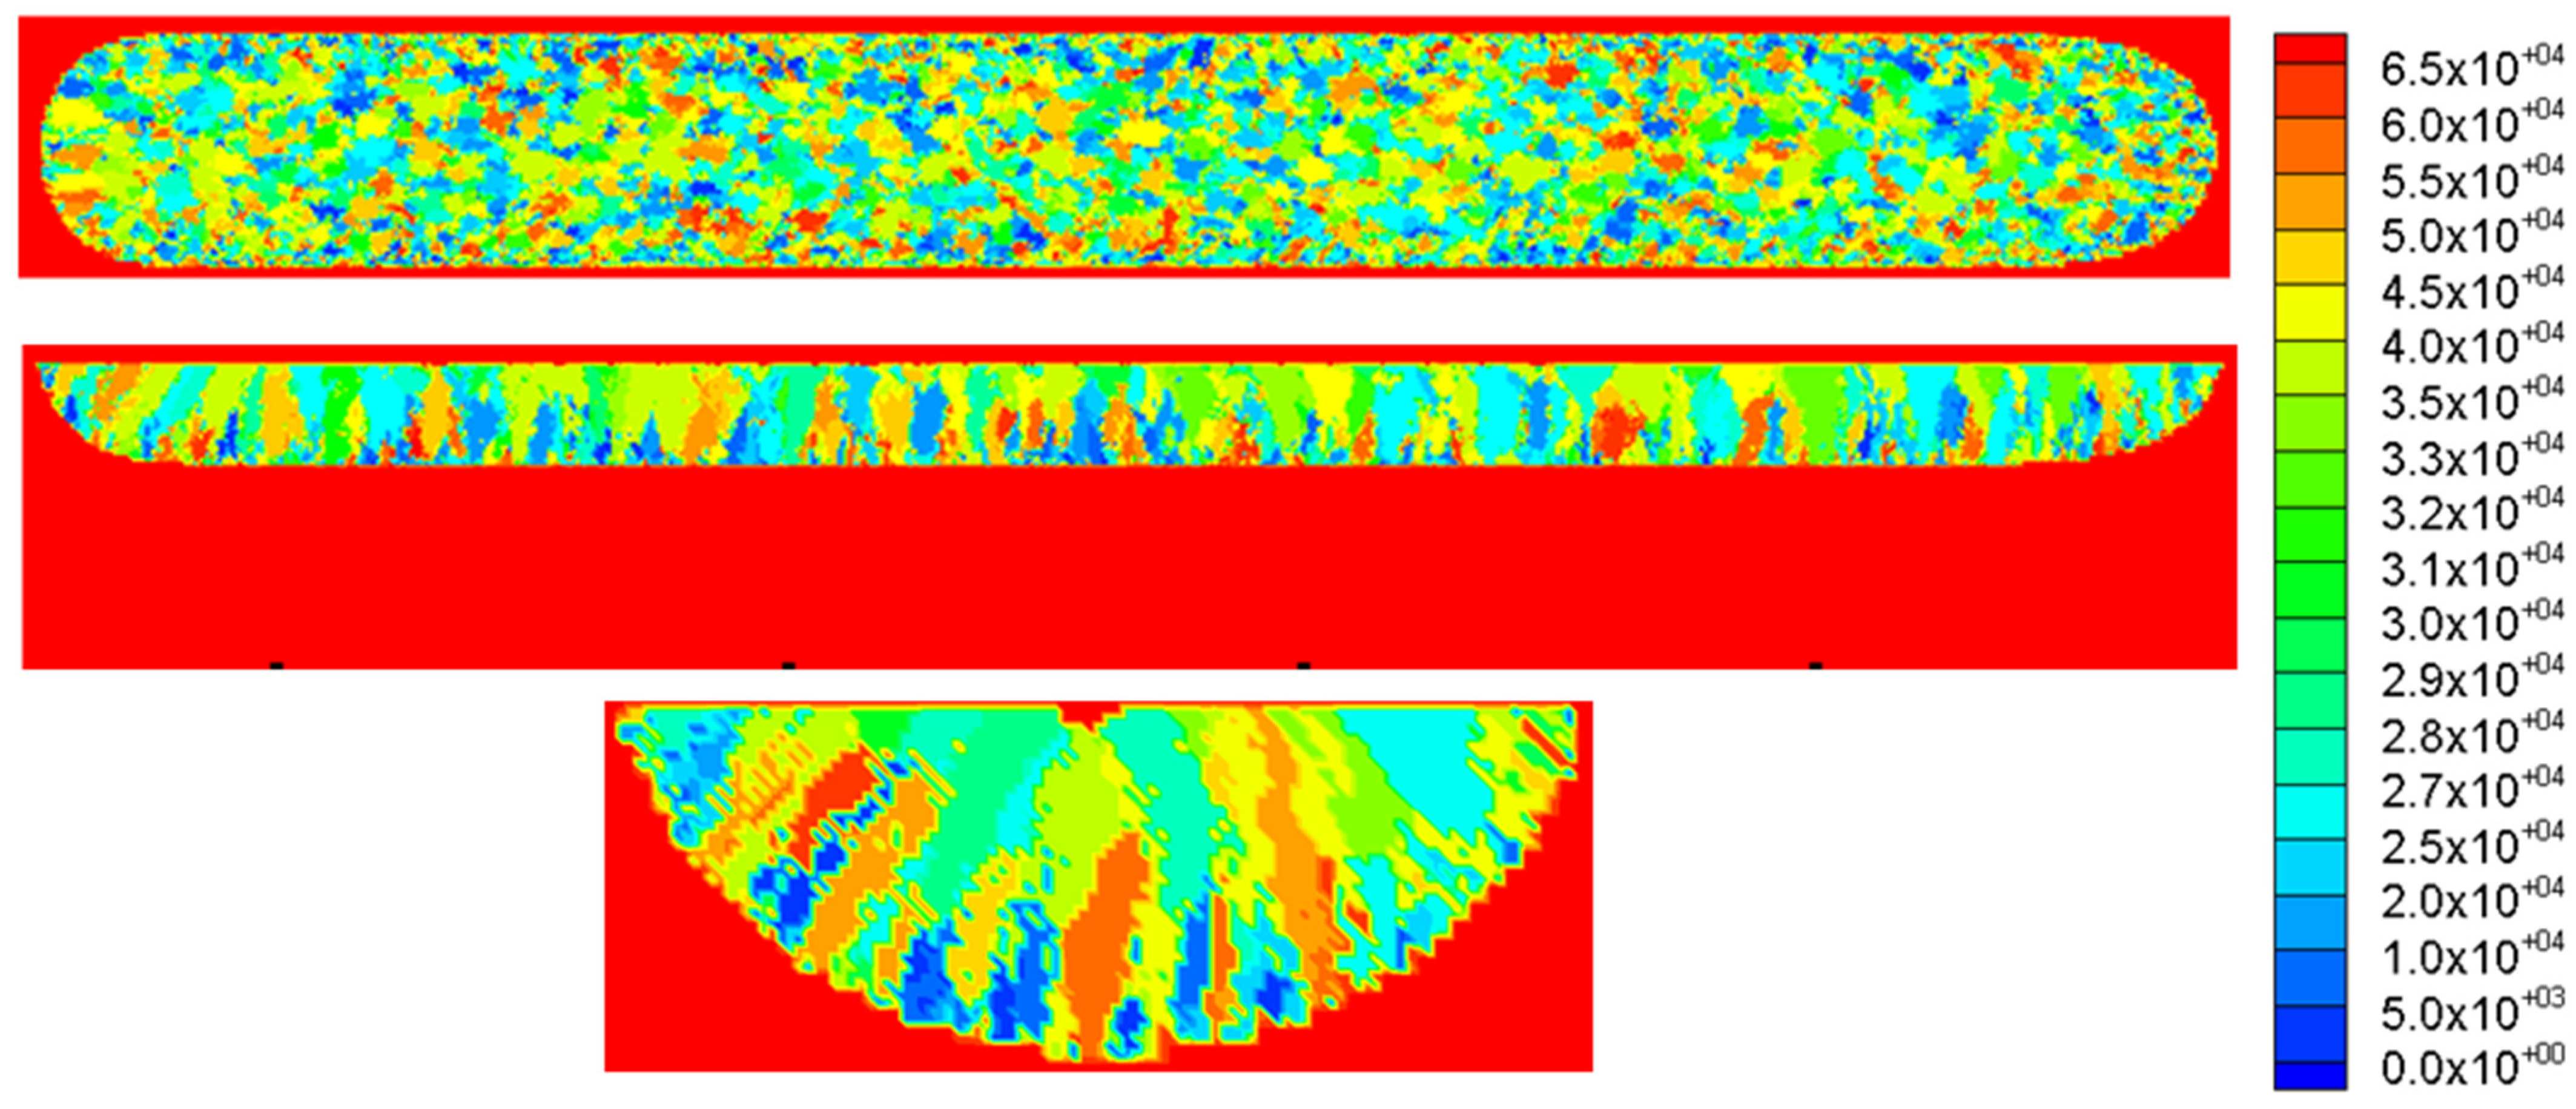
Additional 2D and 3D plots for different planes of the same modeling case are presented in Figure 3 and Figure 4. The best-oriented grains (CIs in the middle of the CI legends in Figure 2, Figure 3 and Figure 4) with respect to the temperature gradient will typically grow to the top of the pool surface, while the worst-oriented grains will normally disappear.

4. Conclusions

An integrated multiscale transient 3D modeling tool, which consists of coupling a fully transient 3D macro-model with a 3D micromodel, was applied to simulate the 3D microstructure evolution during LPBF solidification of IN625. The coupled multiscale model was successfully validated against the benchmark experiments performed by NIST, regarding the melt pool dimensions and the columnar grain size and orientation. The CPU time for the studied simulation is about 1 h on the Intel Skylake AL supercomputer. Notably, the current CPU 3D-Micro simulator can run approximately 2.75 trillion cells on the Intel Skylake AL supercomputer (RAM 500 GB), which is equivalent to a 1.4 mm3 geometry using a mesh size of 2 μm.

Funding

This research was not supported by external funding.

Data Availability Statement

Not applicable.

Acknowledgments

The Alabama Supercomputer Authority (www.asc.edu) (accessed on 4 October 2021) is acknowledged for providing the computing resources to run the simulation presented in this paper.

Conflicts of Interest

The author declares no conflict of interest.

References

  1. Liu, S.; Shin, Y.C. Additive manufacturing of Ti6Al4V alloy: A review. Mater. Des. 2019, 164, 107552. [Google Scholar] [CrossRef]
  2. Schwalbach, E.J.; Donegan, S.P.; Chapman, M.G.; Chaput, K.J.; Groeber, M.A. A discrete source model of powder bed fusion additive manufacturing thermal history. Addit. Manuf. 2019, 25, 485–498. [Google Scholar] [CrossRef]
  3. Oliveira, J.P.; LaLonde, A.; Ma, J. Processing parameters in laser powder bed fusion metal additive manufacturing. Mater. Des. 2020, 193, 108762. [Google Scholar] [CrossRef]
  4. Nastac, L. Modeling and Simulation of Microstructure Evolution in Solidifying Alloys, a Monograph; Springer: New York, NY, USA, 2004. [Google Scholar] [CrossRef]
  5. Nastac, L. A Multiscale Transient Modeling Approach for Predicting the Solidification Structure in VAR-Processed Alloy 718 Ingots. Met. Mater. Trans. A 2014, 45, 44–50. [Google Scholar] [CrossRef]
  6. Nastac, L.; Valencia, J.J.; Tims, M.L.; Dax, F.R. Advances in Solidification of IN718 and RS5 Alloys. In Proceedings of the Fifth International Special Emphasis Symposium on Superalloy 718, 625, 706, and Derivatives, Pittsburgh, PA, USA, 17–20 June 2001. [Google Scholar]
  7. Stefanescu, D.M. Science and Engineering of Casting Solidification; Springer: New York, NY, USA, 2009. [Google Scholar]
  8. Aziz, M.J. Model for solute redistribution during rapid solidification. J. Appl. Phys. 1982, 53, 1158–1168. [Google Scholar] [CrossRef] [Green Version]
  9. Baker, J.C.; Cahn, J.W. Thermodynamics of Solidification, Solidification; American Society of Metals: Metals Park, OH, USA, 1971; p. 23. [Google Scholar]
  10. 2018 AM-Bench Test Descriptions for AMB2018-02, NIST. Available online: https://www.nist.gov/ambench/amb2018-02-description (accessed on 30 November 2021).
  11. Rolchigo, M.; Stump, B.; Belak, J.F.; Plotkowski, A. Sparse thermal data for cellular automata modeling of grain structure in additive manufacturing. Model. Simul. Mater. Sci. Eng. 2020, 28, 065003. [Google Scholar] [CrossRef]
  12. Koepf, J.A.; Gotterbarm, M.R.; Markl, M.; Körner, C. 3D multi-layer grain structure simulation of powder bed fusion additive manufacturing. Acta Mater. 2018, 152, 119–126. [Google Scholar] [CrossRef]
  13. Rodgers, T.; Madison, J.D.; Tikare, V. Simulation of metal additive manufacturing microstructures using kinetic Monte Carlo. Comput. Mater. Sci. 2017, 135, 78–89. [Google Scholar] [CrossRef]
  14. Patankar, S.V. Numerical Heat Transfer and Fluid Flow; Hemisphere Publishing Corporation: New York, NY, USA, 1980. [Google Scholar]
  15. Nastac, L.; Sundarraj, S.; Yu, K.O.; Pang, Y. The Stochastic Modeling of Solidification Structures in Alloy 718 Remelt Ingots: Research Summary. J. Metals 1998, 50, 30–35. [Google Scholar]
  16. Wei, H.; Mazumder, J.; Debroy, T. Evolution of solidification texture during additive manufacturing. Sci. Rep. 2015, 5, 16446. [Google Scholar] [CrossRef] [PubMed] [Green Version]
  17. Nastac, L. A 3D stochastic mesoscopic model for prediction of microstructure evolution during solidification of dendritic alloys. Met. Res. Technol. 2014, 111, 311–319. [Google Scholar] [CrossRef]
  18. Mohammadpour, P.; Phillion, A.B. Solidification microstructure selection maps for laser powder bed fusion of multicomponent alloys. IOP Conf. Ser. Mater. Sci. Eng. 2020, 861, 012005. [Google Scholar] [CrossRef]
  19. Khorasani, M.; Ghasemi, A.; Leary, M.; O’Neil, W.; Gibson, I.; Cordova, L.; Rolfe, B. Numerical and analytical investigation on meltpool temperature of laser-based powder bed fusion of IN718. Int. J. Heat Mass Transf. 2021, 177, 121477. [Google Scholar] [CrossRef]
Figure 1. Diagram showing the coupling between the CFD macro-code and the solidification structure evolution stochastic mesoscopic code.
Metals 11 01995 g001
Figure 2. Comparison between experiment [10] (a,b) and simulations (3 different YK planes—(ce)). The black line in (b) shows the location of the melt pool boundary.
Metals 11 01995 g002
Figure 3. 3D grain structure simulation results: (middle XY, XK, and YK planes).
Metals 11 01995 g003
Figure 4. 3D grain structure simulation results (2D and 3D plots).
Metals 11 01995 g004
Table 1. Themo-physical and material kinetics properties of IN625 [4,10,18].
PropertyValueUnit
ρ7620kg/m3
cp720J/kg/K
K30.1W/m/K
L2.95 × 105J/kg
mL−12.0K/wt. %
Γ1.0 × 10⁻⁷K/m
DL3.0 × 10−9m2/s
ke0.5
T L 1622K
Δ T L S 49.2K
N 0 1.0 × 10¹⁰m−2
a1.0μm
Table 2. Process and material parameters used in the current simulation [10,19].
ParameterValueUnit
P195W
Vs0.8m/s
σ50μm
A0.3-
Δt5.0 × 10−5s
Substrate materialIN625-
Initial temperature298.15K
Publisher’s Note: MDPI stays neutral with regard to jurisdictional claims in published maps and institutional affiliations.