
Effect of La and Sc Co-Addition on the Mechanical Properties and Thermal Conductivity of As-Cast Al-4.8% Cu Alloys

 ,
,
Abstract
:1. Introduction
2. Materials and Methods
3. Results
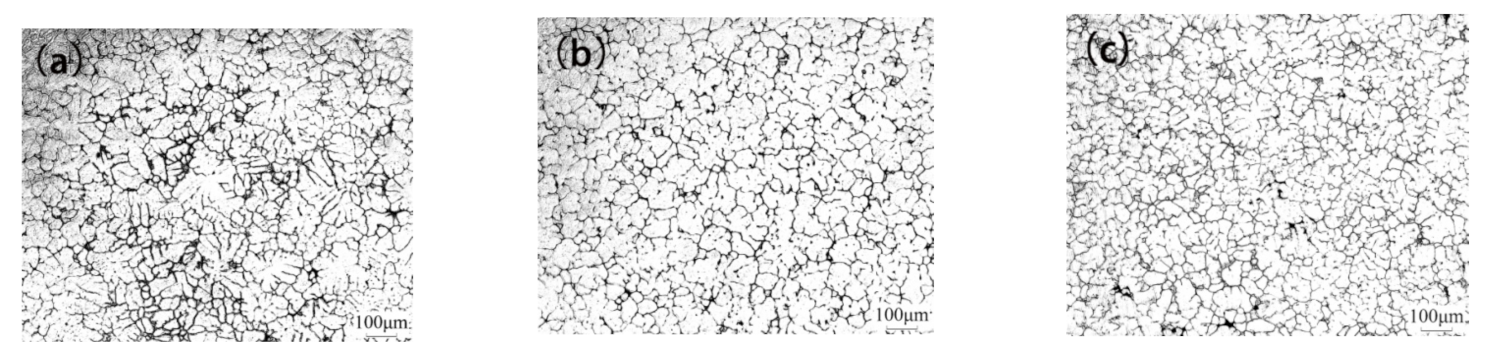
3.1. As-Cast Microstructure Evolution
3.2. Mechanical Properties
3.3. Properties of Thermal Conductivity
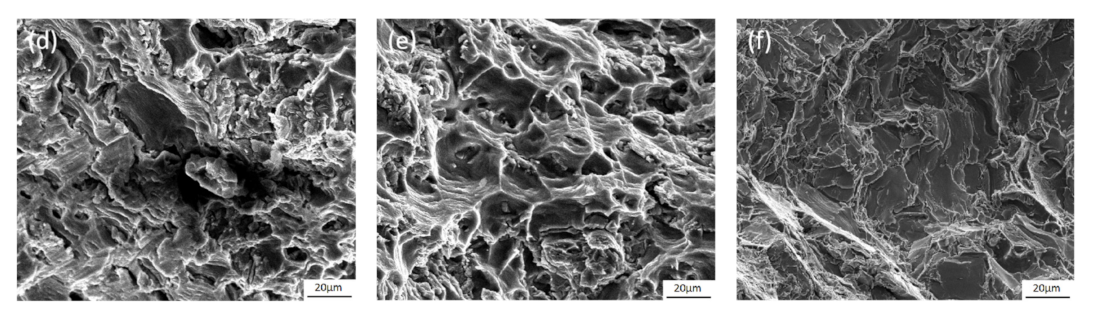
3.4. Fracture Morphology
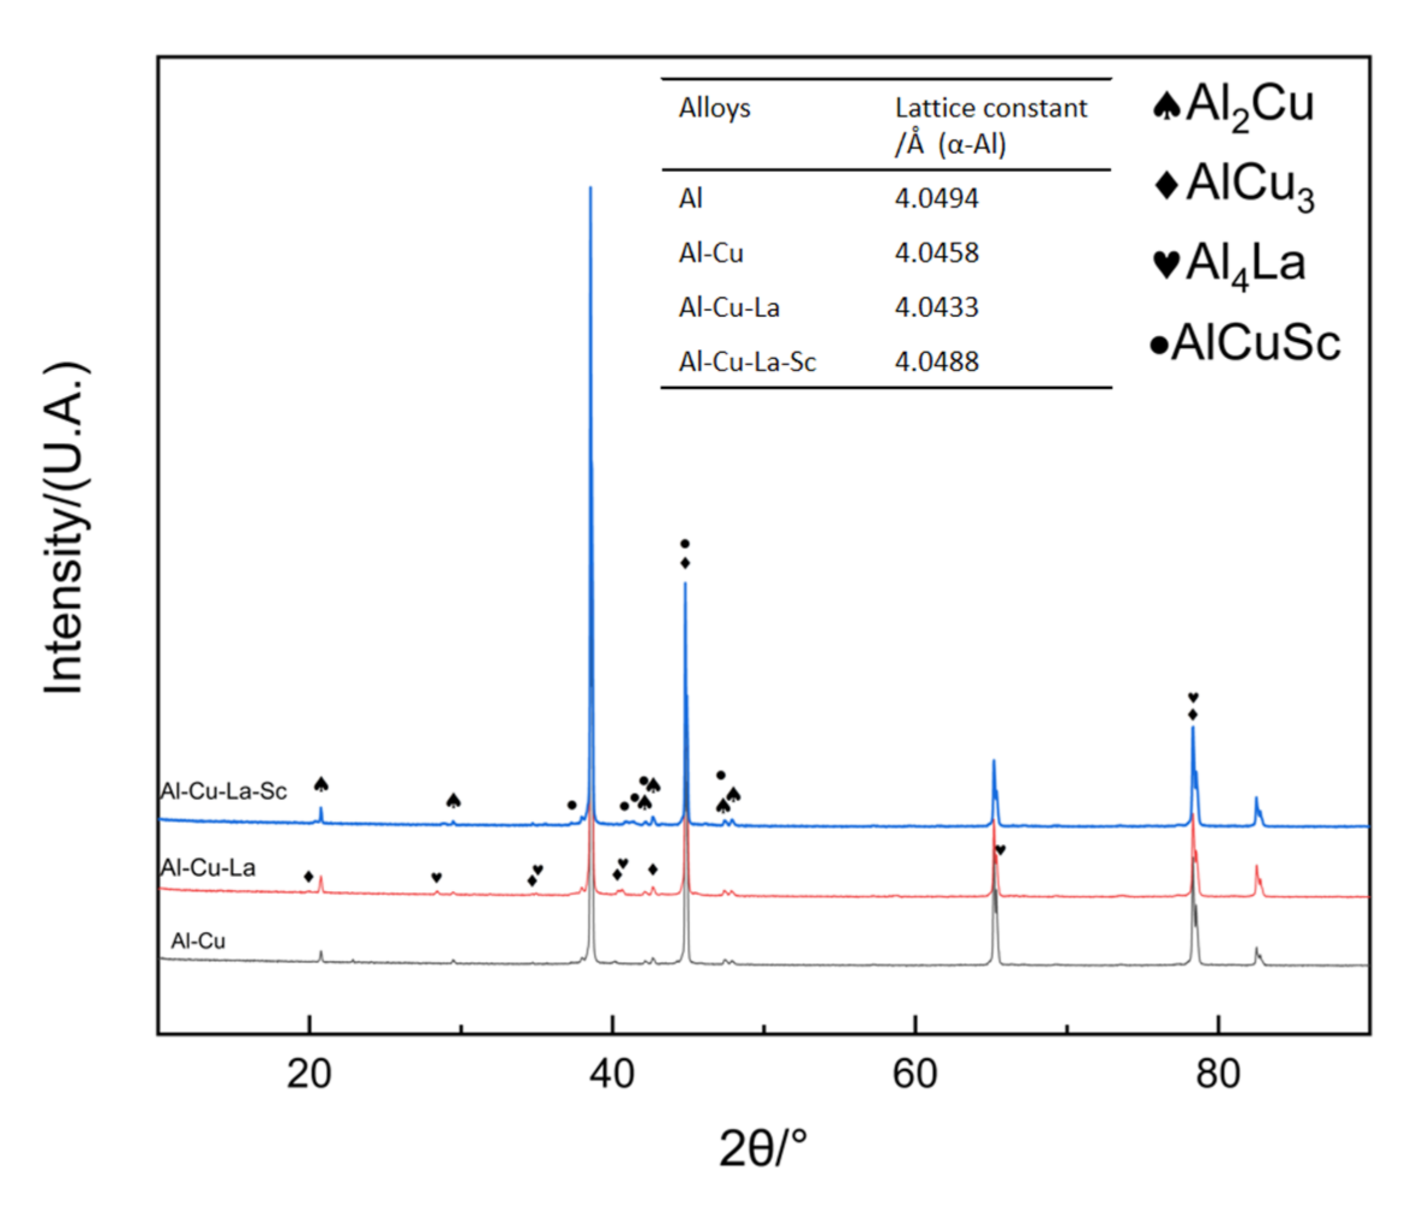
3.5. Lattice Distortion
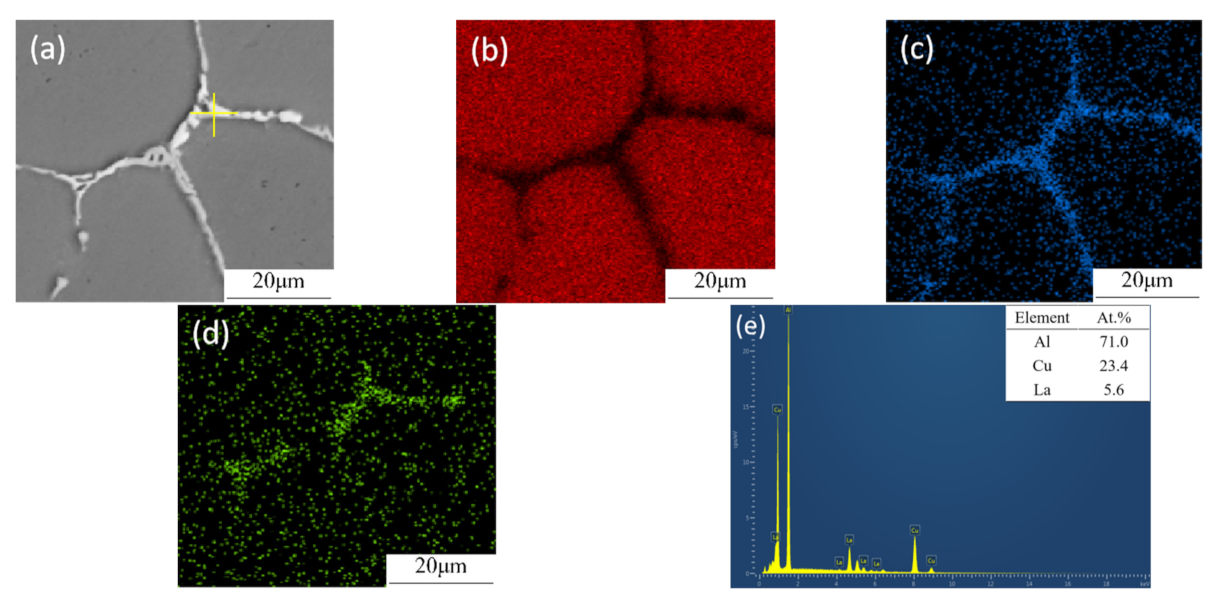
3.6. Intermetallic Compounds at Grain Boundaries
4. Discussion
4.1. Grain Refinement of Alloys with La and La + Sc Addition
4.2. Effect of La and La + Sc on the Porosity
4.3. Effect of Structure Change on Electron Transport
4.4. First-Principles Study of Intermetallic Compounds in Al-Cu, Al-Cu-La, Al-Cu-La-Sc Alloys
4.4.1. First-Principles Calculations for Mechanical Properties
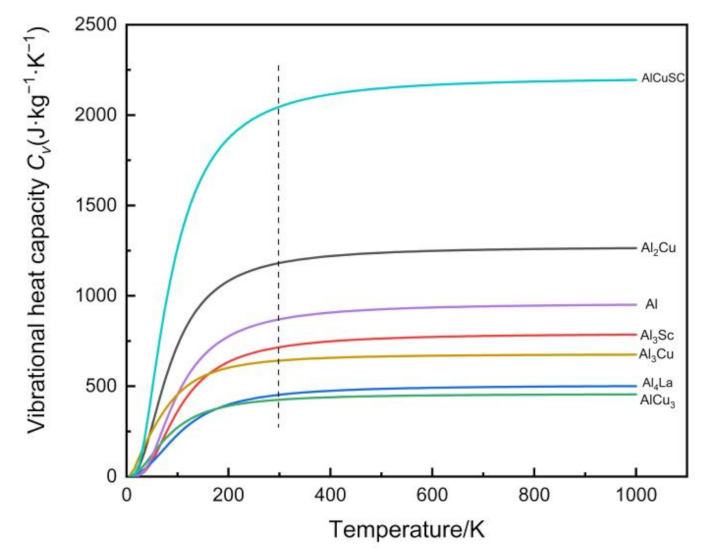
4.4.2. First-Principles Calculations for Vibrational Heat Capacity
4.4.3. Discussion on Thermal Diffusivity
5. Conclusions
- Adding La and La+Sc to Al-Cu alloy can significantly refine the α-Al matrix. The grain morphology changes from coarse dendrite to fine equiaxed crystal. The grain sizes of Al-Cu-La and Al-Cu-La-Sc alloys are 118.53 μm and 69.25 μm, respectively, which are 37.78% and 63.33% lower than the 188.89 μm of Al-Cu.
- La and La+Sc can significantly improve the mechanical properties and thermal conductivity of Al-Cu alloy. Al-Cu-La has the highest elongation of 10.35% ± 0.30%, which is 34.4% higher than the 7.70% ± 0.50% of Al-Cu. Al-Cu-La-Sc has the highest tensile strength and yield strength of 227.6 ± 5.0 MPa and 157.3 ± 3.6 MPa, which are 55.1% and 65.2% higher than the 146.7 ± 7.5 MPa and 95.2 ± 5.3 MPa of Al-Cu, respectively. The thermal conductivity of Al-Cu-La and Al-Cu-La-Sc are 206.286 W·m−1·K−1 and 199.667 W·m−1·K−1, respectively, which are 10.0% and 6.5% higher than 187.489 W·m−1·K−1 of Al-Cu.
- The properties of intermetallic compounds in alloys were calculated by first-principles calculations. Al4La and AlCu3 in Al-Cu-La have good ductility, but the vibrational heat capacity at 25 °C is very low. Al3Sc and AlCuSc in Al-Cu-La-Sc are brittle phases with high resistance to deformation. However, the toughness is poor, and the vibrational heat capacity is higher than Al4Cu and AlCu3. The first principle calculation provides another way for developing new alloy materials according to the performance requirements. The general change trend of alloy properties can be inferred without specific experiment.
Author Contributions
Funding
Institutional Review Board Statement
Informed Consent Statement
Data Availability Statement
Conflicts of Interest
References
- Janicki, M.; Napieralski, A. Modelling electronic circuit radiation cooling using analytical thermal model. Microelectron. J. 2000, 31, 781–785. [Google Scholar] [CrossRef]
- Li, J.; Lv, L.; Zhou, G.H.; Li, X.P. Mechanism of a microscale flat plate heat pipe with extremely high nominal thermal conductivity for cooling high-end smartphone chips. Energy Convers. Manag. 2019, 201, 112202. [Google Scholar] [CrossRef]
- Dong, Z.Q.; Wang, J.G.; Guan, Z.P.; Ma, P.K.; Zhao, P.; Li, Z.J.; Liu, T.S.; Yan, R.F. Effect of Short T6 Heat Treatment on the Thermal Conductivity and Mechanical Properties of Different Casting Processes Al-Si-Mg-Cu Alloys. Metals 2021, 11, 1450. [Google Scholar] [CrossRef]
- Li, S.B.; Yang, X.Y.; Hou, J.T.; Du, W.B. A review on thermal conductivity of magnesium and its alloys. J. Magnes. Alloys 2020, 8, 78–90. [Google Scholar] [CrossRef]
- Zhang, K.; Tao, P.; Zhang, Y.H.; Liao, X.P.; Nie, S.X. Highly thermal conductivity of CNF/AlN hybrid films for thermal management of flexible energy storage devices. Carbohyd. Polym. 2019, 213, 228–235. [Google Scholar] [CrossRef]
- He, T.; Chen, S.; Lu, T.; Zhao, P.; Chen, W.; Scudino, S. High-strength and ductile ultrafine-grained Al–Y–Ni–Co alloy for high-temperature applications. J. Alloys Compd. 2020, 848, 156655. [Google Scholar] [CrossRef]
- Cheng, W.; Liu, C.Y.; Huang, H.F.; Zhang, L.; Zhang, B.; Shi, L. High strength and ductility of Al-Si-Mg alloys fabricated by deformation and heat treatment. Mater. Charact. 2021, 178, 111278. [Google Scholar] [CrossRef]
- Ren, P.R.; Song, W.; Zhong, G.; Huang, W.Q.; Zuo, Z.X.; Zhao, C.Z.; Yan, K.J. High-cycle fatigue failure analysis of cast Al-Si alloy engine cylinder head. Eng. Fail. Anal. 2021, 127, 105546. [Google Scholar] [CrossRef]
- Karabay, S. Modification of AA-6201 alloy for manufacturing of high conductivity and extra high conductivity wires with property of high tensile stress after artificial aging heat treatment for all-aluminium alloy conductors. Mater. Des. 2006, 27, 821–832. [Google Scholar] [CrossRef]
- Zhai, F.L.; Wang, L.P.; Gao, X.; Feng, Y.C.; Zhao, S.C.; Wang, L. Study on Phases Formation and Modification Ability of Rare Earth Elements La, Ce, Sm and Er in Al-Zn-Mg-Cu-Zr Alloy. Trans. Indian Inst. Met. 2021, 74, 2639–2649. [Google Scholar] [CrossRef]
- Zheng, Q.J.; Jiang, H.X.; He, J.; Zhang, L.L.; Zhao, J.Z. Effect of micro-alloying La on precipitation behavior, mechanical properties and electrical conductivity of Al-Mg-Si alloys. Sci. China Technol. Sci. 2021, 64, 2012–2022. [Google Scholar] [CrossRef]
- Du, J.D.; Ding, D.Y.; Zhang, W.L.; Xu, Z.; Gao, Y.J.; Chen, G.Z.; You, X.H.; Chen, R.Z.; Huang, Y.W.; Tang, J.S. Effect of Ce addition on the microstructure and properties of Al-Cu-Mn-Mg-Fe lithium battery shell alloy. Mater. Charact. 2018, 142, 252–260. [Google Scholar] [CrossRef]
- Wang, L.Y.; Ye, B.; Bai, Y.; Zhao, B.B.; Ding, W.J. Effect of Zr and Sc micro-additions on the microstructure and mechanical properties of as-cast Al-5Ce alloy. Mater. Sci. Eng. A 2021, 822, 141654. [Google Scholar] [CrossRef]
- Mahmoud, M.G.; Samuel, A.M.; Doty, H.W.; Samuel, F.H. Effect of the Addition of La and Ce on the Solidification Behavior of Al-Cu and Al-Si-Cu Cast Alloys. Int. J. Met. 2019, 14, 191–206. [Google Scholar] [CrossRef]
- Røyset, J.; Ryum, N. Scandium in aluminium alloys. Int. Mater. Rev. 2005, 50, 19–44. [Google Scholar] [CrossRef]
- Li, Q.L.; Zhang, Y.S.; Lan, Y.F.; Pei, R.J.; Feng, X.Y.; Xia, T.D.; Liu, D.X. Effect of scandium addition on microstructure and mechanical properties of as-cast Al-5%Cu alloys. Vacuum 2020, 177, 109385. [Google Scholar] [CrossRef]
- Davydov, V.G.; Rostova, T.D.; Zakharov, V.V.; Filatov, Y.A.; Yelagin, V.I. Scientific principles of making an alloying addition of scandium to aluminium alloys. Mater. Sci. Eng. A 2000, 280, 30–36. [Google Scholar] [CrossRef]
- Bramfitt, B.L. The effect of carbide and nitride additions on the heterogeneous nucleation behavior of liquid iron. Metall. Mater. Trans. B. 1970, 1, 1987–1995. [Google Scholar] [CrossRef]
- Chen, X.Y.; Li, Q.A.; Chen, J.; Zhu, L.M. Microstructure and mechanical properties of Mg-Gd-Y-Sm-Al alloy and analysis of grain refinement and strengthening mechanism. J. Rare Earth 2019, 37, 1351–1358. [Google Scholar] [CrossRef]
- Shiran, M.K.G.; Khalaj, G.; Pouraliakba, H.; Jandaghi, M.R.; Dehnavi, A.S.; Bakhtiari, H. Multilayer Cu/Al/Cu explosive welded joints: Characterizing heat treatment effect on the interface microstructure and mechanical properties. J. Manuf. Process. 2018, 35, 657–663. [Google Scholar] [CrossRef]
- Jandaghi, M.R.; Saboori, A.; Khalaj, G.; Shiran, M.K.G. Microstructural Evolutions and its Impact on the Corrosion Behaviour of Explosively Welded Al/Cu Bimetal. Metals 2020, 10, 634. [Google Scholar] [CrossRef]
- Zhang, X.; Wang, Z.H.; Zhou, Z.H.; Xu, J.M. Influence of Rare Earth (Ce and La) Addition on the Performance of Al-3.0 wt%Mg Alloy. J. Wuhan Univ. Technol. 2017, 32, 611–618. [Google Scholar] [CrossRef]
- Elia, F.D.; Ravindran, C.; Sediako, D.; Kainer, K.U.; Hort, N. Hot tearing mechanisms of B206 aluminum-copper alloy. Mater. Des. 2014, 64, 44–55. [Google Scholar]
- Vlasceanu, M.S.; Lun, S.; Elsayed, A.; Ravindran, C. Effect of Al-5Ti-1B on grain refinement, dendrite coherency and porosity of AZ91E magnesium alloy. Int. J. Cast Met. Res. 2015, 28, 39–46. [Google Scholar] [CrossRef]
- Tian, L.; Anderson, I.; Riedemann, T.; Russell, A. Modeling the electrical resistivity of deformation processed metal-metal composites. Acta Mater. 2014, 77, 151–161. [Google Scholar] [CrossRef]
- Qin, R.; Yan, R.F.; Guan, Z.P.; Zhang, G.Q.; Song, J.W.; Ren, M.W.; Wang, J.G. Effect of vanadium on Fe-rich phase, mechanical properties and thermal conductivity of hypoeutectic Al-Si alloy. Mater. Res. Express 2021, 8, 026518. [Google Scholar] [CrossRef]
- Vandersluis, E.; Ravindran, C. The Role of Porosity in Reducing the Thermal Conductivity of B319 Al Alloy with Decreasing Solidification Rate. JOM 2019, 71, 2072–2077. [Google Scholar] [CrossRef]
- Zhang, C.; Du, Y.; Liu, S.H.; Liu, Y.L.; Sundman, B. Thermal conductivity of Al-Cu-Mg-Si alloys: Experimental measurement and CALPHAD modeling. Thermochim. Acta 2016, 635, 8–16. [Google Scholar] [CrossRef]
- Jandaghi, M.R.; Pouraliakbar, H. Elucidating the microscopic origin of electrochemical corrosion and electrical conductivity by lattice response to severe plastic deformation in Al-Mn-Si alloy. Mater. Res. Bull. 2018, 108, 195–206. [Google Scholar] [CrossRef]
- Perdew, J.P.; Burke, K.; Ernzerhof, M. Generalized Gradient Approximation Made Simple. Phys. Rev. Lett. 1996, 77, 3865–3868. [Google Scholar] [CrossRef] [Green Version]
- Vanderbilt, D. Soft self-consistent pseudopotentials in a generalized eigenvalue formalism. Phys. Rev. B 1990, 41, 7892–7895. [Google Scholar] [CrossRef] [PubMed]
- Pan, Y.; Pu, D.L.; Liu, G.H. Influence of Mo concentration on the structure, mechanical and thermodynamic properties of Mo-Al compounds from first-principles calculations. Vacuum 2020, 175, 109291. [Google Scholar] [CrossRef]
- Khan, M.I.; Arshad, H.; Rizwan, M.; Gillani, S.S.A.; Shakil, M.; Ahmed, S.; Shakil, M. Investigation of structural, electronic, magnetic and mechanical properties of a new series of equiatomic quaternary Heusler alloys CoYCrZ (Z = Si, Ge, Ga, Al): A DFT study. J. Alloys Compd. 2020, 819, 152964. [Google Scholar] [CrossRef]
- Mohri, T.; Ying, C.; Kohyama, M.; Ogata, S.; Saengdeejing, A.; Bhattacharya, K.S.; Wakeda, M.; Shinzato, S.; Kimizuka, H. Mechanical properties of Fe-rich Si alloy from Hamiltonian. npj Comput. Mater. 2017, 3, 100–106. [Google Scholar] [CrossRef] [Green Version]
- Pugh, S.F. XCII. Relations between the elastic moduli and the plastic properties of polycrystalline pure metals. Philos. Mag. 1954, 45, 823–843. [Google Scholar] [CrossRef]


| Alloy | Cu | La | Sc | Al |
|---|---|---|---|---|
| Al-4.8Cu | 4.72 | - | - | Bal. |
| Al-4.8Cu-0.4La | 4.85 | 0.38 | - | Bal. |
| Al-4.8Cu-0.4La-0.4Sc | 4.78 | 0.37 | 0.42 | Bal. |
| Crystal Plane Set | Al-Cu | Al-Cu-La | Al-Cu-La-Sc | |||
|---|---|---|---|---|---|---|
| 2θ/(°) | d-Spacing/Å | 2θ/(°) | d-Spacing/Å | 2θ/(°) | d-Spacing/Å | |
| {111} | 38.509 | 2.3359 | 38.534 | 2.3344 | 38.479 | 2.3376 |
| {200} | 44.763 | 2.0229 | 44.793 | 2.0216 | 44.729 | 2.0244 |
| {220} | 65.163 | 1.4304 | 65.209 | 1.4295 | 65.109 | 1.4315 |
| {311} | 78.313 | 1.2199 | 78.372 | 1.2191 | 78.245 | 1.2208 |
| {222} | 82.527 | 1.1679 | 82.590 | 1.1672 | 82.453 | 1.1688 |
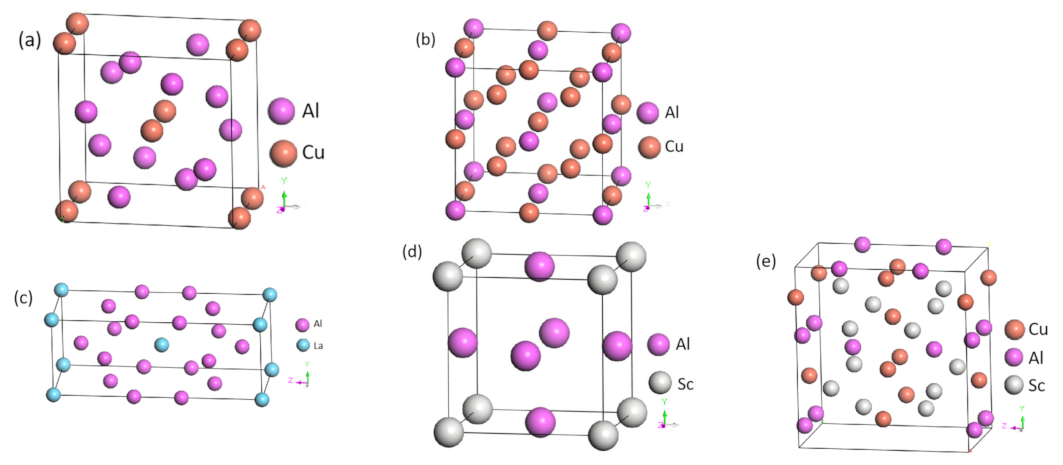
| Phase | Space Group | Crystal System | a(Å) | b(Å) | c(Å) |
|---|---|---|---|---|---|
| Al2Cu | I4/mcm | Tetragonal | 6.0379 | 6.0379 | 4.9351 |
| AlCu3 | Fm-3m | Cubic | 5.8369 | ||
| Al4La | I4/mmm | Tetragonal | 4.3558 | 4.3558 | 10.2396 |
| Al3Sc | Pm-3m | Cubic | 4.1173 | ||
| AlCuSc | Amm2 | Orthorhombic | 5.2007 | 5.2007 | 8.3881 |
| Phase | B | G | E | B/G | v |
|---|---|---|---|---|---|
| Al2Cu | 98.48 | 44.88 | 116.87 | 2.19 | 0.30 |
| AlCu3 | 135.69 | 43.75 | 118.52 | 3.10 | 0.35 |
| Al4La | 69.59 | 24.62 | 66.07 | 2.83 | 0.34 |
| Al3Sc | 84.20 | 71.25 | 166.72 | 1.18 | 0.17 |
| AlCuSc | 123.99 | 60.69 | 156.52 | 2.04 | 0.28 |
Publisher’s Note: MDPI stays neutral with regard to jurisdictional claims in published maps and institutional affiliations. |
© 2021 by the authors. Licensee MDPI, Basel, Switzerland. This article is an open access article distributed under the terms and conditions of the Creative Commons Attribution (CC BY) license (https://creativecommons.org/licenses/by/4.0/).
Share and Cite
Song, Z.-X.; Li, Y.-D.; Liu, W.-J.; Yang, H.-K.; Cao, Y.-J.; Bi, G.-L. Effect of La and Sc Co-Addition on the Mechanical Properties and Thermal Conductivity of As-Cast Al-4.8% Cu Alloys. Metals 2021, 11, 1866. https://doi.org/10.3390/met11111866
Song Z-X, Li Y-D, Liu W-J, Yang H-K, Cao Y-J, Bi G-L. Effect of La and Sc Co-Addition on the Mechanical Properties and Thermal Conductivity of As-Cast Al-4.8% Cu Alloys. Metals. 2021; 11(11):1866. https://doi.org/10.3390/met11111866
Chicago/Turabian StyleSong, Zhao-Xi, Yuan-Dong Li, Wen-Jing Liu, Hao-Kun Yang, Yang-Jing Cao, and Guang-Li Bi. 2021. "Effect of La and Sc Co-Addition on the Mechanical Properties and Thermal Conductivity of As-Cast Al-4.8% Cu Alloys" Metals 11, no. 11: 1866. https://doi.org/10.3390/met11111866
APA StyleSong, Z.-X., Li, Y.-D., Liu, W.-J., Yang, H.-K., Cao, Y.-J., & Bi, G.-L. (2021). Effect of La and Sc Co-Addition on the Mechanical Properties and Thermal Conductivity of As-Cast Al-4.8% Cu Alloys. Metals, 11(11), 1866. https://doi.org/10.3390/met11111866