Article

Experimental and Numerical Investigations of In Situ Alloying during Powder Bed Fusion of Metals Using a Laser Beam

1
Institute for Machine Tools and Industrial Management, Technical University of Munich, Boltzmannstr. 15, 85748 Garching, Germany
2
Chair of Aerodynamics and Fluid Mechanics, Technical University of Munich, Boltzmannstr. 15, 85748 Garching, Germany
*
Author to whom correspondence should be addressed.
Metals 2021, 11(11), 1842; https://doi.org/10.3390/met11111842
Submission received: 16 October 2021 / Revised: 10 November 2021 / Accepted: 14 November 2021 / Published: 16 November 2021
(This article belongs to the Special Issue Advances in Additive Manufacturing of Metals)

Abstract

:
Powder Bed Fusion of Metals using a Laser Beam (PBF-LB/M) is increasingly utilized for the fabrication of complex parts in various industrial sectors. Enabling a robust and reproducible manufacturing process is one of the main goals in view of the future success of PBF-LB/M. To meet these challenges, alloys that are specifically adapted to the process are required. This paper demonstrates the successful interplay of simulation studies with experimental data to analyze the basic phenomena of in situ alloying. The meshless Smoothed-Particle Hydrodynamics (SPH) method was employed for the numerical simulation of two-component powder systems considering both thermodynamics and fluid mechanics in the solid and the melt phase. The simulation results for the in situ alloying of stainless steel 316L blended with the aluminum alloy AlSi10Mg were enriched and validated with the data from a novel experimental test bench. The combination of both approaches can enhance the understanding of the process for in situ alloying. Therefore, future investigations of the PBF-LB/M process with multi-component powder systems can benefit from detailed numerical studies using SPH.

1. Introduction and State of the Art

Initially employed for rapid prototyping only, Powder Bed Fusion of Metals using a Laser Beam (PBF-LB/M) recently achieved a technology-readiness level suitable for series production [1]. In addition to its almost unrestricted geometrical design possibilities, a major advantage compared to the traditional manufacturing processes is the easy access to customized powders. Tailored material combinations allow one both to control the printing process and to improve the particular part characteristics, such as the strength, the hardness, and the corrosion behavior [2]. In recent years, there have been just a few commercially available alloys on the market [3], and most of these alloys were originally designed for conventional manufacturing processes such as forging and drawing only. In contrast, the PBF-LB/M process is characterized by a high energy input in a small volume resulting in unstable melt pools and rapid solidification. Zhao et al. [4] and Martin et al. [5] demonstrated that the formation of porosities is associated with unstable melt pools. Alloys that are specifically designed for the process are able to improve the melt pool stability or alter the melting and the solidification behavior. Montero-Sistiaga et al. [6] showed that adding 4 wt.% silicon to the aluminum alloy 7075 significantly reduced the number of microcracks.
A simple but effective approach manipulating the melt pool dynamics and the printing result is to blend a commercially available powder with additives. The blend is then mixed together in the liquid phase during the PBF-LB/M process, also called in situ alloying. Wimmer et al. [7] showed experimentally that the in situ alloying of a stainless steel 316L powder blended with small amounts of the aluminum alloy AlSi10Mg can alter the temperature fields of the melt pool and the sensitivity to cracking during PBF-LB/M. The key effect was attributed to the difference in the thermal conductivity and the surface tension of both alloys. As the surface tension of AlSi10Mg is characterized by almost half the surface tension of 316L and is less sensitive to temperature variations [8,9], the Marangoni effects are significantly reduced with a high impact on the melt pool dynamics. Wimmer et al. [10] showed an increasing melt pool stability with increasing Al content, which was attributed to the Marangoni convection.
However, experimental investigations can only partially observe the physical quantities and mechanisms of action that are responsible for the melt pool dynamics and the solidification behavior. Numerical modeling is therefore necessary to capture a holistic view of the effects in the melt pool.
The classical simulation approaches following Eulerian descriptions, e.g., Finite-Volume, Finite-Difference or Finite-Element methods, have been applied to PBF-LB/M in the past [11,12,13,14]. However, considering the complex physics including multiple phase interfaces, phase change phenomena, variable surface tension, and violent interface deformation and fragmentation, these methods are strongly limited in their applicability by the nature of the schemes. As a remedy, particle-based Lagrangian methods have gained strong interest as they are naturally suited for this application. Here, the Smoothed-Particle-Hydrodynamics (SPH) method was employed for discretization of the governing equations. Originally developed for astrophysical problems [15,16], SPH has proven its capabilities for complex fluid mechanical problems such as the PBF-LB/M process. Further information on the state of the art in SPH modeling can be found, amongst others, in Ye et al. [17]. Opposed to the advantage of the capability for complex multi-phase modeling with SPH, the freely advecting particle system unfortunately challenges the computational efficiency. This higher cost as compared to grid-based approaches is typically counteracted by utilizing GPU computing [18,19].
Russell et al. [20] used the Smoothed-Particle Hydrodynamics (SPH) method to model the PBF-LB/M process in two dimensions. An isothermal incompressible framework was formulated to simulate liquid metals under the consideration of a thermal expansion. The PBF-LB/M process was modeled for a particle bed, where every third particle was given twice the thermal conductivity of its neighbors. They showed that this localized higher thermal conductivity is sufficient to increase the global heat transfer into the powder material. This led to a deeper melt pool and an increased rate of solidification.
Weirather et al. [21] modeled the PBF-LB/M process with a three-dimensional weakly compressible multi-phase SPH formulation. In their model, the effects of thermal conduction, laser absorption, phase-change (melting and solidification), Marangoni forces, and evaporation (recoil pressure) are considered. The simulation results were compared to the experimental ex situ data and showed good agreement. This work demonstrated the feasibility of the SPH method for simulating the complex PBF-LB/M process. However, within their one-component formulation, multi-component effects cannot be considered.

1.1. Problem Statement

According to the state of the art, a three-dimensional multi-component model for the PBF-LB/M process, which is capable of representing a variable diffusivity and its temperature-dependence would increase the process understanding of the in situ alloying.

1.2. Approach

In this paper, the authors’ existing SPH framework [21] was extended to account for the in situ alloying by solving an additional advection-diffusion equation for the additive concentration. The code implementation builds on OpenFPM, a scalable and open C++ framework for particles and mesh simulations [18]. This package allows performing efficient SPH simulations on distributed multi-CPU architectures or on GPU hardware. There exist many variants of SPH, e.g., truly incompressible SPH [22,23] or δ -SPH [24]. Here, the weakly-compressible approach [25] was used due to it’s algorithmic simplicity. It is known that classical SPH is non-gauge free and suffers from numerical dissipation. This deficiency is eliminated with the use of the transport-velocity formulation [26]. The phase-change model including tracking of different types [27,28] utilizes the Lagrangian nature of the method. Each fluid phase is tracked with a separate set of particles, thus no additional interface information is required. Complex phase interactions are handled implicitly by different inter-particle forces between neighboring particles. Since the powder and the fluid phases are represented with SPH particles, the generalized wall-boundary condition [29] was applied. Following [30], this boundary condition is well utilized for arbitrary geometries such as the solid - melt interface. The species transport of the additive components is modeled similarly to the energy transport [31,32]. Where available, temperature-dependent material data were taken from the literature. The fully coupled material model uses mixture quantities for all relevant properties (see Appendix A).
For the experiments, a novel PBF-LB/M test bench was used that is capable of monitoring the melt pool dynamics via high-speed thermographic imaging. The macroscopic melt pool lengths of the steady-state simulation results and the experimental observations were compared for various powder blends. In addition, segregated alloy particles in the final solidified material were evaluated regarding their concentration profile and compared to the simulation results.

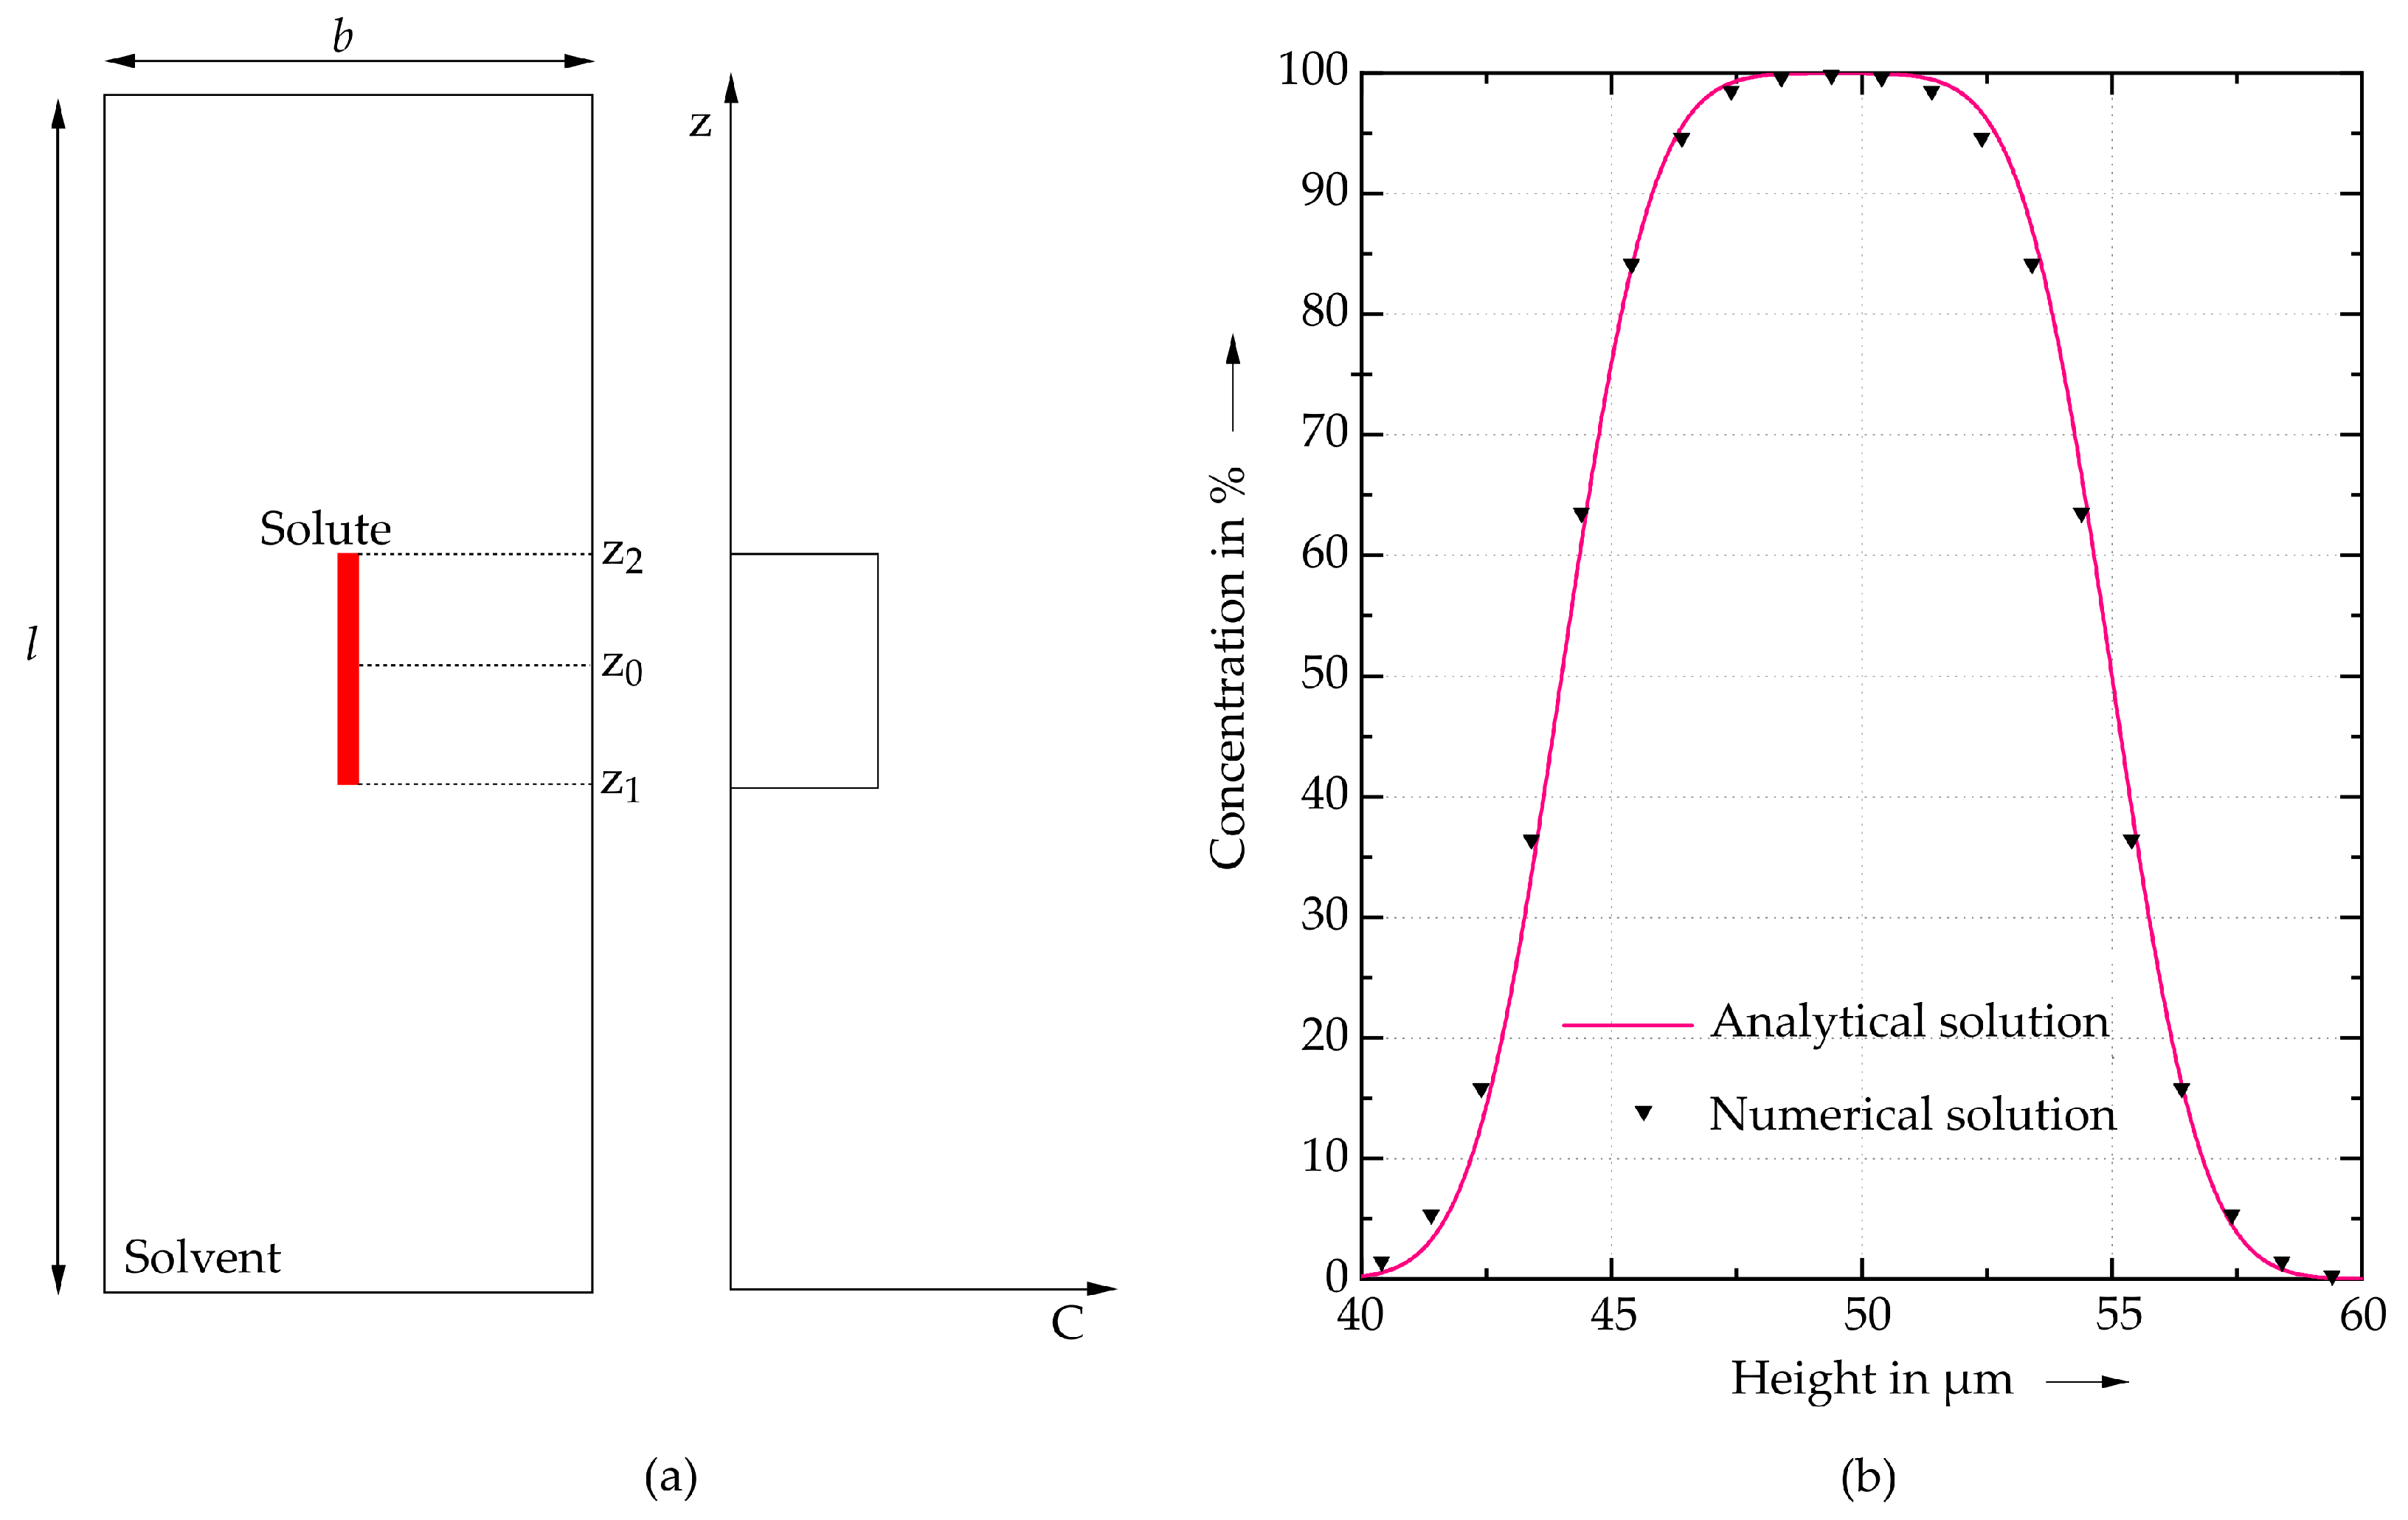
2. Numerical Modeling of the In Situ Alloying

This section focuses on the novel alloy model. For more details and verification of the general solver, we refer to our previous work [21].

Alloy Species Transport

The mixing of additives with the main powder occurs within the liquid melt phase and is governed by advection and diffusion. The temperature-dependent diffusivity of liquids and gases can reach millimeters or centimeters per second. For solids, this effect is usually slow and therefore neglected [33]. Following the Fickian diffusion [34], the material transport equation of an alloy component is given by
d C i d t = D i 2 C i ,
where C i and D i denote the tracer concentration and the temperature-dependent diffusivity of the SPH particle i, respectively. It should be noted that the advective transport is naturally considered by the Lagrangian formulation.
The discretized form of the alloy material transport Equation (1) is given by [32,35]
d C i d t = 1 ρ i j = 1 N V j 4 D i D j D i + D j ( ρ i + ρ j ) r i j i W i j r i j 2 + η 2 C i C j .
Here, η is the dynamic viscosity, V j is the volume of particle j, W i j = W ( r i r j , h ) is a kernel function with the smoothing length h, r i j = | r i r j | is the distance between two particles, ρ i and ρ j are the densities, C i and C j are the concentrations, and D i and D j denote the diffusivities of the respective SPH particles. It should be noted that this conservative formulation was chosen out of several existing discretizations since the density variation between the solid and liquid alloy phase was neglected in this work. The evolution of the concentration equation was added to the velocity-verlet time-integration scheme of the fluid solver. Similarly to a predictor-corrector approach, the concentration of each SPH particle was advanced as follows:
C n + 1 2 = C n + 0.5 Δ t d C d t n
C n + 1 = C n + 1 2 + 0.5 Δ t d C d t n + 1 2
where the indices n, n + 1/2, and n + 1 denote the values at the start, in the middle, and at the end of a time step, respectively. To ensure a stable time integration, the numerical time-step Δ t is chosen as the minimum condition of the relevant criteria according to Morris et al. [36]. Adding the transport equation for an additive concentration gives another limiting condition similar to the viscous time-step criterion:
Δ t c = 0.125 h 2 D max ,
where D max is the maximum diffusivity occurring in the simulated setup, h is the smoothing length, and Δ t c is the time-step criterion for the diffusion condition.
To implement the temperature-dependent diffusivity of 316L and AlSi10Mg in the numerical model, the alloy combination is simplified to an Fe-Al system due to the lack of material data for both alloys.
The diffusivity of each particle D i is determined using the data of [37]. In order to obtain an analytic function, the data weree curve-fitted by
D i = a exp ( b T i ) ,
with the curve fitting parameters
a = 8.34 · 10 5 m 2 s and
b = 2.62 · 10 4 K .
T i is the temperature of the SPH particle i. The stainless steel 316L and the aluminum alloy AlSi10Mg exhibit diverse thermophysical properties. As each SPH particle represents a material volume including potentially both components, the material mixture properties are locally approximated using the mass concentrations as weighting.
As a verification of the alloy transport equation, the diffusion process of a concentration jump in a non-moving solute is presented here. The analytical solution of this problem is given as [35]
C ( z , t ) = C 0 2 erfc z 1 z 4 D c t for z z 0
C ( z , t ) = C 0 2 erfc z z 2 4 D c t for z > z 0 ,
where C 0 is the initial concentration jump, z 1 and z 2 define the initial concentration profile, z 0 is the midpoint of the initial concentration profile, D c is the constant diffusivity, and t denotes the time. The simulation setup with the chosen material parameters is given in Table 1. The quasi one-dimensional problem was initialized in a two-dimensional domain with characteristic length-scales of the target application. A comparison of the analytical solution with the numerical simulation of the concentration profile at the time instant ( t = 1.0 s) is shown in Figure 1. Already for the moderate numerical resolution with the particle spacing Δ x = 1 µm, a good agreement between the analytical and the numerical solutions was found.

3. Experiments

The simulation model was validated with the experimental data of a single-track experiment using the novel test bench [10]. Following the usual practice, the geometrical information of the molten pool was used to quantify the accuracy of the simulation results on a global scale [21,38,39]. In contrast to the validation with ex situ data, which uses microsections over several millimeters, this work provides in situ validation data on a spatial resolution that is equal to the one used in the simulation. To the best of the authors’ knowledge, for the first time cross-sectional thermographic, images of the melt pool were used to validate the simulation results of the PBF-LB/M process.

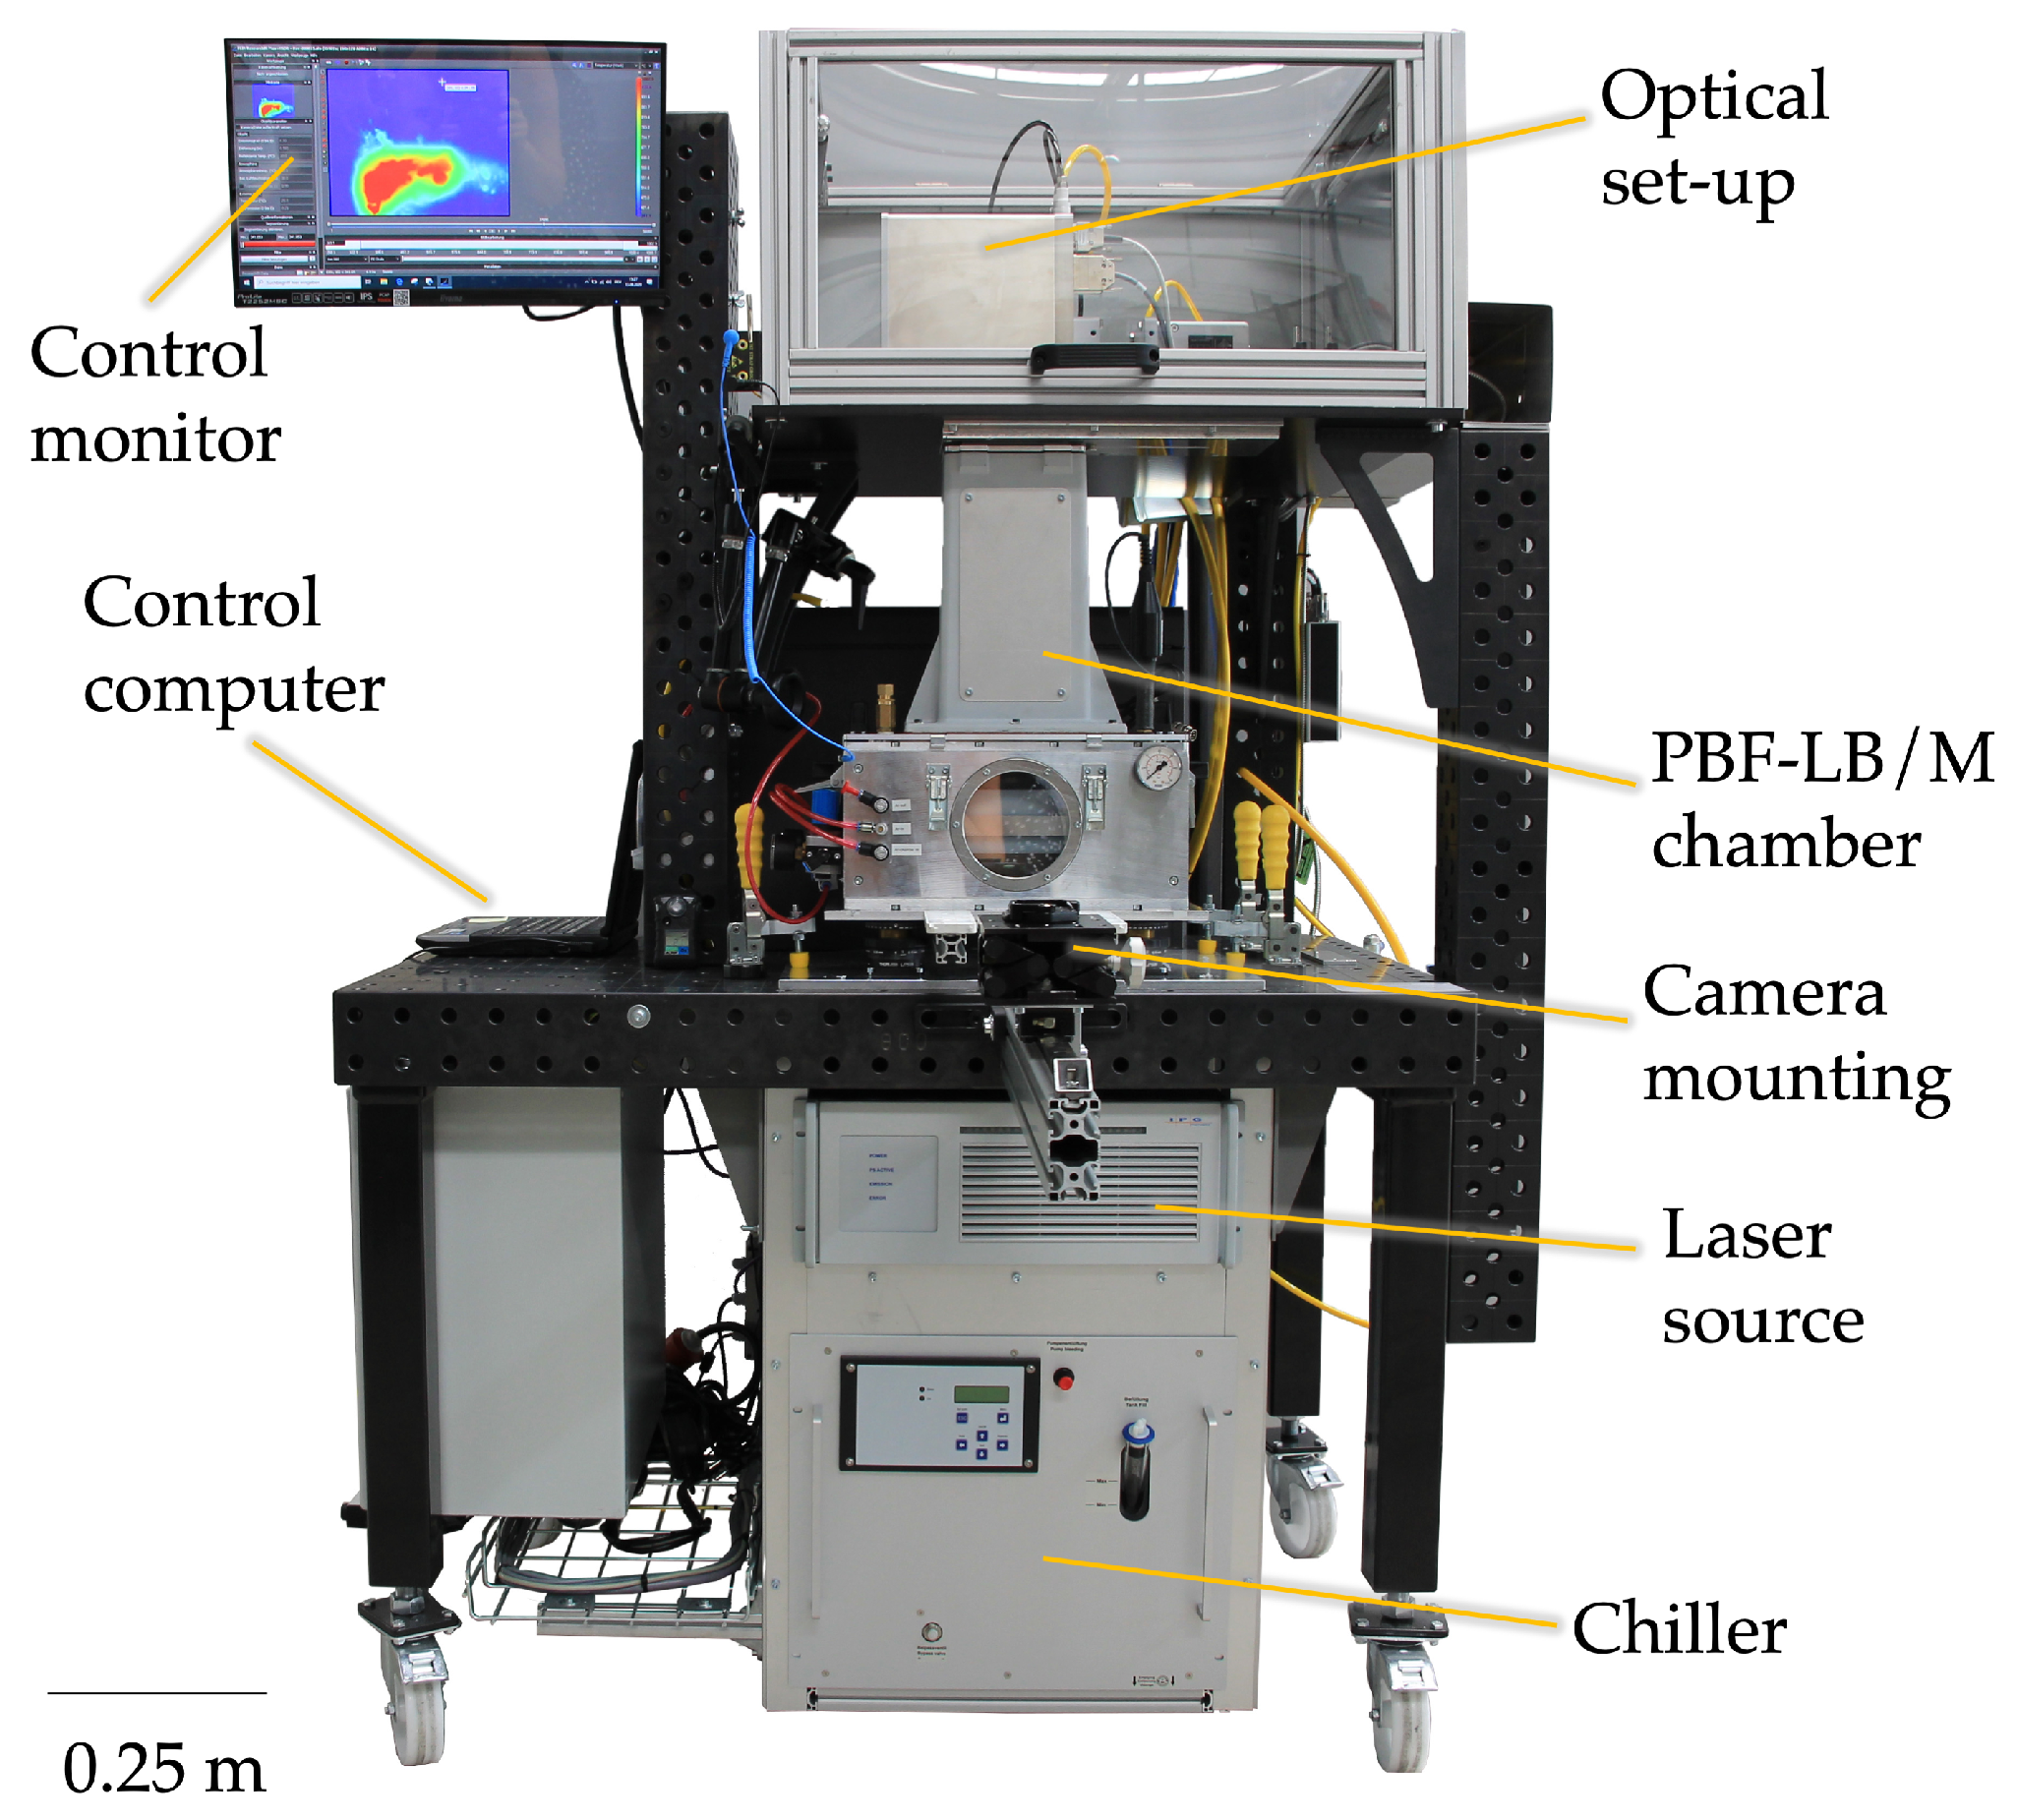
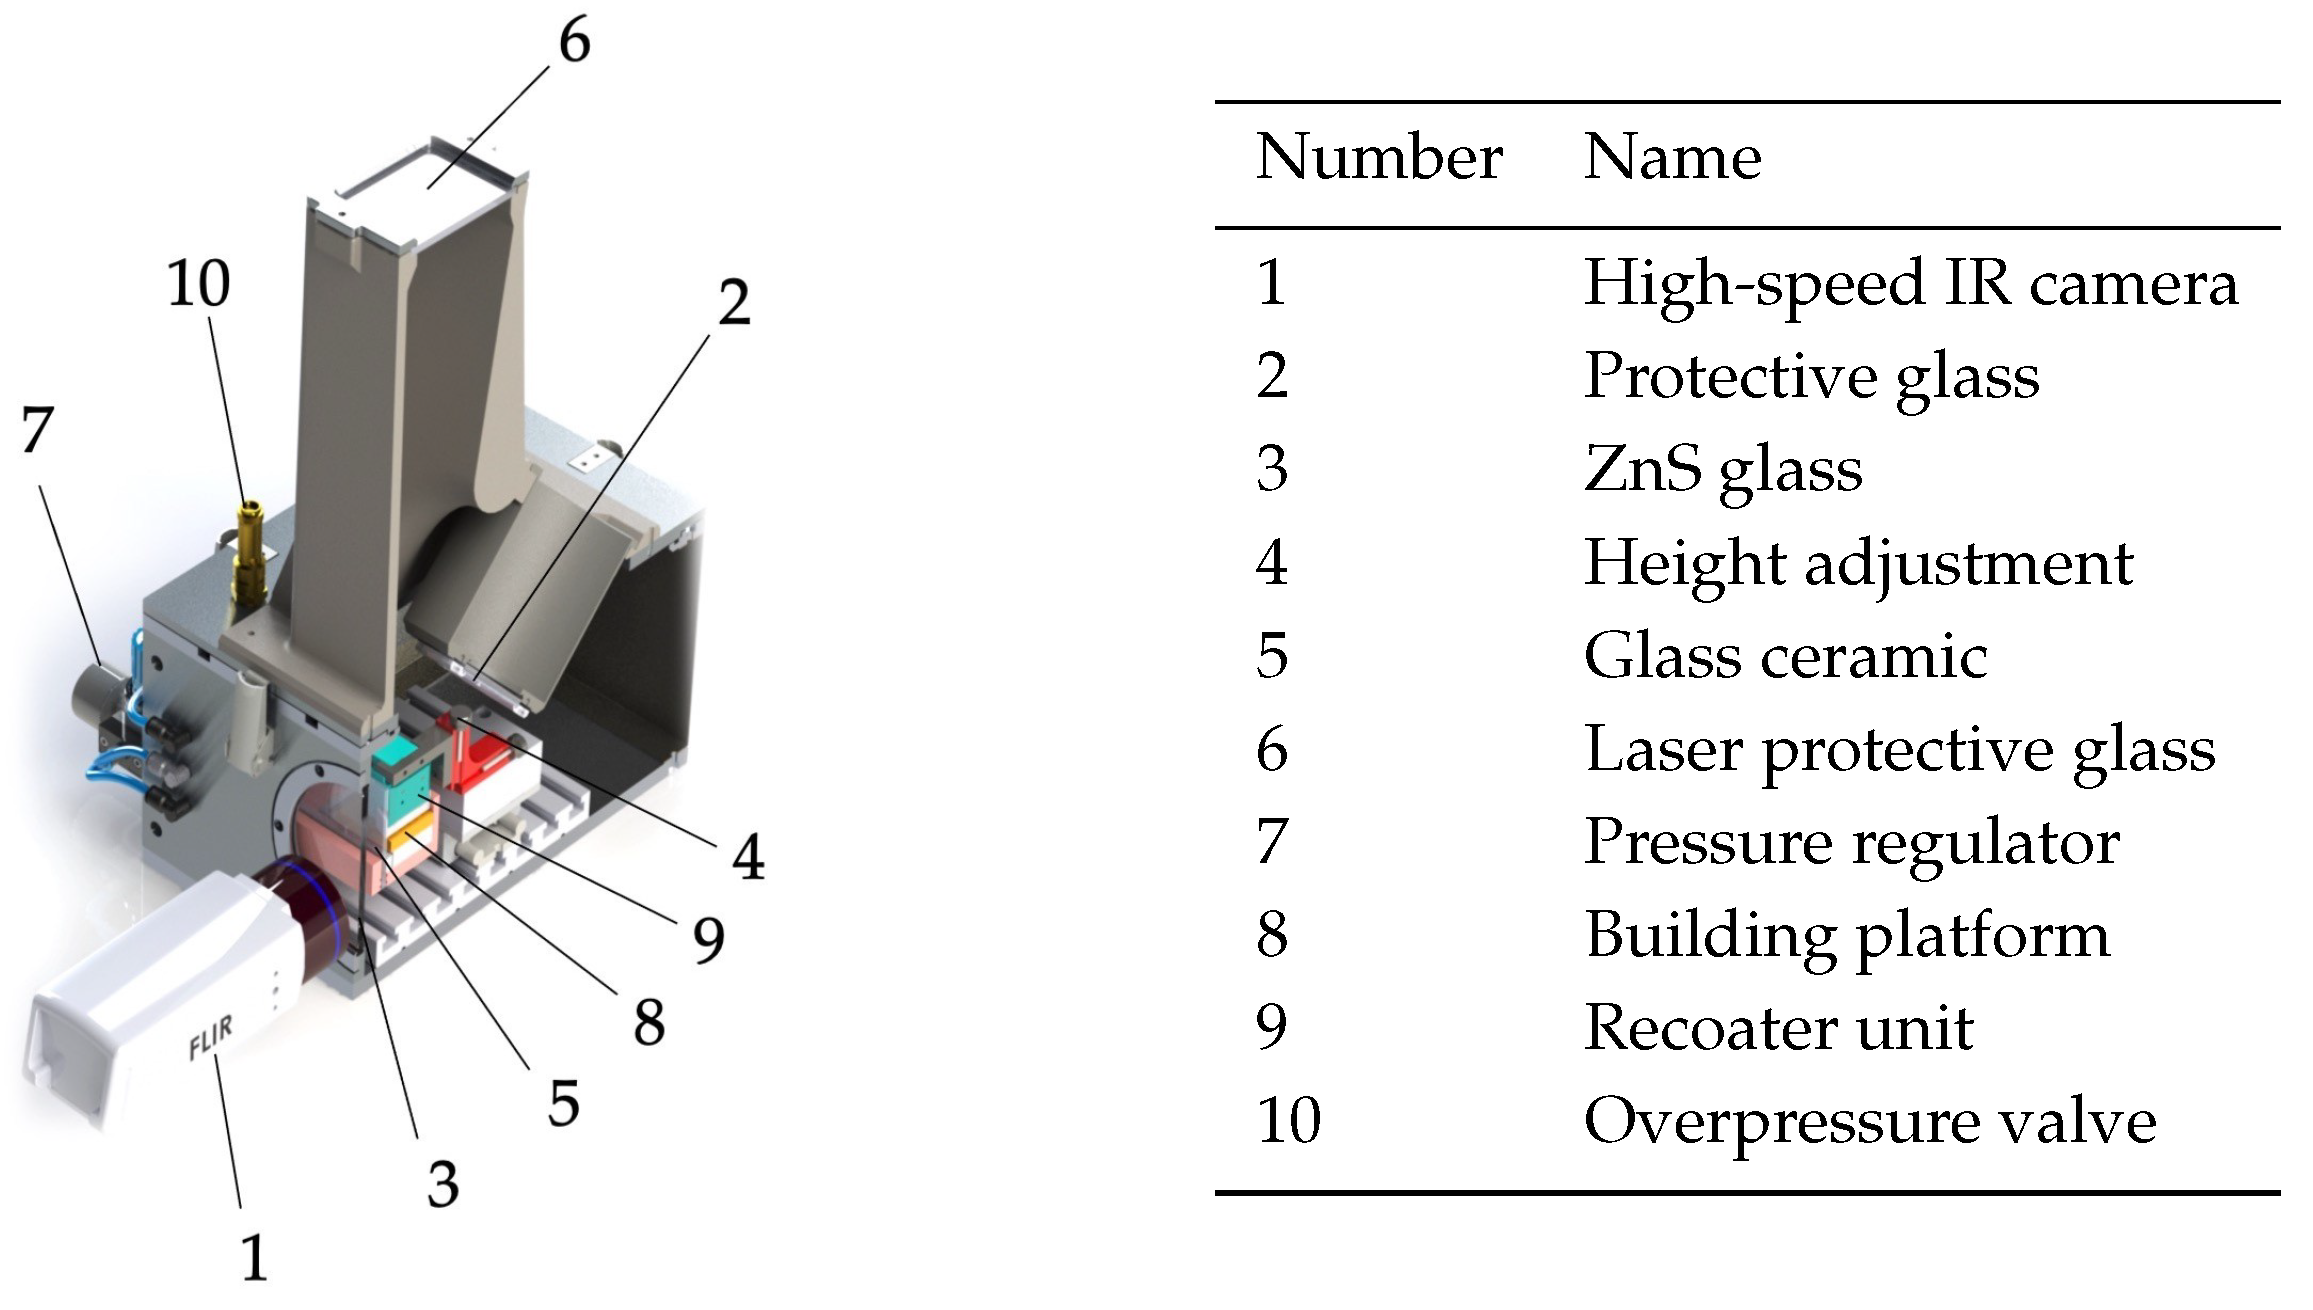
3.1. Experimental Setup

The experiments were carried out in a novel laser test bench (see Figure 2) for the process monitoring of the PBF-LB/M process. It consists of a 1000 W fiber laser (IPG YLR-1000-WC-Y14), a thermographic high-speed infrared camera (FLIR X69000sc) with a FLIR precision optics (100 mm focal length), and an optical setup. The optical setup includes a breadboard (Thorlabs), on which several optical instruments are mounted and aligned for an open beam path. The beam is expanded by a collimator (IPG D50-F200) and is then guided through the scanning systems for area irradiation (Scanlab intelliSCAN III30) and beam waist variation (Scanlab varioSCAN de40i). The observed window of the camera was resolved with 96 × 40 pixels. To increase the imaging scale, distance rings with a length of 68.5 mm were used. With this resolution and the hardware settings, a maximum frame rate of 9762.5 Hz was achieved.
Figure 3 depicts a schematic close-up of the experimental chamber, which allows us to observe the cross-section of the melt pool. The setup enables single or multiple powder layers over an area of 39 × 70 mm 2 with a variable powder layer thickness from 1 µm up to 600 µm. The components of the setup are designed to quickly remove the powder and for an easy access to the chamber for cleaning. In consequence, the setup is well-suited for investigating different powder mixtures.

3.1.1. Calibration of the Thermographic Imaging System

With the chosen scanning speed of 0.375 m/s, the image details set on the camera, and the frame rate of 9762.5 Hz, the melt pool appeared on about 44 frames within the resolved window. Due to the high number of frames and the unstable emissivity in the liquid phase, the melt pool geometry was evaluated with an automated algorithm that uses a reference temperature at the point of the phase transition [40]. Thus, the melt pool geometry was determined independently of the emissivity.
The transmission spectra of the glass ceramic and the ZnS glass were evaluated to enable the calibration of the transmission coefficient. With a spectral range of 3 to 5 µm (range of the lens setup used), the ZnS glass has a mean transmission of 72.57%, while the glass ceramic has 43.13%. This results in a combined transmission of 31.30%.
To analyze the melt pool geometry with high precision, it is crucial to know the exact pixel size of the image. By using distance rings, the pixel size deviates from the one declared by the manufacturer. To determine the exact size, the pixels were calibrated with the same setup used for the experiments. A glass scale with a resolution of 100 µm was used. The scale was placed in the chamber, and a soldering iron was used as a heat source. The difference in the thermal radiation between the stripes and the glass was analyzed with the high-speed IR camera. This method was performed for the horizontal axis and the vertical axis and resulted in a pixel length and height of 17.6 µm considering a quadratic pixel size at an orthogonal view.

3.1.2. Experimental Approach

The powder bed and laser properties of the experiments are summarized in Table 2. The optimal parameter settings were determined with preliminary studies. Note that in this paper the unit wt.% is used to indicate the amount of AlSi10Mg additives in relation to the whole powder blend, and the concentration C (in %) is the amount of AlSi10Mg at a specific location.
To demonstrate the effect of additives on the melt pool stability, three settings with different amounts of AlSi10Mg additives were investigated. The stainless steel 316L powder was obtained from Oerlikon (d 50 = 15.4 µm) and, for the AlSi10Mg additives, the powder of SLM Solutions (d 50 = 11.3 µm) was used. During the experiments, a 316L plate with dimensions 39 × 70 × 8 mm 3 served as a building platform. The plate was sandblasted on the upper surface to provide a better adhesion for the powder particles during coating. The laser beam was positioned at the edge of the building platform so that the high-speed IR camera was capable of observing the melt pool in the cross-section. Preliminary geometry-studies (microsections) of the solidified tracks showed no statistically significant differences between the single-melt tracks in the center or at the edge of the building platform.

3.2. Simulation Setup

The described numerical method was used to replicate the single-track experiments in the simulation. The process parameters were selected according to the experiments (see Table 2). For a reasonable comparison with the experiments, the simulation was performed with all available physical models including the gravity, the friction, the surface tension with thermocapillary effects, the heat conduction, the phase changes, the vaporization effects (recoil pressure), and the alloy species diffusion. The numerical parameters are summarized in Table 3. The chosen spatial resolution results in a total of 1.3 × 10 6 particles. To generate the powder particles utilized in the PBF-LB/M process, the algorithm of Zhou et al. [41] was used. The powder particles are generated according to a drop-and-roll mechanism and therefore consist of multiple SPH particles. With regard to the experimental validation, a similar median value (d 50 = 13.7 µm) of the Particle Size Distribution (PSD) was used. The material properties of the stainless steel 316L and the aluminum alloy AlSi10Mg used for the simulations are listed in Appendix A (Table A1 and Table A2).

4. Results and Discussion

The simulation model is validated by comparing the simulated melt pool lengths with the experimental data from single-melt tracks. The melt pool length is defined as the distance between the onset and the end of the liquid region in the scanning direction for a given steady-state time-step. This definition is used both for the experimental data as well as for the simulations. In addition, the mixing characteristic of the AlSi10Mg additives with the 316L base powder is compared after the solidification.
Figure 4 illustrates the SPH representation of the powder blend at the initial condition (a) and after the melting (b). The colormap indicates the concentration of AlSi10Mg in percent for the respective SPH particle. Figure 4b shows both the solid phase and the melted regions with respective alloy concentration fields. It should be noted that for different amounts of additives, i.e., 1 wt.% and 5 wt.% AlSi10Mg, the overall shape of the melt pool is unaffected. However, at identical time instances, the observed liquid regions in the experiments and in the simulations are larger for the powder blends with a high amount of AlSi10Mg additives. This expected behavior is due to the fact that the liquidus temperature of AlSi10Mg is much lower than the liquidus temperature of 316L. The quantitative comparison of the melt pool lengths between the experiments and simulations is shown in Figure 5 for the different powder blends. The experimental results show a clear monotonic increase in the melt pool length with an increasing additive content. The simulations confirm this tendency: the virtual melt pool lengths for 316L with additives match with the experiments within the standard deviation σ . However, comparing the simulation and the experimental results for the 316L without additives shows that the data overlap only with 2 σ . Possible reasons for this might be, on the one hand, inaccuracies of the material models used and, on the other hand, a viscosity that is assumed to be too small. Interestingly, the higher the AlSi10Mg content, the higher is the spread of the melt pool, which can be used to alter the resolution of the printed parts. In addition, the longer-lasting liquid areas could also allow the control of emerging defects. Note that the numerical setting is neither fine-tuned nor adjusted to match the current experimental data. Instead, a validated physical model implementation was used together with literature data for the material parameter. The simulation results demonstrate that the SPH method is capable of reproducing the fundamental physical phenomena, which results in overall good agreement with the experimental data.
The experimental distribution of a single AlSi10Mg powder particle, which was melted and solidified at the edge of the melt pool, was investigated via Scanning Electron Microscopy (SEM; JEOL JSM-IT200, magnification 1600, acceleration voltage 30 kV) and Energy-Dispersive X-ray Spectroscopy (EDS; energy resolution 129 eV, take-off angle 35 ). Figure 6 shows an SEM image of a solidified track in the longitudinal direction with a superimposed EDS mapping of AlSi10Mg. A single AlSi10Mg powder particle is depicted at the top of the image in orange color. This qualitative image was quantitatively evaluated with two line scans and compared with the simulation result of an AlSi10Mg powder particle in a similar position (Figure 7). Both results demonstrate a mixing in depth and in lateral direction. Due to the marginal advection of a powder particle at the edges of the melt, the concentration profile of AlSi10Mg is dominated by diffusion effects.
The deviation of the simulation result in the lateral direction between 6 and 9 µm may be caused by a differing cross-section position of the analyzed particle. However, the overall mixing behavior shows very good agreement between the simulation and the experiment. Due to the fact that the dissolution of the AlSi10Mg powder particle is not complete, this can lead to inclusions that can impair mechanical properties.

5. Conclusions and Outlook

This paper presents a framework to investigate the basic phenomena of the in situ alloying of stainless steel 316L with the aluminum alloy AlSi10Mg during PBF-LB/M. The numerical simulation results were complemented and validated with experiments. The main findings are summarized in the following:
  • The powder blends consisting of 316L and AlSi10Mg were successfully simplified with an Fe-Al system using curve-fitted material parameters.
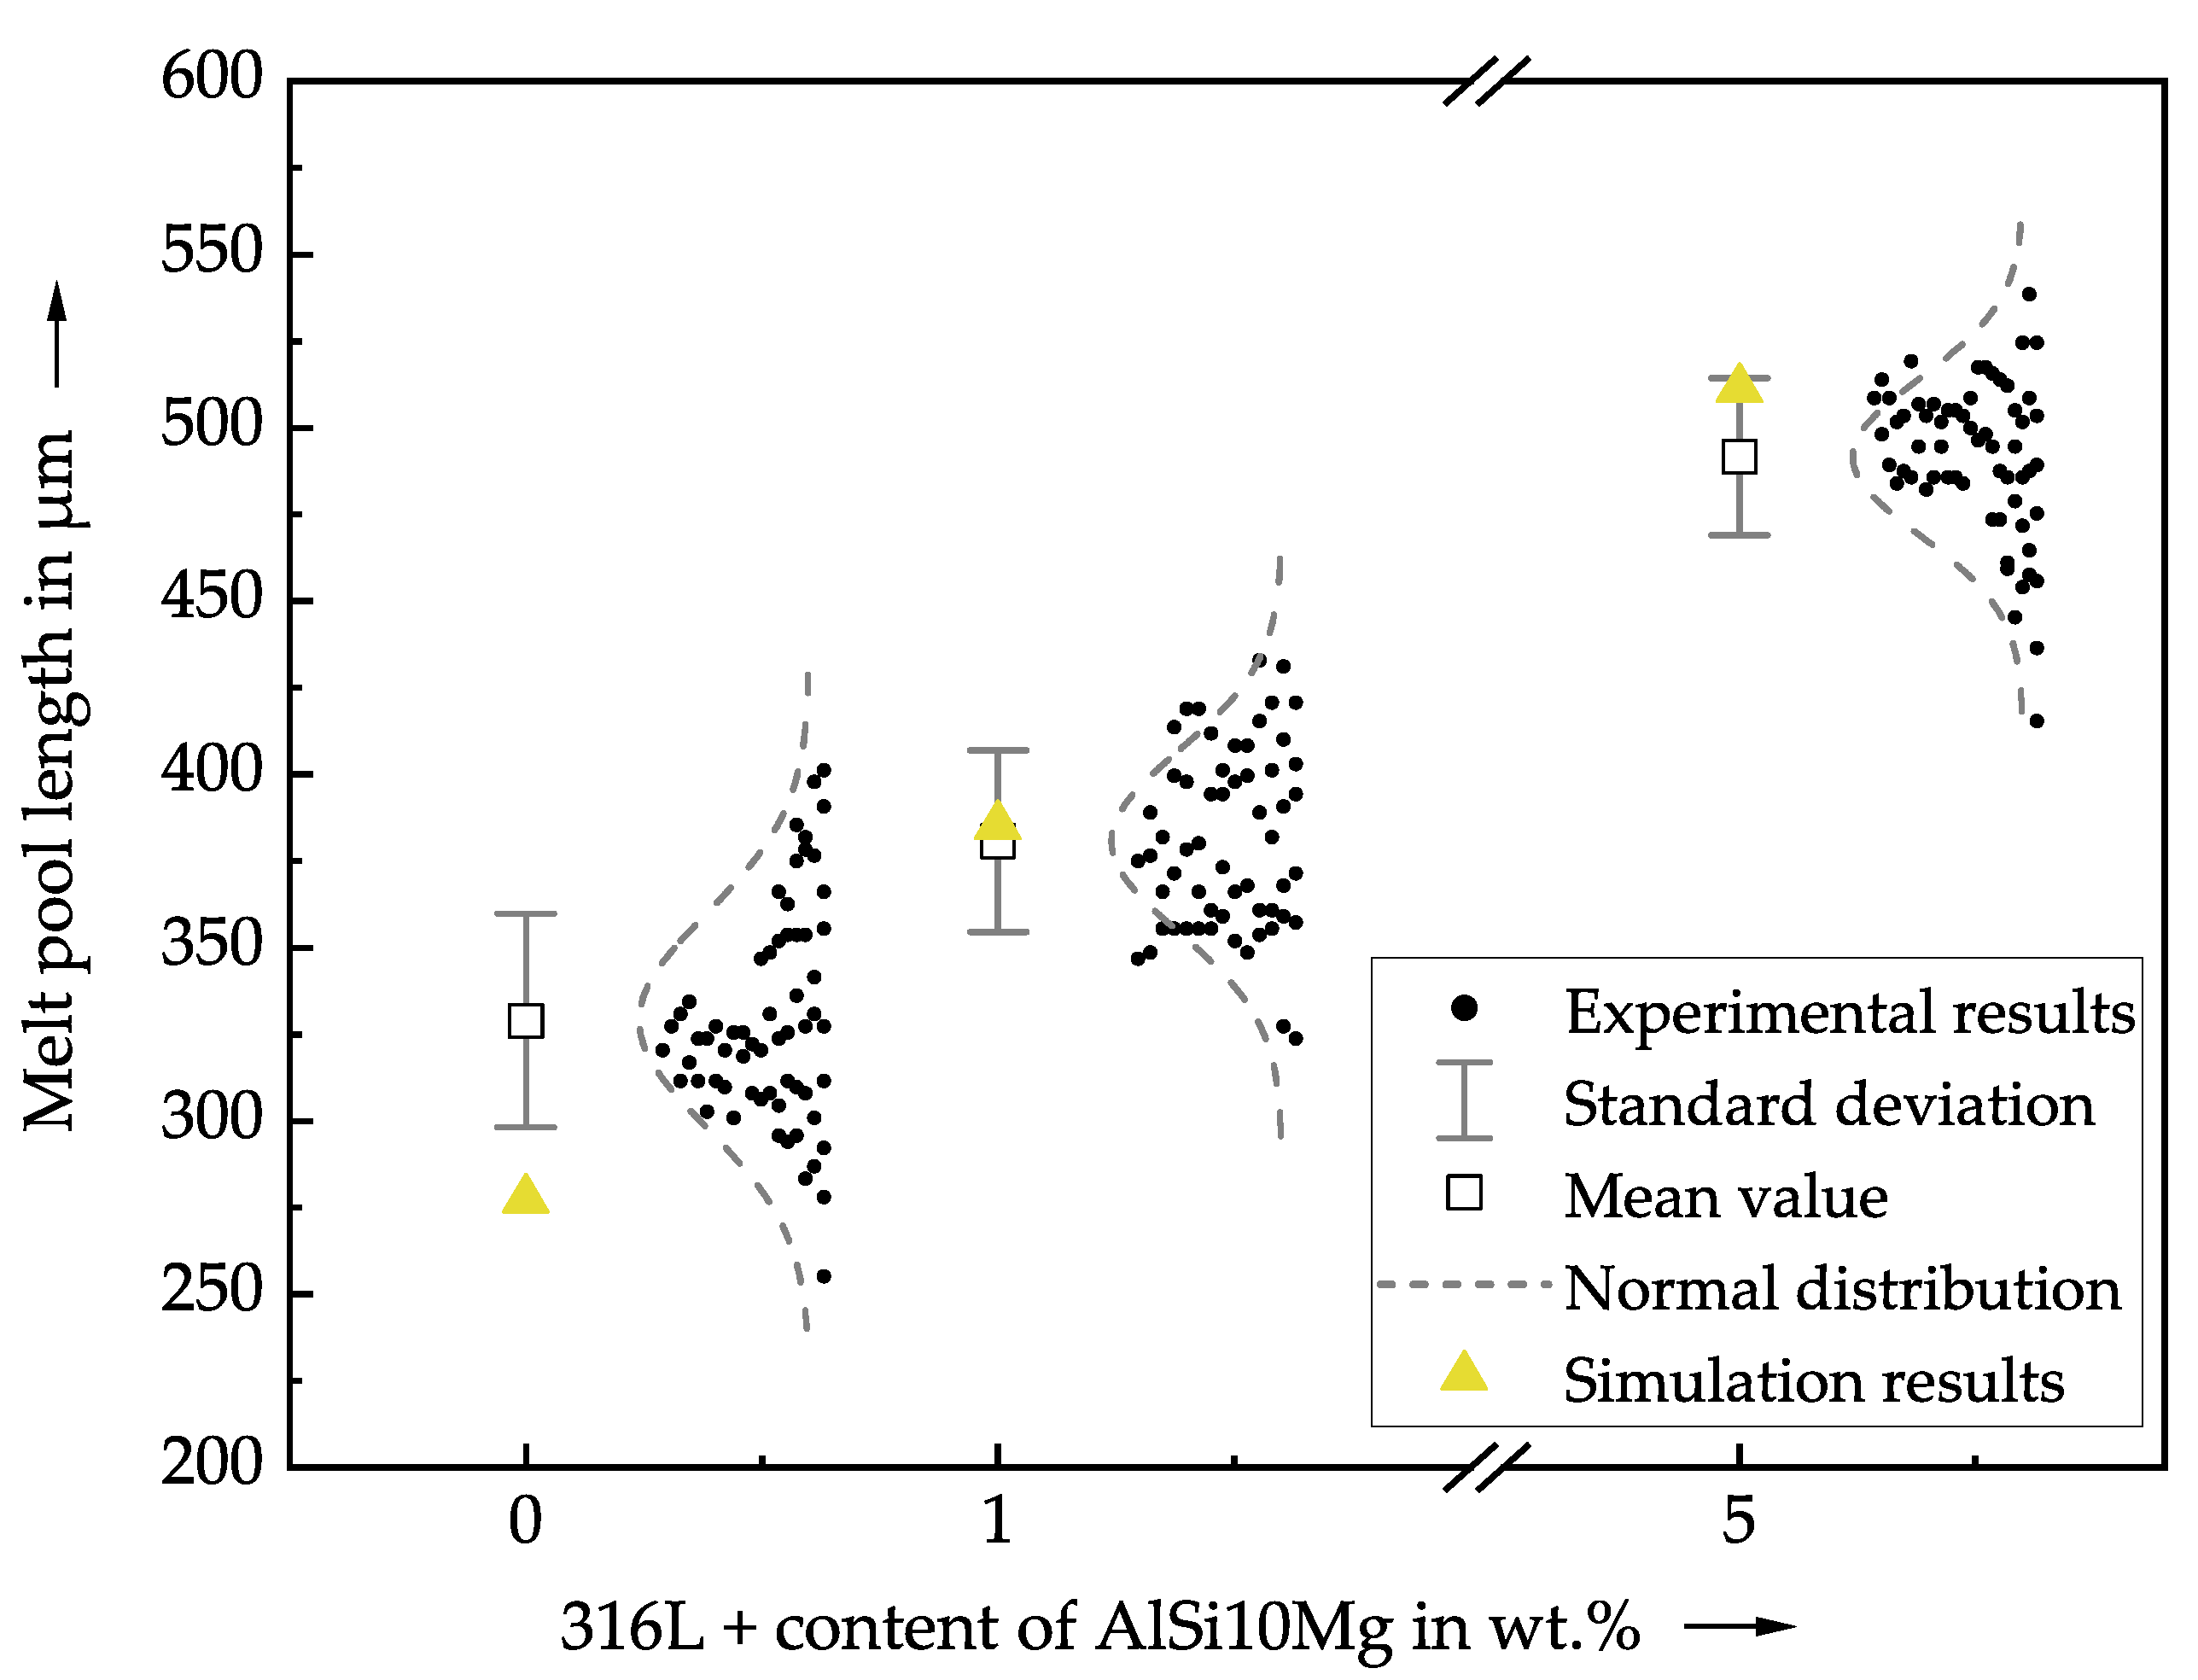
  • The simulation results were validated with a novel experimental setup. High-speed thermographic imaging provided validation data of the melt pool cross-section on a small spatial scale. The global validation quantity was the melt pool length. For both simulation and experiment, the same trend of increasing melt pool dimensions with higher amounts of additives was found.
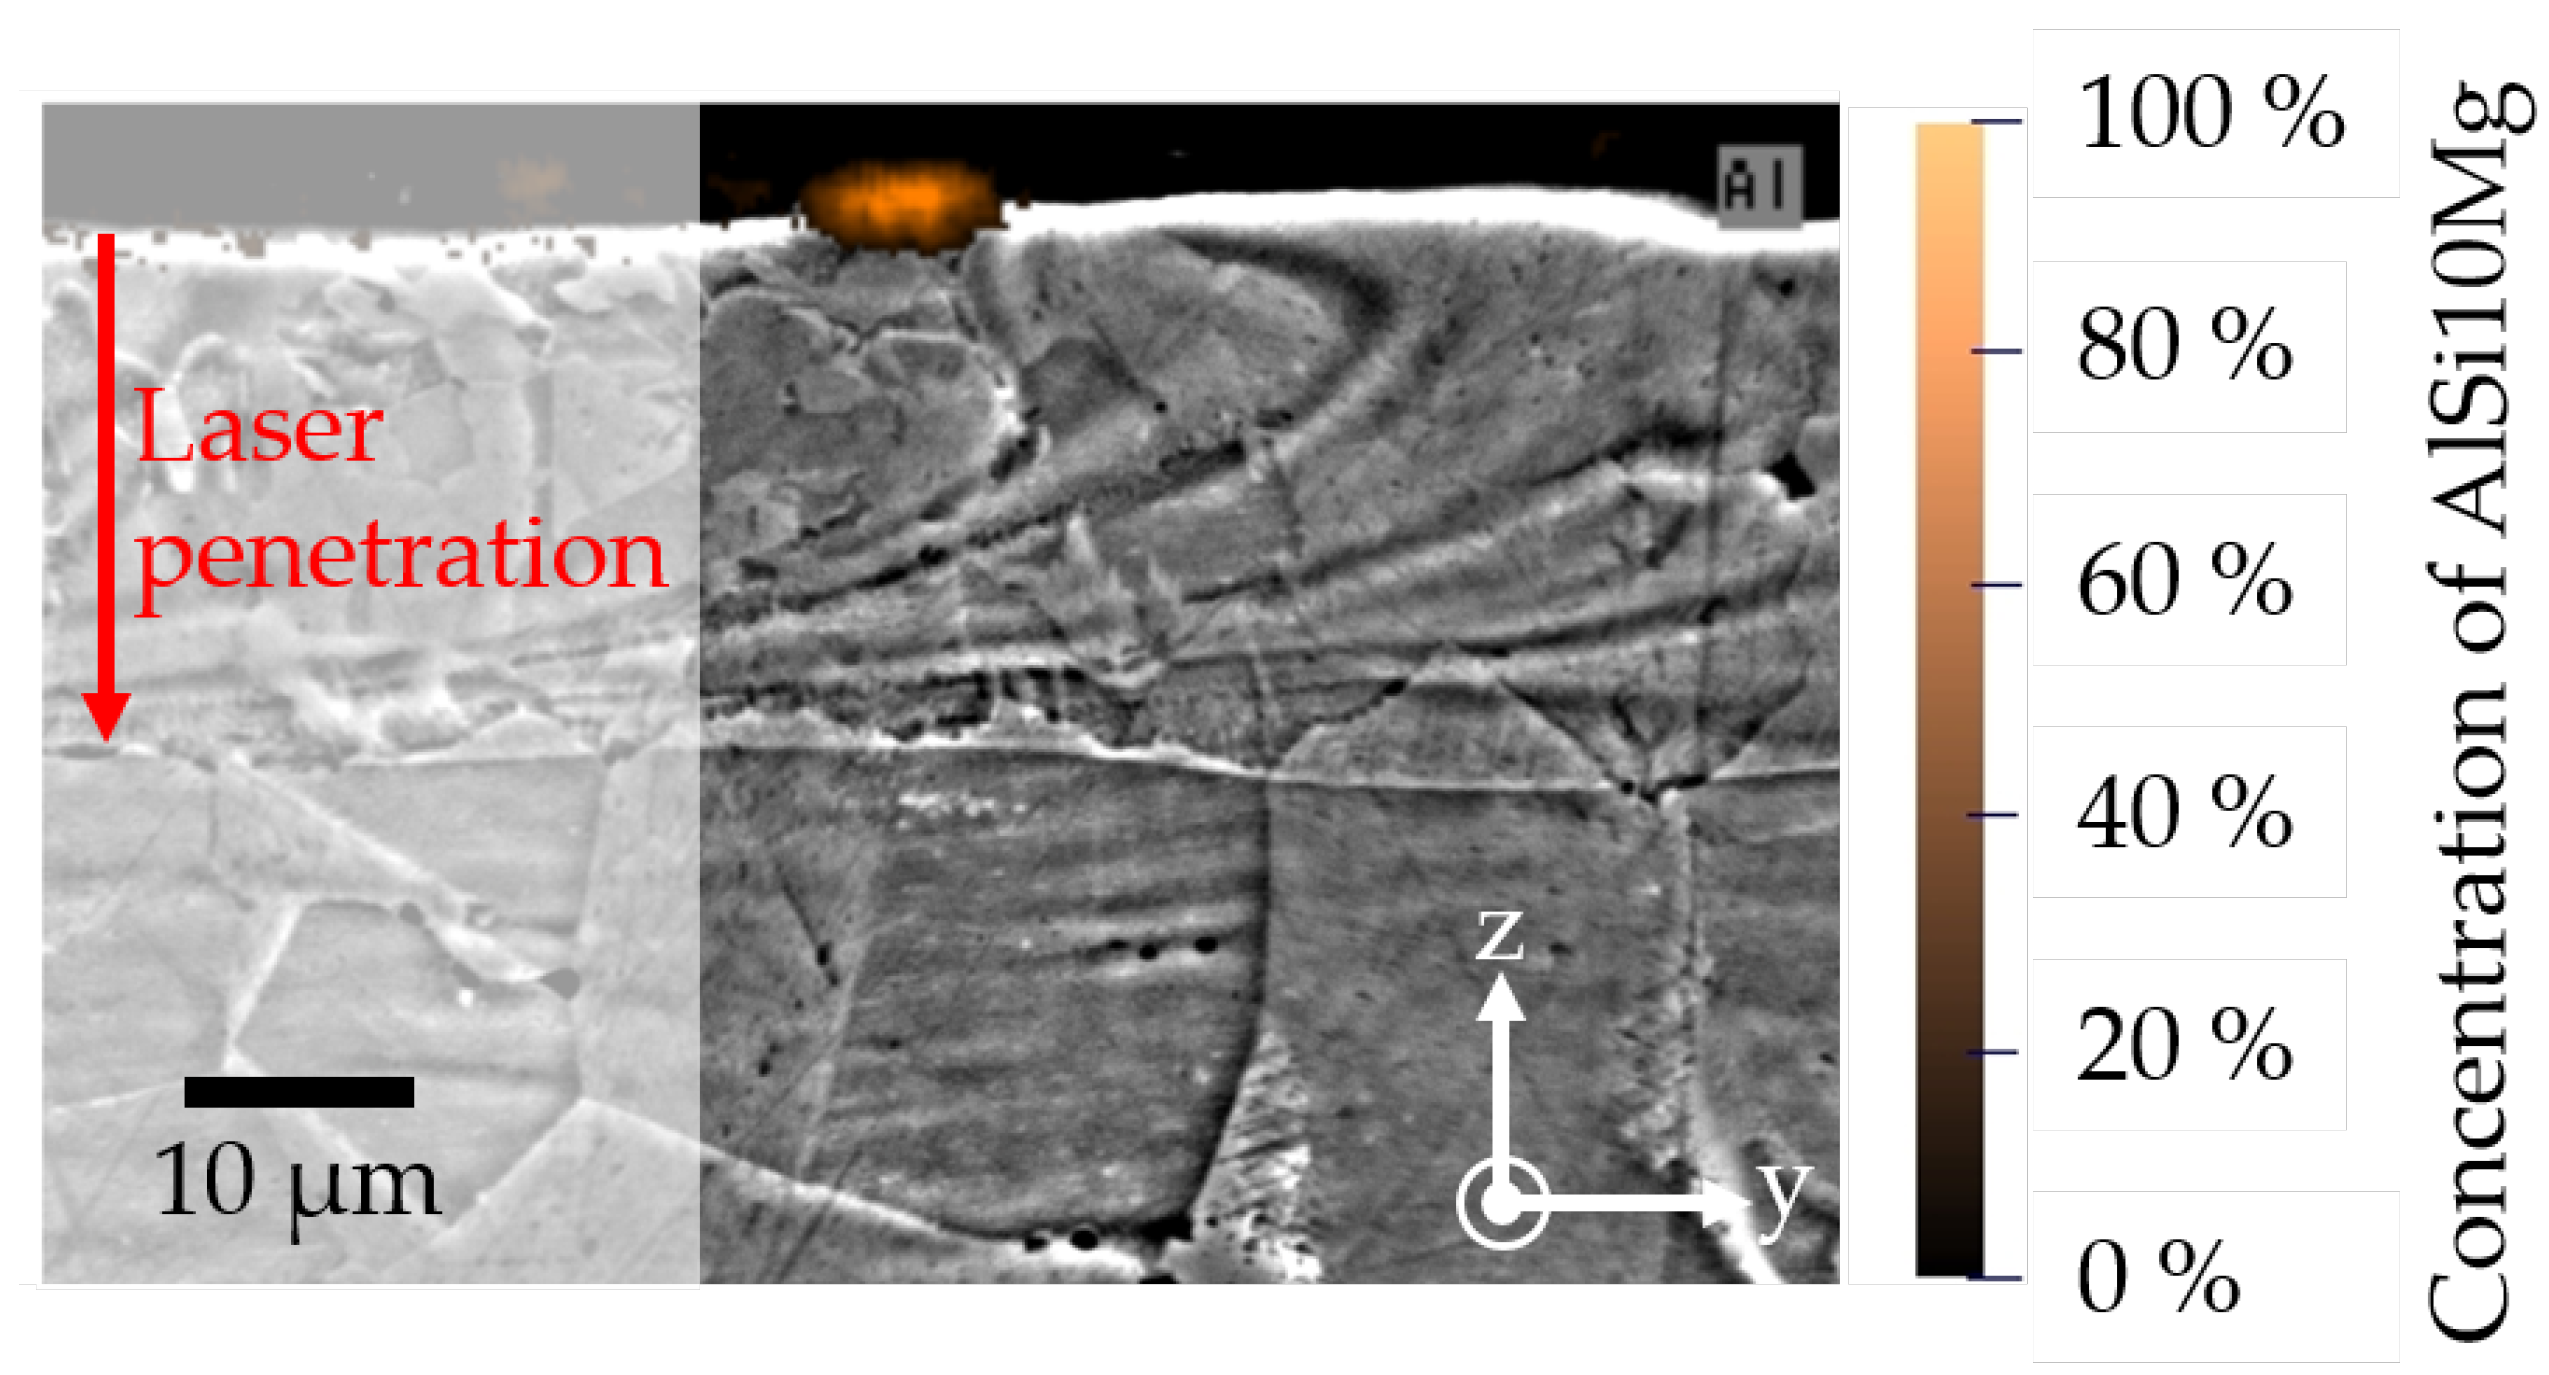
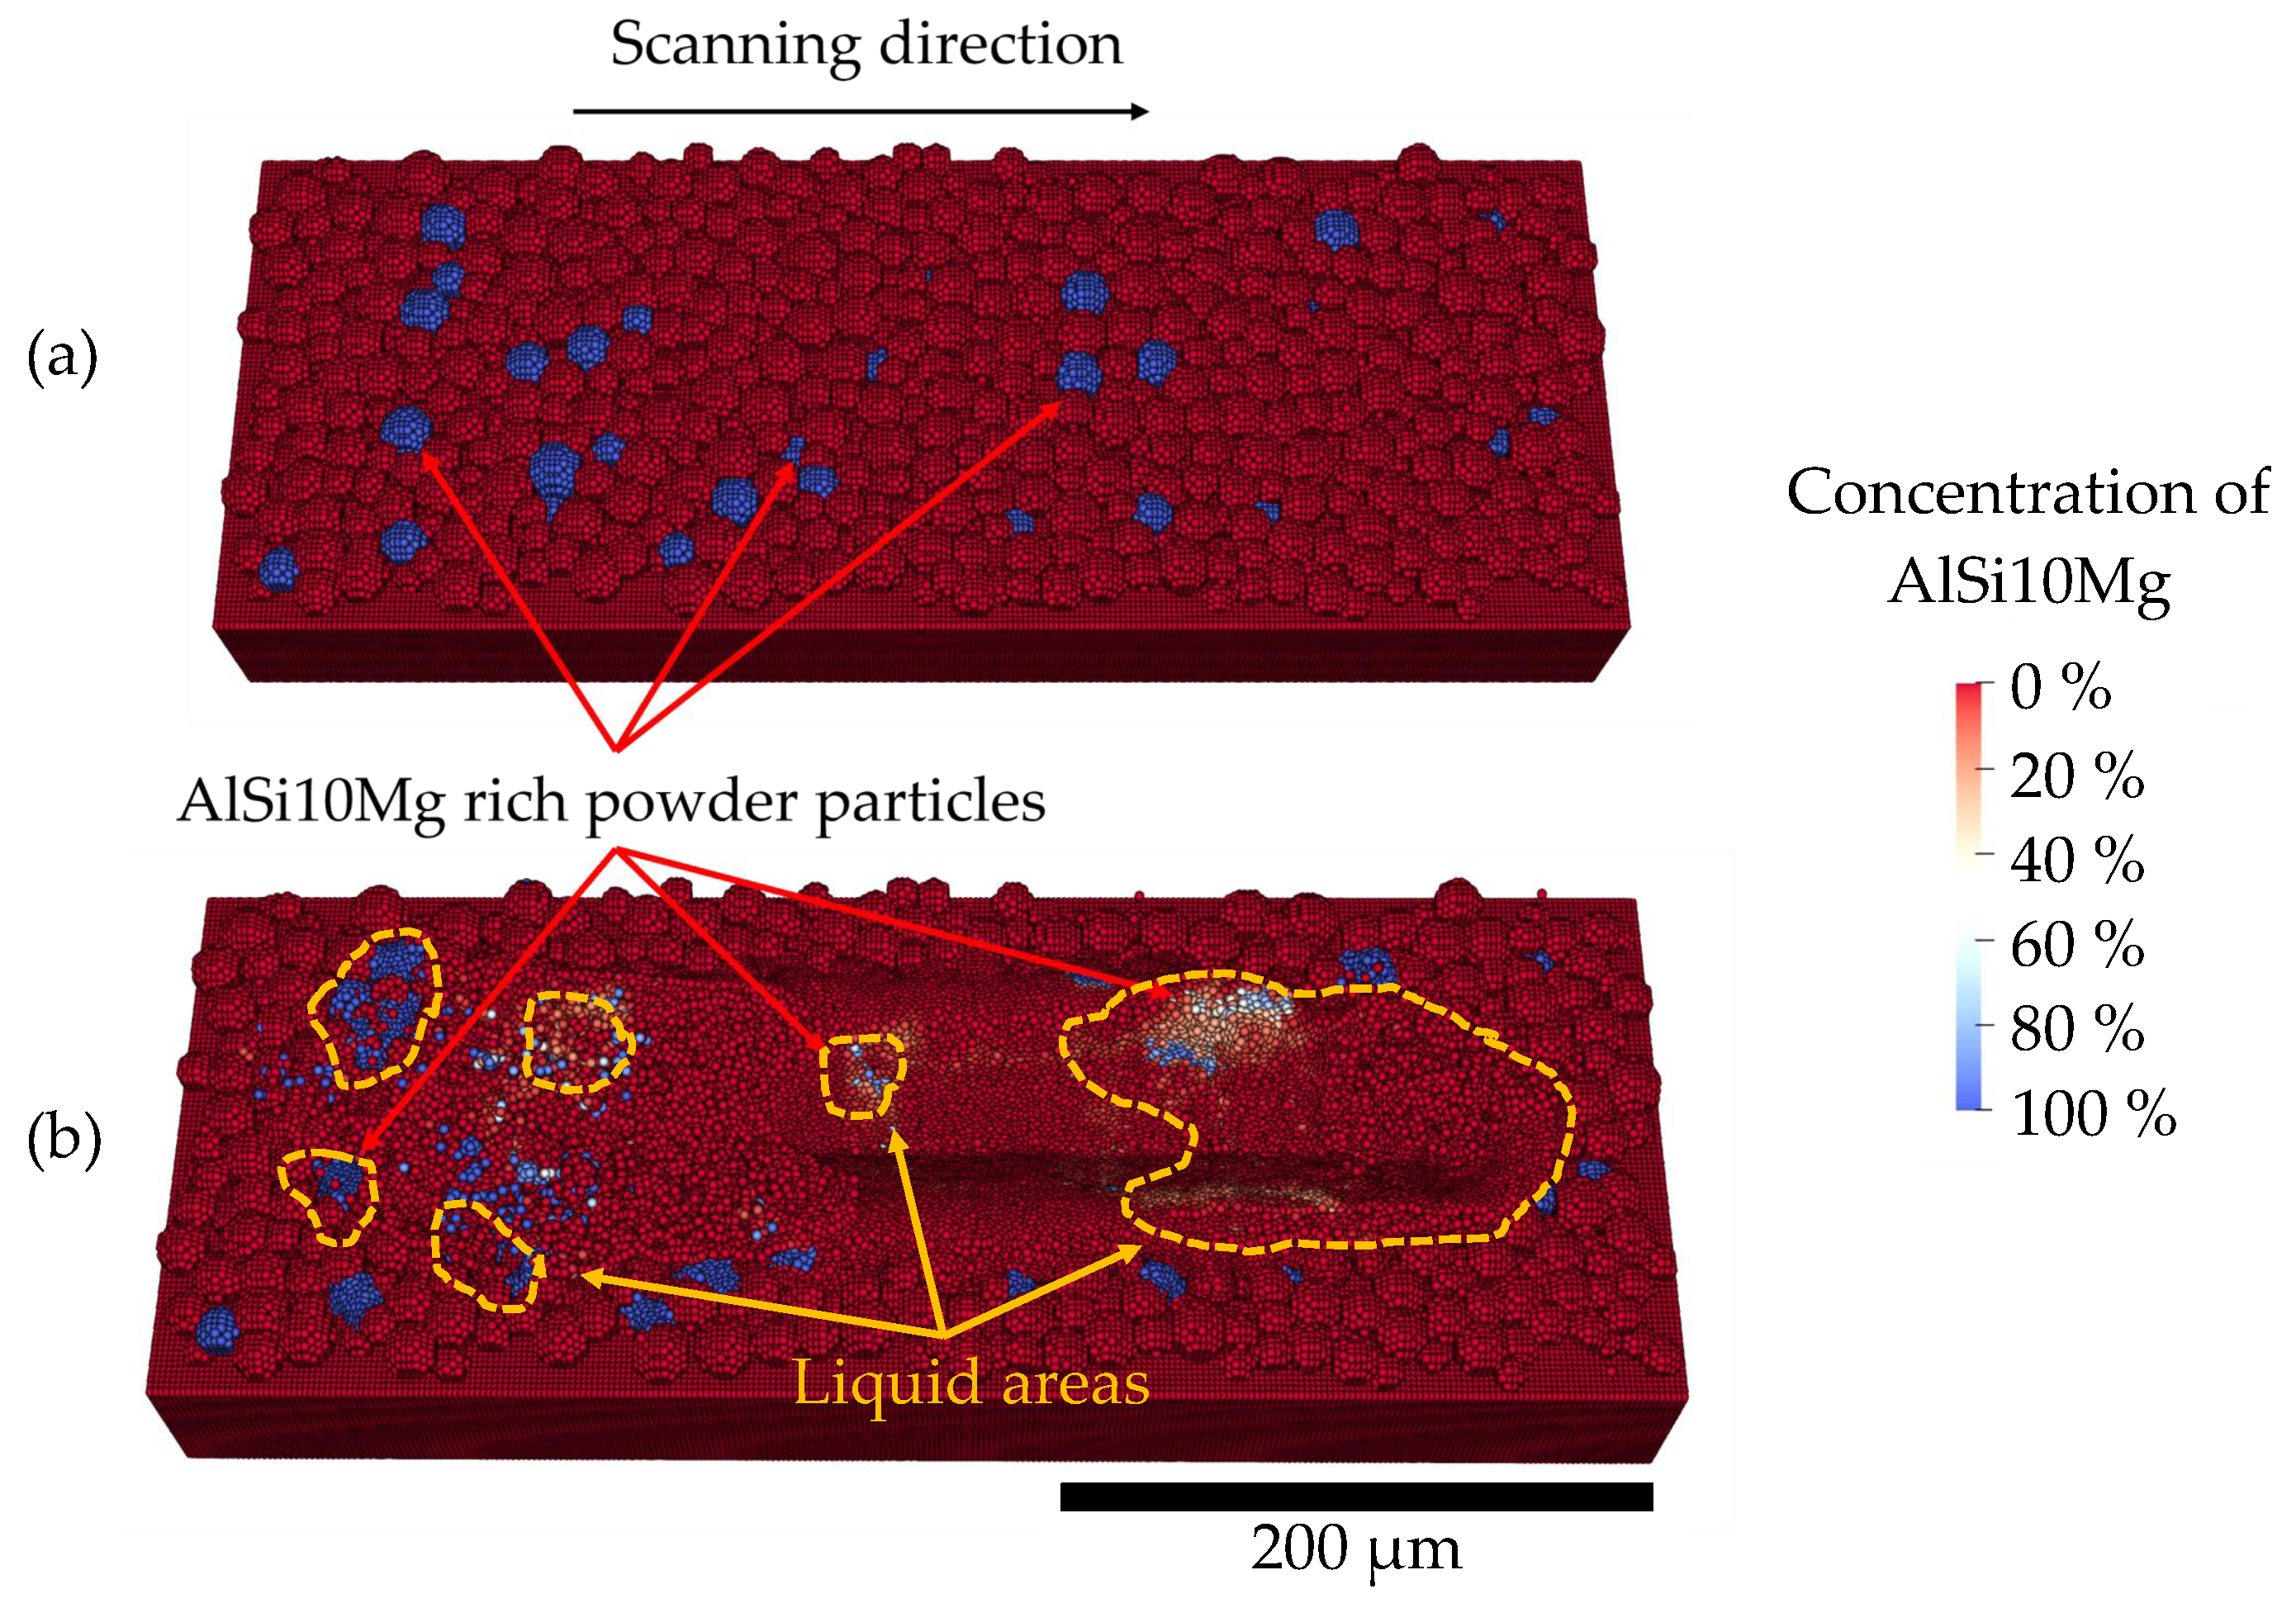
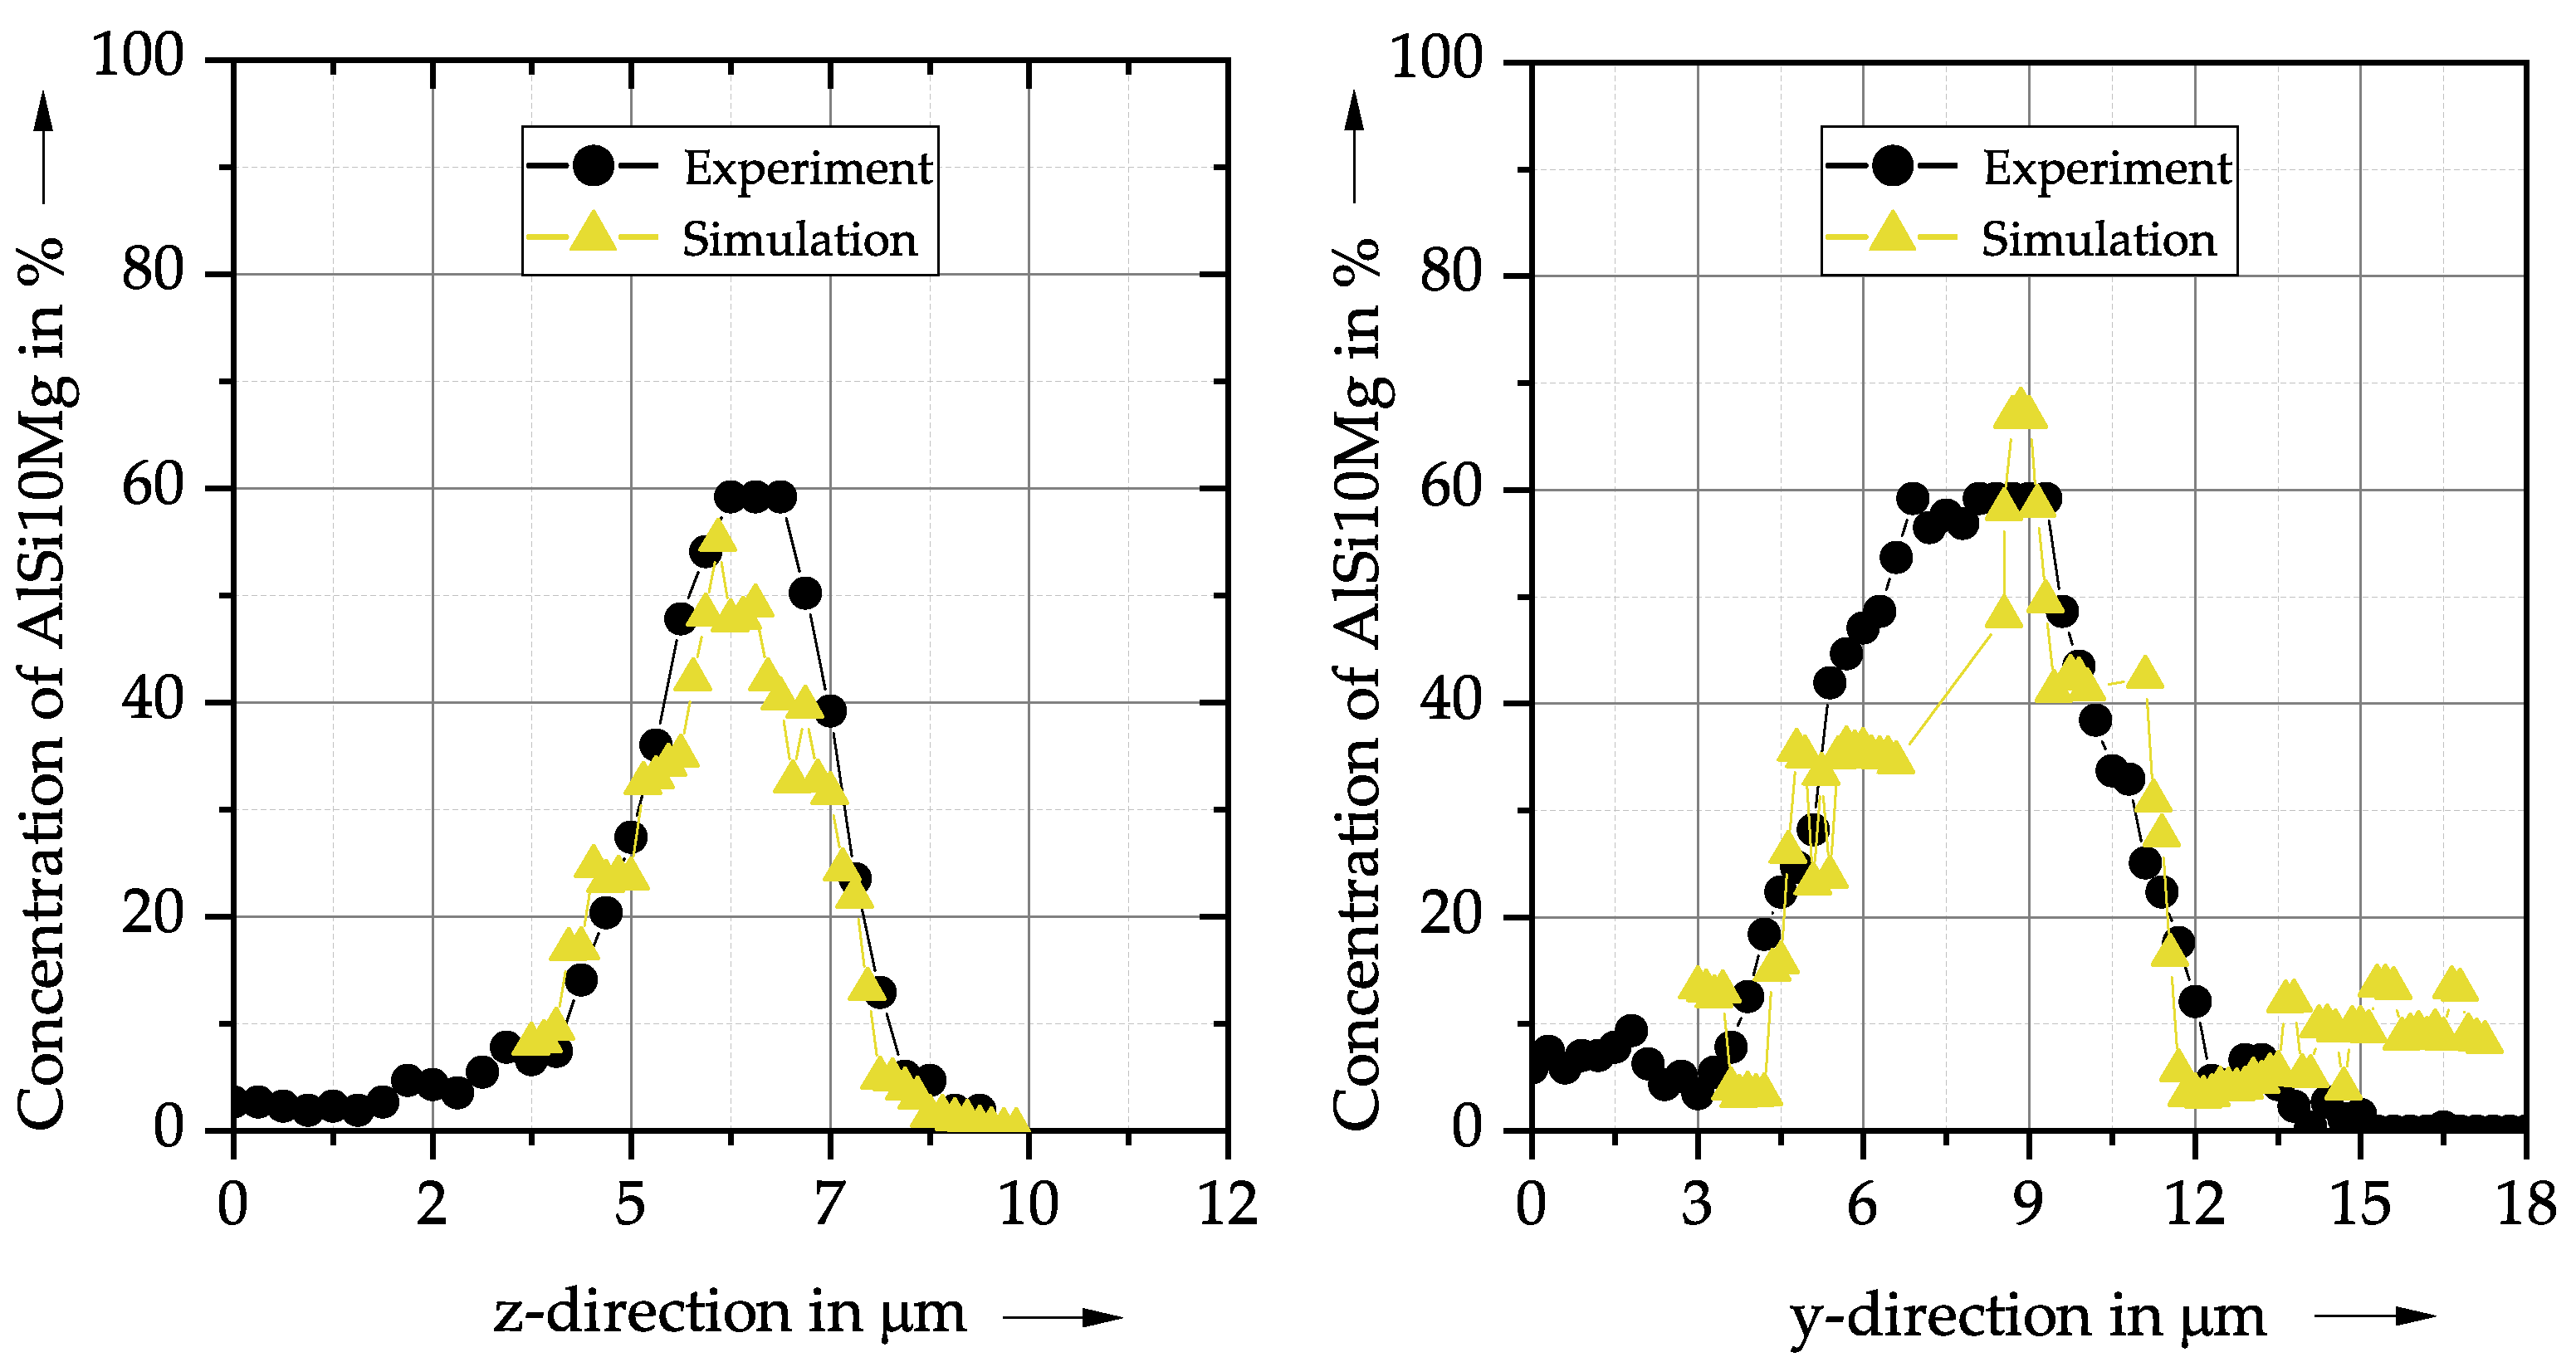
  • The simulation results show a good agreement with the experimental SEM-EDS results for the concentration profile of a single AlSi10Mg powder particle.
  • The presented framework is a suitable basis for the simulation of in situ alloying during PBF-LB/M.
In the future, more elaborate multi-component alloy systems can be implemented using a multi-component species concentration. In addition, an extension of the simulation tool for a hot-cracking prediction is pursued in ongoing work, as in situ alloying is a promising approach to reduce hot-cracking during PBF-LB/M and requires further fundamental investigations. The simulation will significantly reduce the experimental effort for analyzing new material combinations.

Author Contributions

Conceptualization, A.W. and S.A.; methodology, A.W. and B.Y.; software, A.W., B.Y., C.Z. and S.A.; validation, A.W. and F.H.; writing—original draft preparation, A.W. and B.Y.; writing—review and editing, A.W., B.Y., C.Z., S.A., N.A.A. and M.F.Z.; visualization, A.W. and B.Y.; supervision, N.A.A. and M.F.Z.; funding acquisition, S.A., N.A.A. and M.F.Z. All authors have read and agreed to the published version of the manuscript.

Funding

This research was supported by the Deutsche Forschungsgemeinschaft, DFG, project number 387081806.

Institutional Review Board Statement

Not applicable.

Informed Consent Statement

Not applicable.

Data Availability Statement

Not applicable.

Conflicts of Interest

The authors declare no conflict of interest.

Appendix A

Table A1. Material properties of 316L for the simulations.
316LPropertyTemperature RangeValueUnitsReferences
T s Solidus temperature1633K[42]
T l Liquidus temperature1683K[42]
T b Boiling temperature3073K[43]
kThermal conductivity T < T l 9.59 + 141 × 10 4 · K 1 · T W K m [44]
T l > T > T s 355.93 196.90 × 10 3 · K 1 · T W K m [44]
T > T l 6.60 + 121.40 × 10 4 · K 1 · T W K m [44]
HSpecific enthalpy T < 1132 K 138 , 595.00 + 458.93 · K 1 · T J kg [45]
1132 K < T < T l −374,150.00 + 714.29 · K 1 · T J kg [45]
T s < T < T l −8,181,263.00 + 5494.51 · K 1 · T J kg [45]
T > T l −336,177.97 + 847.46 · K 1 · T J kg [45]
cSpecific heat capacity T < T l 492 J kg K [42]
T > T l 736 J kg K [42]
η Dynamic viscosity T > T l 180.76 · e 1.95 / T + 180.68 kg s m 2 [46]
α Surface tension coefficient T l < T < 2166 1.82 N m [47]
T > 2166 1.84 0.11 × ( T 2000 K ) × 10 3 N m [47]
MMolar mass- 57.96 × 10 3 kg mol
aAbsorptivity 0.4[43]
Table A2. Material properties of AlSi10Mg for the simulations.
AlSi10MgPropertyTemperature RangeValueUnitsReferences
T s Solidus temperature816K[48]
T l Liquidus temperature853K[48]
T b Boiling temperature2737K[49]
kThermal conductivity T < T l 155 W K m [50]
T > T l 120 W K m [51]
HSpecific enthalpy T < T l − 230,136.36 + 909.09 · K 1 · T J kg [42]
T < T l −8,243,682.40 + 10 , 729.61 · K 1 · T J kg [42]
T s < T < T l 140,209.01 + 909.09 · K 1 · T J kg [42]
cSpecific heat capacity T < T l 920 J kg K [52]
T > T l 1050 J kg K [51]
η Dynamic viscosity T > T l 163.16 · e 1.78 / T + 163.12 kg s m 2 [53]
α Surface tension coefficient T > T l 0.88 N m [54]
MMolar mass- 332.14 × 10 3 kg mol
aAbsorptivity0.09[55]
It should be noted that following common practice [56], the dynamic viscosity given in Table A1 and Table A2 includes a multiplication factor of 20 to stabilize the molten pool under surface tension.

References

  1. Wohlers, T.; Campbell, I.; Diegel, O.; Huff, R.; Kowen, J. Wohlers Report 2020: 3D Printing and Additive Manufacturing State of the Industry; Wohlers Associates: Fort Collins, CO, USA, 2020. [Google Scholar]
  2. Duan, R.; Li, S.; Cai, B.; Tao, Z.; Zhu, W.; Ren, F.; Attallah, M. In situ alloying based laser powder bed fusion processing of βTi–Mo alloy to fabricate functionally graded composites. Compos. Part B Eng. 2021, 222, 109059. [Google Scholar] [CrossRef]
  3. Gorsse, S.; Hutchinson, C.; Gouné, M.; Banerjee, R. Additive manufacturing of metals: A brief review of the characteristic microstructures and properties of steels, Ti-6Al-4V and high-entropy alloys. Sci. Technol. Adv. Mater. 2017, 18, 584–610. [Google Scholar] [CrossRef] [Green Version]
  4. Zhao, C.; Fezzaa, K.; Cunningham, R.W.; Wen, H.; de Carlo, F.; Chen, L.; Rollett, A.D.; Sun, T. Real-time monitoring of laser powder bed fusion process using high-speed X-ray imaging and diffraction. Sci. Rep. 2017, 7, 3602. [Google Scholar] [CrossRef]
  5. Martin, A.A.; Calta, N.P.; Hammons, J.A.; Khairallah, S.A.; Nielsen, M.H.; Shuttlesworth, R.M.; Sinclair, N.; Matthews, M.J.; Jeffries, J.R.; Willey, T.M.; et al. Ultrafast dynamics of laser-metal interactions in additive manufacturing alloys captured by in situ X-ray imaging. Mater. Today Adv. 2019, 1, 100002. [Google Scholar] [CrossRef]
  6. Montero-Sistiaga, M.L.; Mertens, R.; Vrancken, B.; Wang, X.; Van Hooreweder, B.; Kruth, J.P.; Van Humbeeck, J. Changing the alloy composition of Al7075 for better processability by selective laser melting. J. Mater. Process. Technol. 2016, 238, 437–445. [Google Scholar] [CrossRef]
  7. Wimmer, A.; Kolb, C.G.; Assi, M.; Favre, J.; Bachmann, A.; Fraczkiewicz, A.; Zaeh, M.F. Investigations on the influence of adapted metal-based alloys on the process of laser beam melting. J. Laser Appl. 2020, 32, 022029. [Google Scholar] [CrossRef]
  8. Keene, B.J. Review of data for the surface tension of pure metals. Int. Mater. Rev. 1993, 38, 157–192. [Google Scholar] [CrossRef]
  9. Labudovic, M.; Hu, D.; Kovacevic, R. A three dimensional model for direct laser metal powder deposition and rapid prototyping. Journal of materials science. J. Mater. Sci. 2003, 38, 35–49. [Google Scholar] [CrossRef]
  10. Wimmer, A.; Hofstaetter, F.; Jugert, C.; Wudy, K.; Zaeh, M.F. In situ alloying: Investigation of the melt pool stability during powder bed fusion of metals using a laser beam in a novel experimental set-up. Prog. Addit. Manuf. 2021, 1–9. [Google Scholar] [CrossRef]
  11. Sun, Z.; Chueh, Y.H.; Li, L. Multiphase mesoscopic simulation of multiple and functionally gradient materials laser powder bed fusion additive manufacturing processes. Addit. Manuf. 2020, 35, 101448. [Google Scholar] [CrossRef]
  12. Otto, A.; Koch, H.; Leitz, K.H.; Schmidt, M. Numerical Simulations - A Versatile Approach for Better Understanding Dynamics in Laser Material Processing. Phys. Procedia 2011, 12, 11–20. [Google Scholar] [CrossRef] [Green Version]
  13. Koch, H.; Leitz, K.H.; Otto, A.; Schmidt, M. Laser deep penetration welding simulation based on a wavelength dependent absorption model. Phys. Procedia 2010, 5, 309–315. [Google Scholar] [CrossRef] [Green Version]
  14. Gürtler, F.J.; Karg, M.; Leitz, K.H.; Schmidt, M. Simulation of Laser Beam Melting of Steel Powders using the Three-Dimensional Volume of Fluid Method. Phys. Procedia 2013, 41, 881–886. [Google Scholar] [CrossRef] [Green Version]
  15. Gingold, R.A.; Monaghan, J.J. Smoothed particle hydrodynamics: Theory and application to non-spherical stars. Mon. Not. R. Astron. Soc. 1977, 181, 375–389. [Google Scholar] [CrossRef]
  16. Lucy, L.B. A numerical approach to the testing of the fission hypothesis. Astron. J. 1977, 82, 1013. [Google Scholar] [CrossRef]
  17. Ye, T.; Pan, D.; Huang, C.; Liu, M. Smoothed particle hydrodynamics (SPH) for complex fluid flows: Recent developments in methodology and applications. Phys. Fluids 2019, 31, 011301. [Google Scholar]
  18. Incardona, P.; Leo, A.; Zaluzhnyi, Y.; Ramaswamy, R.; Sbalzarini, I.F. OpenFPM: A scalable open framework for particle and particle-mesh codes on parallel computers. Comput. Phys. Commun. 2019, 241, 155–177. [Google Scholar] [CrossRef]
  19. Domínguez, J.M.; Crespo, A.J.; Gómez-Gesteira, M. Optimization strategies for CPU and GPU implementations of a smoothed particle hydrodynamics method. Comput. Phys. Commun. 2013, 184, 617–627. [Google Scholar] [CrossRef]
  20. Russell, M.A.; Souto-Iglesias, A.; Zohdi, T.I. Numerical simulation of Laser Fusion Additive Manufacturing processes using the SPH method. Comput. Methods Appl. Mech. Eng. 2018, 341, 163–187. [Google Scholar] [CrossRef]
  21. Weirather, J.; Rozov, V.; Wille, M.; Schuler, P.; Seidel, C.; Adams, N.A.; Zaeh, M.F. A Smoothed Particle Hydrodynamics Model for Laser Beam Melting of Ni-based Alloy 718. Comput. Math. Appl. 2019, 78, 2377–2394. [Google Scholar] [CrossRef]
  22. Tong, M.; Browne, D.J. An incompressible multi-phase smoothed particle hydrodynamics (SPH) method for modelling thermocapillary flow. Int. J. Heat Mass Transf. 2014, 73, 284–292. [Google Scholar] [CrossRef]
  23. Hu, X.; Adams, N. A constant-density approach for incompressible multi-phase SPH. J. Comput. Phys. 2009, 228, 2082–2091. [Google Scholar] [CrossRef]
  24. Sun, P.; Colagrossi, A.; Marrone, S.; Zhang, A. The δplus-SPH model: Simple procedures for a further improvement of the SPH scheme. Comput. Methods Appl. Mech. Eng. 2017, 315, 25–49. [Google Scholar] [CrossRef]
  25. Hu, X.Y.; Adams, N.A. A multi-phase SPH method for macroscopic and mesoscopic flows. J. Comput. Phys. 2006, 213, 844–861. [Google Scholar] [CrossRef]
  26. Adami, S.; Hu, X.Y.; Adams, N.A. A transport-velocity formulation for smoothed particle hydrodynamics. J. Comput. Phys. 2013, 241, 292–307. [Google Scholar] [CrossRef]
  27. Cleary, P.W.; Prakash, M.; Ha, J. Novel applications of smoothed particle hydrodynamics (SPH) in metal forming. J. Mater. Process. Technol. 2006, 177, 41–48. [Google Scholar] [CrossRef]
  28. Cleary, P.W. Extension of SPH to predict feeding, freezing and defect creation in low pressure die casting. Appl. Math. Model. 2010, 34, 3189–3201. [Google Scholar] [CrossRef]
  29. Adami, S.; Hu, X.; Adams, N. A generalized wall boundary condition for smoothed particle hydrodynamics. J. Comput. Phys. 2012, 231, 7057–7075. [Google Scholar] [CrossRef]
  30. Valizadeh, A.; Monaghan, J.J. A study of solid wall models for weakly compressible SPH. J. Comput. Phys. 2015, 300, 5–19. [Google Scholar] [CrossRef]
  31. Adami, S.; Hu, X.Y.; Adams, N.A. A conservative SPH method for surfactant dynamics. J. Comput. Phys. 2010, 229, 1909–1926. [Google Scholar] [CrossRef]
  32. Cleary, P.W.; Monaghan, J.J. Conduction Modelling Using Smoothed Particle Hydrodynamics. J. Comput. Phys. 1999, 148, 227–264. [Google Scholar] [CrossRef]
  33. Balogh, Z.; Schmitz, G. Diffusion in Metals and Alloys. In Physical Metallurgy; Elsevier: Amsterdam, The Netherlands, 2014; pp. 387–559. [Google Scholar] [CrossRef]
  34. Fick, A. Ueber Diffusion. Ann. Der Phys. Und Chem. 1855, 170, 59–86. [Google Scholar] [CrossRef]
  35. Aristodemo, F.; Federico, I.; Veltri, P.; Panizzo, A. Two-phase SPH modelling of advective diffusion processes. Environ. Fluid Mech. 2010, 10, 451–470. [Google Scholar] [CrossRef]
  36. Morris, J.P.; Fox, P.J.; Zhu, Y. Modeling Low Reynolds Number Incompressible Flows Using SPH. J. Comput. Phys. 1997, 136, 214–226. [Google Scholar] [CrossRef]
  37. Oikawa, H. Review on Lattice Diffusion of Substitutional Impurities in Iron. A Summary Report. 1982. Available online: http://inaba.nims.go.jp/diff/DIF_Oikawa/Table.html (accessed on 10 October 2021).
  38. Bruna-Rosso, C.; Demir, A.G.; Previtali, B. Selective laser melting finite element modeling: Validation with high-speed imaging and lack of fusion defects prediction. Mater. Des. 2018, 156, 143–153. [Google Scholar] [CrossRef] [Green Version]
  39. Khairallah, S.; Anderson, A. Mesoscopic simulation model of selective laser melting of stainless steel powder. J. Mater. Process. Technol. 2014, 214, 2627–2636. [Google Scholar] [CrossRef]
  40. Wimmer, A.; Lehmann, M.; Schuler, A.; Zaeh, M.F. Analysis of the phase transformation of AlSi10Mg during Laser Powder Bed Fusion. Procedia CIRP 2020, 94, 177–181. [Google Scholar] [CrossRef]
  41. Zhou, J.; Zhang, Y.; Chen, J. Numerical simulation of random packing of spherical particles for powder-based additive manufacturing. J. Manuf. Sci. Eng. 2009, 131, 031004. [Google Scholar] [CrossRef]
  42. Mills, K.C. Recommended Values of Thermophysical Properties for Selected Commercial Alloys; Woodhead: Cambridge, UK, 2002. [Google Scholar]
  43. Trapp, J.; Rubenchik, A.M.; Guss, G.; Matthews, M.J. In situ absorptivity measurements of metallic powders during laser powder-bed fusion additive manufacturing. Appl. Mater. Today 2017, 9, 341–349. [Google Scholar] [CrossRef]
  44. Valencia, J.J.; Quested, P.N. Thermophysical Properties. In Metals Process Simulation; ASM International: Almere, The Netherland, 2010. [Google Scholar] [CrossRef] [Green Version]
  45. Pichler, P.; Simonds, B.J.; Sowards, J.W.; Pottlacher, G. Measurements of thermophysical properties of solid and liquid NIST SRM 316L stainless steel. J. Mater. Sci. 2020, 55, 4081–4093. [Google Scholar] [CrossRef] [PubMed] [Green Version]
  46. Kim, C.S. Thermophysical Properties of Stainless Steels; Argonne National Lab.: Lemont, IL, USA, 1975. [Google Scholar] [CrossRef]
  47. Fukuyama, H.; Higashi, H.; Yamano, H. Thermophysical Properties of Molten Stainless Steel Containing 5 mass % B4C. Nucl. Technol. 2019, 205, 1154–1163. [Google Scholar] [CrossRef] [Green Version]
  48. Vončina, M.; Mrvar, P.; Medved, J. Thermodynamic Analysis of AlSi10Mg Alloy. Mater. Geoenviron. 2006, 52, 621–633. [Google Scholar]
  49. Renishaw plc. Aluminium Powder ALSi10Mg—Safety Data Sheet (SDS); Tech. Rep; Renishaw plc: Gloucestershire, UK, 2018. [Google Scholar]
  50. Li, Y.; Gu, D. Parametric analysis of thermal behavior during selective laser melting additive manufacturing of aluminum alloy powder. Mater. Des. 2014, 63, 856–867. [Google Scholar] [CrossRef]
  51. Wei, P.; Wei, Z.; Chen, Z.; He, Y.; Du, J. Thermal behavior in single track during selective laser melting of AlSi10Mg powder. Appl. Phys. A 2017, 123, 1–13. [Google Scholar] [CrossRef]
  52. EOS. EOS Aluminium AlSi10Mg—Material Data Sheet; Tech. Rep.; EOS GmbH-Electro Optical Systems: Bavaria, Germany, 2014. [Google Scholar]
  53. Paradis, P.F.; Ishikawa, T. Surface Tension and Viscosity Measurements of Liquid and Undercooled Alumina by Containerless Techniques. Jpn. J. Appl. Phys. 2005, 44, 5082–5085. [Google Scholar] [CrossRef]
  54. Chen, L.; Li, H.; Liu, S.; Shen, S.; Zhang, T.; Huang, Y.; Zhang, G.; Zhang, Y.; He, B.; Yang, C. Simulation of surface deformation control during selective laser melting of AlSi10Mg powder using an external magnetic field. AIP Adv. 2019, 9, 045012. [Google Scholar] [CrossRef]
  55. Louvis, E.; Fox, P.; Sutcliffe, C.J. Selective laser melting of aluminium components. J. Mater. Process. Technol. 2011, 211, 275–284. [Google Scholar] [CrossRef]
  56. Fürstenau, J.P.; Wessels, H.; Weißenfels, C.; Wriggers, P. Generating virtual process maps of SLM using powder-scale SPH simulations. Comput. Part. Mech. 2019, 7, 655–677. [Google Scholar] [CrossRef]
Figure 1. The verification case (a) and the comparison of the analytical solution with the numerical solution for t = 1.0 s (b).
Metals 11 01842 g001
Figure 2. Experimental setup for the process monitoring during PBF-LB/M.
Metals 11 01842 g002
Figure 3. Sectional view of the PBF-LB/M chamber with a description of the various components.
Metals 11 01842 g003
Figure 4. The initial powder bed (a) and the steady-state melt pool (b) for 316L blended with 5 wt.% AlSi10Mg.
Metals 11 01842 g004
Figure 5. Comparison of the melt pool length between the steady-state simulation results and the experimental results in dependence of the amount of AlSi10Mg additives.
Metals 11 01842 g005
Figure 6. SEM image of a longitudinal microsection with a superimposed EDS mapping of AlSi10Mg showing a single AlSi10Mg powder particle after single-track melting; the laser scanning direction was in the positive y-direction.
Metals 11 01842 g006
Figure 7. Comparison of the simulation and the experimental results of the mixing behavior for a single AlSi10Mg powder particle after single-track melting in two spatial directions.
Metals 11 01842 g007
Table 1. Simulation parameters and material properties for the diffusion verification.
SymbolPropertyValueUnit
lHeight of the domain (z-direction)100µm
bWidth of the domain (x-direction)40µm
x 1 Position of the stripe in x-direction20µm
z 1 Position of the stripe in z-direction44µm
z 2 Position of the stripe in z-direction55µm
C 0 Solute concentration100%
C 1 Solvent concentration0%
ρ 0 Solute density1000 kg / m 3
ρ 1 Solvent density1000 kg / m 3
D 0 Diffusivity 1 × 10 4 m 2 / s
Δ x Particle size1µm
Table 2. Powder bed and laser properties.
SymbolPropertyValueUnit
dPowder layer thickness20µm
-Amount of AlSi10Mg additives in the powder blend0wt.%
1wt.%
5wt.%
PLaser power175 W
rLaser beam radius40µm
v b Laser beam velocity0.375 m s
Table 3. Numerical settings.
SymbolPropertyValueUnit
ρ 0 Reference density7763kg/m 2
-Kernel typeQuintic spline-
h 0 Particle spacing2.0µm
gGravity9.81m/s 2
tExposure time ( v b = 0.375 m/s) 10.4 × 10 4 s
Publisher’s Note: MDPI stays neutral with regard to jurisdictional claims in published maps and institutional affiliations.

