Article

Evolution of Face-Centered Cubic Ti Alloys Transformation by X-ray Diffraction Profile Analysis in Mechanical Alloying

by
Edgar Pio
1,2,*,
Ariosto Medina
3,
Carola Martínez
4,
Felipe Manuel Castro Cerda
1,5 and
Claudio Aguilar
2,*
1
Departamento de Ingeniería Metalúrgica, Universidad de Santiago de Chile, Av. Lib. Bdo. O’Higgins 3363, Estación Central, Santiago C.P. 9170020, Chile
2
Departamento de Ingeniería Metalúrgica y de Materiales, Universidad Técnica Federico Santa María, Valparaíso C.P. 2390123, Chile
3
Instituto de Investigación en Metalurgia y Materiales, Universidad Michoacana de San Nicolás de Hidalgo, Edificio U, Av. Francisco J. Múgica s/n, Morelia C.P. 58030, Mexico
4
Departamento Ingeniería en Obras Civiles, Universidad de La Frontera, Avenida Francisco Salazar, Temuco 01145, Chile
5
Department of Materials Science and Engineering, Delft University of Technology, Mekelweg 2, 2628 CD Delft, The Netherlands
*
Authors to whom correspondence should be addressed.
Metals 2021, 11(11), 1841; https://doi.org/10.3390/met11111841
Submission received: 28 September 2021 / Revised: 6 November 2021 / Accepted: 8 November 2021 / Published: 16 November 2021
(This article belongs to the Special Issue Amorphous and High-Entropy Alloy Coatings)

Abstract

:
Four titanium alloys (Ti-Ta, Ti-Ta-Sn, Ti-Ta-Mn, and Ti-Nb-Sn) were synthesized by mechanical alloying (MA) in a planetary mill in different times between 2 h and 100 h. The microstructure characterization was made by X-ray diffraction (XRD), in which the Rietveld method was applied to analyze the diffraction patterns. The study demonstrated that after short milling times between 2 h and 30 h, the fraction of hexagonal close-packed (hcp) phase decreases; at the same time, the formation of body-centered cubic (bcc) and face-centered cubic (fcc) Ti phases are promoted. Additionally, after 30 h of MA, the full transformation of hcp-Ti was observed, and the bcc-Ti to fcc-Ti phase transformation took place until 50 h. The results suggest that the addition of Ta and Sn promotes the fcc-Ti phase formation, obtaining 100% of this phase at 50 h onwards, whereas Nb and Mn show the opposite effect.

1. Introduction

Titanium and titanium alloys have been used commercially since the early 1950s due to their unique properties, such as high strength-to-weight ratio, high melting point, and excellent corrosion resistance in chloride-containing media [1,2,3,4]. For this reason, they are mainly used in the aerospace industry, specifically for the manufacture of fan blades, compressor blades, discs, hubs, and numerous non-rotor parts on gas turbines engines [1,5,6,7]. Additionally, Ti alloys are used in chemical processing industries, which include heat exchangers, electrochemical reactors, desalination plants, the paper industry, and hydrocarbon processing [1,8]. In addition, Ti alloys are used for consumer goods, such as sports equipment, jewelry, architecture, decoration, glasses [1], and biomedical implants due to its high biocompatibility, high strength, and low elastic modulus [1,9,10,11].
Pure Ti has allotropic behavior; below 885 °C, it exhibits a hexagonal close-packed (hcp, called α-phase) crystal structure, and above that, a body-centered cubic (bcc, called β-phase) [2,4]. Some metastable phases can be obtained under various heat treatment [12,13], such as casting, welding, or rapid heating/cooling [3,12,14]. The martensitic phases α , α , ω , and phases α n and β n (“n” stands for nonequilibrium composition) are metastable phases in Ti alloys that are formed due to hardening [4,12,13,15]. A metastable phase with a face-centered cubic (fcc) crystal structure has been reported by several authors in pure Ti and Ti-based alloys [16,17,18,19,20,21,22,23,24]. Chatterjee et al. [17] reported the formation of nanocrystalline grains and partial transformation to a fcc Ti-phase after 10 h of milling pure Ti powder. They concluded that these nanocrystalline powders and the partial transformation of fcc can be obtained by intense plastic deformation promoted by the milling media. Chicardi et al. [18] reported the microstructural evolution of Ti-33Nb-4Mn (at. %). This alloy first evolved to a bcc crystal structure and then to fcc nanocrystalline TiNbMn alloy after 20 h of mechanical alloying. Manna et al. [21] reported a polymorphic transformation from hcp to fcc in pure Ti after high-energy milling. The XRD patterns showed the formation of this metastable phase after 10 h of milling. Asano et al. [24] successfully synthesized fcc Ti phase in MgxTi100−x alloy (30 ≤ x ≤ 80) by mechanical alloying, concluding that the fcc phase was stabilized by the introduction of stacking faults in Mg and Ti, which have a hcp structure. Ti-based alloys with low containing γ-phase have been obtained using different methods, such as explosive cladding [16], rolling at room temperature for pure Ti [25], water quenching of Ti compact [26], and high-energy milling [22,27]. In all synthesis processes, two common characteristics have been reported to obtain the γ-phase: (i) nanocrystalline grain size and (ii) high deformation. This indicates that transformations of Ti could be induced by deformation during milling [24,28,29,30,31,32]. The strains could promote a crystal structure transformation, which is called transformation induced by deformation [31,32,33,34]. Ali et al. [34] studied the strain-induced phase transformation conducted in Ti-6246 alloy, revealing that deformation at temperatures below the β-transus plays a significant role in the β to α phase transformation kinetics. These transformations could be explained by the Phenomenological Theory of Martensite Crystallography (PTMC), which is based on the observation of an invariant plane strain deformation and well-defined orientation relationship (OR) [35,36,37]. The α-Ti to β-Ti transformation exhibits an OR of (0001)α//(110)β with the direction [11 2 ¯ 0]α//[111]β [38,39,40], and Wang et al. [41] report in the high-speed machining of Ti-6Al-4V alloy an OR (01 1 ¯ 0)α//(110)β and [0001]α //[111]β. Zhu et al. [42] reported the OR of Ti-α to Ti-γ as (11 2 ¯ 0)α//(2 2 ¯ 0)γ or (10 1 ¯ 0)α//(220)γ with [0001]α//[001]γ. Hong et al. [43] reported this transformation in a cryogenic channel die compression test with an OR { 10 1 ¯ 0 } α / / { 110 } γ and 0001 α / / 001 γ .
Few authors have reported the formation of 100% of fcc-Ti in Ti alloys and the influence of allotting element addition on the stability of this phase. Aguilar et al. [44] studied the microstructural evolution of Ti-13Ta-xSn (3, 6, 9, and 12 at. %) alloys by MA, concluding that the addition of Sn at 6 at. % promotes the formation of fcc Ti-phase. Chicardi et al. [45] studied the synthesis of TiNbxMn by MA, reporting that the addition of Mn after 10 h of milling time promotes the stabilization of fcc Ti-phase. Therefore, it is interesting to identify the synthesis conditions, the influence of alloying elements on the fcc Ti phase formation, and the mechanical properties of a bulk fcc Ti phase sample.
The present work aims to study the microstructural evolution and the condition of formation of γ-phase in four Ti-based alloys (Ti-Ta, Ti-Ta-Sn, Ti-Ta-Mn, and Ti-Nb-Sn). The Ti powder alloys were synthesized by mechanical alloying (MA) using a planetary ball mill in Yttrium-stabilized Zirconia media and characterized by X-ray diffraction pattern profile analysis.

2. Materials and Methods

2.1. Synthesis of Ti Alloys

The metal powders selected were titanium (grade IV, <100 mesh, NOAH Technologies, San Antonio, TX, USA), tantalum (99.9 wt. %, <325 mesh, Sigma-Aldrich, Santiago, Chile), tin (99.8 wt. %, <100 mesh, Sigma-Aldrich, Santiago, Chile), niobium (99.9 wt. %, <325 mesh, NOAH Technologies, San Antonio, TX, USA) and manganese (99.8 wt. %, <50 mesh, NOAH Technologies). Four Ti-based alloys were synthetized: Ti-13Ta, Ti-13Ta-6Sn, Ti-13Ta-6Mn, and Ti-30Nb-6Sn (at. %). The mechanical alloying (MA) was carried out using 20 g of metal powder for each alloy. The mixture was placed in 250 mL vials, and two different sizes of ball 5 and 10 mm of diameter, both of Yttrium-stabilized Zirconia (YSZ) (Zr(Hf)O2-5% Y2O3, Across International). They were mechanically alloyed in a planetary mill (PM400, Retsch) under an extra pure argon atmosphere (99.999% with <2 ppm O2, Linde Group, Santiago, Chile) with a speed of 250 rpm with intervals of 30 min on/off. The ball-to-powder ratio (BPR) was maintained at 10:1 in all the processes. The process control agent (PCA) employed was stearic acid (C18H36O2, 99 wt. %, LobaChemie, Santiago, Chile) in a 2 wt. % of the powder mixture. Milling time varies from 2 h to 100 h.

2.2. X-ray Diffraction Pattern Analysis

2.2.1. Microstructural Characterization

The X-ray diffraction (XRD) powder patterns of the alloys were recorded on a multi-purpose powder diffractometer STOE STADI MP (STOE & Cie GmbH, Darmstadt, Germany) equipped in transmission geometry. A pure Cu Kα1-radiation source (λ = 1.54056 Å, curved Germanium (111) monochromator Johann-type, 40 kV, 30 mA) with a DECTRIS MYTHEN 1K detector (DECTRIS AG, Baden, Switzerland) were used. XRD patterns were obtained between 25° and 90° in 2θ, with step size and a holding time of 0.12° (2θ) and 10 s per step, respectively. The X-ray diffraction patterns were indexed using the PDF-2 database and the Crystallography Open Database (COD). The microstructural characterizations were made by the Rietveld method using the software Materials Analysis Using Diffraction (MAUD v.2.99, Italy) [46,47]. Figures S1–S4 show the Rietveld refinements XRD patterns of Ti-13Ta, Ti-13Ta-6Sn, Ti-13Ta-6Mn, and Ti-30Nb-6Sn at 2 h of MA, and Tables S1–S4 show the refinement parameters used for each Rietveld refinement (Supplementary Materials). The LaB6 (a = 4.1565 Å) was used as an external standard for determining instrumental broadening [48]. A Delf line broadening model [49,50] and an isotropic size–strain model implemented in MAUD were used to characterize the microstructure phases in the profile fitting.

2.2.2. Determination of Dislocation Density from XRD

The dislocation density values were determined by data extracted from the Rietveld refinements, according to the procedure used by Saastamoinen et al. [51,52,53,54,55,56,57,58]. They used the equations proposed by Williamson and Smallman [59] Equations (1) and (2) that relate the dislocation density due to the crystallite size (ρp) and dislocation density due to microstrain (ρs), respectively.
ρ p = 3 n D 2  
ρp is defined as the total length of dislocation lines per unit volume of the crystal [59,60], <D> is the crystallite size from XRD, and the dimensionless value of n is 1, which is applied to severely deformed or annealed metals [59].
ρ s = k ε 2 F b 2
To estimate the value of ρs, Equation (2) factor F takes a value of 1 when n is equal to 1 in Equation (1), ε is the microstrain, b is Burger’s vector, and k is a constant with values between 2 and 25. Nevertheless, according to Griffiths et al. [61], Equation (2) only applies in cubic crystal structures because it ignores the anisotropic nature of the hcp crystal structure [62,63]. For this reason, Griffiths et al. adapted Williamson and Smallman’s hcp crystal structure, proposing Equation (3). However, Wilson and Frank [59] determined k values for the bcc crystal structure (b along <111>) and fcc crystal structure (b along <110>) as 14.4 and 16.1, respectively. In Equation (3), ka is a constant, which depends on the prism and basal line. Taking the values of 52.1 for the prism line with b 1/3<11 2 ¯ 0> and 26.1 for the basal line with b [0001], the Stocks-Wilson relation (Equation (4)) was used to determine the values of ε, which relate the root-mean-square values of microstrain (<ε2>1/2) determined from Rietveld refinement [64]:
ρ s = k a ( ε 2 1 2 ) 2 b 2 ( l n ( D 2 r o ) )
ε = ε 2 1 2 2 π

2.2.3. Determination of Dislocation Density in Ti13Ta6Sn

In this work, only one Ti-based alloy was selected to measure dislocation density by TEM and compare with the XRD results. The samples for HRTEM analysis were prepared by spreading a droplet of solution of Ti alloys onto a carbon film supported by a Cu grid and subsequent drying in vacuum. A Tecnai F20 microscope (FEI Company, Eindhoven, Holland) operating at 200 kV with a field emission gun was used to further analyze the structural characteristics of the milled samples. The HRTEM images of the powder milled at 5 h, 15 h, 50 h, and 100 h were analyzed using Gatan Microscopy Suite ® (GMS 3) (Gatan, Inc., Pleasanton, CA, USA) (Figure 1a), where each image was divided into 16 regions of interest (ROI) (Figure 1b). According to the common models of hcp–fcc–bcc transitions [36,40,65], the OR are Kurdjumov–Sachs (KS) for fcc ↔ bcc: { 111 } γ / / { 110 } β with 110 γ / / 111 β [66], Burger for bcc ↔ hcp: { 110 } β / / { 0001 } α with 111 β / / 11 2 ¯ 0 α [40], and Shoji–Nishiyama (SN) for fcc ↔ hcp: { 111 } γ / / { 0001 } α with 110 γ / / 11 2 ¯ 0 α [67]. The {002} α-Ti, {110} β-Ti, and {111} γ-Ti planes were defined to be analyzed in each Fast Fourier Transform (FFT) ROI (Figure 1d). These results were compared with the general FFT image (Figure 1c). Figure 1e shows the Inverse Fast Fourier Transform (IFFT) images to each ROI to identify the dislocations, as shown in Figure 1f. Finally, the dislocation density due to microstrain was calculated using the relationship: ρs = N/S, where N is the number of dislocations present in the TEM image per phase of Ti and S is the area of the TEM image analyzed [68].

3. Results and Discussion

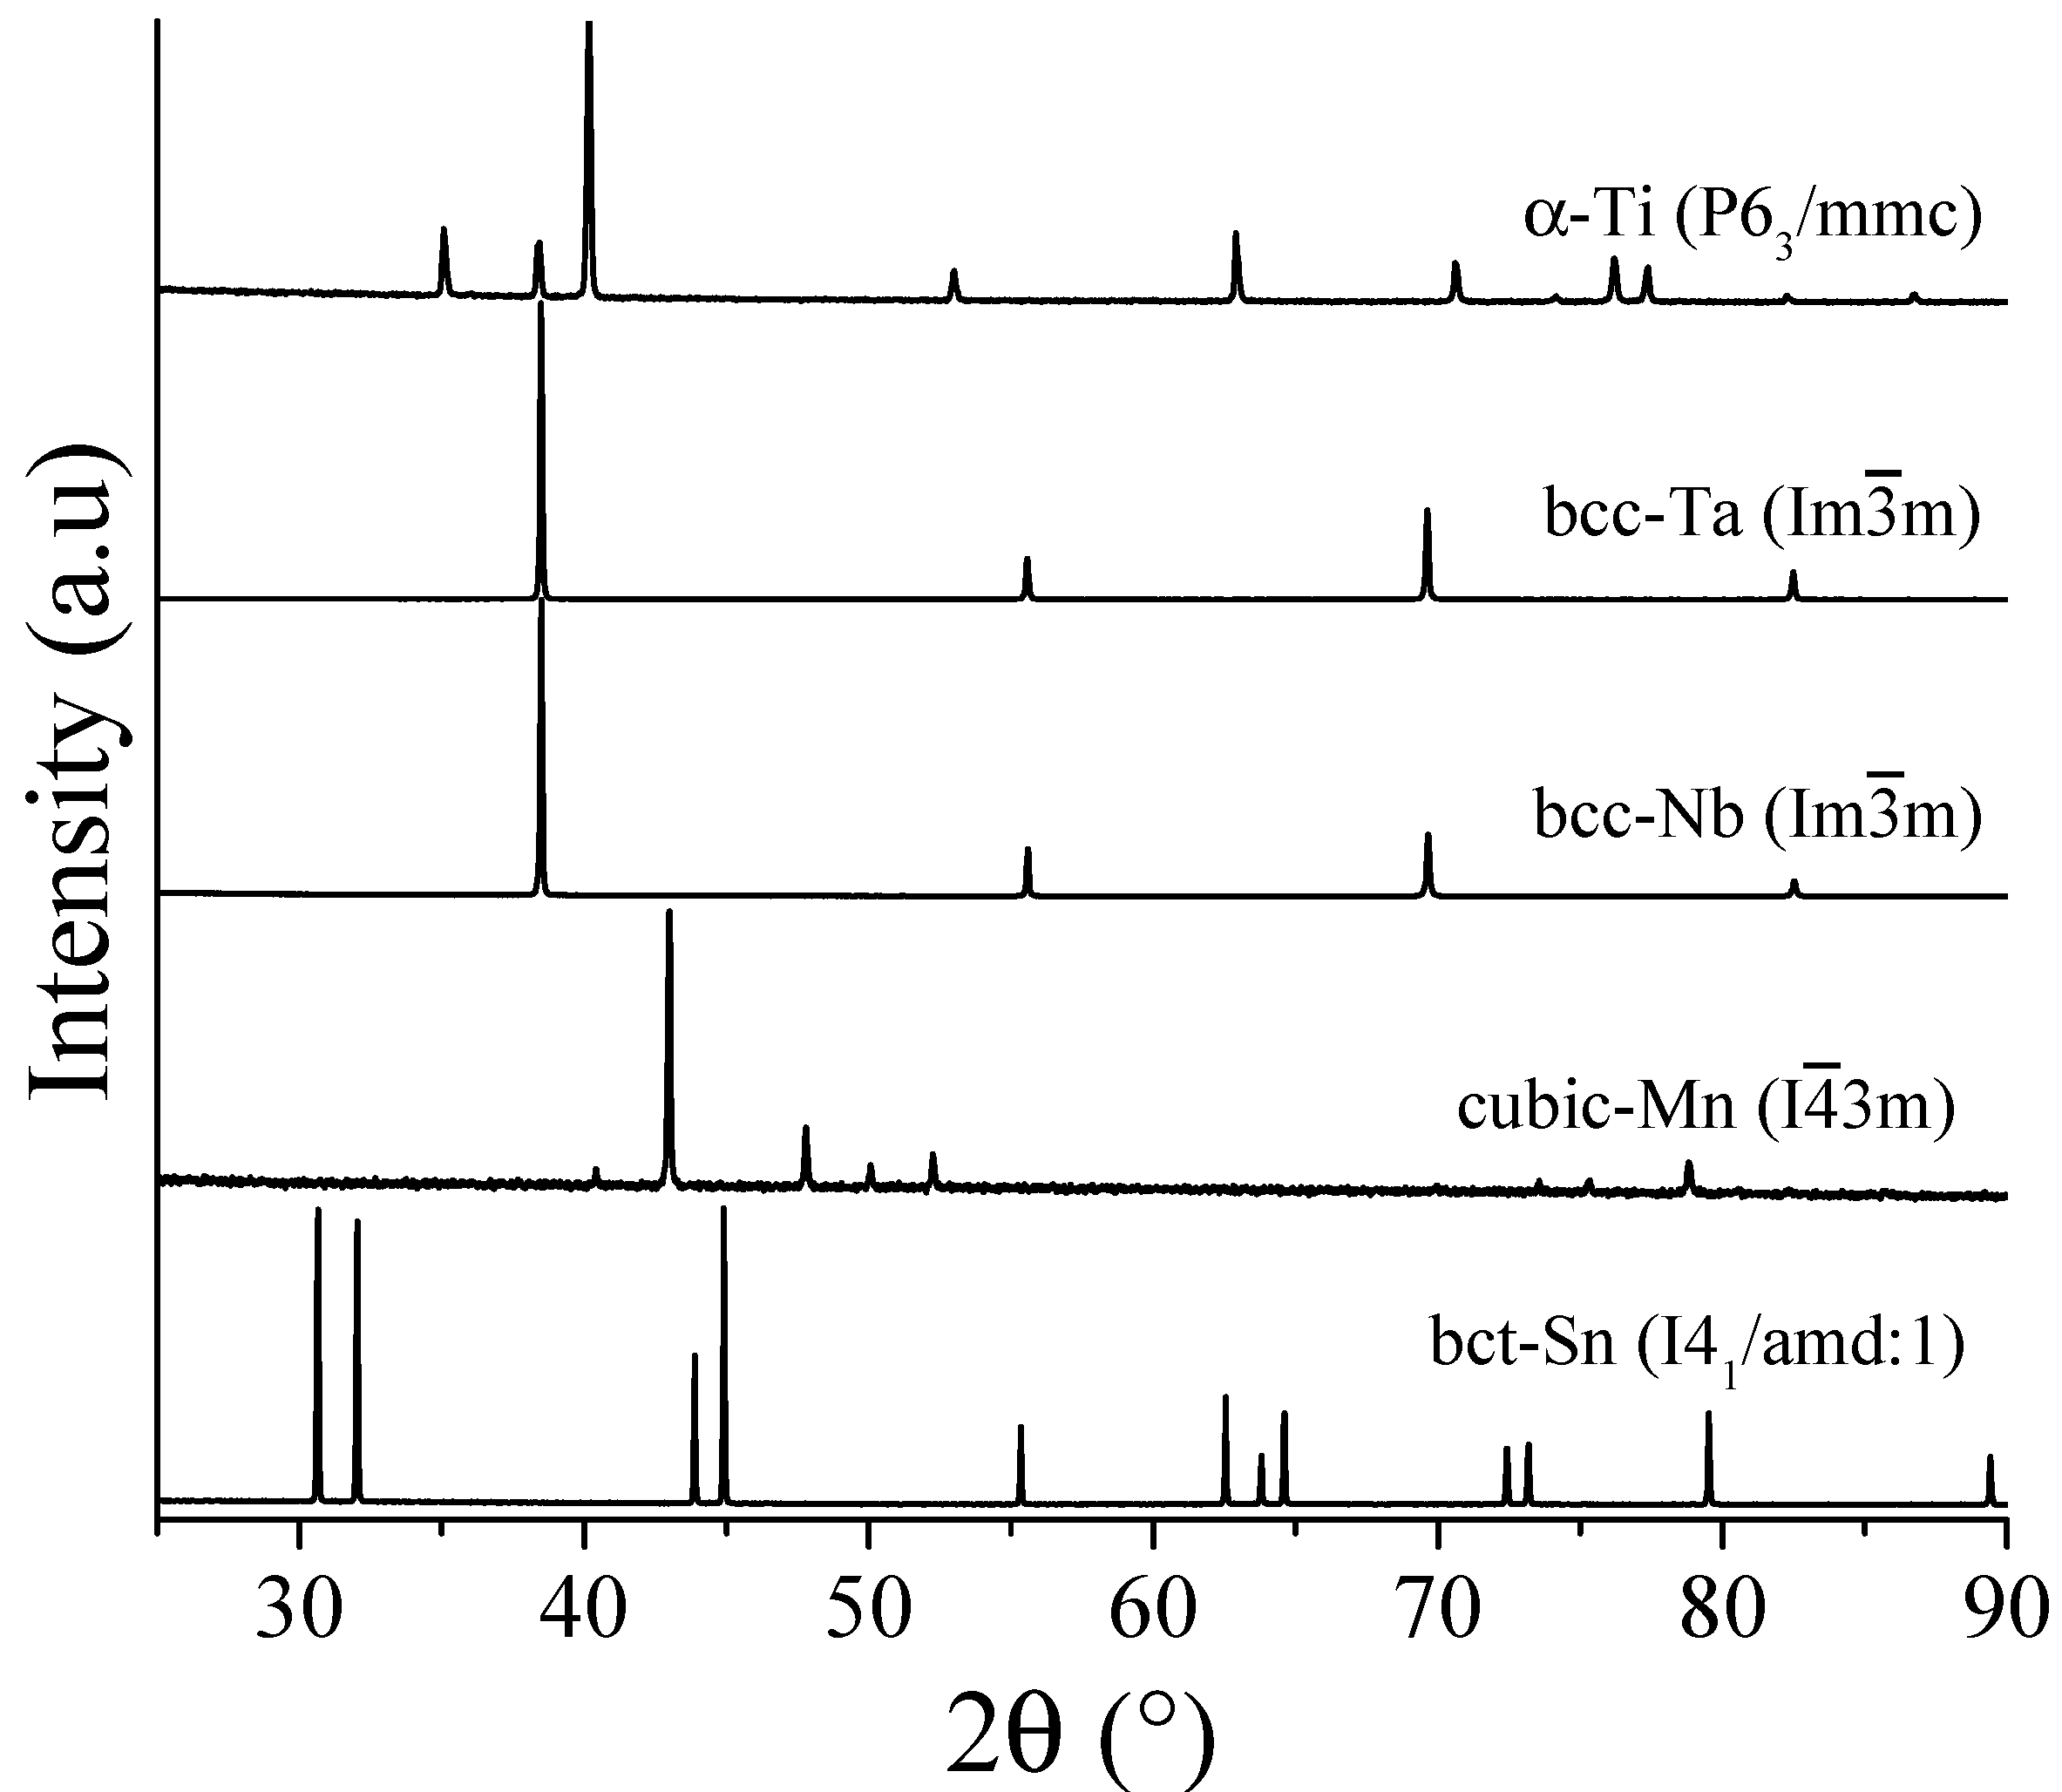
3.1. Pure Powders Characterization

Figure 2 shows the X-ray diffraction patterns of the raw materials used in the four Ti-based alloys. The crystal structures indexed for pure powder were hexagonal close-packed Ti (hcp, P63/mmc, COD ID 9011600) with a0 = 0.29507 and c0 = 0.4684 nm, body-centered cubic Ta (bcc, Im 3 ¯ m, COD ID 1541266) with a0 = 0. 33048 nm, body-centered tetragonal Sn (bct, I41/amd:1, COD ID 1534488) with a0 = 0. 5831 and c0 = 0.31810248 nm, cubic Mn (I 4 ¯ 3m, COD ID 9011068) with a0 = 0. 8913 nm, and body-centered cubic Nb (bcc, Im 3 ¯ m, COD ID 1539041) with a0 = 0. 3304 nm.

3.2. Ti-13Ta Alloy

Figure 3 shows the X-ray diffraction patterns of the Ti-13Ta alloys at different milling times. At 2 h of MA, different crystal structures were indexed as hexagonal close packed (hcp, P63/mmc, COD ID 1527784) and body-centered cubic (bcc, Im 3 ¯ m, COD ID 1528103) for α-Ti and β-Ti phases, respectively. At 5 h of MA, the peaks intensity of the α-Ti phase decreases, whereas the peaks of β-Ti can be observed. Additionally, a new face-centered cubic structure was identified (fcc, Fm 3 ¯ m , COD ID 1534878), which is denoted in this work as the γ-Ti phase. According to the PTMC, this transformation could be associated with a KS and Burger orientation relationship. After that, at 10 h, the intensity of the α-Ti and β-Ti peaks decreases. The latter displays a broadening associated to the increase in microstrain and the decrease in crystallite size [69,70,71]. Additionally, the contamination of YSZ (COD ID 1521474) was identified, which comes from the jar and milling media used, α-Ti disappears, and γ-Ti is observed after 15 h milling, which denoted the SN model of transformation from α-Ti to γ-Ti. Between 20 and 30 h, the peaks exhibit a noticeable shift and broadening due to the severe plastic deformation [72,73,74,75]. In addition, the γ-Ti phase increases, suggesting that the β-Ti to γ-Ti transformation occurs with a KS model [76,77,78,79,80]. Finally, between 50 h and 100 h, only γ-Ti peaks were identified, confirming the presence of this phase after long milling times [18,21,28,43,81].

3.3. Ti-13Ta-6Sn Alloy

The X-ray diffraction patterns of the Ti-13Ta-6Sn alloys at different milling times are shown in Figure 4. At 2 h, the peaks of Sn (COD ID 1534488), Ta (COD ID 1541266), α-Ti, and β-Ti phases were identified. The initial contents of Ta and Sn were of 13 and 6 at. %, respectively. After 2 h of MA, Ta and Sn decreased to 11 and 2 at. %, respectively (see Table 1). These values were determined by Rietveld refinements. The diminution of both elements suggests they go into solid solution in the Ti matrix. At 5 h, the peaks of pure Ta and Sn disappeared and the appearance of small reflections γ-Ti phase was observed. At 10 h, the reflections of α, β, and γ-Ti phases exhibit broadening and shifting due to the severe plastic deformation promoted by the milling media [82,83]. Peaks of YSZ were identified at 15 h, and the peaks of the α-Ti were not observed. This phenomenon was observed in the same milling time for the Ti-13Ta alloy, suggesting the same model of PTMC. At 20 and 30 h, β-Ti peaks are shifted and broaden, whereas others have disappeared due to the severe plastic deformation. The peaks of the γ-Ti phase show high intensities. Finally, at 50 and 100 h, just peaks of γ-Ti are observed, indicating transformation by the KS model [36,77].

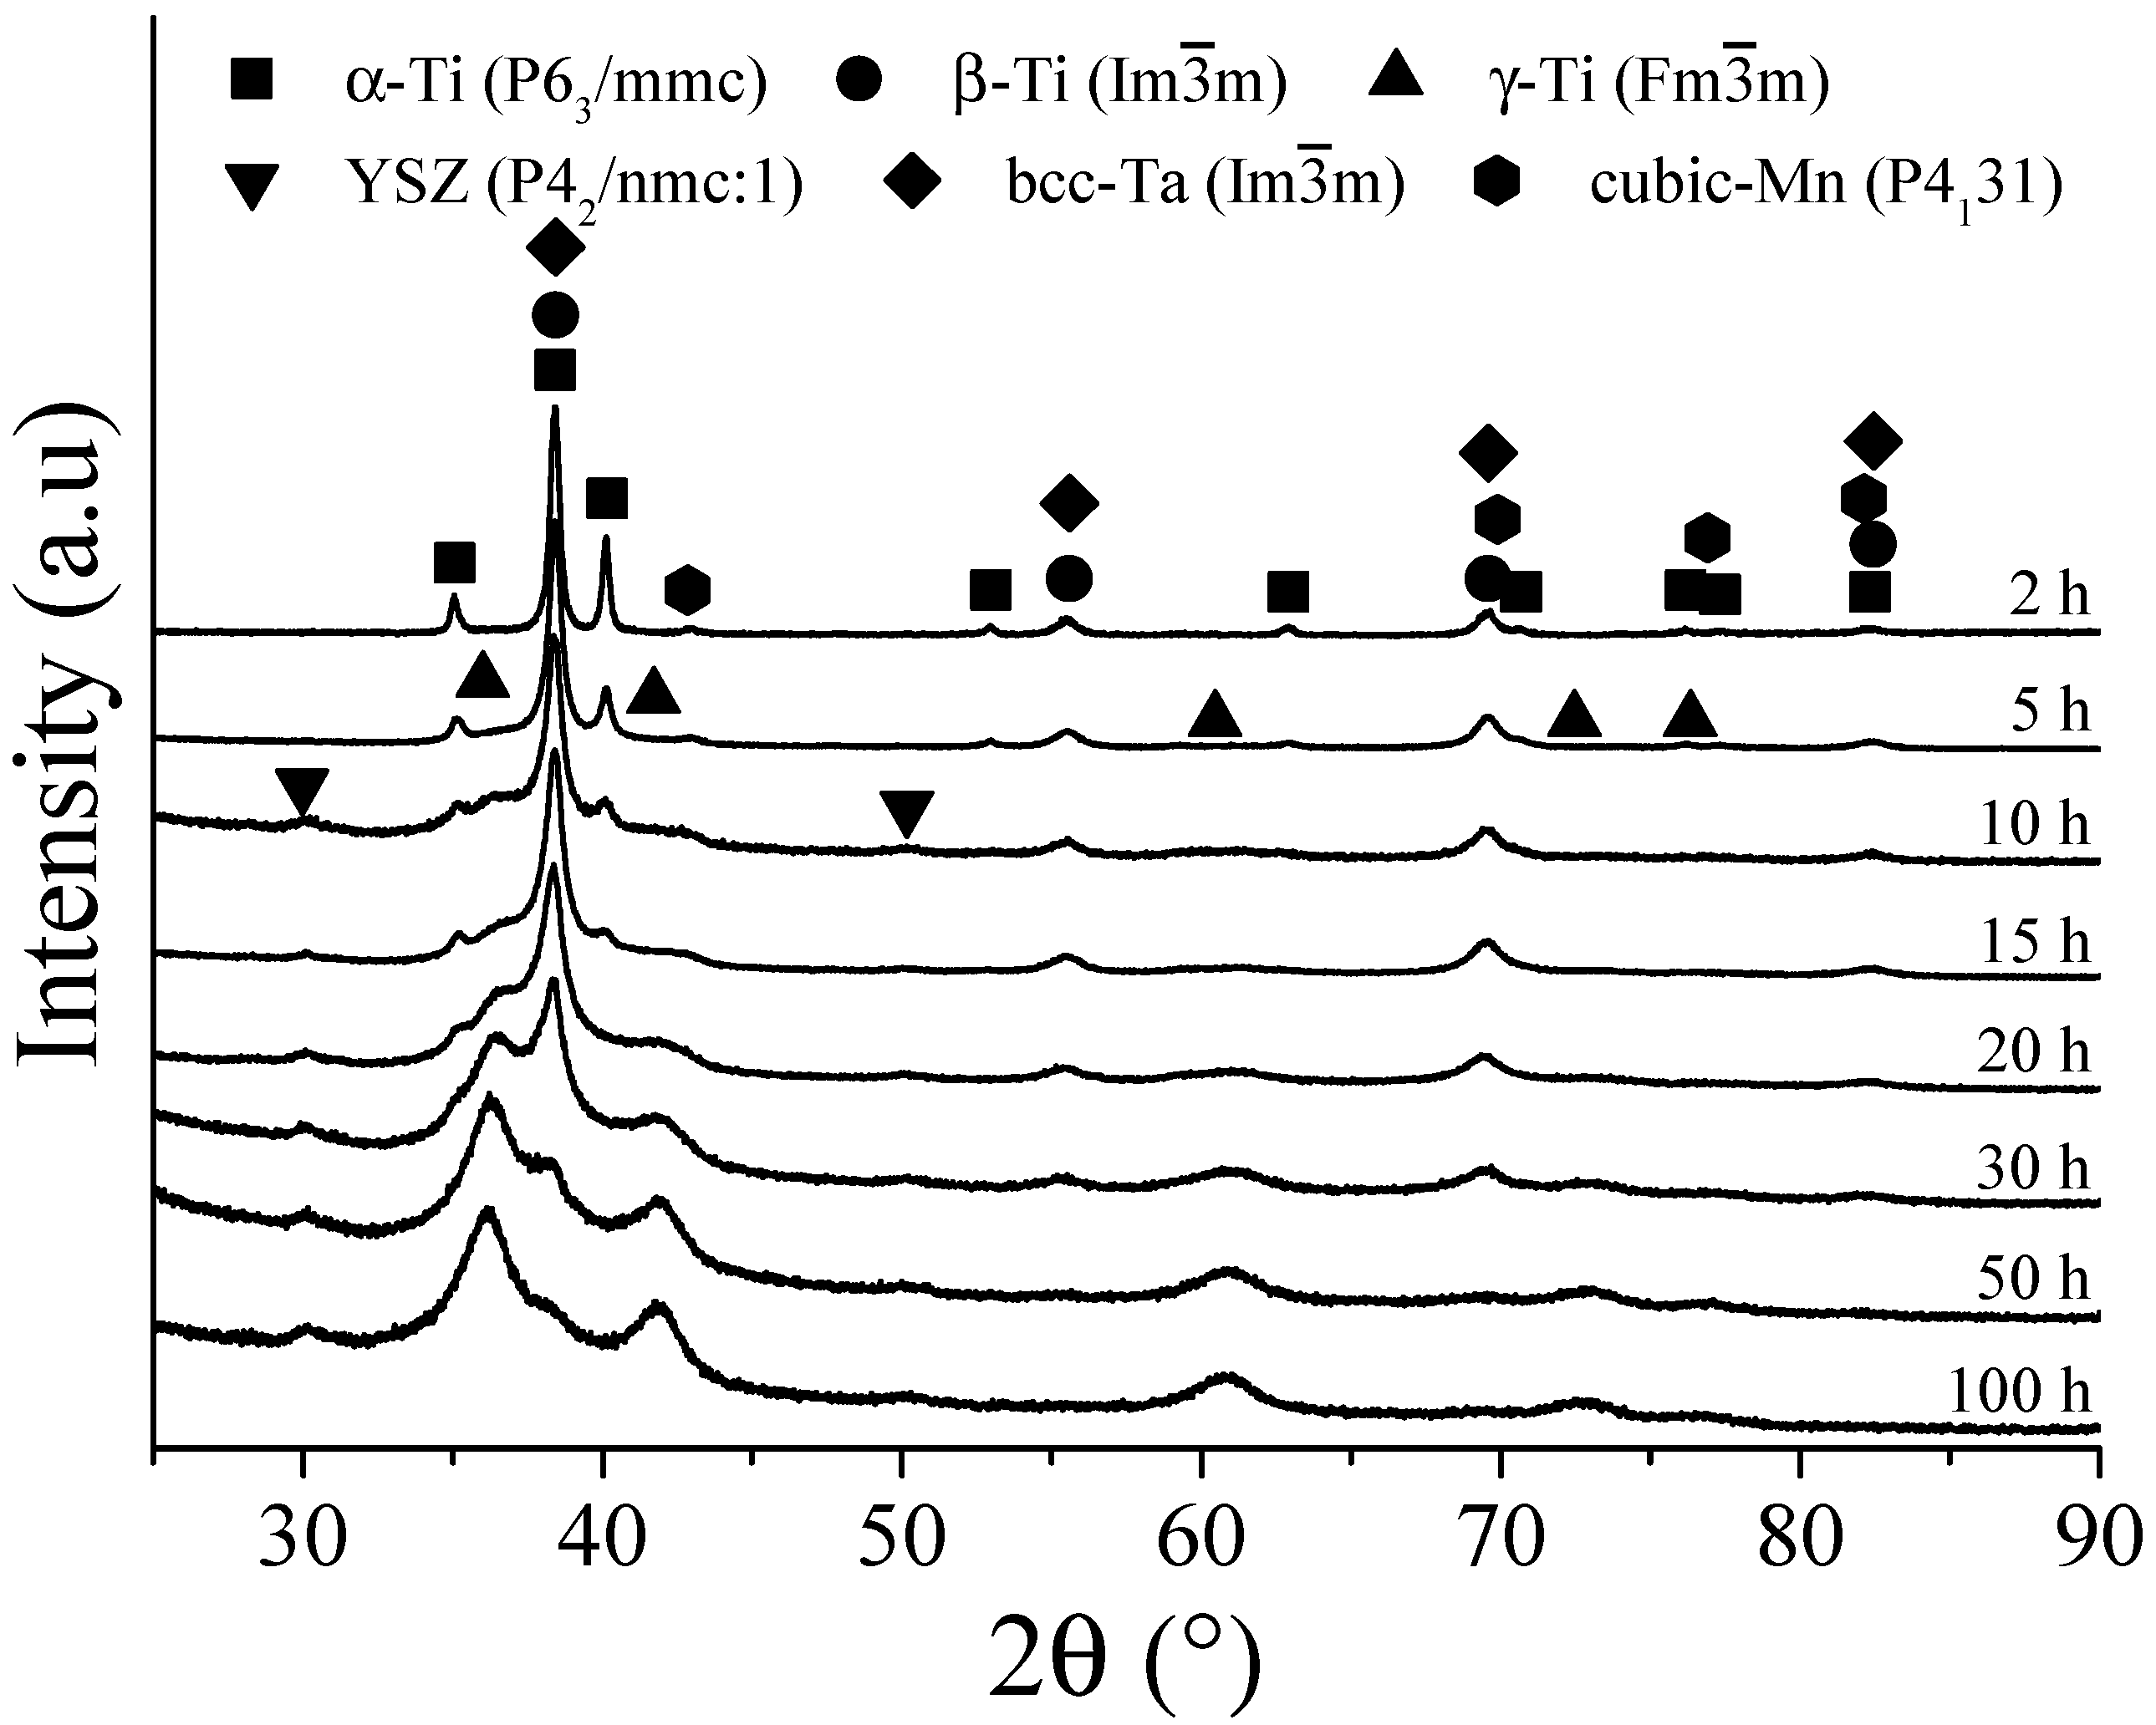
3.4. Ti-13Ta-6Mn Alloy

Figure 5 shows the XRD patterns of the Ti-13Ta-6Mn alloys after different milling times. At 2 h of MA, the peaks of Mn (COD ID 1539039), Ta (COD ID 1541266), α-Ti, and β-Ti phases are observed. The amount of Mn and Ta decrease to 4 at. % each (Table 1). At 5 h, an absence of Mn and Ta peaks was observed because they have entered in solid solution in Ti phases. The first peaks of the γ-Ti phase are observed at ≈36° and 42° in 2θ. Peaks of YSZ were identified at 10 and 20 h of MA; the peaks of the α-Ti phase disappear after 20 h. The same phenomenon was identified for the Ti-13Ta and Ti-13Ta-6Sn alloys during 15 h of MA, suggesting one or both Burger and SN transformations. The results suggest that the addition of Mn enhances the stability of α-Ti phase to long milling time; meanwhile, a broadening peak of the β-Ti phase is observed due to decreasing of the crystal size as well as increasing of the microstrain [69,70,71]. An increase in the intensity of the γ-Ti phase is observed due to the formation of this phase [84,85,86]. At 50 h, it is possible to appreciate the β-Ti → γ-Ti transformation due to the β-Ti peaks diminution of the intensity associated with a KS model. At higher milling times, the presence of the β-Ti phase can be observed in the Ti-13Ta-6Mn alloy, suggesting that the addition of Mn delays the formation of the γ-Ti phases in mechanical alloying. In Ti-13Ta and Ti-13Ta-6Sn alloys at higher milling times, the β-Ti phase was not observed.

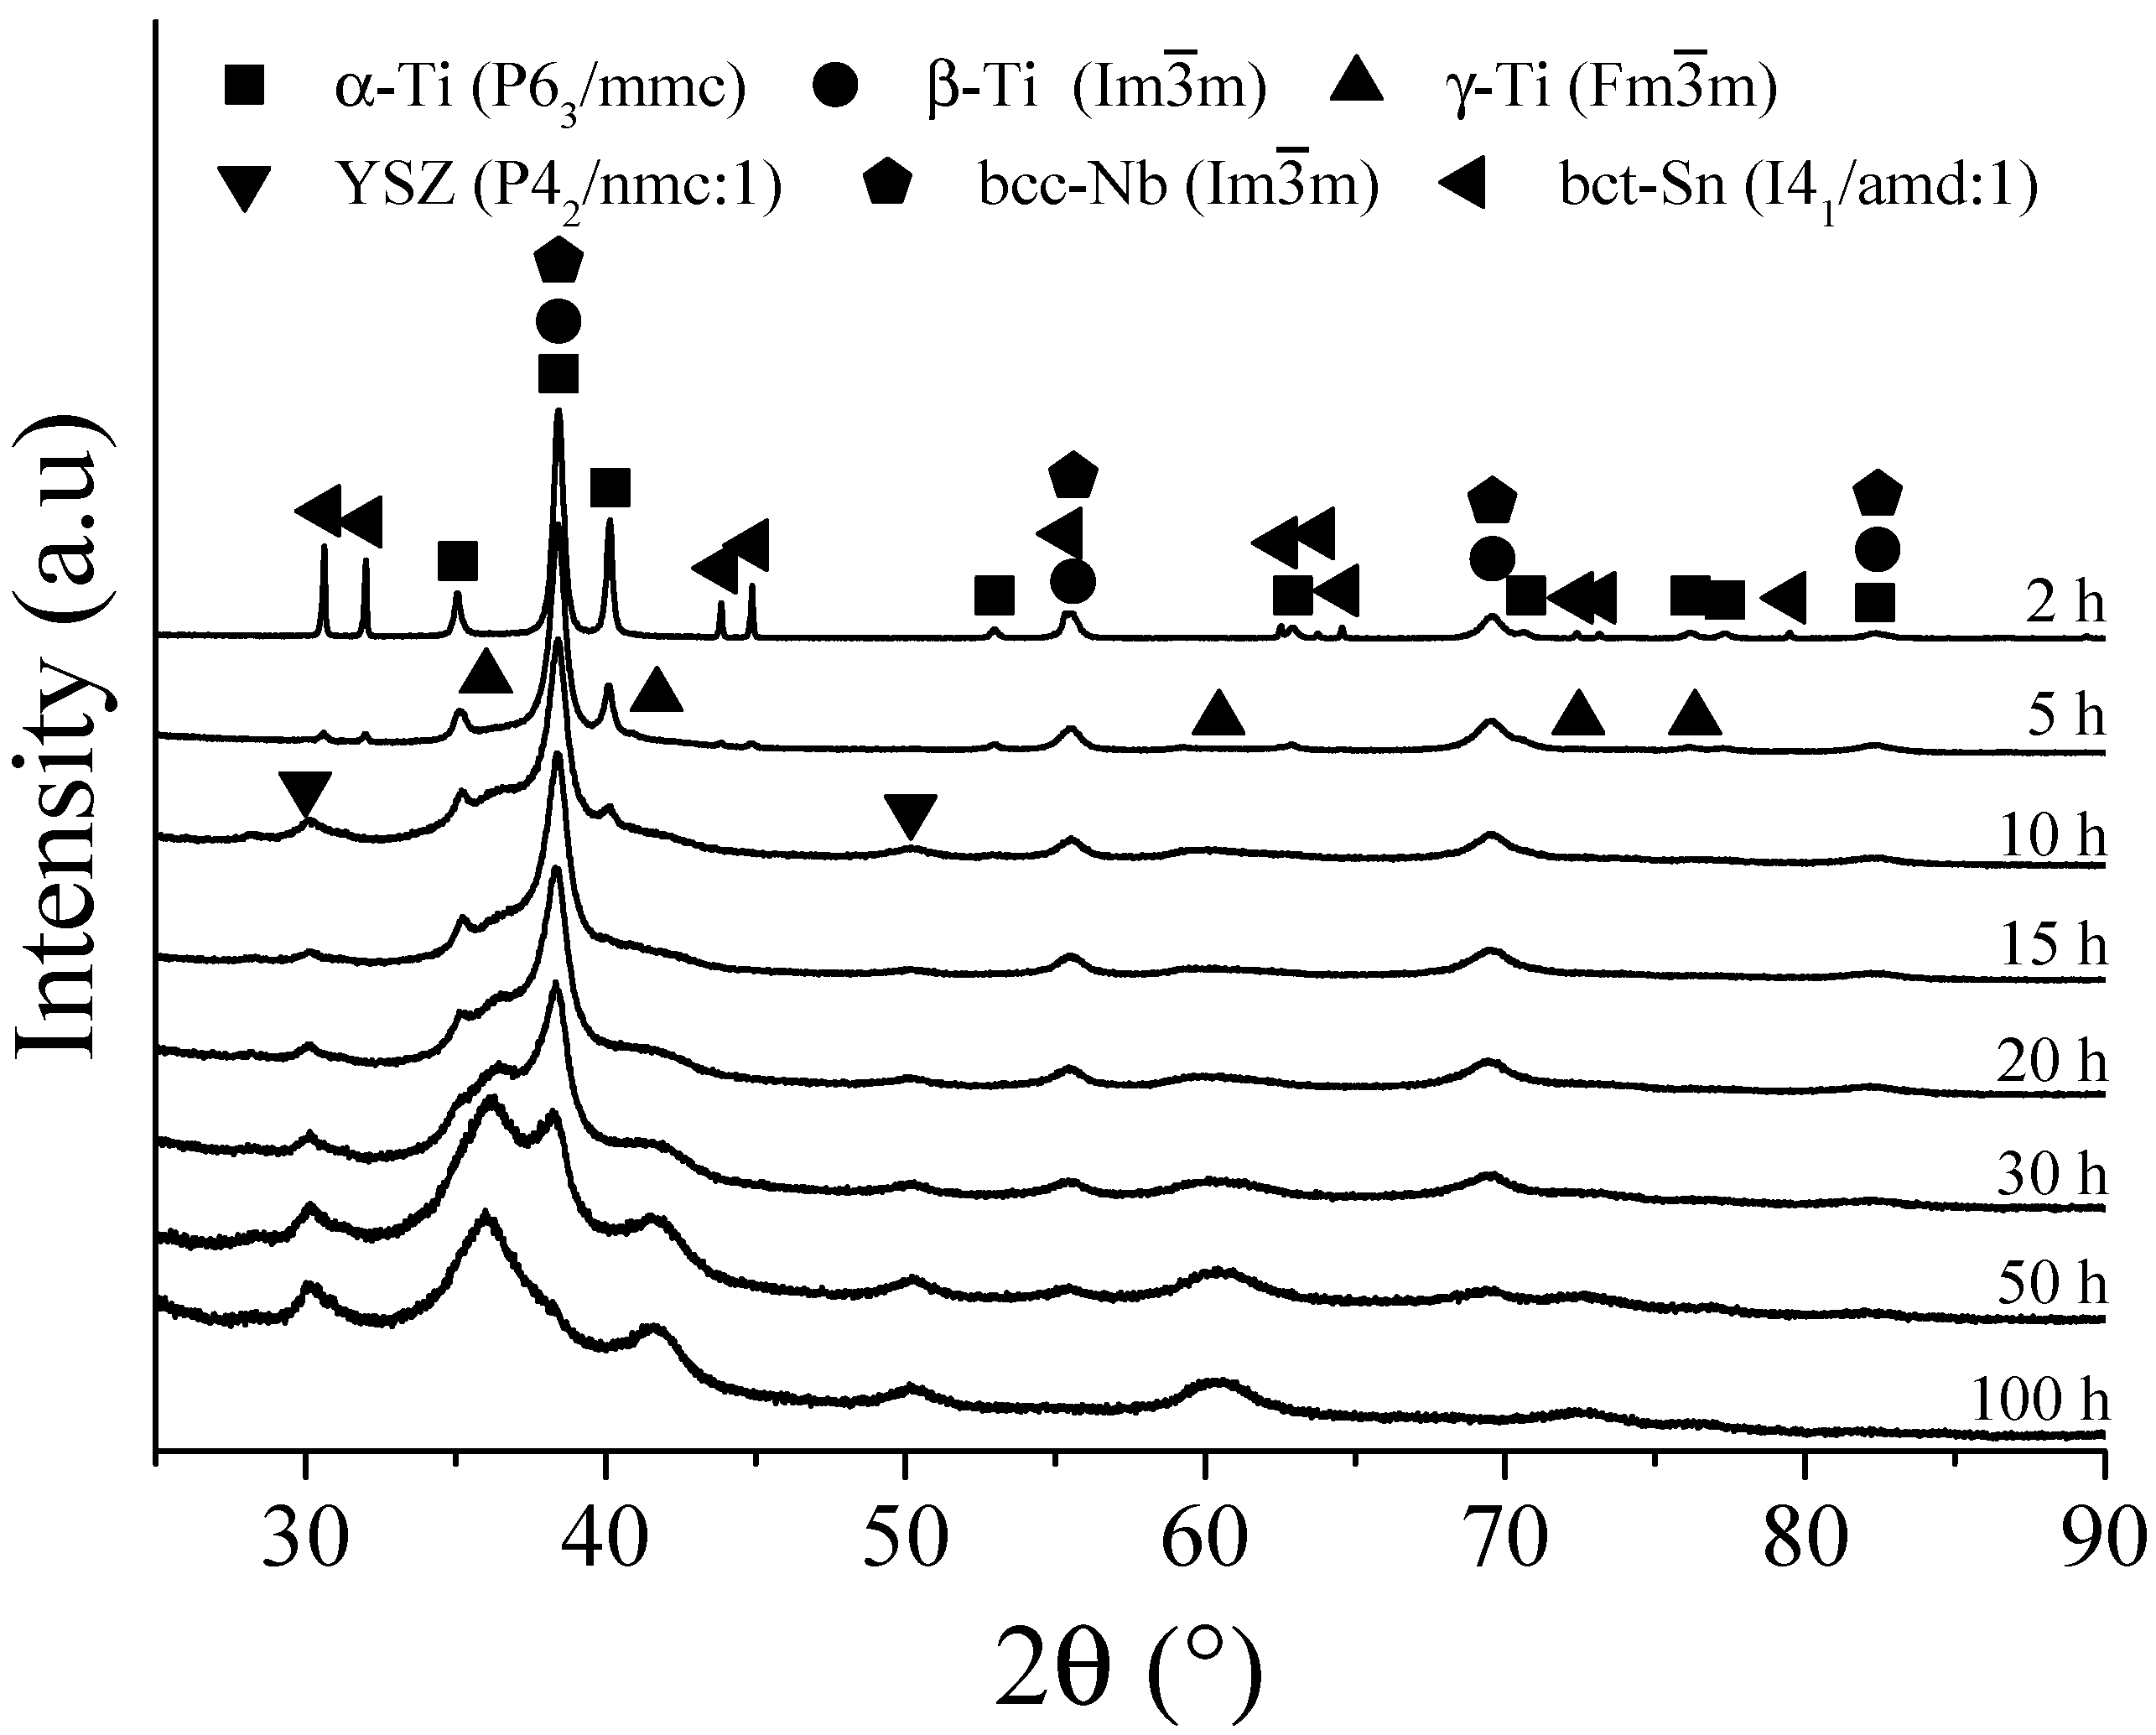
3.5. Ti-30Nb-6Sn Alloy

The X-ray diffraction patterns of the Ti-30Nb-6Sn alloys as a function of the milling times are given in Figure 6. At 2 h of MA, the peaks of Nb (COD ID 1539041), Sn (COD ID 1534488), α-Ti, and β-Ti phases were identified. The amount of Nb and Sn decreased from 30 at. % to 13 at. % and 6 at. % to 3 at. %, respectively (see Table 1). At 5 h, the peaks of γ-Ti and β-Ti are observed, and the peaks of Nb, Sn, and α-Ti decreased. At 10 h, the Sn peaks are not observed. In addition, contamination (YSZ) from milling media and jars was observed. α-Ti peaks are not present at 20 h of MA. The same behavior was observed at the same milling time for the Ti-13Ta-6Mn alloy and Ti-13Ta and Ti-13Ta-6Sn alloys at 15 h. These results suggest that the addition of Nb retards the α-Ti phase transformation to another phase. The β-Ti peaks present changes in broadening and intensity produced by the severe plastic deformation [82,83]. At 30 and 50 h, the γ-Ti peaks are increasing their intensity, and the β-Ti phase decrease in intensity and increase in broadening. At 100 h, the γ-Ti phase is predominant with a small presence of β-Ti and YZS phases.

3.6. Microstructural Evolution of the Ti-Based Phases

The characterization of the microstructural evolution of the α-Ti, β-Ti, and γ-Ti phases was carried out by Rietveld refinements. The figure merit values (goodness of fit (Gof) and Rwp) of all refinements were around 2 and 10% for the Gof and Rwp, respectively. According to the literature, a refinement is considered excellent when 1 < Gof < 2 and Rwp < 10% [87,88,89]. The lattice parameter c/a ratio for the α-Ti phase (hcp) ranged between 1.587 and 1.617. The lattice parameter of the β-Ti phase (bcc) was between 0.331 and 0.336 nm, and the γ-Ti phase exhibits a lattice parameter between 0.425 and 0.432 nm for all Ti alloys. The maximum contamination of YSZ from balls and jars was quantified as follows: 15%, 13%, 6%, and 23% (wt. %) for the Ti-13Ta, Ti-13Ta-6Sn, Ti-13Ta-6Mn, and Ti-30Nb-6Sb alloys, respectively. The evolution of α-Ti, β-Ti, and γ-Ti phases as a function of the milling time is shown in Figure 7a–c, respectively. The α-Ti phase decreased exponentially with milling time ( α Ti ( t ) = 0.64 + 60.3 e ( 0.12 t ) , RMS = 5.5 ), up to disappearing for milling times higher than 30 h for all alloys, as shown in Figure 7a. This shows the instability of the crystalline structure at long milling times. The α-Ti phase disappears first for the Ti-13Ta and Ti-13Ta-6Sn alloys, following for the Ti-13Ta-6Mn and Ti-30Nb-6Sn alloys. These results suggest that the Ta and Sn destabilize the α-Ti phase compared with Nb and Mn elements. The content of the β-Ti phase increases from 5 to 10 h; after that, it remained constant with an average of ≈60 wt. % at 15 h of MA. At 20 h of MA, the content of the β-Ti phase decreases and finally disappears at 50 h of MA for the Ti-13Ta and Ti-13Ta-6Sn alloys. At 100 h, the β-Ti phase is observed for the Ti-13Ta-6Mn and Ti-30Nb-6Sn alloys (≈12 wt. %); see Figure 7b. The γ-Ti phase increases its content as the milling time increases (see Figure 7c). As the formation rate of the β-Ti phase is higher than that of the γ-Ti phase, it suggests that β-Ti requires smaller mechanical energy than the γ-Ti phase to be formed. In general, the α-Ti phase mainly promotes the formation of the γ-Ti phase, as seen in Figure 7a,c. Yang et al. [90] reported a transformation mechanism from hcp to fcc phase in cold-rolled pure Ti, suggesting that the slip should be the predominated stage of transformation, which is known as a slip-controlled phase transition. All the results suggest that the transformation from β-Ti to γ-Ti phase is induced by deformation.
The evolution of the microstrain values (<ε2>1/2) for α-Ti, β-Ti, and γ-Ti phases is shown in Figure 8a–c, respectively. In the α-Ti phase, a higher value of <ε2>1/2 (1.85 × 10⁻²) was observed in Ti-13Ta alloy at 15 h compared with all other alloys. This value was due to the plastic deformation [91,92,93] suffered by the hcp crystal structure [62,94]. For the β-Ti phase at time less than 15 h, low values of <ε2>1/2 were observed; this effect could be associated with: (i) transformation induced by deformation from α-Ti to β-Ti and (ii) the stability of the β-Ti phase, furthering the reduction of the microstrain [31,32,33,34,95,96]. At 30 h, for the Ti-13Ta and Ti-13Ta-6Sn alloys, the <ε2>1/2 reaches a maximum value of β-Ti compared with the Ti-13Ta-6Mn and Ti-30Nb-6Sn alloys; see Figure 8b. This increment could be related to the β-Ti to γ-Ti transformation, which is indicated by the total absence of β-Ti and the presence of 100% of the γ-Ti phase in the next hour of milling (see Figure 7b–c). At times longer than 30 h, the <ε2>1/2 of Ti-13Ta-6Mn and Ti-30Nb-6Sn alloys continue increasing, whereas the Ti-13Ta and Ti-13Ta-6Sn alloys decrease due to mechanical crystallization [97]. The microstrain values of the γ-Ti phase decrease as the milling times increased for all alloys, as can be seen in Figure 8c, indicating the stability of this phase over a long milling time. The microstrain values for the Ti-13Ta-6Mn and Ti-30Nb-6Sn alloys show a relatively constant value between 50 h and 100 h, which is associated with the high deformation capacity of the fcc phase [98,99].
Figure 9 shows the crystallite size evolution of α-Ti, β-Ti, and γ-Ti phases, respectively. Figure 9a shows the variation of the crystal size of the α-Ti phase, and it can be observed that at 2–5 h of MA, the crystallite size increases for the Ti-30Nb-6Sn alloy and decrease for all the other Ti alloys. This result could be associated with the addition of Ta, which promotes the stabilization of the β-Ti phase and instability of the hcp crystal structure of the α-Ti phase [100]. Between 5 h and 30 h, the α-Ti crystallite size values presented oscillations. This could be related to the fact that severe plastic deformation and mechanical crystallization of the α-Ti phase occurred; this effect could be verified with the increase in the <ε2>1/2 (see Figure 8a) and ρp (see Figure 9a) [97,101,102]. The highest crystallite size values of the α-Ti phase were observed between 118 nm and 282 nm. After that, the α-Ti phase is not observed. In Figure 9b, the crystallite size of the β-Ti remained constant, with values ranging from 5 nm to 19 nm. The β-Ti crystallite size of the Ti-30Nb-6Sn alloy increases after 50 h, suggesting mechanical crystallization [97]. At the same time, the Ti-13Ta-6Mn alloy remained constant. The crystallite size of γ-Ti decreases quickly when milling time increases, supporting the fact that the stability of this phase requires small crystallite size [103]. The crystallite size is kept constant with an average value of 5 nm (±0.6 nm) after 20 h milling time for all alloys. Xiong et al. [103] studied the dependence of the crystallite size with temperature on the phase transformation of pure Ti from hcp to fcc. The Gibbs free energy values at 777 K showed that the γ-Ti phase is stable in nanoparticles, nanowires, and nanofilms when the size is smaller than 27 nm, 19 nm, and 9 nm, respectively, which is following the values for crystallite size after 20 h of milling in the γ-Ti phase.
The dislocation density values (ρp) for α-Ti, β-Ti, and γ-Ti phases are shown in Figure 10a–c, respectively. The α-Ti phase shows lower ρp values for all milling times than all other phases. This could be related to the activation of slip systems in the hcp crystal structure of the α-Ti phase and the store plastic deformation energy [97,102,104,105,106,107]. For the β-Ti, the increment of ρp values could be related with transformation induced by deformation from α-Ti to β-Ti [33,34,41,43,96], indicating that the formation of this phase requires a high number of ρp to its formation below 30 h of MA. However, in Ti13Ta and Ti13Ta6Sn alloys, at the β-Ti phase before its absence at 30 h, a diminution of ρp was observed. It suggests an instability or a condition of transformation from β-Ti to γ-Ti. On the other hand, for the γ-Ti, low values of ρp below 20 h were observed. This could be associated with the crystallization and formation of γ-Ti. Nevertheless, after 20 h, the ρp values remain relatively constant, indicating a steady state and stability of γ-Ti in long milling times.

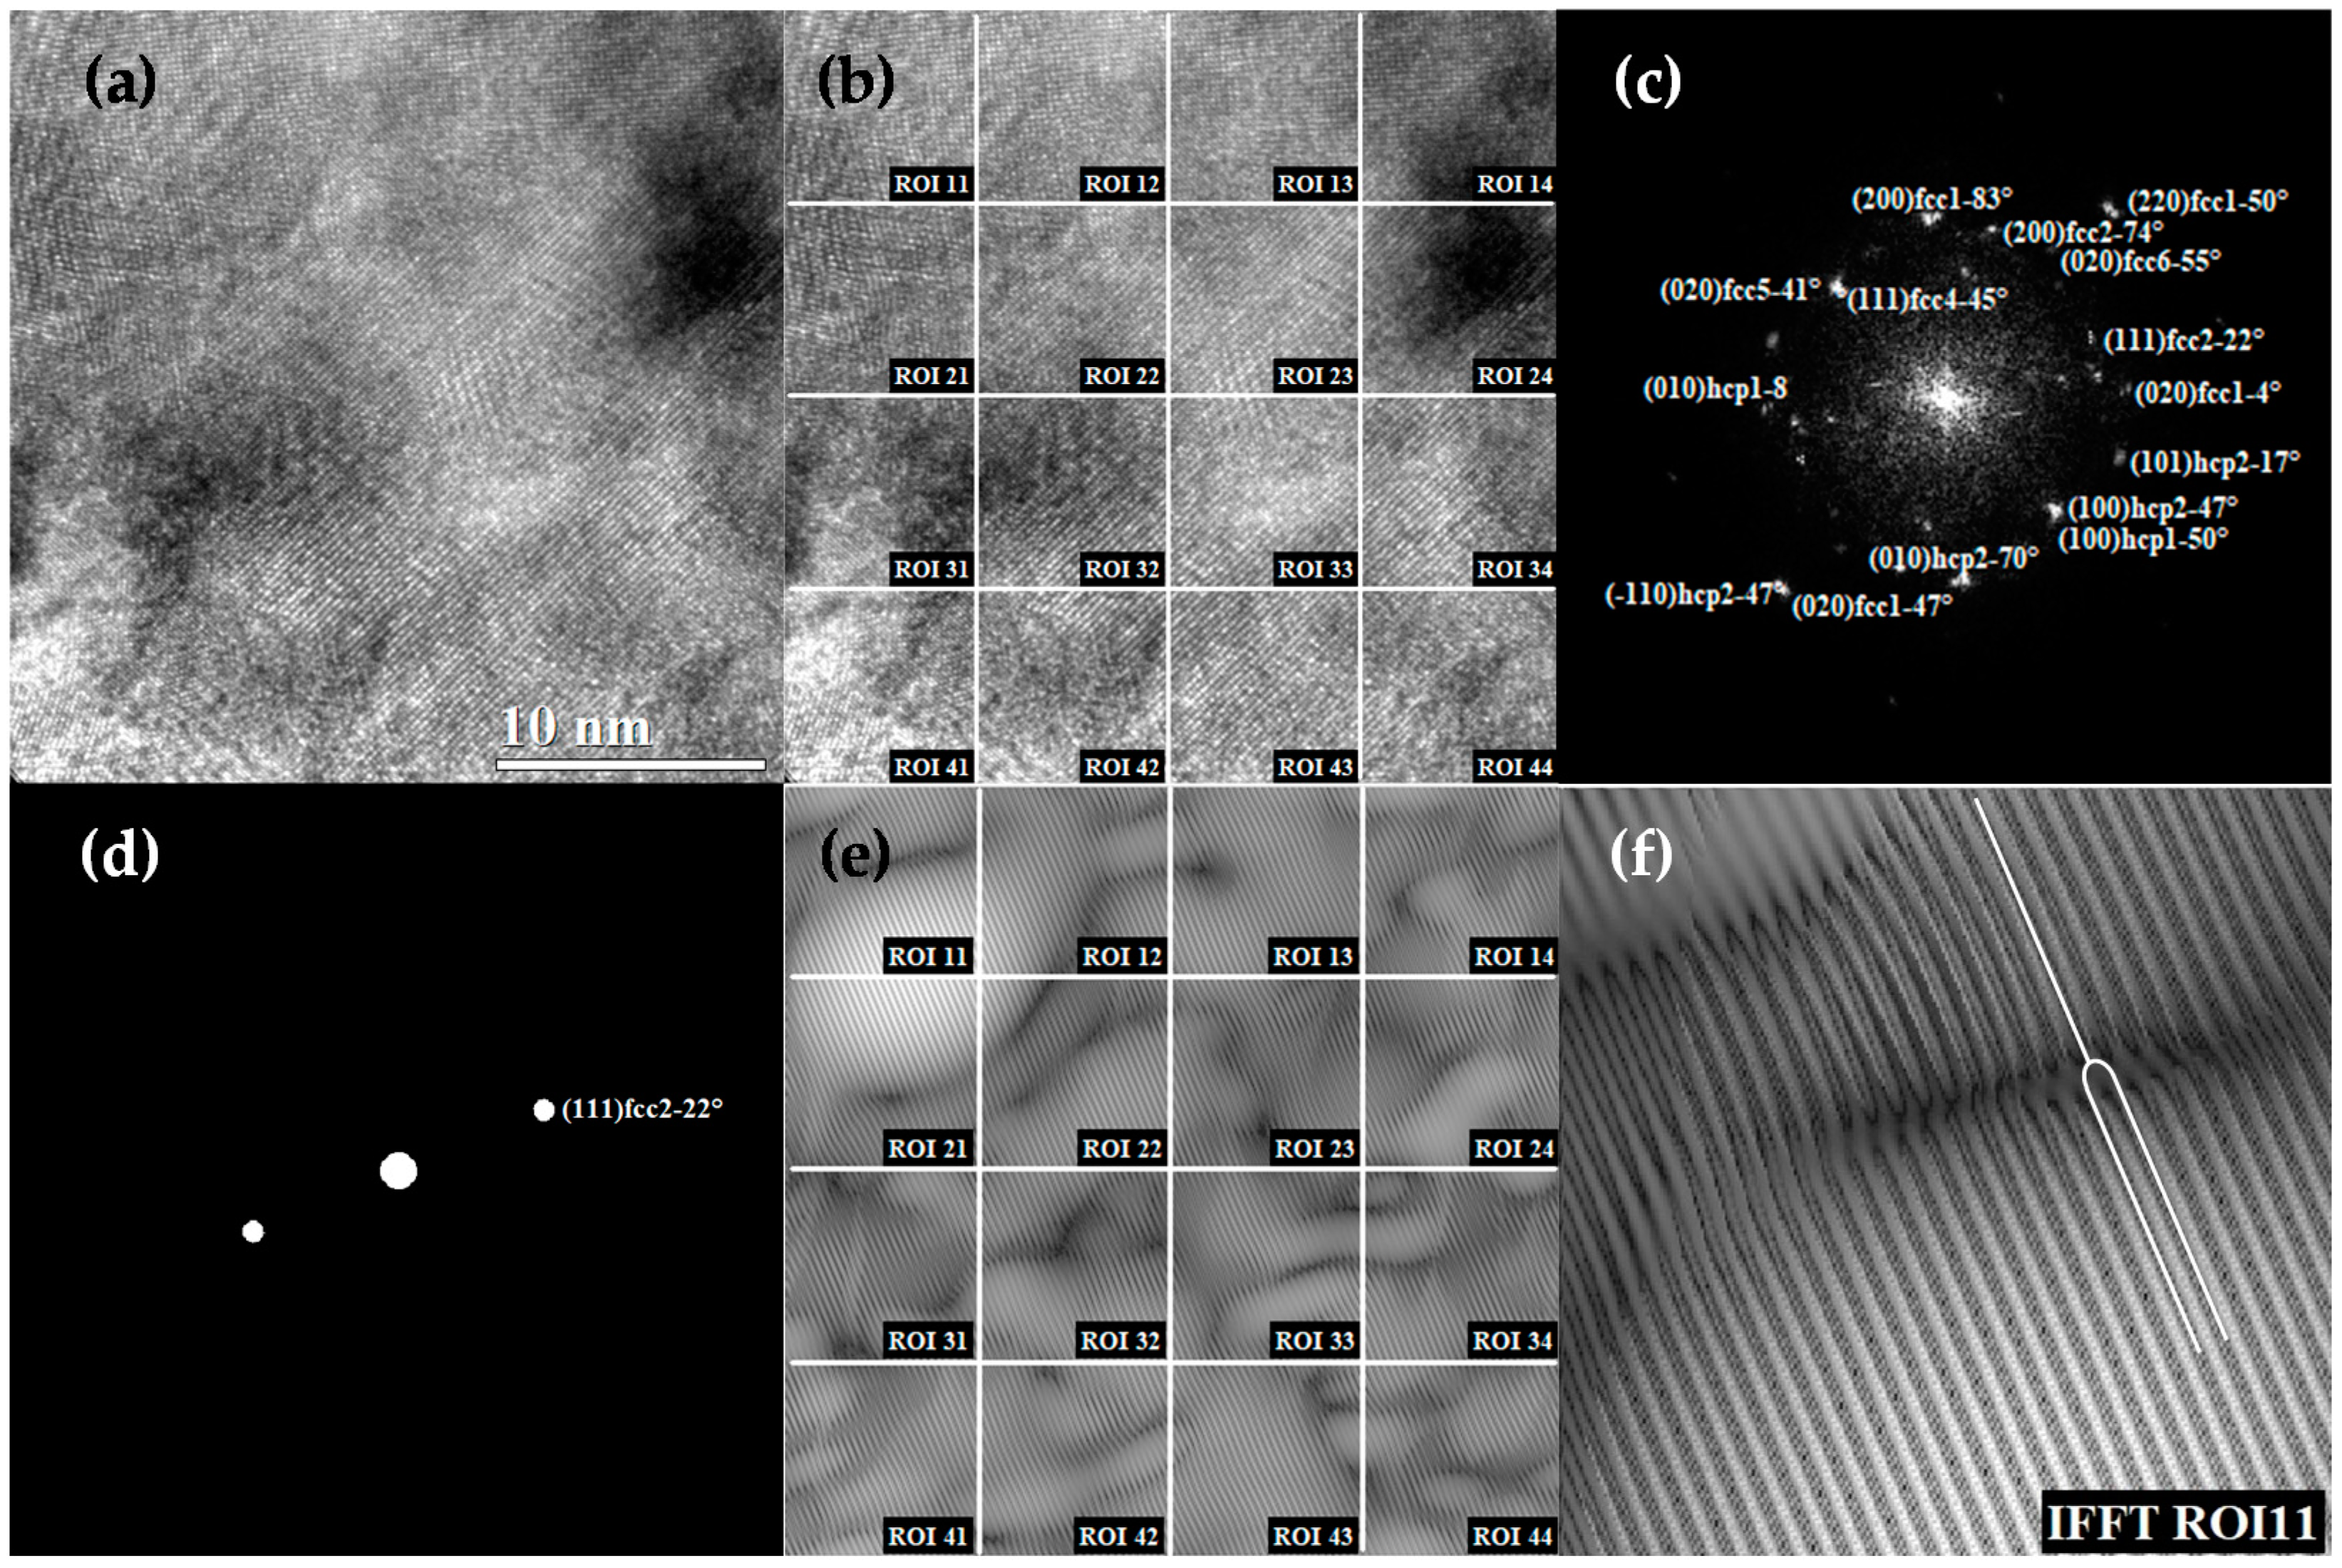
3.7. Analysis of Dislocation Density Obtained by TEM and XRD for Ti13Ta6Sn Alloy

Ti13Ta6Sn alloys exhibit higher potential to synthesize Ti-based alloys with an fcc crystal structure. The density dislocations were obtained using Equation (3) with the <110>α-Ti, <111> β-Ti, and <110> γ-Ti directions. A comparison of ρs values determined by XRD and TEM is given in Table 2. The ρs values determined by TEM are lower than the values determined by XRD for all phases. According to Bailey and Hirsch [108], an important source of error in TEM analysis increases the difficulty of solving individual dislocation in regions of high dislocation density due to overlapping. For these reasons, the determination of density dislocation by TEM images requires high consumption time to determine comparable values by TEM and XRD analyses. However, in both analyses, it is possible to observe a tendency in the dislocation density values: the lowest for α-Ti, the middle for β-Ti (except at 15 h), and the highest for γ-Ti (below 50 h). This tendency would be related to the activation slip system of each phase. The high values of ρs in γ-Ti below 50 h could be associated with the initial condition of its formation, requiring high levels of deformation in low milling times. While in long milling times, the reduction of ρs values until a steady state indicates the stability of the γ-Ti phase.

4. Conclusions

According to the X-ray diffraction and Rietveld refinement analyses, the microstructural evolution of the formation of the γ-Ti phase could be summarized in three different stages:
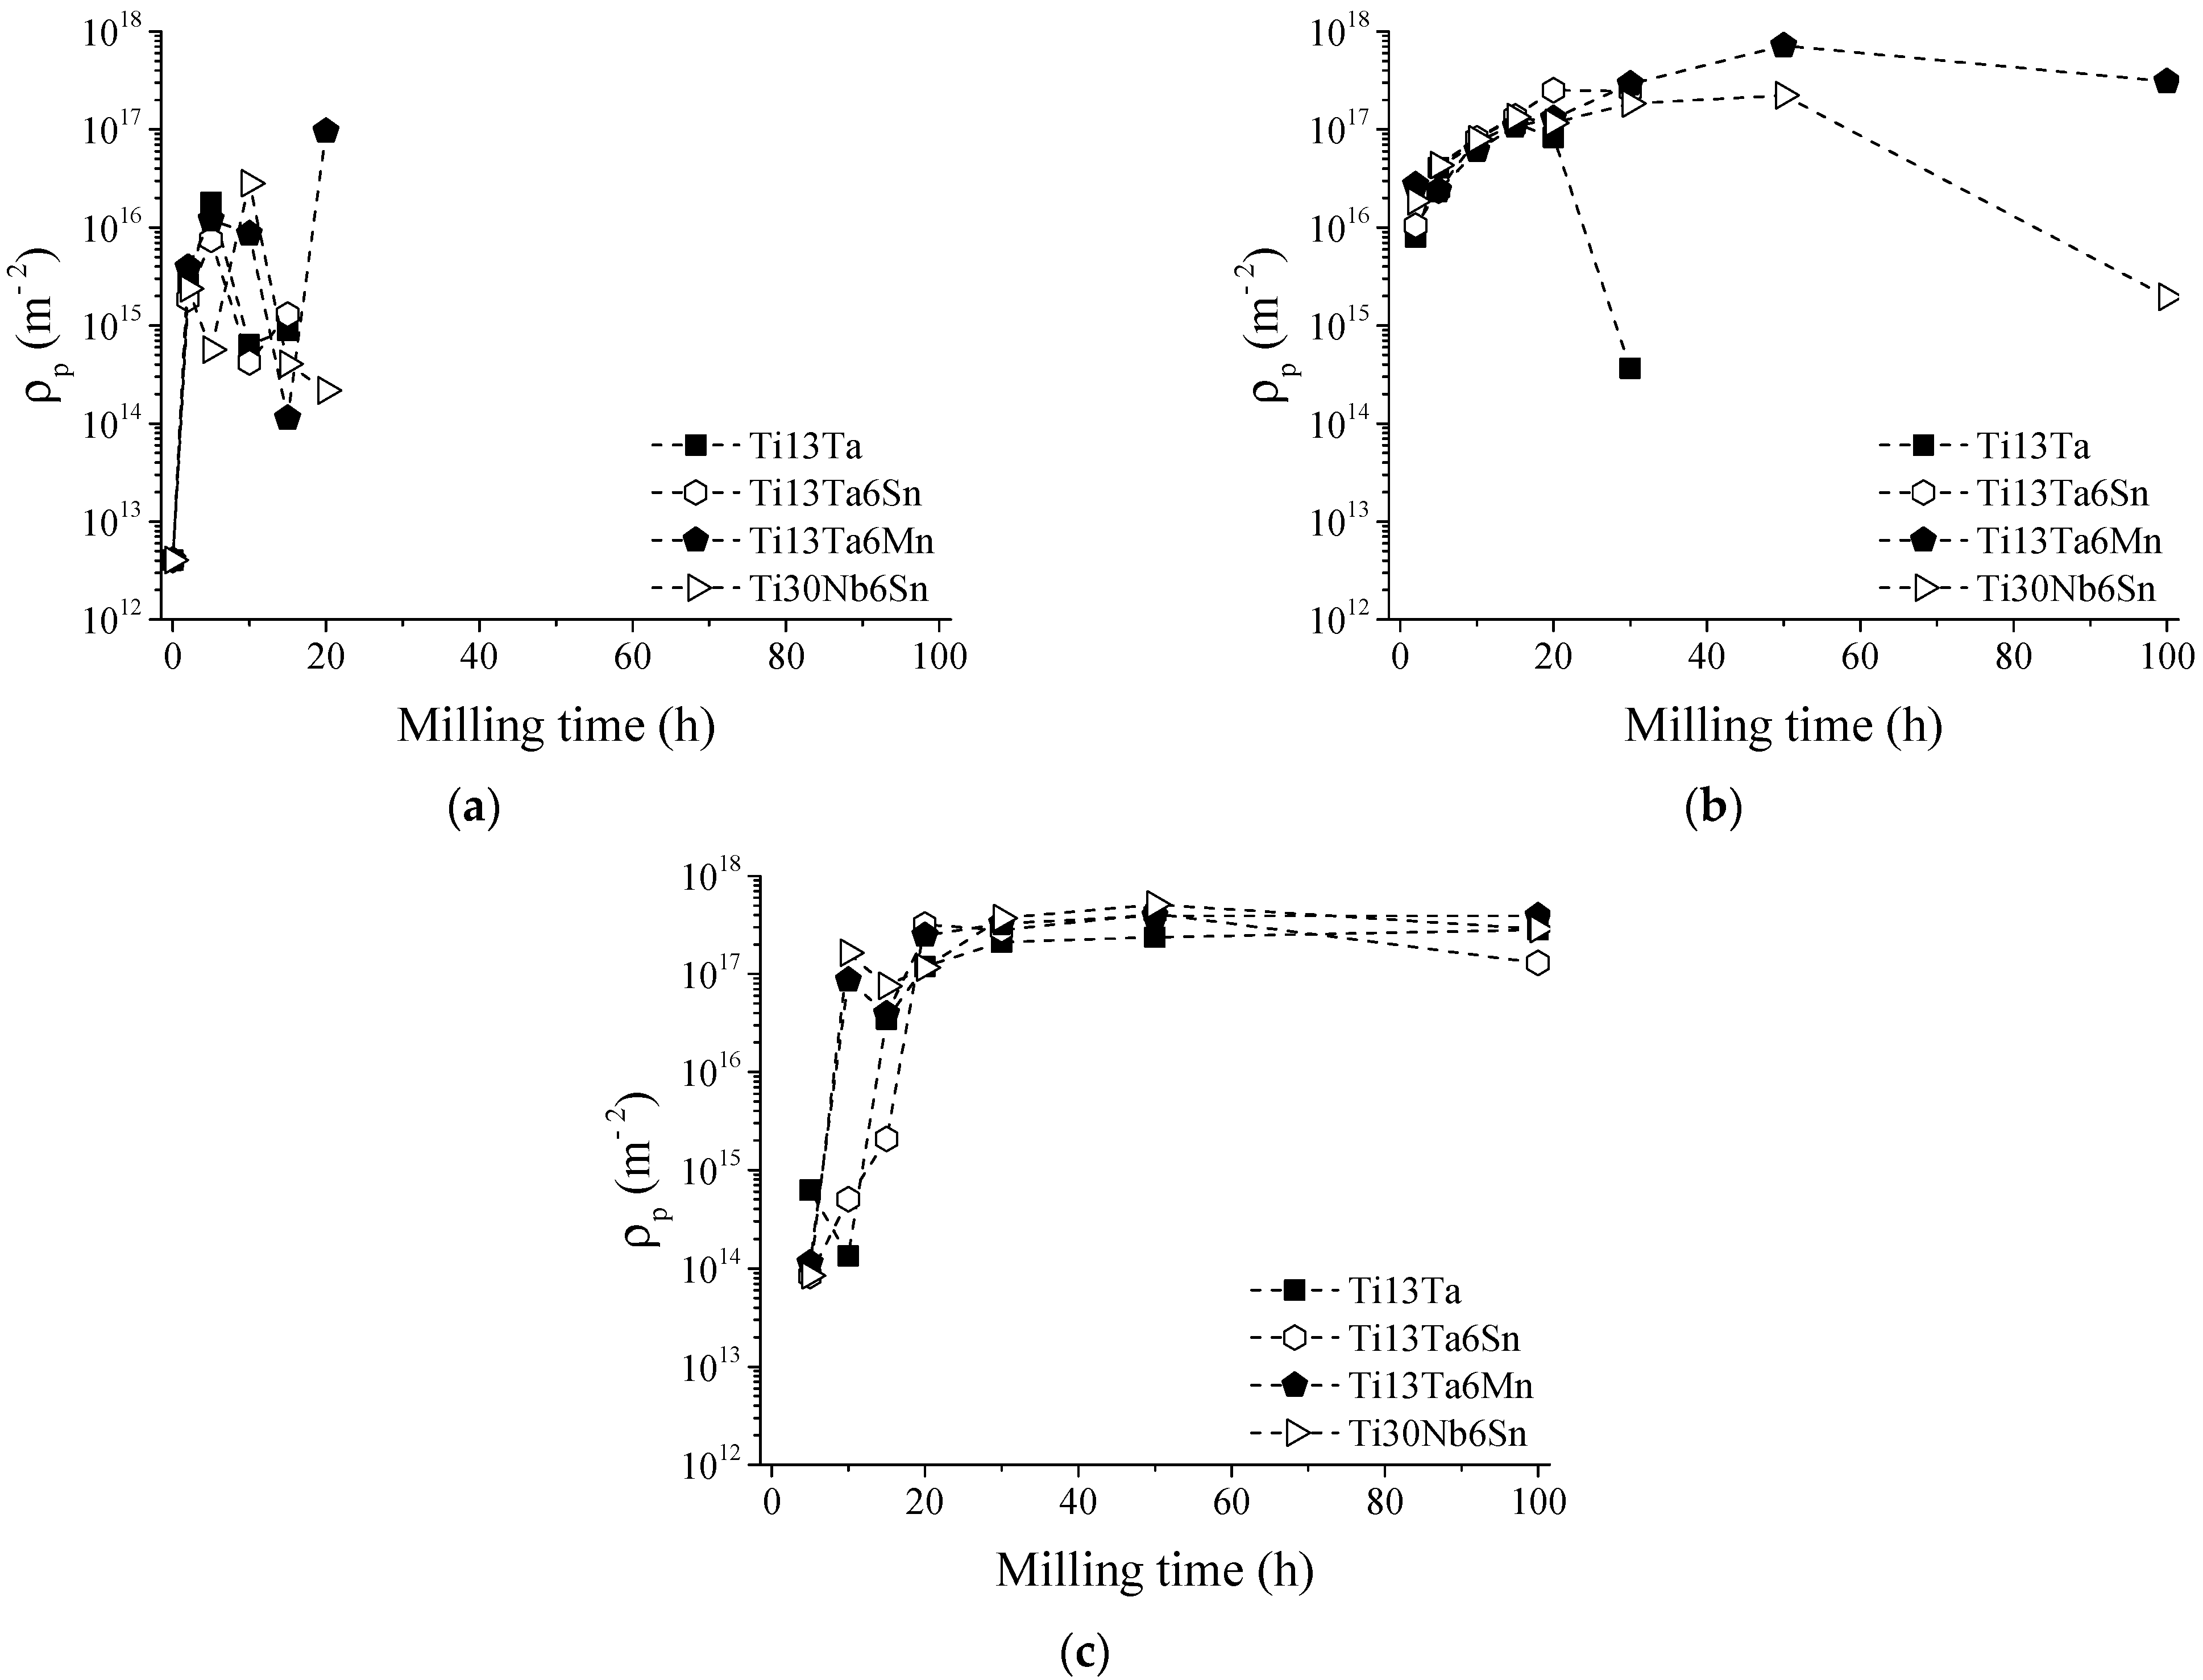
  • In the first hours of MA (2–5 h), the diffusion of solute elements and solid solution formation was performed. At the same time, the transformation conditions from hcp to bcc or fcc were identified. During the transformation from hcp to bcc crystal structure, low microstrain values, dislocation density, and crystalline size were observed, in a range of 1.8 × 10⁻³ m−2 to 6.47 × 10⁻³ m−2, 5.4 × 10¹⁴ m−2 to 1.77 × 10¹⁶ m−2, and 14 nm to 34 nm, respectively. In addition, high microstrain and crystalline size values were identified, around 2.5 × 10⁻² to 3.23 × 10⁻²  ε 2 1 / 2 and 119 nm to 327 nm, respectively, during the transformation from hcp to fcc crystal structure.
  • In the period from 5 h to 15 h of MA, the α-Ti phase content decreased, and the microstrain and crystallite size values increased. The content of the β-Ti phase, microstrain, crystallite size, and dislocation density remained relatively constant, indicating its stability in this interval of time. However, the microstrain and crystalline size decreased as the dislocation intensity increased. These facts were associated with the γ-Ti phase stabilizing in long milling times.
  • From 15 to 30 h, the total absence of the α-Ti phase was identified for Ti-13Ta and Ti-13Ta-6Sn alloys. Except for Ti-13Ta-6Mn and Ti-30Nb-6Sn alloys, this result indicates that adding Mn and Nb stabilizes the α-Ti phase for long milling times. The content of the β-Ti phase starts decreasing without changes in its crystallite size (except to the Ti-13Ta) but increasing its microstrain, indicating the instability of the bcc-Ti crystal structure. Nevertheless, the content of the γ-Ti phase increased at all milling times while the microstrain, crystallite size, and dislocation density decreased, which indicates the stable conditions of the γ-Ti. From 30 h onwards, high microstrain values of the β-Ti phase were registered. In the next hour of milling, 100% of the γ-Ti phase (50 h) for the Ti-13Ta and Ti-13Ta-6Sn alloys were observed. This condition could be due to the transformation from β-Ti to γ-Ti, for which a big microstrain is required. On the other hand, in the Ti-13Ta-6Mn and Ti-30Nb-6Sn alloys, the microstrain of β-Ti increased after 50 h. However, at 100 h, a high content of γ-Ti with low quantities of β-Ti phases was quantified, indicating that these alloys keep the β-Ti phase stable over long milling times.

Supplementary Materials

The following are available online at https://www.mdpi.com/article/10.3390/met11111841/s1, Figure S1: Rietveld refinement of the XRD patterns for the Ti-13Ta at: (a) 2, (b) 5, (c) 10, (d) 15, (e) 20, (f) 30, (g) 50 and (h) 100 h of MA, experimental data (point) and modelling result (line), Figure S2: Rietveld refinement of the XRD patterns for the Ti-13Ta-6Sn at: (a) 2, (b) 5, (c) 10, (d) 15, (e) 20, (f) 30, (g) 50 and (h) 100 h of MA, experimental data (point) and modelling result (line), Figure S3: Rietveld refinement of the XRD patterns for the Ti-13Ta-6Mn at: (a) 2, (b) 5, (c) 10, (d) 15, (e) 20, (f) 30, (g) 50 and (h) 100 h of MA, experimental data (point) and modelling result (line), Figure S4: Rietveld refinement of the XRD patterns for the Ti-30Nb-6Sn at: (a) 2, (b) 5, (c) 10, (d) 15, (e) 20, (f) 30, (g) 50 and (h) 100 h of MA, experimental data (point) and modelling result (line), the difference between experimental and calculated patterns is given below, Table S1: Results of Rietveld analysis for the Ti-13Ta alloy, Table S2: Results of Rietveld analysis for the Ti-13Ta-6Sn alloy, Table S3: Results of Rietveld analysis for the Ti-13Ta-6Mn alloy, Table S4: Results of Rietveld analysis for the Ti-30Nb-6Sn alloy.

Author Contributions

Conceptualization, E.P. and C.A.; methodology, E.P.; software, E.P.; validation, C.A., A.M. and F.M.C.C.; formal analysis, E.P.; investigation, E.P.; resources, C.A.; data curation, C.A. and A.M.; writing—original draft preparation, E.P.; writing—review and editing, E.P., C.A., A.M., F.M.C.C. and C.M.; visualization, E.P. and C.M.; supervision, C.A., A.M., C.M. and F.M.C.C.; project administration, C.A. and C.M.; funding acquisition, C.A. All authors have read and agreed to the published version of the manuscript.

Funding

This research received no external funding.

Data Availability Statement

Data sharing is not applicable to this article.

Acknowledgments

The authors would like to thank the financial support provided by FONDECYT grant n° 1190797 and FONDEQUIP grant n° EQM140095.

Conflicts of Interest

The authors declare no conflict of interest.

References

  1. Cardarelli, F.; Cardarelli, F. Less Common Nonferrous Metals. In Materials Handbook; Springer: Cham, Switzerland, 2018; pp. 317–695. [Google Scholar] [CrossRef]
  2. Froes, F.H. Titanium: Physical Metallurgy, Processing, and Applications; ASM International: Almere, The Netherlands, 2015; ISBN 9781627080804. [Google Scholar]
  3. Boyer, R.; Welsch, G.; Collings, E.W. Materials Properties Handbook—Titanium Alloys: 17.7 High-Temperature Strength; ASM International: Almere, The Netherlands, 1994; ISBN 978-0-87170-481-8. [Google Scholar]
  4. Bhattacharjee, A.; Saha, B.; Williams, J.C. Titanium Alloys: Part 1—Physical Metallurgy and Processing; Springer: Singapore, 2017; pp. 91–115. [Google Scholar]
  5. Eylon, D.; Fujishiro, S.; Postans, P.J.; Froes, F.H. High-Temperature Titanium Alloys—A Review. JOM J. Miner. Met. Mater. Soc. 1984, 36, 55–62. [Google Scholar] [CrossRef]
  6. Mouritz, A.P. Titanium alloys for Aerospace Structures and Engines. Introd. Aerosp. Mater. 2012, 202–223. [Google Scholar]
  7. Peters, M.; Kumpfert, J.; Ward, C.H.; Leyens, C. Titanium alloys for aerospace applications. Adv. Eng. Mater. 2003, 5, 419–427. [Google Scholar] [CrossRef]
  8. Gurrappa, I. Characterization of titanium alloy Ti-6Al-4V for chemical, marine and industrial applications. Mater. Charact. 2003, 51, 131–139. [Google Scholar] [CrossRef]
  9. Balazic, M.; Kopac, J.; Jackson, M.J.; Ahmed, W. Review: Titanium and titanium alloy applications in medicine. Int. J. Nano Biomater. 2007, 1, 3–34. [Google Scholar] [CrossRef]
  10. Luo, Y.; Yang, L.; Tian, M. Application of Biomedical-Grade Titanium Alloys in Trabecular Bone and Artificial Joints; Woodhead Publishing Limited: Southston, UK, 2013; ISBN 9780857090171. [Google Scholar]
  11. Koizumi, H.; Takeuchi, Y.; Imai, H.; Kawai, T.; Yoneyama, T. Application of titanium and titanium alloys to fixed dental prostheses. J. Prosthodont. Res. 2019, 63, 266–270. [Google Scholar] [CrossRef]
  12. Lyasotskaya, V.S.; Knyazeva, S.I. Metastable phases in titanium alloys and conditions of their formation. Met. Sci. Heat Treat. 2008, 50, 373–377. [Google Scholar] [CrossRef]
  13. Gao, J.; Rainforth, W.M. The Effect of Heating Rate on Discontinuous Grain Boundary Alpha Formation in a Metastable Beta Titanium Alloy. Metall. Mater. Trans. A Phys. Metall. Mater. Sci. 2020, 51, 3766–3771. [Google Scholar] [CrossRef]
  14. Skvortsova, S.V.; Ilyin, A.A. Mechanisms of phase and structural transformations and texture formation in titanium alloy sheet semiproducts. Russ. Metall. 2007, 2007, 355–363. [Google Scholar] [CrossRef]
  15. Xing, L.L.; Zhao, C.C.; Chen, H.; Shen, Z.J.; Liu, W. Microstructure of a Ti–50 Wt% Ta alloy produced via laser powder bed fusion. Acta Metall. Sin. 2020, 33, 981–990. [Google Scholar] [CrossRef]
  16. Prasanthi, T.N.; Sudha, C.; Ravikirana; Saroja, S. Formation and reversion of metastable fcc phase in a Ti-5Ta-2Nb explosive clad. Mater. Charact. 2016, 116, 24–32. [Google Scholar] [CrossRef]
  17. Chatterjee, P.; Sen Gupta, S.S. An X-Ray diffraction study of strain localization and anisotropic dislocation contrast in nanocrystalline titanium. Philos. Mag. A Phys. Condens. Matter Struct. Defects Mech. Prop. 2001, 81, 49–60. [Google Scholar] [CrossRef]
  18. Chicardi, E.; García-Garrido, C.; Sayagués, M.J.; Torres, Y.; Amigó, V.; Aguilar, C. Development of a novel fcc structure for an amorphous-nanocrystalline Ti-33Nb-4Mn (at.%) ternary alloy. Mater. Charact. 2018, 135, 46–56. [Google Scholar] [CrossRef]
  19. Guo, W.; Martelli, S.; Padella, F.; Magini, M.; Burgio, N.; Paradiso, E.; Franzoni, U.F.C.C. Metastable Phase Induced in the Ti-Al System by Mechanical Alloying of Pure Elemental Powders. Mater. Sci. Forum 1992, 88–90, 139–146. [Google Scholar] [CrossRef]
  20. Shechtman, D.; Van Heerden, D.; Jose, D. Fcc titanium in Ti-Al multilayers. Mater. Lett. 1994, 20, 329–334. [Google Scholar] [CrossRef]
  21. Manna, I.; Chattopadhyay, P.P.; Nandi, P.; Banhart, F.; Fecht, H.J. Formation of face-centered-cubic titanium by mechanical attrition. J. Appl. Phys. 2003, 93, 1520–1524. [Google Scholar] [CrossRef]
  22. Zhang, D.L.; Ying, D.Y. Formation of fcc titanium during heating high energy ball milled Al-Ti powders. Mater. Lett. 2002, 52, 329–333. [Google Scholar] [CrossRef]
  23. Sun, F. Synthesis and characterization of mechanical-alloyed Ti– x Mg alloys. J. Alloy. Compd. 2002, 340, 220–225. [Google Scholar] [CrossRef]
  24. Asano, K.; Enoki, H.; Akiba, E. Synthesis of HCP, FCC and BCC structure alloys in the Mg-Ti binary system by means of ball milling. J. Alloys Compd. 2009, 480, 558–563. [Google Scholar] [CrossRef]
  25. Wu, H.C.; Kumar, A.; Wang, J.; Bi, X.F.; Tomé, C.N.; Zhang, Z.; Mao, S.X. Rolling-Induced Face Centered Cubic Titanium in Hexagonal Close Packed Titanium at Room Temperature. Sci. Rep. 2016, 6, 24370. [Google Scholar] [CrossRef]
  26. Bolokang, A.S.; Phasha, M.J.; Motaung, D.E.; Cummings, F.R.; Muller, T.F.G.; Arendse, C.J. Microstructure and phase transformation on milled and unmilled Ti induced by water quenching. Mater. Lett. 2014, 132, 157–161. [Google Scholar] [CrossRef]
  27. Aguilar, C.; Pio, E.; Medina, A.; Martínez, C.; Sancy, M.; Guzman, D. Evolution of synthesis of FCC nanocrystalline solid solution and amorphous phase in the Ti-Ta based alloy by high milling energy. J. Alloys Compd. 2021, 854, 155980. [Google Scholar] [CrossRef]
  28. Chatterjee, P.; Gupta, S.S. An X-Ray diffraction study of nanocrystalline titanium prepared by high-energy vibrational ball milling. Appl. Surf. Sci. 2001, 182, 372–376. [Google Scholar] [CrossRef]
  29. Bera, S.; Manna, I. Hexagonal close packed to face centered cubic polymorphic transformation in nanocrystalline titanium-zirconium system by mechanical alloying. J. Alloys Compd. 2006, 417, 104–108. [Google Scholar] [CrossRef]
  30. Dercz, G.; Matuła, I.; Zubko, M.; Liberska, A. Structure characterization of biomedical Ti-Mo-Sn alloy prepared by mechanical alloying method. In Acta Physica Polonica A; Polish Academy of Sciences: Warsaw, Poland, 2016; Volume 130, pp. 1029–1032. [Google Scholar]
  31. Tamura, I. Deformation-induced martensitic transformation and transformation-induced plasticity in steels. Met. Sci. 1982, 16, 245–253. [Google Scholar] [CrossRef]
  32. Pereloma, E.; Timokhina, I. Deformation-induced phase transformations. Metals 2018, 8, 886. [Google Scholar] [CrossRef] [Green Version]
  33. Cao, Y.; Ni, S.; Liao, X.; Song, M.; Zhu, Y. Structural evolutions of metallic materials processed by severe plastic deformation. Mater. Sci. Eng. R Rep. 2018, 133, 1–59. [Google Scholar] [CrossRef]
  34. Dehghan-Manshadi, A.; Dippenaar, R.J. Strain-induced phase transformation during thermo-mechanical processing of titanium alloys. Mater. Sci. Eng. A 2012, 552, 451–456. [Google Scholar] [CrossRef] [Green Version]
  35. Dahmen, U. Phase Transformations, Crystallographic Aspects. Encycl. Phys. Sci. Technol. 2003, 821–853. [Google Scholar] [CrossRef] [Green Version]
  36. Cayron, C. Shifting the Shear Paradigm in the Crystallographic Models of Displacive Transformations in Metals and Alloys. Crystals 2018, 8, 181. [Google Scholar] [CrossRef] [Green Version]
  37. Wayman, C.M. Shear transformations and microstructure. Metallography 1975, 8, 105–130. [Google Scholar] [CrossRef]
  38. Baek, E.R.; Suprobo, G. Massive Phase Transformation as a New Prospective on Microstructural Design in a Titanium Alloy—A Review. Mater. Sci. Forum 2020, 1000, 428–435. [Google Scholar] [CrossRef]
  39. McQuillan, M.K. Phase Transformations in Titanium and Its Alloys. Metall. Rev. 2013, 8, 41–104. [Google Scholar] [CrossRef]
  40. Burgers, W.G. On the process of transition of the cubic-body-centered modification into the hexagonal-close-packed modification of zirconium. Physica 1934, 1, 561–586. [Google Scholar] [CrossRef]
  41. Wang, Q.; Liu, Z.; Wang, B.; Hassan Mohsan, A.U. Stress-Induced orientation relationship variation for phase transformation of α-Ti to β-Ti during high speed machining Ti-6Al-4V. Mater. Sci. Eng. A 2017, 690, 32–36. [Google Scholar] [CrossRef]
  42. Zhu, W.; Kou, W.; Tan, C.; Zhang, B.; Chen, W.; Sun, Q.; Xiao, L.; Sun, J. Face centered cubic substructure and improved tensile property in a novel β titanium alloy Ti–5Al–4Zr–10Mo–3Cr. Mater. Sci. Eng. A 2020, 771, 138611. [Google Scholar] [CrossRef]
  43. Hong, D.H.; Lee, T.W.; Lim, S.H.; Kim, W.Y.; Hwang, S.K. Stress-induced hexagonal close-packed to face-centered cubic phase transformation in commercial-purity titanium under cryogenic plane-strain compression. Scr. Mater. 2013, 69, 405–408. [Google Scholar] [CrossRef]
  44. Aguilar, C.; Pio, E.; Medina, A.; Parra, C.; Mangalaraja, R.; Martin, P.; Alfonso, I.; Tello, K. Effect of Sn on synthesis of nanocrystalline Ti-Based alloy with fcc structure. Trans. Nonferrous Met. Soc. China 2020, 30, 2119–2131. [Google Scholar] [CrossRef]
  45. Chicardi, E.; Aguilar, C.; Sayagués, M.J.; García-Garrido, C. Influence of the Mn content on the TiNbxMn Alloys with a novel fcc structure. J. Alloys Compd. 2018, 746, 601–610. [Google Scholar] [CrossRef]
  46. Lutterotti, L.; Matthies, S.; Wenk, H.-R. MAUD: A friendly Java program for Material Analysis Using Diffraction. IUCr Newsl. CPD 1999, 21, 15. [Google Scholar]
  47. Lutterotti, L.; Scardi, P. Simultaneous structure and size–strain refinement by the Rietveld method. J. Appl. Crystallogr. 1990, 23, 246–252. [Google Scholar] [CrossRef]
  48. Scardi, P.; Lutterotti, L.; Maistrelli, P. Experimental determination of the instrumental broadening in the Bragg–Brentano geometry. Powder Diffr. 1994, 9, 180–186. [Google Scholar] [CrossRef]
  49. Delhez, R.; de Keijser, T.H.; Langford, J.I.; Louër, D.; Mittemeijer, E.J.; Sonneveld, E.J. Crystal imperfection broadening and peak shape in the Rietveld method. In The Rietveld Method; Young, R.A., Ed.; Oxford University: Oxford, UK, 1993. [Google Scholar]
  50. de Keijser, T.H.; Langford, J.I.; Mittemeijer, E.J.; Vogels, A.B.P. Use of the Voigt function in a single-line method for the analysis of X-Ray diffraction line broadening. J. Appl. Crystallogr. 1982, 15, 308–314. [Google Scholar] [CrossRef]
  51. Zhao, Y.H.; Sheng, H.W.; Lu, K. Microstructure evolution and thermal properties in nanocrystalline Fe during mechanical attrition. Acta Mater. 2001, 49, 365–375. [Google Scholar] [CrossRef]
  52. Susila, P.; Sturm, D.; Heilmaier, M.; Murty, B.S.; Subramanya Sarma, V. Microstructural studies on nanocrystalline oxide dispersion strengthened austenitic (Fe-18Cr-8Ni-2W-0.25Y2O3) alloy synthesized by high energy ball milling and vacuum hot pressing. J. Mater. Sci. 2010, 45, 4858–4865. [Google Scholar] [CrossRef]
  53. Rajabi, A.; Ghazali, M.J. Quantitative analyses of TiC nanopowders via mechanical alloying method. Ceram. Int. 2017, 43, 14233–14243. [Google Scholar] [CrossRef]
  54. Dini, G.; Ueji, R.; Najafizadeh, A.; Monir-Vaghefi, S.M. Flow stress analysis of TWIP steel via the XRD measurement of dislocation density. Mater. Sci. Eng. A 2010, 527, 2759–2763. [Google Scholar] [CrossRef]
  55. Laala-Bouali, H.; Bentayeb, F.Z.; Louidi, S.; Guo, X.; Tria, S.; Suñol, J.J.; Escoda, L. X-ray line profile analysis of the ball-milled Fe–30Co Alloy. Adv. Powder Technol. 2013, 24, 168–174. [Google Scholar] [CrossRef]
  56. Khitouni, M.; Mhadhbi, M.; Escoda, L.; Suñol, J.J.; Dammak, M. Characterization of mechanically alloyed nanocrystalline Fe(Al): Crystallite size and dislocation density. J. Nanomater. 2010, 2010, 712407. [Google Scholar]
  57. Zribi, Z.; Ktari, H.H.; Herbst, F.; Optasanu, V.; Njah, N. EBSD, XRD and SRS characterization of a casting Al-7wt%Si alloy processed by equal channel angular extrusion: Dislocation density evaluation. Mater. Charact. 2019, 153, 190–198. [Google Scholar] [CrossRef]
  58. Saastamoinen, A.; Kaijalainen, A.; Porter, D.; Suikkanen, P.; Yang, J.R.; Tsai, Y.T. The effect of finish rolling temperature and tempering on the microstructure, mechanical properties and dislocation density of direct-quenched steel. Mater. Charact. 2018, 139, 1–10. [Google Scholar] [CrossRef]
  59. Williamson, G.K.; Smallman, R.E., III. Dislocation densities in some annealed and cold-worked metals from measurements on the X-Ray Debye-Scherrer spectrum. Philos. Mag. 1956, 1, 34–46. [Google Scholar] [CrossRef]
  60. Smallman, R.E.; Westmacott, K.H. Stacking Faults in Face-Centred Cubic Metals and Alloys. Philos. Mag. 1957, 2, 669–683. [Google Scholar] [CrossRef]
  61. Griffiths, M.; Winegar, J.E.; Mecke, J.F.; Holt, R.A. Determination of Dislocation Densities in Hexagonal Close-Packed Metals using X-ray diffraction and Transmission Electron Microscopy. Adv. X-ray Anal. 1991, 35, 593–599. [Google Scholar] [CrossRef]
  62. Yoo, M.H.; Agnew, S.R.; Morris, J.R.; Ho, K.M. Non-basal slip systems in HCP metals and alloys: Source mechanisms. Mater. Sci. Eng. A 2001, 319–321, 87–92. [Google Scholar] [CrossRef]
  63. Britton, T.B.; Dunne, F.P.E.; Wilkinson, A.J. On the mechanistic basis of deformation at the microscale in hexagonal close-packed metals. Proc. R. Soc. A Math. Phys. Eng. Sci. 2015, 471, 20140881. [Google Scholar] [CrossRef] [Green Version]
  64. Rai, R.; Triloki, T.; Singh, B.K. X-ray diffraction line profile analysis of KBr thin films. Appl. Phys. A Mater. Sci. Process. 2016, 122, 1–11. [Google Scholar] [CrossRef] [Green Version]
  65. Cayron, C. Continuous atomic displacements and lattice distortions during martensitic transformations in fcc-bcc-hcp Systems. Acta Mater. 2015, 111, 417–441. [Google Scholar] [CrossRef] [Green Version]
  66. Kurdjumow, G.; Sachs, G.; Kurdjumow, G.; Sachs, G. Über den mechanismus der Stahlhärtung. Z. Phys. 1930, 64, 325–343. [Google Scholar] [CrossRef]
  67. Nishiyama, Z. Martensiti Transformatio; Academic Press: Cambridge, MA, USA, 1972; p. 480. [Google Scholar]
  68. Kruml, T.; Paidar, V.; Martin, J.L. Dislocation density in Ni3(Al,Hf). Intermetallics 2000, 8, 729–736. [Google Scholar] [CrossRef]
  69. Lewis, D.; Northwood, D.O. X-ray diffraction measurement of microstrains. Strain 1968, 4, 19–23. [Google Scholar] [CrossRef]
  70. Leineweber, A. Understanding anisotropic microstrain broadening in Rietveld refinement. Z. Krist. 2011, 226, 905–923. [Google Scholar] [CrossRef]
  71. Will, G. Powder Diffraction—The Rietveld Method and the Two Stage Method to Determine and Refine Crystal Structures from Powder Diffraction Data; Springer: Berlin/Heidelberg, Germany, 2006; ISBN 9783540279860. [Google Scholar]
  72. Shafi, P.M.; Bose, A.C. Impact of crystalline defects and size on X-ray line broadening: A phenomenological approach for tetragonal SnO2 nanocrystals. AIP Adv. 2015, 5, 057137. [Google Scholar] [CrossRef]
  73. Rajender, G.; Giri, P.K. Strain induced phase formation, microstructural evolution and bandgap narrowing in strained TiO2 nanocrystals grown by ball milling. J. Alloys Compd. 2016, 676, 591–600. [Google Scholar] [CrossRef]
  74. Krivoglaz, M.A. X-ray and Neutron Diffraction in Nonideal Crystals; Springer Science & Business Media: Berlin/Heidelberg, Germany, 1996. [Google Scholar] [CrossRef]
  75. Noyan, I.C.; Cohen, J.B. Residual Stress: Measurement by Diffraction and Interpretation; Springer: Berlin/Heidelberg, Germany, 2013. [Google Scholar]
  76. Fogagnolo, J.B.; Velasco, F.; Robert, M.H.; Torralba, J.M. Effect of mechanical alloying on the morphology, microstructure and properties of aluminium matrix composite powders. Mater. Sci. Eng. A 2003, 342, 131–143. [Google Scholar] [CrossRef]
  77. Chatterjee, P.P.; Pabi, S.K.; Manna, I. An allotropic transformation induced by mechanical alloying. J. Appl. Phys. 1999, 86, 5912. [Google Scholar] [CrossRef]
  78. Ma, E.; Atzmon, M. Phase transformations induced by mechanical alloying in binary systems. Mater. Chem. Phys. 1995, 39, 249–267. [Google Scholar] [CrossRef]
  79. Bakker, H.; Zhou, G.F.; Yang, H. Mechanically driven disorder and phase transformations in alloys. Prog. Mater. Sci. 1995, 39, 159–241. [Google Scholar] [CrossRef] [Green Version]
  80. Zhang, L.C.; Aindow, M. Morphology and interfacial structure of gamma precipitates in the beta phase of a Ti-Al-Nb-Zr alloy. J. Mater. Sci. 2006, 41, 611–619. [Google Scholar] [CrossRef]
  81. Machio, C.; Nyabadza, D.; Sibanda, V.; Chikwanda, H.K. Characterization of mechanically alloyed f.c.c. Ti–Mg-based powders. Powder Technol. 2011, 207, 387–395. [Google Scholar] [CrossRef]
  82. Aguilar, C.; Guerra, C.; Lascano, S.; Guzman, D.; Rojas, P.A.; Thirumurugan, M.; Bejar, L.; Medina, A. Synthesis and characterization of Ti-Ta-Nb-Mn foams. Mater. Sci. Eng. C 2016, 58, 420–431. [Google Scholar] [CrossRef] [PubMed]
  83. Aguilar, C.; Castro, F.; Martínez, V.; Guzmán, D.; de las Cuevas, F.; Lozada, L.; Vielma, N. Structural study of nanocrystalline solid solution of Cu-Mo obtained by mechanical alloying. Mater. Sci. Eng. A 2012, 548, 189–194. [Google Scholar] [CrossRef]
  84. Pecharsky, V.K.; Zavalij, P.Y. Fundamentals of Powder Diffraction and Structural Characterization of Materials; Springer: Berlin/Heidelberg, Germany, 2009; ISBN 978-0-387-09578-3. [Google Scholar]
  85. Suryanarayana, C.; Norton, M.G.; Suryanarayana, C.; Norton, M.G. X-rays and Diffraction. In X-ray Diffraction; Springer: Berlin/Heidelberg, Germany, 1998; pp. 3–19. [Google Scholar]
  86. Waseda, Y.; Matsubara, E.; Shinoda, K.; Waseda, Y.; Matsubara, E.; Shinoda, K. Fundamental Properties of X-rays. In X-ray Diffraction Crystallography; Springer: Berlin/Heidelberg, Germany, 2011; pp. 1–20. [Google Scholar]
  87. Toby, B.H. R factors in Rietveld Analysis: How good is good enough? Powder Diffr. 2006, 21, 67–70. [Google Scholar] [CrossRef] [Green Version]
  88. Mccusker, L.B.; Von Dreele, R.B.; Cox, D.E.; Louer, D.; Scardi, P. Rietveld refinement guidelines. Int. Union Crystallogr. J. Appl. Crystallogr. J. Appl. Cryst 1999, 32, 36–50. [Google Scholar] [CrossRef] [Green Version]
  89. Young, R.A. The Rietveld Method; International Union of Crystallograph: Paris, Frnace; Oxford University Press: Oxford, UK, 1995. [Google Scholar]
  90. Yang, J.X.; Zhao, H.L.; Gong, H.R.; Song, M.; Ren, Q.Q. Proposed mechanism of HCP → FCC phase transition in titianium through first principles calculation and experiments. Sci. Rep. 2018, 8, 1992. [Google Scholar] [CrossRef] [PubMed] [Green Version]
  91. Benjamin, J.S.; Volin, T.E. The mechanism of mechanical alloying. Metall. Trans. 1974, 5, 1929–1934. [Google Scholar] [CrossRef]
  92. Suryanarayna, C. Mechanical Alloying and Milling; Marcel Dekker: New York, NY, USA, 2004. [Google Scholar]
  93. Koch, C.C. Materials Synthesis by Mechanical Alloying. Annu. Rev. Mater. Sci. 1989, 19, 121–143. [Google Scholar] [CrossRef]
  94. Zeng, Z.; Jonsson, S.; Roven, H.J. The effects of deformation conditions on microstructure and texture of commercially pure Ti. Acta Mater. 2009, 57, 5822–5833. [Google Scholar] [CrossRef]
  95. Koike, J.; Shimoyama, Y.; Ohnuma, I.; Okamura, T.; Kainuma, R.; Ishida, K.; Maruyama, K. Stress-induced phase transformation during superplastic deformation in two-phase Ti-Al-Fe alloy. Acta Mater. 2000, 48, 2059–2069. [Google Scholar] [CrossRef]
  96. Chen, C.L.; Lu, W.; Sun, D.; He, L.L.; Ye, H.Q. Deformation-induced A2 → γ phase transformation in TiAl alloys. Mater. Charact. 2010, 61, 1029–1034. [Google Scholar] [CrossRef]
  97. Al-Aqeeli, N.; Suryanarayana, C.; Hussein, M.A. Formation of an amorphous phase and its crystallization in the immiscible Nb-Zr system by mechanical alloying. J. Appl. Phys. 2013, 114, 153512. [Google Scholar] [CrossRef]
  98. Wang, Z.Q.; Beyerlein, I.J.; LeSar, R. Slip band formation and mobile dislocation density generation in high rate deformation of single fcc crystals. Philos. Mag. 2008, 88, 1321–1343. [Google Scholar] [CrossRef]
  99. Follansbee, P.S. High Strain Rate Deformation in FCC Metals and Alloys; Los Alamos National Lab.: Los Alamos, NM, USA, 1985. [Google Scholar]
  100. Dobromyslov, A.V.; Dolgikh, G.V.; Dutkevich, Y.; Trenogina, T.L. Phase and structural transformations in Ti-Ta alloys. Phys. Met. Metallogr. 2009, 107, 502–510. [Google Scholar] [CrossRef]
  101. Maurice, D.; Courtney, T.H. Modeling of mechanical alloying: Part I. Deformation, coalescence, bdand fragmentation mechanisms. Metall. Mater. Trans. A 1994, 25, 147–158. [Google Scholar] [CrossRef]
  102. Sharma, S.; Suryanarayana, C. Mechanical crystallization of Fe-based amorphous alloys. J. Appl. Phys. 2007, 102, 083544. [Google Scholar] [CrossRef] [Green Version]
  103. Xiong, S.; Qi, W.; Huang, B.; Wang, M.; Li, Z.; Liang, S. Size–Temperature Phase Diagram of Titanium Nanosolids. J. Phys. Chem. C 2012, 116, 237–241. [Google Scholar] [CrossRef]
  104. Koch, C.C. Synthesis of nanostructured materials by mechanical milling: Problems and opportunities. Nanostruct. Mater. 1997, 9, 13–22. [Google Scholar] [CrossRef]
  105. Patil, U.; Hong, S.J.; Suryanarayana, C. An unusual phase transformation during mechanical alloying of an Fe-based bulk metallic glass composition. J. Alloys Compd. 2005, 389, 121–126. [Google Scholar] [CrossRef]
  106. Chang, L.; Zhou, C.-Y.; Pan, X.-M.; He, X.-H. Size-dependent deformation mechanism transition in titanium nanowires under high strain rate tension. Mater. Des. 2017, 134, 320–330. [Google Scholar] [CrossRef]
  107. Ma, Z.C.; Tang, X.Z.; Mao, Y.; Guo, Y.F. The plastic deformation mechanisms of hcp single crystals with different orientations: Molecular dynamics simulations. Materials 2021, 14, 733. [Google Scholar] [CrossRef]
  108. Bailey, J.E.; Hirsch, P.B. The dislocation distribution, flow stress, and stored energy in cold-worked polycrystalline silver. Philos. Mag. 2006, 5, 485–497. [Google Scholar] [CrossRef]
Figure 1. Procedure to identify dislocations in TEM images in Ti13Ta6Sn at 5 h: (a) Original TEM image, (b) Division of TEM image in matrix 4 × 4, (c) FFT image indexed showing of Ti phases and planes of image (a), (d) (111) Planes of γ-Ti phase of image (c), (e) IFFT images of (b), (f) Zoom of the region of the IFFT ROI 11 showing the dislocation.
Metals 11 01841 g001
Figure 2. X-ray diffraction patterns of raw material used in the Ti-based alloys.
Metals 11 01841 g002
Figure 3. X-ray diffraction patterns of Ti-13Ta alloy as a function of the milling times.
Metals 11 01841 g003
Figure 4. X-ray diffraction pattern of Ti-13Ta-6Sn alloy as a function of the milling time.
Metals 11 01841 g004
Figure 5. X-ray diffraction patterns of Ti-13Ta-6Mn alloy as a function of the milling time.
Metals 11 01841 g005
Figure 6. X-ray diffraction pattern of milled Ti-30Nb-6Sn alloy as a function of the milling time.
Metals 11 01841 g006
Figure 7. Phase evolution as a function of the milling time, (a) α-Ti, (b) β-Ti, and (c) γ-Ti phase.
Metals 11 01841 g007
Figure 8. Microstrain evolution as a function of the milling time, (a) α-Ti, (b) β-Ti, and (c) γ-Ti phase.
Metals 11 01841 g008
Figure 9. Crystallite size evolution as a function of the milling time: (a) α-Ti, (b) β-Ti, and (c) γ-Ti phase.
Metals 11 01841 g009
Figure 10. Evolution of ρp as a function of the milling time, (a) α-Ti, (b) β-Ti, and (c) γ-Ti phase.
Metals 11 01841 g010
Table 1. Ti alloying elements amount at 0 h and 2 h of mechanical alloying.
Solute Elements (at. %)
ElementsTaSnNbMn
Alloys0 h2 h0 h2 h0 h2 h0 h2 h
Ti13Ta13
Ti13Ta6Sn131162
Ti13Ta6Mn1340 64
Ti30Nb6Sn 633013
Table 2. Dislocation density due to microstrain: <110> α-Ti, <111> β-Ti, and <110> γ-Ti calculated by XRD and TEM.
Milling Time (h)Analysisα-Tiβ-Tiγ-Ti
×1015 (m2)×1015 (m2)×1015 (m2)
5DRX1.648002.20624220.405
TEM1.609943.7143110.5484
15DRX62.86850.182689173.746
TEM2.638926.597319.83077
50DRX**8.34252
TEM**13.8044
100DRX**41.1297
TEM**6.7415
*—No phases were identified.
Publisher’s Note: MDPI stays neutral with regard to jurisdictional claims in published maps and institutional affiliations.

