
Mechanical Characterization of Nanocrystalline Materials via a Finite Element Nanoindentation Model

 ,
,  ,
,  and
and 
Abstract
:1. Introduction
2. Modelling
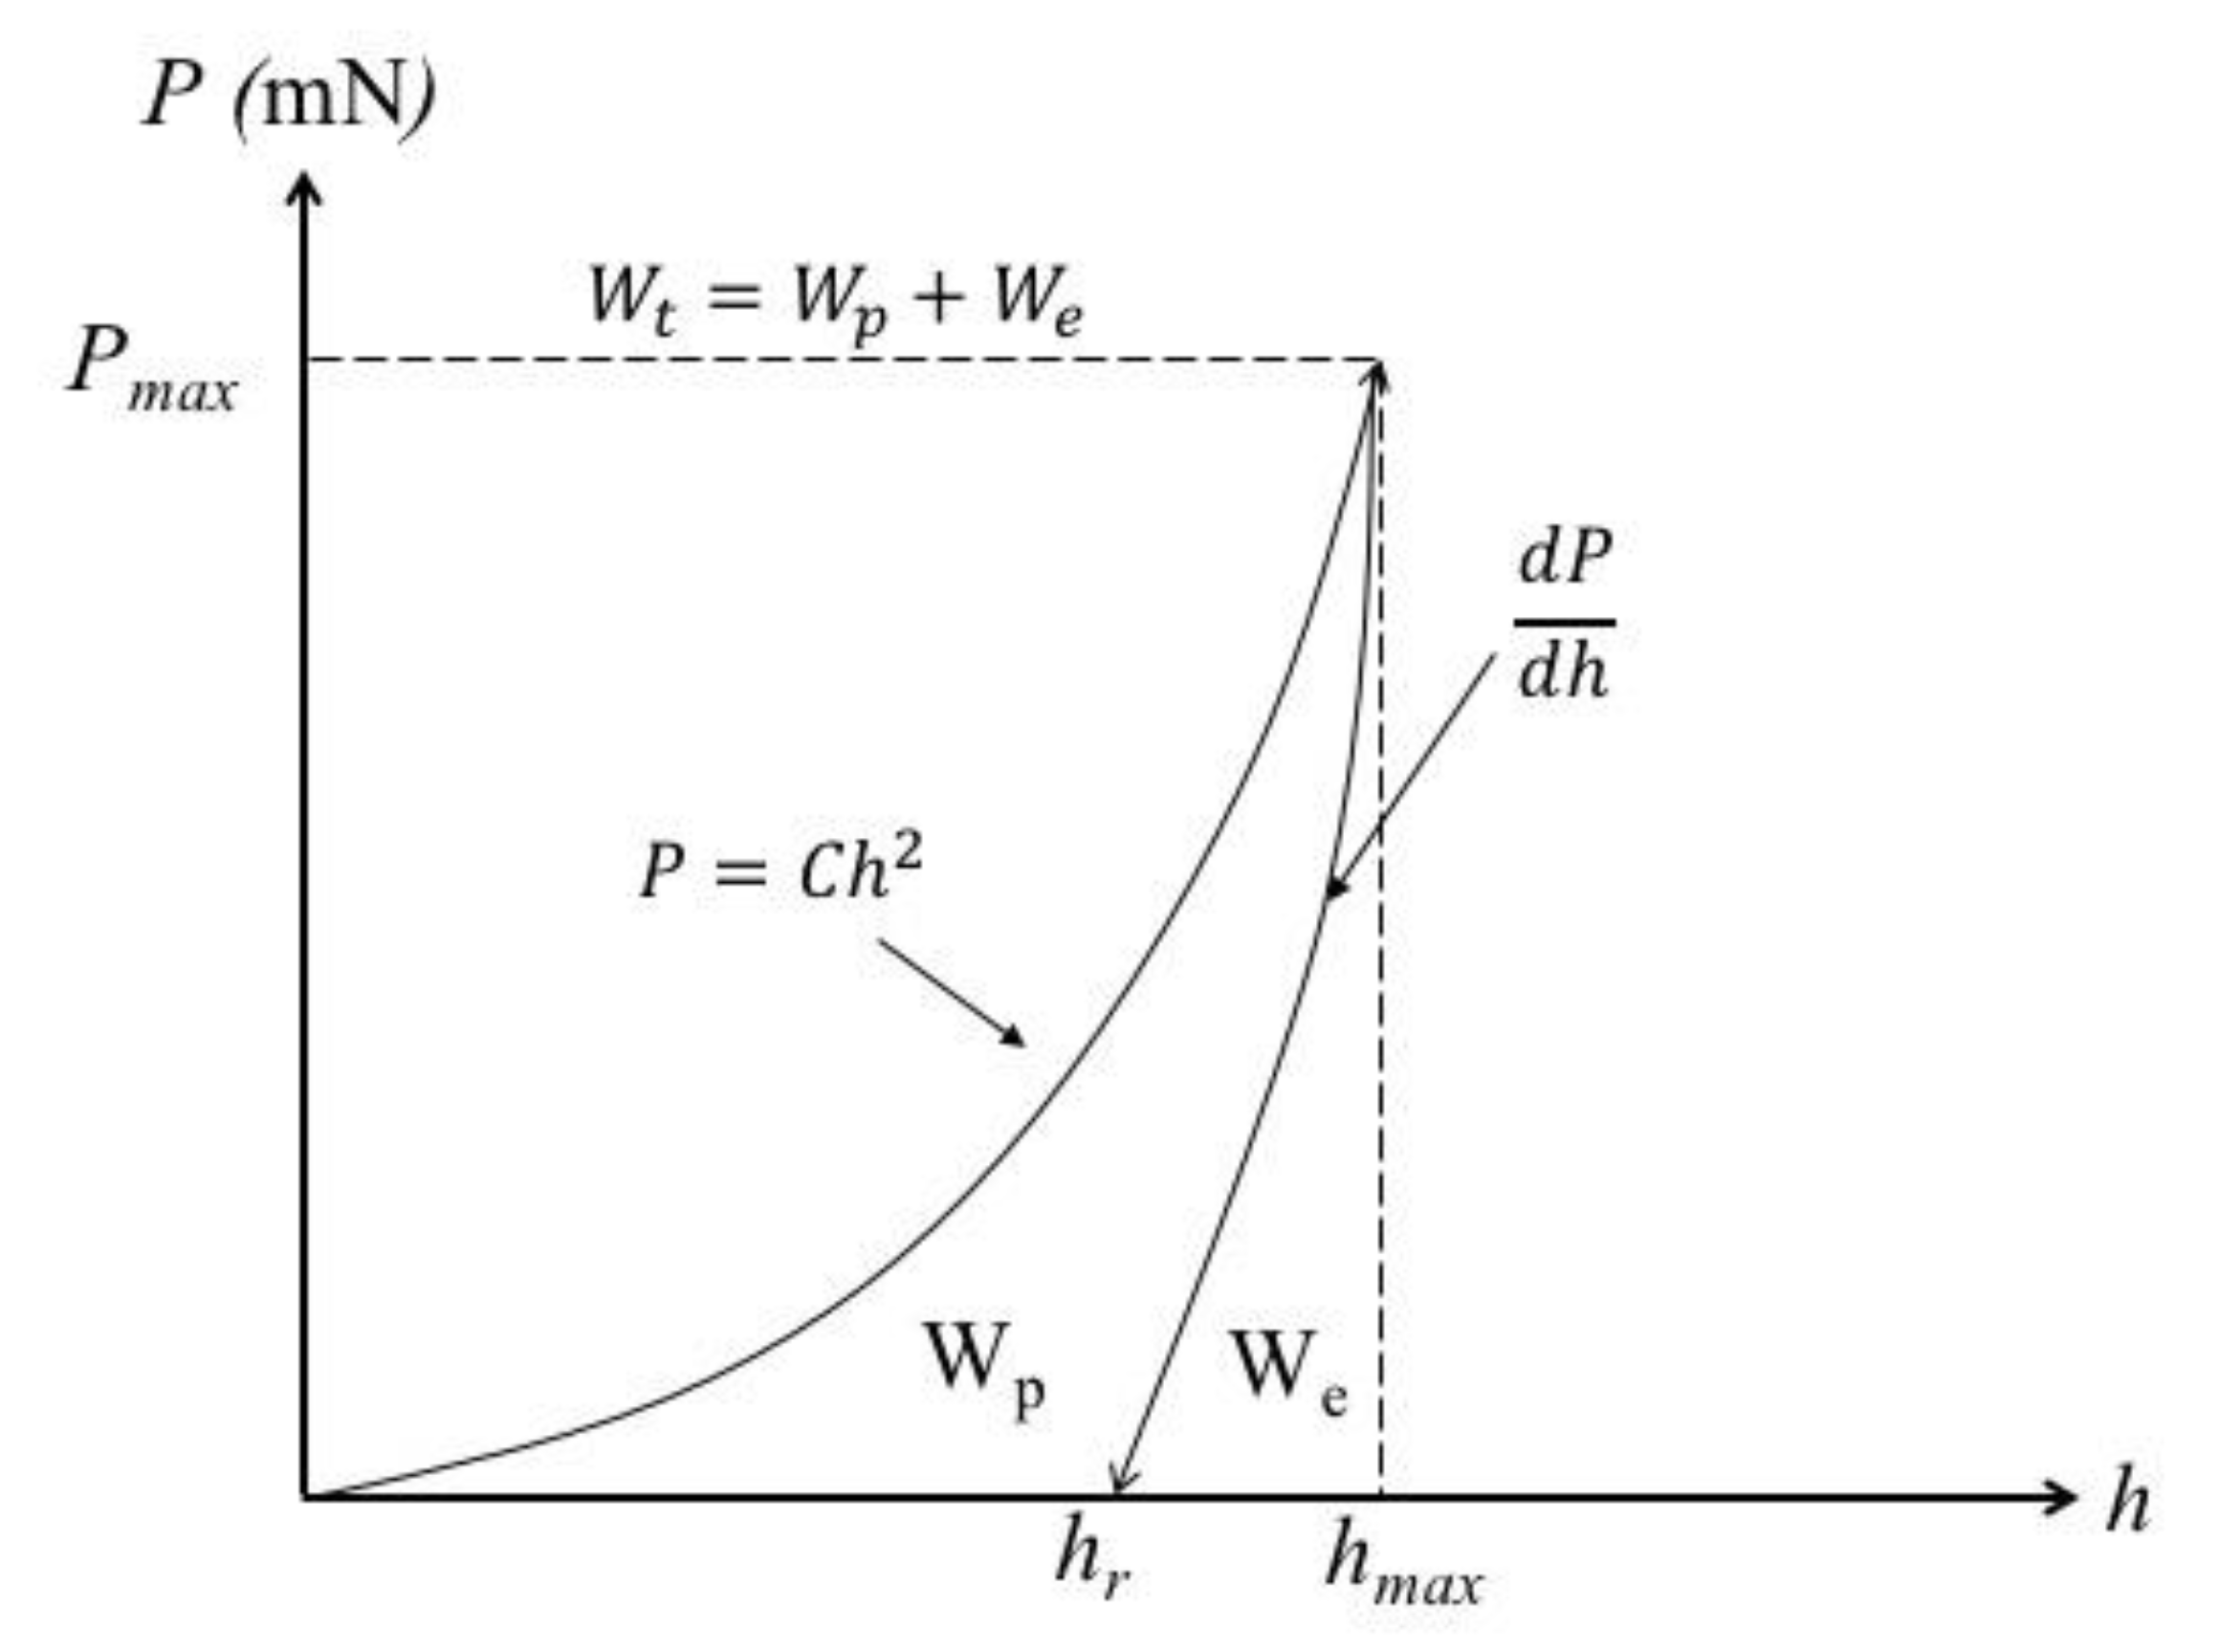
2.1. Analytical Approach
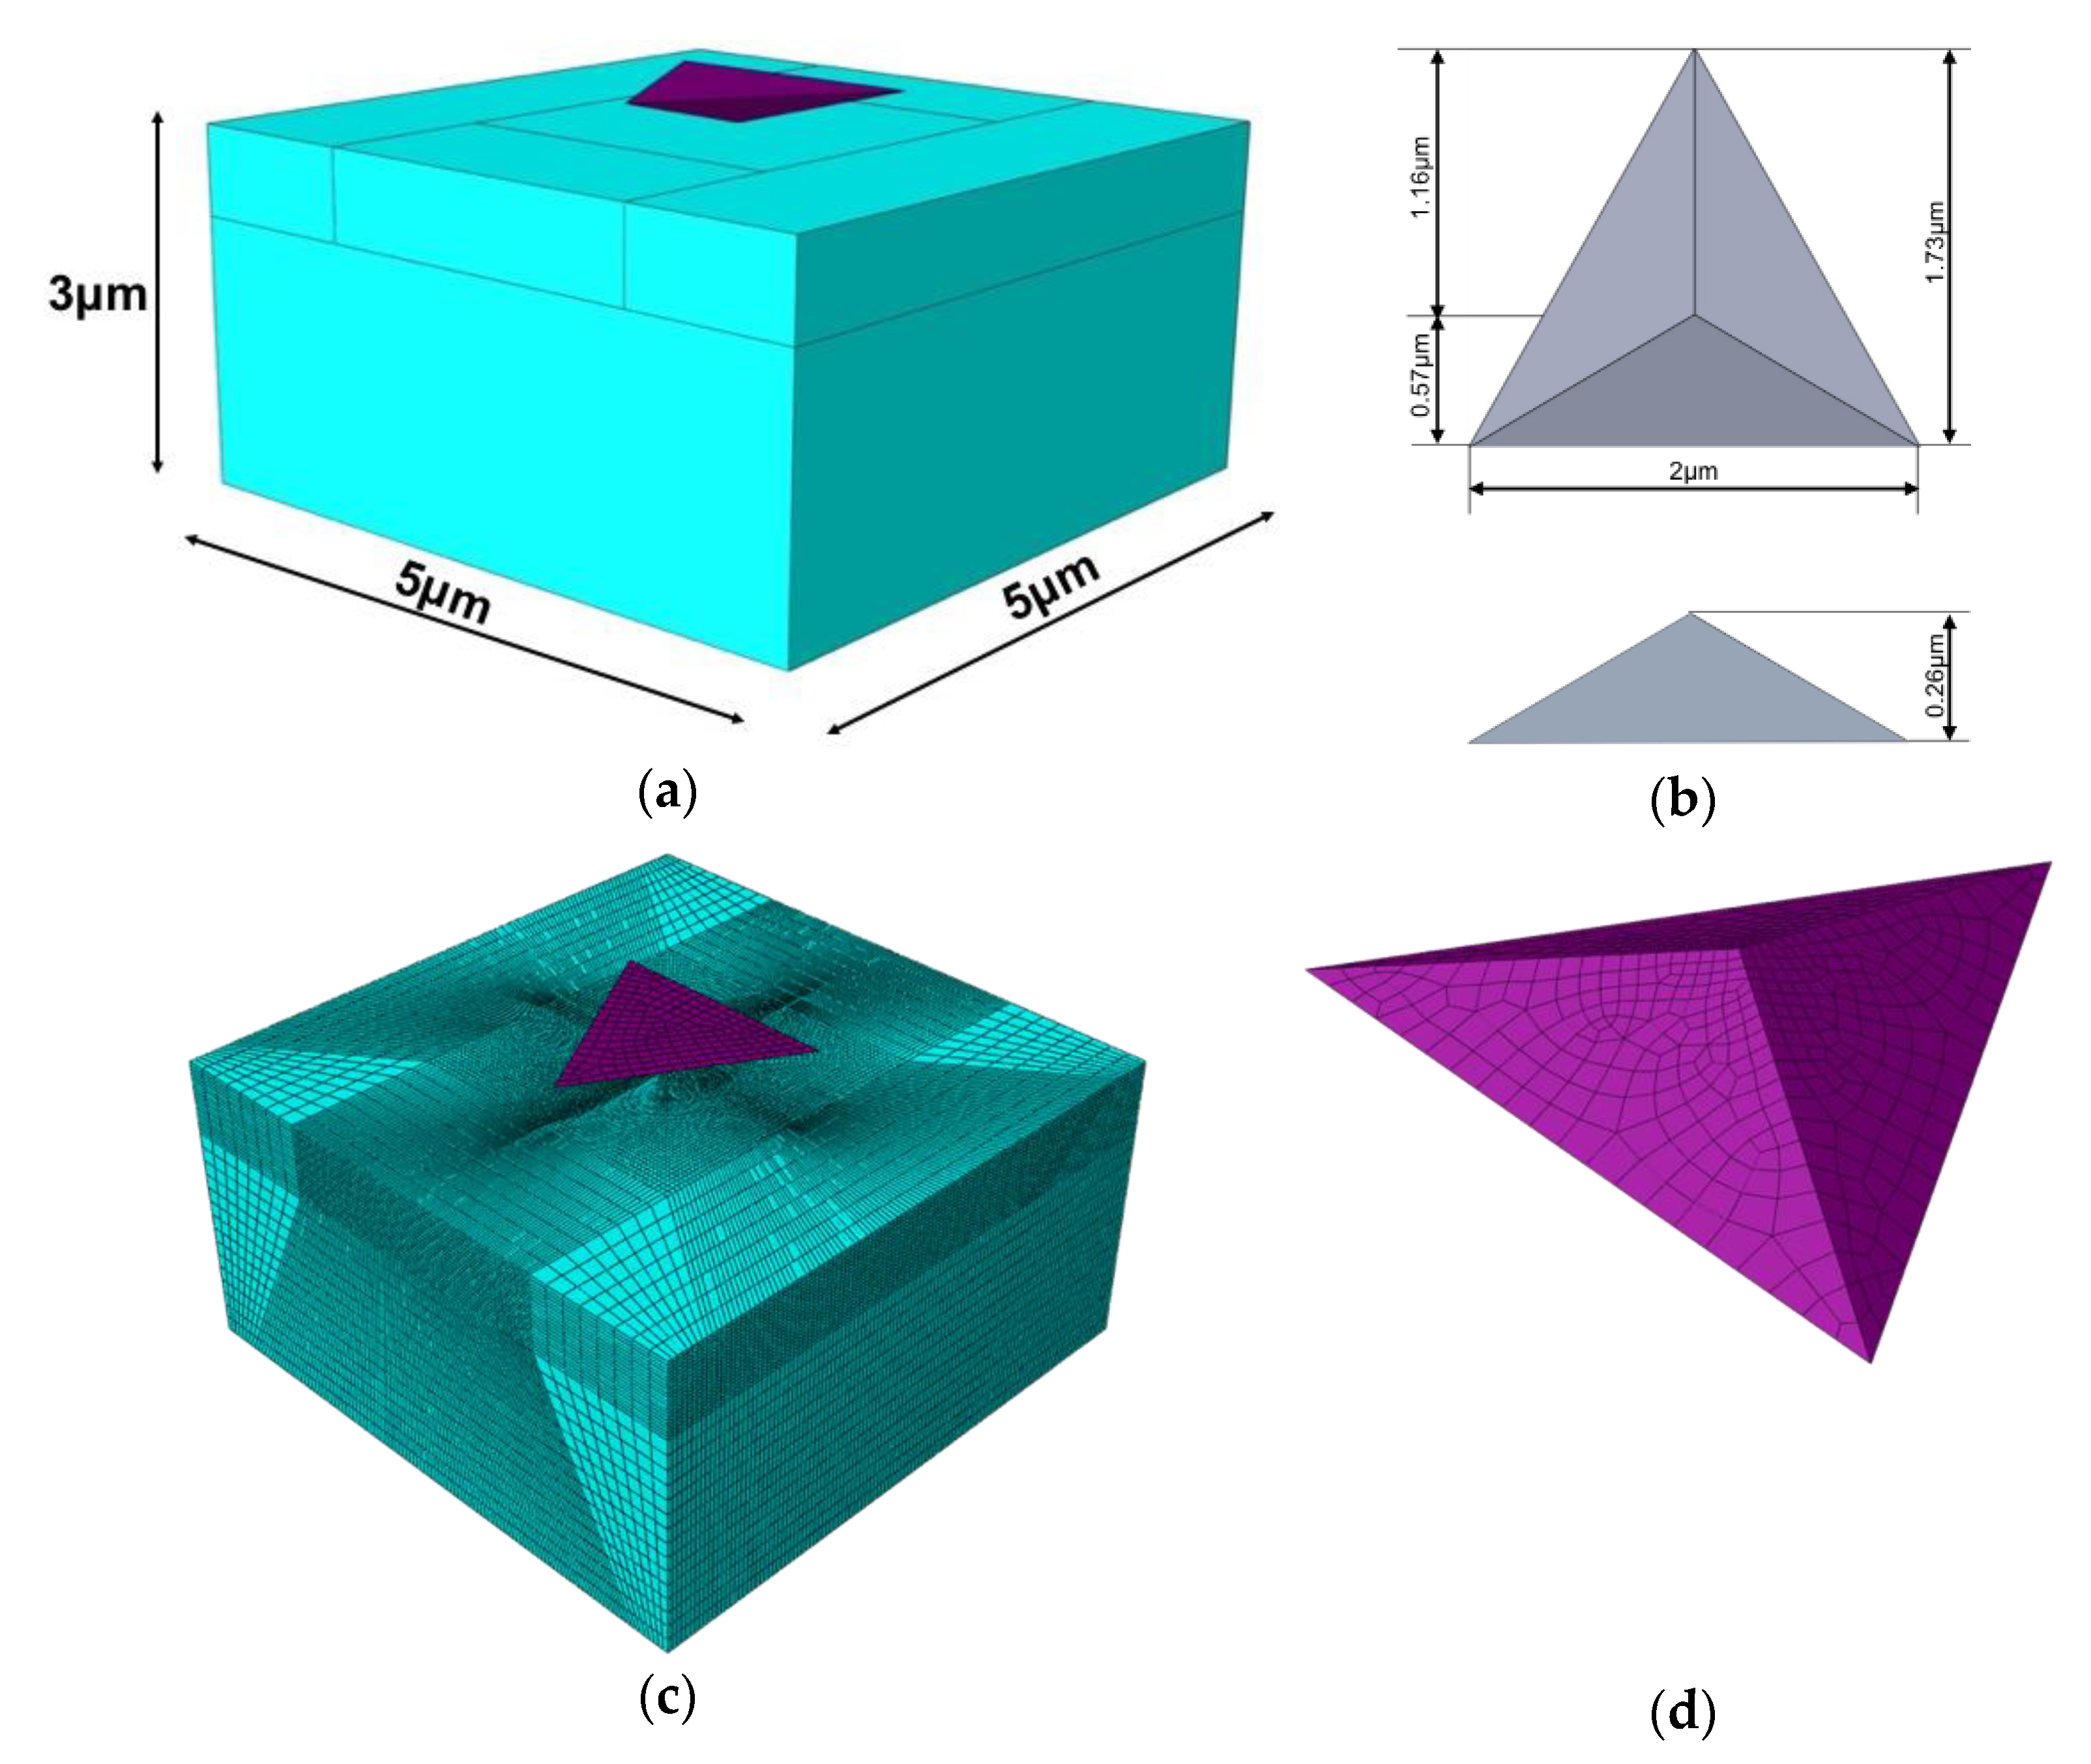
2.2. Numerical Model
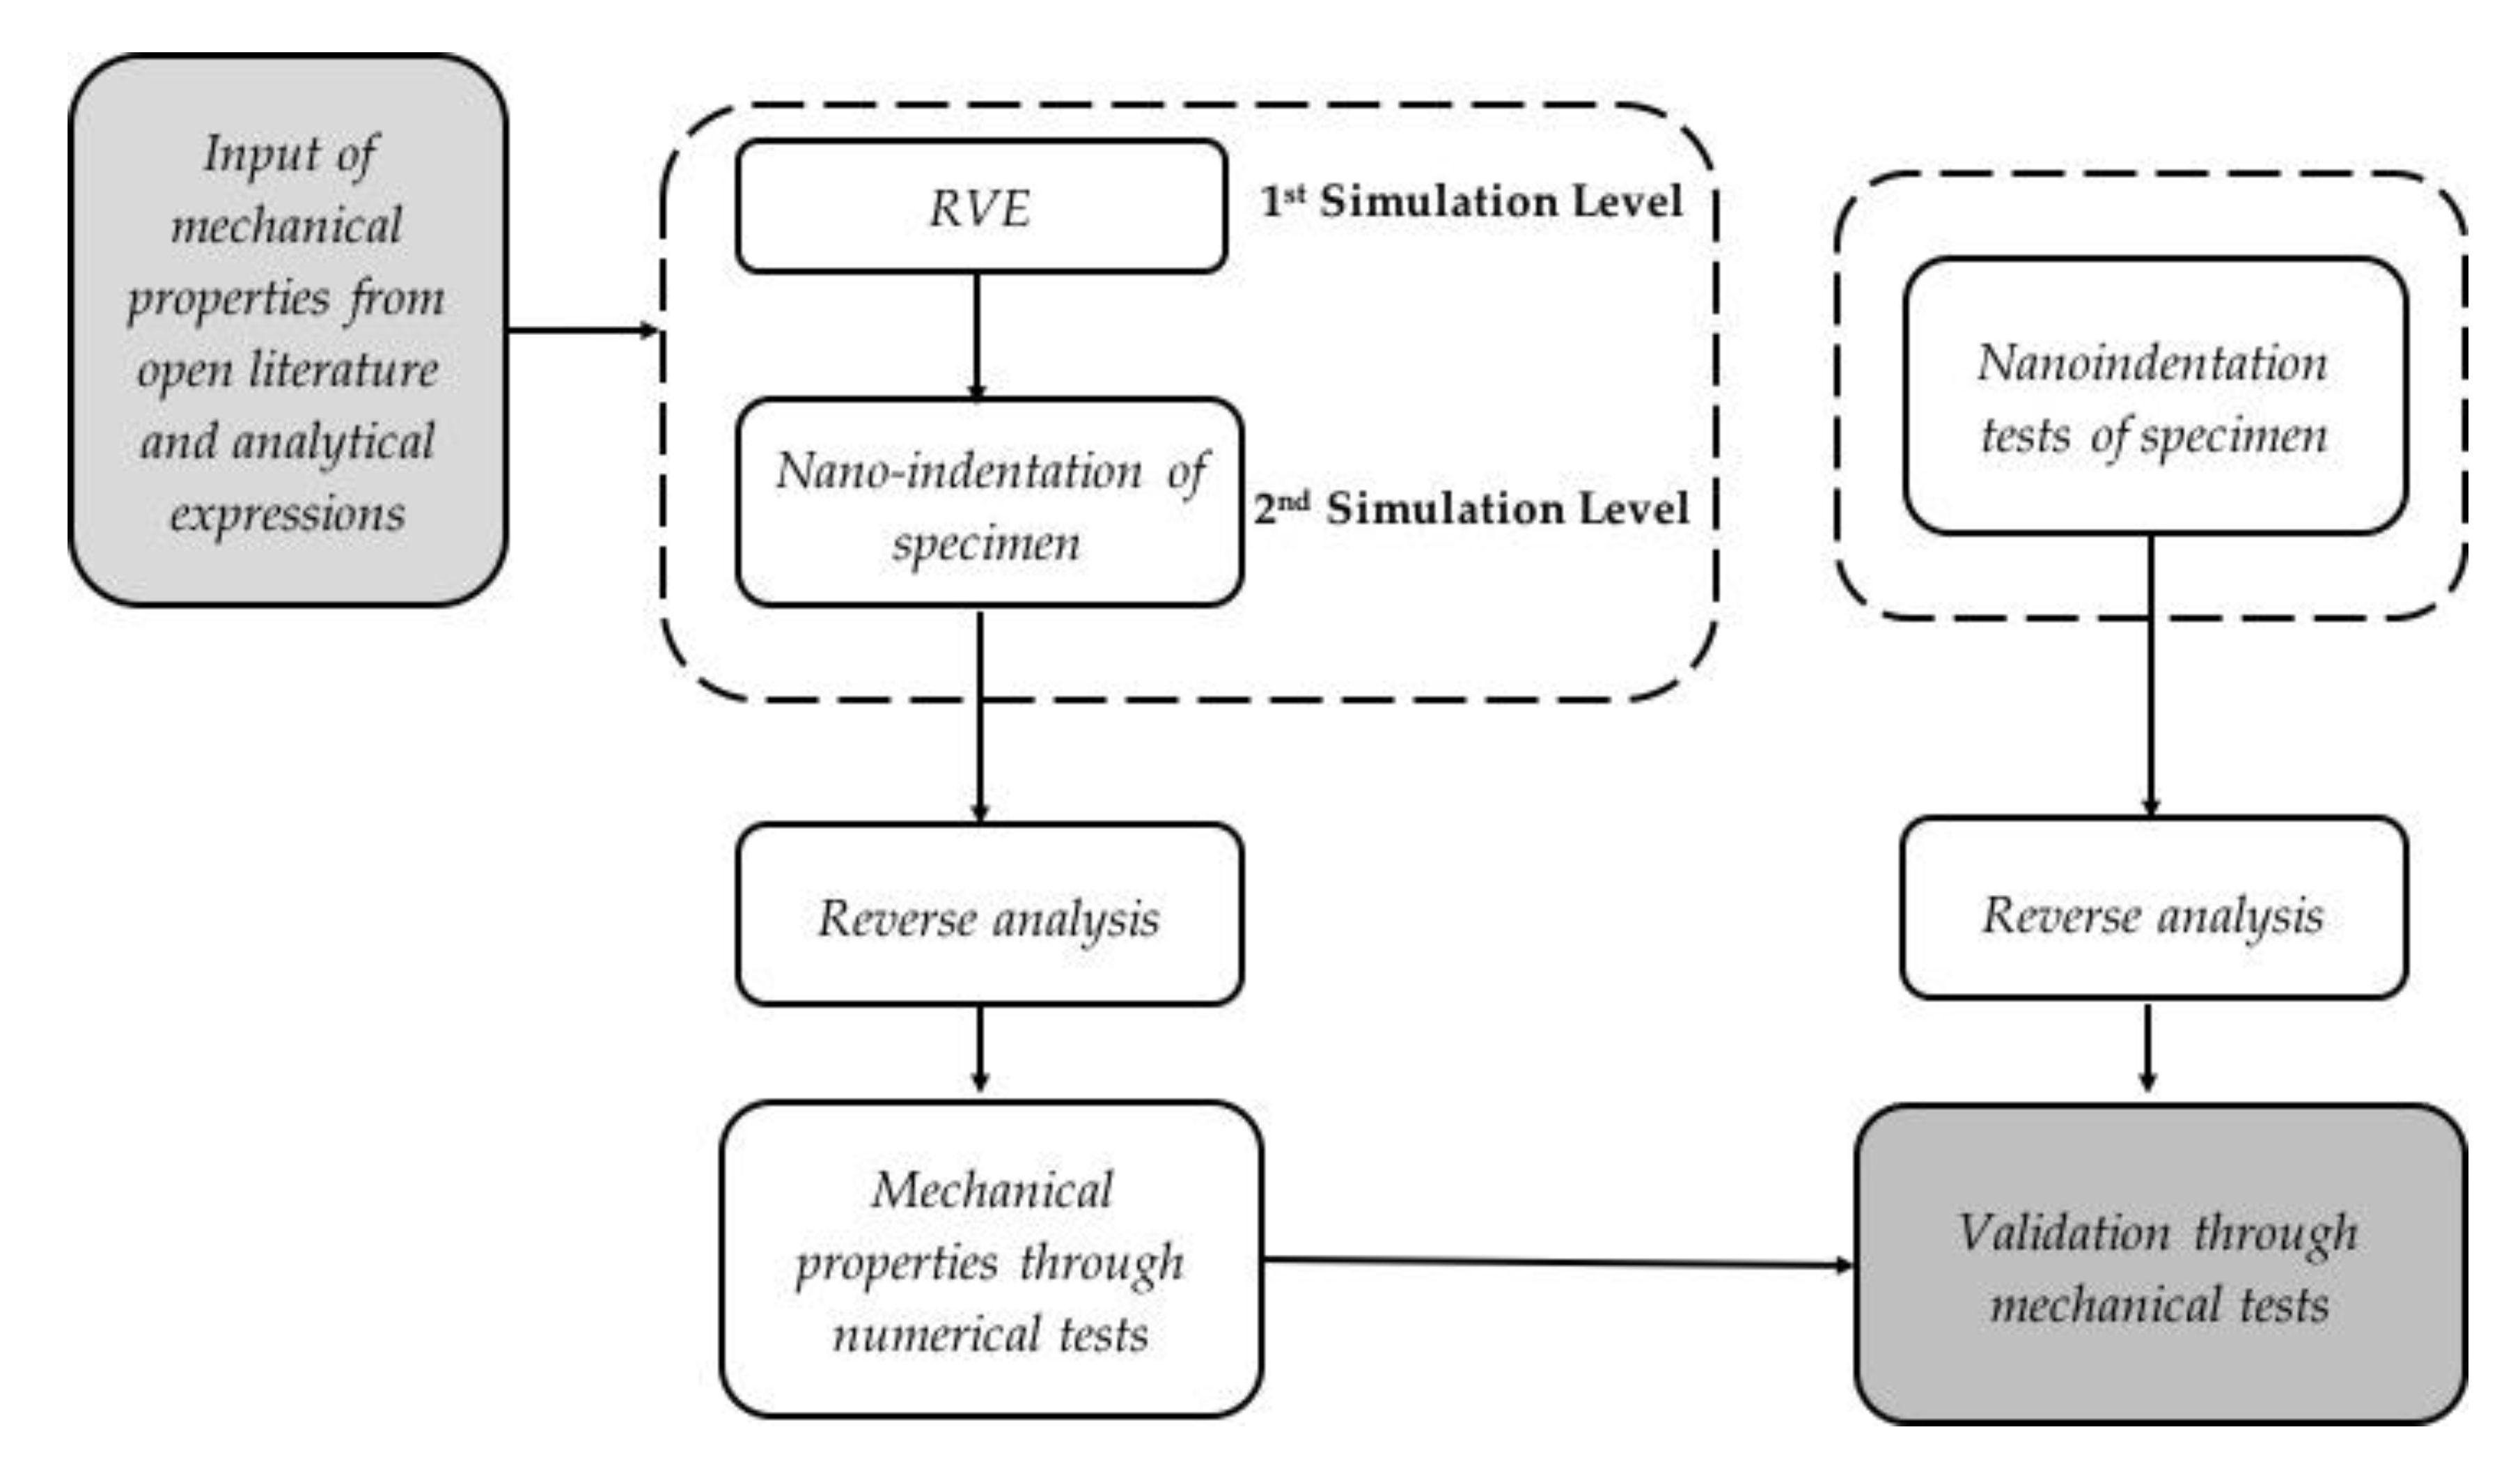
2.3. Inverse Analysis Algorithm
3. Experimental
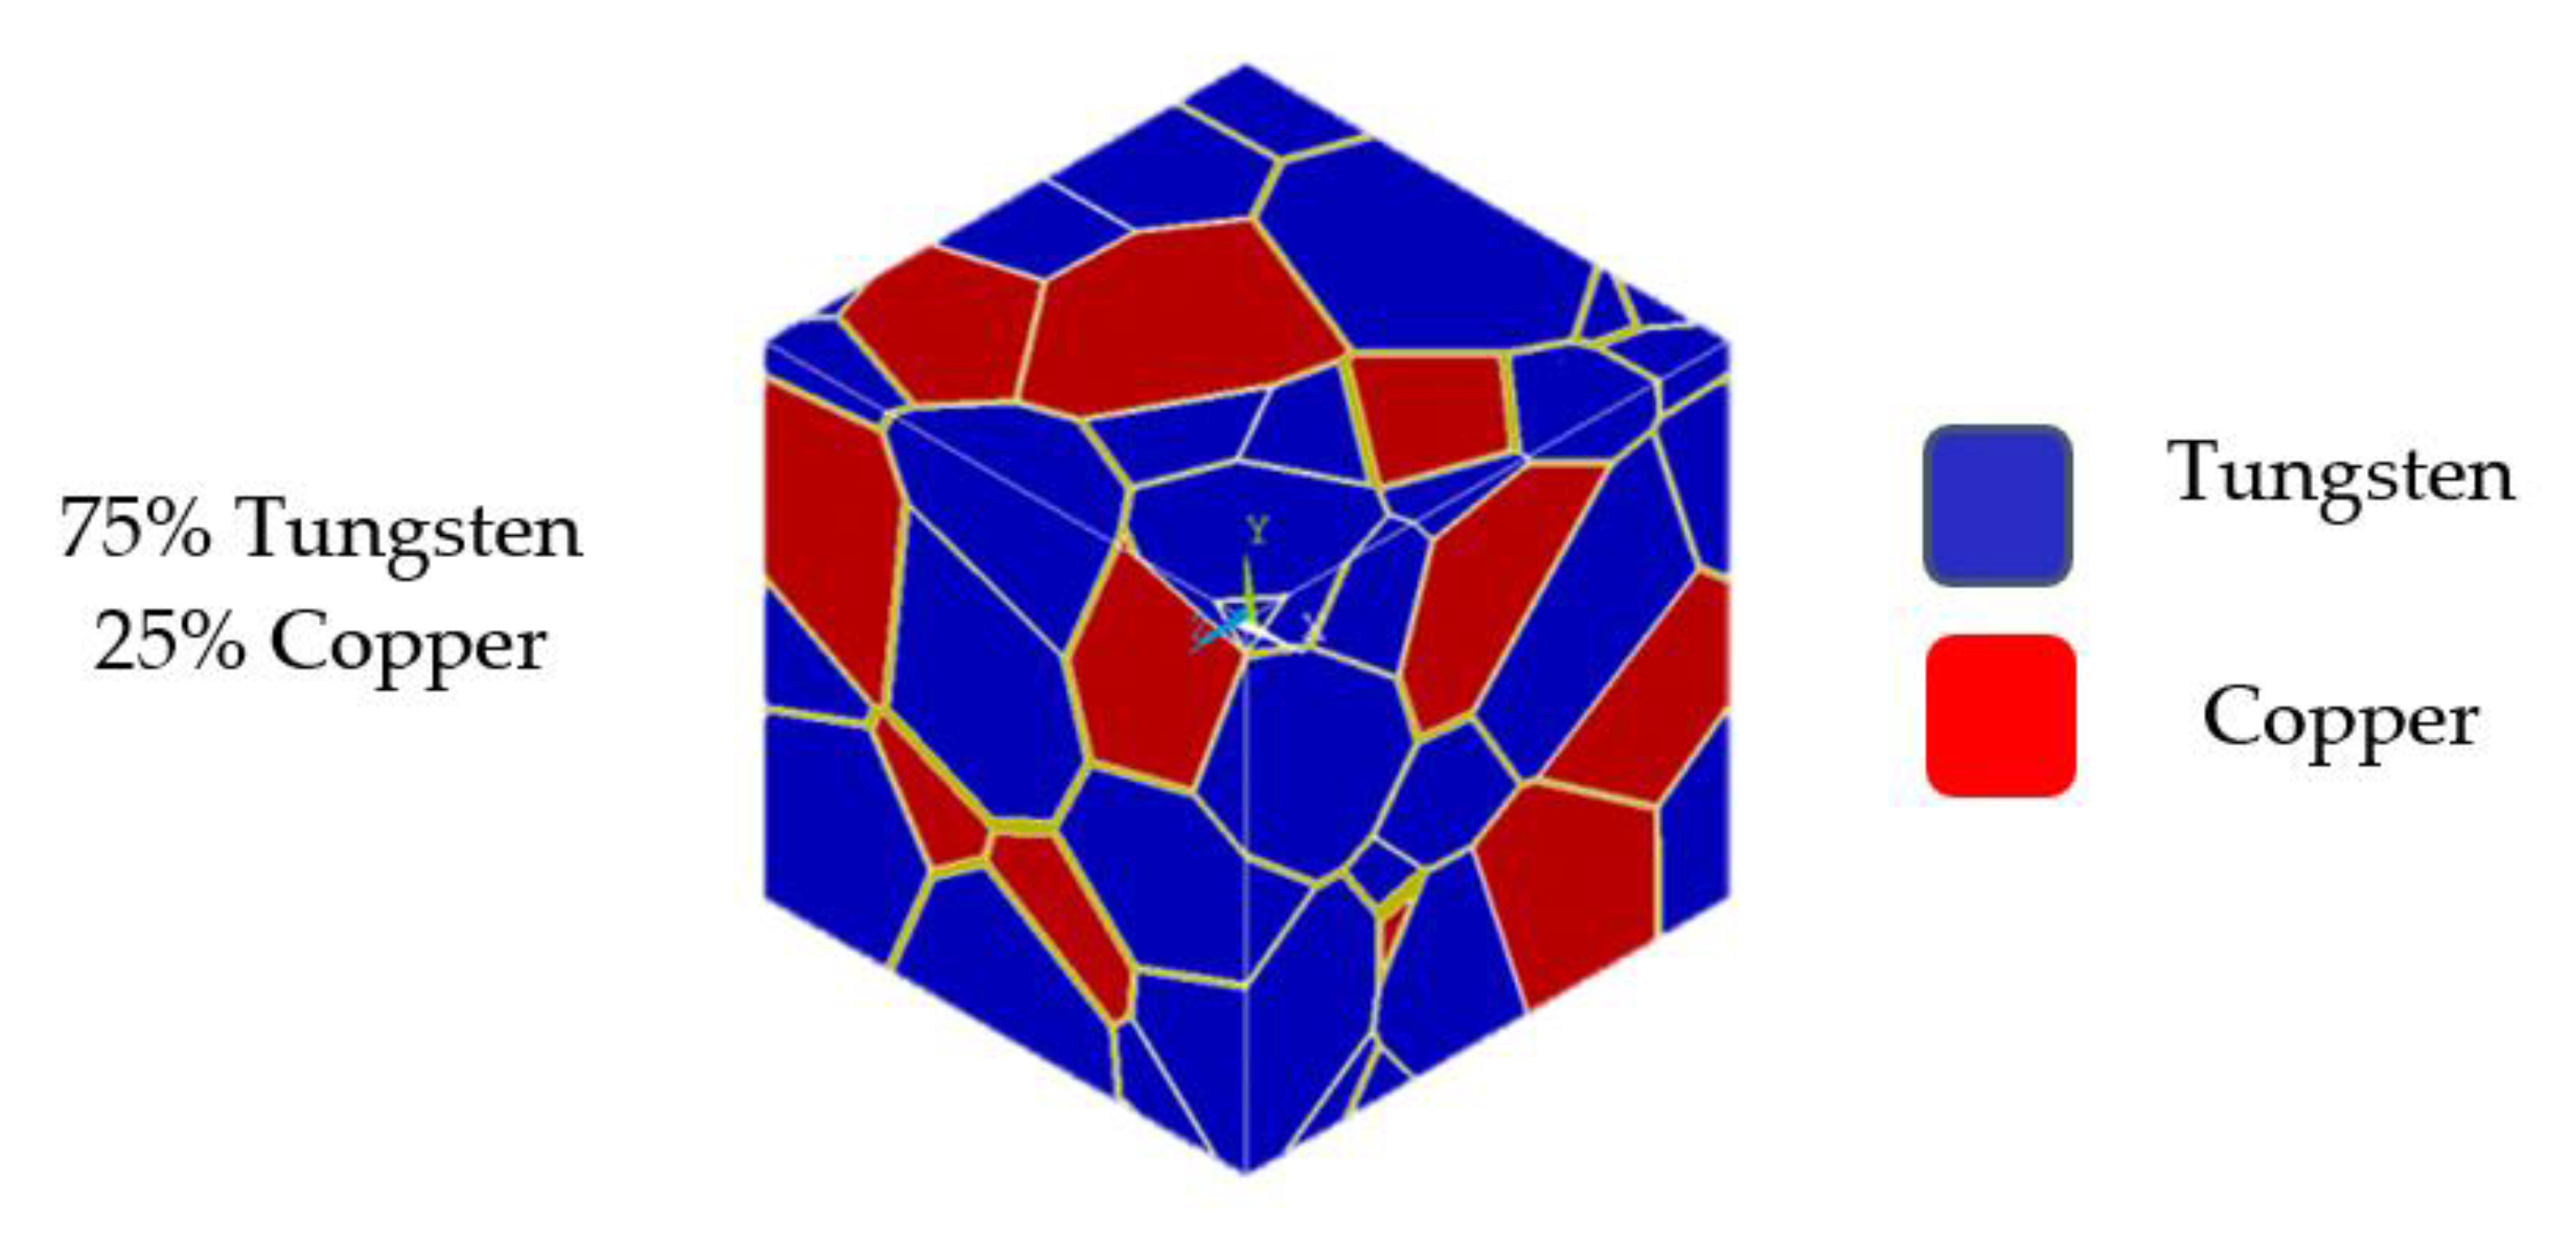
3.1. Materials
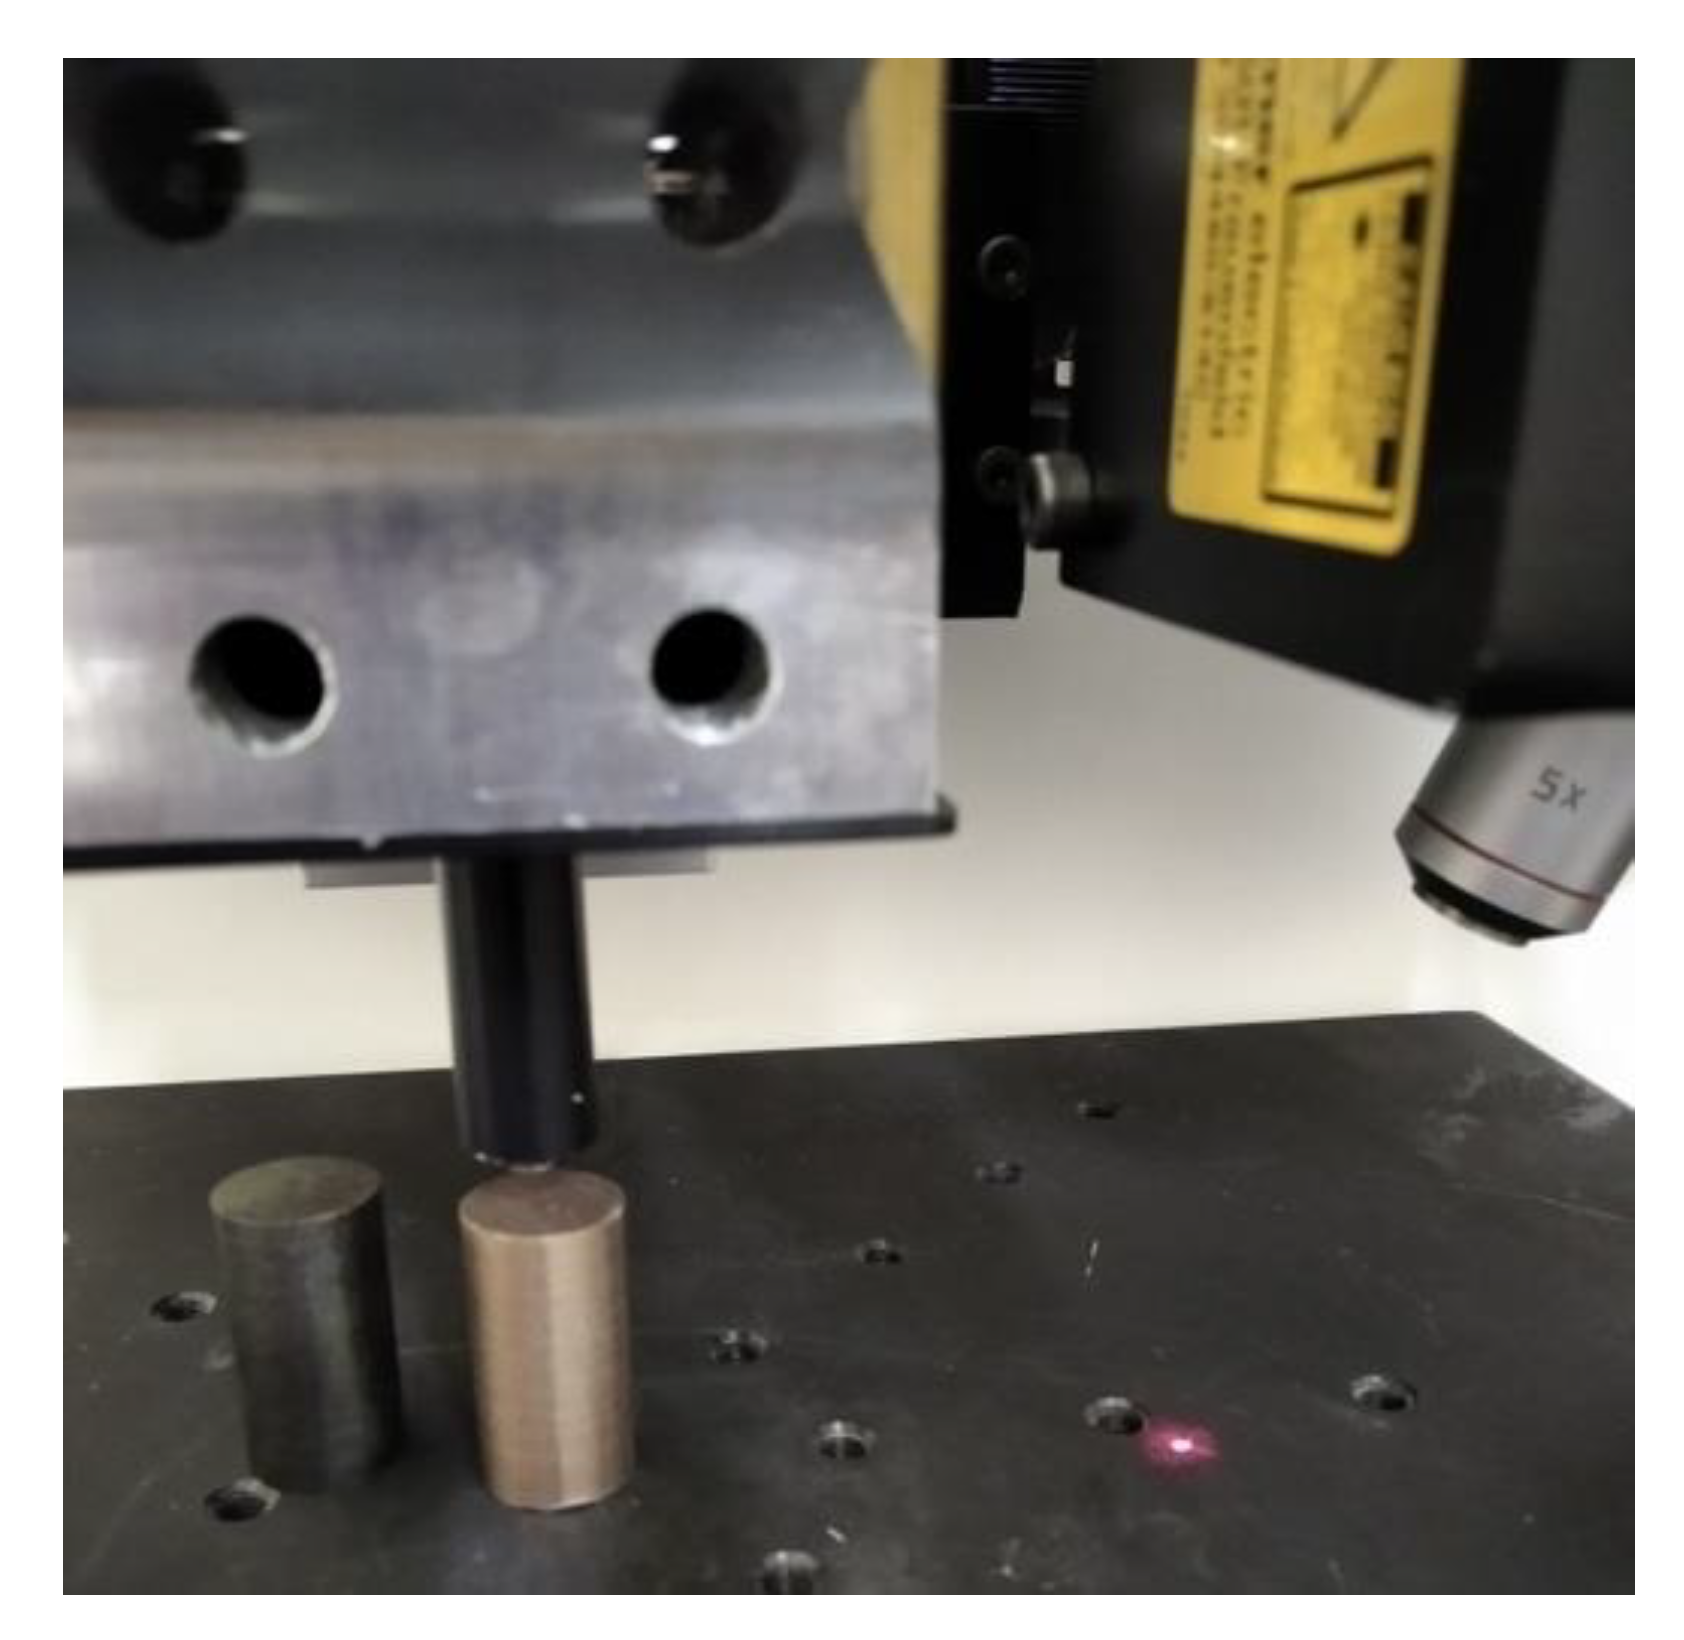
3.2. Nanoindentation Test
4. Results
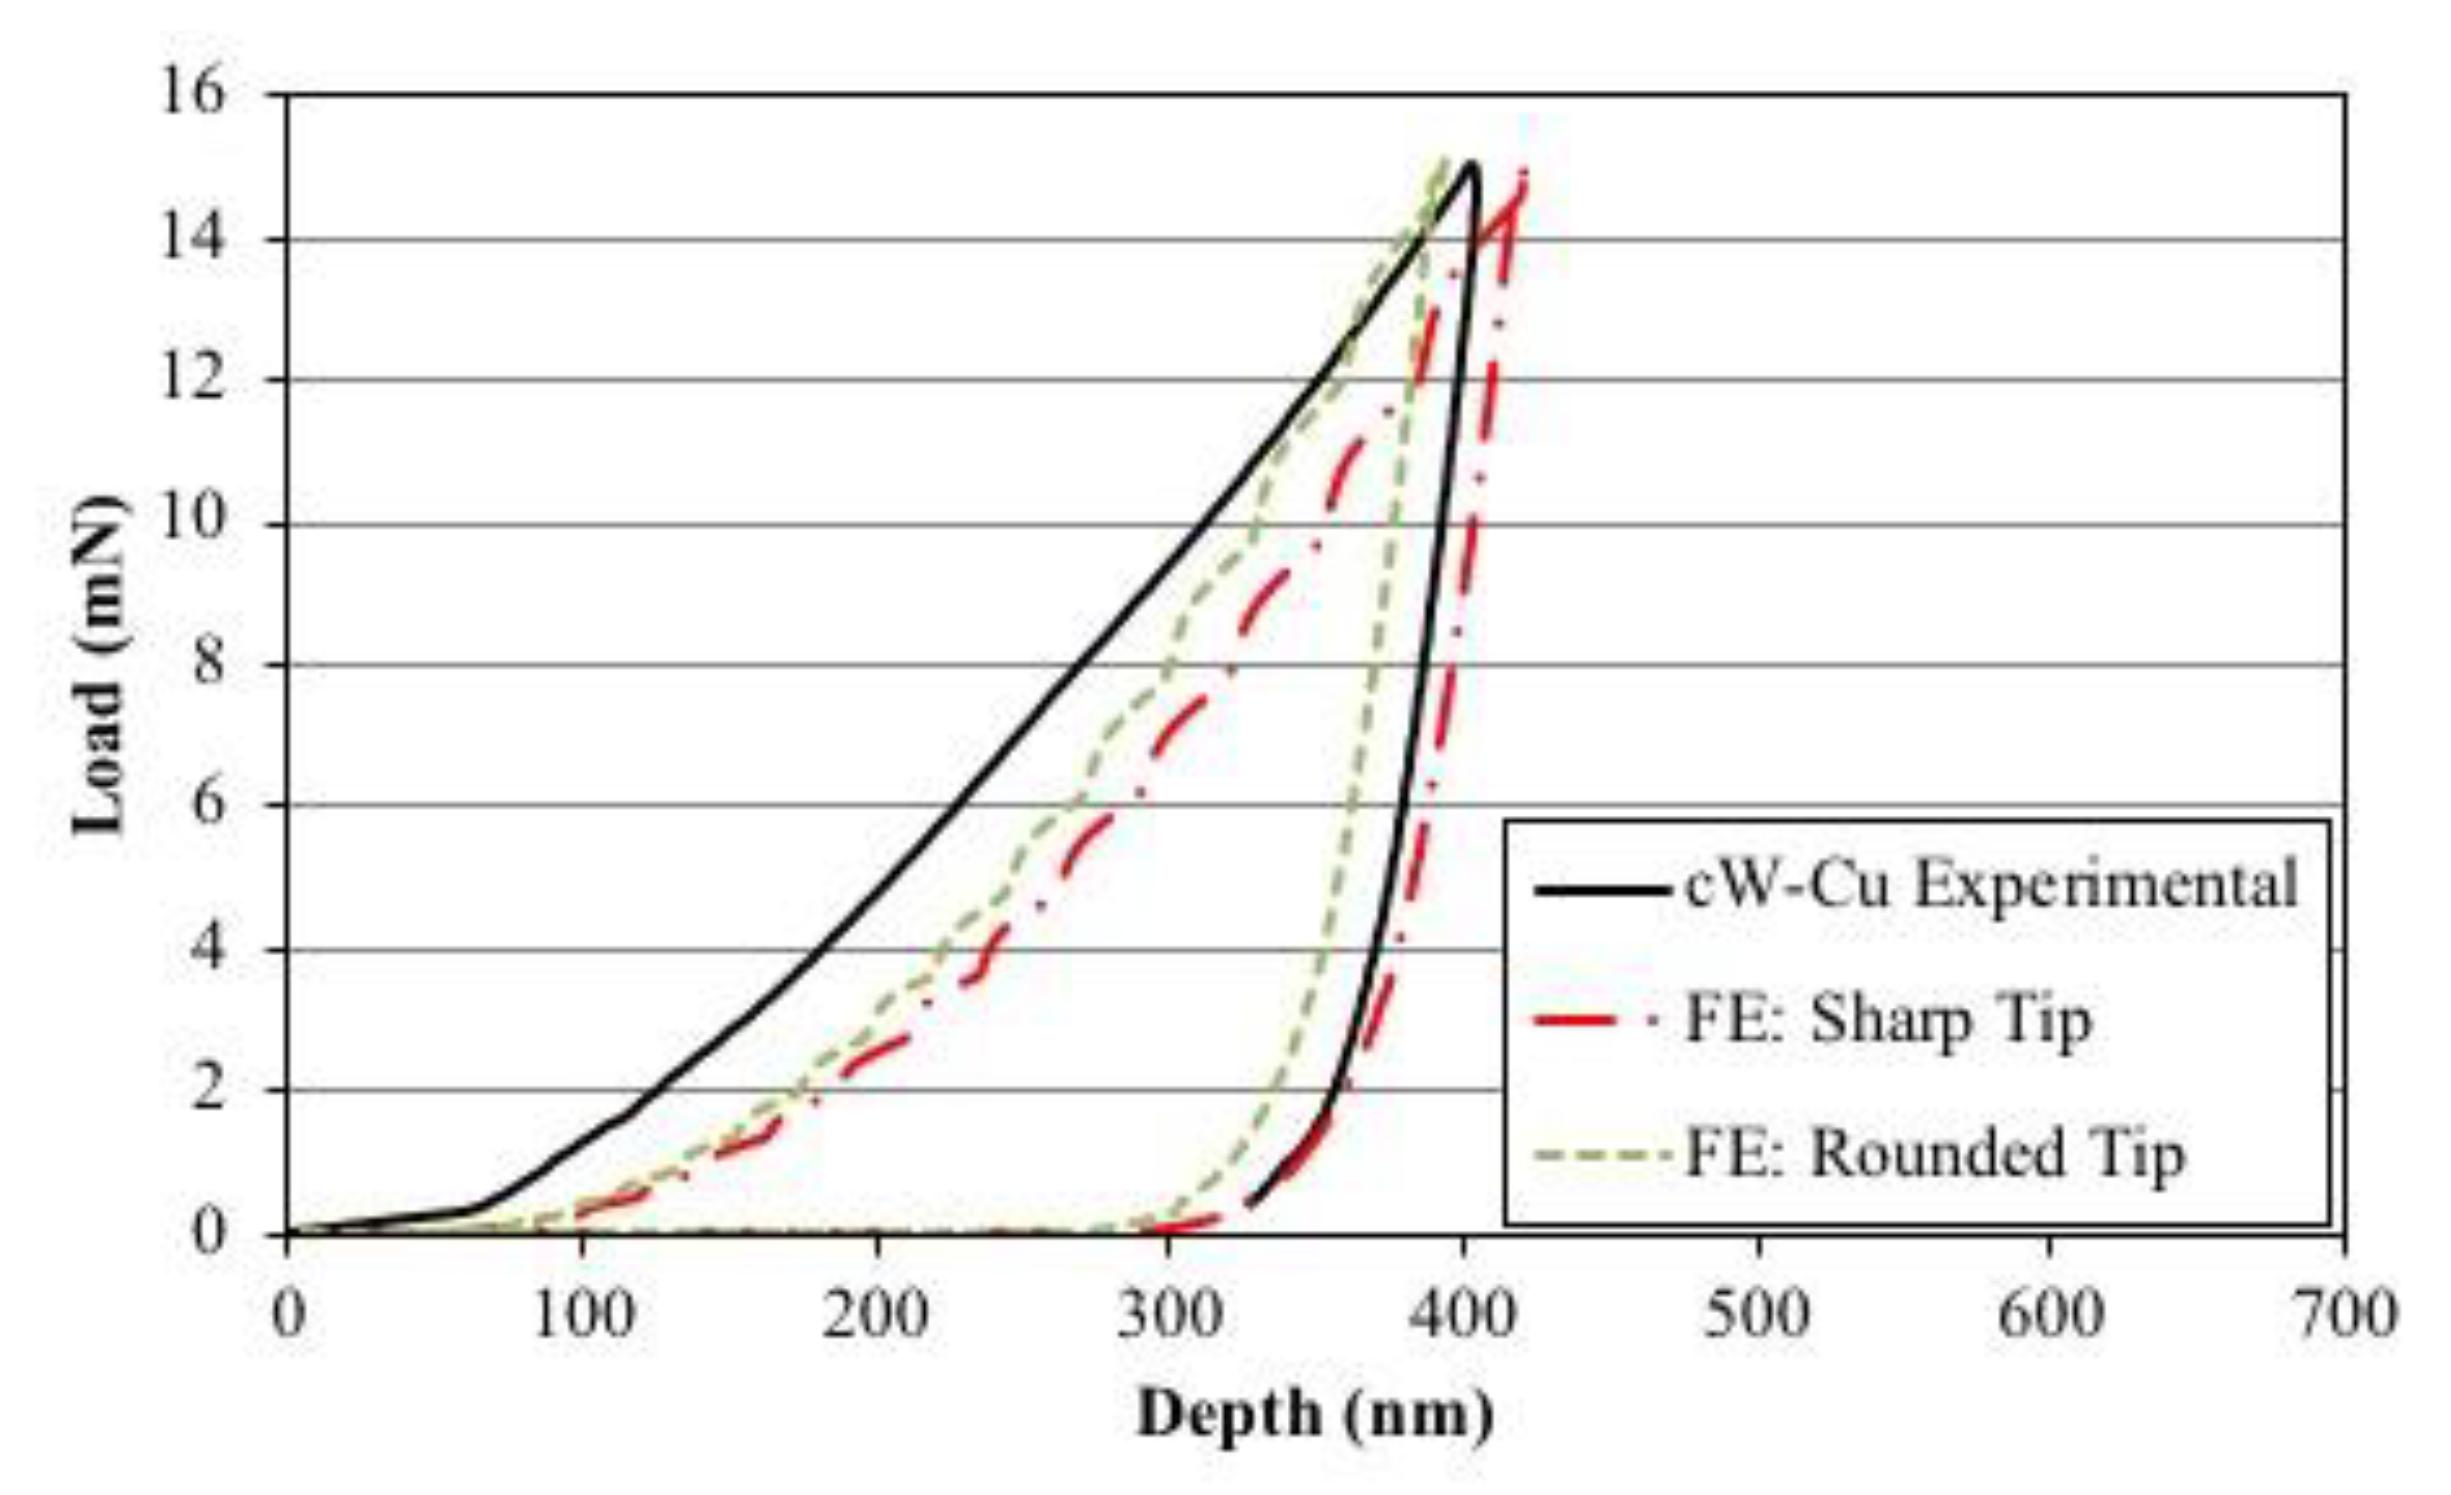
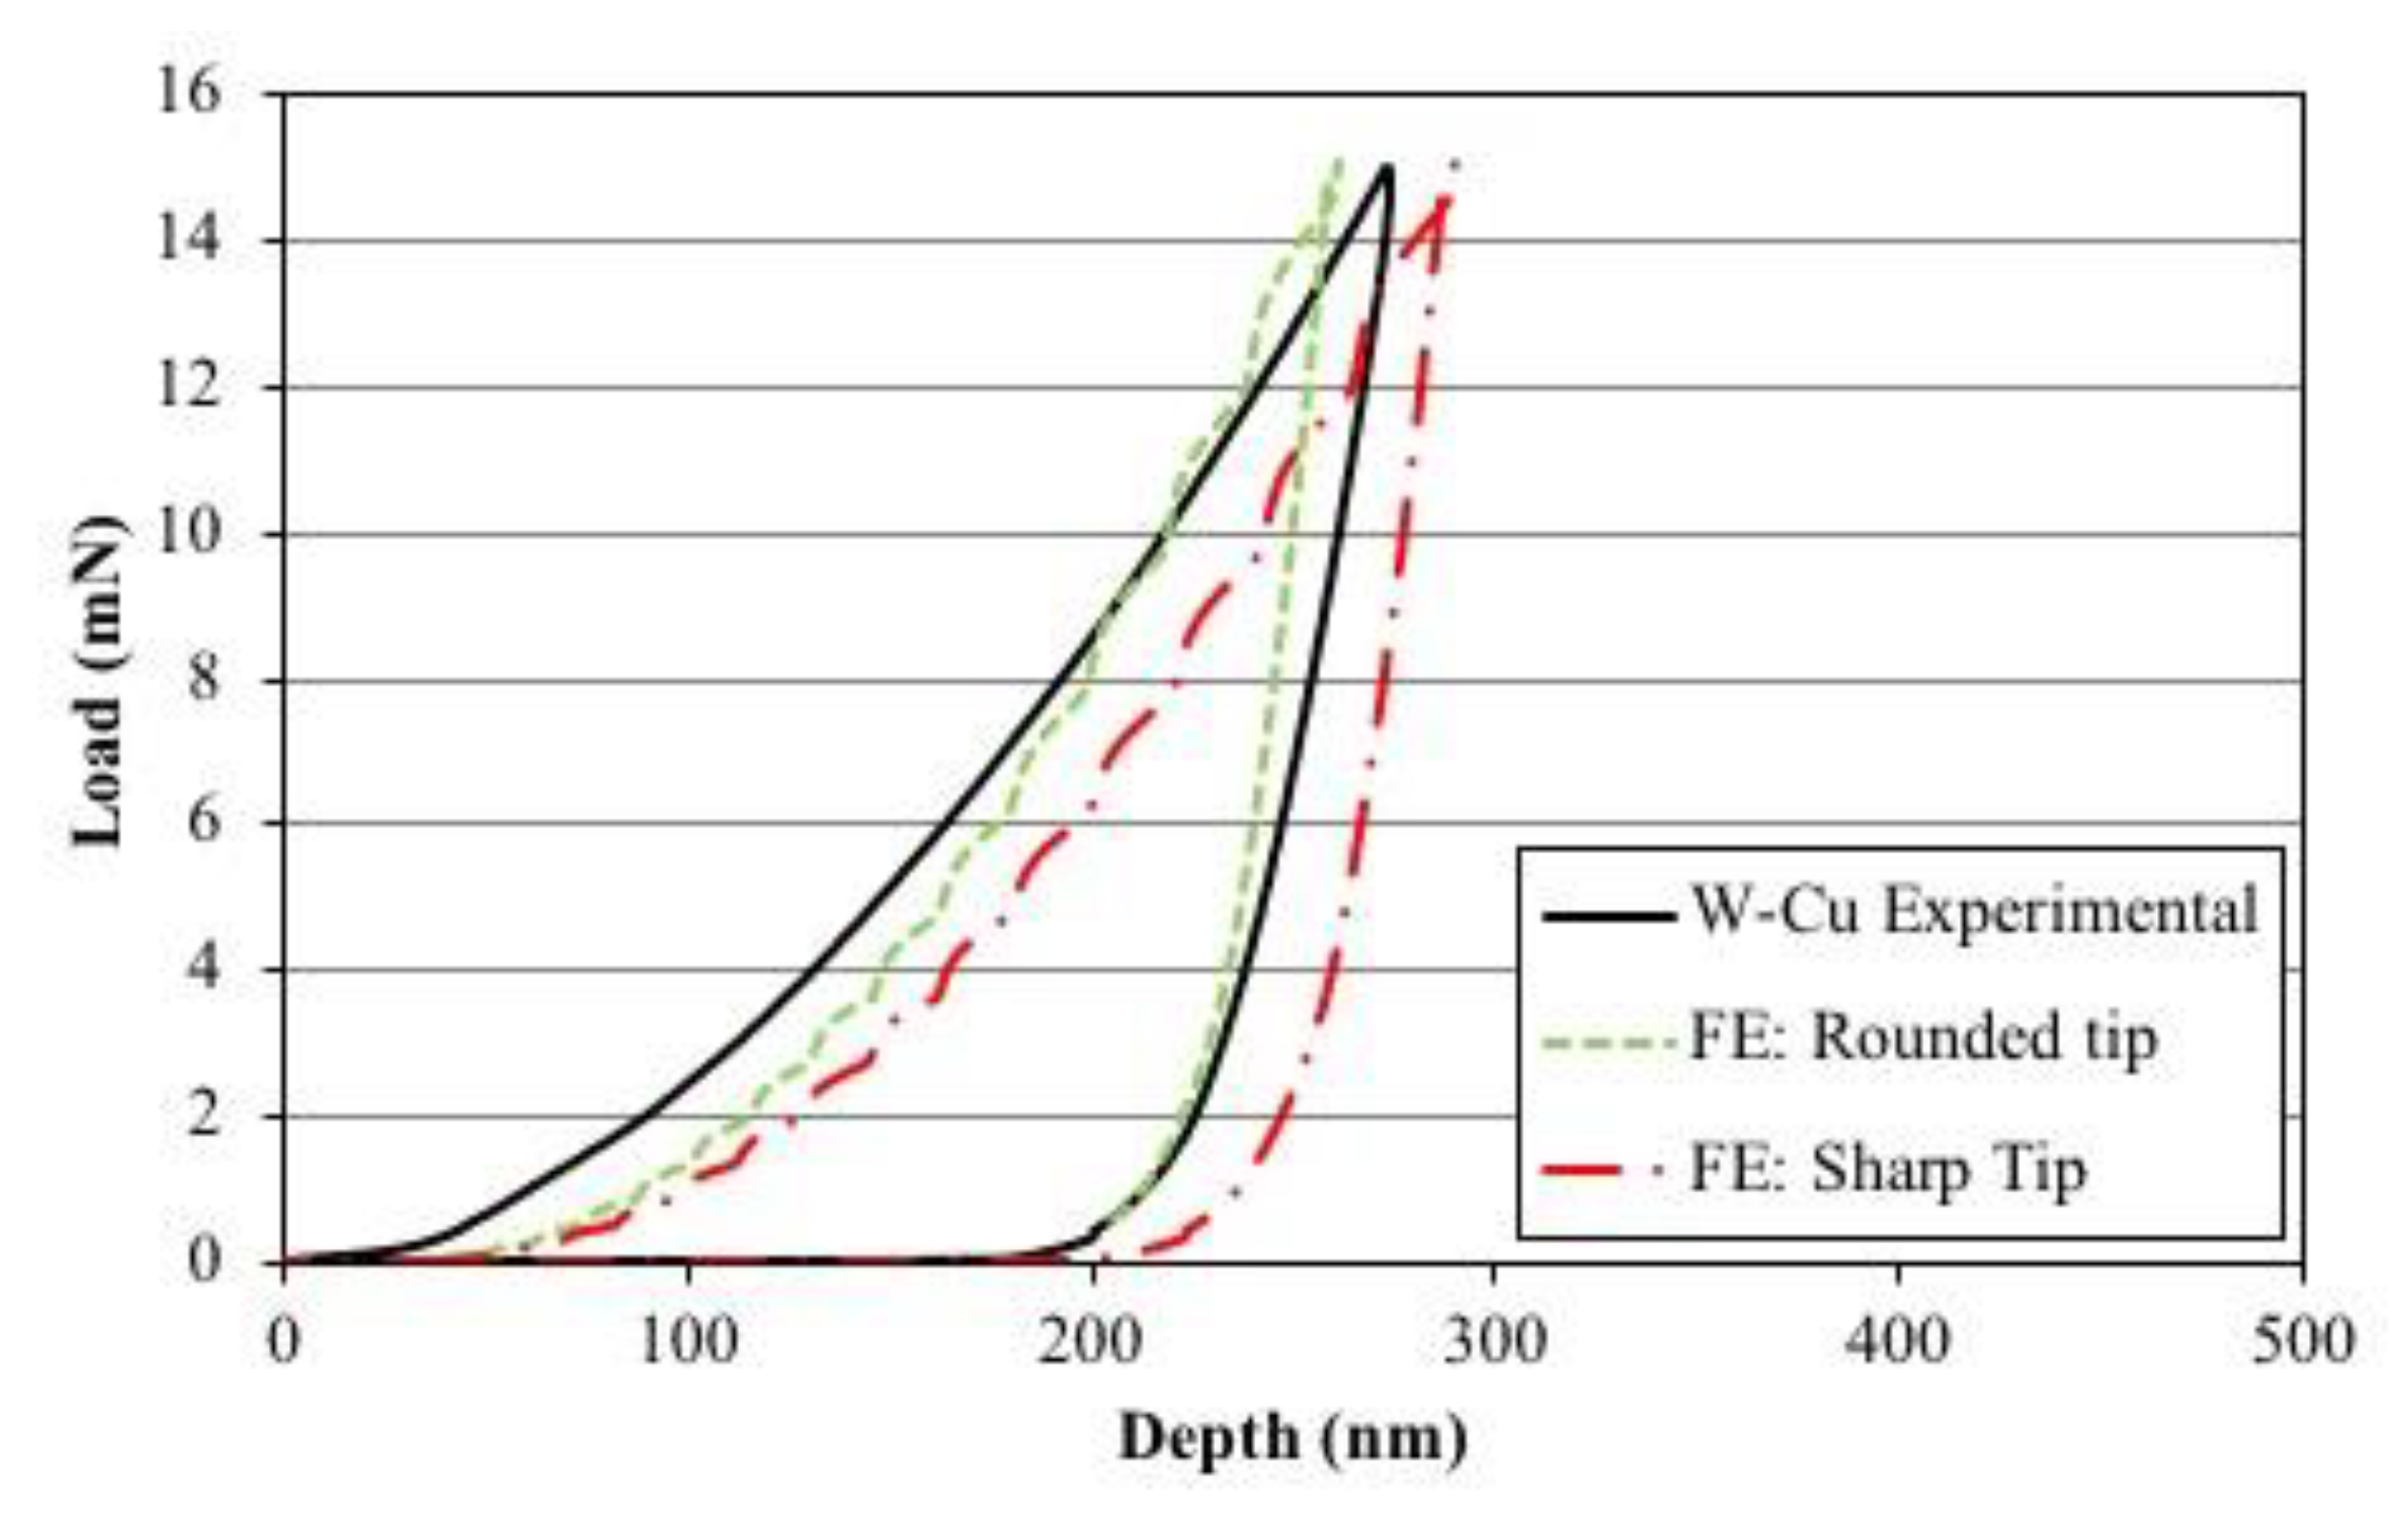
4.1. Validation of the Numerical Nanoindentation Model
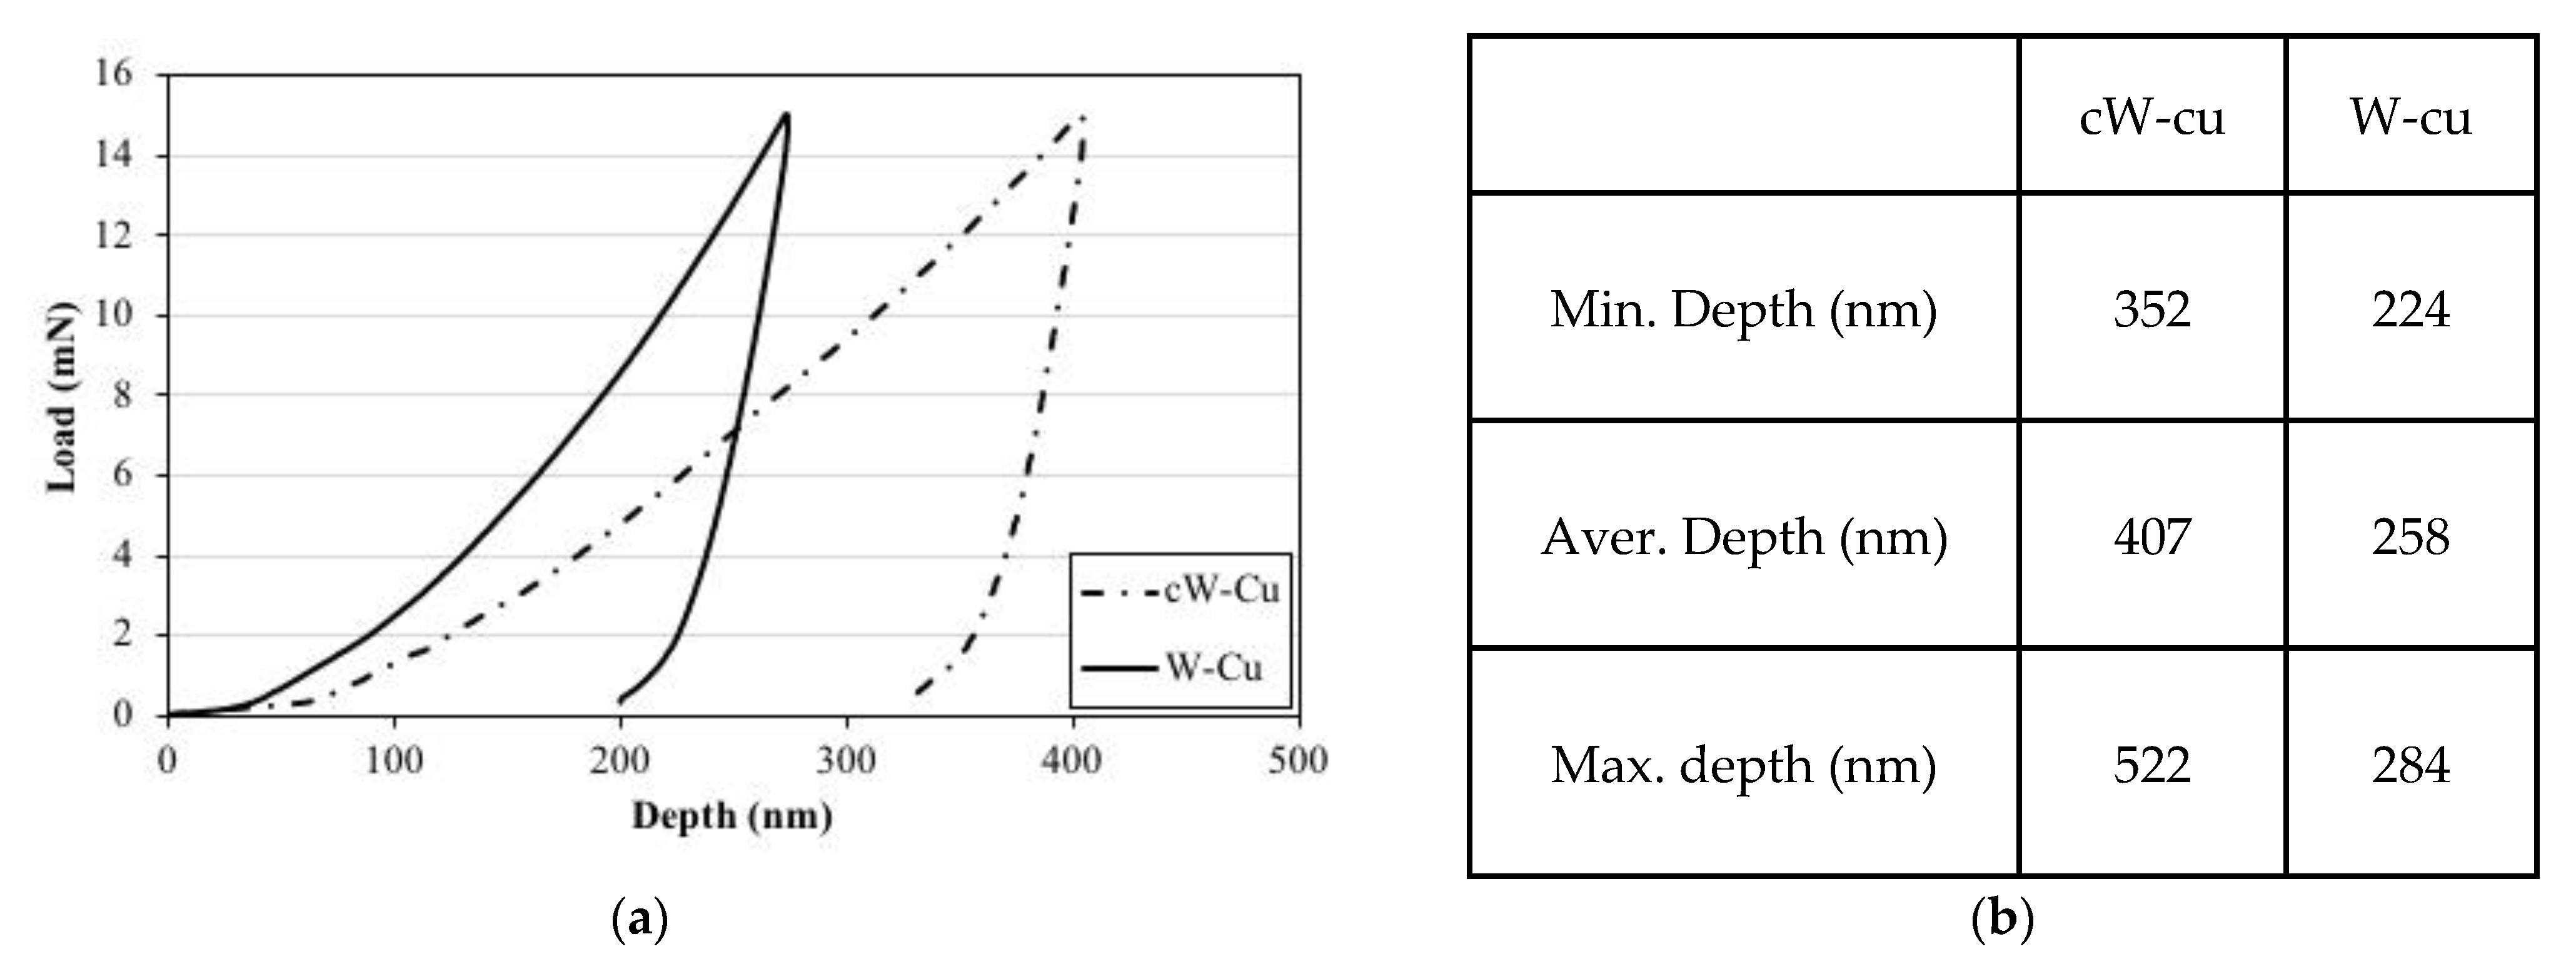
4.2. Comparison of Nanoindentation Experimental Results Utilizing the SSCUBONI Algorithm
4.3. Comparison of Numerical Nanoindentation Results Utilizing the Inverse Algorithm
5. Conclusions
Author Contributions
Funding
Data Availability Statement
Acknowledgments
Conflicts of Interest
References
- Gleiter, H. Nanostructured materials: Basic concepts and microstructure. Acta Mater. 2000, 48, 1–29. [Google Scholar] [CrossRef] [Green Version]
- Kumar, K.; Van Swygenhoven, H.; Suresh, S. Mechanical behavior of nanocrystalline metals and alloys The Golden Jubilee Issue—Selected topics in Materials Science and Engineering: Past, Present and Future, edited by S. Suresh. Acta Mater. 2003, 51, 5743–5774. [Google Scholar] [CrossRef]
- Naik, S.; Walley, S. The Hall–Petch and inverse Hall–Petch relations and the hardness of nanocrystalline metals. J. Mater. Sci. 2019, 55, 2661–2681. [Google Scholar] [CrossRef] [Green Version]
- Hibbard, G.; Erb, U.; Aust, K.; Klement, U.; Palumbo, G. Thermal Stability of Nanostructured Electrodeposits. J. Metastable Nanocryst. Mater. 2002, 13, 387–396. [Google Scholar] [CrossRef]
- Suryanarayana, C. Nanocrystalline materials. Int. Mater. Rev. 1995, 40, 41–64. [Google Scholar] [CrossRef]
- Groza, J. Nanostructured Materials. Mater. Today 2002, 5, 55. [Google Scholar]
- Liao, W.; Lan, S.; Gao, L.; Zhang, H.; Xu, S.; Song, J.; Wang, X.; Lu, Y. Nanocrystalline high-entropy alloy (CoCrFeNiAl0.3) thin-film coating by magnetron sputtering. Thin Solid Films 2017, 638, 383–388. [Google Scholar] [CrossRef]
- Liao, W.; Zhang, H.; Liu, Z.; Li, P.; Huang, J.; Yu, C.; Lu, Y. High Strength and Deformation Mechanisms of Al0.3CoCrFeNi High-Entropy Alloy Thin Films Fabricated by Magnetron Sputtering. Entropy 2019, 21, 146. [Google Scholar] [CrossRef] [PubMed] [Green Version]
- Xing, Q.; Ma, J.; Zhang, Y. Phase thermal stability and mechanical properties analyses of (Cr,Fe,V)-(Ta,W) multiple-based elemental system using a compositional gradient film. Int. J. Miner. Metall. Mater. 2020, 27, 1379–1387. [Google Scholar] [CrossRef]
- Xing, Q.; Ma, J.; Wang, C.; Zhang, Y. High-Throughput Screening Solar-Thermal Conversion Films in a Pseudobinary (Cr, Fe, V)-(Ta, W) System. ACS Comb. Sci. 2018, 20, 602–610. [Google Scholar] [CrossRef]
- Lowe, T.; Valiev, R. Producing nanoscale microstructures through severe plastic deformation. JOM 2000, 52, 27–28. [Google Scholar] [CrossRef]
- Valiev, R.; Islamgaliev, R.; Alexandrov, I. Bulk nanostructured materials from severe plastic deformation. Prog. Mater. Sci. 2000, 45, 103–189. [Google Scholar] [CrossRef]
- Zhou, H.; Hu, L.; Sun, Y.; Zhang, H.; Duan, C.; Yu, H. Synthesis of nanocrystalline AZ31 magnesium alloy with titanium addition by mechanical milling. Mater. Charact. 2016, 113, 108–116. [Google Scholar] [CrossRef]
- Suresh, S. Graded Materials for Resistance to Contact Deformation and Damage. Science 2001, 292, 2447–2451. [Google Scholar] [CrossRef] [Green Version]
- Delfosse, D. Fundamentals of Functionally Graded Materials. Mater. Today 1998, 1, 18. [Google Scholar] [CrossRef]
- Masumura, R.; Hazzledine, P.; Pande, C. Yield stress of fine grained materials. Acta Mater. 1998, 46, 4527–4534. [Google Scholar] [CrossRef]
- Jeong, D.; Gonzalez, F.; Palumbo, G.; Aust, K.; Erb, U. The effect of grain size on the wear properties of electrodeposited nanocrystalline nickel coatings. Scr. Mater. 2001, 44, 493–499. [Google Scholar] [CrossRef]
- Hayes, R.; Witkin, D.; Zhou, F.; Lavernia, E. Deformation and activation volumes of cryomilled ultrafine-grained aluminum. Acta Mater. 2004, 52, 4259–4271. [Google Scholar] [CrossRef]
- Jia, D.; Ramesh, K.; Ma, E. Effects of nanocrystalline and ultrafine grain sizes on constitutive behavior and shear bands in iron. Acta Mater. 2003, 51, 3495–3509. [Google Scholar] [CrossRef]
- Cavaliere, P. Strain Rate Sensitivity and Fatigue Properties of an Al-fe Nanocrystalline Alloy Produced by Cryogenic Ball Milling. Multidiscip. Model. Mater. Struct. 2007, 3, 225–234. [Google Scholar] [CrossRef]
- Tabor, D. The Hardness of Metals; Oxford University Press: New York, NY, USA, 1951. [Google Scholar]
- Tabor, D. The hardness of solids. Rev. Phys. Technol. 1970, 1, 145–179. [Google Scholar] [CrossRef]
- Doerner, M.; Nix, W. A method for interpreting the data from depth-sensing indentation instruments. J. Mater. Res. 1986, 1, 601–609. [Google Scholar] [CrossRef]
- Pharr, G.; Cook, R. Instrumentation of a conventional hardness tester for load-displacement measurement during indentation. J. Mater. Res. 1990, 5, 847–851. [Google Scholar] [CrossRef]
- Oliver, W.; Pharr, G. An improved technique for determining hardness and elastic modulus using load and displacement sensing indentation experiments. J. Mater. Res. 1992, 7, 1564–1583. [Google Scholar] [CrossRef]
- Field, J.; Swain, M. A simple predictive model for spherical indentation. J. Mater. Res. 1993, 8, 297–306. [Google Scholar] [CrossRef]
- Field, J.; Swain, M. Determining the mechanical properties of small volumes of material from submicrometer spherical indentations. J. Mater. Res. 1995, 10, 101–112. [Google Scholar] [CrossRef]
- Gerberich, W.; Nelson, J.; Lilleodden, E.; Anderson, P.; Wyrobek, J. Indentation induced dislocation nucleation: The initial yield point. Acta Mater. 1996, 44, 3585–3598. [Google Scholar] [CrossRef]
- Bolshakov, A.; Oliver, W.; Pharr, G. Influences of stress on the measurement of mechanical properties using nanoindentation: Part II. Finite element simulations. J. Mater. Res. 1996, 11, 760–768. [Google Scholar] [CrossRef]
- Alcalá, J.; Giannakopoulos, A.; Suresh, S. Continuous measurements of load-penetration curves with spherical microindenters and the estimation of mechanical properties. J. Mater. Res. 1998, 13, 1390–1400. [Google Scholar] [CrossRef]
- Cheng, Y.; Cheng, C. Scaling approach to conical indentation in elastic-plastic solids with work hardening. J. Appl. Phys. 1998, 84, 1284–1291. [Google Scholar] [CrossRef]
- Cheng, Y.; Cheng, C. Relationships between hardness, elastic modulus, and the work of indentation. Appl. Phys. Lett. 1998, 73, 614–616. [Google Scholar] [CrossRef]
- Suresh, S.; Nieh, T.; Choi, B. Nano-indentation of copper thin films on silicon substrates. Scr. Mater. 1999, 41, 951–957. [Google Scholar] [CrossRef] [Green Version]
- Gouldstone, A.; Koh, H.; Zeng, K.; Giannakopoulos, A.; Suresh, S. Discrete and continuous deformation during nanoindentation of thin films. Acta Mater. 2000, 48, 2277–2295. [Google Scholar] [CrossRef]
- Johnson, K. The correlation of indentation experiments. J. Mech. Phys. Solids 1970, 18, 115–126. [Google Scholar] [CrossRef]
- Suresh, S.; Alcala, J.; Giannakopoulos, A. Depth Sensing Indentation and Methodology for Mechanical Property Measurements. U.S. Patent 6134954A, 19 June 2020. [Google Scholar]
- Dao, M.; Chollacoop, N.; Van Vliet, K.; Venkatesh, T.; Suresh, S. Computational modeling of the forward and reverse problems in instrumented sharp indentation. Acta Mater. 2001, 49, 3899–3918. [Google Scholar] [CrossRef] [Green Version]
- Giannakopoulos, A.; Larsson, P.; Vestergaard, R. Analysis of Vickers indentation. Int. J. Solids Struct. 1994, 31, 2679–2708. [Google Scholar] [CrossRef]
- Cheng, Y.; Cheng, C. Can stress–strain relationships be obtained from indentation curves using conical and pyramidal indenters? J. Mater. Res. 1999, 14, 3493–3496. [Google Scholar] [CrossRef] [Green Version]
- Giannakopoulos, A.; Suresh, S. Determination of elastoplastic properties by instrumented sharp indentation. Scr. Mater. 1999, 40, 1191–1198. [Google Scholar] [CrossRef] [Green Version]
- Venkatesh, T. Determination of elasto-plastic properties by instrumented sharp indentation: Guidelines for property extraction. Scr. Mater. 2000, 42, 833–839. [Google Scholar] [CrossRef]
- Suresh, S.; Giannakopoulos, A. A new method for estimating residual stresses by instrumented sharp indentation. Acta Mater. 1998, 46, 5755–5767. [Google Scholar] [CrossRef]
- Bhattacharya, A.; Nix, W. Finite element simulation of indentation experiments. Int. J. Solids Struct. 1988, 24, 881–891. [Google Scholar] [CrossRef]
- Laursen, T.; Simo, J. A study of the mechanics of microindentation using finite elements. J. Mater. Res. 1992, 7, 618–626. [Google Scholar] [CrossRef]
- Tunvisut, K.; O’Dowd, N.; Busso, E. Use of scaling functions to determine mechanical properties of thin coatings from microindentation tests. Int. J. Solids Struct. 2001, 38, 335–351. [Google Scholar] [CrossRef]
- Hill, R.; Storakers, B.; Zdunek, A. A theoretical study of the Brinell hardness test. Proc. R. Soc. Lond. A Math. Phys. Sci. 1989, 423, 301–330. [Google Scholar]
- Larsson, P.; Giannakopoulos, A.; SÖderlund, E.; Rowcliffe, D.; Vestergaard, R. Analysis of Berkovich indentation. Int. J. Solids Struct. 1996, 33, 221–248. [Google Scholar] [CrossRef]
- Bazios, P.; Tserpes, K.; Pantelakis, S. Modelling and Experimental Validation of the Porosity Effect on the Behaviour of Nano-Crystalline Materials. Metals 2020, 10, 821. [Google Scholar] [CrossRef]
- Oliver, W.; Pharr, G. Measurement of hardness and elastic modulus by instrumented indentation: Advances in understanding and refinements to methodology. J. Mater. Res. 2004, 19, 3–20. [Google Scholar] [CrossRef]
- Chrobak, D.; Kim, K.; Kurzydłowski, K.; Nowak, R. Nanoindentation experiments with different loading rate distinguish the mechanism of incipient plasticity. Appl. Phys. Lett. 2013, 103, 072101. [Google Scholar] [CrossRef]
- Wang, Y.; Raabe, D.; Klüber, C.; Roters, F. Orientation dependence of nanoindentation pile-up patterns and of nanoindentation microtextures in copper single crystals. Acta Mater. 2004, 52, 2229–2238. [Google Scholar] [CrossRef] [Green Version]
- Tadmor, E.; Miller, R.; Phillips, R.; Ortiz, M. Nanoindentation and incipient plasticity. J. Mater. Res. 1999, 14, 2233–2250. [Google Scholar] [CrossRef] [Green Version]
- Zhang, J.; Zhang, J.; Wang, Z.; Hartmaier, A.; Yan, Y.; Sun, T. Interaction between phase transformations and dislocations at incipient plasticity of monocrystalline silicon under nanoindentation. Comput. Mater. Sci. 2017, 131, 55–61. [Google Scholar] [CrossRef]
- Fischer-Cripps, A. A simple phenomenological approach to nanoindentation creep. Mater. Sci. Eng. A 2004, 385, 74–82. [Google Scholar] [CrossRef]
- Elmustafa, A.; Stone, D. Nanoindentation and the indentation size effect: Kinetics of deformation and strain gradient plasticity. J. Mech. Phys. Solids 2003, 51, 357–381. [Google Scholar] [CrossRef]
- Karthik, V.; Visweswaran, P.; Bhushan, A.; Pawaskar, D.; Kasiviswanathan, K.; Jayakumar, T.; Raj, B. Finite element analysis of spherical indentation to study pile-up/sink-in phenomena in steels and experimental validation. Int. J. Mech. Sci. 2012, 54, 74–83. [Google Scholar] [CrossRef]
- Biener, M.; Biener, J.; Hodge, A.; Hamza, A. Dislocation nucleation in bcc Ta single crystals studied by nanoindentation. Phys. Rev. B 2007, 76, 165422. [Google Scholar] [CrossRef] [Green Version]
- Morris, J.; Bei, H.; Pharr, G.; George, E. Size Effects and Stochastic Behavior of Nanoindentation Pop In. Phys. Rev. Lett. 2011, 106. [Google Scholar] [CrossRef] [Green Version]
- Hasnine, M.; Mustafa, M.; Suhling, J.; Prorok, B.; Bozack, M.; Lall, P. Characterization of aging effects in lead free solder joints using nanoindentation. In Proceedings of the 2013 IEEE 63rd Electronic Components and Technology Conference, Las Vegas, NV, USA, 28–31 May 2013; pp. 166–178. [Google Scholar] [CrossRef]
- Lucas, B.; Oliver, W. Indentation power-law creep of high-purity indium. Metall. Mater. Trans. A 1999, 30, 601–610. [Google Scholar] [CrossRef]
- Zhang, P.; Li, S.; Zhang, Z. General relationship between strength and hardness. Mater. Sci. Eng. A 2011, 529, 62–73. [Google Scholar] [CrossRef]
- Hay, J.; Agee, P.; Herbert, E. Continuous stiffness measurement during instrumented indentation testing. Exp. Tech. 2010, 34, 86–94. [Google Scholar] [CrossRef]
- Chen, X.; Xiang, Y.; Vlassak, J. Novel technique for measuring the mechanical properties of porous materials by nanoindentation. J. Mater. Res. 2006, 21, 715–724. [Google Scholar] [CrossRef]
- Innovative Coarsening-Resistant Alloys with Enhanced Radiation Tolerance and Ultrafine-Grained Structure for Aerospace Application|ICARUS. Available online: http://icarus-alloys.eu (accessed on 14 June 2020).
- Bazios, P.; Tserpes, K.; Pantelakis, S. Numerical Computation of Material Properties of Nanocrystalline Materials Utilizing Three-Dimensional Voronoi Models. Metals 2019, 9, 202. [Google Scholar] [CrossRef] [Green Version]
- Breval, E.; Macmillan, N. Elastic recovery at Vickers hardness impressions. J. Mater. Sci. Lett. 1985, 4, 741–742. [Google Scholar] [CrossRef]
- Suresh, S.; Giannakopoulos, A.; Alcalá, J. Spherical indentation of compositionally graded materials: Theory and experiments. Acta Mater. 1997, 45, 1307–1321. [Google Scholar] [CrossRef]
- Suresh, S.A.; Giannakopoulos, A. Report Inst-2/98; Massachusetts Institute of Technology: Cambridge, MA, USA, 1998. [Google Scholar]
- ISO/TR 29381. Metallic Materials—Measurement of Mechanical Properties by an Instrumented Indentation Test—Indentation Tensile Properties; ISO: Geneva, Switzerland, 2008. [Google Scholar]
- ISO 14577. Metallic Materials–Instrumented Indentation Test for Hardness and Materials Parameters, Part 1: Test Method, 2002, Part 2: Verification and Calibration of Testing Machines, 2002, Part 3: Calibration of Reference Blocks, 2002, Part 4: Test Method for Metallic and Non-Metallic Coatings; ISO: Geneva, Switzerland, 2007. [Google Scholar]
- Bouzakis, K.; Michailidis, N.; Hadjiyiannis, S.; Skordaris, G.; Erkens, G. The effect of specimen roughness and indenter tip geometry on the determination accuracy of thin hard coatings stress–strain laws by nanoindentation. Mater. Charact. 2002, 49, 149–156. [Google Scholar] [CrossRef]
- Available online: http://www.horizonindia.in/buehler/grinders-polishers/3-BUEHLERVANGUARD.pdf (accessed on 31 October 2021).
- Michailidis, N.; Pappa, M. Application of strength properties determined by nanoindentations to describe the material response in micro- and macro-indentation. CIRP Ann. 2009, 58, 511–514. [Google Scholar] [CrossRef]
- Michailidis, N.; Bouzakis, K.; Koenders, L.; Herrmann, K. Nanoindentation, CIRP Encyclopedia of Production Engineering; Springer: Berlin/Heidelberg, Germany, 2014; pp. 1–9. [Google Scholar]
- Lichinchi, M.; Lenardi, C.; Haupt, J.; Vitali, R. Simulation of Berkovich nanoindentation experiments on thin films using finite element method. Thin Solid Films 1998, 312, 240–248. [Google Scholar] [CrossRef] [Green Version]


Publisher’s Note: MDPI stays neutral with regard to jurisdictional claims in published maps and institutional affiliations. |
© 2021 by the authors. Licensee MDPI, Basel, Switzerland. This article is an open access article distributed under the terms and conditions of the Creative Commons Attribution (CC BY) license (https://creativecommons.org/licenses/by/4.0/).
Share and Cite
Tserpes, K.; Bazios, P.; Pantelakis, S.G.; Pappa, M.; Michailidis, N. Mechanical Characterization of Nanocrystalline Materials via a Finite Element Nanoindentation Model. Metals 2021, 11, 1827. https://doi.org/10.3390/met11111827
Tserpes K, Bazios P, Pantelakis SG, Pappa M, Michailidis N. Mechanical Characterization of Nanocrystalline Materials via a Finite Element Nanoindentation Model. Metals. 2021; 11(11):1827. https://doi.org/10.3390/met11111827
Chicago/Turabian StyleTserpes, Konstantinos, Panagiotis Bazios, Spiros G. Pantelakis, Maria Pappa, and Nikolaos Michailidis. 2021. "Mechanical Characterization of Nanocrystalline Materials via a Finite Element Nanoindentation Model" Metals 11, no. 11: 1827. https://doi.org/10.3390/met11111827
APA StyleTserpes, K., Bazios, P., Pantelakis, S. G., Pappa, M., & Michailidis, N. (2021). Mechanical Characterization of Nanocrystalline Materials via a Finite Element Nanoindentation Model. Metals, 11(11), 1827. https://doi.org/10.3390/met11111827