Article

Fabrication, Microstructure, and Properties of In Situ V2C-Reinforced Copper Composites

1
Key Laboratory of Advanced Technologies of Materials, Ministry of Education, School of Materials Science and Engineering, Southwest Jiaotong University, Chengdu 610031, China
2
State Key Laboratory of Green Building Materials, China Building Materials Academy, Beijing 100000, China
*
Author to whom correspondence should be addressed.
Metals 2021, 11(11), 1829; https://doi.org/10.3390/met11111829
Submission received: 11 October 2021 / Revised: 1 November 2021 / Accepted: 11 November 2021 / Published: 13 November 2021
(This article belongs to the Special Issue Extreme Environment Materials)

Abstract

:
In this paper, in situ V2C-reinforced Cu composites were successfully fabricated by hot pressing at 750 °C under 25 MPa using Cu and V2SnC powders. Due to decomposition of V2SnC to V2C and Sn during sintering, Sn atoms entered the crystal structure of Cu. Therefore, final compositions of composites consisted of Cu(Sn) and V2C phases. Here, copper composites with 0, 5, 10, 20, and 30 vol.% V2C were designed. Their microstructures and physical and mechanical properties were systematically investigated. It was observed that with increasing V2C content, electrical conductivity decreased from 0.589 × 10⁸ S·m−1 to 0.034 × 10⁸ S·m−1 and thermal conductivity decreased from 384.36 W⋅m−1⋅K−1 to 24.65 W·m−1·K−1, while Vickers hardness increased from 52.6 HV to 334 HV. Furthermore, it was found that composites with 20 vol.% V2C had the highest tensile strength (440 MPa).

1. Introduction

Copper has high electrical conductivity, high ductility, high chemical stability, and excellent thermal properties [1]. To date, Cu has been widely used in electrical devices, electrodes, and pantography [2]. However, low strength and weak wear resistance have greatly limited its application. In order to solve this problem, dispersion strengthening (DS) has been widely employed [3]. It was found that by adding a second phase to the copper matrix, dispersed particles can reinforce the substrate by crack bridging, crack deflection, second-phase pulling out, and grain refinement [4,5,6,7]. Because traditional ceramics have high hardness and Young’s modulus, ceramic-particle-reinforced Cu composites have been extensively investigated. For instance, Tao et al. prepared Ni@Al2O3/Cu composites by utilizing spark plasma sintering (SPS) to densify Ni coated Al2O3 with copper. By modifying the poor wettability between Cu and Al2O3, the fracture toughness of composites was significantly improved. Oanh, N.T.H et al. significantly enhanced the hardness of Cu by the addition of TiC [8,9,10,11,12,13,14]. However, traditional ceramics (Al2O3, SiC et al.) are usually detrimental to the electrical and thermal properties of copper, as they are all insulators. Therefore, research on the development of alternative materials with good electrical properties, high hardness, and good strength has become important.
Recently, layered compounds such as Mn+1AXn phases, which can reinforce copper while maintaining excellent electrical and thermal properties, have attracted huge research interest. Mn+1AXn phases where M is an early transition metal, A is a IIIA or IVA group element, X is carbon, nitrogen, or boron, and n is an integer commonly equal to 1, 2, or 3 are good additives to reinforce a Cu matrix. They contain both metal bonds and covalent bonds in crystal structures, exhibiting combined properties of metals and ceramics, such as high bending strength, high Young’s modulus, and high thermal and electrical conductivities [15,16,17,18,19,20,21,22]. In addition, they have a good wettability with copper [23,24,25]. In previous works, it was reported that the introduction of MAX phase and MAX-derived MX into copper effectively enhanced the hardness and tensile strength of composites [26]. MAX-derived MX is formed due to precipitation of A atoms under high temperatures and pressures. As a result, a similar layer structure to that of MAX phase can be obtained. Dudina et al. [27] prepared Ti3SiC2 (5 vol.%)-Cu composites by spark plasma sintering (SPS). The electrical conductivity and hardness of composites were 21.2% IACS and 152 HV100, respectively. Wu, J., et al. [28] also prepared Ti2SnC (1 vol.%)-Cu composite by hot pressing and increased the tensile strength of Cu to 336 MPa, with only 24.4% of the electrical conductivity lost. Zhang, J., et al. [26] reported on TiCx-Cu composites with enhanced tensile strength obtained by sintering of Cu with Ti3AlC2.
In this work, in order to reinforce copper composites, a new MAX phase of V2SnC was introduced. Sn-based MAX phase (V2SnC) exhibits high electrical conductivity, self-lubrication and low hardness, which are promising to be used as addtions to reinforce Cu [29]. It is believed that this research will enrich the design and fabrication of Cu-based composites. Interestingly, it was found that V2SnC completely decomposed to V2C and Sn, forming V2SnC-derived V2C, and Sn dissolved into copper to form a solid solution [30,31,32,33]. The microstructure and physical and mechanical properties of composites were systematically investigated. Moreover, the positive reinforcement effect of in situ V2SnC-derived V2C particles on the Cu matrix was examined.

2. Experimental Procedure

Commercial element powders of V (300 mesh, 99.9%, Qinhuangdao ENO High-Tech Material Development Co., LTD., Qinhuangdao, China), Sn (300 mesh, 99.9%, Qinhuangdao ENO High-Tech Material Development Co., LTD., Qinhuangdao, China), and C (1500 mesh, 99.9%, Qinhuangdao ENO High-Tech Material Development Co., LTD., Qinhuangdao, China) were utilized as raw materials to synthesize V2SnC. The process of synthesis of V2SnC is the same as in previous work researched by the author’s lab [29].
Commercial copper powder (300 mesh, 99.9%, Qinhuangdao ENO High-Tech Material Development Co., LTD., Qinhuangdao, China) and as-prepared V2SnC powder (200 mesh) were mixed by ball milling in an agate jar for 12 h with a rotating speed of 150 rpm. The powder-to-ball ratio was 1:10. The content of V2C in the copper composites was 0 vol.%, 5 vol.%, 10 vol.%, 20 vol.%, and 30 vol.%, respectively. After drying in an oven (101-WSB, Supo Corp., Shaoxing, China) for 24 h, the powder mixture was put into a graphite die and consolidated at 750 °C for 60 min under a pressure of 25 MPa in a hot pressing furnace (ZT-50-24Y, Chenhua Corp., Shanghai, China). The whole sintering process was carried out in vacuum with a heating rate of 20 °C/min. After sintering, samples were cooled naturally in the hot pressing chamber. Finally, contaminations on the surface of samples were removed by a diamond grinding wheel. All samples were machined by electrical discharged machining (EDM) and polished down to 1.0 μm diamond grids.
Phase composition of samples was examined by an X-ray diffractometer (D8 ADVANCE, Bruker, Germany) with Cu Kα radiation (λ = 1.54178 Å). The crystal parameters of copper were calculated using two basic relationships. Firstly, for face-centered cubic:   d ( hkl ) = 1 α a h 2 + k 2 + l 2 , where h, k, and l are indices of crystallographic plane; α is a constant that equals 1 when h, k, and l are all odd numbers; and a is the lattice constant. The second relationship is the Bragg equation: 2 dsin θ = n   λ , where d is the crystalline interplanar spacing, θ is the diffraction angle, and λ is the wave length of X-ray [34]. By utilizing XRD data, lattice constants of copper were roughly calculated. Elemental distribution of the composites was analyzed by a field emission scanning electron microscope (Inspect F50, FEI, Hillsboro, OR, US) equipped with an energy-dispersive spectrometer (EDAX, Super octane, Hillsboro, OR, US). The polished and etched surfaces (5g FeCl3, 50 mL HCl, 100 mL H2O) of composites were examined by an optical microscope (XZJ-L2030, Phenix, Shangrao, China).
Density of as-prepared Cu composites was measured by Archimedes’ method in distilled water. Electrical conductivity of specimens (dimension: 1 mm × 1 mm × 10 mm) was measured by a resistivity tester machine (FT-300A1, Ningbo Rooko Instrument Co., Ltd., Ningbo, China). Thermal conductivity of samples (dimension: Ø12.7 mm × 3 mm) was measured by a laser thermal conductivity meter (NETZSCH LFA467, Selb, Germany, reference material: Cu) at room temperature.
Hardness of specimens was measured by a Vickers hardness tester (HVS-50, Lianer Corp., Shanghai, China) by a load of 10 N and dwelling 15 s. Samples were machined by wire-electrode cutting to a dimension of 24 mm × 10 mm × 1 mm (3 samples) for tensile strength measurements (YC-100KN, Yice Corp., Ningbo, China, gauge length: 17.80 mm, moving speed: 1 mm/min). To investigate the damage mechanisms, the fracture surface of specimens was examined by SEM.

3. Results and Discussion

3.1. Phase Composition and Microstructure

Figure 1 compares XRD patterns of the initial powder mixture and as-prepared copper composites. It can be seen that in the initial mixture, diffraction peaks of Cu were strong, and weak peaks of V2SnC and Sn were detected [35] (Figure 1a). Figure 1b–e show XRD spectra of S1, S2, S3, and S4, respectively, corresponding to 5%, 10%, 20%, and 30% volume content of V2C. Diffraction peaks of V2SnC and Sn disappeared, and those of V2C occurred. It seems that during the hot pressing, V2SnC was completely decomposed into V2C and Sn, and Sn entered the crystal structure of Cu to form a solid solution. Here, the space group of V2C is P63/mmc (PDF#73-1302), which is the same as that of V2SnC. With increasing the content of V2C, diffraction peaks of Cu shifted to lower angles. The shift of diffraction peaks of Cu to lower angles indicates that the lattice constant of Cu (Face centered cubic, a = b = c) increased by forming a Cu-Sn solid solution, considering that the atomic radius of copper is 1.57 Å and that of Sn is 1.72 Å [36]. By calculating, it was confirmed that with the rise in of V2C content, the crystal parameter of copper increased from 3.6001 Å to 3.7192 Å (Table 1), corresponding to the higher solid-solution content of Sn [37].
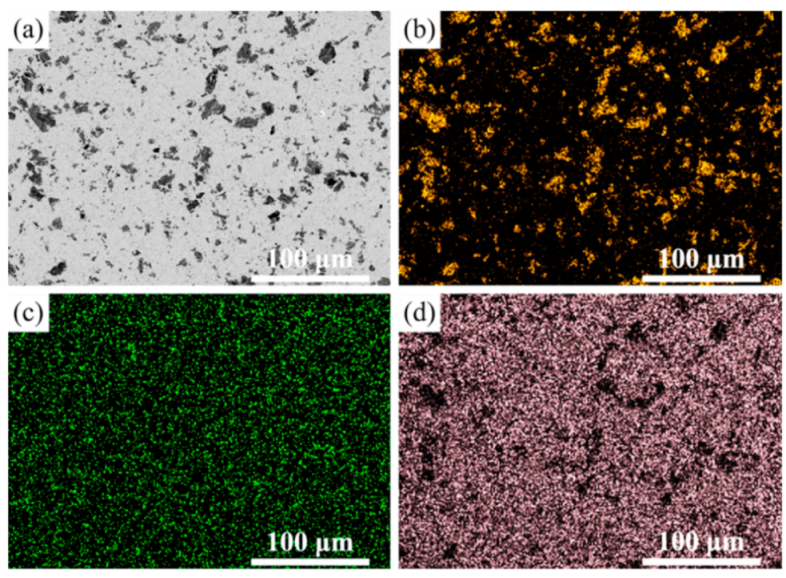
Figure 2 shows the element distribution of V, Sn, and Cu. It can be seen that V element existed in the region of black particles, corresponding to the V2C phase (Figure 2a,b). Sn and Cu elements had the same distribution region, presenting a homogeneous, solid solution (Figure 2c,d). These results support the conclusion that Sn dissolved into copper to form a solid solution.
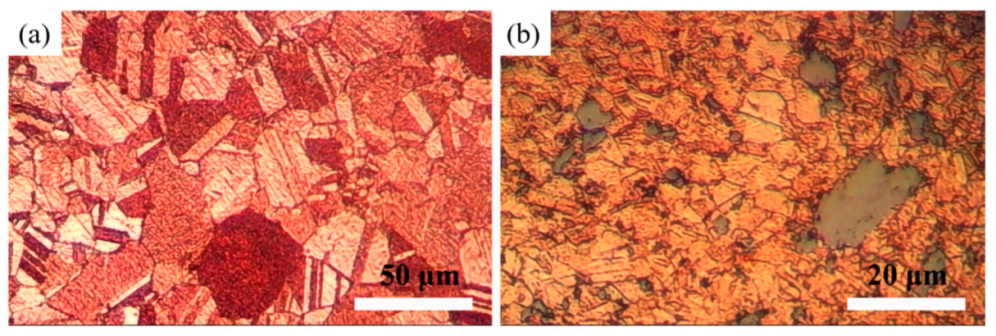
The microstructure of the etched surface of pure Cu and Cu-5 vol.% V2C composite is shown in Figure 3a,b. As shown, there was no obvious pore on the surface of pure Cu or the Cu composite. High sintering temperature and long holding time were conductive to the diffusion of Cu. The grain size of pure Cu prepared by hot pressing was as large as 50 μm (Figure 3a). The introduction of V2C into the Cu matrix can refine the grain size. Consequently, the grain size of the Cu composite was smaller than that of pure Cu, as shown in Figure 3b.
The tensile fracture surface of pure copper and Cu composites was examined (Figure 4). As shown in Figure 4a, the fracture surface of pure copper was characterized by dimples, presenting a typical fracture feature of metals. The diameter of dimples was about 8 μm. For the Cu-5 vol.% V2C composite, tear ridges were clearly observed, indicating a great plastic deformation of Cu grains before fracture. In addition to the fractured V2C particles, some holes formed during the tensile process (Figure 4b). Figure 4c–e show the tensile sections of Cu composites with 10, 20, and 30 vol.% V2C respectively. With increasing V2C content, the number of tear ridges decreased gradually. Especially in the Cu composite with 30 vol.% V2C, tear ridges disappeared, and only fractured V2C particles were observed.

3.2. Physical Properties

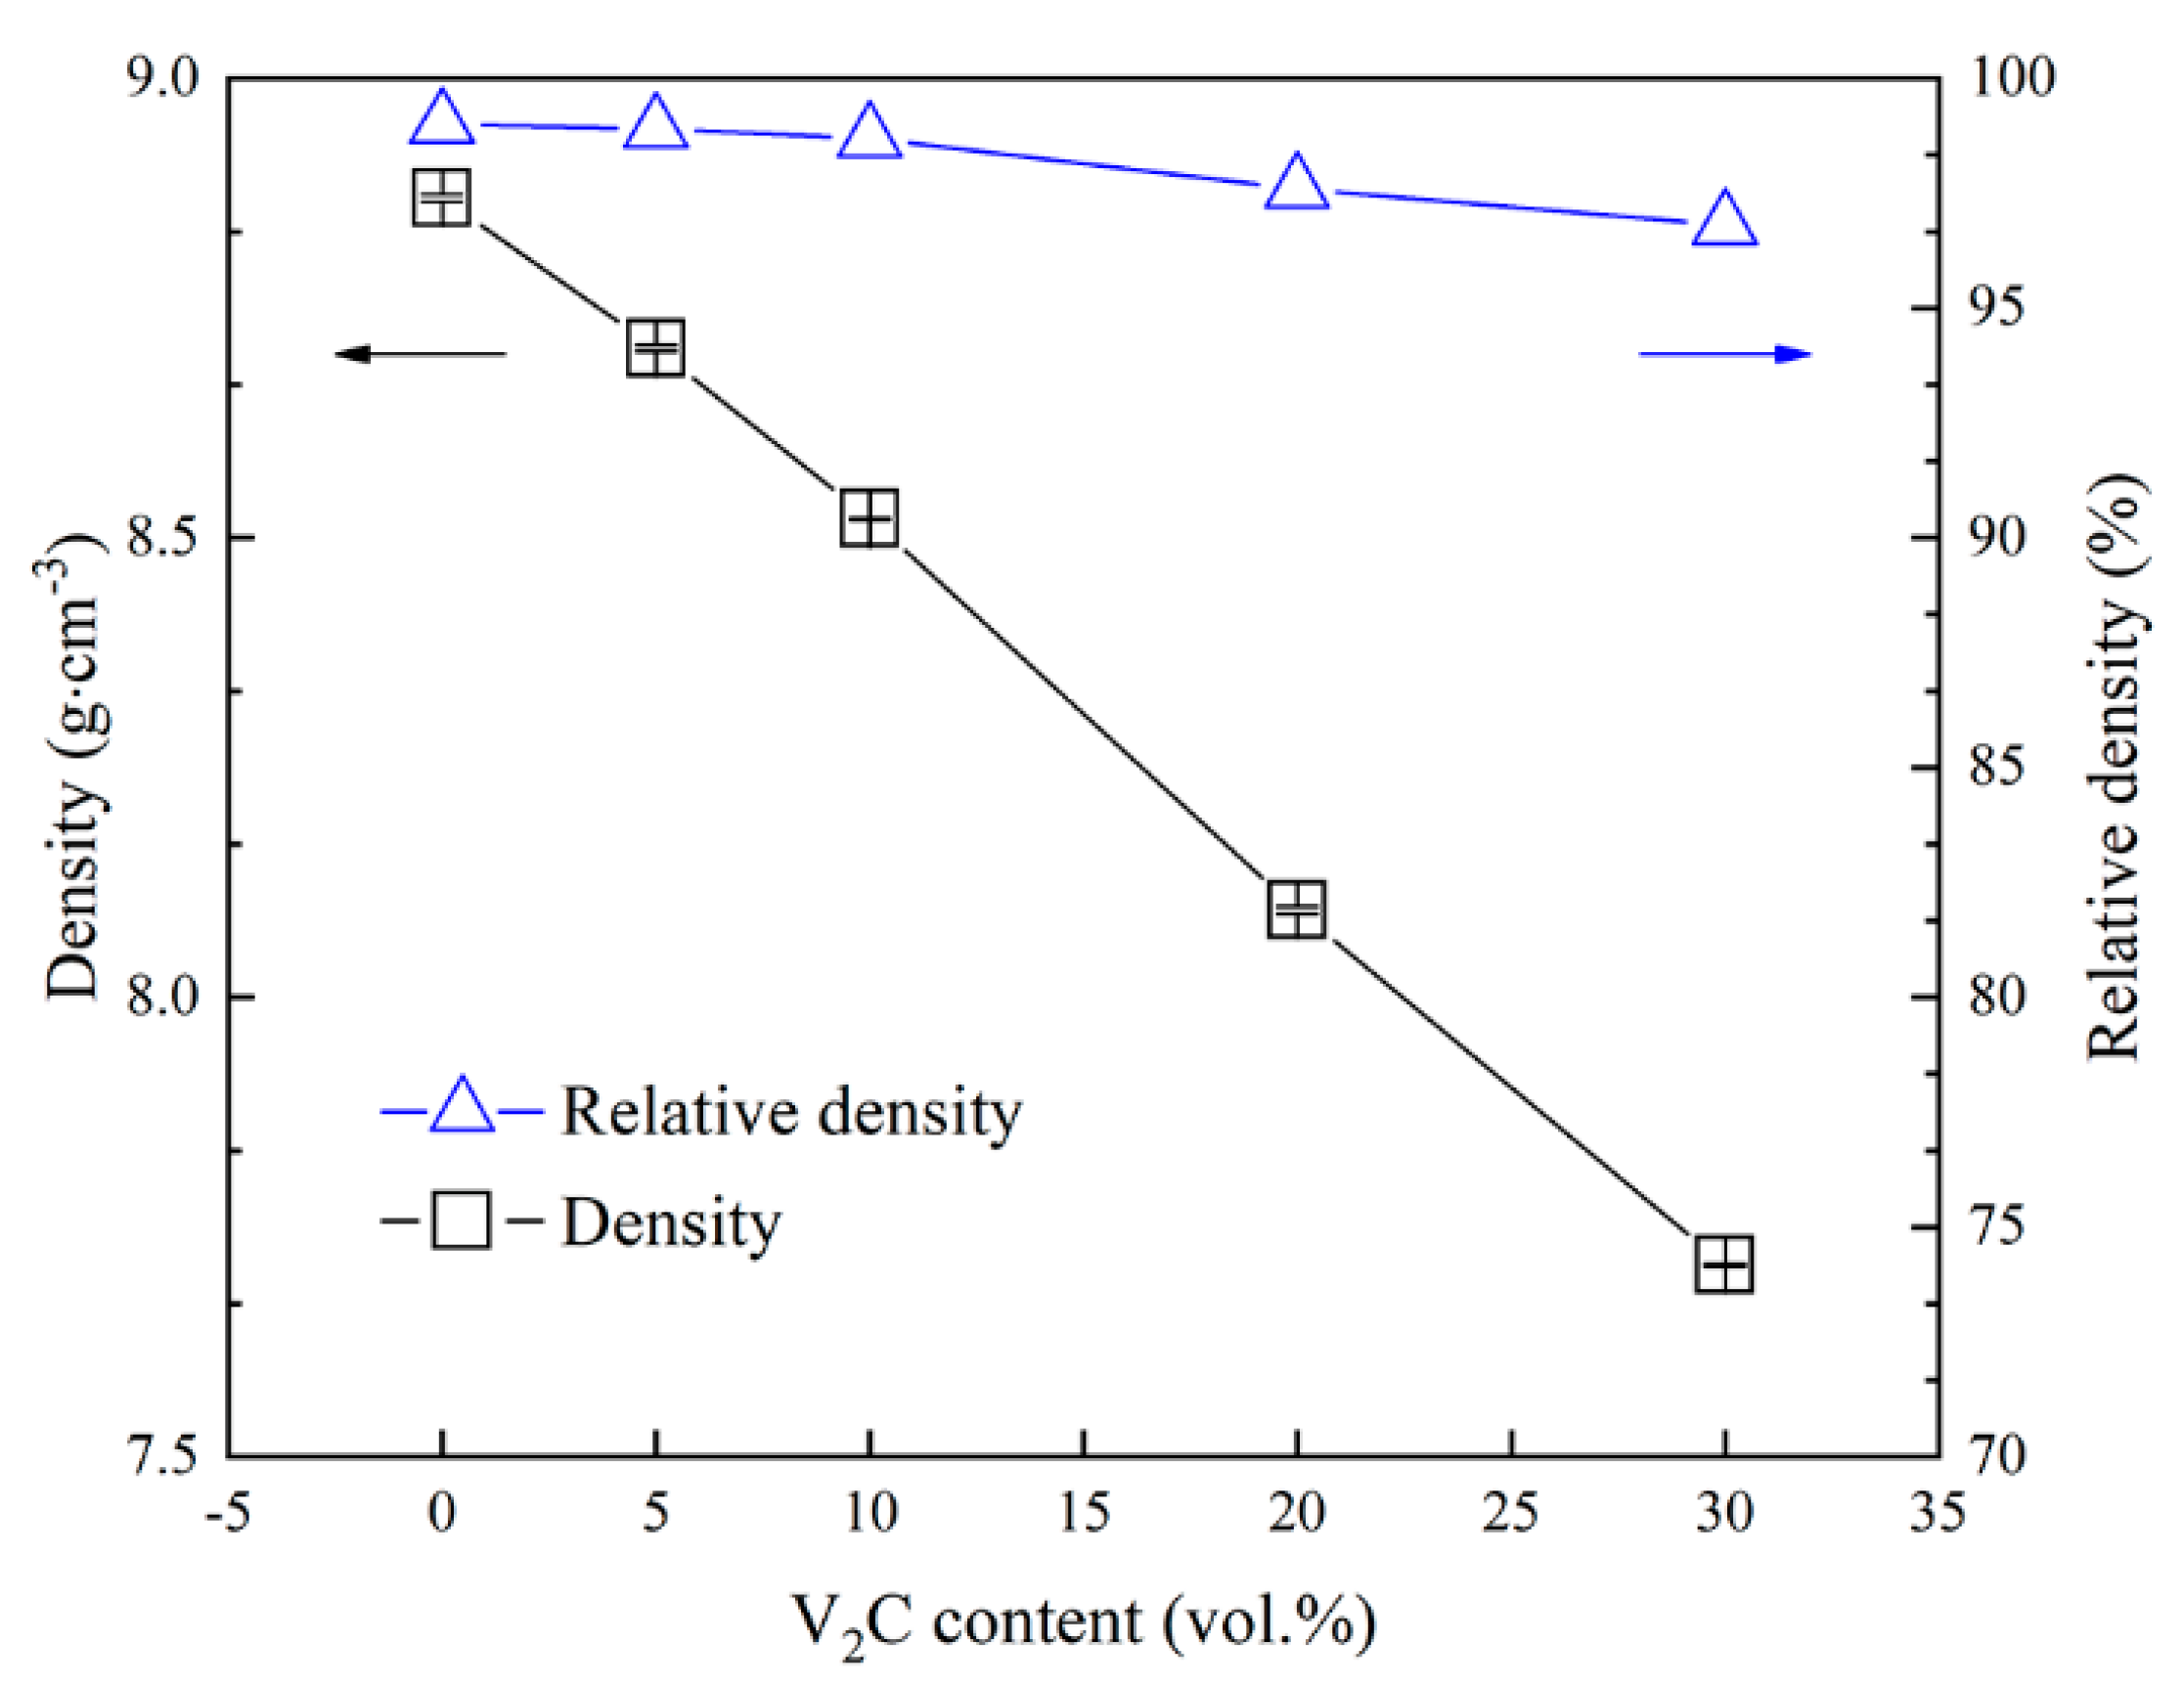
Figure 5 shows the measured density of composites as a function of V2C content. With increasing content of V2C, the density of pure Cu, S1, S2, S3, and S4 was 8.870 g·cm−3, 8.706 g·cm−3, 8.521 g·cm−3, 8.095 g·cm−3, and 7.709 g·cm−3, respectively. The calculated relative density of the composites was 99%, 98.9%, 98.7%, 97.6%, and 96.8%, respectively. Compared with pure Cu, the density of Cu composites with 5, 10, 20, and 30 vol.% V2C was decreased by 1.8%, 3.9%, 8.7%, and 13.1%, respectively. The continuous decrease in density was due to the lower density of V2C (5.63 g·cm−3) compared to that of Cu (8.96 g·cm−3). The introduction of more V2C undoubtedly reduces the density of composites.
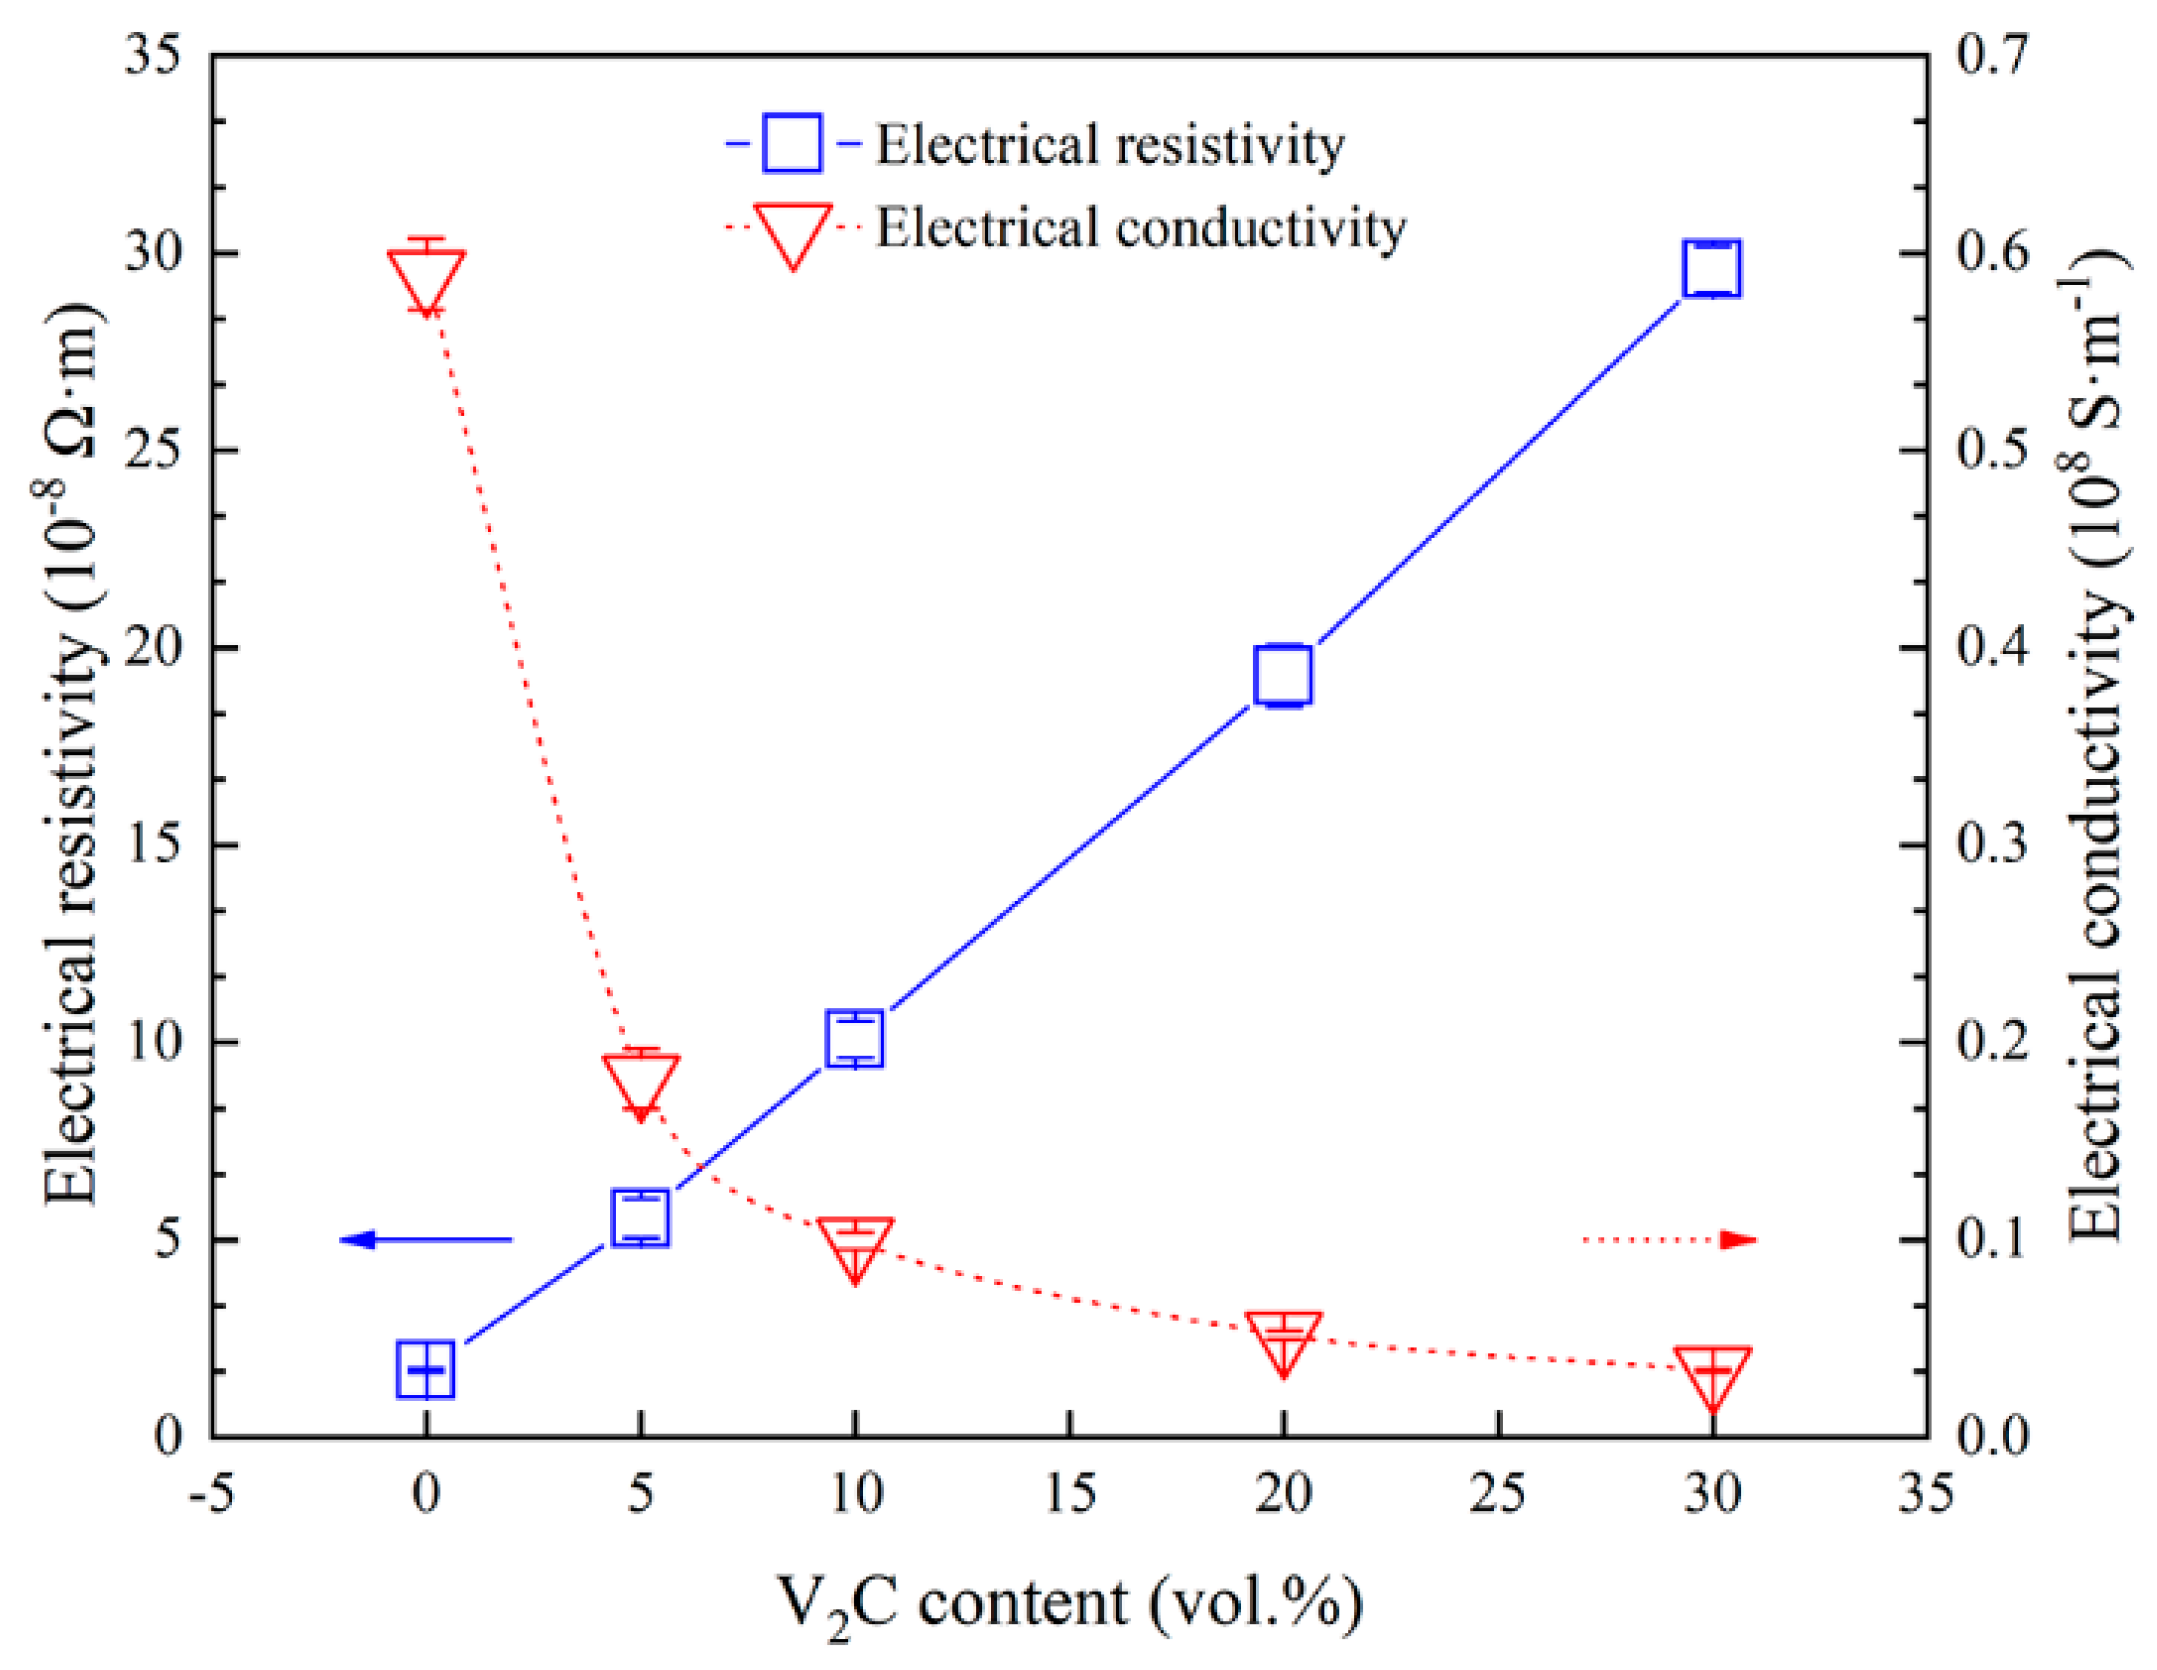
The measured electrical resistivity and electrical conductivity of pure Cu, S1, S2, S3, and S4 samples is shown in Figure 6. As can be seen, electrical resistivity showed a linear change with increasing V2C content. The electrical conductivity of pure Cu was 0.589 × 10⁸ S·m−1, and that of Cu composites with 5 vol.% V2C, 10 vol.% V2C, 20 vol.% V2C, and 30 vol.% V2C was 0.180 × 10⁸ S·m1, 0.099 × 10⁸ S·m−1, 0.052 × 10⁸ S·m−1, and 0.034 × 10⁸ S·m−1, respectively. Interestingly, it was observed that electrical conductivity of the composite had a considerable decrease when V2C content was 5 vol.%. Then, the electrical conductivity of composites decreased continuously with increasing V2C content. V2C in the matrix increased the scattering of electrons. It is known that electrical conductivity of metallic materials mainly depends on the scattering of electrons [38]. Consequently, the continuous decrease in electrical conductivity of Cu composites with more V2C content was probably related to three reasons: (1) electrical conductivity of V2C is lower than that of copper; (2) boundaries of refined copper grains enhanced the electron scattering; (3) a solid solution of Sn in the crystal structure of Cu induced the lattice distortion. What is worth mentioning is that the electrical conductivity (0.034 × 10⁸ S·m−1) of the Cu composite with 30 vol.% V2C still met the requirement of a Cu-based slider (≥0.0286 × 10⁸ S·m−1, TB/T1842.1-2002). As a result, the composites retained good electrical properties.
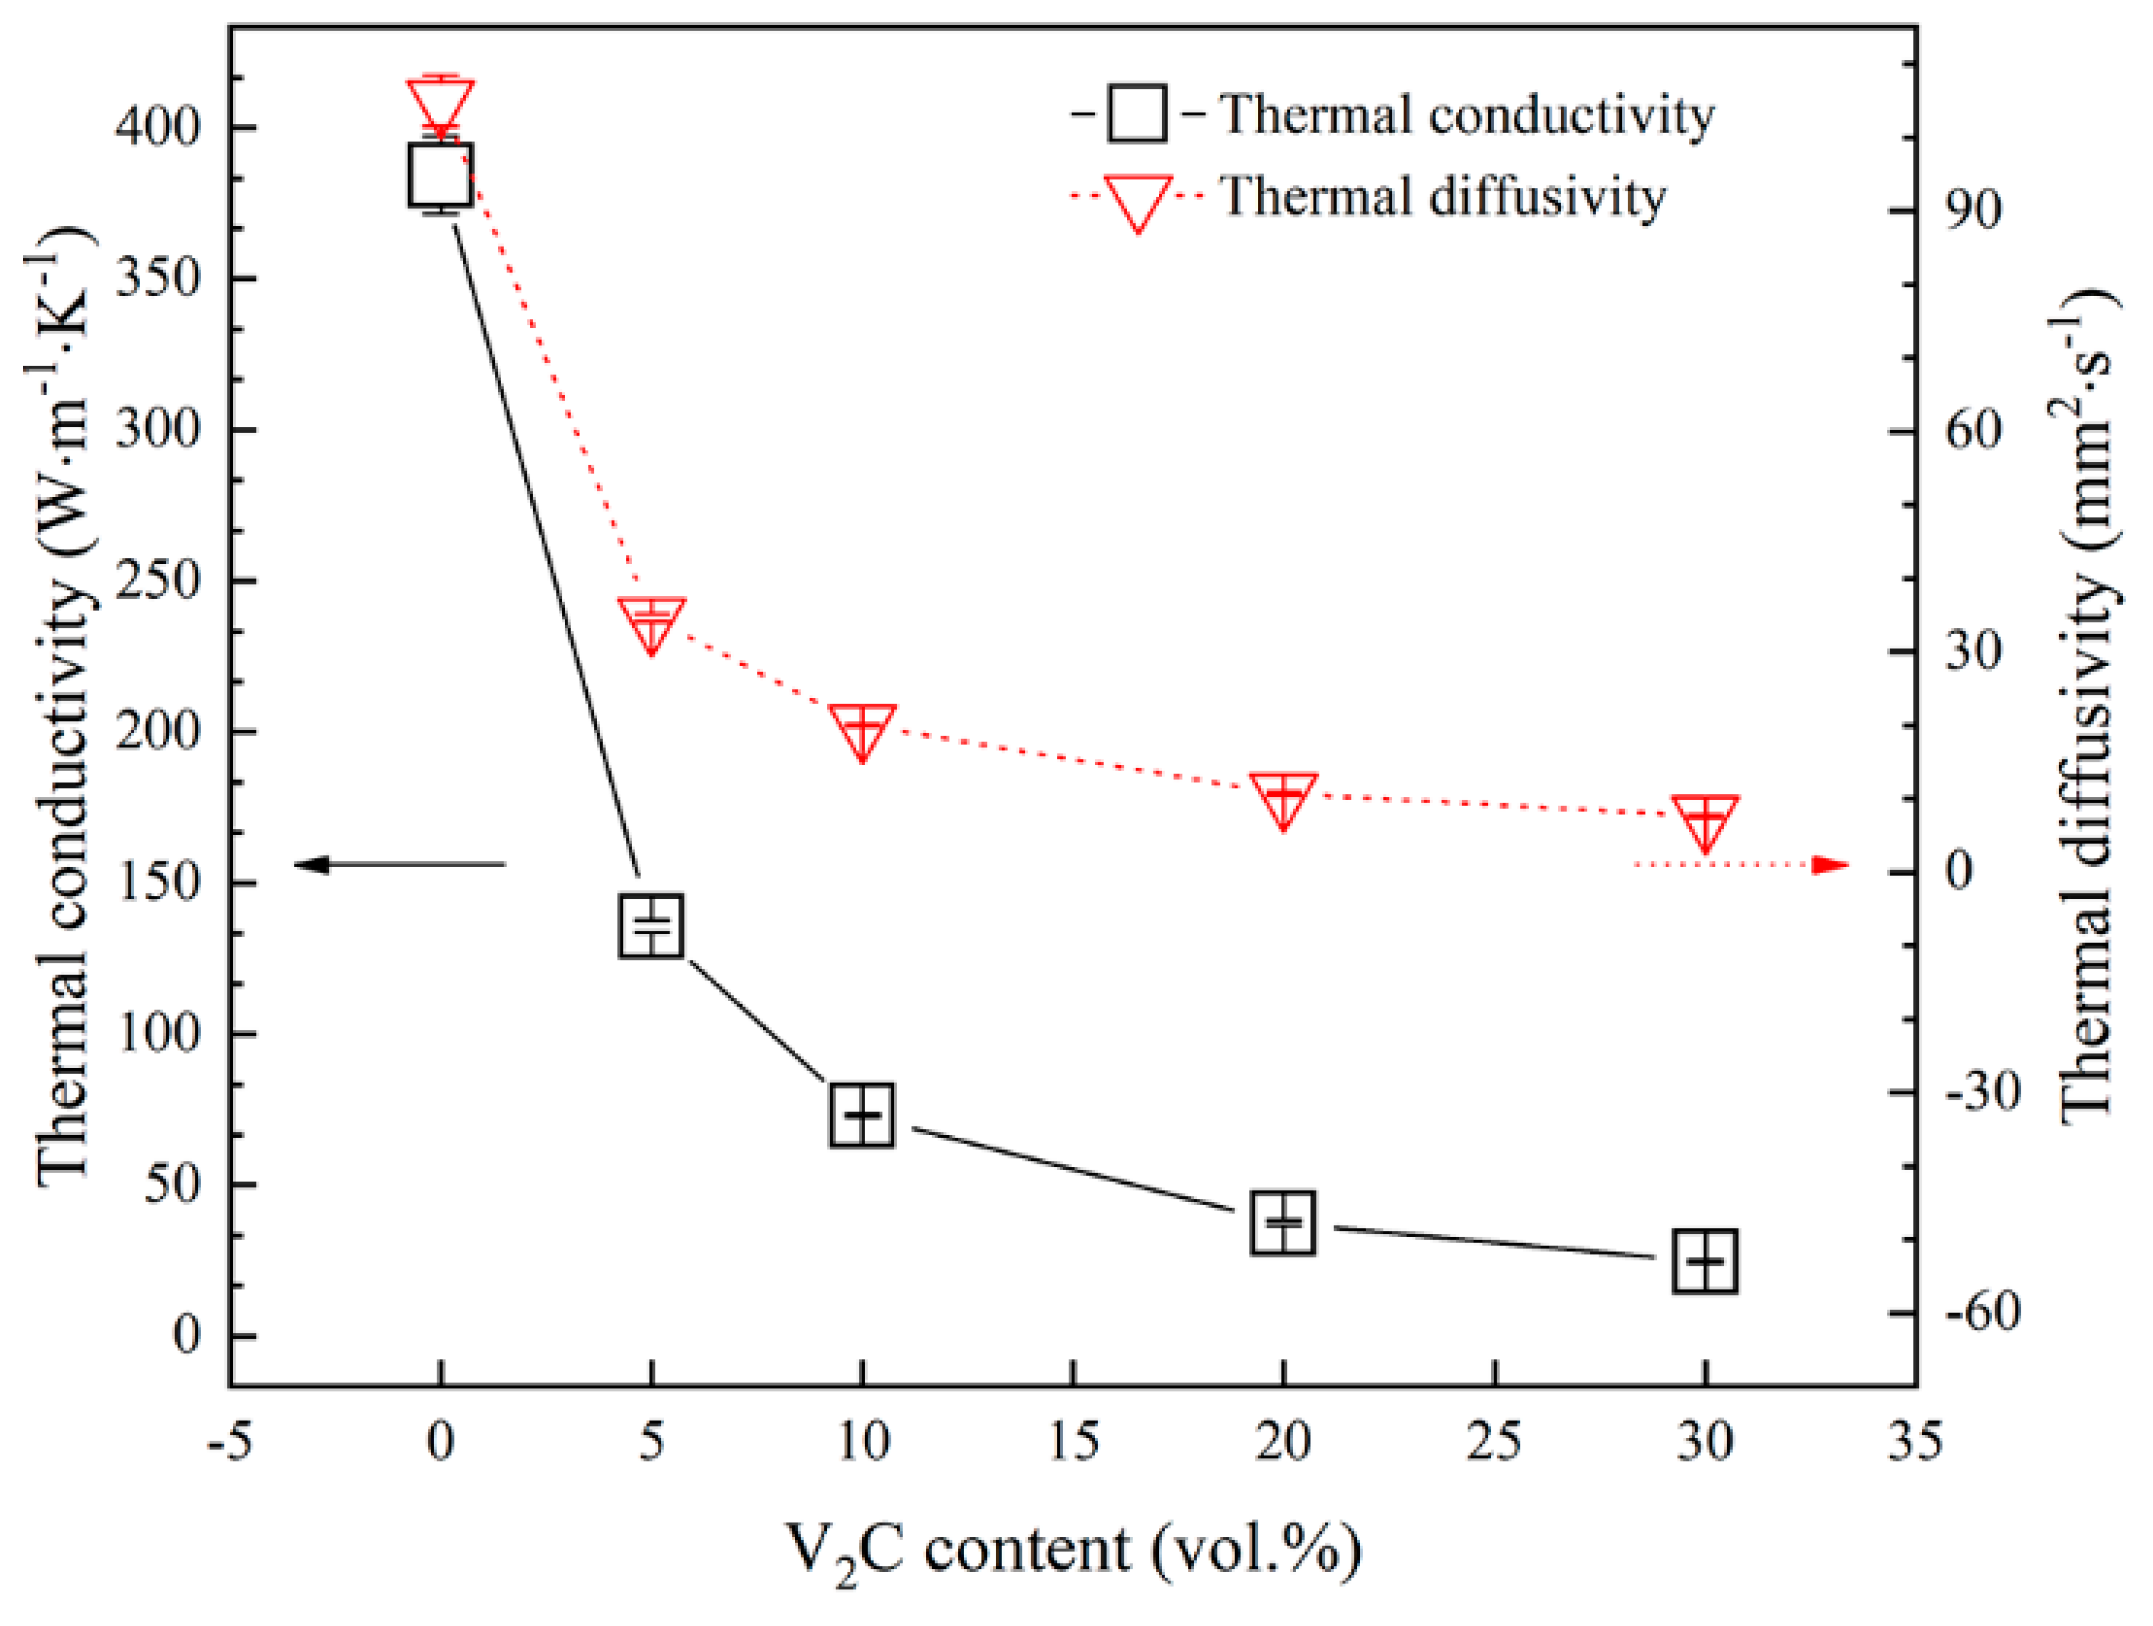
Furthermore, in order to analyze the effect of V2C content on thermal properties of Cu composites, the thermal conductivity and thermal diffusivity of composites were tested (Figure 7). Pure copper prepared by hot pressing had a high thermal conductivity of 384.36 W·m−1·K−1, and those of the S1, S2, S3, and S4 specimens were 135.75 W·m−1·K−1, 73.10 W·m−1·K−1, 37.46 W·m−1·K−1, and 24.65 W·m−1·K−1, respectively. The noticeable decrease in thermal conductivity might be attributed to following reasons [39,40,41]: (1) the thermal conductivity of V2C is lower compared to that of copper; (2) more grain boundaries of Cu and V2C inhibited the movement of electrons; (3) the solid solution of Sn raised the crystal mismatch of Cu. In addition, thermal diffusivity of Cu composites shows the same decreasing tendency, reducing from 104.99 mm2·s−1 for pure Cu to 7.61 mm2·s−1 for Cu composite with 30 vol.% V2C.

3.3. Mechanical Properties

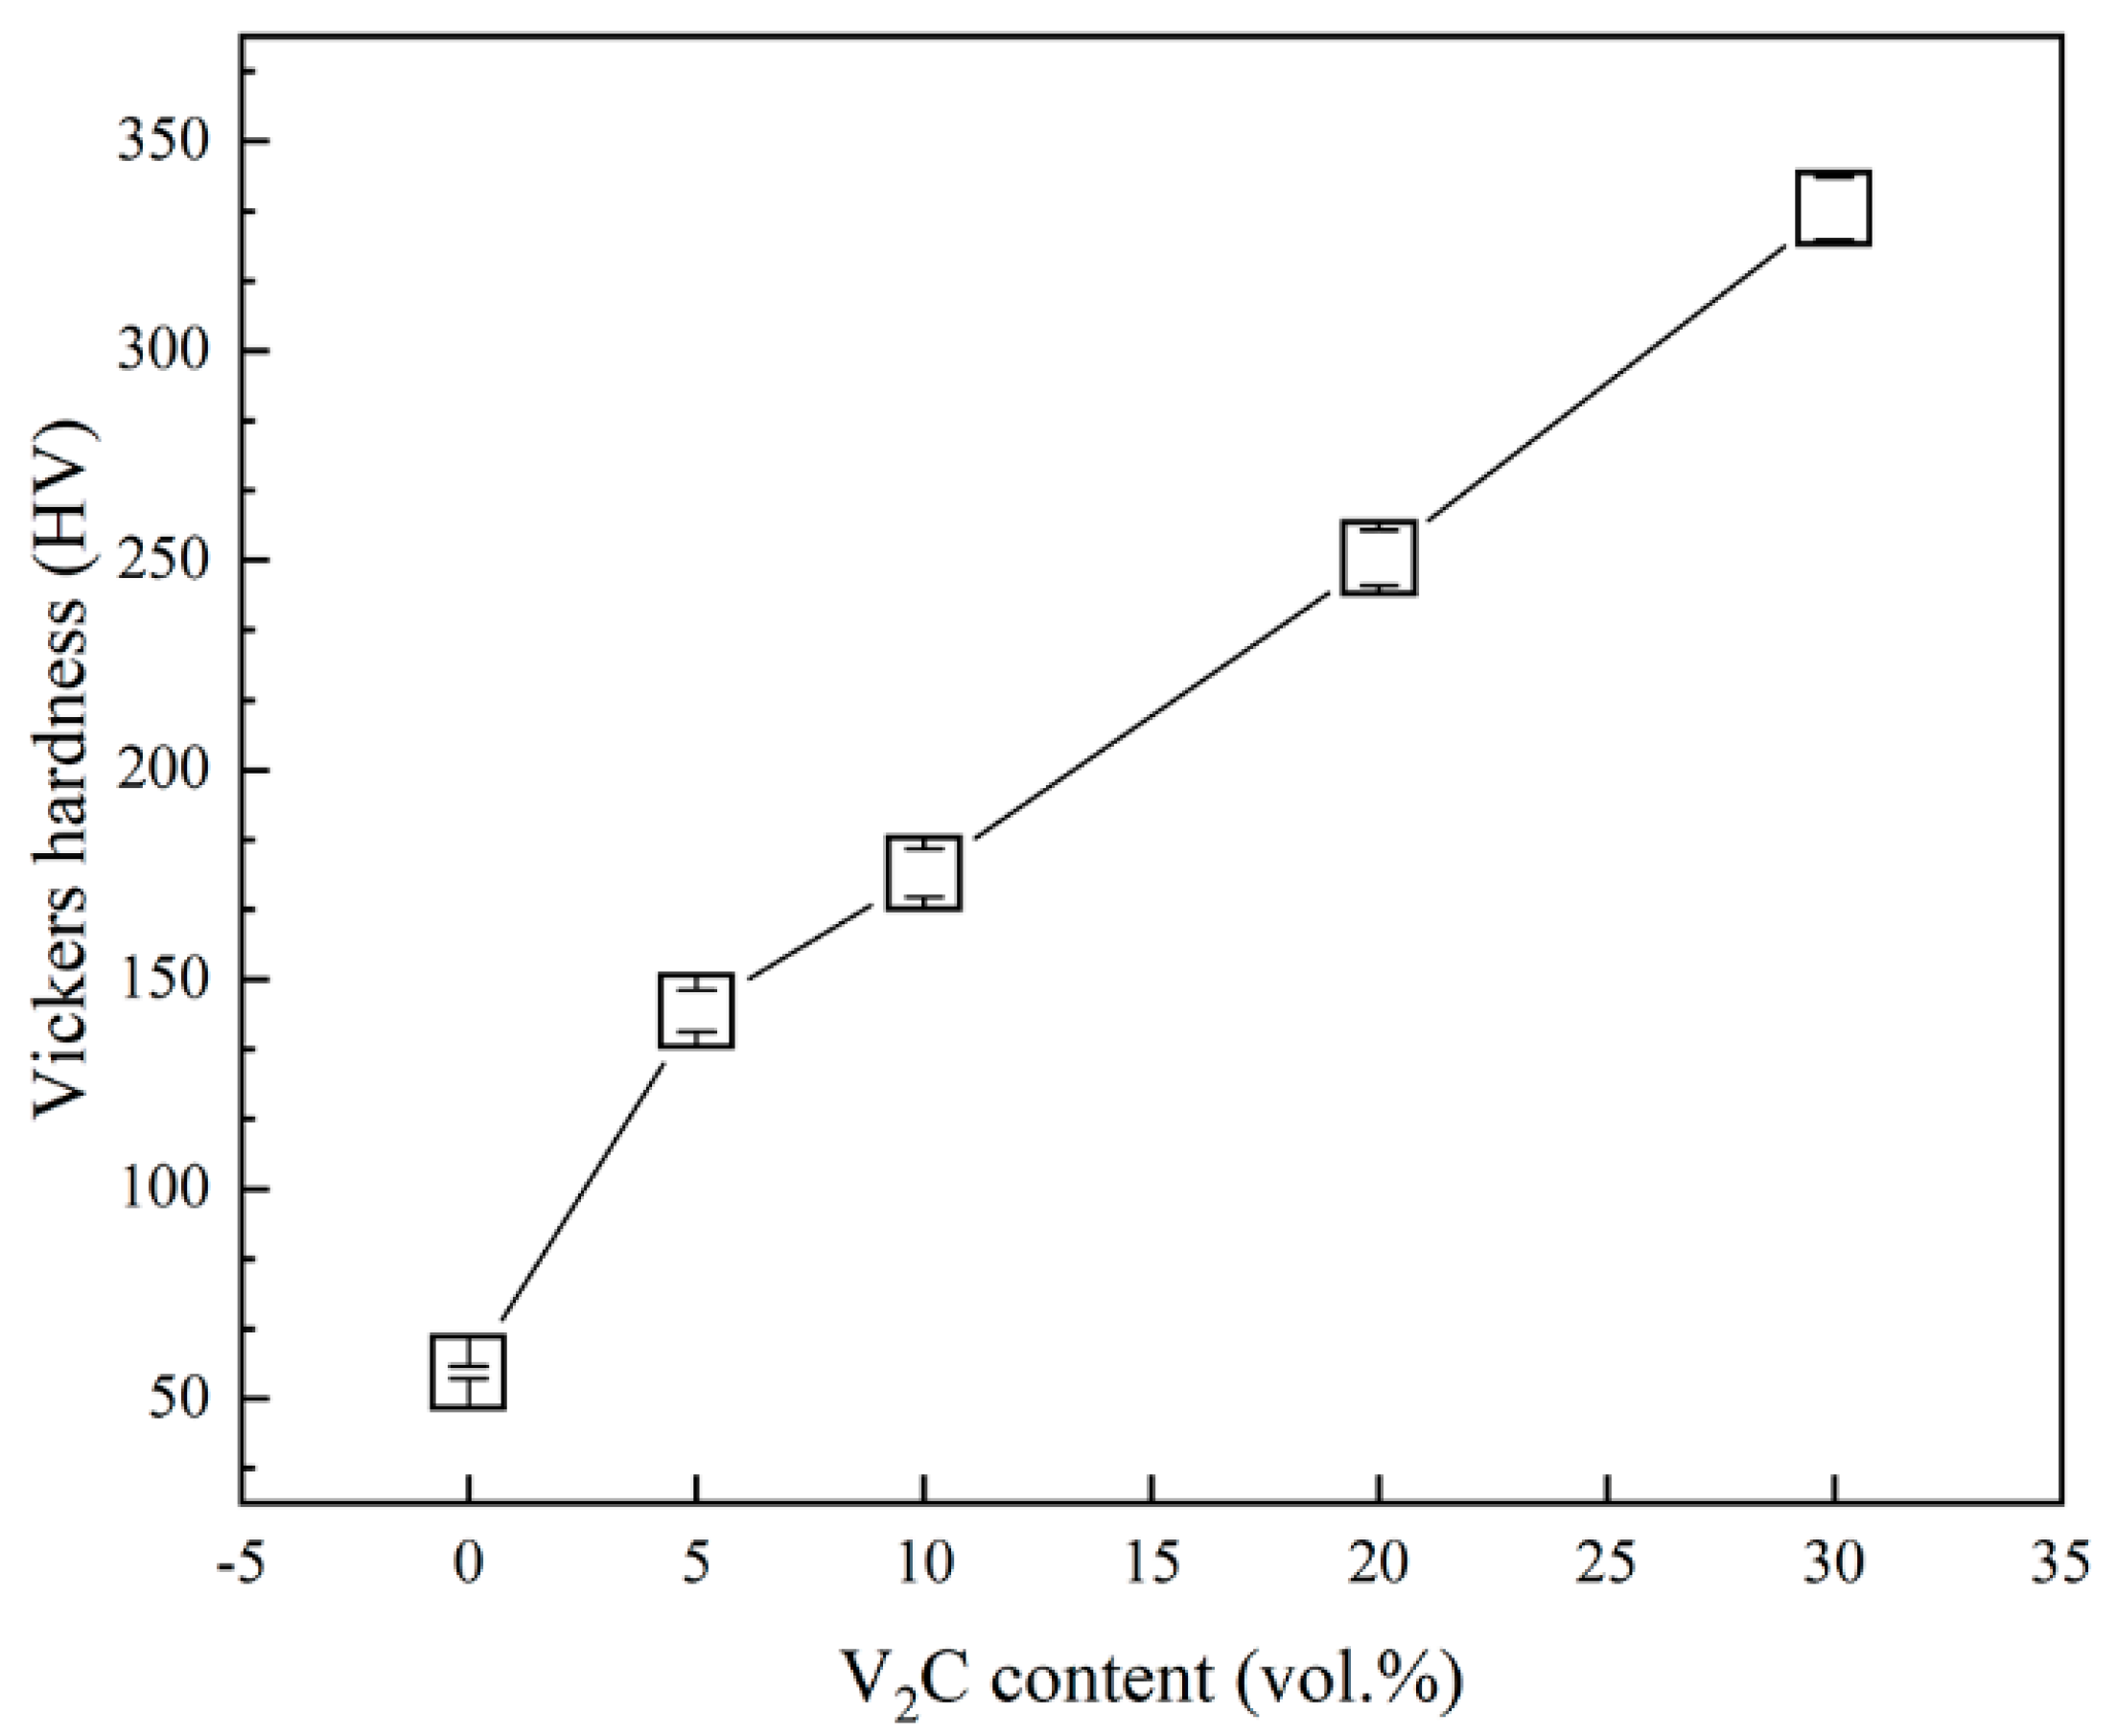
Figure 8 shows the Vickers hardness of Cu composites as a function of V2C content. The hardness increased from 56.2 HV for pure Cu to 334 HV for the Cu composite with 30 vol.% V2C. The increase in hardness can be attributed to the fact that hardness of V2C is higher than that of copper. Figure 9 shows variations in tensile strength of Cu composites with different V2C content. For the pure copper sample, the tensile strength was only 160 MPa. With the addition of more V2C, the tensile strength of composites effectively rose to 322 MPa for Cu-5 vol.% V2C composite, 362 MPa for Cu-10 vol.% V2C composite, and 440 MPa for Cu-20 vol.% V2C composite, whereas when 30 vol.% V2C was added, the tensile strength of the composite degraded to 349 MPa. We speculate that addition of V2C particles refined the Cu grains in the composites, as discussed in Figure 3. Consequently, according to the Hall-Petch rule, when the grain size of copper was decreased, the strength of the composite increased correspondingly [42]. Additionally, solid solution strengthening may also play another important role in reinforcing Cu composites due to the formation of a Cu(Sn) solid solution [43,44]. However, the tensile strength of the composite decreased when V2C content exceeded a certain value (30 vol.%). More V2C can embrittle the matrix, and defects distributed along the V2C made cracks spread easily. Therefore, the tensile strength decreased.
Properties of different in situ MX-Cu composites are listed in Table 2. The in situ TiCx-reinforced copper composites were prepared by hot pressing, and TiCx was derived from Ti3AlC2. As a term of comparison, although both V2C-Cu and TiCx-Cu composites have similar electrical properties, the tensile strength of the V2C-Cu composite is slightly higher. Accordingly, the V2C-Cu composite in the present study achieved a high tensile strength and obtained excellent electrical properties.

4. Conclusions

Dense Cu composites with different V2C contents (0 vol.%, 5 vol.%, 10 vol.%, 20 vol.%, and 30 vol.%) were successfully fabricated by hot pressing Cu and V2SnC as initial materials. The phase composition, microstructure, physical, and mechanical properties of composites were systematically investigated, and the obtained conclusions are summarized as follows:
i.
V2SnC completely decomposed into V2C and Sn because the Sn-based MAX phase easily precipitated Sn atoms under high temperatures and pressures. Sn entered the crystal structure of copper to form a solid solution. As a result of increasing V2SnC content, the lattice constant of copper increased from 3.6001 Å to 3.7192 Å. Due to the decomposition of V2SnC, phase compositions of the composite consisted of V2C and copper.
ii.
With increasing V2C content, the scattering of electrons was improved. Consequently, the electrical and thermal conductivities of the composites decreased from 0.589 × 10⁸ S·m−1 to 0.034 × 10⁸ S·m−1 and from 384.36 W·m−1⋅K−1 to 24.65 W·m−1·K−1, respectively.
iii.
The introduction of V2C resulted in reinforcement of the Cu matrix by dispersion strengthening, grain refinement, and solid-solution strengthening. As a result, the hardness and strength of composite were improved. The Vickers hardness of composites increased from 52.6 HV to 334 HV with increasing V2C content. The Cu composite with 20 vol.% V2C had the highest tensile strength of 440 MPa, which was nearly three times that of pure Cu (160 MPa). When the content of V2C exceeded 30 vol.%, the tensile strength decreased due to embrittlement.

Author Contributions

Conceptualization, methodology, and writing—original draft, Y.Q.; software, B.H.; investigation, S.F.; data curation, S.G.; visualization, Q.F.; draft revision, D.W.; draft revision, Y.B.; supervision, C.H.; project administration, C.H.; funding acquisition, C.H. All authors have read and agreed to the published version of the manuscript.

Funding

This work was supported by the Natural Science Foundation of China (grant Nos. 52072311 and 52032011), the Outstanding Young Scientific and Technical Talents in Sichuan Province (grant No. 2019JDJQ0009), the Fundamental Research Funds for the Central Universities (grant Nos. 2682020ZT61 and 2682021GF013), the Opening Project of State Key Laboratory of Green Building Materials, and the Open Project of State Key Laboratory Cultivation Base for Nonmetal Composites and Functional Materials (20kfhg17).

Institutional Review Board Statement

Not applicable.

Informed Consent Statement

Not applicable.

Data Availability Statement

The data presented in this study are available on request from the corresponding author. The data are not publicly available due to all the datasets created during this research belonging to the funder, according to the contract.

Conflicts of Interest

The authors declare no conflict of interest. The funders had no role in the design of the study; in the collection, analyses, or interpretation of data; in the writing of the manuscript; or in the decision to publish the results.

References

  1. Huang, X.; Feng, Y.; Qian, G.; Zhao, H.; Zhang, J.; Zhang, X. Physical, mechanical, and ablation properties of Cu–Ti3AlC2 composites with various Ti3AlC2 contents. Mater. Sci. Technol. 2018, 34, 757–762. [Google Scholar] [CrossRef]
  2. Zeng, L.; You, C.; Zhang, X.; Liang, T.; Miao, S.; Liu, B. Preparation of bulk Cu-W interpenetrating-phase composites by liquid metal dealloying. Int. J. Refract. Met. Hard Mater. 2021, 97, 105503. [Google Scholar] [CrossRef]
  3. Wang, B.A.; Wang, N.; Yang, Y.J.; Zhong, H.; Ma, M.Z.; Zhang, X.Y.; Liu, R.P. Microstructure and mechanical properties of ZrO2 particle dispersion strengthened 16MnV steel. Mater. Sci. Eng. A 2017, 692, 168–173. [Google Scholar] [CrossRef]
  4. Dalvand, A.; Ahmadi, M. Impact failure mechanism and mechanical characteristics of steel fiber reinforced self-compacting cementitious composites containing silica fume. Eng. Sci. Technol. Int. J. 2021, 24, 736–748. [Google Scholar] [CrossRef]
  5. Xue, R.; Liu, P.; Zhang, Z.; Zhang, N.; Zhang, Y.; Wang, J. Improvement of toughness of reaction bonded silicon carbide composites reinforced by surface-modified SiC whiskers. Ceram. Int. 2021, 47, 18150–18156. [Google Scholar] [CrossRef]
  6. Luo, G.; Chen, J.; Qin, J.; Sun, Y.; Zhang, J.; Li, Y.; Shen, Q. Microstructure and strengthening mechanism of boride in-situ reinforced titanium matrix composites prepared by plasma activated sintering. Ceram. Int. 2021, 47, 15910–15922. [Google Scholar] [CrossRef]
  7. Wątroba, M.; Bednarczyk, W.; Kawałko, J.; Bała, P. Fine-tuning of mechanical properties in a Zn–Ag–Mg alloy via cold plastic deformation process and post-deformation annealing. Bioact. Mater. 2021, 6, 3424–3436. [Google Scholar] [CrossRef]
  8. Palma, R.H.; Sepúlveda, A.O.; Espinoza, R.G.; Zúñiga, A.P.; Diánez, M.J.; Criado, J.M.; Sayagués, M.J. High-temperature mechanical behaviour of Cu-Ti-C, Cu-Al and Cu-Ti-Al-C alloys obtained by reaction milling. Mater. Sci. Eng. A 2004, 384, 262–269. [Google Scholar] [CrossRef]
  9. Bagheri, G.A. The effect of reinforcement percentages on properties of copper matrix composites reinforced with TiC particles. J. Alloy. Compd. 2016, 676, 120–126. [Google Scholar] [CrossRef]
  10. Akbarpour, M.R.; Mousa Mirabad, H.; Alipour, S. Microstructural and mechanical characteristics of hybrid SiC/Cu composites with nano- and micro-sized SiC particles. Ceram. Int. 2019, 45, 3276–3283. [Google Scholar] [CrossRef]
  11. Chrysanthou, A.; Erbaccio, G. Production of copper-matrix composites by in situ processing. J. Mater. Sci. 1995, 30, 6339–6344. [Google Scholar] [CrossRef]
  12. Feng, T.; Zheng, W.; Chen, W.; Shi, Y.; Fu, Y.Q. Enhanced interfacial wettability and mechanical properties of Ni@Al2O3/Cu ceramic matrix composites using spark plasma sintering of Ni coated Al2O3 powders. Vacuum 2021, 184, 109938. [Google Scholar] [CrossRef]
  13. Oanh, N.T.H.; Viet, N.H.; Kim, J.S.; Dudina, D.V. Structural investigations of TiC–Cu nanocomposites prepared by ball milling and spark plasma sintering. Metals 2017, 7, 123. [Google Scholar]
  14. Oanh, N.T.H.; Viet, N.H.; Kim, J.S.; Moreira Jorge Junior, A. Characterization of In-Situ Cu-TiH2-C and Cu-Ti-C nanocomposites produced by mechanical milling and spark plasma sintering. Metals 2017, 7, 117. [Google Scholar] [CrossRef] [Green Version]
  15. Fu, S.; Liu, Y.; Zhang, H.; Grasso, S.; Hu, C. Synthesis and characterization of high purity Mo2Ti2AlC3 ceramic. J. Alloy. Compd. 2020, 815, 152485. [Google Scholar] [CrossRef]
  16. Niu, Y.; Fu, S.; Zhang, K.; Dai, B.; Zhang, H.; Grasso, S.; Hu, C. Synthesis, microstructure, and properties of high purity Mo2TiAlC2 ceramics fabricated by spark plasma sintering. J. Adv. Ceram. 2020, 9, 759–768. [Google Scholar] [CrossRef]
  17. Zhang, Z.; Duan, X.; Qiu, B.; Yang, Z.; Cai, D.; He, P.; Jia, D.; Zhou, Y. Preparation and anisotropic properties of textured structural ceramics: A review. J. Adv. Ceram. 2019, 8, 289–332. [Google Scholar] [CrossRef] [Green Version]
  18. Tabares, E.; Jiménez-Morales, A.; Tsipas, S.A. Study of the synthesis of MAX phase Ti3SiC2 powders by pressureless sintering. Bol. Soc. Esp. Ceram. Vidr. 2021, 60, 41–52. [Google Scholar] [CrossRef]
  19. Zhao, Y.; Deng, S.; Liu, H.; Zhang, J.; Guo, Z.; Hou, H. First-principle investigation of pressure and temperature influence on structural, mechanical and thermodynamic properties of Ti3AC2 (A = Al and Si). Comput. Mater. Sci. 2018, 154, 365–370. [Google Scholar] [CrossRef]
  20. Chen, L.; Duan, G.; Gao, X.F.; Wang, C.L. Property of mono-vacancy in MAX phase M3AC2 (M = Ti, A = Al, Si, or Ge): First-principles calculations. Mod. Phys. Lett. B 2018, 32, 1–7. [Google Scholar] [CrossRef]
  21. Akhlaghi, M.; Tayebifard, S.A.; Salahi, E.; Shahedi Asl, M.; Schmidt, G. Self-propagating high-temperature synthesis of Ti3AlC2 MAX phase from mechanically-activated Ti/Al/graphite powder mixture. Ceram. Int. 2018, 44, 9671–9678. [Google Scholar] [CrossRef]
  22. Abbas, N.; Qin, X.; Ali, S.; Zhu, G.; Lu, J.; Alam, F.E.; Wattoo, A.G.; Zeng, X.; Gu, K.; Tang, J. Direct deposition of extremely low interface-contact-resistant Ti2AlC MAX-phase coating on stainless-steel by mid-frequency magnetron sputtering method. J. Eur. Ceram. Soc. 2020, 40, 3338–3342. [Google Scholar] [CrossRef]
  23. Li, M.; Zhai, H.; Huang, Z.; Liu, X.; Zhou, Y.; Li, S.; Li, C. Microstructure and mechanical properties of TiC0.5 reinforced copper matrix composites. Mater. Sci. Eng. A 2013, 588, 335–339. [Google Scholar] [CrossRef]
  24. Howe, J.M. Bonding, structure, and properties of metal/ceramic interfaces: Part 1 chemical bonding, chemical reaction, and interfacial structure. Int. Mater. Rev. 1993, 38, 233–256. [Google Scholar] [CrossRef]
  25. Xiao, P.; Derby, B. Wetting of titanium nitride and titanium carbide by liquid metals. Acta Mater. 1996, 44, 307–314. [Google Scholar] [CrossRef]
  26. Zhang, J.; Zhou, Y.C. Microstructure, mechanical, and electrical properties of Cu-Ti3AlC2 and in situ Cu-TiCx composites. J. Mater. Res. 2008, 23, 924–932. [Google Scholar] [CrossRef]
  27. Dudina, D.V.; Mali, V.I.; Anisimov, A.G.; Bulina, N.V.; Korchagin, M.A.; Lomovsky, O.I.; Bataev, I.A.; Bataev, V.A. Ti3SiC2-Cu composites by mechanical milling and spark plasma sintering: Possible microstructure formation scenarios. Met. Mater. Int. 2013, 19, 1235–1241. [Google Scholar] [CrossRef]
  28. Wu, J.; Zhou, Y.; Yan, C. Mechanical and electrical properties of Ti2SnC dispersion-strengthened copper. Z. Metallkd. 2005, 96, 847–852. [Google Scholar] [CrossRef]
  29. Xu, Q.; Zhou, Y.; Zhang, H.; Jiang, A.; Tao, Q.; Lu, J.; Rosén, J.; Niu, Y.; Grasso, S.; Hu, C. Theoretical prediction, synthesis, and crystal structure determination of new MAX phase compound V2SnC. J. Adv. Ceram. 2020, 9, 481–492. [Google Scholar] [CrossRef]
  30. Zhang, J.; Liu, B.; Wang, J.Y.; Zhou, Y.C. Low-temperature instability of Ti2SnC: A combined transmission electron microscopy, differential scanning calorimetry, and X-ray diffraction investigations. J. Mater. Res. 2009, 24, 39–49. [Google Scholar] [CrossRef]
  31. Barsoum, M.W.; Yaroschuk, G.; Tyagi, S. Fabrication and characterization of M2SnC (M = Ti, Zr, Hf and Nb). Scr. Mater. 1997, 37, 1583–1591. [Google Scholar] [CrossRef]
  32. Wu, J.; Zhou, Y.; Wang, J.; Wang, W.; Yan, C. Interfacial reaction between Cu and Ti2SnC during processing of Cu-Ti2SnC composite. Z. Fuer Met. Res. Adv. Tech. 2005, 96, 1314–1320. [Google Scholar] [CrossRef]
  33. Jin, S.; Su, T.; Hu, Q.; Zhou, A. Thermal conductivity and electrical transport properties of double-A-layer MAX phase Mo2Ga2C. Mater. Res. Lett. 2020, 8, 158–164. [Google Scholar] [CrossRef] [Green Version]
  34. Chen, Y.; Liang, H.; Xia, X.; Tao, P.; Shen, R.; Liu, Y.; Feng, Y.; Zheng, Y.; Li, X.; Du, G. The lattice distortion of β-Ga2O3 film grown on c-plane sapphire. J. Mater. Sci. Mater. Electron. 2015, 26, 3231–3235. [Google Scholar] [CrossRef]
  35. Zhang, P.G.; Ding, J.X.; Liu, Y.S.; Yang, L.; Tian, W.B.; Ouyang, J.; Zhang, Y.M.; Sun, Z.M. Mechanism and mitigation of spontaneous Ga whisker growth on Cr2GaC. Sci. China Technol. Sci. 2020, 63, 440–445. [Google Scholar] [CrossRef]
  36. Huang, B.S.; Fu, S.; Zhang, S.S.; Ju, C.Y.; Wu, S.S.; Peng, H. Preparation and property test of porous Cu-Sn alloy by powder filling and sintering method. Mater. Res. Express 2019, 6, 1–10. [Google Scholar] [CrossRef]
  37. Liang, B.; Han, D.; Zhang, W. Fabrication and Wear Performance of (Cu–Sn) Solution/TiCx Bonded Diamond Composites. J. Superhard Mater. 2018, 40, 179–183. [Google Scholar] [CrossRef]
  38. Zhang, Q.G.; Cao, B.Y.; Zhang, X.; Fujii, M.; Takahashi, K. Influence of grain boundary scattering on the electrical and thermal conductivities of polycrystalline gold nanofilms. Phys. Rev. B–Condens. Matter Mater. Phys. 2006, 74, 1–5. [Google Scholar] [CrossRef]
  39. Ma, A.; Wang, X.; Chen, Y.; Yu, J.; Zheng, W.; Zhao, Y. Largely enhanced thermal conductivity of ethylene-propylene-diene monomer composites by addition of graphene ball. Compos. Commun. 2019, 13, 119–124. [Google Scholar] [CrossRef]
  40. Wei, J.; Liao, M.; Ma, A.; Chen, Y.; Duan, Z.; Hou, X.; Li, M.; Jiang, N.; Yu, J. Enhanced thermal conductivity of polydimethylsiloxane composites with carbon fiber. Compos. Commun. 2020, 17, 141–146. [Google Scholar] [CrossRef]
  41. Wang, T.; Yu, J.; Wang, M.; Cao, Y.; Dai, W.; Shen, D.; Guo, L.; Wu, Y.; Bai, H.; Dai, D.; et al. Effect of different sizes of graphene on thermal transport performance of graphene paper. Compos. Commun. 2017, 5, 46–53. [Google Scholar] [CrossRef]
  42. Zhang, M.; Liu, L.; Liang, S.; Li, J. Evolution in microstructures and mechanical properties of pure copper subjected to severe plastic deformation. Met. Mater. Int. 2020, 26, 1585–1595. [Google Scholar] [CrossRef]
  43. Ma, R.; Guo, X. Effects of Mo and Zr composite additions on the microstructure, mechanical properties and oxidation resistance of multi-elemental Nb-Si based ultrahigh temperature alloys. J. Alloy. Compd. 2021, 870, 159437. [Google Scholar] [CrossRef]
  44. Kwon, H.; Suh, C.Y. Hardening of Ti(CN)–Fe composites by microstructural refinement and solid solution strengthening of metallic phase. Ceram. Int. 2021, 47, 13927–13933. [Google Scholar] [CrossRef]
Figure 1. XRD patterns of (a) powder mixture and Cu composites with (b) 5 vol.% V2C, (c) 10 vol.% V2C, (d) 20 vol.% V2C, and (e) 30 vol.% V2C.
Metals 11 01829 g001
Figure 2. (a) Scanning electron microscope (SEM) image of Cu composite with 10 vol.% V2C and element distribution in the composite: (b) V element, (c) Sn element, and (d) Cu element.
Metals 11 01829 g002
Figure 3. Optical microscope (OM) images of pure Cu (a) and Cu-5 vol.% V2C composite (b).
Metals 11 01829 g003
Figure 4. SEM images of fracture surface of (a) pure Cu sample and Cu composites with (b) 5 vol.% V2C, (c) 10 vol.% V2C, (d) 20 vol.% V2C, and (e) 30 vol.% V2C.
Metals 11 01829 g004
Figure 5. Density of Cu composites as a function of V2C content.
Metals 11 01829 g005
Figure 6. Electrical conductivity and electrical resistivity of Cu composites versus V2C content.
Metals 11 01829 g006
Figure 7. Thermal conductivity and thermal diffusivity of Cu composites as a function of V2C content measured at room temperature.
Metals 11 01829 g007
Figure 8. Vickers hardness of Cu composites as a function of V2C content.
Metals 11 01829 g008
Figure 9. Tensile strength of Cu composites versus V2C content.
Metals 11 01829 g009
Table 1. Calculated lattice constant of Cu based on the XRD patterns.
CompositesPure CuS1S2S3S4
Lattice constant (Å)
(a = b = c)
3.60013.61813.65533.68063.7192
Table 2. Tensile strength and electrical conductivity of the different in situ MX-Cu composites.
CompositesTensile Strength (MPa)Electrical
Conductivity
(%IACS)
Preparing MethodReference
Pure Cu16098Hot pressingThis work
V2C (5 vol.%)-Cu33231.4
V2C (10 vol.%)-Cu36217
V2C (20 vol.%)-Cu4409
V2C (30 vol.%)-Cu3495.8
Pure Cu13084.7Hot pressingRef. [25]
TiCx (5 vol.%)-Cu31530
TiCx (10 vol.%)-Cu35616
TiCx (20 vol.%)-Cu3929
TiCx (30 vol.%)-Cu2996
Publisher’s Note: MDPI stays neutral with regard to jurisdictional claims in published maps and institutional affiliations.