Article

Microstructure and Texture Evolution during Severe Plastic Deformation at Cryogenic Temperatures in an Al-0.1Mg Alloy

1
Brunel Centre of Advanced Solidification Technology (BCAST), Brunel University London, Uxbridge UB8 3PH, UK
2
Department of Mechanical Engineering, Imperial College London, London SW7 2AZ, UK
*
Author to whom correspondence should be addressed.
Metals 2021, 11(11), 1822; https://doi.org/10.3390/met11111822
Submission received: 26 September 2021 / Revised: 4 November 2021 / Accepted: 11 November 2021 / Published: 13 November 2021

Abstract

:
The deformation structures formed in an Al-0.1Mg single-phase aluminium alloy have been studied during plane strain compression (PSC) down to liquid nitrogen temperature, following prior equal channel angular extrusion (ECAE) to a strain of ten. Under constant deformation conditions a steady state was approached irrespective of the temperature, where the rate of grain refinement stagnated and a minimum grain size was reached which could not be further reduced. A 98% reduction at 77 K (−196 °C) only transformed the ECAE processed submicron grain structure into a microstructure with thin ribbon grains, where a nanoscale high angle boundary (HAB) spacing was only approached in the sheet normal direction. It is shown that the minimum grain size achievable in severe deformation processing is controlled by a balance between the rate of compression of the HAB structure and dynamic recovery. The required boundary migration rate to maintain a constant boundary spacing is found far higher than can be justified from conventional diffusion-controlled grain growth and at low temperatures, a constant boundary spacing can only be maintained by invoking an athermal mechanism and is considered to be dominated by the operation of grain boundary dislocations.

1. Introduction

There has been great interest in exploiting the possibilities offered by nano-technologies and therefore a great demand for industrially viable routes that can produce nanocrystalline materials. In this context, severe plastic deformation (SPD) offers several unique advantages, including being capable of producing at low cost bulk materials that are fully dense and chemically homogenous and contamination free [1,2,3]. Although this technology has been successfully used to produce submicron grained structures in a wide range of metals and alloys, there are still some basic scientific issues to be addressed in order to follow appropriate routes and to extend severe deformation processing to produce true nanocrystalline structures in useable volumes.
An important limitation of SPD processing is that the grain size of material cannot be refined indefinitely with increasing strain. Under constant deformation conditions a steady state tends to develop at ultra-high strains whereupon further grain refinement becomes impossible [4,5,6]. For example, it has been reported [5] that, during Equal Channel Angular Extrusion (ECAE) of aluminium alloys, the grain size approaches a limit when the high angle grain boundary spacing converges with that of the low angle grain boundaries. Only small further changes in grain size have been seen to take place when the applied strain is increased above ten [5]. Steady-state grain sizes have also been reported during ball-milling of several metals and alloys [7,8]. It has thus been clearly shown that there is a minimum grain size achievable by SPD, which depends mainly on the material, temperature, and strain rate during processing [4,6,8].
Dynamic recovery is considered to be the major reason responsible for the attainment of a steady-state grain size during SPD [4,5,9], and it should therefore be possible to achieve smaller minimum grain sizes by lowering the homologous deformation temperature, which results in the suppression of thermally activated restoration processes [10,11]. Indeed, the application of cryogenic SPD techniques has produced the formation of near nanocrystalline structures in Al [12,13], Cu [14] and other alloys [15,16], offering a practical prospect for producing true bulk nanostructural materials, with grain sizes below 100 nm. Typically, this involves heavily rolling materials at liquid nitrogen temperatures, which have already been deformed by a severe deformation technique like ECAE, to true strains of ~2.5–3 [10,14,15,17]. At these low temperatures, twinning becomes an important mechanism of grain refinement in copper alloys [14,17], although it doesn’t show a significant effect in high stacking fault metals like Al. One of the advantages claimed for cryogenic deformation is that on light annealing bimodal grain structures can be produced with an attractive combination of strength and tensile ductility [12,17]. However, the exploration of the cryogenic SPD technique is at its early stages and many aspects of the underlying science remain unclear. In particular, the evolution of the deformation structure at cryogenic temperatures has rarely been reported.
In order to develop a better understanding of the potential of cryogenic severe deformation routes for producing bulk nanomaterials, the present work has focused on investigating the evolution of microstructure during deformation under plane strain conditions, down to liquid nitrogen temperatures, in a model single phase Al-alloy pre-processed by ECAE to give it an initial submicron grain starting structure. The principle aim of the work was to study the factors that limit the grain size achievable by severe deformation and understand the mechanisms for maintaining the constant grain structure.

2. Material and Experimental Procedures

2.1. Starting Material

A single-phase high purity Al-0.1 (wt%) Mg alloy was used in this work as it has been often used for other severe deformation studies (e.g., [5,18]). DC cast and homogenized plates of the alloy were cold rolled to 50% and then recrystallized at 673 K (400 °C) for 1 h, giving a grain size of ~300 μm. Square cross-section billets 15 mm × 15 mm by 100 mm long were machined in the rolling direction and processed by ECAE at room temperature, using a 120° die. A total of 15 ECAE passes was applied to the billets via route A [19] (i.e., the billet orientation was maintained constant throughout deformation), giving a total effective strain of ~10. This produced an average grain size of 0.9 μm (grain width 0.55 μm; see Figure 1 below). These ECAE samples were then cut into plane strain compression specimens for cryogenic deformation. Some billets were also processed to 25 passes of ECAE with a total effective strain of ~17 to generate a steady state grain size.

2.2. Plane Strain Deformation

Specimens of dimensions 12 mm × 8 mm × 10 mm were cut from the 15 pass ECAE billets and then deformed in plane strain compression (PSC) using a channel die to a range of strains of up to 2.8, at a constant strain rate of 10−2 s−1 and at 295 K (room temperature) and three cryogenic temperatures. Methanol or n-pentane baths were chilled to their melting points with liquid nitrogen and used to maintain the specimens at the temperatures of 213 K (−60 °C) and 143 K (−130 °C), respectively. Liquid nitrogen alone was used to obtain 77 K (−196 °C). The temperature during compression was monitored by a thermal couple attached to the specimen and found to be within a range of ±2 °C. PTFE tape was used at room temperature and molybdenum disulphide/graphite at cryogenic temperatures to minimize friction. For the PSC specimens, orientation convention for flat rolling is adopted, with ND being the compression direction, RD the extension direction and TD the direction constrained by the channel. During PSC the specimen orientations ND, TD and RD were parallel to ND, TD and ED (extrusion direction), respectively, in the ECAE reference system [20].

2.3. Microstructure Characterization

The deformed samples were sectioned through their centre TD plane, before metallographic preparation and electro-polishing. The microstructures of the samples were then characterized by electron backscatter (EBS) imaging and electron backscatter diffraction (EBSD) (Oxford Instrument, High Wycombe, UK) in a field emission gun scanning electron microscope (FEGSEM) (FEI Siron, North Brabant, Netherlands). EBSD mapping was scanned over an area of 10 µm × 10 µm to 100 µm × 100 µm and the step size was 20 nm for microstructure characterization and 100 nm for texture analysis. The EBSD data was analyzed using HKL Channel 5 software (Oxford Instrument, High Wycombe, UK), after a grain dilation cleanup (grain tolerance of 5° and minimum grain size of 10 pixels), and all EBSD data are presented as all-Euler angle maps. High-angle boundaries (HABs) are defined as having misorientations greater than, or equal to, 15° (shown as black lines) and low-angle boundaries (LABs) have misorientations less than 15° (white lines). Due to misorientation noise, boundaries were cut-off of less than 1° misorientation. From the EBSD data, the average HAB and LAB spacings in the ND (λND) and RD/ED (λND) directions were calculated e using the linear intercept method and the fraction of HAB area and the average HAB and LAB boundary misorientations were also analyzed. For each measurement, the data was obtained from three or more maps and over 2000 grains were sampled in all cases.

3. Results

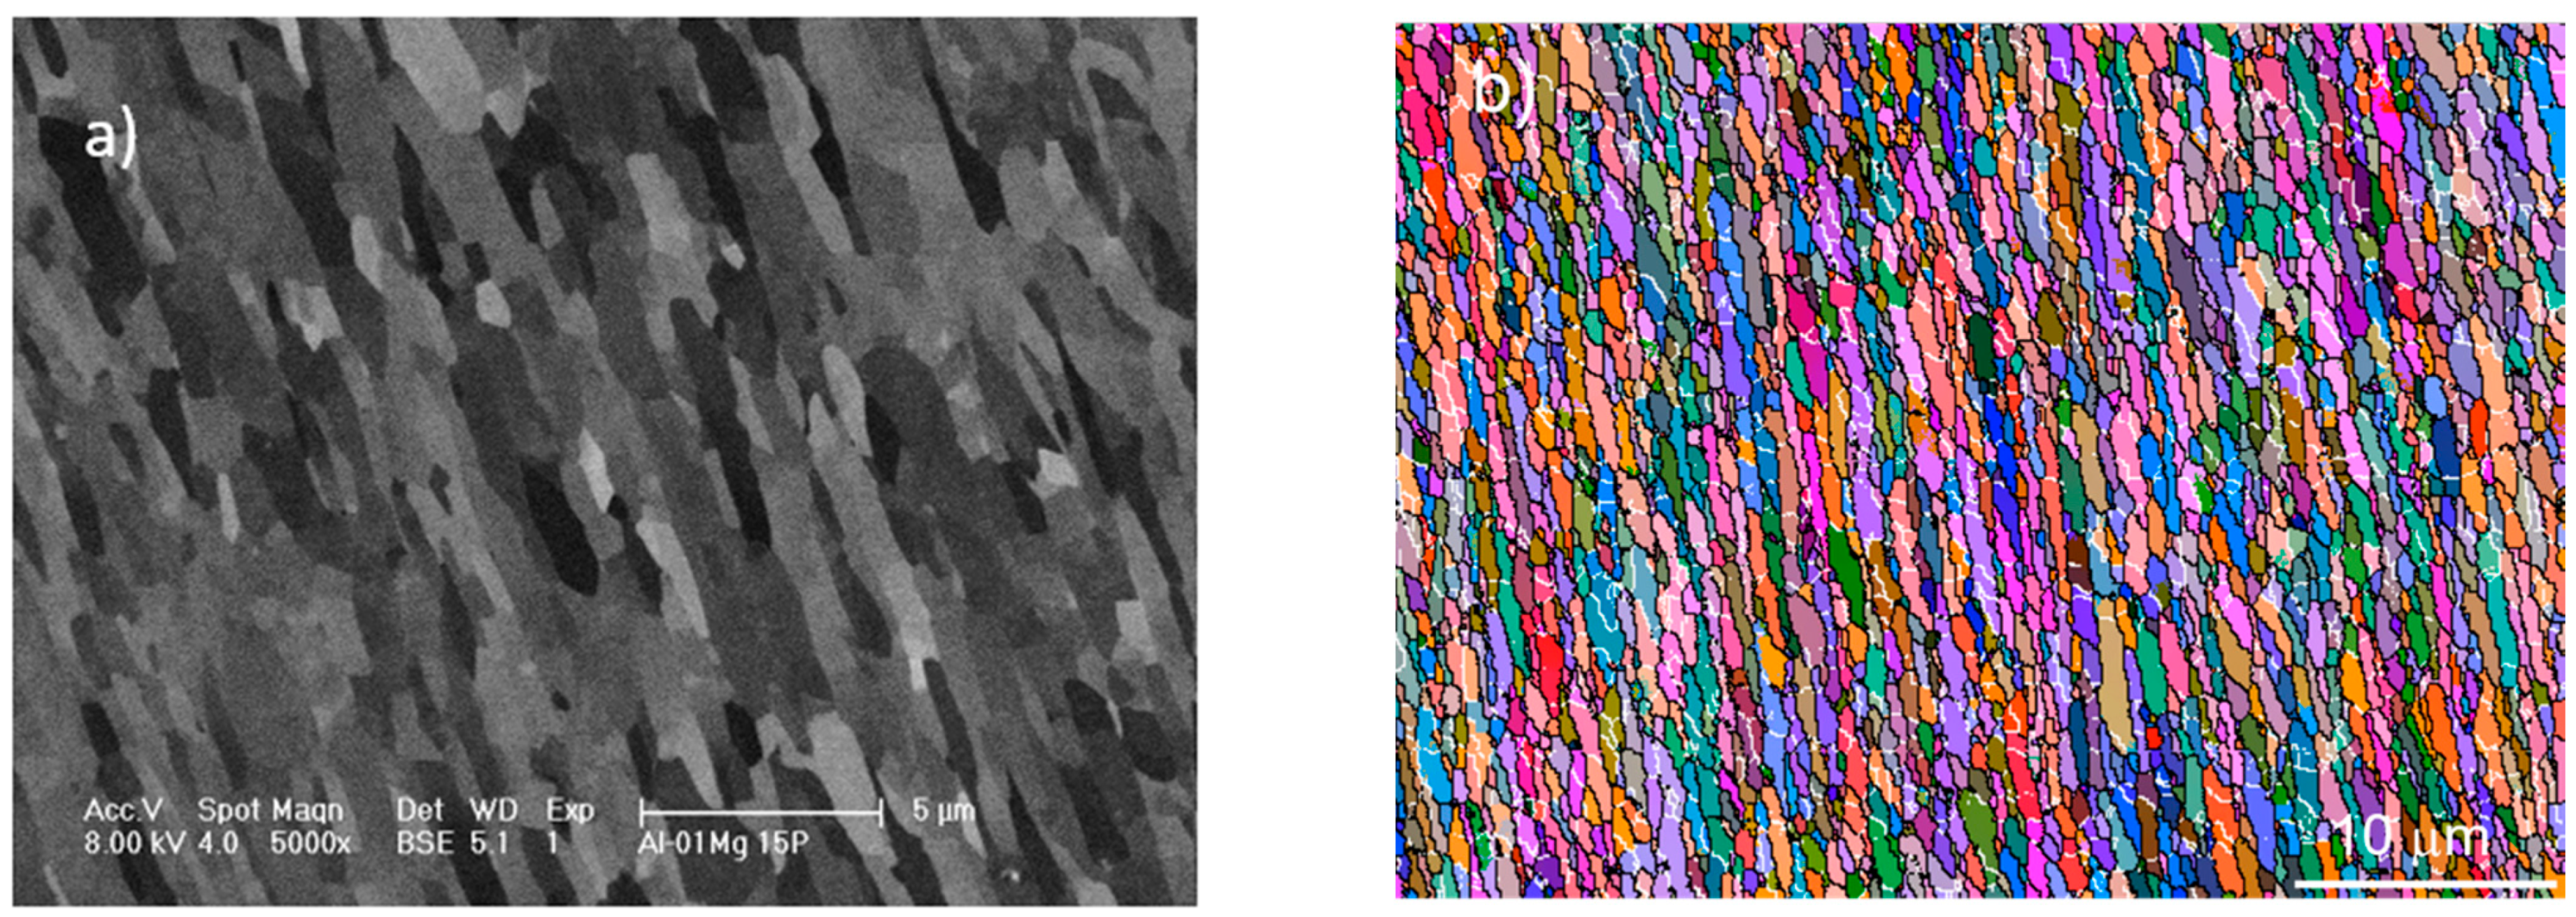
3.1. The Starting UFG Structure

The BSE image in Figure 1a and EBSD map in Figure 1b show the ultrafine grain (UFG) structure of the Al-0.1Mg alloy obtained after 15 passes ECAE processing, which was the starting condition for the cryogenic PSC experiment. The UFG structures formed during ECAE processing of this alloy at room temperature and the mechanisms involved in its evolution, have been previously reported [5,18]. At this strain level, ECAE processing by route A, where there is constant distortion of an element, leads to the formation of a fibrous deformation structure aligned close to ED, containing a mixture of highly elongated thin ribbon grains and lower aspect ratio submicron grains. However, the grain width is relatively uniform and has converged with the subgrain size. There was a significant proportion of retained LABs, mainly in the normal direction, creating a ‘bamboo’ structure [18] within many larger elongated grain fragments. An average grain width of λND ~0.55 μm was measured from the EBSD maps and an average aspect ratio of R~2.3 was measured manually as the grain elongation directions are more or less deviated from the ED, which is vertically aligned in Figure 1. The fraction of HAB area was 75%, which is high enough to comply with the definition proposed for an ultrafine grained material (>70% [21]). To confirm that, when the conditions are maintained constant in severe deformation, ultimately a steady state must be approached where there is no further grain refinement, some ECAE samples were further deformed at room temperature up to 25 passes (a true strain of ~17). Statistical data obtained by EBSD measurement showed little significant difference in the fraction of HAB area, and a negligible reduction in grain width, in the strain range ~8–17.

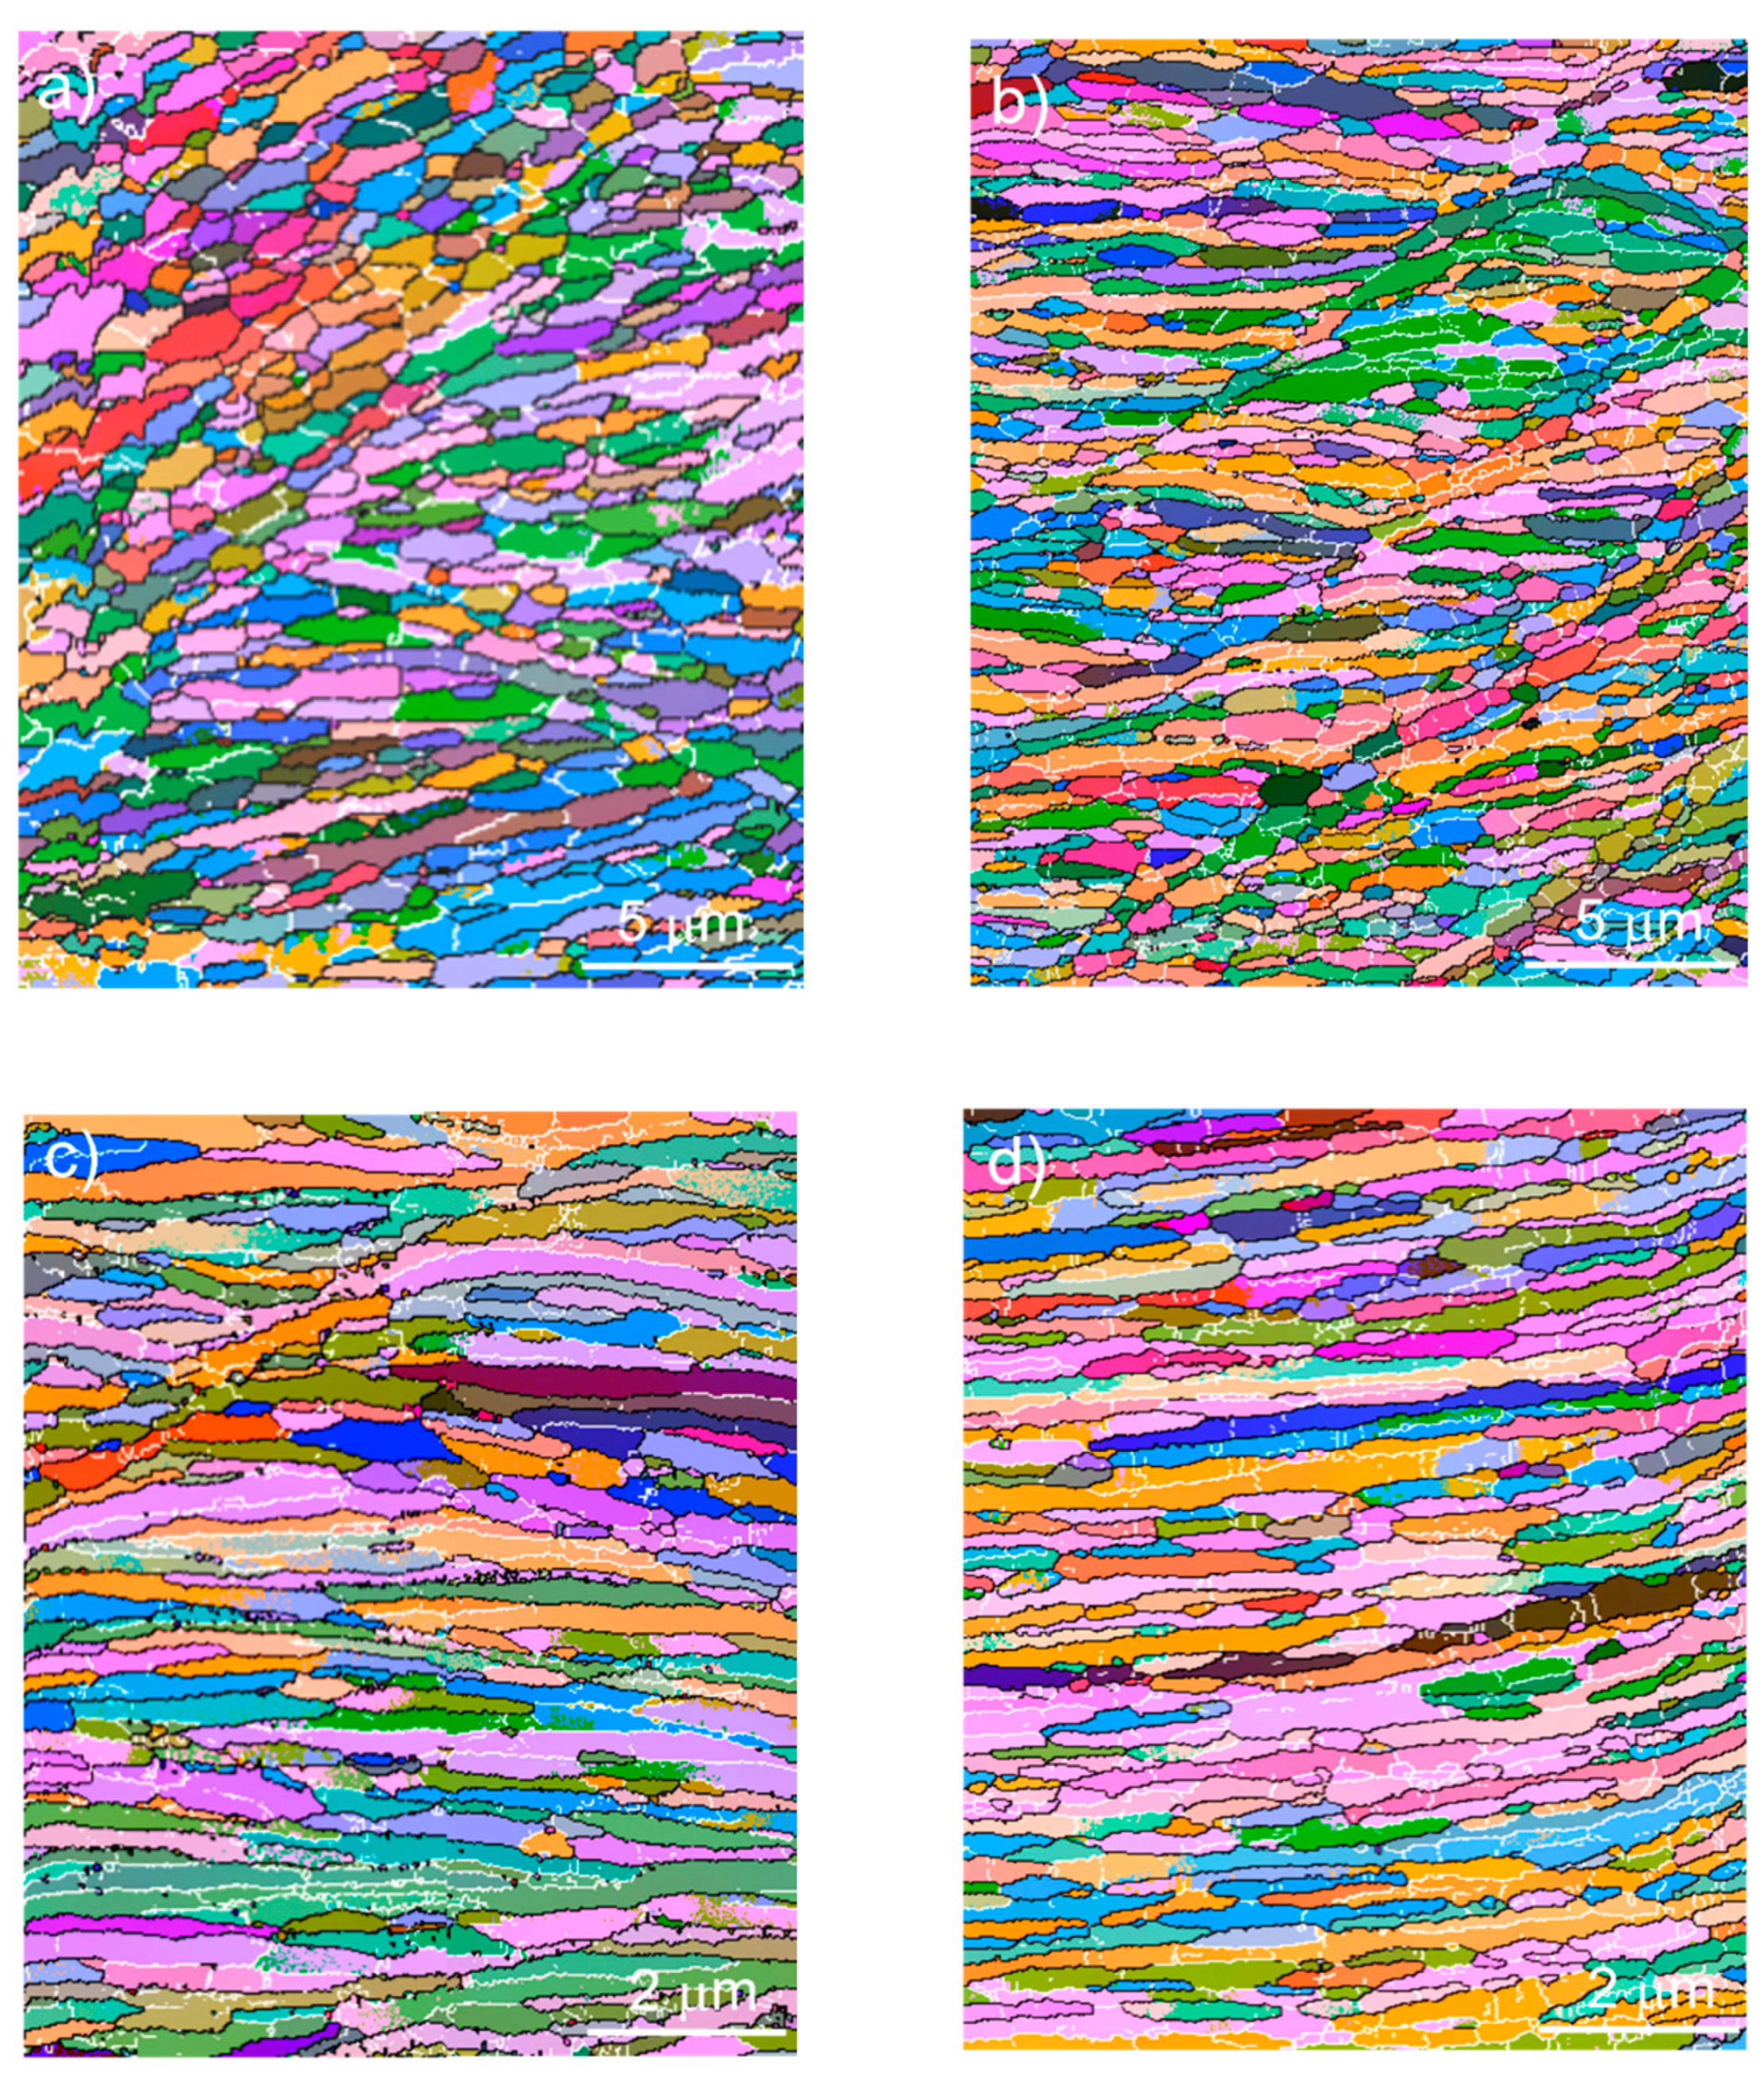
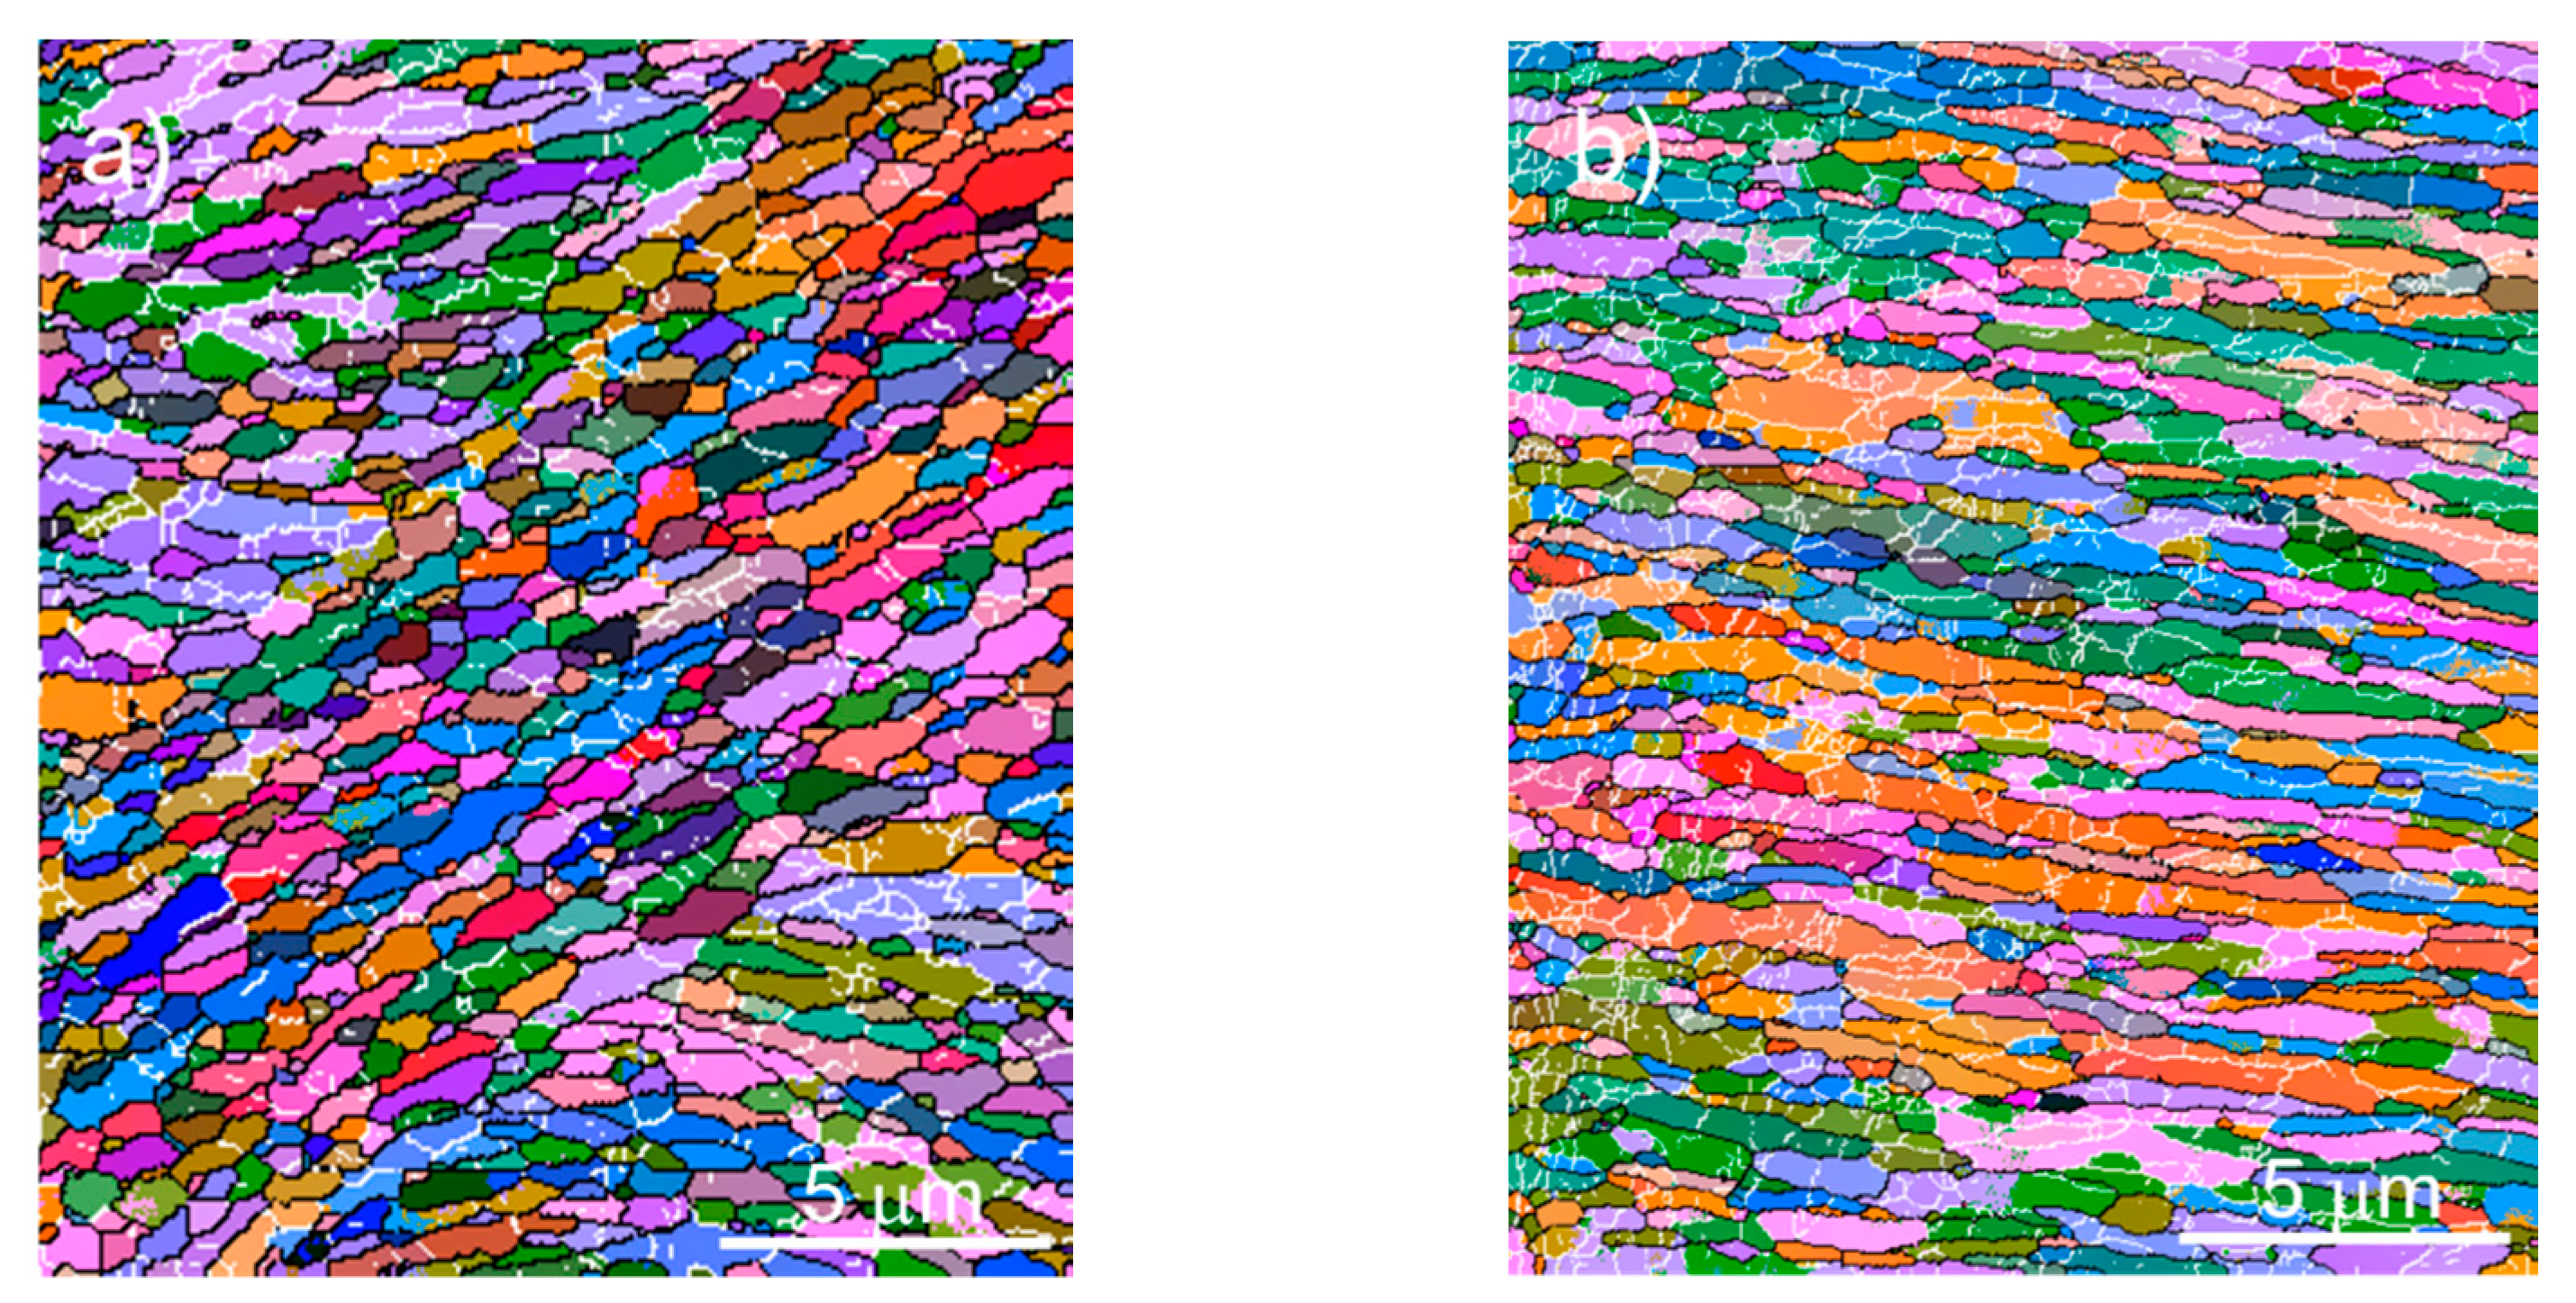
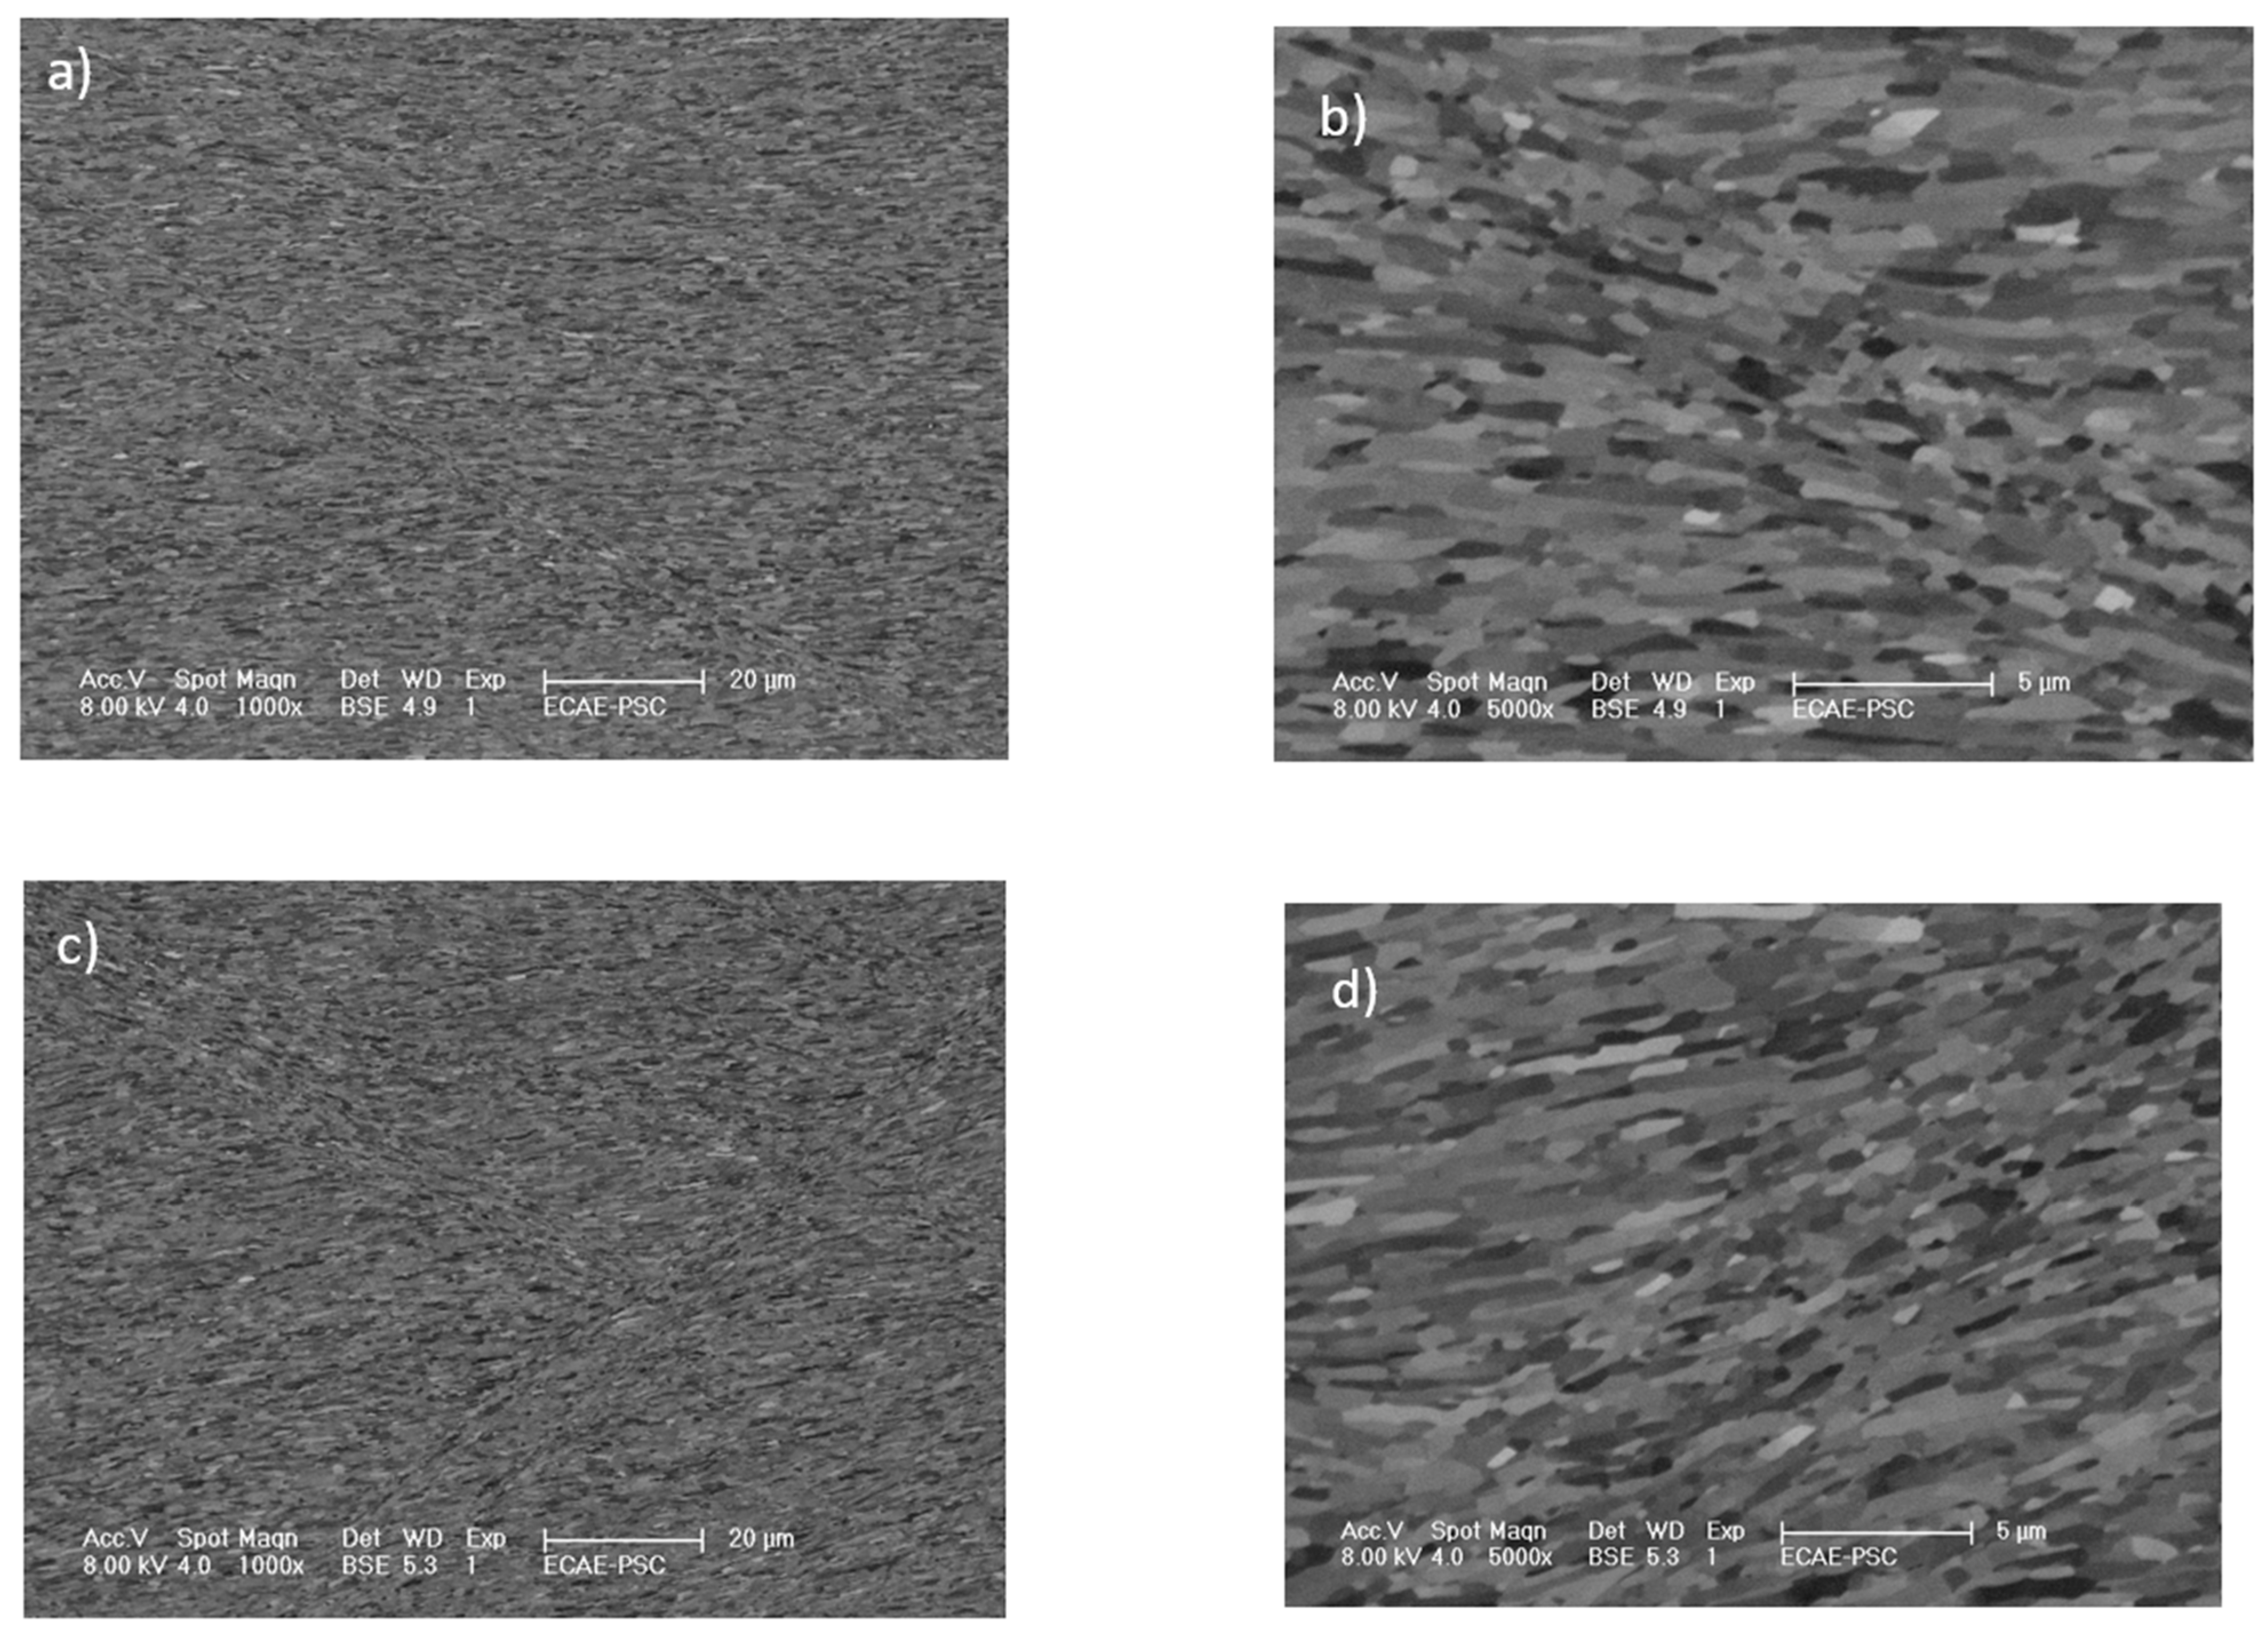
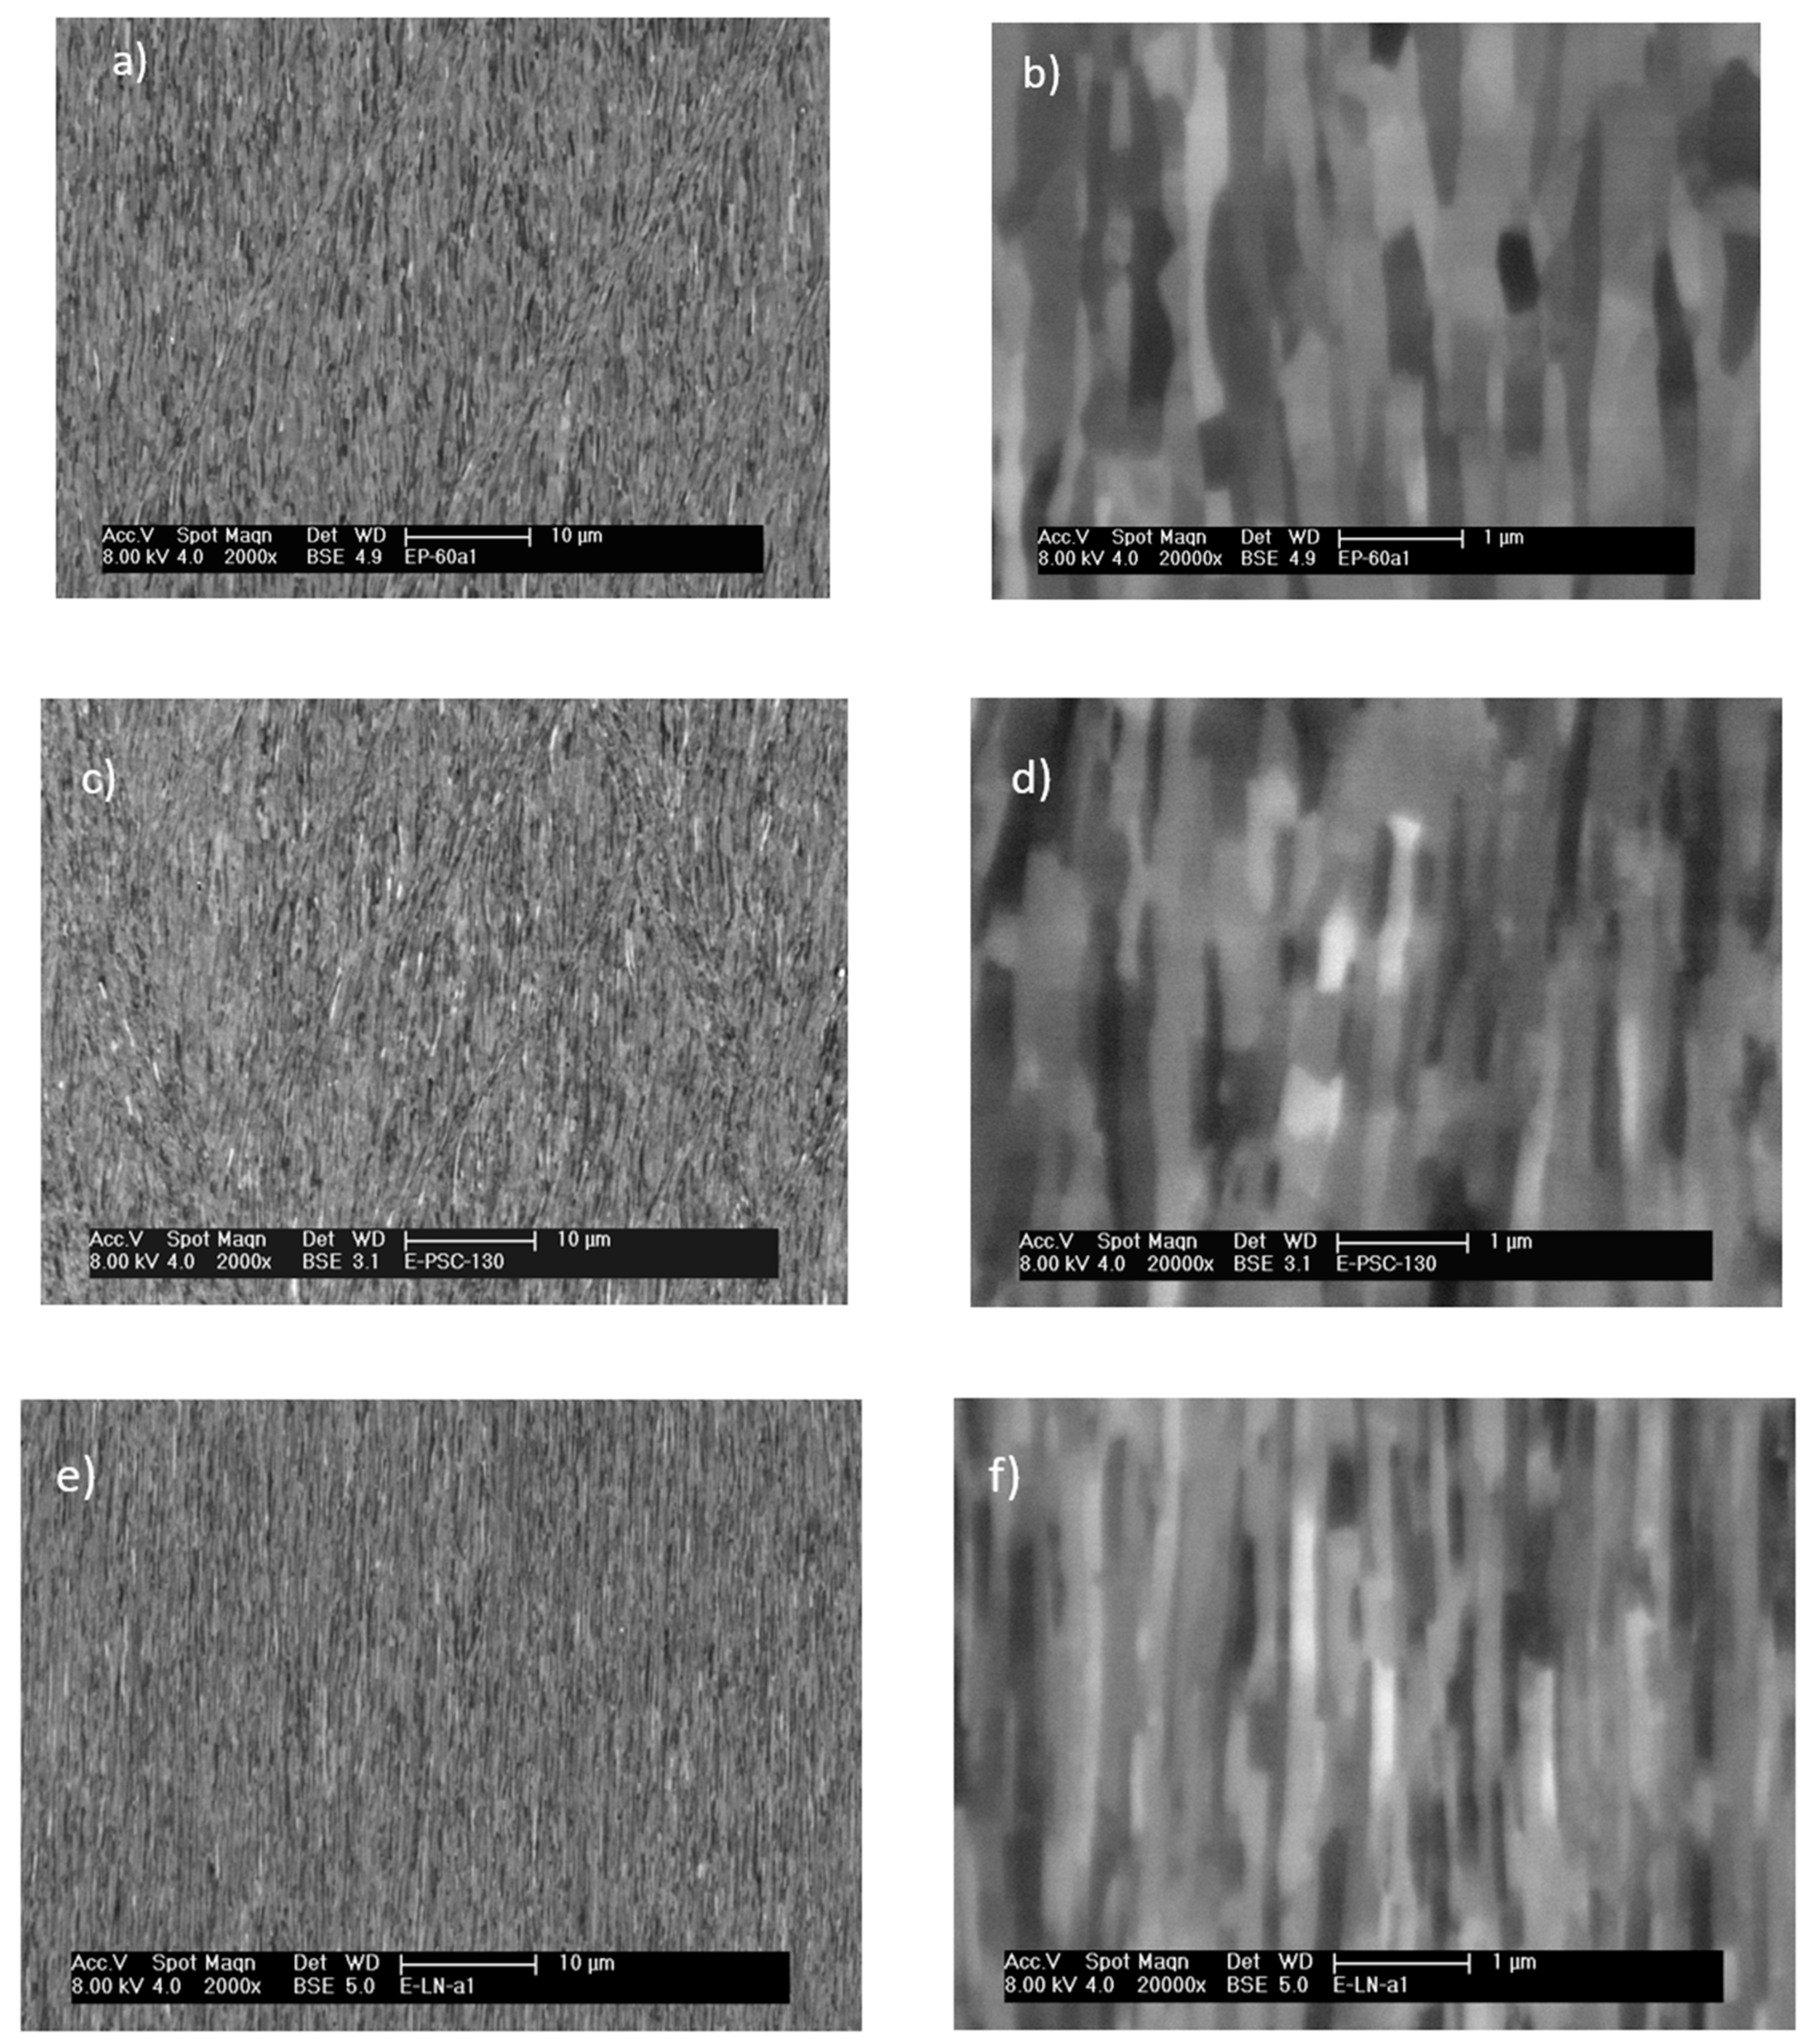
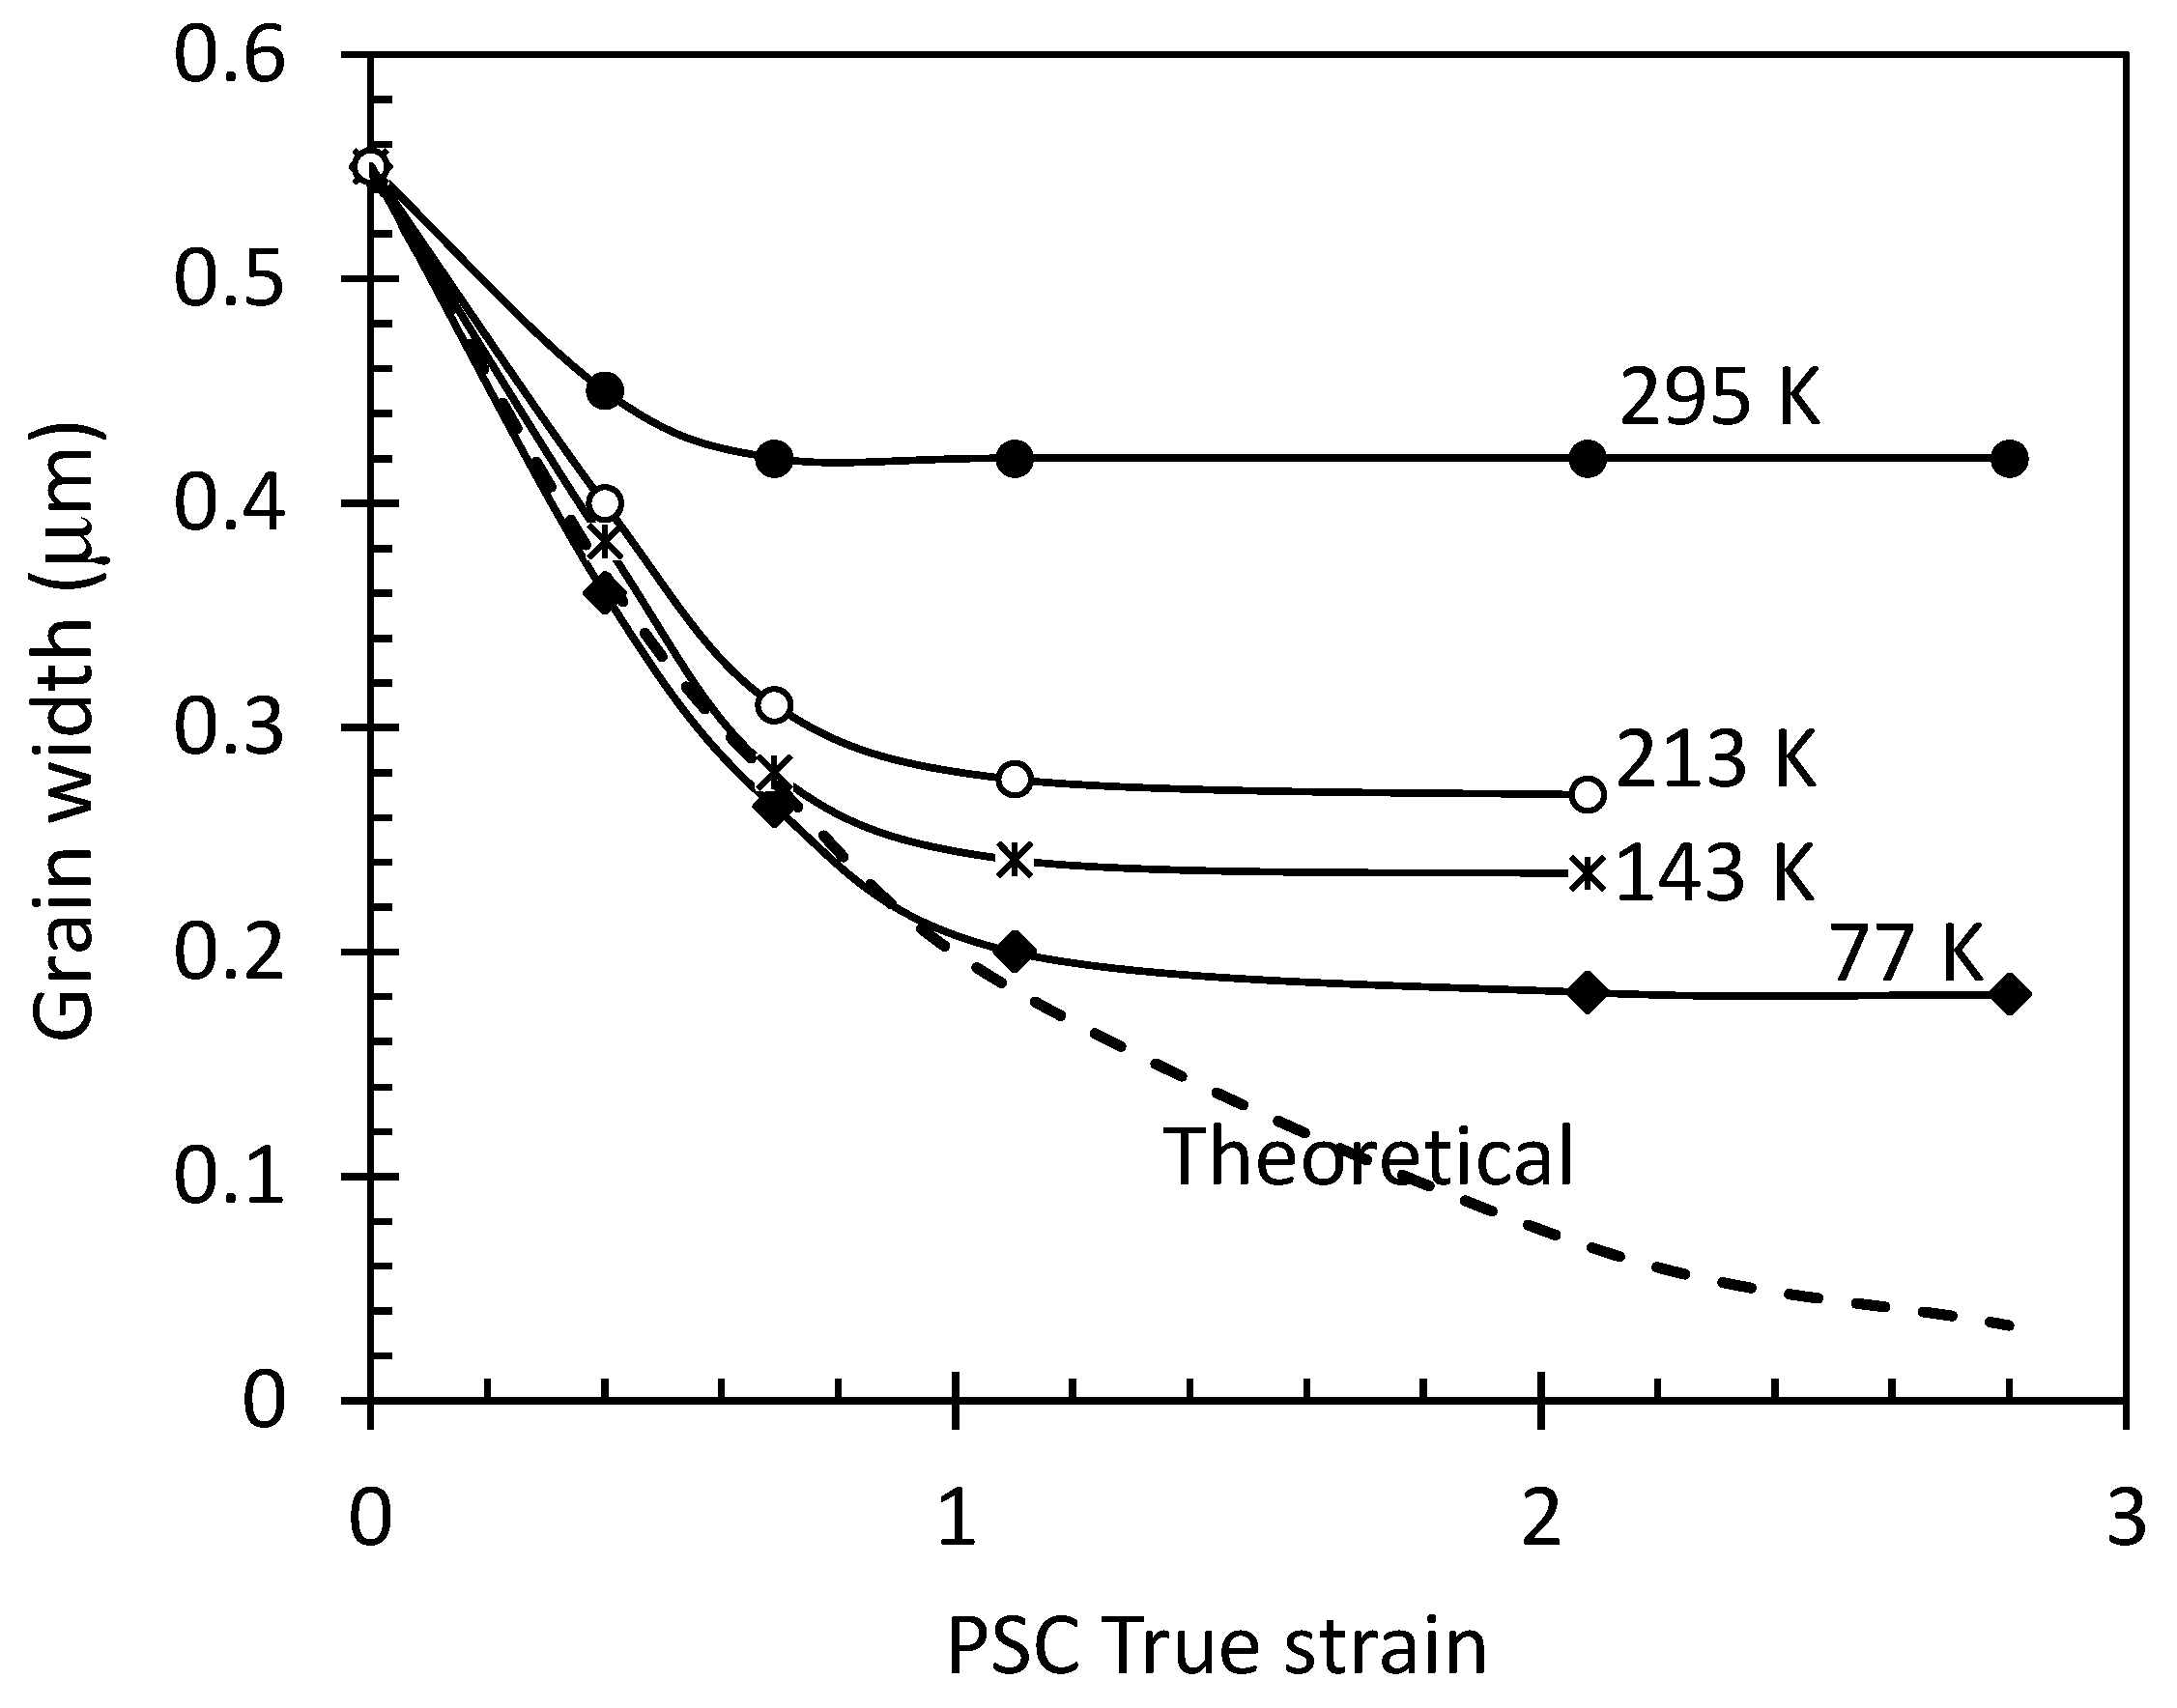
3.2. Microstructural Evolution during PSC Deformation

Figure 2 shows microstructures obtained after PSC at room temperature to a strain of 1.1 and 2.1 respectively, with Figure 2a,c displaying the general features and Figure 2b,d revealing detailed structures at a finer scale, respectively. The most striking feature after room temperature PSC was the disruption of the initial uniform ECAE UFG structure due to shear banding. The shear bands were about ~5 μm in width and within them the grains were re-aligned and elongated in the direction of shear (Figure 2b,d). Localization of strain resulted in slightly finer and more equiaxed grains within the shear bands than in the matrix. The shear bands cut through the initial elongated grain structure at an angle of 35–40° to RD, closely aligned to the plane of maximum shear stress in the channel die samples (slightly away from 45° due to friction). There were little significant microstructural differences between strain levels of 1.1. and 2.1.
Figure 3 shows EBS images from the samples deformed by PSC at cryogenic temperatures to a true strain of 2.1. As expected, the deformation structures were temperature dependent. With reducing cryogenic temperatures, the initial UFG structure became more elongated and compressed and a very fine lamellar structure formed, aligned parallel to RD, with straighter aligned boundaries than found in the initial material deformed at room temperature. The spacing of the lamellar boundaries reduced considerably with decreasing temperature and the finest ribbon structure obtained at 77 K had an overall boundary spacing (including both LABs and HABs) of 130 nm, which is verging on being nanocrystalline (Figure 3e,f). However, if only boundaries greater than 15° in misorientation are considered then the minimum ND HAB spacing achieved was ~180 nm. Upon PSC at 215 K and 130 K, the starting fibrous UFG structure was also disrupted by the introduction of macroscopic shear bands (Figure 3a,c), as was at room temperature (Figure 2a,c). The shear bands rotated with continued deformation from an angle of 35–40° to 20–30° relative to RD at the strain of 2.1.
This trend in shear band alignment is similar to that found in PSC and rolling at more conventional strains [22], although the intensity of shear banding lessened with decreasing temperature and they reduced in width, until they completely vanished at 77 K.
EBSD mapping was conducted to measure the microstructural parameters. Figure 4 shows examples of EBSD maps obtained from samples deformed to a true strain of 2.1 by PSC at room temperature and the cryogenic temperatures. Figure 5 shows the average high angle boundary spacing along ND (λND), as a function of strain at all temperatures tested. It can be seen that a steady state grain width is reached at all temperatures after a certain strain, after which little further grain refinement occurs, and that the steady grain width decreases with decreasing temperature. Figure 5 also includes the geometrically required HAB spacing (λG) in ND (dotted line), predicted from the response of the pre-existing HABs to plane strain compression. This parameter assumes on average a grain deforms in proportion to the imposed strain and gives a theoretical width if deformation is homogenous by dislocation glide and there is no grain subdivision. During PSC to large strains, grains of an initial HAB spacing λ0 in ND become thin ribbons. From simple geometric considerations in PSC the theoretical geometrically required grain thickness (λG) is related to λ0 and the true strain (ε) [9] by approximately:
λ G = λ 0 exp ( ε )
From Figure 4 it can be seen that at all temperatures, λND initially decreases with strain before a steady state is established. At room temperature, where the deformation conditions are altered mainly just by a change in deformation mode from simple shear in ECAE to pure shear in plane strain compression, there is only a small adjustment in the deformation structure. λND marginally decreases and quickly approaches new constant values. As shown in Figure 4, the λND/λG ratio is higher than unity in the whole strain range. This implies that there is a loss of high angle boundary area during deformation, relative to that expected purely from geometrical considerations. In comparison, on deformation at cryogenic temperatures, λND initially follows the prediction of Equation (1) at low strains, with a λND/λG ratio close to 1. But, similar to the trend at room temperature, the rate of reduction of λND then rapidly slows down and reaches a steady state width at high strains. Departure from the theoretical line occurs more quickly the warmer the deformation temperature and the strain required to achieve a steady state in λND increases with decreasing temperature, from ~0.5 at room temperature to ~1.0 at 77 K. At low temperatures the average grain aspect ratio increases considerably during plane strain compression but does not change significantly at room temperature. At the maximum strain of 2.8, the λND/λG ratios were 2.1 and 23.7 for the grain structure obtained at room temperature and 77 K respectively (see Table 1). There is, therefore, a greater loss of HAB area, relative to the expected decrease in HAB spacing from geometric considerations, at higher deformation temperatures, due to the greater rate of restoration processes, which leads to a larger steady state grain size.
Figure 6 shows the fraction of HAB area as a function of strain and temperature. It can be seen that there is initially an abrupt drop in HAB area fraction after a strain of 0.4 at cryogenic temperatures, due to the introduction of LABs when the equilibrium cell size is reduced by lowering the deformation temperature, compared with a slight decrease for room temperature deformation to the same strain level. The HAB fraction then increases with further strain at all temperatures, approaching a similar level close to that of the starting material by a strain of εtrue ~1.1. With further deformation, the HAB fraction continues to increase slightly at room temperature until it reaches a stable value, whereas a slight decrease is seen at cryogenic temperatures. This latter behavior is probably related to the development of a stronger texture in the cold deformed sample. EBSD data showed that the average misorientations of low and high angle boundaries underwent insignificant changes with strain and temperature, being about 40–44° for HABs and 4–6° for LABs.

3.3. Texture Development during PSC

The development of textures during PSC was analyzed by EBSD measurement. The texture of the starting ECAE processed UFG material was weak and comprised of S and rotated cube components with low volume fractions. During PSC deformation, a typical rolling texture developed in all samples and the main components are brass, copper and S. The overall texture intensity increased with increasing strain and decreasing temperature, although individual texture components exhibited different trends in their development. The strongest texture was seen in the PSC sample deformed at 77 K to the maximum strain employed of ε = 2.8. The detailed volume fractions of individual texture components during PSC deformation at 77 K, calculated from EBSD data, are given in Table 2. Three stages of texture development were seen with strain at 77 K. At low strains, the three rolling texture components, i.e., brass, copper and S, all developed rapidly from the starting weak ECAE texture, with the S and copper components increasing at a noticeably higher rate. A small fraction of Goss component also developed at the beginning of deformation and died off quickly. At the same time, there was a reduction in the strength of the ND-rotated cube original ECAE component. In the medium strain range, from 1.1 to 2.1, the Brass and S components moderately strengthened, while the copper component remained almost constant in intensity. Finally, upon further straining to ε = 2.8, the volume fraction of S and Brass underwent another rapid increase at the expense of the copper texture.
The above results are broadly in agreement with texture evolution during rolling, or plane strain compression, of aluminium alloys with conventional grain sizes [23], although the texture at room temperature and moderate cryogenic temperatures were weakened by macroshear banding. It is interesting to notice that at 77 K that there is a transition from an S and copper dominated texture to an S and brass controlled texture after large strains (ε > 2), whereas at room temperature the copper component remained stronger. The type of rolling texture developed in single phase aluminium alloys depends on the deformation temperature and alloy solute levels, which affect the stacking fault energy in the material [23].

4. Discussion

Grain refinement during severe deformation to ultra-high strains, under constant conditions, clearly becomes progressively less efficient and ultimately stagnates as a steady state grain size is approached. Impact of deformation mode change from simple shear in ECAE to pure shear in PSC alone on grain refinement seems to be limited. PSC deformation using samples processed by ECAE at room temperature represents such a deformation change. The minimum grain width after PSC at room temperature was slightly reduced from 0.55 µm to 0.45 µm. Considering the starting ECAE structure is slightly away from its steady state and light changes in strain rate and friction conditions, this grain size change is not significant. Upon deformation mode change, the dominant slip systems are expected to be altered and existing textures disturbed and re-evolved. Indeed, a strong rolling texture was developed during PSC deformation and extensive shear banding took place due to strain localization caused by the change in dominant slip systems as shown in Figure 2. However, because the grain size converges with the subgrain size at the steady state, which represents the minimum mean dislocation free path, there are no dislocation sources in operation within grains. Therefore, further grain subdivision was impossible. Figure 7a shows an EBSD map obtained from a sample deformed by PSC at room temperature to a strain of 0.4, showing that the macroshear bands are comprised of individual grains without apparent differences in the HAB fraction from the matrix and that shear banding does not change the steady state grain size.
At cryogenic temperatures, there is initially an abrupt drop in HAB area fraction after a strain of 0.4 (Figure 6), due to the introduction of LABs when the equilibrium cell size is reduced by lowering the deformation temperature, compared with a very slight decrease for room temperature deformation to the same strain level. Figure 7b shows the microstructure after a strain of 0.4 at 77 K and it can be seen that the fraction of LABs is apparently higher than that in Figure 7a. The introduction of LABs resulted in the decrease in grain size as they gradually transformed into LABs. The HAB fraction then increases with further strain at all temperatures, approaching a similar level close to that of the starting material by a strain of εtrue ~1.1 and a steady state grain size is established.
An important question in this context is what are the restoration mechanisms that give rise to the occurrence of the steady state. It has been mainly attributed to thermally activated dynamic recovery. However, it will be shown here that at low temperatures the required rate of dynamic restoration is many orders of magnitude higher than the figures that can be satisfactorily explained by diffusion-controlled boundary migration and must be dominated by athermal processes. This important point has previously been made for room temperature/warm deformation and cryogenic deformation as well [4,9], although physical mechanisms have never been given to explain the phenomenon. Here, grain boundary dislocation emission is considered to be the controlling mechanism.
A constant λND, occurring in the late stages of deformation, implies that there must be a loss of grain boundaries in order to compensate the reduction in grain size by geometrical compression described by Equation (1). The fraction of the lost HAB area (fL) can be related to the initial grain width λ0, measured grain width λND and the total strain (εt) by:
f L = 1 ( λ 0 λ ND ) exp ( ε t )
For example, λND at 298 K and 77 K are 420 nm and 180 nm, respectively, and it requires a loss of ~92% and ~80% of the lamellar HABs to maintain the constant λND at a total strain of 2.8 at these two temperatures, respectively. If the grain boundary loss is caused by thermally activated competitive coarsening between ribbon grains, boundaries must migrate during deformation at a rate equal to that of their compression, VC, which can be related to strain rate, ε ˙ , by:
V C = d λ / d t = λ ND ε ˙
Using the experimentally measured data of the steady state λND at different temperatures, the boundary migration rate VC estimated from Equation (3) is plotted in Figure 8 against inverse temperature. From the data, an apparent “activation energy” of ~6 kJ mol−1 for of the grain boundary migration is obtained. This figure is far too low and physically unreasonable for any thermally activated processes and conventional thermally activated mechanisms cannot satisfactorily explain the measured dynamic restoration rate during steady state deformation at cryogenic temperatures.
Texture development during deformation can explain part of the high angle grain boundary loss when neighbor grains evolve into similar orientations. Figure 9 shows the correlation of the overall texture volume fraction and the loss of HABs at the steady state deformation (ε > 1) during PSC at 77 K. Although texture increase will eventually flat while HAB loss continues, it is important to understand that grain boundary dislocation absorption or emission must occur during deformation, which give rise to a reduction in misorientation between adjacent grains and eventually their orientations converge and the boundary between them disappear. It is also important to understand that these “measured textures” only reflect the resultant orientation distribution after certain amount of deformation and that the “real textures” during deformation can be dynamic, evolving in response to local microstructures and energies. Thus, orientation convergence due to boundary dislocation activities is not necessarily related to texture development but a fundamental mechanism of microstructural evolution during steady state deformation.
At steady state where there is a dynamic grain size distribution around the steady state grain size. It is expected that intragranular dislocation sources operate in grains larger than the steady state grain size, whereas grain boundary dislocation sources dominate in smaller grains. The net effect of grain subdivision due to intragranular dislocation operation and grain coarsening as a result of grain boundary dislocation emission and absorption determines the steady state deformation. Mobile dislocations will inevitably sink into boundaries where they terminate in response to material flow. Because the actual PSC deformation keeps reducing grain size in the compression direction, grain coarsening assisted by the operation of grain boundary dislocations must dominate.
Grain boundaries have long been recognized as sources and sinks for dislocations. Constant changes in grain shape and grain boundary misorientation can only occur via grain boundary dislocations during deformation (except the cases where diffusion mechanism dominates). In the present case, grain boundary dislocation operation can adequately explain the steady state deformation and the rate of dynamic grain structure coarsening, as Equation (3) suggests that the coarsening rate is directly related to strain rate, which is simply determined by the operation of dislocations.

5. Summary

The evolution of microstructures and textures during plane strain compression in a ultrafine grained Al-0.1Mg alloy prepared by ECAE has been carried out at a range of low temperatures from 77 K to room temperature to various strains with following findings:
(1)
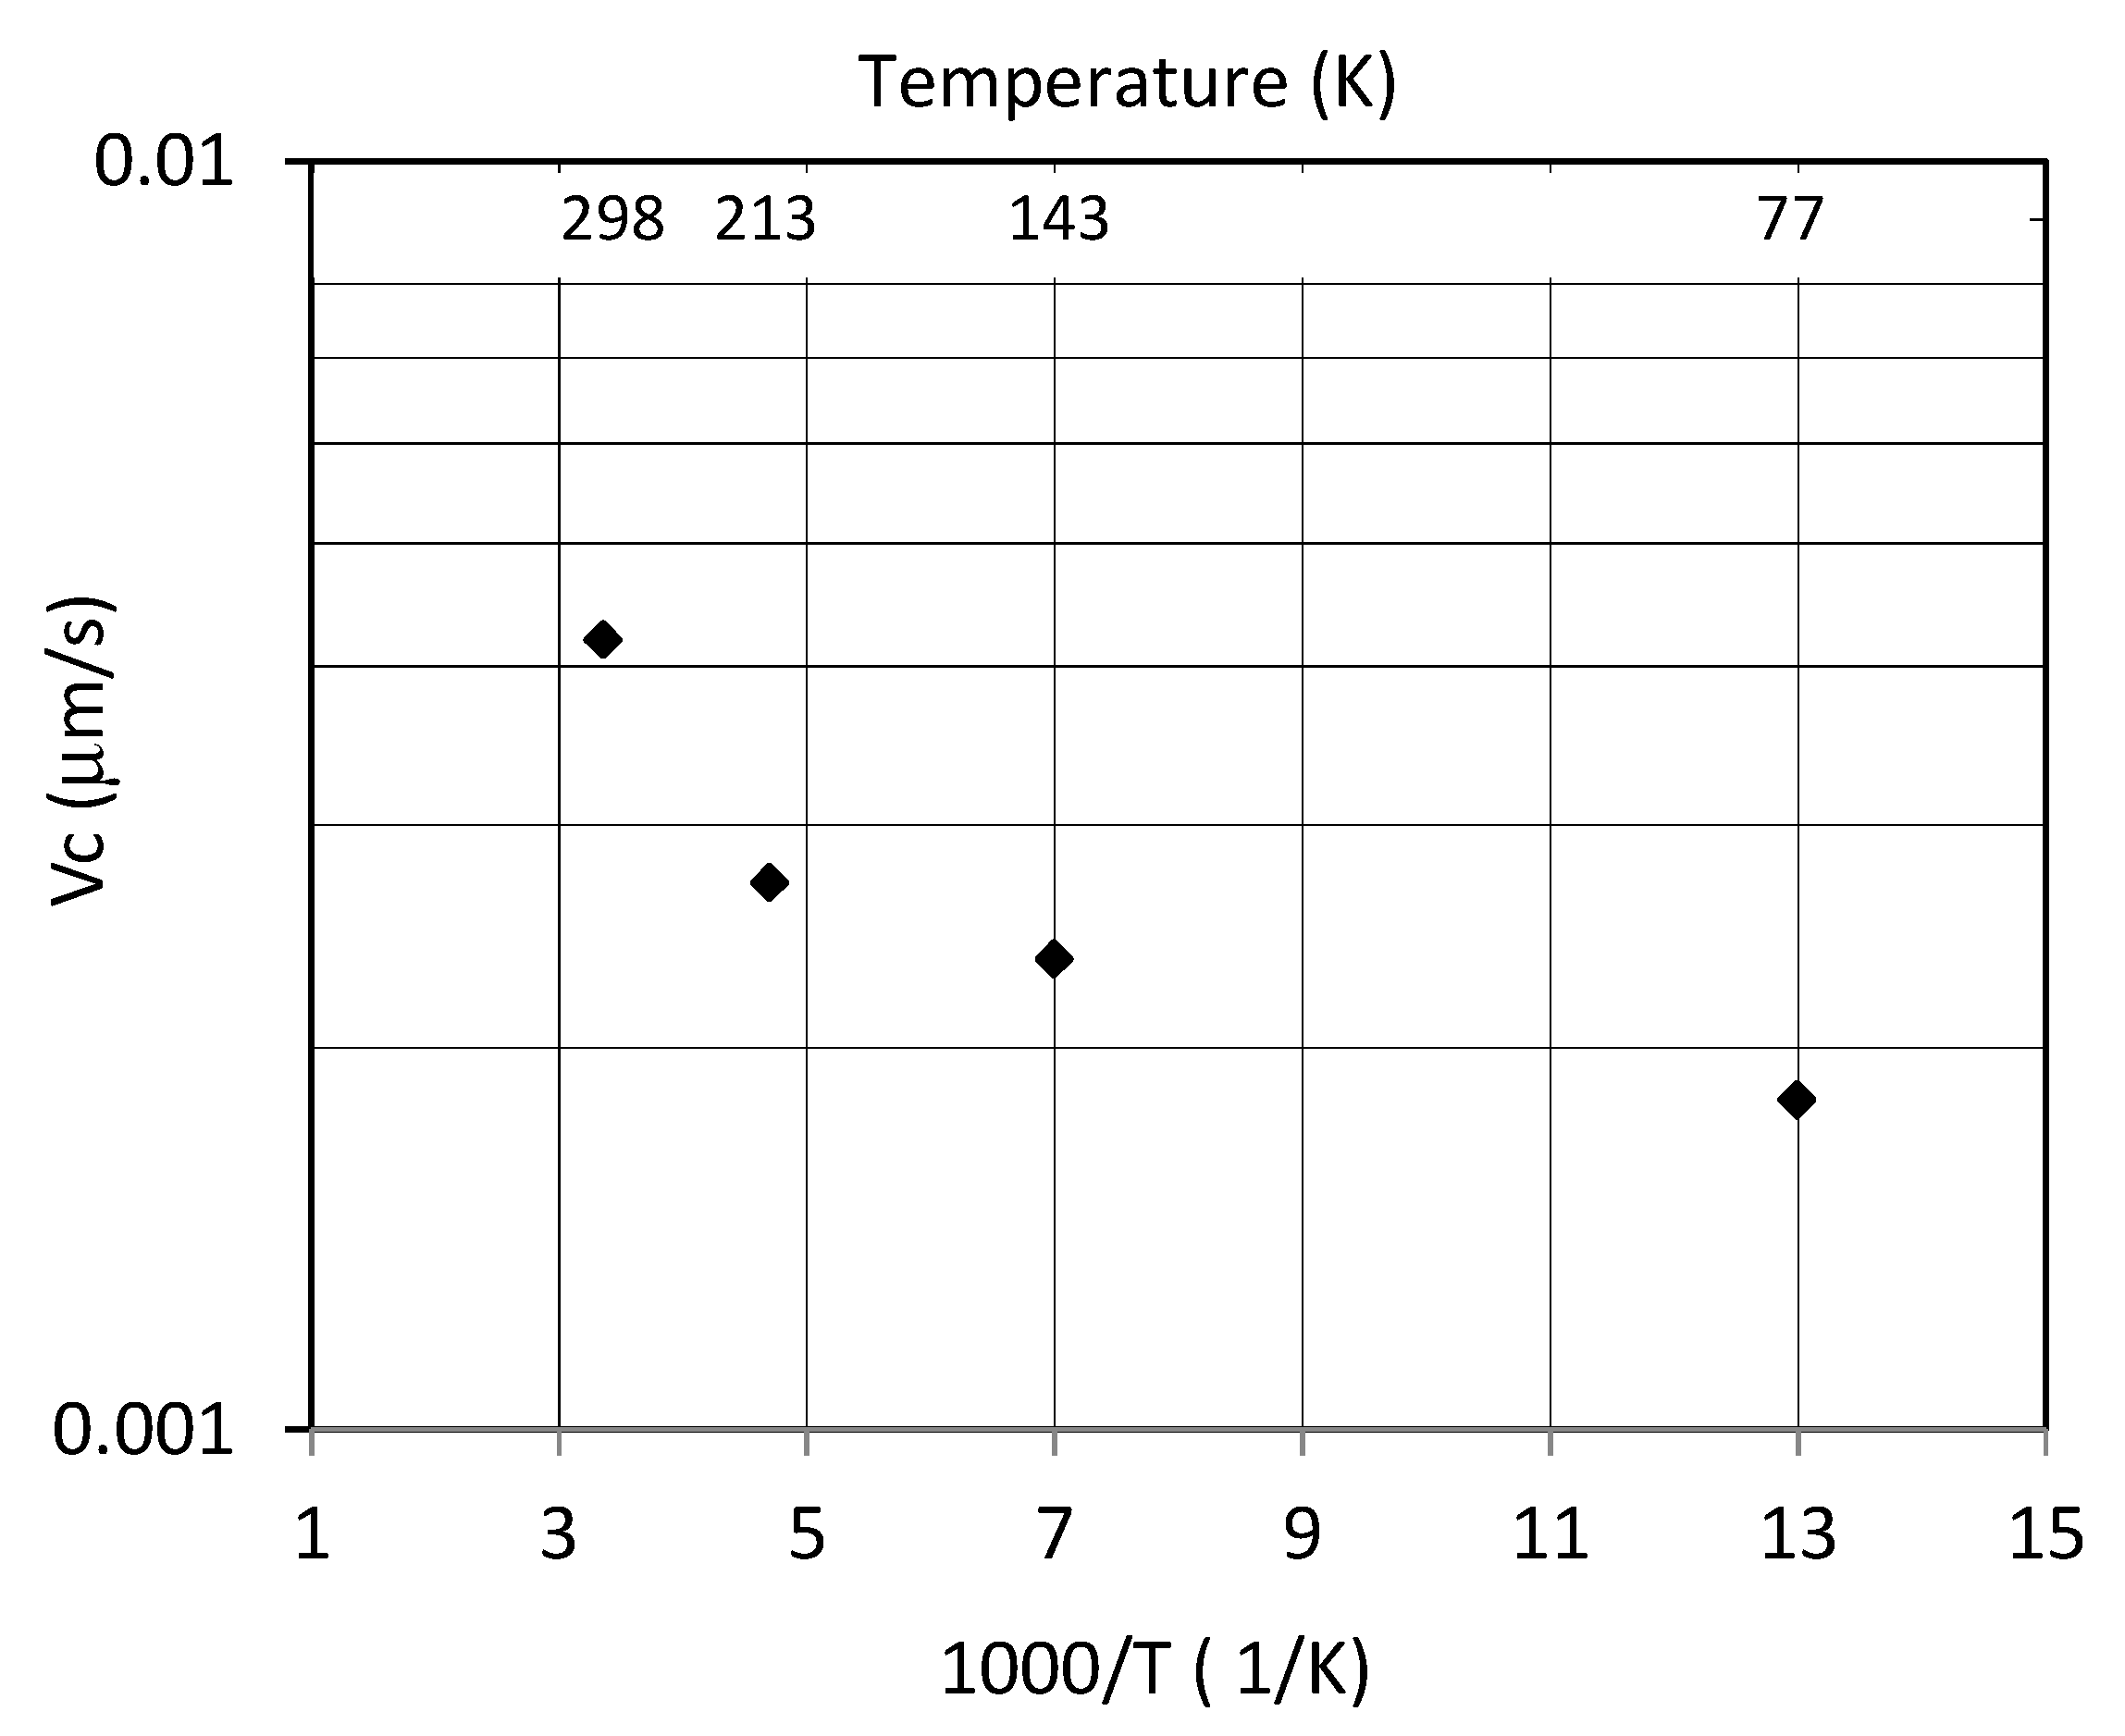
Grain refinement takes place during deformation at cryogenic temperatures. The grain width along the compression direction decreases with decreasing temperature and a minimum grain width of 180 nm is obtained at 77 K.
(2)
The change of deformation mode from simple in ECAE to pure shear in plane strain compression shows limited impact on grain size, although extensive macroshear banding is observed during plane strain compression.
(3)
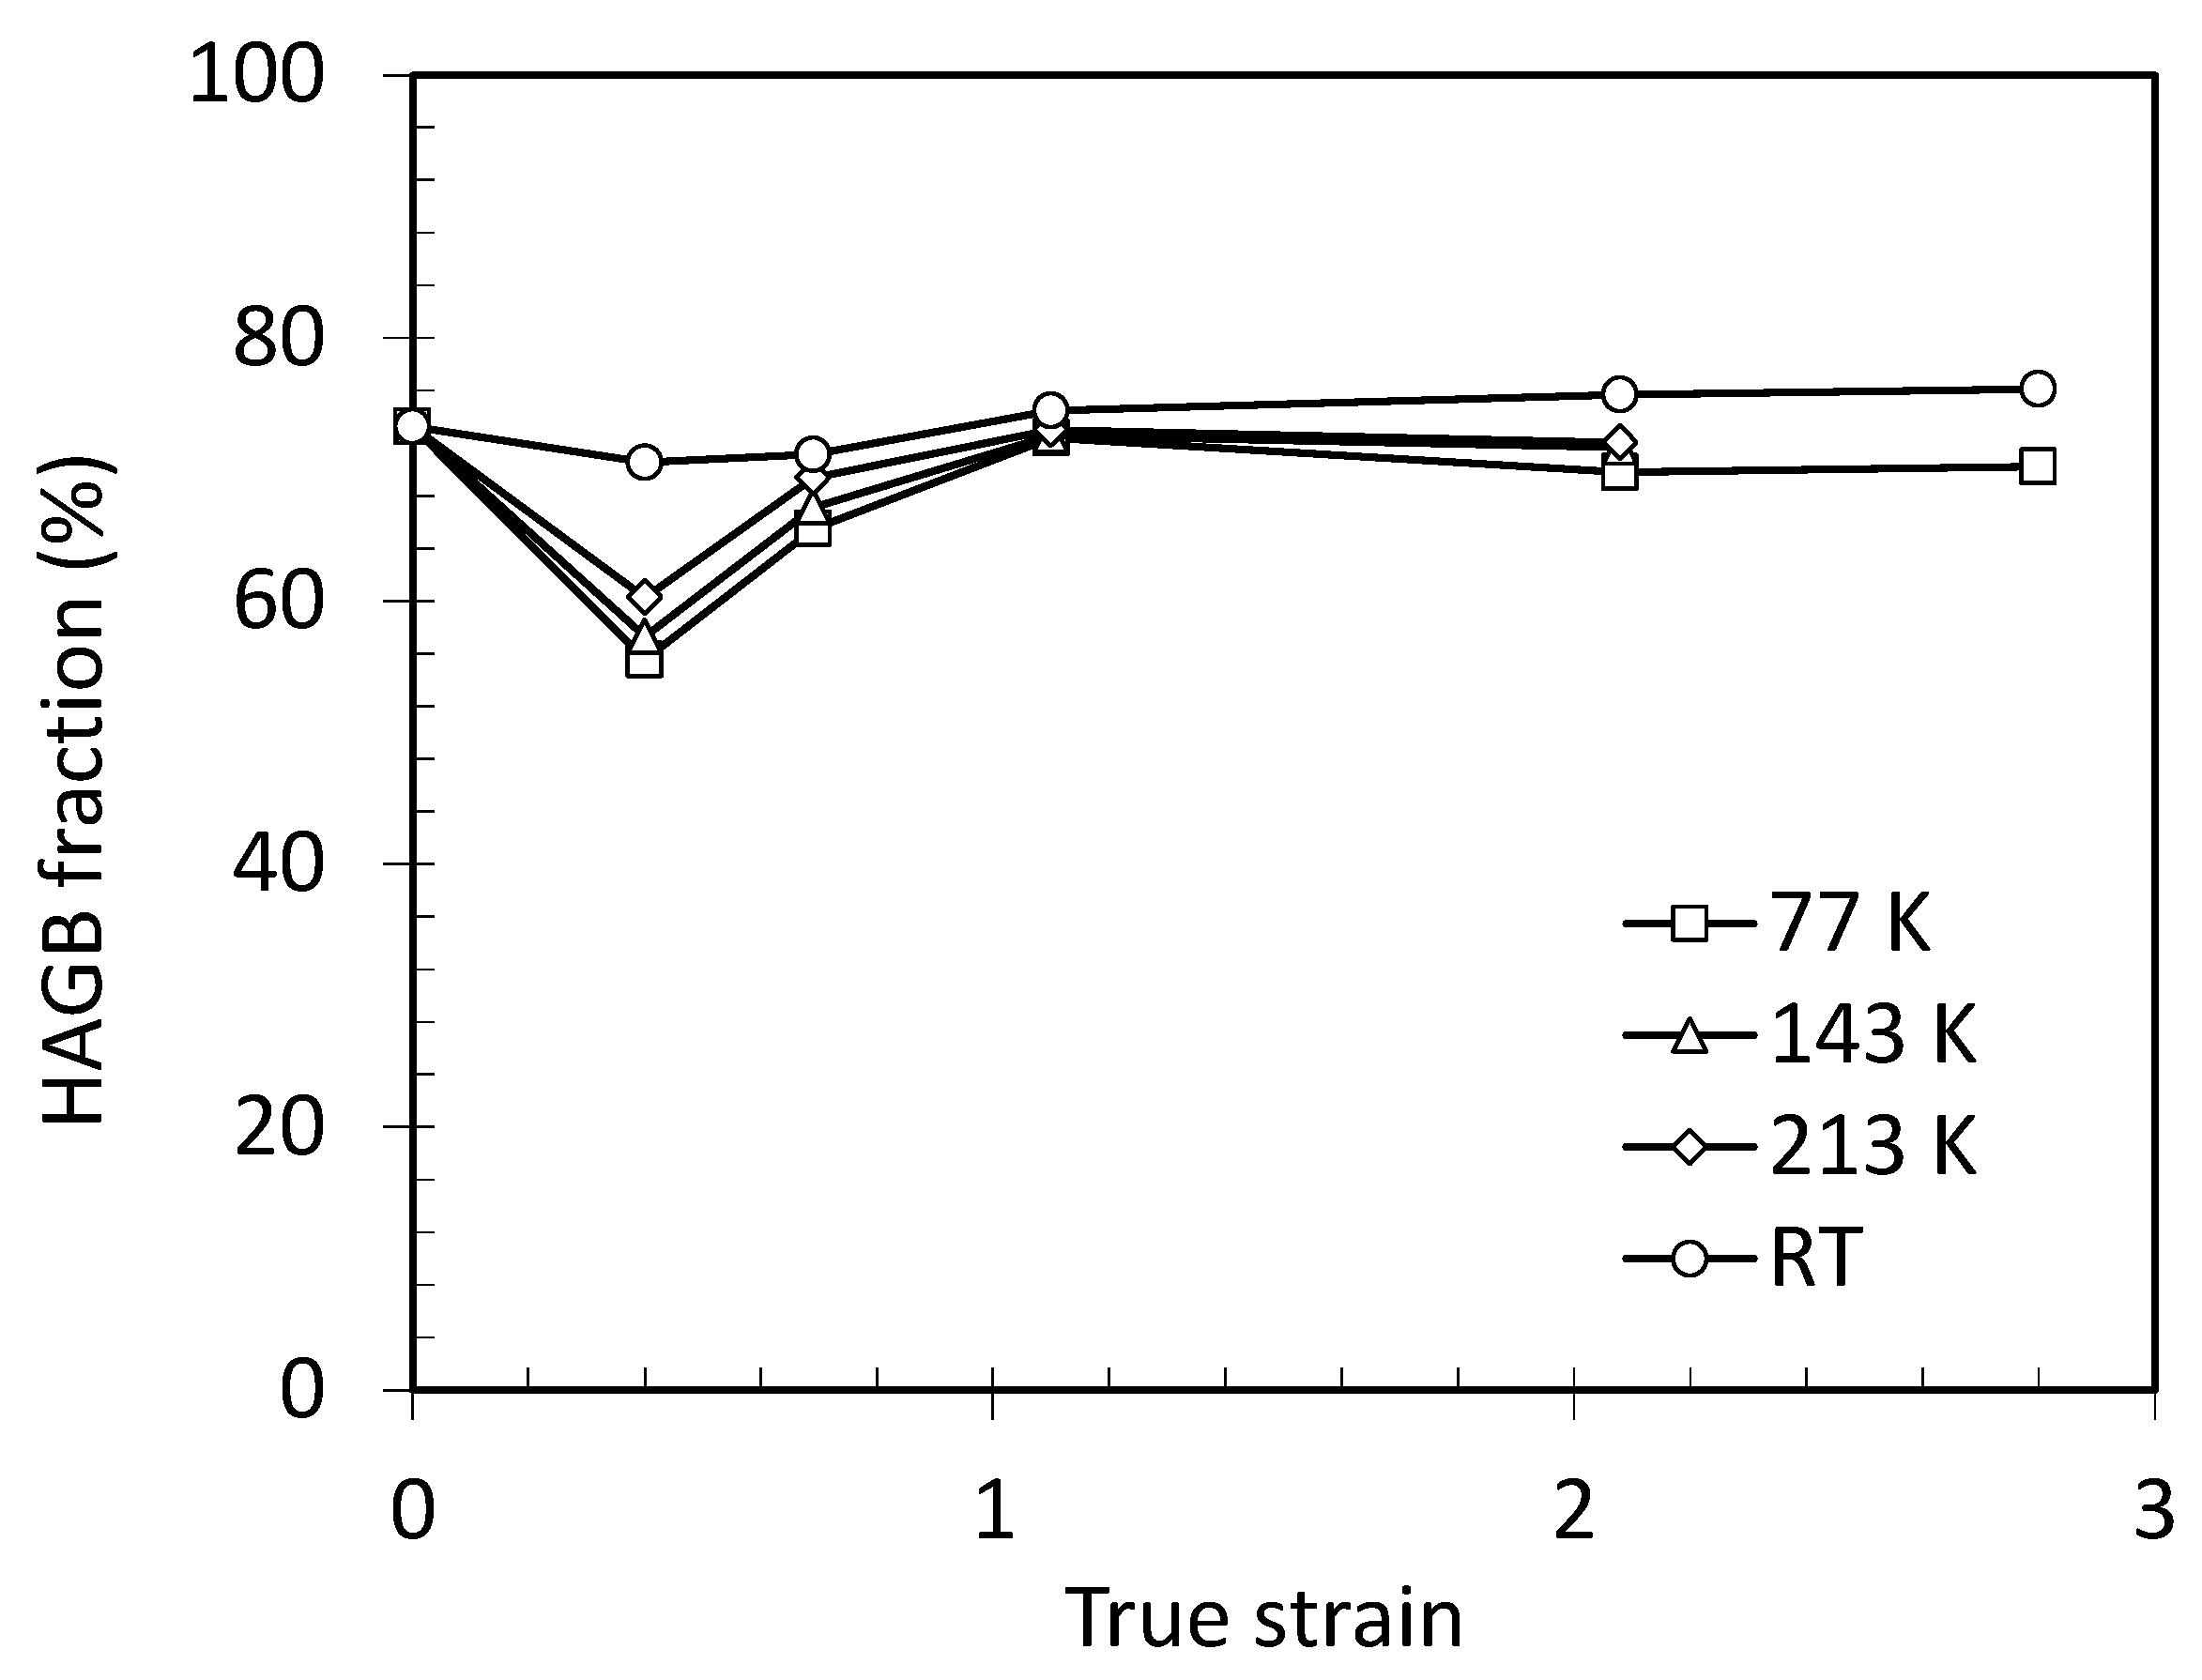
Steady state deformation is established after a certain strain at all the temperatures investigated and is characterized by a constant average grain size and constant average high angle boundary area fraction.
(4)
For a given temperature and strain rate, the steady state grain size is the limit of grain refinement.
(5)
The temperature dependence of steady state grain boundary kinetics cannot be explained by thermally activated processes and grain boundary dislocation operation is suggested to explain the constant grain size and misorientation at steady state.

Author Contributions

The authors have equal contributions to the conceptualization, investigation and data curation and analysis and writing and editing; funding acquisition and management. Conceptualization, Y.H. and J.J.; Data curation, Y.H. and J.J.; Investigation, Y.H.; Methodology, Y.H.; Writing—original draft, Y.H.; Writing—review & editing, Y.H. and J.J. All authors have read and agreed to the published version of the manuscript.

Funding

This research was funded by EPSRC Future LiME Hub (EP/N007638/1).

Institutional Review Board Statement

Not applicable.

Informed Consent Statement

Not applicable.

Data Availability Statement

Original data are available upon request.

Acknowledgments

The authors would like to acknowledge the financial support of the EPSRC Future LiME Hub (EP/N007638/1) for this investigation.

Conflicts of Interest

The authors declare no conflict of interest.

References

  1. Valiev, R.Z.; Estrin, Y.; Horita, Z.; Langdon, T.G.; Zehetbauer, M.J.; Zhu, Y. Producing bulk ultrafine-grained materials by severe plastic deformation: Ten years later. JOM 2016, 68, 1216–1226. [Google Scholar] [CrossRef] [Green Version]
  2. Segal, V.M. Engineering and commercialization of equal channel angular extrusion (ECAE). Mater. Sci. Eng. A. 2004, 386, 269–276. [Google Scholar] [CrossRef]
  3. Khelfa, T.; Muñoz-Bolaños, J.A.; El-Hafez, H.A.; Alawad, M.O.; El-Garaihy, W.H. Experimental and numerical investigation of the ECAP processed copper: Microstructural evolution, crystallographic texture and hardness homogeneity. Met. Mater. Int. 2020, 26, 12471261. [Google Scholar]
  4. Huang, Y. Steady State and a General Scale Law of Deformation; IOP Conference Series: Materials Science and Engineering; Institute of Physics: Copenhagen, Denmark, 2017; Volume 219, p. 012029. [Google Scholar]
  5. Prangnell, P.B.; Huang, Y.; Berta, M.; Apps, P.J. Mechanisms of formation of submicron grain structures by severe plastic deformation. In Proc Int Symp on Fundamentals of Deformation and Annealing; Prangnell, P.B., Bate, P.S., Eds.; Trans Tech Publications Ltd.: Stafa-Zurich, Switzerland, 2007; pp. 159–168. [Google Scholar]
  6. Liu, F.; Fa, T.; Chen, P.H.; Wang, J.T. Steady-state characteristics of fcc pure metals processed by severe plastic deformation: Experiments and modelling. Philos. Mag. 2020, 100, 62–83. [Google Scholar] [CrossRef]
  7. Börner, I.; Eckert., J. Nanostructure formation and steady-state grain size of ball-milled iron powders. Mater. Sci. Eng. A 1997, 226–228, 541–552. [Google Scholar] [CrossRef]
  8. Amram, D.; Schuh, C. Mechanical alloying produces grain boundary segregation in Fe–Mg powders. Scr. Mater. 2020, 180, 57–61. [Google Scholar] [CrossRef]
  9. Jazaeri, H.; Humphreys, F.J. The effect of initial grain size on the microstructures developed during cold rolling of a single-phase aluminium alloy. Acta Mater. 2004, 52, 3239–3250. [Google Scholar] [CrossRef]
  10. Wang, Y.M.; Ma, E.; Chen, M.W. Enhanced tensile ductility and toughness in nanostructured Cu. Appl. Phys. Lett. 2002, 80, 2395–2397. [Google Scholar] [CrossRef]
  11. Magalhães, D.C.C.; Kliauga, A.M.; Ferrante, M.; Sordi, V.L. Plastic deformation of FCC alloys at cryogenic temperature: The effect of stacking-fault energy on microstructure and tensile behaviour. J. Mater. Sci. 2017, 52, 7466–7478. [Google Scholar] [CrossRef]
  12. Dhal, A.; Panigrahi, S.K.; Shunmugam, M.S. Insight into the microstructural evolution during cryo-severe plastic deformation and post-deformation annealing of aluminum and its alloys. J. Alloys Compd. 2017, 726, 1205–1219. [Google Scholar] [CrossRef]
  13. Yin, X.; Pi, Y.; He, D.; Jiayang, Z.; Wenjun, D. Development of ultrafine grained Al 7075 by cryogenic temperature large strain extrusion machining. J. Mater. Res. 2018, 33, 3449–3457. [Google Scholar] [CrossRef]
  14. Wang, Y.M.; Chen, W.M.; Zhou, F.; Ma, E. High tensile ductility in a nanostructured metal. Nature 2002, 419, 912–915. [Google Scholar] [CrossRef] [PubMed]
  15. Hayes, R.W.; Rodriguez, R.; Lavernia, E.J. The mechanical behavior of a cryomilled Al–10Ti–2Cu alloy. Acta Mater. 2001, 49, 4055–4064. [Google Scholar] [CrossRef]
  16. Wang, T.S.; Peng, J.G.; Gao, Y.W.; Zhang, F.C.; Jing, T.F. Microstructure of 1Cr18Ni9Ti stainless steel by cryogenic compression deformation and annealing. Mater. Sci. Eng. A. 2005, 407, 84–93. [Google Scholar] [CrossRef]
  17. Zhao, Y.H.; Bingert, J.F.; Liao, X.Z.; Cui, B.Z.; Han, K.; Sergueeva, A.V.; Mukherjee, A.K.; Valiev, R.Z.; Langdon, T.G.; Zhu, Y.T. Simultaneously Increasing the Ductility and Strength of Ultra-Fine-Grained Pure Copper. Adv Mater. 2006, 18, 2949–2953. [Google Scholar] [CrossRef]
  18. Apps, P.J.; Berta, M.; Prangnell, P.B. Stability of Ultra-Fine ‘Grain Structures’ Produced by Severe Deformation. Acta Mater. 2005, 53, 499–510. [Google Scholar] [CrossRef]
  19. Segal, V.M.; Reznikov, V.I.; Drobyshevskiy, A.E.; Kopylov, V.I. Plastic metal working by simple shear. Russ. Metall. 1981, 1, 99–105. [Google Scholar]
  20. Gholinia, A.; Bate, S.P.; Prangnell, P.B. Modelling texture development during equal channel angular extrusion of aluminium. Acta Mater. 2002, 50, 2121–2236. [Google Scholar] [CrossRef]
  21. Prangnell, P.B.; Hayes, J.S.; Bowen, J.R.; Apps, P.J.; Bate, P.S. Continuous recrystallisation of lamellar deformation structures produced by severe deformation. Acta Mater. 2004, 52, 3193–3206. [Google Scholar] [CrossRef]
  22. Basson, F.; Driver, J.H. Deformation banding mechanisms during plane strain compression of cube-oriented fcc crystals. Acta Mater. 2000, 48, 2101–2115. [Google Scholar] [CrossRef]
  23. Humphreys, F.J.; Hatherley, M. Recrystallization and related annealing phenomena, 2nd ed.; Elsevier: Oxford, UK, 2002. [Google Scholar]
Figure 1. EBS image (a) and EBSD map (b), showing the UFG structure of the Al-0.1Mg alloy after 15 passes ECAE processing at room temperature. The extrusion direction (ED) is vertical.
Metals 11 01822 g001
Figure 2. EBS images showing the UFG structures on the TD plane developed during PSC at room temperature to a true strain of 1.1 (a,b) and 2.1 (c,d), following 15 passes ECAE. The compression direction is vertically aligned.
Metals 11 01822 g002
Figure 3. EBS images showing the microstructures on the TD plane obtained after PSC to a true strain of 2.1 at 215 K (a,b), 130 K (c,d) and 77 K (e,f). The compression direction is horizontal.
Metals 11 01822 g003
Figure 4. Example EBSD maps showing the submicron grained Al-0.13%Mg alloy deformed by PSC to a true strain of 2.1 at (a) 298 K, (b) 213 K, (c) 143 K and (d) 77 K. Note the different magnifications used in the EBSD maps and RD is horizontal.
Metals 11 01822 g004
Figure 5. High angle boundary ND spacing (λND), grain width, as a function of PSC strain at different temperatures.
Metals 11 01822 g005
Figure 6. Evolution of high angle grain boundary area fraction as a function of strain and temperature during PSC.
Metals 11 01822 g006
Figure 7. EBSD maps showing (a) grain structure within macroshear bands after PSC at room temperature to a strain of 1.1 and (b) the relatively high fraction of LABs in the early stages of PSC deformation at 77 K to a strain of 0.4.
Metals 11 01822 g007
Figure 8. Estimated boundary migration rate at steady state (assuming that constant grain coarsening is responsible for the steady state grain size) as a function of temperature.
Metals 11 01822 g008
Figure 9. Overall texture volume fraction and the loss of lamellar HABs calculated according to the difference between the measured and geometrically predicted HAB spacing at 77 K.
Metals 11 01822 g009
Table 1. Grain aspect ratio after PSC as a function of temperature and strain.
Temperature (K)Aspect Ratio *
ε = 0ε = 0.4ε = 0.69ε = 1.1ε = 2.1ε = 2.8
772.3 ± 0.545.42 ± 0.669.76 ± 0.8214.2 ± 1.1519.8 ± 0.7623.7 ± 0.84
1432.3 ± 0.544.69 ± 0.838.62 ± 1.1110.64 ± 1.2712.36 ± 1.06-
2132.3 ± 0.544.36 ± 1.137.05 ± 1.048.09 ± 1.419.04 ± 1.22-
2932.3 ± 0.541.97 ± 0.681.94 ± 0.712.04 ± 0.552.08 ± 0.722.11 ± 0.67
* Measured manually to avoid errors that could occur by automatic calculation using EBSD data as the elongated grains were not strictly aligned along the RD direction. 100–120 grains were counted for each measurement.
Table 2. Texture development, based on EBSD measurement, as a function of strain during PSC at 77 K.
Texture ComponentTexture Volume Fraction (%) *
ε = 0ε = 0.4ε = 0.69ε = 1.1ε = 2.1ε = 2.8
Brass {110}<112>1.92 ± 1.417.72 ± 2.088.66 ± 3.2210.78 ± 2.5416.99 ± 3.6530.30 ± 5.45
Copper {112}<111>3.41 ± 0.8621.42 ± 3.7728.78 ± 4.0528.87 ± 6.2629.61 ± 4.249.87 ± 3.16
S {123}<634>6.28 ± 2.2422.15 ± 4.6528.02 ± 3.1634.41 ± 5.8741.22 ± 5.6651.2 ± 6.28
R-cube {001}<110>7.87 ± 1.811.46 ± 0.660.87 ± 0.430.030.010.15
Goss {110}<100>0.44 ± 0.3511.2 ± 3.128.64 ± 1.902.28 ± 1.062.78 ± 1.880
* An orientation deviation of ±15° from ideal texture component is allowed in the calculation.
Publisher’s Note: MDPI stays neutral with regard to jurisdictional claims in published maps and institutional affiliations.

