Article

Implementation of the Chicot–Lesage Composite Hardness Model in a Determination of Absolute Hardness of Copper Coatings Obtained by the Electrodeposition Processes

by
Ivana O. Mladenović
1,
Jelena S. Lamovec
2,
Dana G. Vasiljević-Radović
1,
Rastko Vasilić
3,
Vesna J. Radojević
4 and
Nebojša D. Nikolić
1,*
1
Institute of Chemistry, Technology and Metallurgy, University of Belgrade, Njegoševa 12, 11 000 Belgrade, Serbia
2
University of Criminal Investigation and Police Studies, Cara Dušana 196, Zemun, 11 000 Belgrade, Serbia
3
Faculty of Physics, University of Belgrade, Studentski Trg 12-16, 11 000 Belgrade, Serbia
4
Faculty of Technology and Metallurgy, University of Belgrade, Karnegijeva 4, 11 000 Belgrade, Serbia
*
Author to whom correspondence should be addressed.
Metals 2021, 11(11), 1807; https://doi.org/10.3390/met11111807
Submission received: 18 October 2021 / Revised: 30 October 2021 / Accepted: 8 November 2021 / Published: 10 November 2021
(This article belongs to the Special Issue Advances in Understanding Metal Electrolysis Processes)

Abstract

:
The influence of various electrolysis parameters, such as the type of cathode, composition of the electrolyte and electrolysis time, on the morphology, structure and hardness of copper coatings has been investigated. Morphology and structure of the coatings were analyzed by scanning electron microscope (SEM), atomic force microscope (AFM) and X-ray diffraction (XRD), while coating hardness was examined by Vickers microindentation test applying the Chicot–Lesage (C–L) composite hardness model. Depending on the conditions of electrolysis, two types of Cu coatings were obtained: fine-grained mat coatings with a strong (220) preferred orientation from the sulfate electrolyte and smooth mirror bright coatings with a strong (200) preferred orientation from the electrolyte with added leveling/brightening additives. The mat coatings showed larger both measured composite and calculated coating hardness than the mirror bright coatings, that can be explained by the phenomena on boundary among grains. Independent of electrolysis conditions, the critical relative indentation depth (RID) of 0.14 was established for all types of the Cu coatings, separating the zone in which the composite hardness can be equaled with the coating hardness and the zone requiring an application of the C–L model for a determination of the absolute hardness of the Cu coatings.

1. Introduction

Copper is widely used in many industrial branches involving aerospace, automotive, electronics and telecommunications [1]. Its application in these industries is due to the specific characteristics of this metal, such as high thermal and electrical conductivity, malleability, corrosion resistance and good adhesion with a substrate. Various methods, such as electrodeposition, electroless plating, chemical vapor deposition (CVD), physical vapor deposition (PVD), thermal spray and sputtering techniques, are the most often used for obtaining Cu in a compact form on different conductive or non-conductive substrates [2,3].
Among all these methods, electrodeposition technique is advantageous for production of compact and uniform copper coatings suitable for above mentioned purposes. This is a low-cost technique, mainly requiring room temperature, it is environmentally friendly, time saving and facile [4]. Another advantage of this method over all other methods also lies in easy control of the quality and thickness of coatings by a simple selection of regimes and parameters of electrodeposition [5]. The compact and uniform Cu coatings of technological significance are obtained using both constant galvanostatic regime (DC mode) and various current pulse reverse regimes. For DC regime, the main parameters determining the quality of the coatings are the current density applied, kind and composition of electrolytes which also include the presence of specific substances (additives) in them, the type of cathode, stirring of electrolyte and time of electrodeposition. The quality of coatings obtained by the application of various pulse reverse regimes is primarily determined by parameters defining these regimes, such as current density amplitude, deposition time and pause duration for the pulsating current (PC) regime, cathodic and anodic current densities, and cathodic and anodic times for the reversing current (RC) regimes [5]. The coatings obtained by pulse reverse regimes usually have lower porosity and more compact structure than those obtained in DC mode. Effects on morphology of the metal deposits obtained by use of various pulse reverse regimes approach to those obtained by electrodeposition in the DC mode from electrolytes with added leveling/brightening additives. The largest lack of pulse reverse regimes for massive use is high cost of pulse rectifiers, which is considerably higher than the DC units [6].
One of the challenges in analysis of mechanical characteristics of metal coatings is the determination of their absolute (or real) hardness. In order to obtain absolute hardness of the coating, it is necessary to eliminate any contribution of substrate (cathode) hardness on a measured (composite) hardness of the coating. It can be done by using either very low indentation loads or by application of various composite hardness models, such as the Chicot–Lesage [7,8,9,10], Korsunsky [11,12,13,14], Chen–Gao [15,16,17,18], Burnett–Rickerby (B–R) [19,20], etc. Each of these two methods has its pros and cons. For example, the use of low indentation loads can cause a huge error when reading diagonal size after indentation. On the other hand, the substrate/coating hardness ratio strongly affects the determination of the absolute hardness of the coating making the choice of the composite hardness models very important. Some of these models are adjusted for “soft film on hard substrate” composite system like the Chen–Gao [15,16,17,18] and the Chicot–Lesage (C–L) [7,8,9,10], while others like Korsunsky [11,12,13,14] are adjusted for “hard film on soft substrate” composite hardness system.
During hardness analysis of the Cu coatings electrodeposited by the PC regime on Si(111), the calculated values of the coating hardness by the C–L model were multiple times larger than the composite hardness at the applied low indentation loads [21]. The similar situation was also observed during the hardness analysis of Cu coatings of various thicknesses electrodeposited by the same regime on the brass substrate [22]. For Cu coatings electrodeposited on the brass, this anomaly was successfully solved by defining a limiting or critical relative indentation depth (RID) value of 0.14 which separates the area in which a composite hardness corresponds to the absolute hardness of the coating and the area where application of the composite hardness model was necessary for the determination of the absolute coating hardness. The establishment of this critical or limiting value indicates a successful implementation of the C–L model in a determination of an absolute hardness of the copper coatings. Regarding this fact, the further analysis of Cu coatings was necessary with the aim to establish whether this critical or limiting value has universal character and can be applicable for other Cu coatings. For that reason, we continue this investigation type and analyze the copper coatings obtained under various electrodeposition conditions by application of the C–L model.

2. Materials and Methods

2.1. Production of the Cu Coatings by Electrodeposition

Electrodeposition of copper was performed by a galvanostatic regime of electrolysis (DC mode) at a current density (j) of 50 mA cm−2 from the acid sulfate electrolyte (the basic electrolyte) and from an electrolyte with addition of leveling and brightening additives that enable a formation of Cu coatings with mirror bright appearance [23,24]. The compositions of electrolytes were
(a)
the basic electrolyte: 240 g L−1 CuSO4·5 H2O in 60 g L−1 H2SO4 (electrolyte I), and
(b)
the electrolyte with additives: 240 g L−1 CuSO4∙5H2O, 60 g L−1 H2SO4, 0.124 g L−1 NaCl, 1 g L−1 PEG 6000 (polyethylene glycol), 0.0015 g L−1 MPSA (3–Mercapto–1–propanesulfonic acid) (electrolyte II).
All electrodepositions were performed in an open cell of cylindrical shape with an electrolyte temperature of 22.0 ± 0.50 °C. Two types of cathodes were used: Si(111), and brass (2601/2 hard, ASTM B36, K&S Engineering). The preparation of Si(111) and brass cathodes for copper electrodeposition is described in previously published papers [21,22]. The cathodes of (1.0 × 1.0) cm2 surface area were positioned in the center of the cell. In all experiments, the copper anode positioned close to wall of the cell was used. The high purity water (Milipore, 18 MΩ cm) and p.a. reagents were used for a preparation of the electrolytes. The mixing of electrolyte was performed using magnetic stirrer (MS; 100 rpm). The thicknesses of electrodeposited Cu coatings were either 20 or 40 µm. The mechanical comparator with electronic reader on display (model: Iskra, type: NP37 (Iskra Avtomatica, Ljubljana, Slovenia) was used to measure the coating thickness. The accuracy of the vertical shift was ±1 µm.
All working conditions applied for a production of uniform Cu coatings are summarized in Table 1.

2.2. Morphological and Structural Analysis of the Electrolytically Produced Cu Coatings

The copper coatings obtained under various conditions of the electrodeposition were characterized by application of the following techniques:
(a)
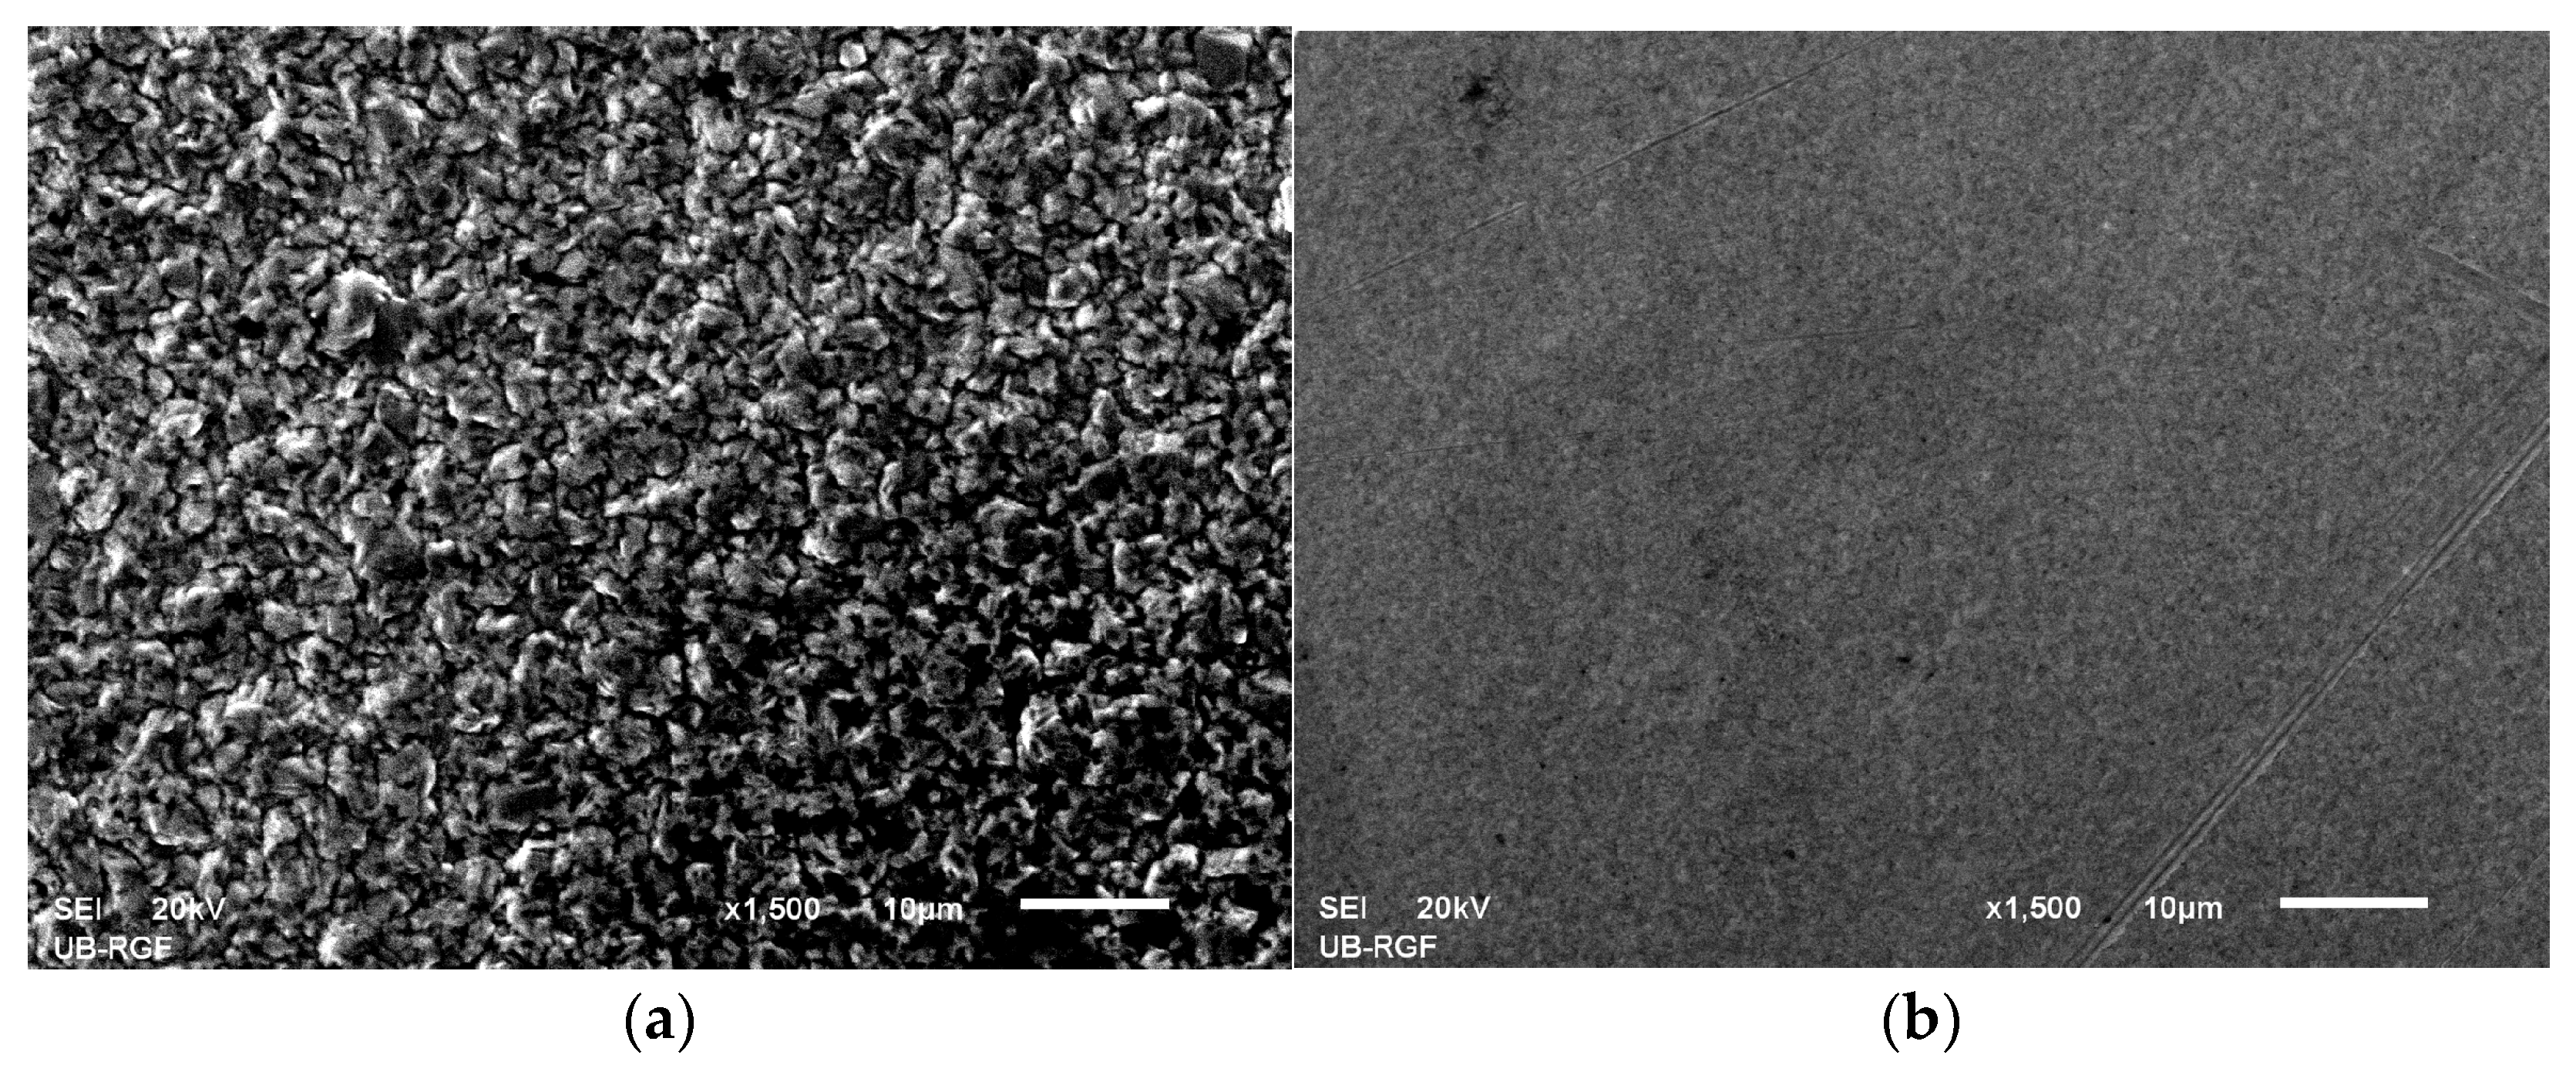
Scanning electron microscope (SEM): morphology of the electrolytically obtained Cu coatings was examined using JEOL JSM-6610LV (JEOL Ltd., Tokyo, Japan).
(b)
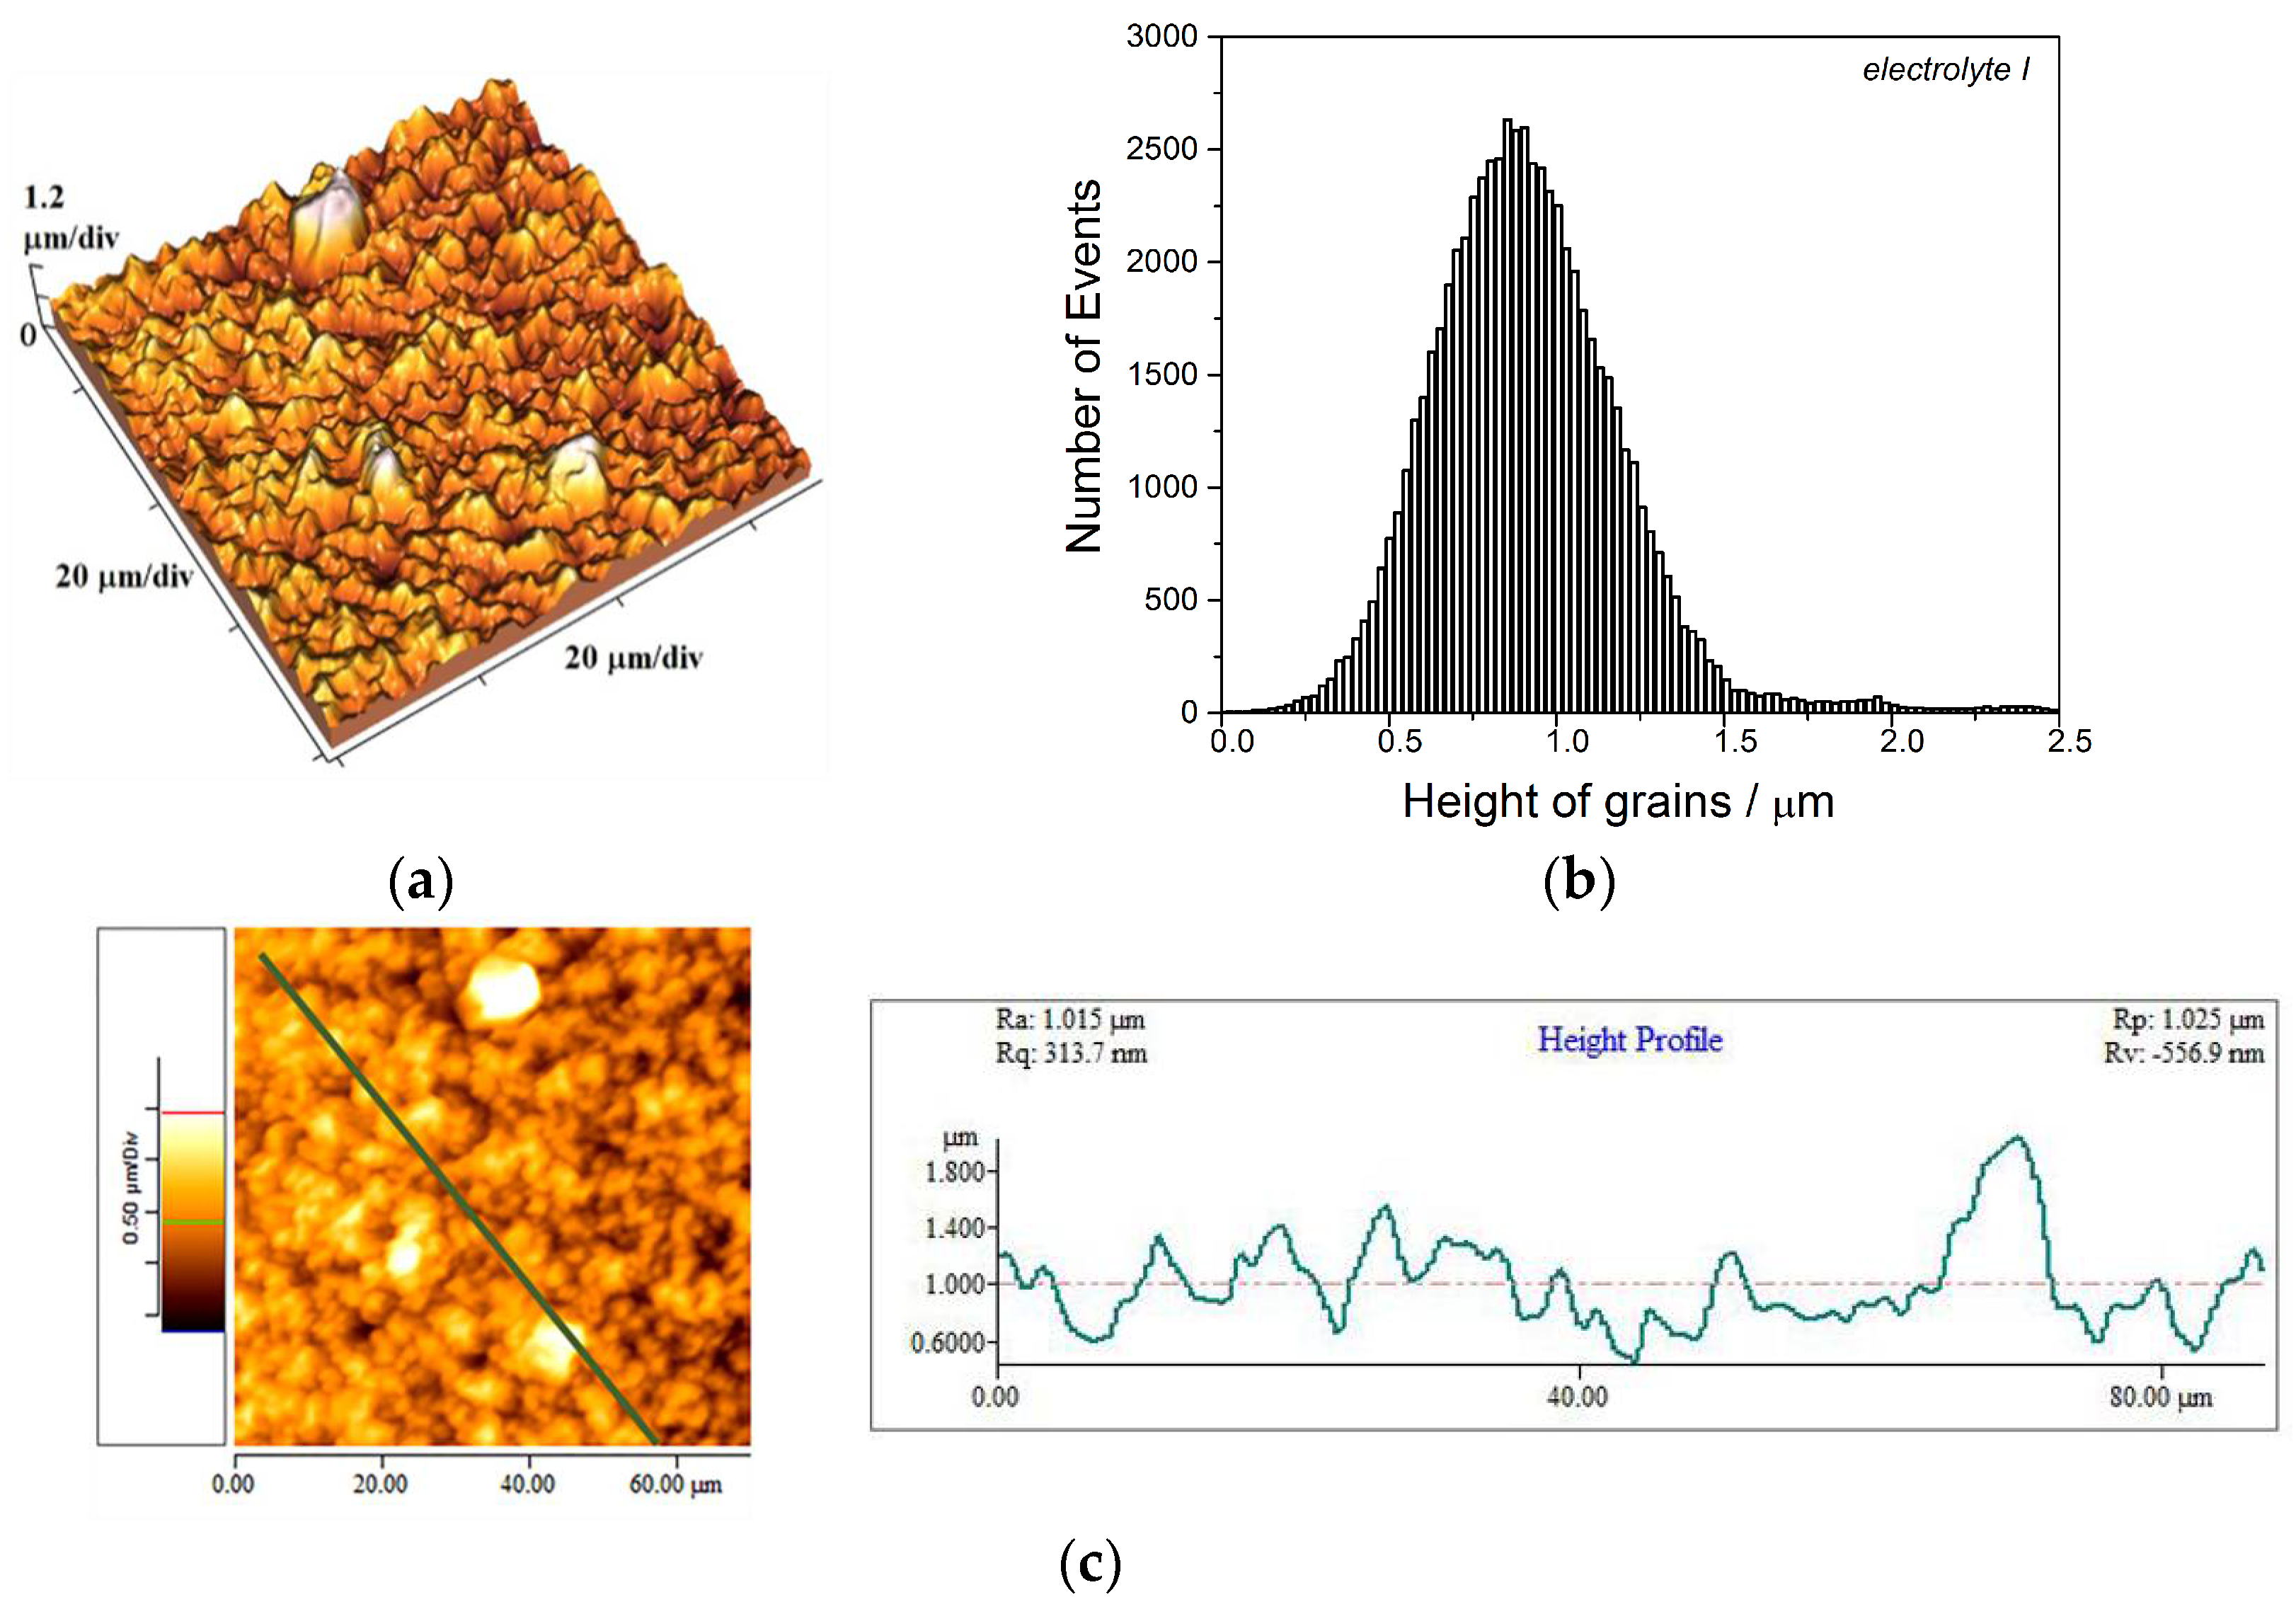
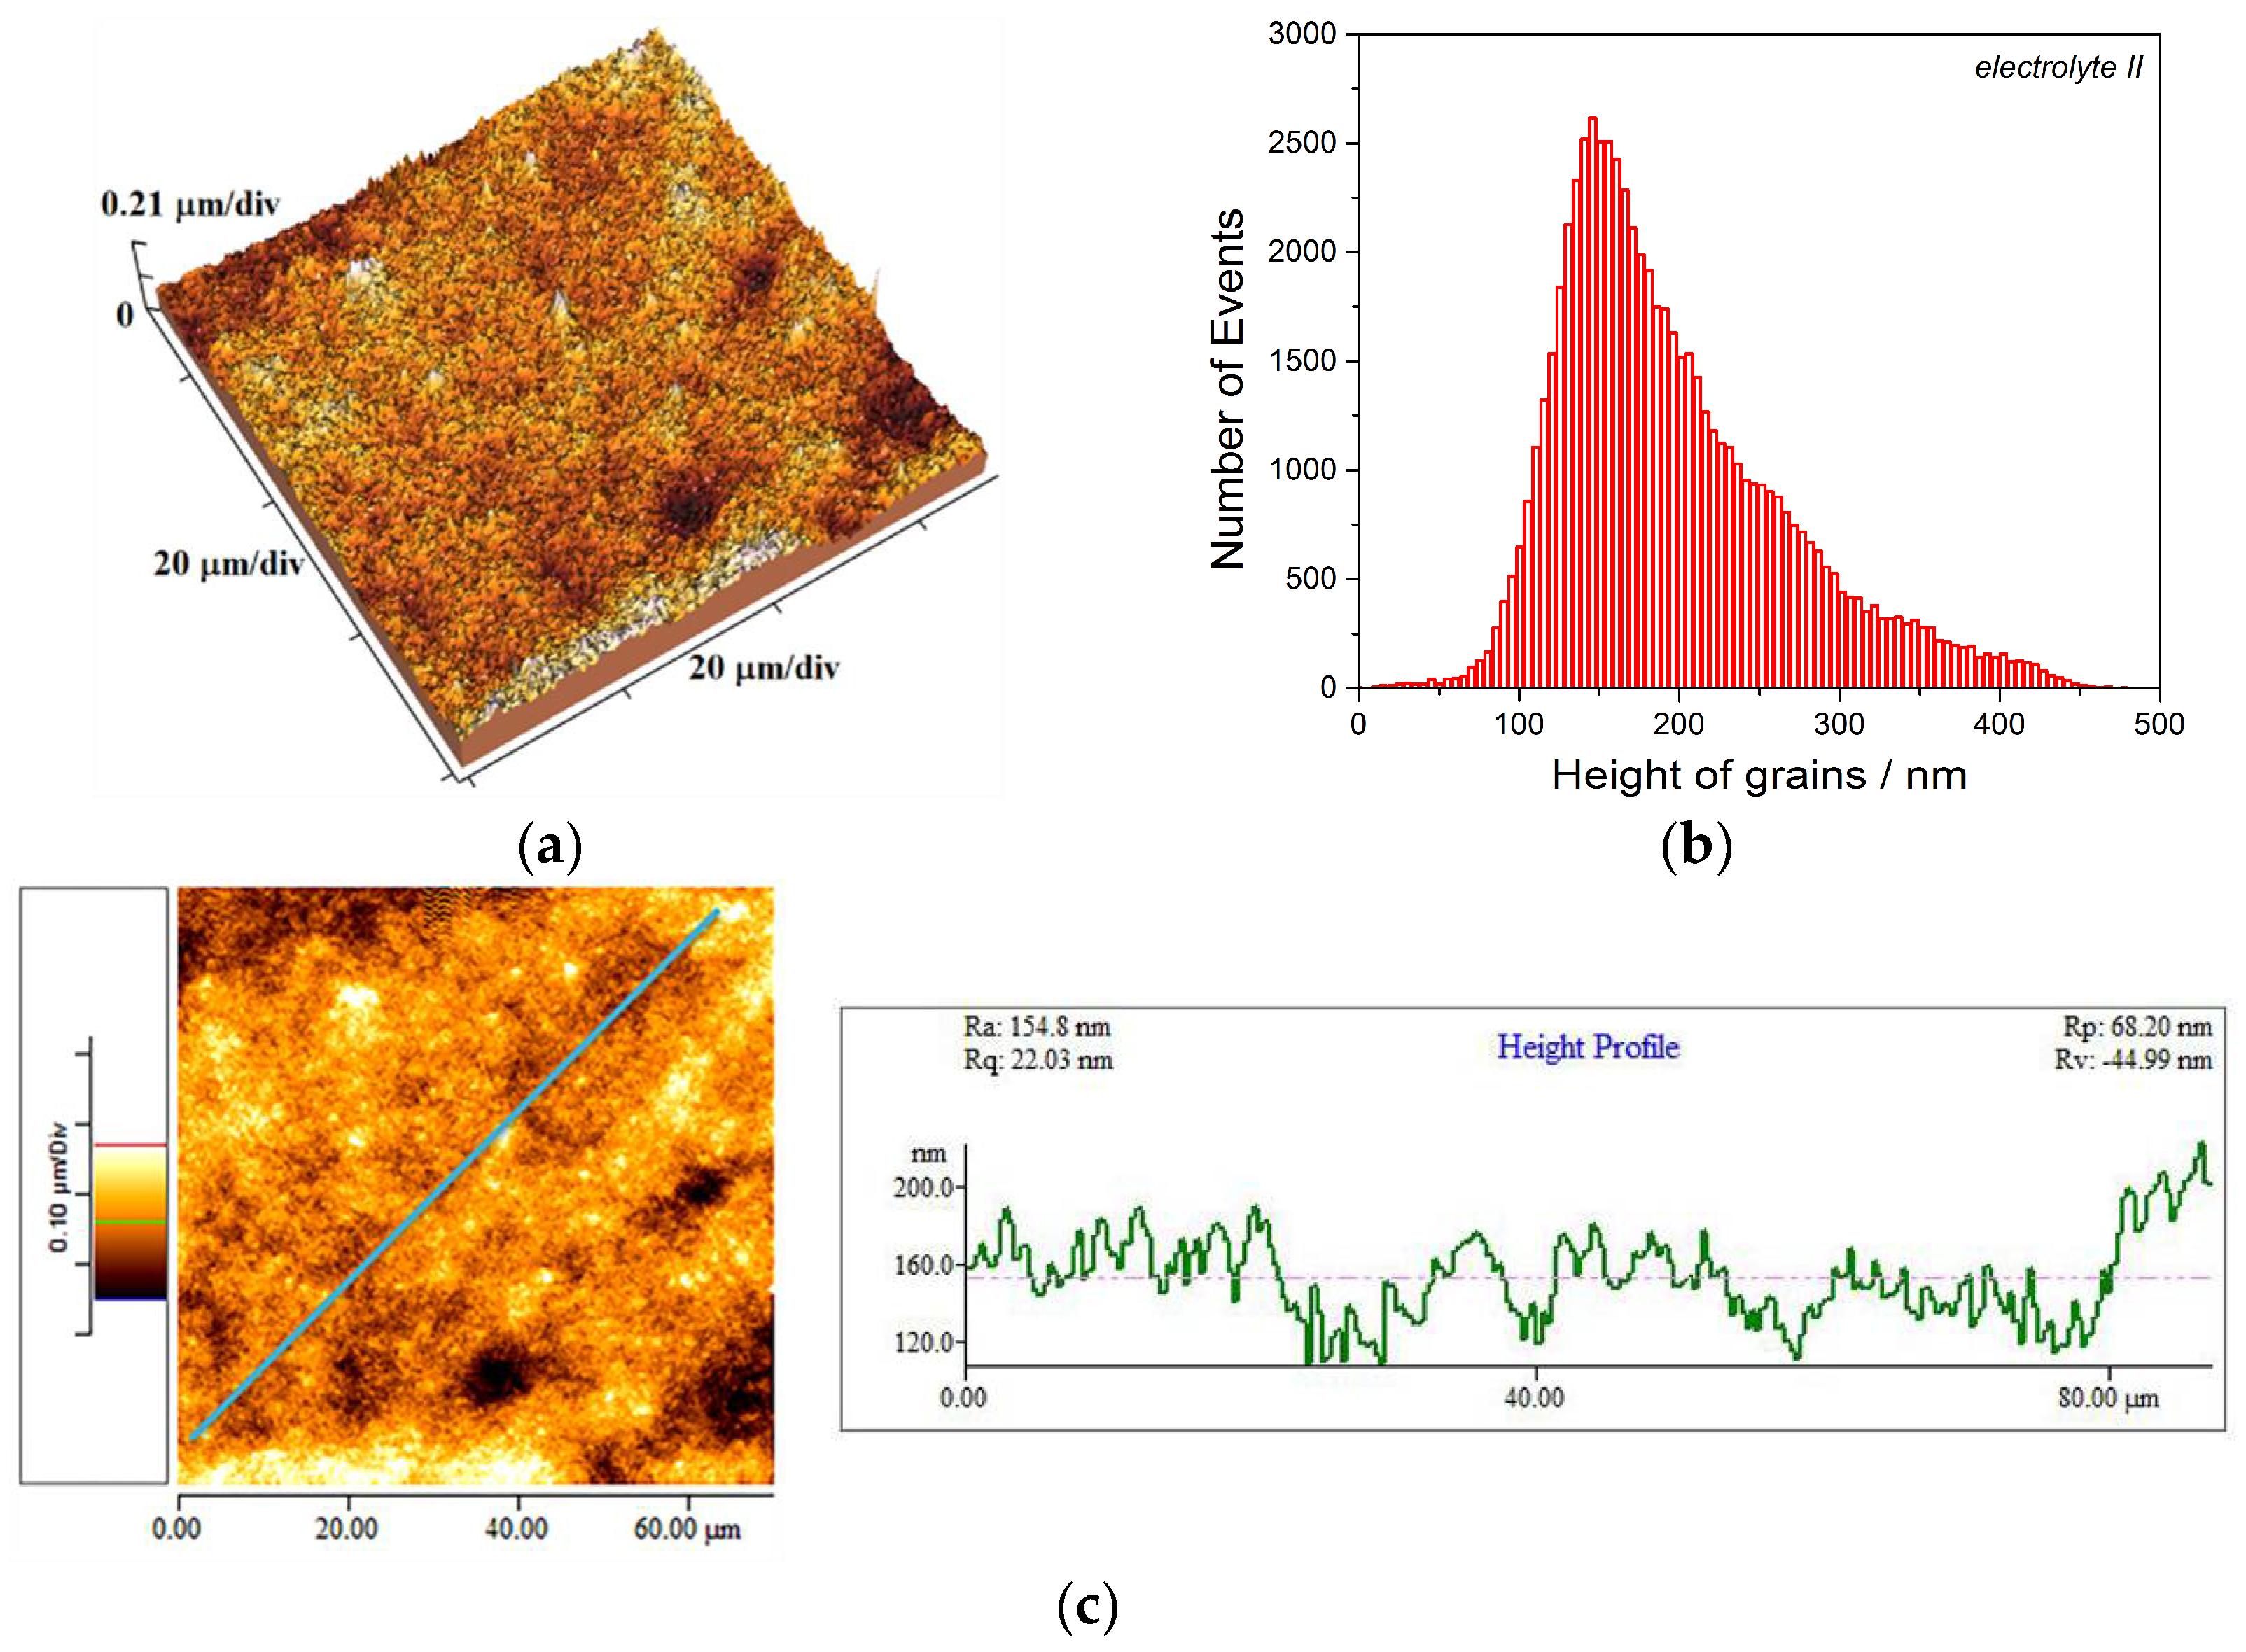
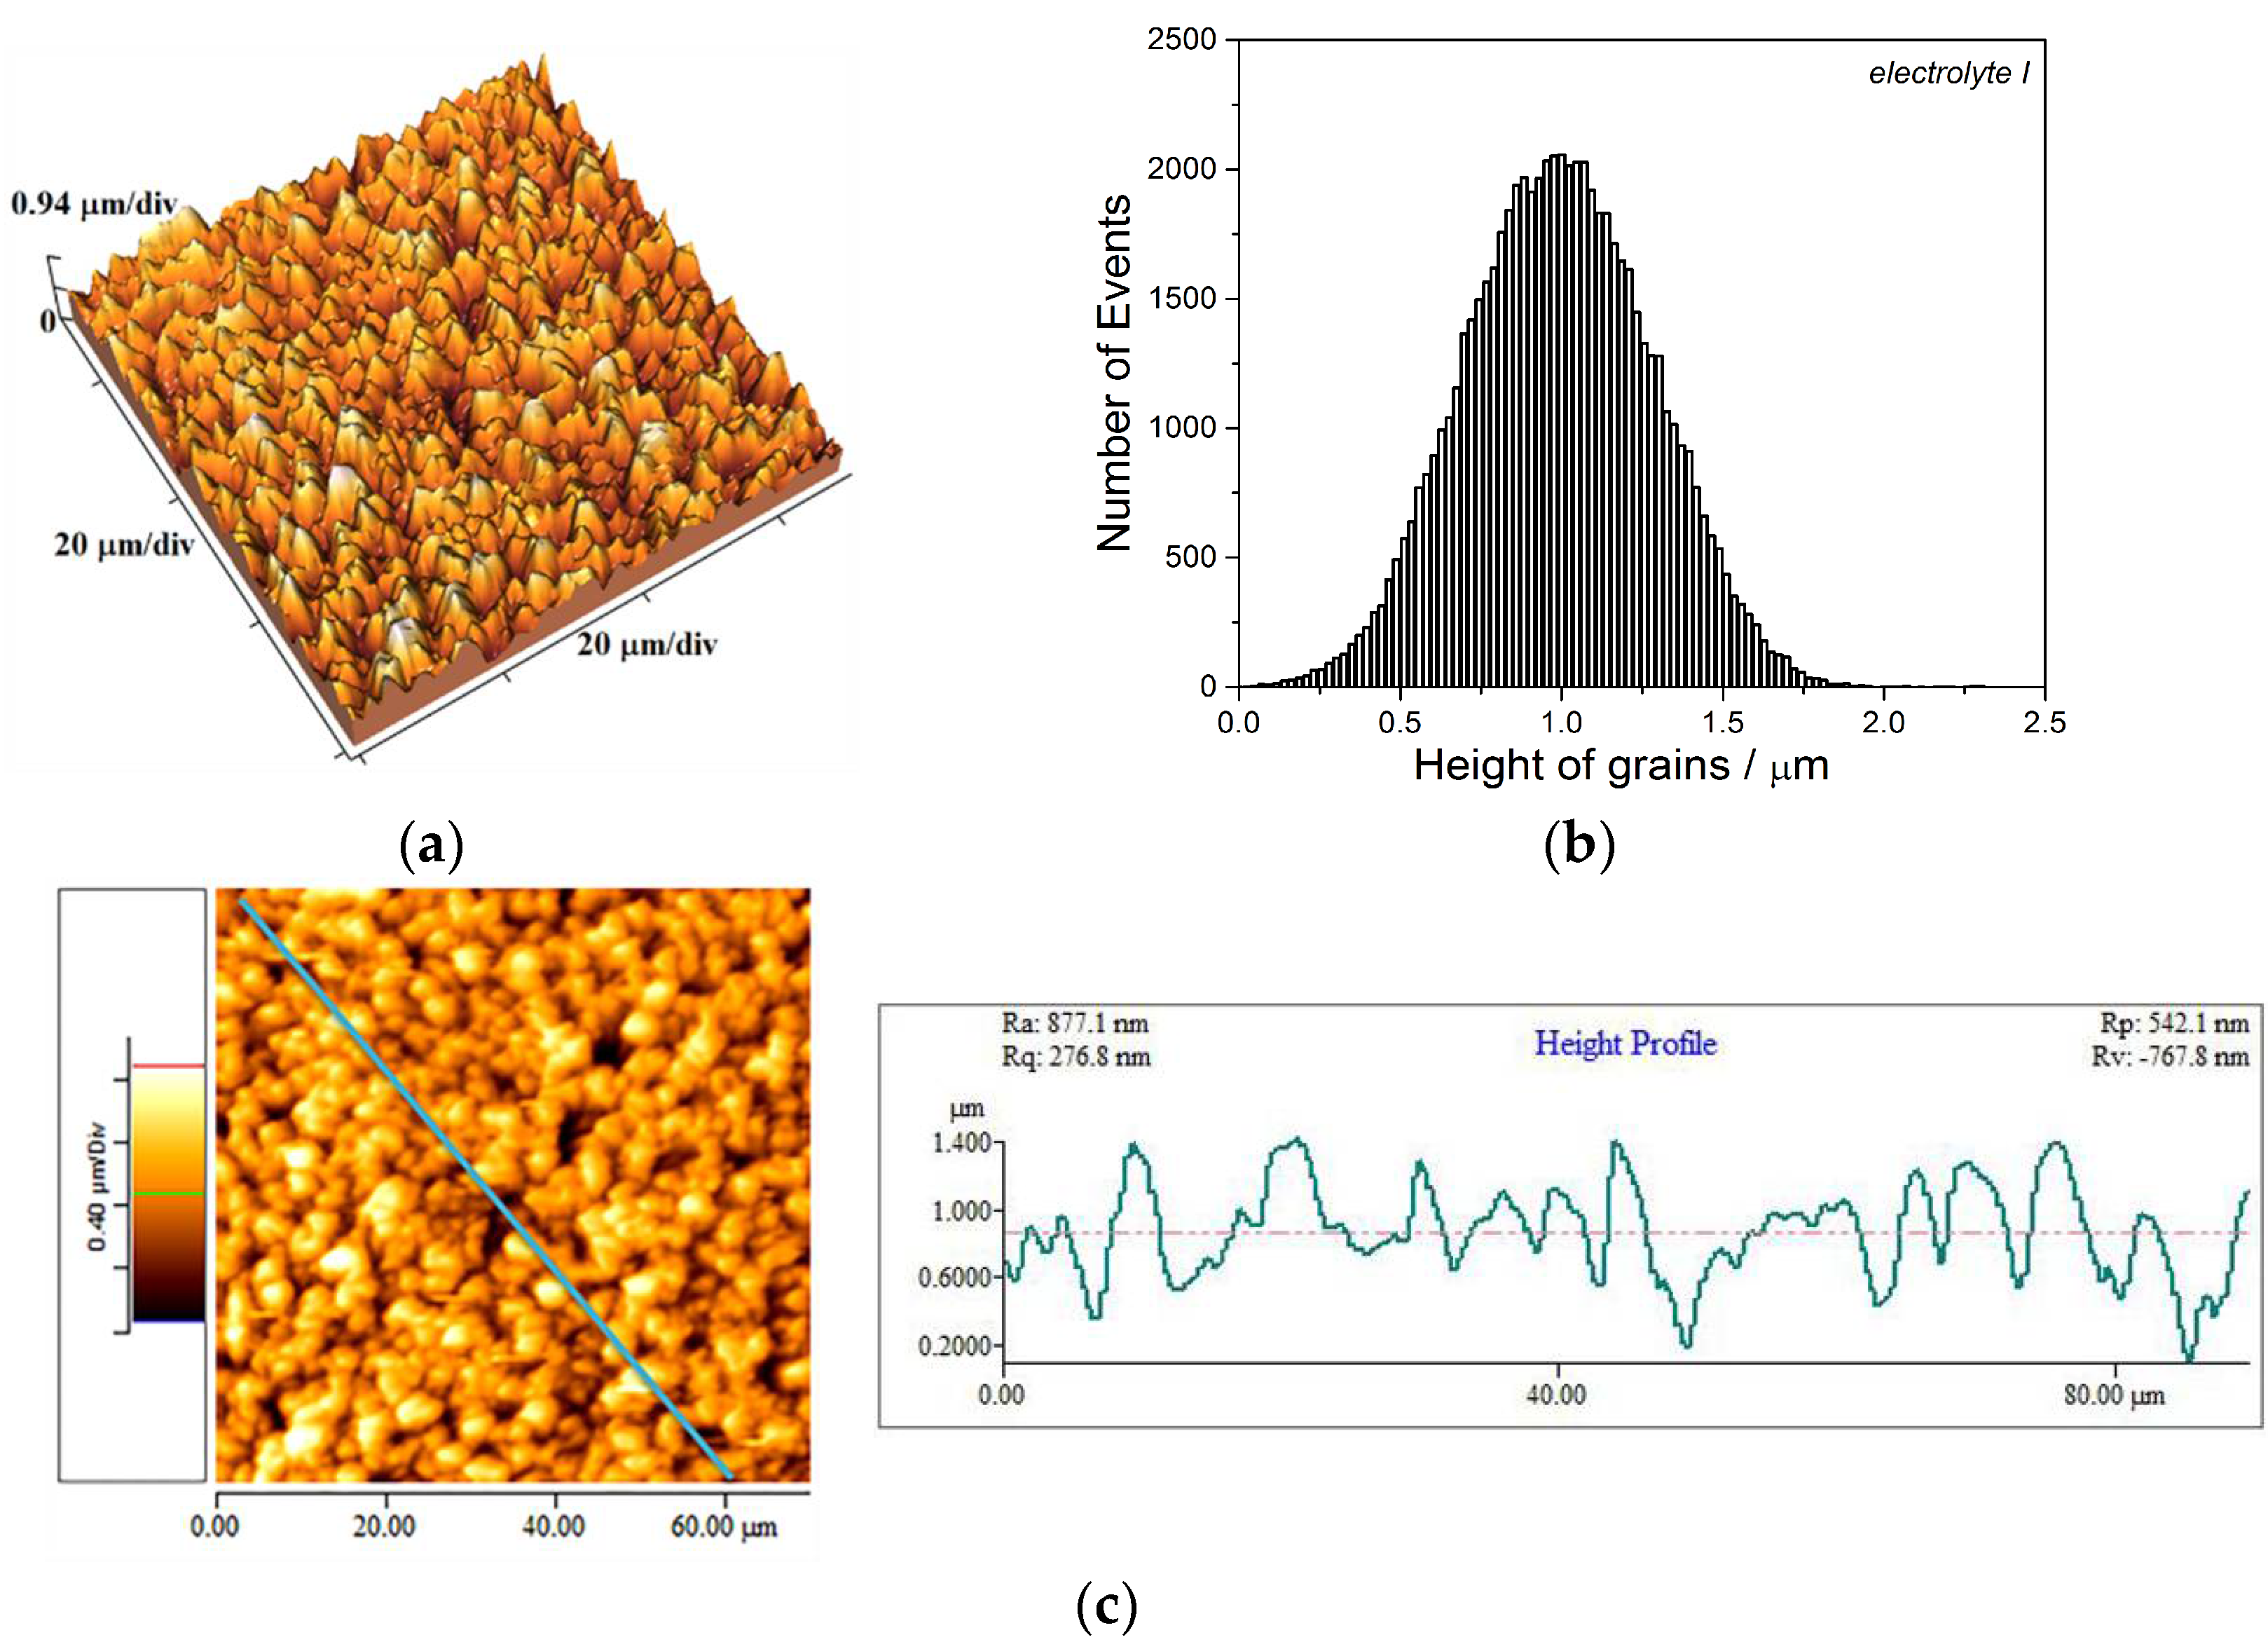
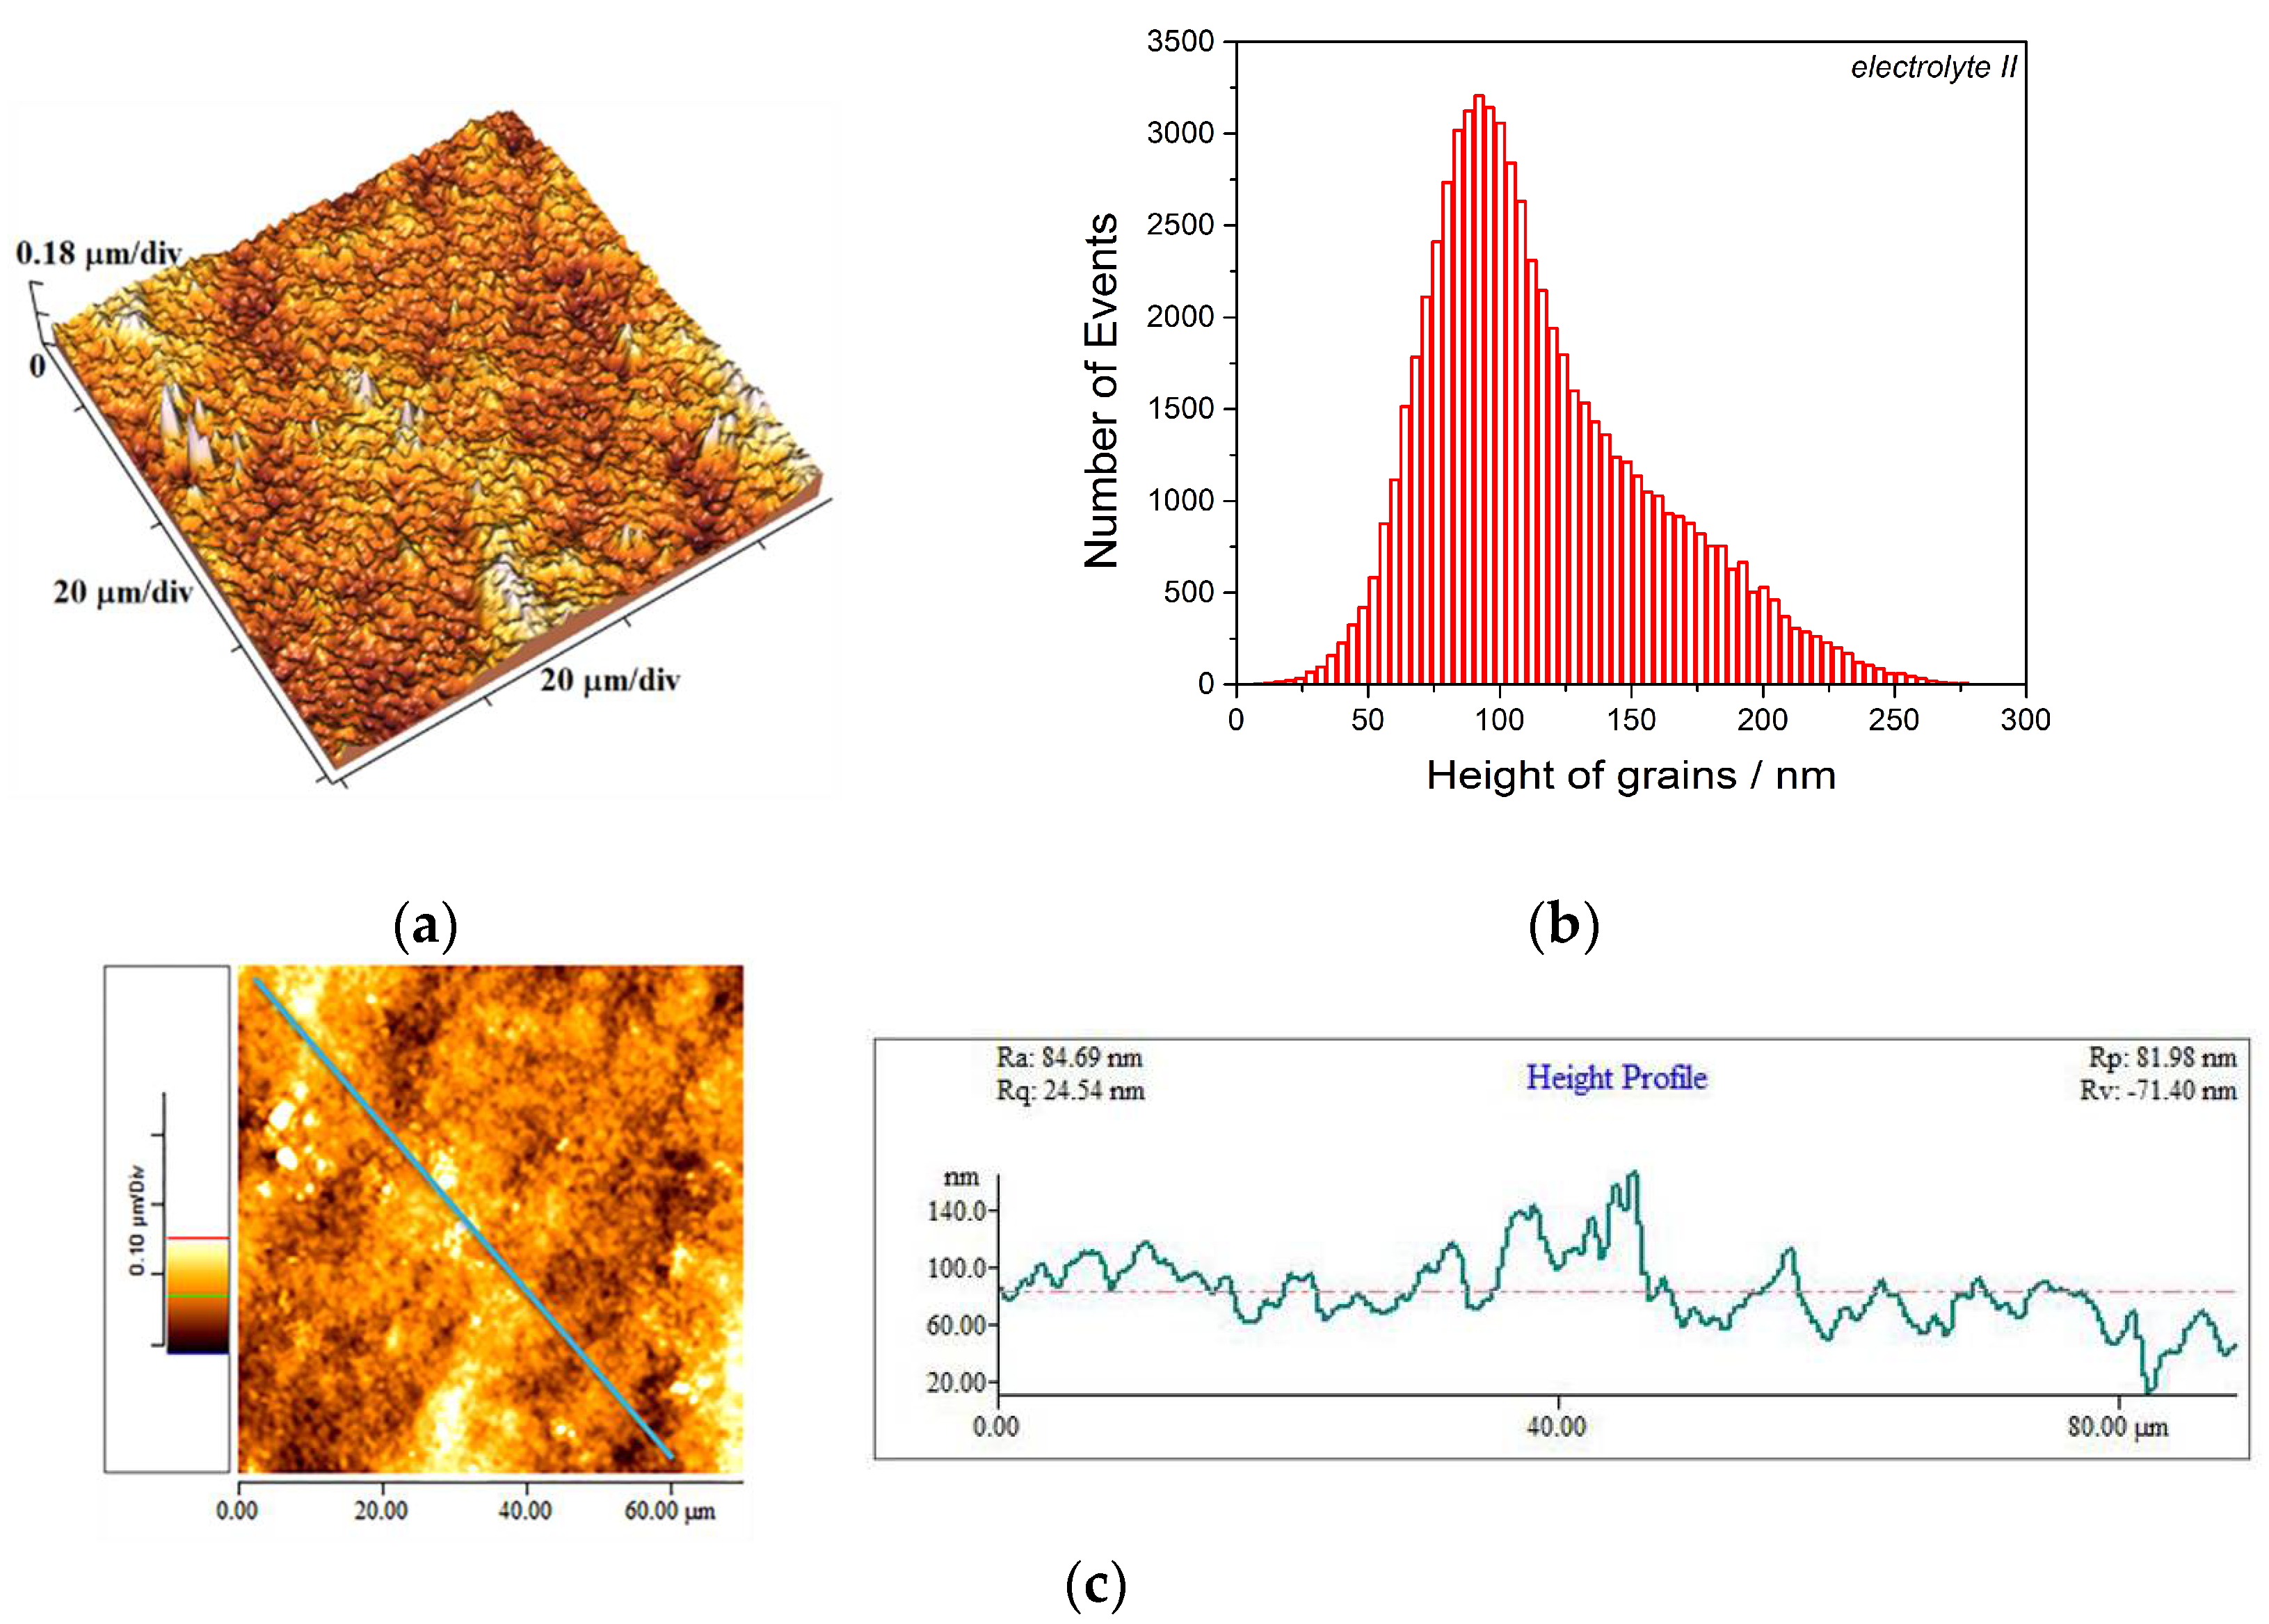
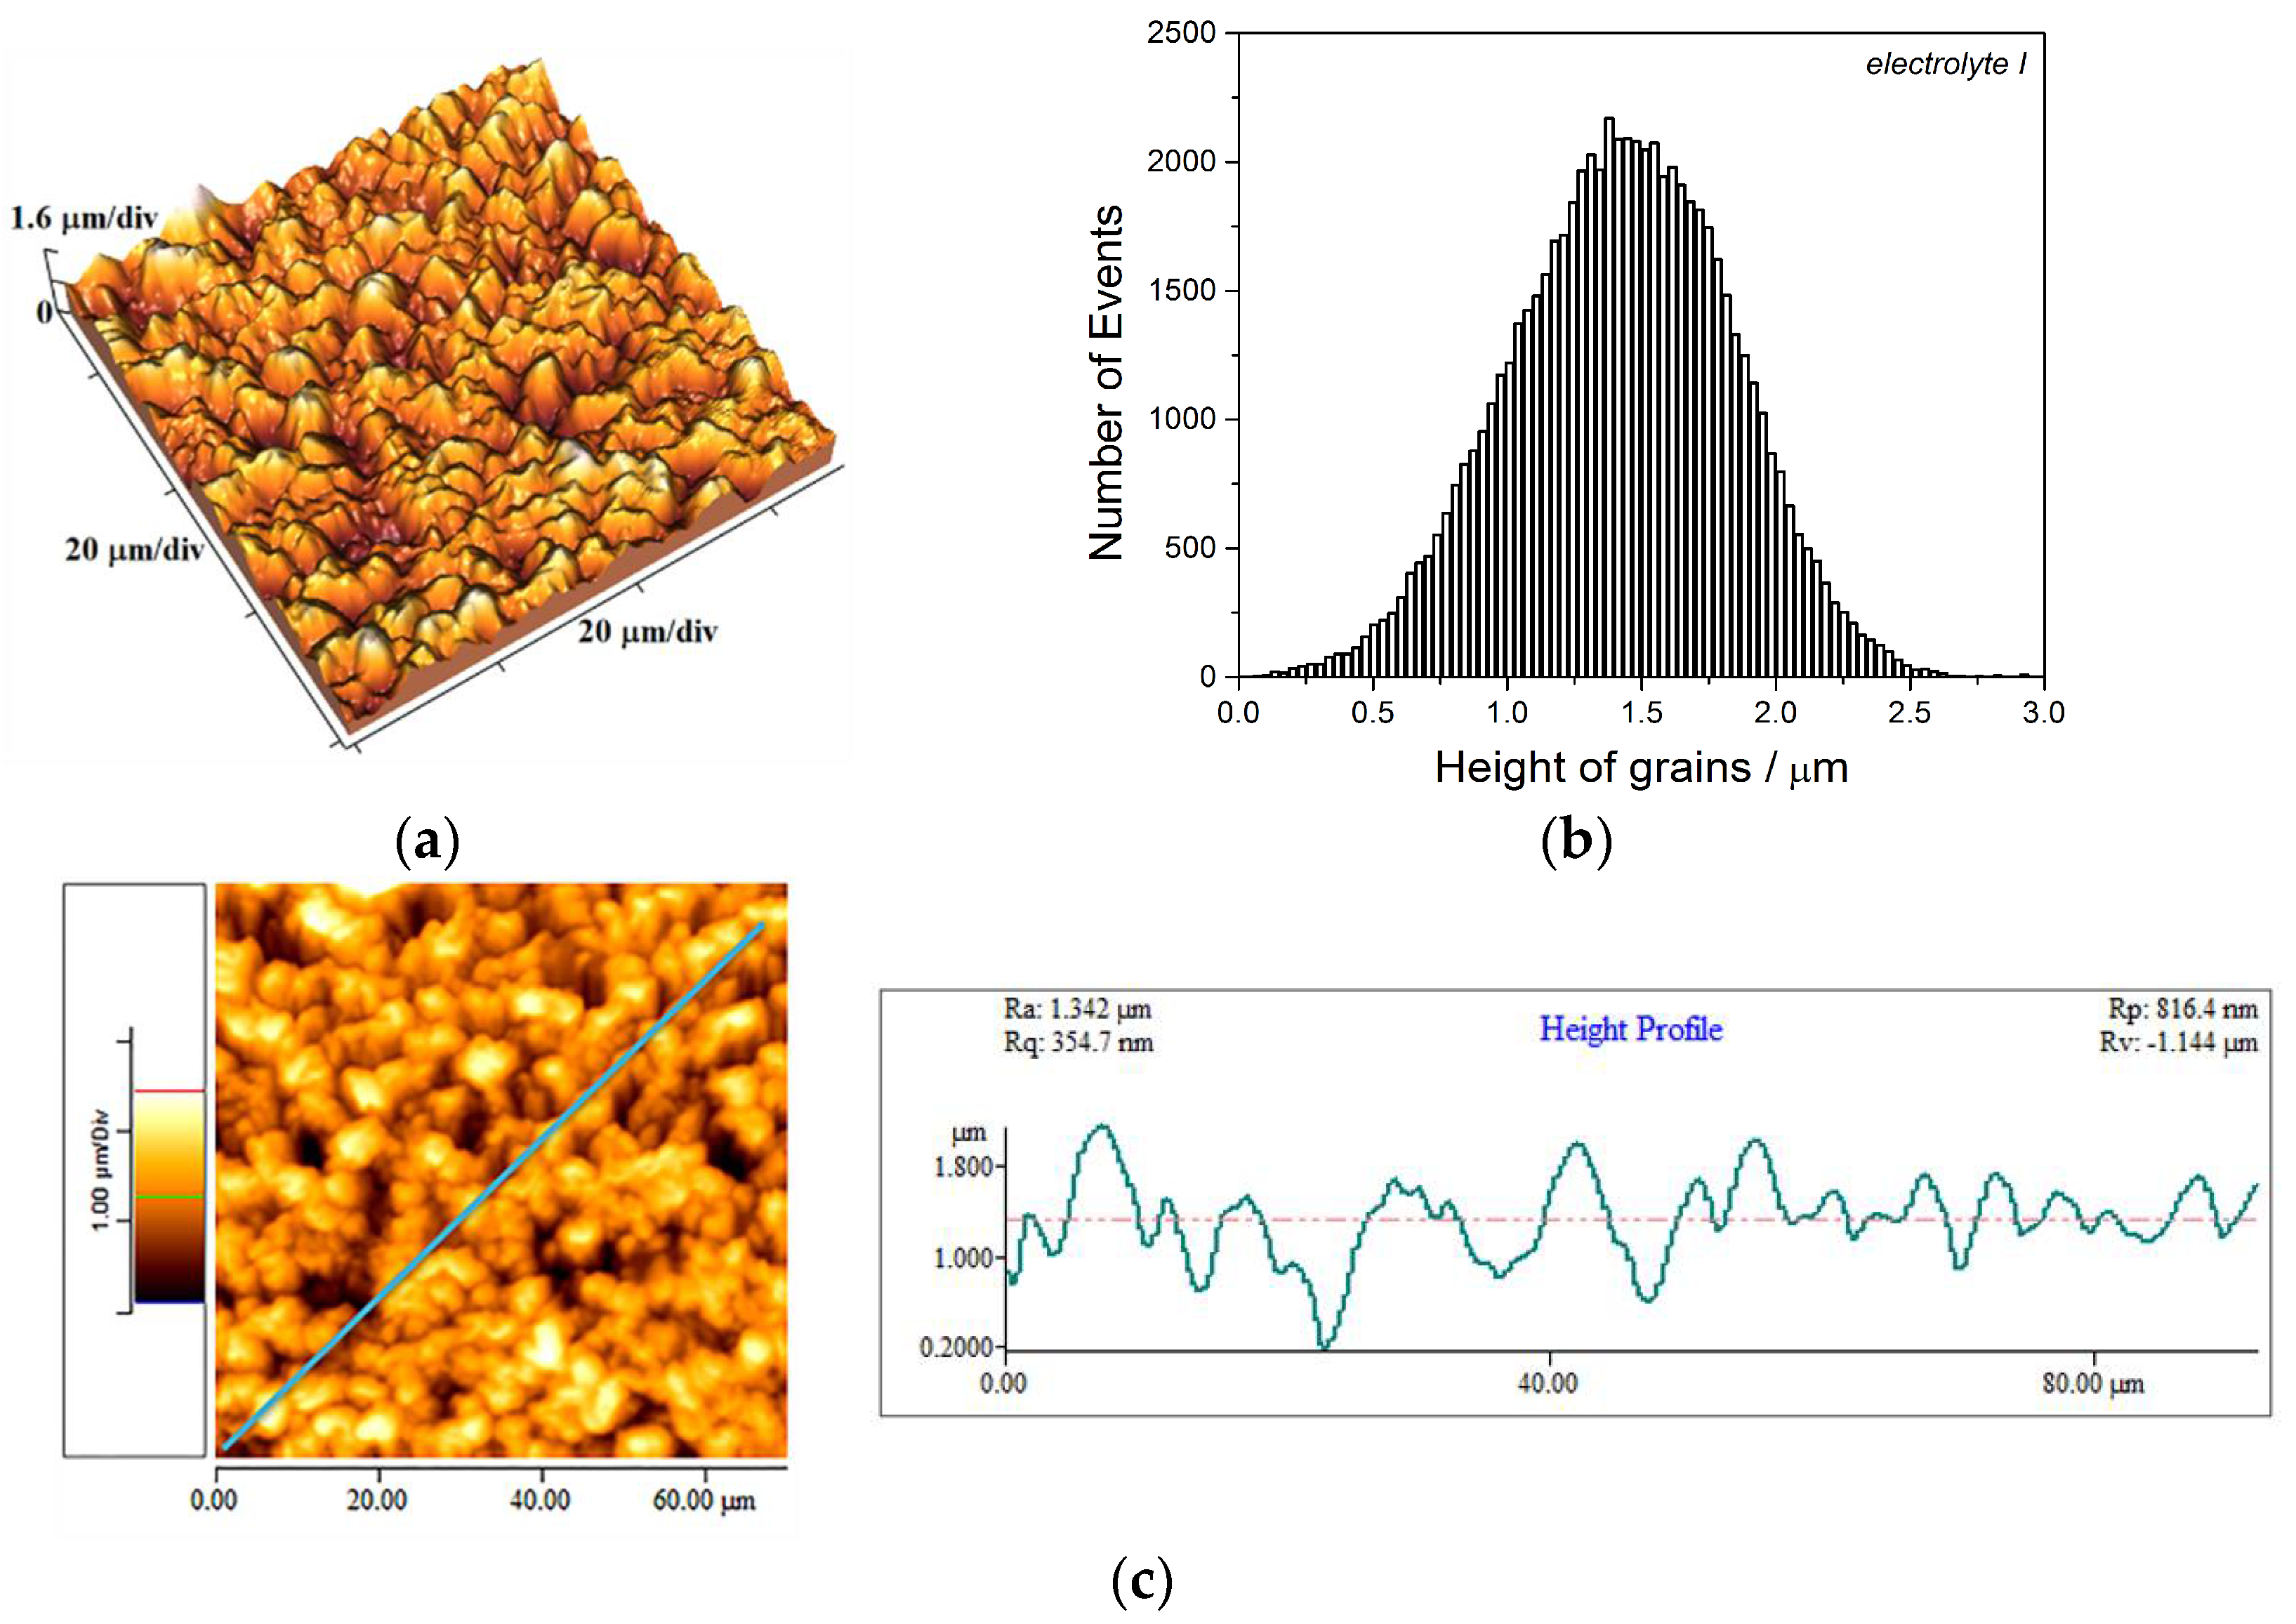
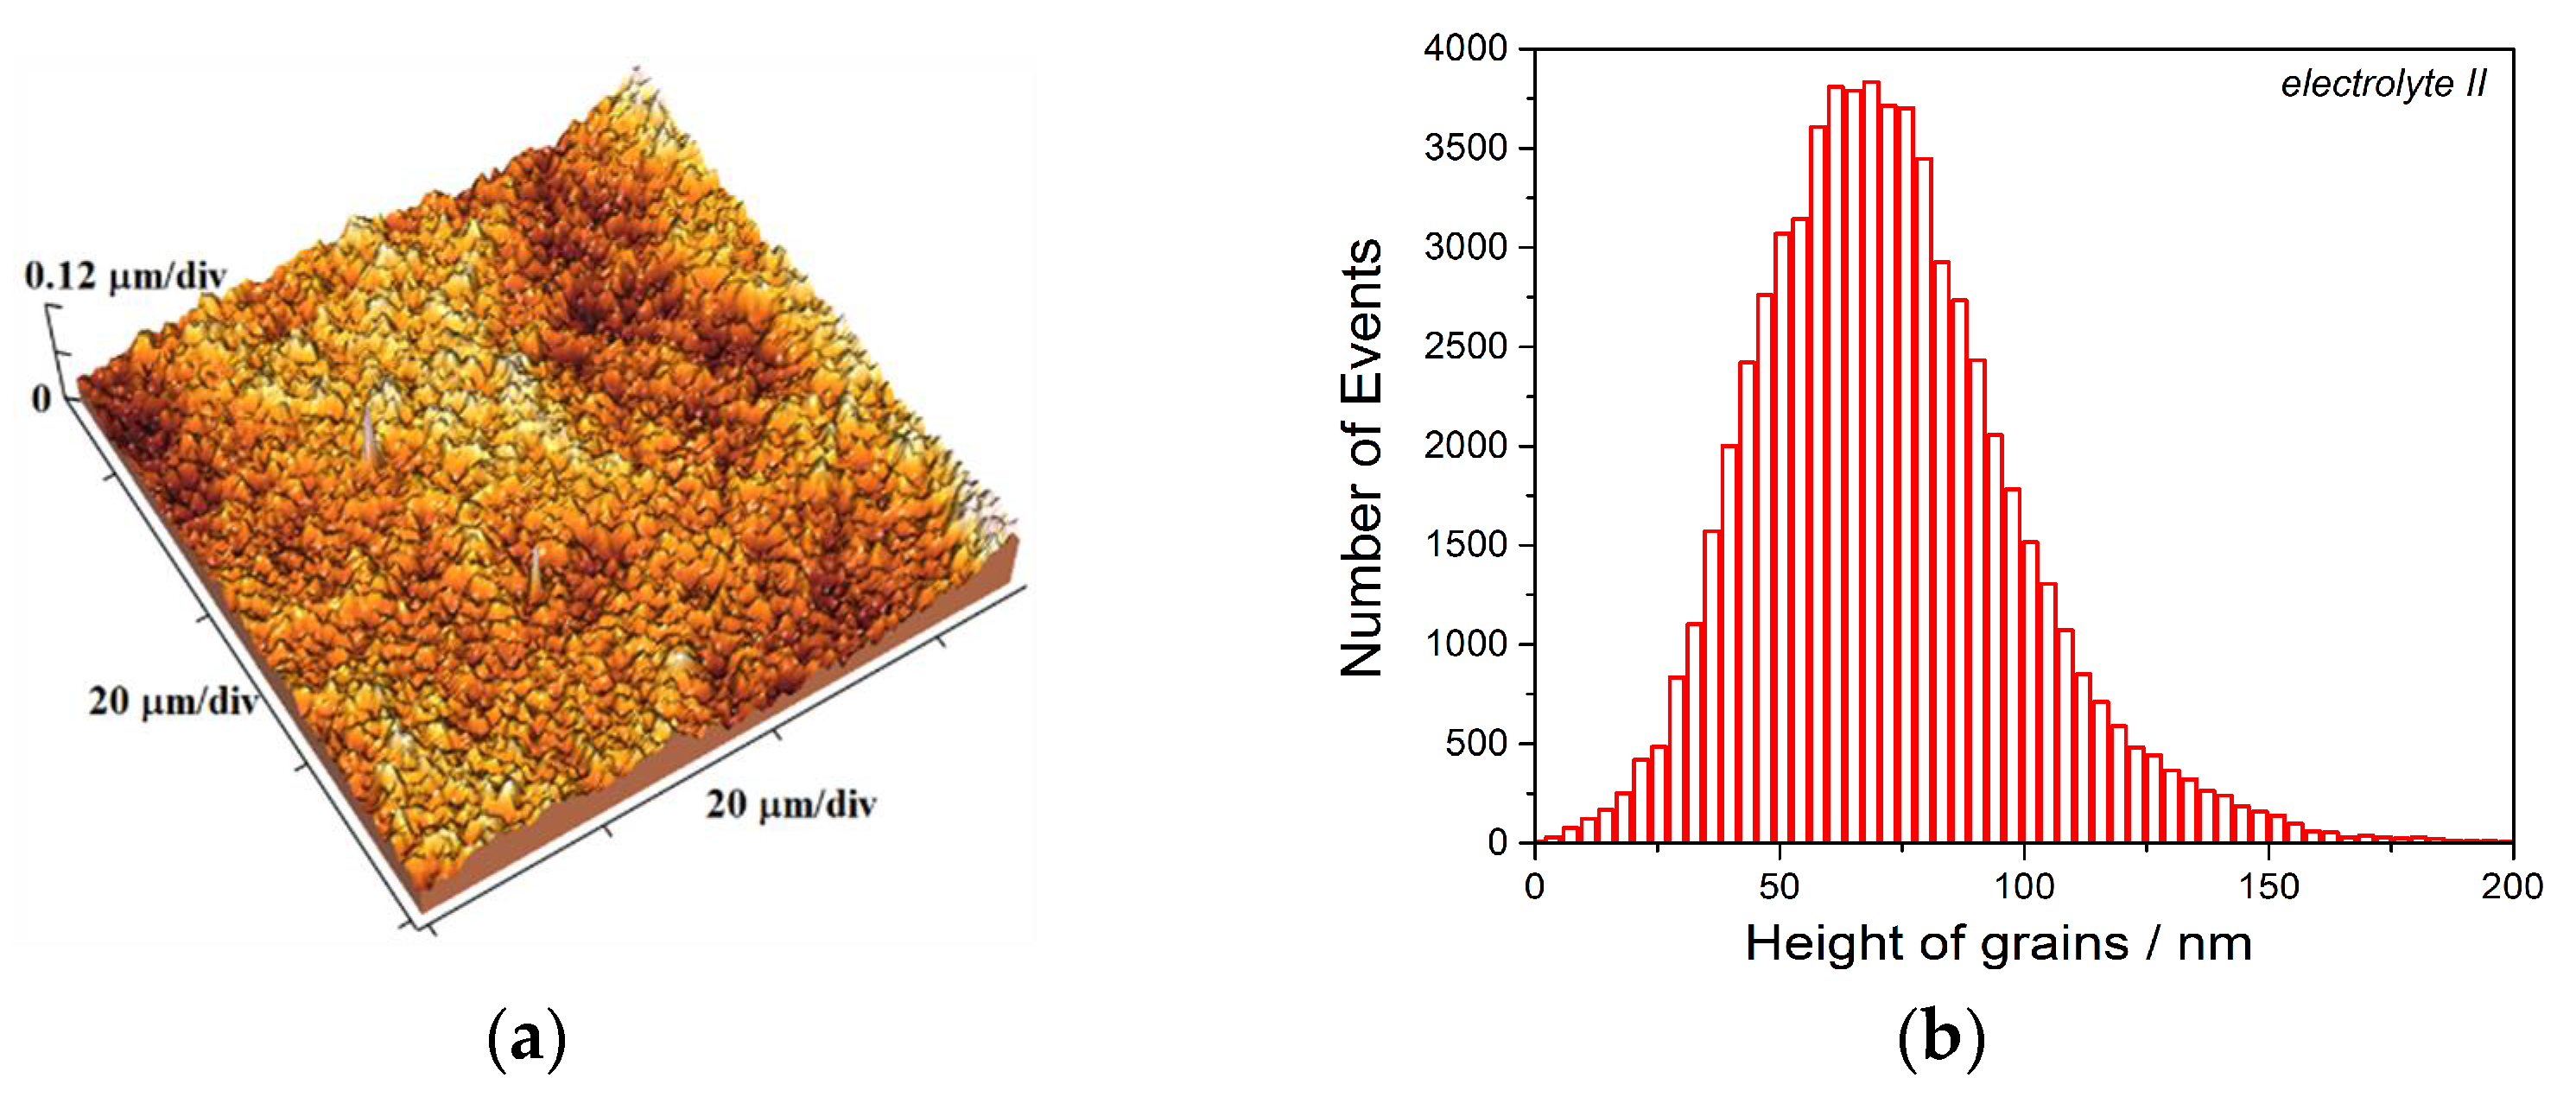
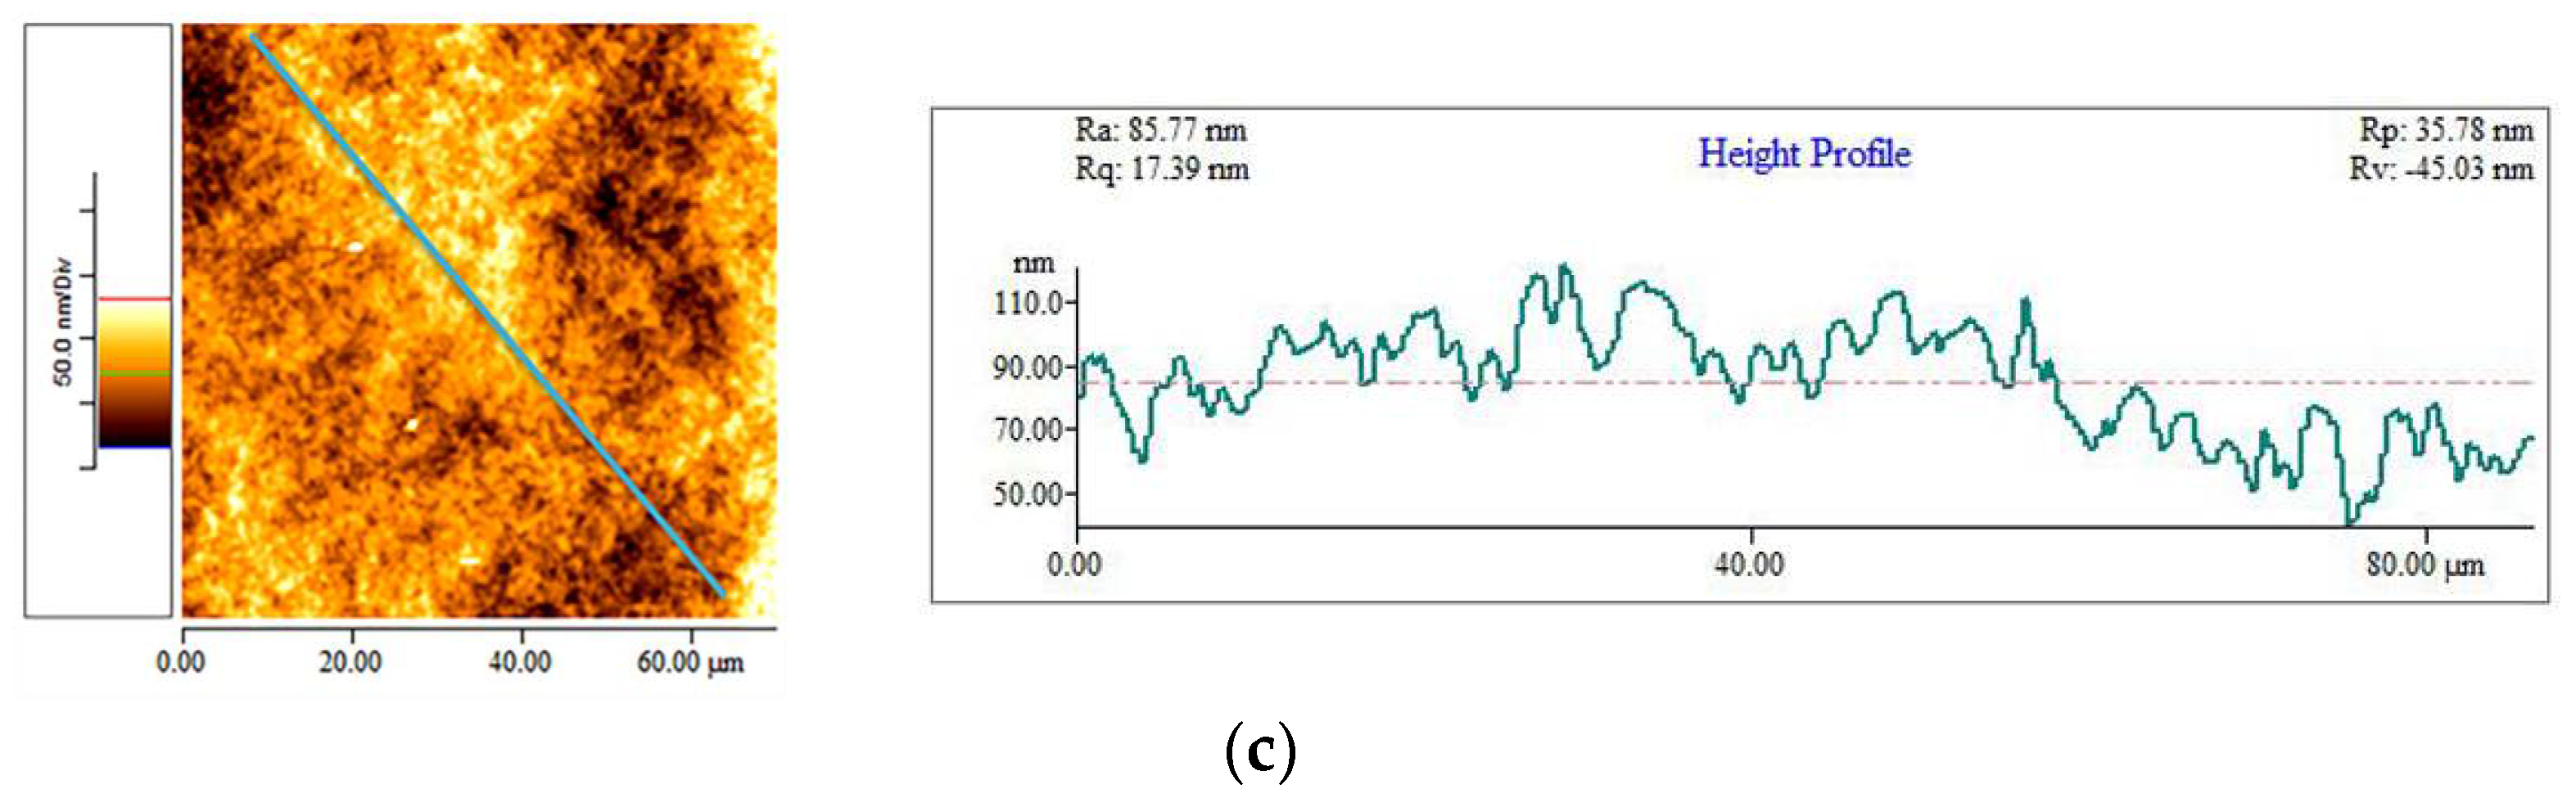
Atomic force microscope (AFM): topography of the coatings was monitored in the contact mode using Auto Probe CP Research; TM Microscopes—Veeco Instruments, Santa Barbara, CA, USA. The software SPMLab (SPMLab NT Ver. 6.0.2., Veeco Instruments, Santa Barbara, CA, USA) was used for an estimation of roughness of obtained coatings by the determination of the arithmetic average of the absolute (Ra) roughness parameters, and for generation of histogram of topography.
(c)
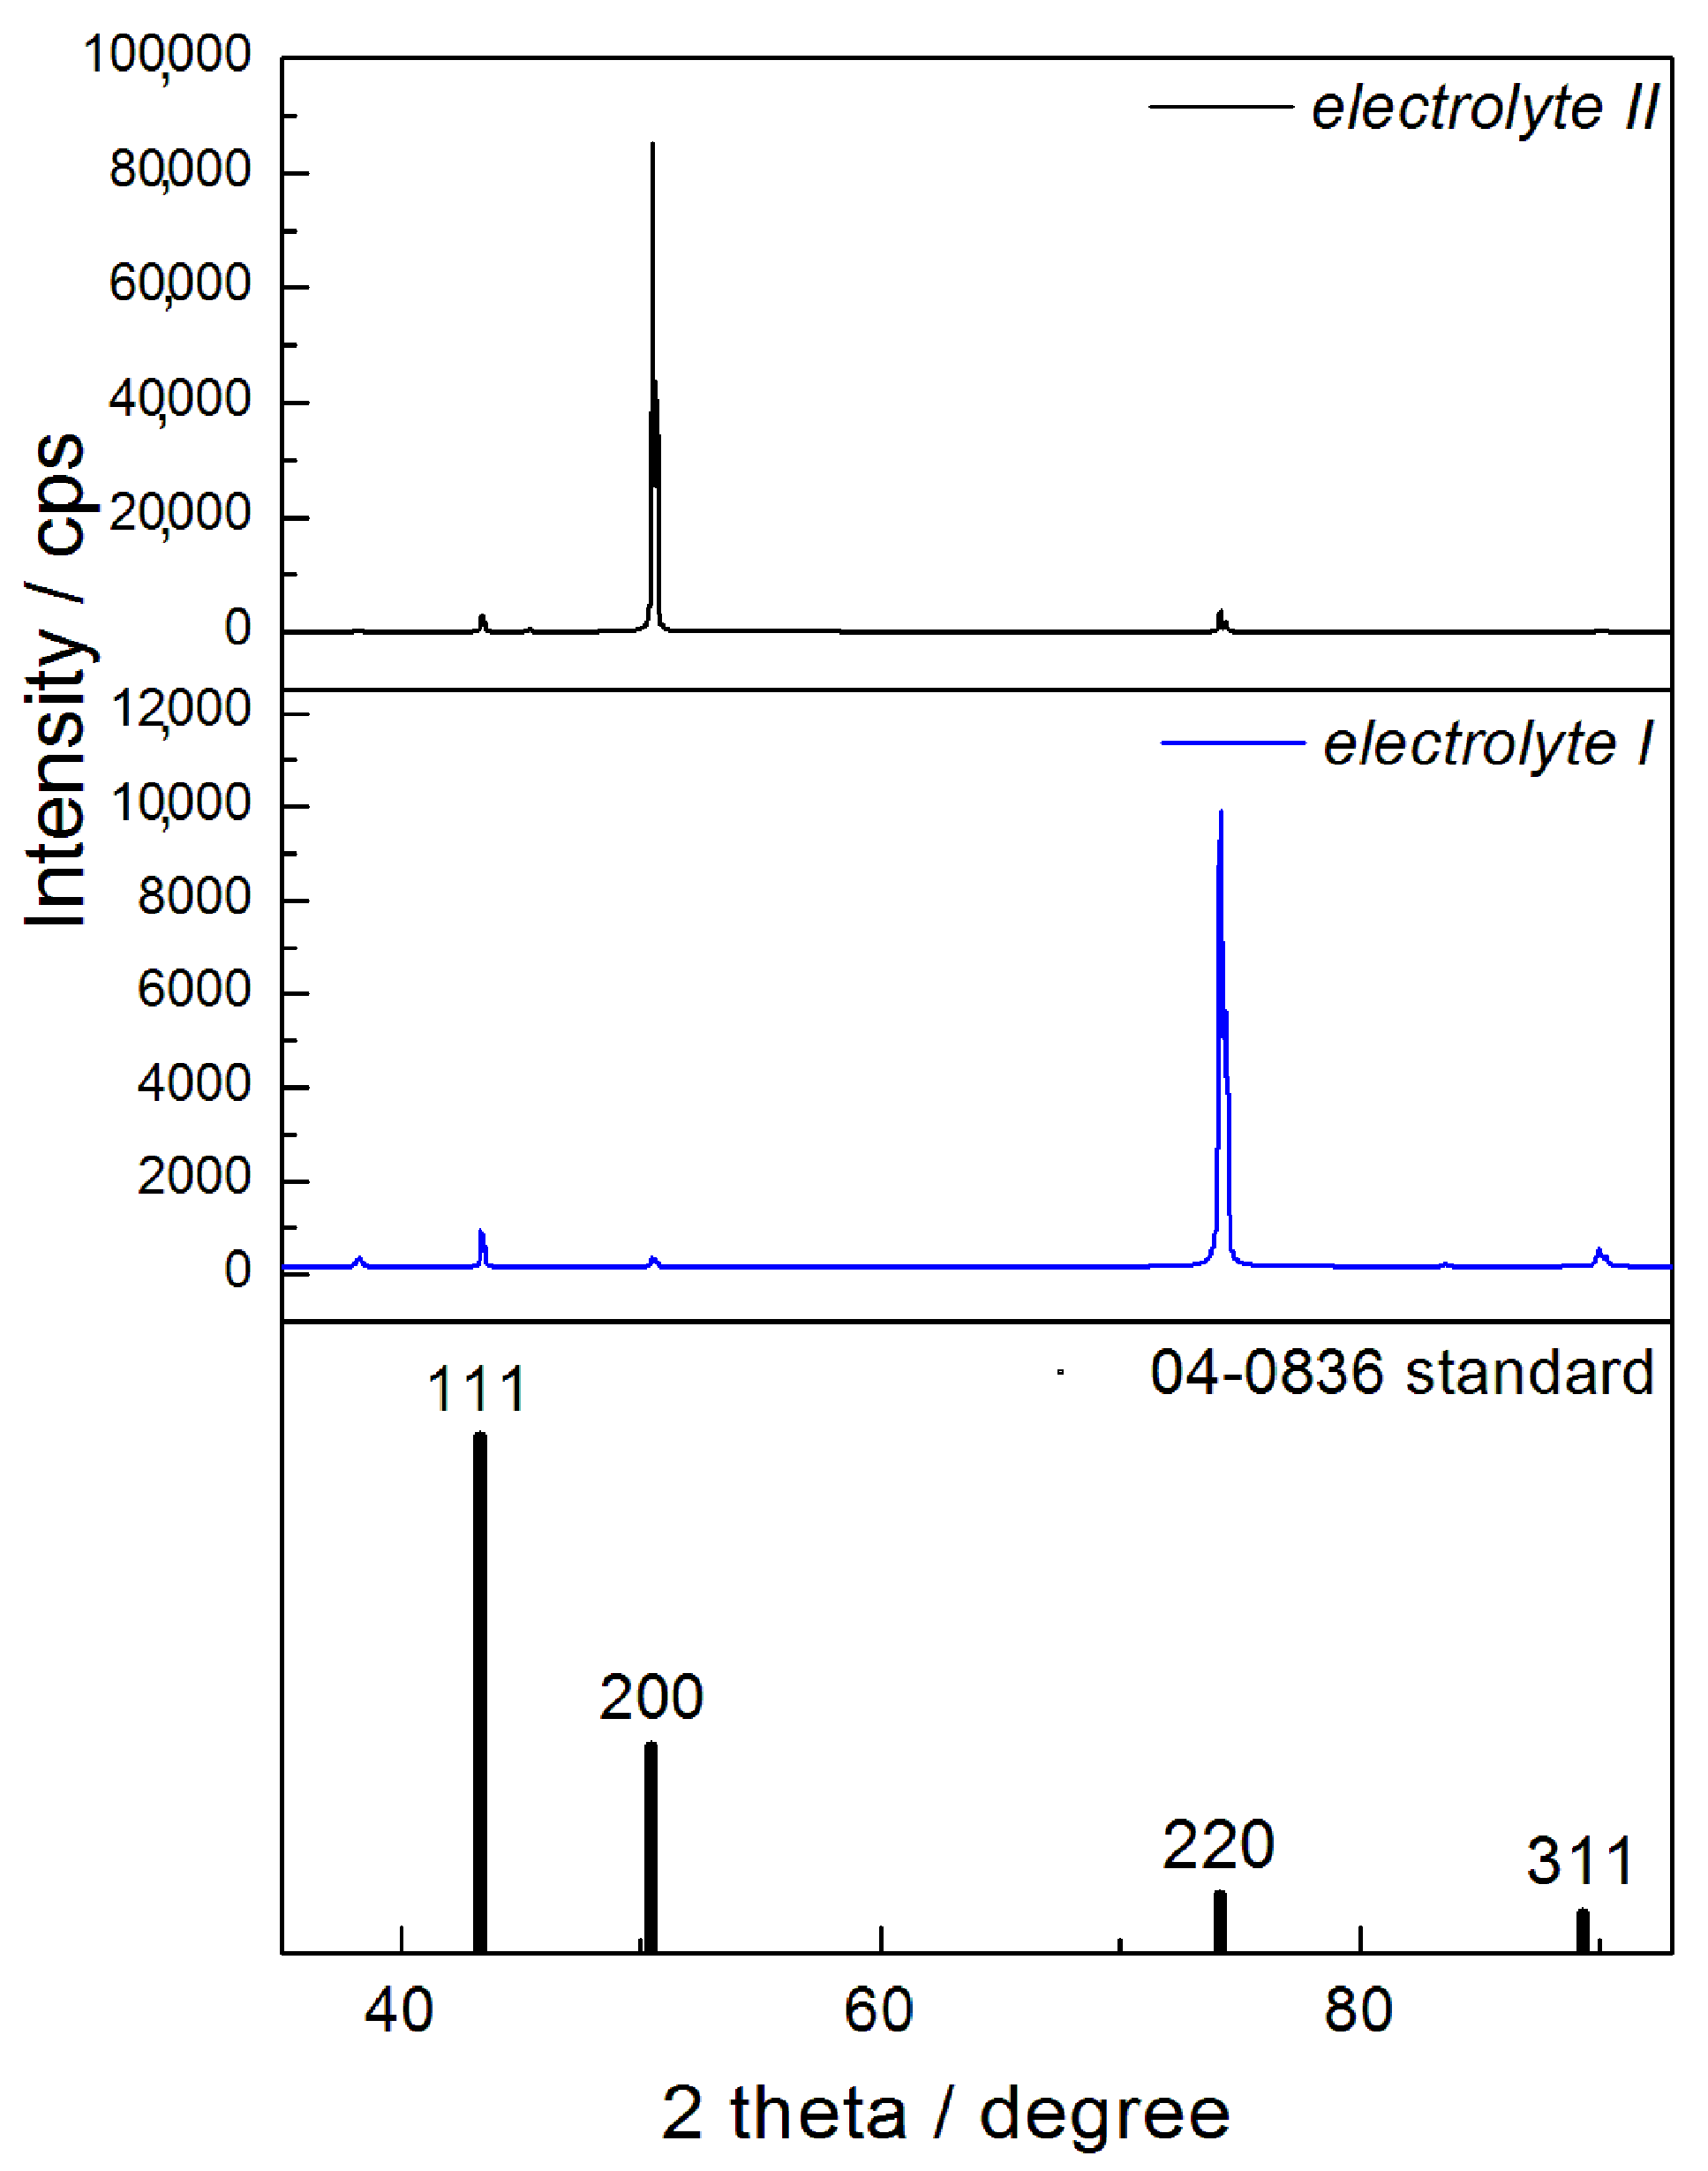
X-ray diffractometer (XRD): The crystal structure of obtained Cu coatings electrodeposited on Si(111) cathode was analyzed using RIGAKU Ultima IV diffractometer (Rigaku Co. Ltd., Tokyo, Japan) in Bragg–Brentano geometry with CuKα radiation in a 2θ range from 30° to 95°. For an estimation of the preferred orientation of Cu coatings, methodology based on the determination of the “Texture Coefficient“, TC(hkl) and the “Relative Texture Coefficient“, RTC(hkl) was applied. The detailed description of a procedure for the determination of these coefficients is presented in [21,25,26].

2.3. Characterization of the Mechanical Properties of Cu Coatings

The Vickers microhardness tester Leitz Kleinert Prufer DURIMET I (Leitz, Oberkochen, Germany) with applied loads (P) in the (0.049 − 2.942) N range and a dwell time of 25 s was used for a determination of a hardness of the Cu coatings. The measured (or so-called) composite hardness (Hc) including a contribution of the substrate hardness (i.e., cathode) is given by Equation (1) [21]:
H c = 1.8544 P d 2
where Hc (in Pa) is the measured (or the composite hardness), P (in N) is the applied load and d is size of a diagonal (in m) in the coating obtained under the applied load.
The hardness values of Si(111) and brass cathodes have been already determined applying the PSR (Proportional Specimen Resistance) model [27], and they were 7.42 GPa for Si(111) [21] and 1.41 GPa for the brass B36 [22] substrates. The Chicot–Lesage (C–L) composite hardness model was used for a determination of the absolute hardness of the Cu coatings. The basis of this model has been already given in Ref. [21].

3. Results

3.1. Analysis of the Copper Coatings Electrodeposited on the Brass Cathode

Figure 1 shows the morphology of 20 µm thick Cu coatings obtained from the basic electrolyte (electrolyte I) and from the electrolyte with leveling/brightening additives (electrolyte II) on the brass. The electrodeposition processes were performed at a current density of 50 mA cm−2 using a magnetic stirrer (MS) for the electrolyte stirring. The Cu coating obtained from the basic electrolyte was fine-grained with mat appearance (Figure 1a), while the Cu coating obtained from the electrolyte with additives was very smooth without clear boundary among grains and had mirror bright appearance (Figure 1b).
The difference between the coatings obtained from the electrolytes without and with additives was confirmed by the AFM analysis of the coatings. Figure 2 and Figure 3 show the topography, the corresponding line section analysis and the histogram of the coatings obtained without (Figure 2) and with the additives (Figure 3). The values of the arithmetic average of the absolute (Ra) roughness were 231.60 ± 10.6 nm for the coating obtained from the basic electrolyte and 28.25 ± 2.1 nm for the coating obtained from the electrolyte with additives, indicating strong leveling/brightening effect of the additives.
The dependencies of the composite hardness (Hc) on the relative indentation depth (RID) for the given Cu coatings are shown in Figure 4a. The RID is defined as a ratio between indentation depth, h, and coating thickness, δ (RID = h/δ), where indentation depth depends on a diagonal size as h = d/7. The contribution of substrate to composite hardness increases with the increasing RID value, suggesting that the composite hardness matches the substrate hardness at high RID values [21,22,28]. Although there is no precise boundary where strong contribution of the substrate to the composite hardness begins, as well as where the composite hardness becomes equal to substrate hardness, the RID values of 0.1 and 1 are usually taken as the limiting values. In this range of RID values (so-called composite zone), application of the composite hardness models is necessary for a determination of the absolute hardness of coatings [21,22].
From Figure 4a it can be seen that the composite hardness of the mat coating obtained from the basic electrolyte was larger than that obtained from the electrolyte with additives. Furthermore, it follows from the same Figure that the Hc values were mainly in the RID range between 0.1 and 1, indicating a necessity of application of the composite hardness models for the determination of absolute coating hardness [11,12,13,21,28,29,30]. With a hardness of 1.41 GPa, the brass belongs to the group of relatively hard substrates, while Cu coatings electrodeposited on it belong to “soft film on hard substrate” composite system type [22]. The Chicot–Lesage (C–L) composite hardness model showed as very valuable for analysis of such systems [21,22]. The dependencies of the coating hardness, Hcoat, calculated by the application of this model on the RID for the Cu coatings electrodeposited on the brass from the electrolytes without and with additives are shown in Figure 4b. At first sight, it can be noticed that the calculated coating hardness follows the same trend as the measured composite hardness.
A careful analysis of the dependencies given in Figure 4a,b also showed that the calculated Hcoat values were larger than the measured Hc values at small RID values, with a tendency of an increase of this difference with a decrease of the RID value. This illogicality required an additional analysis of the Hcoat–RID dependencies by application of the C-L model, with the aim to determine an absolute hardness of the Cu coatings, and consequently, a precise boundary where a strong influence of the substrate hardness on the composite hardness commences. It is done in the following way: Figure 4c shows the dependencies of the (δ/d)m on the RID for the given coatings obtained on the brass without and with additives. In these dependencies, m represents a composite Meyer’s index calculated by a linear regression performed on all experimental points for the given coating—cathode (substrate) system [9,13]. For these systems, the m values were 0.4525 for the coating obtained from the basic electrolyte and 0.3423 for the coating obtained from the electrolyte with additives.
Considering (δ/d)m = 1 as the limiting value for which the C–L model is valid [7,8,9,10], the RID value of 0.14 was obtained (Figure 4c). For the RID values larger than this critical or limiting value, an application of the composite hardness model is necessary for a determination of the absolute hardness of the coating. On the other hand, for the RID values smaller than 0.14, a measured composite hardness can be equaled with the coating hardness. This can be confirmed by comparison of the measured (Hc) and the calculated (Hcoat) values of hardness. Namely, for the RID values larger than 0.14, the Hc values are larger than Hcoat values, while for the RID values smaller than 0.14 Hc values were smaller than Hcoat values what is illogical. Therefore, for RID < 0.14, the coating hardness corresponds to the composite hardness, while for RID ≥ 0.14, the coating hardness corresponds to calculated value obtained from the C–L model.

3.2. Analysis of the Copper Coatings Electrodeposited on Si(111) Cathode

Morphology of metal deposits at the macro level is primarily determined by composition of the electrolyte, while parameters such as the type of cathode and electrodeposition time (i.e., the thickness of coating) have no significant influence on coating morphology [5]. These parameters affect other characteristics of the coatings like roughness, and for that reason, analysis of the Cu coatings electrodeposited on the Si(111) cathode was only performed by the AFM technique. Anyway, Cu coatings obtained on the Si(111) cathodes from the basic electrolyte (electrolyte I) were fine-grained with mat appearance, while those obtained from the electrolyte with additives (electrolyte II) were mirror bright.
The topography, the histogram and line section analyses of the Cu coatings obtained without and with the additives and characterized by the AFM technique are shown in Figure 5 and Figure 6. The difference between the coating obtained from the basic electrolyte (Figure 5) and that obtained in the presence of additives (Figure 6) is clear. The values of Ra roughness were 216.81 ± 8.5 nm for the coating obtained from the basic electrolyte and 20.96 ± 1.9 nm for the coating obtained from the electrolyte with the additives. These values were comparable to those obtained on the brass substrate. The slightly lower values of Ra roughness obtained on Si(111) than those on brass substrate can be attributed to a lower initial roughness of the Si(111) than the brass substrate. Namely, the initial Ra roughness were 31.53 ± 2.4 nm for the brass and 24.18 ± 2.0 nm for the Si(111) substrate.
A hardness of 7.42 GPa classifies Si(111) in a group of very hard substrates, while the coatings of copper electrodeposited on it are in a group of “soft film on hard substrate” composite systems [21]. The dependencies of the measured Hc and the calculated Hcoat values by the C–L model on the RID for the given coatings are shown in Figure 7a,b, respectively. While the dependencies of Hc on the RID were relatively similar to those obtained on the brass substrate (Figure 4a and Figure 7a), the strong difference in the shape of the Hcoat–RID dependencies was observed between those obtained on brass and Si(111) cathodes for both types of electrolytes (Figure 4b and Figure 7b). In the case of Si(111), the Hcoat–RID dependencies showed declining trend, with significantly larger values of Hcoat than Hc for small RID values. This difference increased with a decrease of the RID value. To resolve this illogicality, the dependencies of the (δ/d)m on the RID were done again and shown in Figure 7c. For these Cu coatings, the values of Meyer’s index [m] were 0.4153 for the Cu coating obtained from the basic electrolyte and 0.3447 for the coating obtained from the electrolyte with the additives. Assuming a validity of the C–L model up to (δ/d)m = 1, the limiting or critical RID value of 0.14 was obtained (Figure 7c). The careful analysis of data shown in Figure 7a,b confirmed that the measured Hc values become larger than Hcoat value just after this critical RID value of 0.14. Therefore, similar to the Cu coatings electrodeposited from the same electrolytes on the brass, the coating hardness can be equaled with the measured composite hardness for RID < 0.14. For RID ≥ 0.14, it was necessary to apply the C–L model for a determination of the absolute hardness of the coating.

3.3. Analysis of the Copper Coatings Electrodeposited on the Si(111) Cathode—Influence of Coating Thickness

The AFM analysis of 40 µm thick Cu coatings electrodeposited on the Si(111) cathodes from the electrolytes without and with the additives, including the topography, the histogram and line section analysis is shown in Figure 8 and Figure 9. The Ra roughness were 317.20 ± 8.9 nm for the Cu coating obtained from the basic electrolyte and 15.36 ± 1.5 nm for the Cu coating obtained from the electrolyte with additives. The increase of the roughness of the 40 µm thick coating obtained from the basic electrolyte relative to the roughness obtained for the 20 µm thick coating can be attributed to a process of non-dendritic amplification of surface protrusions during the electrodeposition processes [5]. The roughness of the 40 µm thick Cu coating obtained from the electrolyte with additives was smaller than that for the 20 µm thick coating, what can be attributed to good leveling/brightening characteristics of this combination of additives.
The coatings with 40 µm thickness showed very suitable for a structural analysis [21], and the X-ray diffraction (XRD) patterns of the Cu coatings obtained without and with additives are shown in Figure 10. The diffraction peaks at 2θ values of 43.3°, 50.4°, 74.1° and 89.9° correspond to (111), (200), (220) and (311) crystal faces of the face-centered cubic (FCC) crystal lattice of Cu, respectively [31]. In the Cu coating obtained from the basic electrolyte, crystallites of Cu were predominately oriented in (220) crystal plane, while in that obtained from the electrolyte with additives were predominately oriented in (200) crystal plane. Certainly, the presence of additives strongly influenced the preferred orientation of the Cu coating.
The precise estimation of the preferred orientation of Cu coatings was done by a calculation of the “Texture Coefficient” (TC(hkl)) and “Relative Texture Coefficient” (RTC(hkl)) [26,31,32], and the obtained values are presented in Table 2. The TC values larger than 1 indicate the existence of the preferred orientation, while those around 1 indicate random orientation [26,32]. As all four main diffraction peaks were analyzed, the values of RTC coefficients larger than 25% indicate the existence of the preferred orientation [26,32]. The meaning of R in Table 2 is given in [21,26,31].
From Table 2, it follows that Cu coating obtained from the basic electrolyte feature strong (220) preferred orientation, while Cu coating obtained from the electrolyte with the additives has strong (200) preferred orientation. The origin of these various preferred orientations will be discussed later.
Hardness analysis of the coatings was performed applying the same procedure, and the dependencies of Hc and Hcoat on the RID for 40 µm thick Cu coatings are shown in Figure 11a,b, respectively. The shape of the obtained dependencies was similar to those obtained for the 20 µm thick Cu coatings on the Si(111) substrate. The only difference between these two coating thicknesses is a shift of Hc values, and thus Hcoat values, for the 40 µm thick coatings towards lower RID values, i.e., towards the zone of a dominant effect of coating hardness in a measured composite hardness.
The dependencies of the (δ/d)m on the RID for the formed coatings are presented in Figure 11c. The values of m parameters were 0.4290 for the mat Cu coating obtained from the electrolyte without additives, and 0.3367 for the mirror bright Cu coating obtained from an electrolyte with additives. Assuming a validity of the C–L model up to (δ/d)m = 1, the critical or limiting RID value of 0.14, which separates the zone in which the coating hardness can be equaled with the composite hardness from the zone requiring an application of the C–L model for a determination of the absolute coating hardness, was also obtained for this system. Therefore, it is clear that the RID value of 0.14 is independent of crucial parameters of electrolysis, such as the cathode type, composition of the electrolyte and the coating thickness, and presents one of the main characteristics of electrolytically deposited coatings of copper.

4. Discussion

Depending on a composition of electrolytes, two kinds of Cu coatings were formed and analyzed. The fine-grained Cu coatings with mat appearance were obtained from the basic electrolyte, while very smooth mirror bright Cu coatings were obtained from the electrolyte with an addition of the leveling and brightening additives. The strong difference in surface morphology was confirmed by their roughness analysis; the Cu coatings obtained from the basic electrolyte showed considerably higher roughness than those obtained from the electrolyte with additives. On the other hand, the type of used substrate had not significant effect on roughness of the Cu coatings.
Aside from a strong effect on morphological characteristics of the Cu coatings, an addition of this combination of the leveling and brightening additives also affected the structural characteristics. The Cu coating obtained from the basic electrolyte showed strong (220) preferred orientation, while the Cu coating obtained from the electrolyte with additives showed strong (200) preferred orientation. Strong (200) preferred orientation is a result of synergistic action of chloride ions, polyethylene glycol (PEG) and 3-mercapto-1-propanesulfonic acid (MPSA) on Cu electrodeposition process [23,24,33,34]. The combination of PEG and chloride ions added to acid sulfate electrolyte shows a strong inhibitive effect on the cathodic reaction. In the presence of chloride ions, PEG acts a suppressor of deposition process, which adsorbs itself on the growing cathode and exhibits a blocking effect according to Cu(II) ions during electrodeposition process. On the other hand, MPSA represents top brightening additive and added to the electrolyte acts as an activator of the deposition process [23,24,35]. The model of “local perforation” is proposed to explain a synergistic action of these additives in formation of mirror bright Cu coatings [33,34]. Therefore, the additives added to the sulfate electrolyte achieved the strong effect on the preferred orientation of the Cu coatings. On the other hand, the effect of the additives on size of crystallites was less pronounced. The crystallite sizes determined by Debye–Scherrer equation [36] were 69 nm for the mat coating obtained from electrolyte I and 48 nm for the mirror bright coating obtained from electrolyte II.
The type of electrolyte also strongly affected hardness of the produced Cu coatings. Both composite (measured) and calculated hardness of the Cu coatings obtained from the basic electrolyte were higher than those obtained from the electrolyte with additives. The explanation for this can be found in SEM micrographs shown in Figure 1. The fine-grained mat coating obtained from the basic electrolyte showed clear boundary between Cu grains, while boundary among grains was not visible in smooth mirror bright Cu coating obtained in the presence of additives. The higher coating hardness of Cu coatings obtained from additive free electrolyte can be attributed to numerous boundaries among grains representing a disruption site for dislocation motion, or better said, the boundaries among grains prevent a movement of the dislocations [30,37]. Each grain boundary acts as a mini-resistor when the indenter penetrates in the volume of the coating material. In the case of additives in electrolyte, these boundaries among grains are lost, and dislocation motion has a dominant effect on hardness characteristics of these Cu coatings. Disappearance of the grain boundary causes a decrease of resistance during penetration in the coating material, leading to the smaller hardness of mirror bright coatings relative to mat coatings. Based on the modification of the microstructure, the following can be said: mat copper coatings obtained from electrolyte I can be classified into the group of microcrystalline coatings (mc), while mirror bright coatings electrodeposited from electrolyte II belong to the group of nanocrystalline (nc) coatings. The hardness value generally increased with decreasing the grain size for mc-coatings and the dislocation pile up mechanism is the basis for a validity of Hall–Petch equation [38]. In case of nc-coatings this mechanism is not applicable because a grain size is less than a certain critical value and then the inverse Hall–Petch equation is valid [39]. The difference between mat and mirror bright coatings is confirmed by analysis of histograms of topography shown in Figure 2b, Figure 3b, Figure 5b, Figure 6b, Figure 8b and Figure 9b. The distribution of the grain height was uniform for all Cu coatings, with greater symmetry to a certain extent for the mat coatings (Figure 2b, Figure 5b and Figure 8b). Based on the difference in the grain height (x -axis on the histograms), it is clear that the mat coatings are of micrometer dimensions while the mirror bright coatings are in the region of nanodimensions. Therefore, it follows that the AFM technique is more relevant for analysis of size of grains than the XRD technique.
Analyzing the obtained histograms and the coating hardness dependencies, it can be seen that the coating hardness of nano-sized mirror bright coatings was smaller than the micro-sized mat coatings. At the first sight, it is in contradiction with a prediction of Hall–Petch equation, as this equation predicts an increase of coating hardness with a decrease of grain size [38]. The decrease in the coating hardness with decreasing the grain size clearly indicates that the size of grains in the mirror bright coatings is below certain critical value and the inverse Hall–Petch equation begins to be valid. In this way, the hard softening effect of the additives on the coating hardness is proven.
However, despite a strong difference in morphological, structural and hardness characteristics of the coatings obtained without and with additives, the same limiting or critical RID value of 0.14 was established [(RID)c = 0.14] for both types of the electrolytes. In view of the definition of RID, it is clear that the critical indentation depth, hc, below which the substrate (cathode) does not have a significant effect on the coating hardness depends on the coating thickness, δ, as hc < 0.14δ. Critical indentation depth depends on the ratio of the coating /substrate hardness and is caused by various factors, such as the indenter geometry, plastic pile-up effect, film/substrate adhesion, elastic properties of the film and substrate and the friction between the indenter and film [40,41,42,43,44,45,46]. For polycrystalline soft coatings on hard substrates, such as the Cu coatings electrodeposited on Si(111) and brass substrates, it is widely adopted rule that a critical indentation value below which a substrate has negligible effect on coating hardness is related to a coating thickness as hc < 0.20δ [40]. Therefore, it is clear that the critical RID value (or hc value) obtained in this investigation, separating the zone in which the measured composite hardness can be equaled with the coating hardness ((RID)c < 0.14 or hc < 0.14δ) and the zone requiring an application of the C–L model for a determination of absolute coating hardness ((RID)c ≥ 0.14 or hc ≥ 0.14δ), is situated between widely adopted Buckle’s one-tenth rule assuming that a film thickness of 10 times the indentation depth is sufficient to neglect the influence of the substrate (i.e., hc < 0.10δ) [28] and the value established for a polycrystalline soft coatings on hard substrates of hc < 0.20δ [40]. This clearly proves that the C–L model is successfully implemented in a determination of the absolute hardness of the Cu coatings.
The established critical RID value of 0.14 for the Cu coating was independent of the main parameters of electrolysis, such as the type of cathode, composition of the electrolyte and the coating thickness. The identical RID value was also obtained for the Cu coatings of different thickness electrodeposited on the brass by the pulsating current (PC) regime [22]. Anyway, the fact that the critical RID value of 0.14 was obtained for various regimes and parameters of electrolysis clearly indicates that this value can have universal character for the copper coatings obtained by the electrolysis processes. Certainly, the further investigations in this direction will be continued in the future.

5. Conclusions

The copper coatings electrodeposited by a galvanostatic regime from the acid sulfate electrolytes (without and with leveling/brightening additives) on various electrodes (brass and Si(111) orientation) of 20 and 40 µm thickness were characterized by SEM, AFM and XRD techniques. The Vickers indentation test and the Chicot–Lesage (C–L) composite hardness model was used for a determination of the absolute hardness of Cu coatings. On the basis of the performed analysis of the produced coatings, we reached the following conclusions:
(a)
The Cu coatings obtained from the basic (sulfate) electrolyte were fine-grained with mat appearance. These coatings showed strong (220) preferred orientation. The smooth mirror bright Cu coatings of strong (200) preferred orientation were obtained from the electrolyte with additives for leveling and brightening. The roughness of the fine-grained coatings was considerably larger than the roughness of smooth coatings.
(b)
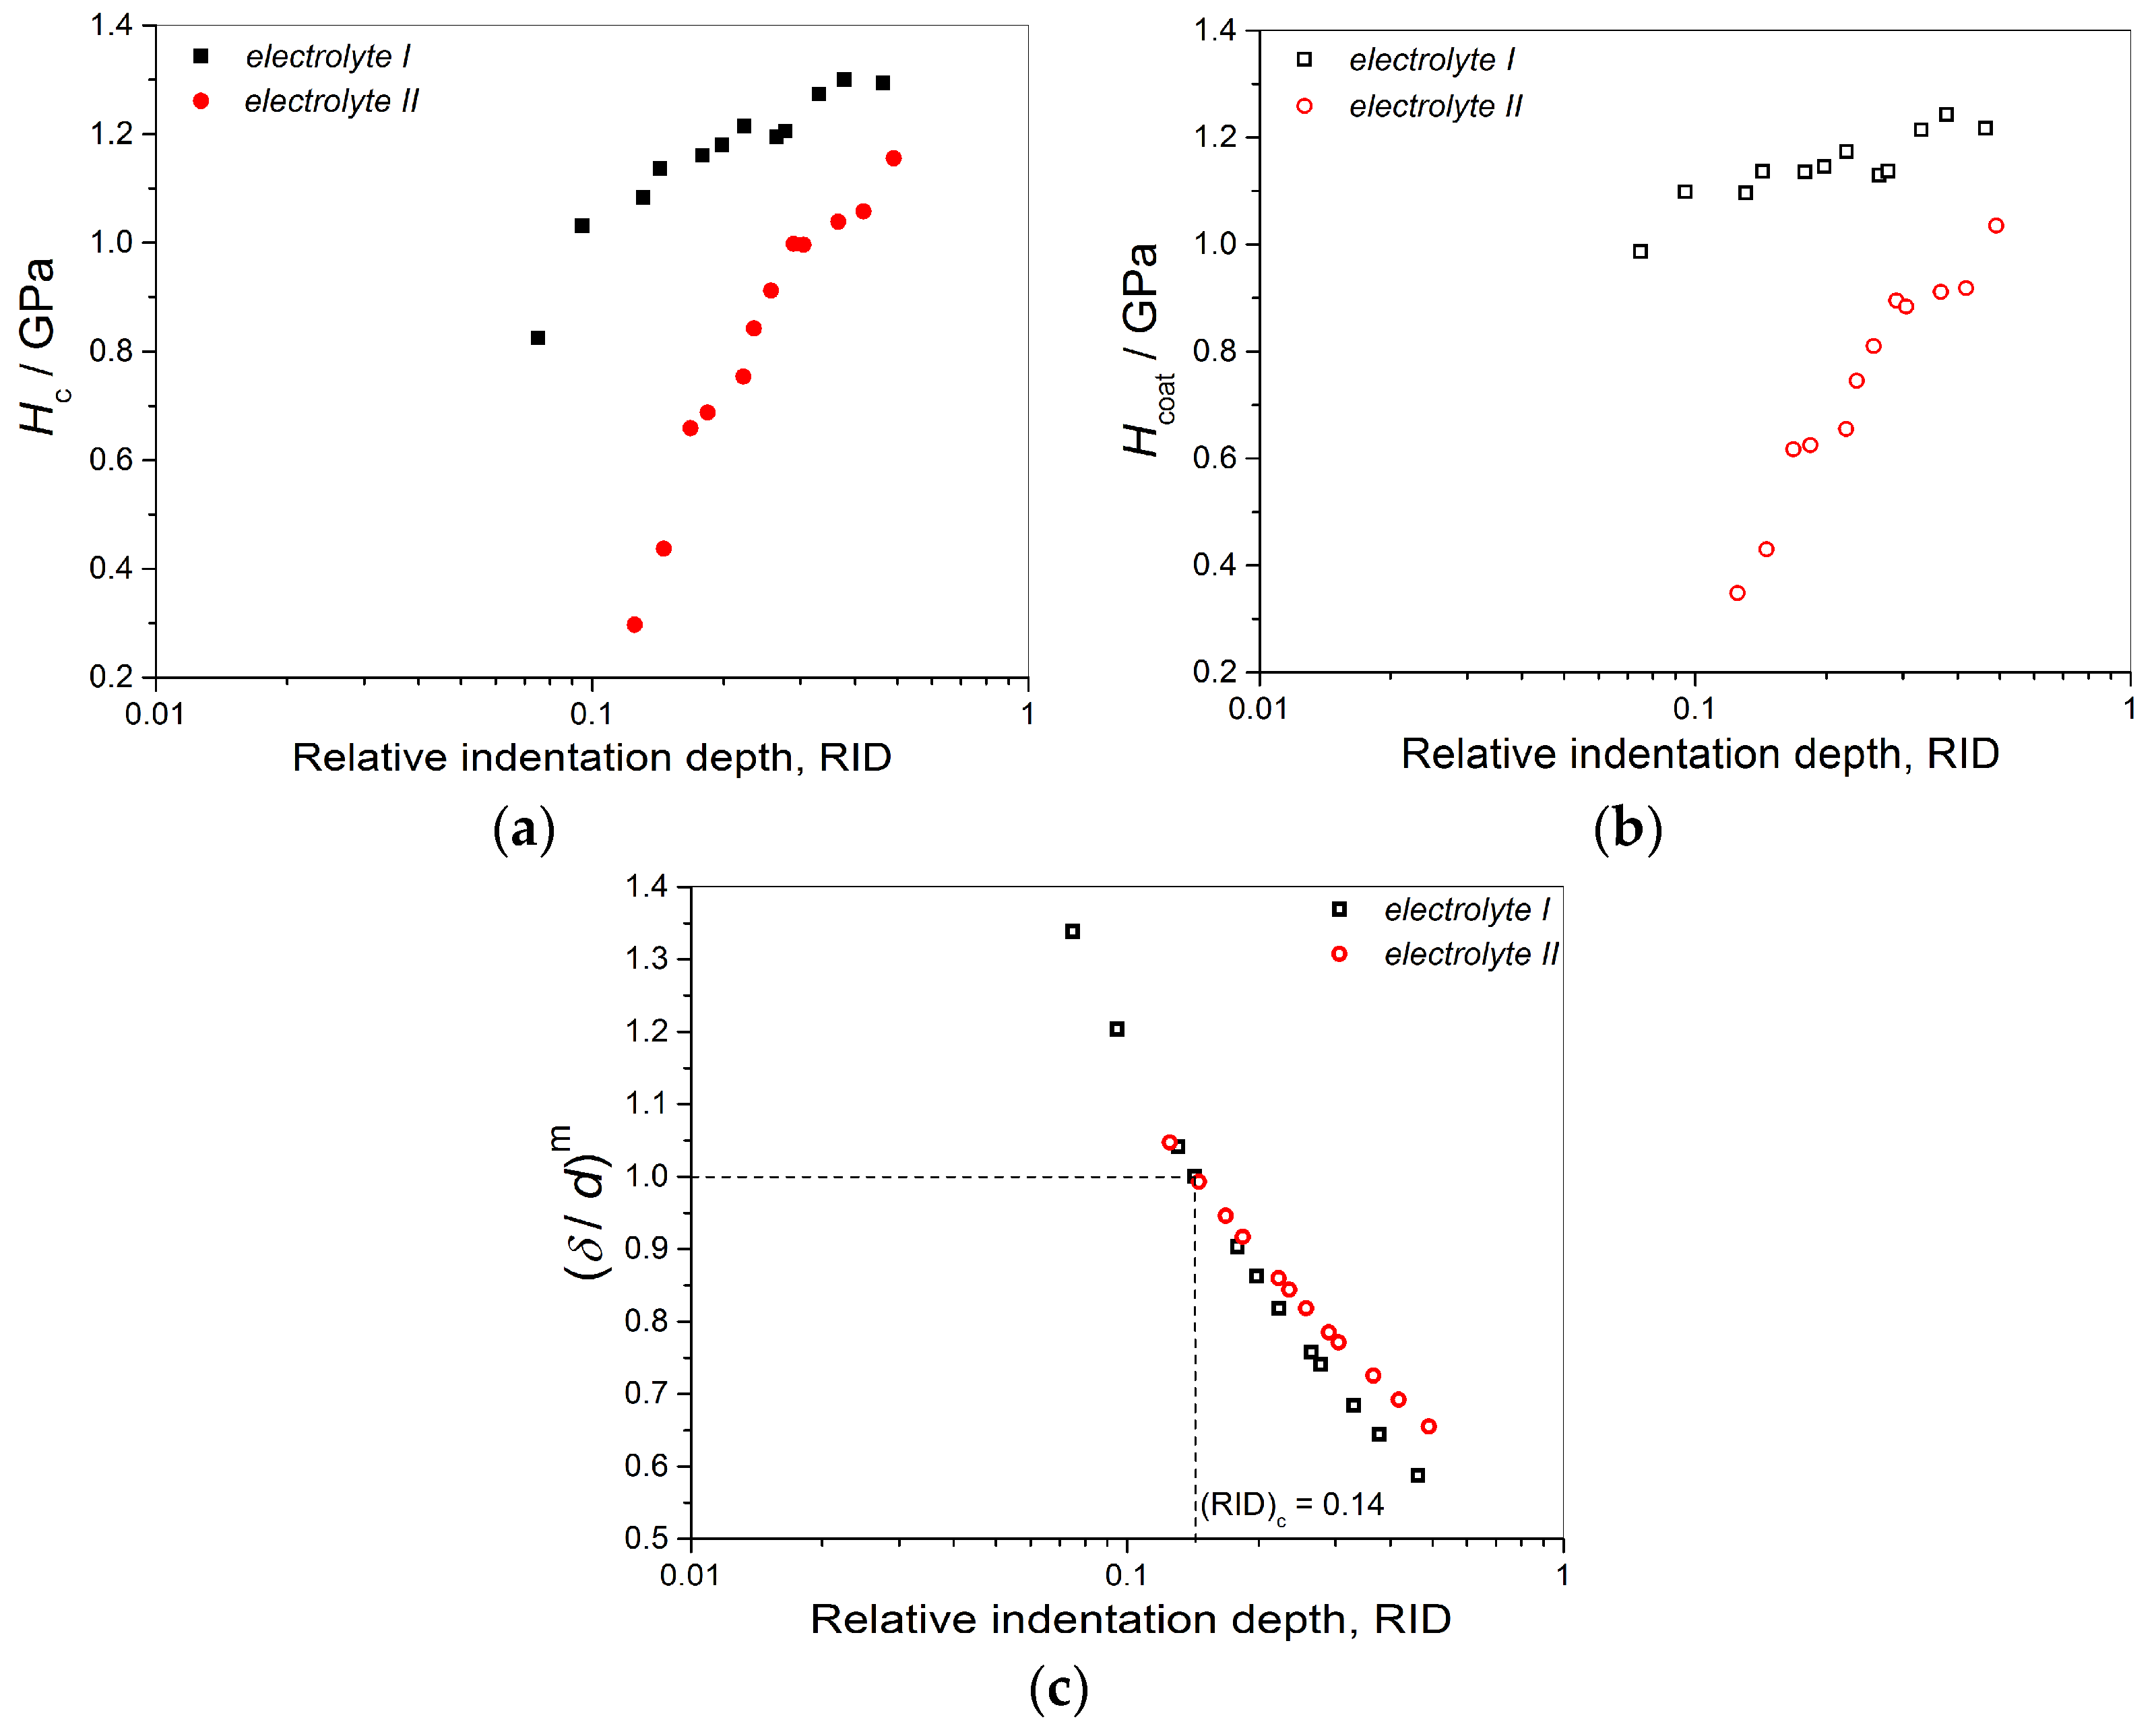
Hardness of the mat Cu coatings was larger than that obtained for mirror bright Cu coatings. This difference can be attributed to numerous boundaries among grains in the fine-grained mat coatings.
(c)
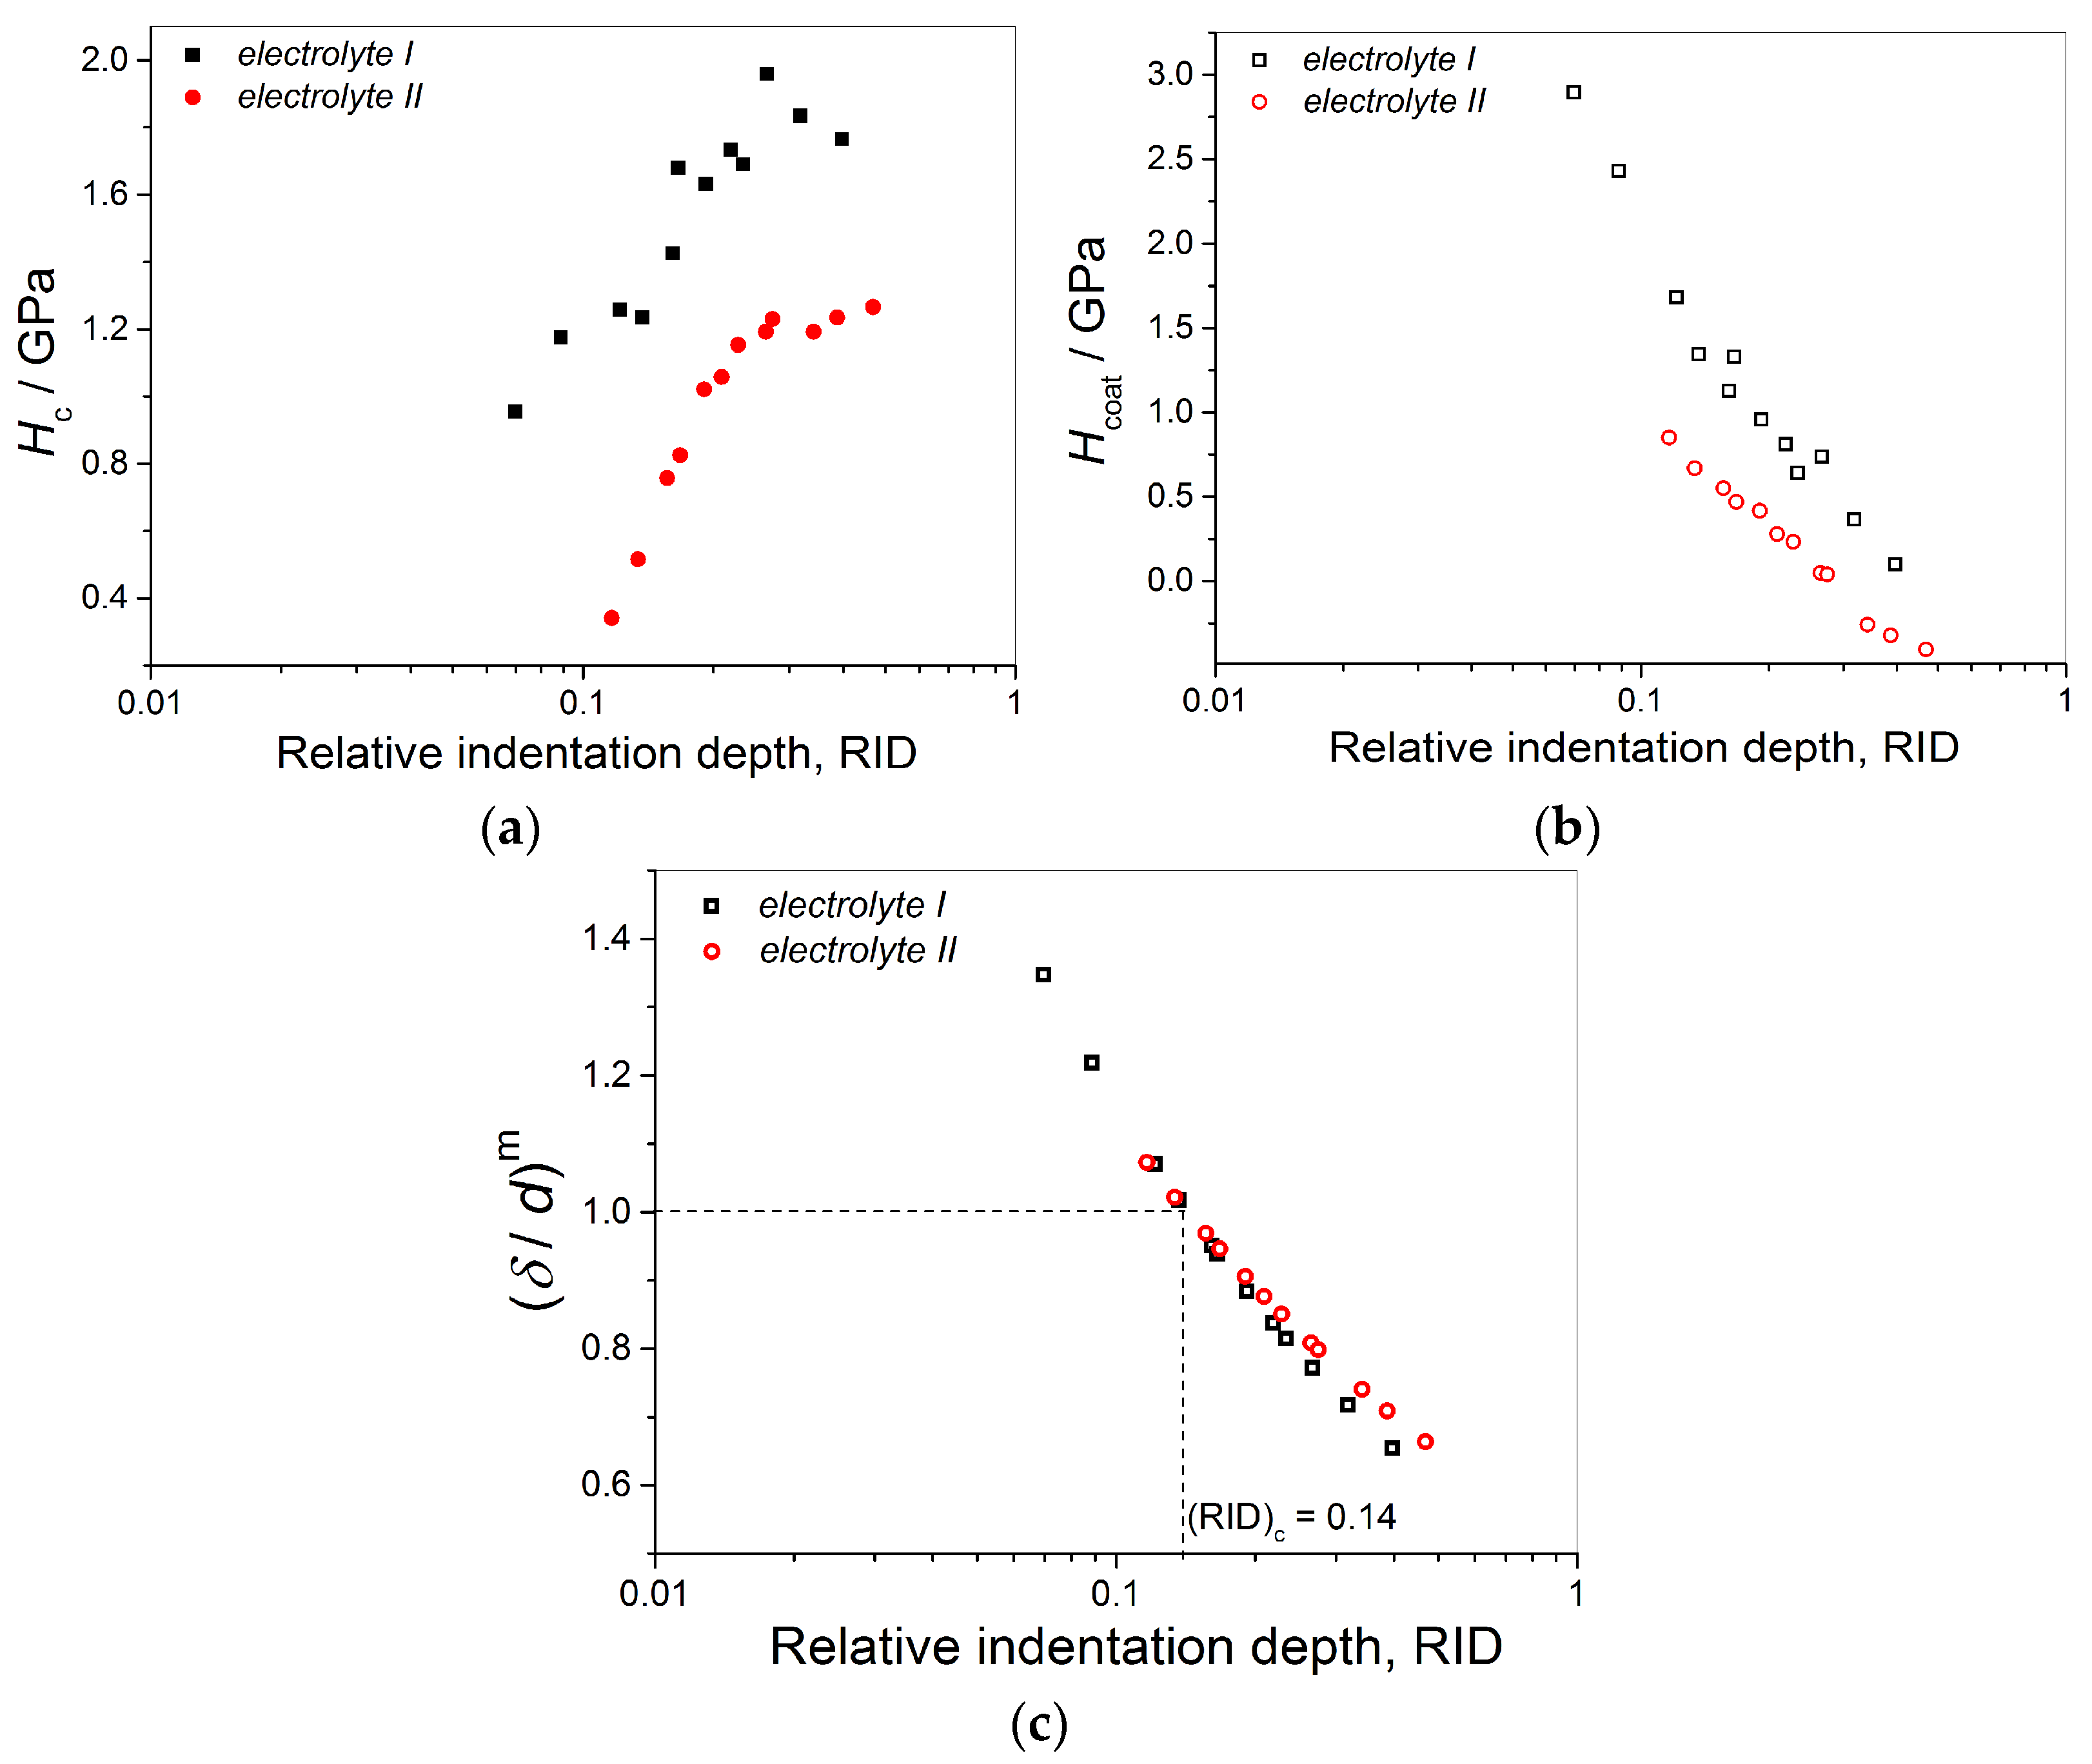
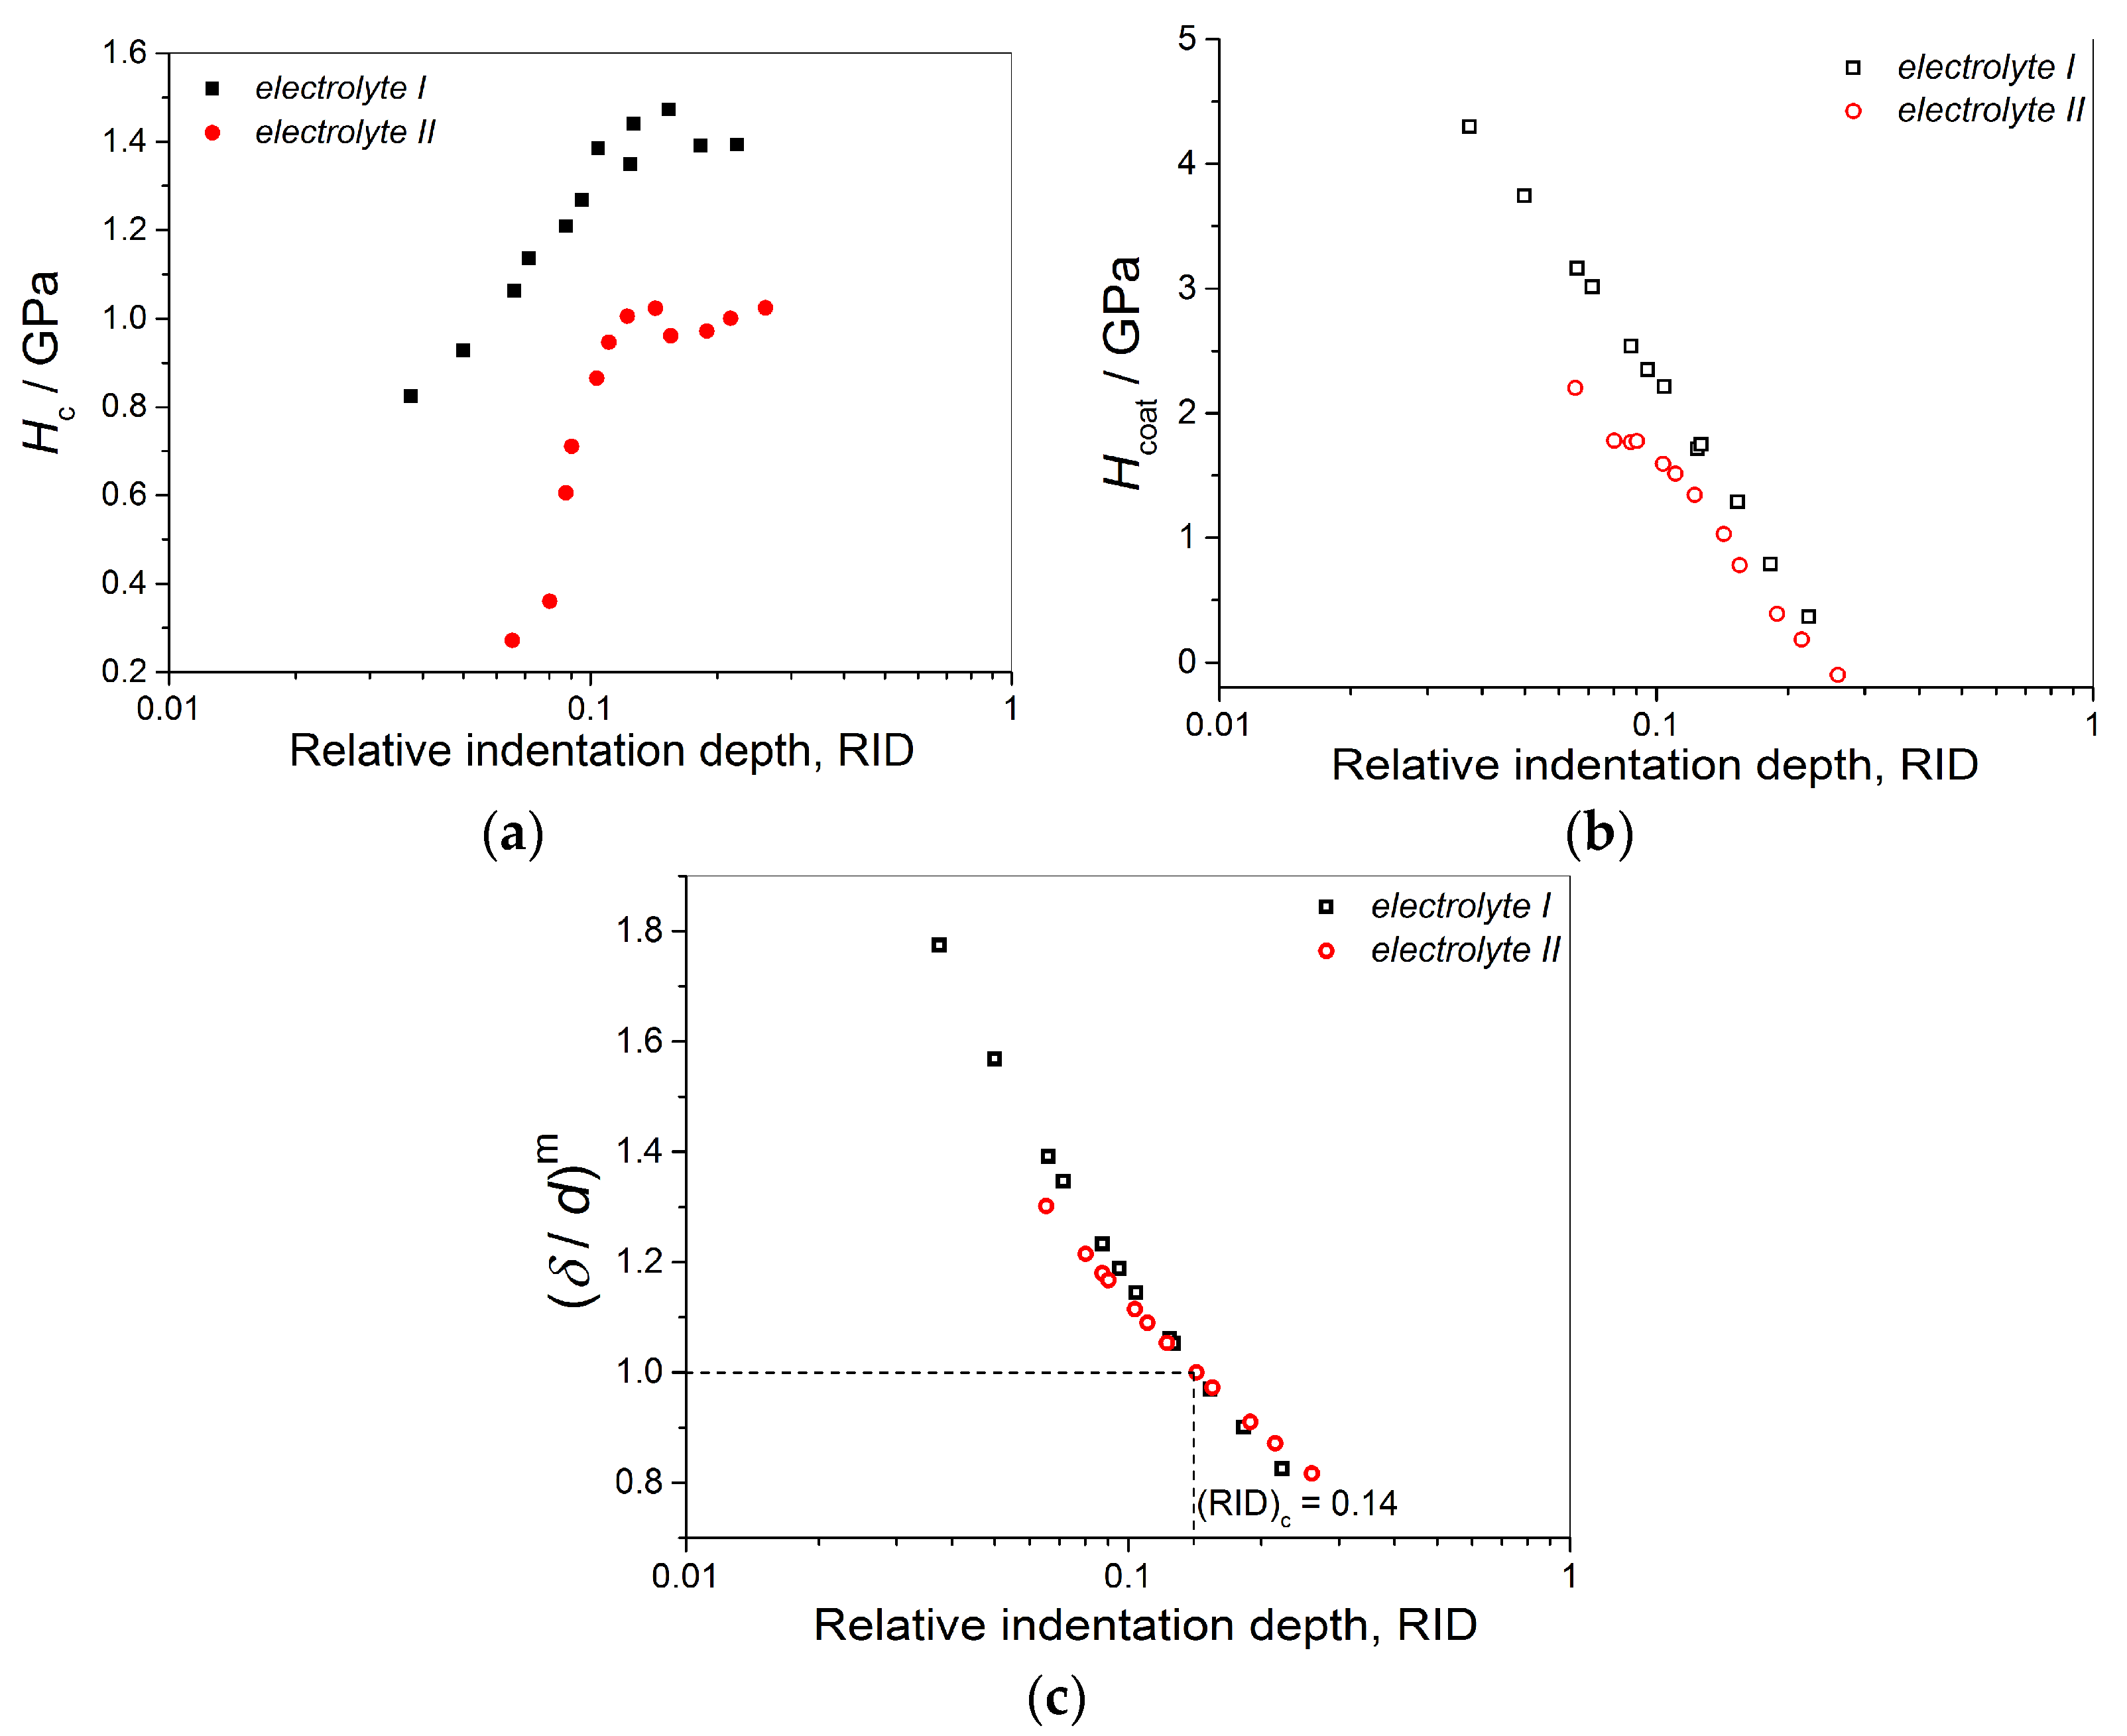
The shapes of the dependencies of the coating hardness calculated by the C–L model on the RID differ mutually for the Cu coatings obtained on the brass and the Si(111) cathodes. This indicated the strong effect of cathode hardness on coating hardness.
(d)
Irrespective of conditions of electrolysis, the critical or limiting relative indentation depth (RID) of 0.14 was established for all types of the coatings. This value separates the zone in which the composite hardness can be equaled with the coating hardness (negligible effect of the cathode hardness on the composite hardness) and the zone of a necessary application of the C–L model for a determination of the absolute hardness of the Cu coatings (the strong effect of the cathode hardness on the composite hardness).
(e)
The established RID value of 0.14 obtained by implementation of the C–L model represents novel criterion for an estimation of the absolute hardness of electrolytically obtained Cu coatings.

Author Contributions

Conceptualization, N.D.N.; J.S.L. and I.O.M.; investigation, I.O.M., R.V., D.G.V.-R. and N.D.N.; writing—original draft preparation N.D.N. and I.O.M.; writing—review and editing, N.D.N., J.S.L., V.J.R., D.G.V.-R., R.V. and I.O.M.; validation, N.D.N. and I.O.M.; resources, V.J.R., D.G.V.-R., I.O.M. and R.V.; visualization, N.D.N. All authors have read and agreed to the published version of the manuscript.

Funding

This work was financially supported by the Ministry of Education, Science and Technological Development of the Republic of Serbia. (Grants No. 451-03-9/2021-14/200026 and 451-03-9/2021-14/200135).

Institutional Review Board Statement

Not applicable.

Informed Consent Statement

Not applicable.

Data Availability Statement

The data presented in this study are available on request from the corresponding author or co-authors. The data are not publicly available.

Acknowledgments

This work was funded by Ministry of Education, Science and Technological Development of Republic of Serbia.

Conflicts of Interest

The authors declare no conflict of interest.

References

  1. Copper Plating Service. Available online: https://www.sharrettsplating.com/coatings/copper (accessed on 27 September 2021).
  2. Bharadishettar, N.; Bhat, U.K.; Panemangalore, D.B. Coating technologies for copper based antimicrobial active surfaces: A perspective review. Metals 2021, 11, 711. [Google Scholar] [CrossRef]
  3. Rohan, J.F.; Thompson, D. Frontiers of Cu Electrodeposition and Electroless plating for On-chip Interconnects. In Copper Electrodeposition for Nanofabrication of Electronics Devices; Kondo, K., Alkolkar, R.N., Barkey, D.P., Yokoi, M., Eds.; Springer: New York, NY, USA, 2014; Volume 171, pp. 99–101. [Google Scholar] [CrossRef]
  4. Wei, C.; Wu, G.; Yang, S.; Liu, Q. Electrochemical deposition of layered copper thin films based on the diffusion limited aggregation. Sci. Rep. 2016, 6, 34779. [Google Scholar] [CrossRef] [PubMed] [Green Version]
  5. Popov, K.I.; Djokić, S.S.; Nikolić, N.D.; Jović, V.D. Morphology of Electrochemically and Chemically Deposited Metals; Springer International Publishing: New York, NY, USA, 2016. [Google Scholar] [CrossRef]
  6. Chandrasekar, M.S.; Pushpavanam, M. Pulse and pulse reverse plating—Conceptual, advantages and applications. Electrochim. Acta 2008, 53, 3313–3322. [Google Scholar] [CrossRef]
  7. Lesage, J.; Pertuz, A.; Chicot, D. A New Method to Determine the Hardness of Thin Films. Matéria 2004, 9, 13–22. [Google Scholar]
  8. Lesage, J.; Pertuz, A.; Puchi-Cabrera, E.S.; Chicot, D. A model to determine the surface hardness of thin films from standard micro-indentation tests. Thin Solid Films 2006, 497, 232–238. [Google Scholar] [CrossRef]
  9. Lesage, J.; Chicot, D. A model for hardness determination of thin coatings from standard microindentation test. Surf. Coat. Technol. 2005, 200, 886–889. [Google Scholar] [CrossRef]
  10. Chicot, D.; Lesage, J. Absolute hardness of films and coatings. Thin Solid Films 1995, 254, 123–130. [Google Scholar] [CrossRef]
  11. Korsunsky, A.M.; McGurk, M.R.; Bull, S.J.; Page, T.F. On the hardness of coated systems. Surf. Coat. Technol. 1998, 99, 171–183. [Google Scholar] [CrossRef]
  12. Tuck, J.R.; Korunsky, A.M.; Bull, S.J.; Davidson, R.I. On the application of the work-of-indentation approach to depth-sensing indentation experiments in coated systems. Surf. Coat. Technol. 2001, 137, 217–224. [Google Scholar] [CrossRef]
  13. Lamovec, J.; Jovic, V.; Randjelovic, D.; Aleksic, R.; Radojevic, V. Analysis of the composite and film hardness of electrodeposited nickel coatings on different substrates. Thin Solid Films 2008, 516, 8646–8654. [Google Scholar] [CrossRef]
  14. Ma, Z.S.; Zhou, Y.C.; Long, S.G.; Lu, C. On the intrinsic hardness of a metallic film/substrate system: Indentation size and substrate effects. Int. J. Plast. 2012, 34, 1–11. [Google Scholar] [CrossRef] [Green Version]
  15. Chen, M.; Gao, J. The adhesion of copper films coated on silicon and glass substrates. Mod. Phys. Lett. B 2000, 14, 103–108. [Google Scholar] [CrossRef]
  16. He, J.L.; Li, W.Z.; Li, H.D. Hardness measurement of thin films: Separation from composite hardness. Appl. Phys. Lett. 1996, 69, 1402. [Google Scholar] [CrossRef]
  17. Hou, Q.; Gao, J.; Li, S. Adhesion and its influence on micro-hardness of DLC and SiC films. Eur. Phys. J. B 1999, 8, 493–496. [Google Scholar] [CrossRef]
  18. Magagnin, L.; Maboudian, R.; Carraro, C. Adhesion evaluation of immersion plating copper films on silicon by microindentation measurements. Thin Solid Films 2003, 434, 100–105. [Google Scholar] [CrossRef]
  19. Burnett, P.J.; Rickerby, D.S. The mechanical properties of wear-resistant coatings. II: Experimental studies and interpretation of hardness. Thin Solid Films 1987, 148, 51–65. [Google Scholar] [CrossRef]
  20. Bull, S.J.; Rickerby, D.S. New developments in the modeling of the hardness and scratch adhesion of thin films. Surf. Coat. Technol. 1990, 42, 149–164. [Google Scholar] [CrossRef]
  21. Mladenović, I.O.; Lamovec, J.S.; Vasiljević Radović, D.G.; Vasilić, R.; Radojević, V.J.; Nikolić, N.D. Morphology, Structure and Mechanical Properties of Copper Coatings Electrodeposited by Pulsating Current (PC) Regime on Si(111). Metals 2020, 10, 488. [Google Scholar] [CrossRef] [Green Version]
  22. Mladenović, I.O.; Nikolić, N.D.; Lamovec, J.S.; Vasiljević Radović, D.G.; Radojević, V.J. Application of the Composite Hardness Models in the Analysis of Mechanical Characteristics of Electrolytically Deposited Copper Coatings: The Effect of the Type of Substrate. Metals 2021, 11, 111. [Google Scholar] [CrossRef]
  23. Nikolić, N.D.; Rakočević, Z.; Popov, K.I. Structural Characteristics of Bright Copper Surfaces. J. Electroanal. Chem. 2001, 514, 56–66. [Google Scholar] [CrossRef]
  24. Nikolić, N.D.; Rakočević, Z.; Popov, K.I. Reflection and structural analyses of mirror bright metal coatings. J. Solid State Electrochem. 2004, 8, 526–531. [Google Scholar] [CrossRef]
  25. Berube, L.P.; Esperance, G.L. A Quantitative Method of Determining of the Degree of Texture of Zinc Electrodeposits. J. Electrochem. Soc. 1989, 136, 2314–2315. [Google Scholar] [CrossRef]
  26. Nikolić, N.D.; Maksimović, V.M.; Avramović, L. Correlation of Morphology and Crystal Structure of Metal Powders Produced by Electrolysis Processes. Metals 2021, 11, 859. [Google Scholar] [CrossRef]
  27. Li, H.; Bradt, R.C. Knoop microhardness anisotropy of single-crystal LaB6. Mater. Sci. Eng. A 1991, 142, 51–61. [Google Scholar] [CrossRef]
  28. Buckle, H. The Science of Hardness Testing and Its Research Applications; Westbrook, J.W., Conrad, H., Eds.; American Society for Metals: Metals Park, OH, USA, 1973; p. 453. [Google Scholar]
  29. Mladenović, I.O.; Lamovec, J.S.; Jović, V.B.; Obradov, M.; Vasiljević Radović, D.G.; Nikolić, N.D.; Radojević, V.J. Mechanical characterization of copper coatings electrodeposited onto different substrates with and without ultrasound assistance. J. Serb. Chem. Soc. 2019, 84, 729–741. [Google Scholar] [CrossRef] [Green Version]
  30. Mladenović, I.O.; Lamovec, J.S.; Vasiljević-Radović, D.G.; Radojević, V.J.; Nikolić, N.D. Mechanical features of copper coatings electrodeposited by the pulsating current (PC) regime on Si(111) substrate. Int. J. Electrochem. Sci. 2020, 15, 12173–12191. [Google Scholar] [CrossRef]
  31. Avramović, L.; Maksimović, V.M.; Baščarević, Z.; Ignjatović, N.; Bugarin, M.; Marković, R.; Nikolić, N.D. Influence of the Shape of Copper Powder Particles on the Crystal Structure and Some Decisive Characteristics of the Metal Powders. Metals 2019, 9, 56. [Google Scholar] [CrossRef] [Green Version]
  32. Avramović, L.; Pavlović, M.M.; Maksimović, V.M.; Vuković, M.; Stevanović, J.S.; Bugarin, M.; Nikolić, N.D. Comparative Morphological and Crystallographic Analysis of Electrochemically- and Chemically-Produced Silver Powder Particles. Metals 2017, 7, 160. [Google Scholar] [CrossRef] [Green Version]
  33. Plieth, W. Additives in the electrocrystallization process. Electrochim. Acta 1992, 37, 2115–2121. [Google Scholar] [CrossRef]
  34. Muresan, L.M.; Varvara, S.C. Leveling and Brightening Mechanisms in Metal Electrodeposition. In Metal Electrodeposition; Nunez, M., Ed.; Nova Science Publishers, Inc.: New York, NY, USA, 2005; pp. 1–45. [Google Scholar]
  35. Kim, J.J.; Kim, S.-K.; Kim, Y.S. Catalytic behavior of 3-mercapto-1-propane sulfonic acid on Cu electrodeposition and its effect on Cu film properties for CMOS device metallization. J. Electroanal. Chem. 2003, 542, 61–66. [Google Scholar] [CrossRef]
  36. Holzwarth, U.; Gibson, N. The Scherrer equation versus the ‘Debye-Scherrer equation’. Nat. Nanotech. 2011, 6, 534. [Google Scholar] [CrossRef] [PubMed]
  37. Varea, A.; Pellicer, E.; Pané, S.; Nelson, B.J.; Suriñach, S.; Baró, M.D.; Sort, J. Mechanical Properties and Corrosion Behaviour of Nanostructured Cu-rich CuNi Electrodeposited Films. Int. J. Electrochem. Sci. 2012, 7, 1288–1302. [Google Scholar]
  38. Petch, N.J. The cleavage strength of polycrystals. J. Iron Steel Inst. 1953, 174, 25–28. [Google Scholar]
  39. Mishra, R.; Basu, B.; Balasubramaniam, R. Effect of grain size on the tribological behavior of nanocrystalline nickel. Mater. Sci. Eng. A 2004, 373, 370–373. [Google Scholar] [CrossRef]
  40. Manika, I.; Maniks, J. Effect of substrate hardness and film structure on indentation depth criteria for film hardness testing. J. Phys. D Appl. Phys. 2008, 41, 074010. [Google Scholar] [CrossRef]
  41. Manika, I.; Maniks, J. Characteristics of deformation localization and limits to the microhardness testing of amorphous and polycrystalline coatings. Thin Solid Films 1992, 208, 223–227. [Google Scholar] [CrossRef]
  42. Lebouvier, D.; Gilormini, P.; Felder, E. A kinematic model for plastic indentation of a bilayer. Thin Solid Films 1989, 172, 227–239. [Google Scholar] [CrossRef]
  43. Bull, S.J. Nanoindentation of coatings. J. Phys. D Appl. Phys. 2005, 38, R393. [Google Scholar] [CrossRef]
  44. Kramer, D.E.; Volinsky, A.A.; Moody, N.R.; Gerberich, W.W. Substrate effects on indentation plastic zone development in thin soft films. J. Mater. Res. 2001, 16, 3150–3157. [Google Scholar] [CrossRef] [Green Version]
  45. Beegan, D.; Chowdhury, S.; Laugier, M.T. The nanoindentation behaviour of hard and soft films on silicon substrates. Thin Solid Films 2004, 466, 167–174. [Google Scholar] [CrossRef]
  46. Wu, T.W.; Moshref, M.; Alexopoulos, P.S. The effect of the interfacial strength on the mechanical properties of aluminum films. Thin Solid Films 1990, 187, 295–307. [Google Scholar] [CrossRef]
Figure 1. The morphology of 20 µm thick Cu coatings obtained by electrodeposition at a current density of 50 mA cm−2 on the brass from: (a) the basic electrolyte (electrolyte I) and (b) the electrolyte with leveling/brightening additives (electrolyte II). Magnification: ×1500.
Metals 11 01807 g001
Figure 2. The AFM analysis of 20 µm thick Cu coating obtained by electrodeposition at a current density of 50 mA cm−2 on the brass from electrolyte I: (a) the surface topography, (b) the histogram and (c) line section analysis (X-axis: distance line; Y-axis: height profile). Scan size: (70 × 70) µm2.
Metals 11 01807 g002
Figure 3. The AFM analysis of 20 µm thick Cu coating obtained by electrodeposition at a current density of 50 mA cm−2 on the brass from electrolyte II: (a) the surface topography, (b) the histogram and (c) line section analysis (X-axis: distance line; Y-axis: height profile). Scan size: (70 × 70) µm2.
Metals 11 01807 g003
Figure 4. The dependencies of (a) the composite (Hc) and (b) the calculated coating (Hcoat) hardness on the RID for the 20 µm thick Cu coatings electrodeposited on the brass from electrolytes I and II, and (c) the dependencies of (δ/d)m on the RID for the same Cu coatings.
Metals 11 01807 g004
Figure 5. The AFM analysis of 20 µm thick Cu coating obtained by electrodeposition at a current density of 50 mA cm-2 on the Si(111) substrate from electrolyte I: (a) the surface topography, (b) the histogram and (c) line section analysis (X-axis: distance line; Y-axis: height profile). Scan size: (70 × 70) µm2.
Metals 11 01807 g005
Figure 6. The AFM analysis of 20 µm thick Cu coating obtained by electrodeposition at a current density of 50 mA cm−2 on the Si(111) substrate from electrolyte II: (a) the surface topography, (b) the histogram and (c) line section analysis (X-axis: distance line; Y-axis: height profile). Scan size: (70 × 70) µm2.
Metals 11 01807 g006
Figure 7. The dependencies of (a) the composite (Hc) and (b) the calculated coating (Hcoat) hardness on the RID for the 20 µm thick Cu coatings electrodeposited on the Si(111) from electrolytes I and II, and (c) the dependencies of (δ/d)m on the RID for the same Cu coatings.
Metals 11 01807 g007
Figure 8. The AFM analysis of 40 µm thick Cu coating obtained by electrodeposition at a current density of 50 mA cm−2 on the Si(111) substrate from electrolyte I: (a) the surface topography, (b) the histogram and (c) line section analysis (X-axis: distance line; Y-axis: height profile). Scan size: (70 × 70) µm2.
Metals 11 01807 g008
Figure 9. The AFM analysis of 40 µm thick Cu coating obtained by electrodeposition at a current density of 50 mA cm-2 on the Si(111) substrate from electrolyte II: (a) the surface topography, (b) the histogram and (c) line section analysis (X-axis: distance line; Y-axis: height profile). Scan size: (70 × 70) µm2.
Metals 11 01807 g009aMetals 11 01807 g009b
Figure 10. The XRD patterns of the 40 µm Cu coatings obtained from electrolytes without (electrolyte I) and with additives (electrolyte II).
Metals 11 01807 g010
Figure 11. The dependencies of (a) the composite (Hc) and (b) the calculated coating (Hcoat) hardness on the RID for the 40 µm thick Cu coatings electrodeposited on the Si(111) from electrolytes I and II, and (c) the dependencies of (δ/d)m on the RID for the same Cu coatings.
Metals 11 01807 g011
Table 1. The conditions of electrodeposition applied for a formation of uniform Cu coatings. In all experiments: j = 50 mA cm−2.
No.The Type of ElectrolyteThe Type of CathodeThe Coating Thickness
(δ/µm)
1.electrolyte Ibrass20
2.electrolyte IIbrass20
3.electrolyte ISi(111)20
4.electrolyte IISi(111)20
5.electrolyte ISi(111)40
6.electrolyte IISi(111)40
Table 2. Texture calculations for the Cu coatings obtained from the electrolytes without (electrolyte I) and with additives (electrolyte II). (electrolyte I—I; electrolyte II—II; s—Cu standard).
PlaneR (in %)RsTCRTC (in %)
(hkl)RIRII(in %)TCITCIIRTCIRTCII
(111)7.93.3154.60.1450.0611.711.47
(200)3.292.1225.10.1273.671.4988.31
(220)84.04.0510.97.710.3790.678.90
(311)4.90.529.40.5210.0556.131.32
Publisher’s Note: MDPI stays neutral with regard to jurisdictional claims in published maps and institutional affiliations.

