1. Introduction
The increased use of Al alloy in recent decades has seen an increased demand for high-pressure die casting (HPDC) in the automotive, aerospace, and transportation industries. In particular, as the demand for eco-friendly and electric vehicles increases, welding and heat treatment are becoming very important to meet the weight reduction, complexity (integral molding), and high functionality of die castings.
The HPDC process is an effective casting process for producing metal parts of a particular shape by forcing molten metal into a mold (die) under high pressure. HPDC has several advantages such as high productivity, smooth surface, and the ability to afford thin castings with accurate dimensions. However, there is a limit in its application to high-strength parts requiring a load or parts requiring elongation, owing to the formation of defects such as pores and shrinkage holes. Additionally, T6 heat treatment and welding are difficult in some cases. In particular, heat treatment by blistering on the surface of thin castings is very difficult [
1,
2,
3]. Gas porosity occurs as a result of the lubricating oil (nitrogen formation), release agent (hydrogen formation), and air entrapment during the filling process. Therefore, it is necessary to reduce gas porosity by using lubricating oils and release agents with low gas generation or by applying a vacuum system [
4,
5].
Much research on the reduction of the gas porosity in die castings has been reported. A die-casting process comprising a vacuum system is one way to reduce gas porosity in castings. Conventional vacuum die casting incorporates a vacuum of <200 mbar to realize inner gas quantities in the castings ranging between 10 and 15 cc/100 g [
6,
7]. However, it still has many gas porosities to apply to heat treatment and welding. In high-vacuum die casting, the vacuum is <50 mbar, and the inner gas quantities of the castings can be reduced to values ≤3 cc/100 g, so that the casting is heat treatable and weldable. However, this process has the disadvantage of high facility investment cost [
7,
8,
9].
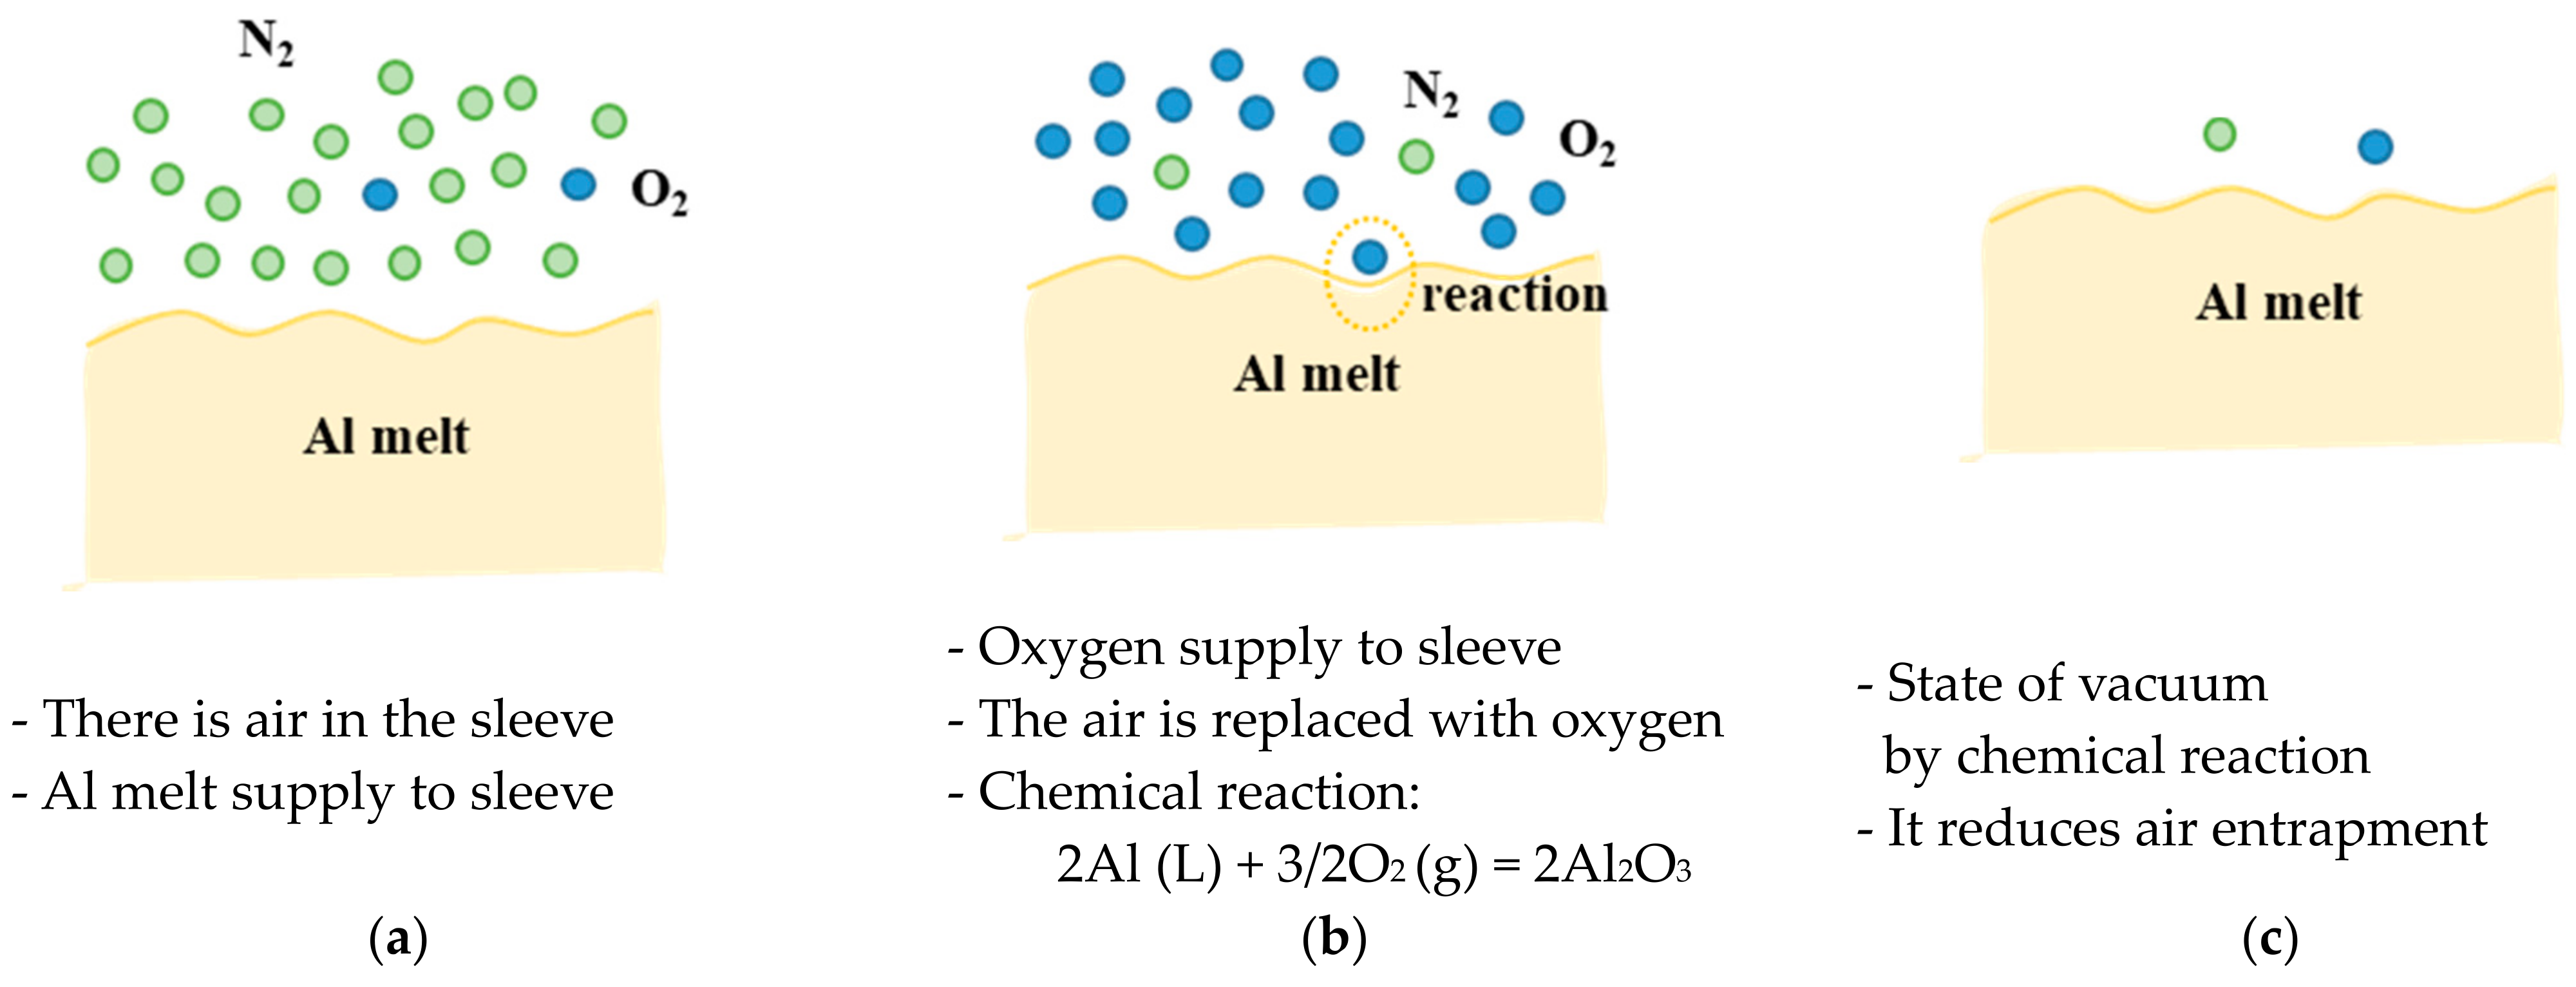
Pore-free (PF) die casting is another effective process to reduce the gas porosity in castings. In this process, the air in the mold and sleeve is replaced with active oxygen, and reaction of the active oxygen and molten aluminum form a vacuum in the mold and sleeve.
Figure 1 shows the oxidation reaction with molten aluminum: When molten aluminum is injected in the sleeve, the inner space in the sleeve is mostly filled with nitrogen, while other elements are present in small amounts (
Figure 1a). When active oxygen is injected, the nitrogen, which makes up most of the air in the sleeve, is replaced with active oxygen (
Figure 1b). Thus, when the molten aluminum is poured into the mold, the active oxygen oxidizes the molten aluminum (Equation (1)) [
7,
8,
10].
During the chemical reaction, the mold interior is instantly vacuumed to reduce air entrapment events, thus reducing gas porosity (
Figure 1c). Most of the Al
2O
3 formed in the chemical reaction is very fine with an average particle size of <1 μm. In addition, as ≤0.1 wt % oxide is formed in the castings, the effect on the mechanical properties is insignificant, except for a slight increase in the hardness [
8,
10]. Notably, PF die casting affords castings of low gas porosity, similar to those attained by high-vacuum die casting. In addition, it has the advantage of cheaper facility costs than those required for high-vacuum die casting [
7,
10].
In previous studies, three methods (vacuum die casting, PF die casting, and vacuum + PF die casting (VPFDC)) were applied to mitigate the gas porosity in castings, which is the biggest disadvantage of conventional die casting (CDC). The results confirmed that compared to CDC, all three methods reduce the gas porosity. In particular, it was confirmed that the gas porosity was significantly reduced by VPFDC, in which the vacuum and oxygen injection systems were combined [
7].
In this study, we compared the gas porosities of castings fabricated using PF die casting with varying amounts of injected oxygen. All castings were subjected to T6 heat treatment, and computed tomography (CT) was performed to elucidate the microstructure and mechanical properties of the castings before and after T6 heat treatment.
2. Materials and Methods
In this study, test casting was performed by applying the PF die-casting method with varied amounts of injected oxygen, using a 125-ton cold-chamber die-casting machine (TOYO, TOYO125, Ulsan, Korea), and each specimen was cast 20 pieces. The composition of the Al–Si–Cu alloy used in the study was confirmed by X-ray fluorescence (XRF, Panalytical, Ulsan, Korea) and is listed in
Table 1 [
3,
6,
7].
Prior to die casting, gas bubbling filtration (GBF, FS korea, Ulsan, Korea) was performed at a speed of 300 rpm for 8 min. Subsequently, after hydrogen gas removal and molten metal inclusion, test casting was performed according to the casting conditions listed in
Table 2 [
3,
7,
11].
During casting, the pouring and die temperatures were maintained at 680 °C and 150–200 °C, respectively. For all the processes, the low velocity was gradually increased to 0.1
→0.2
→0.25 m/s, while the high velocity was 1.5 m/s.
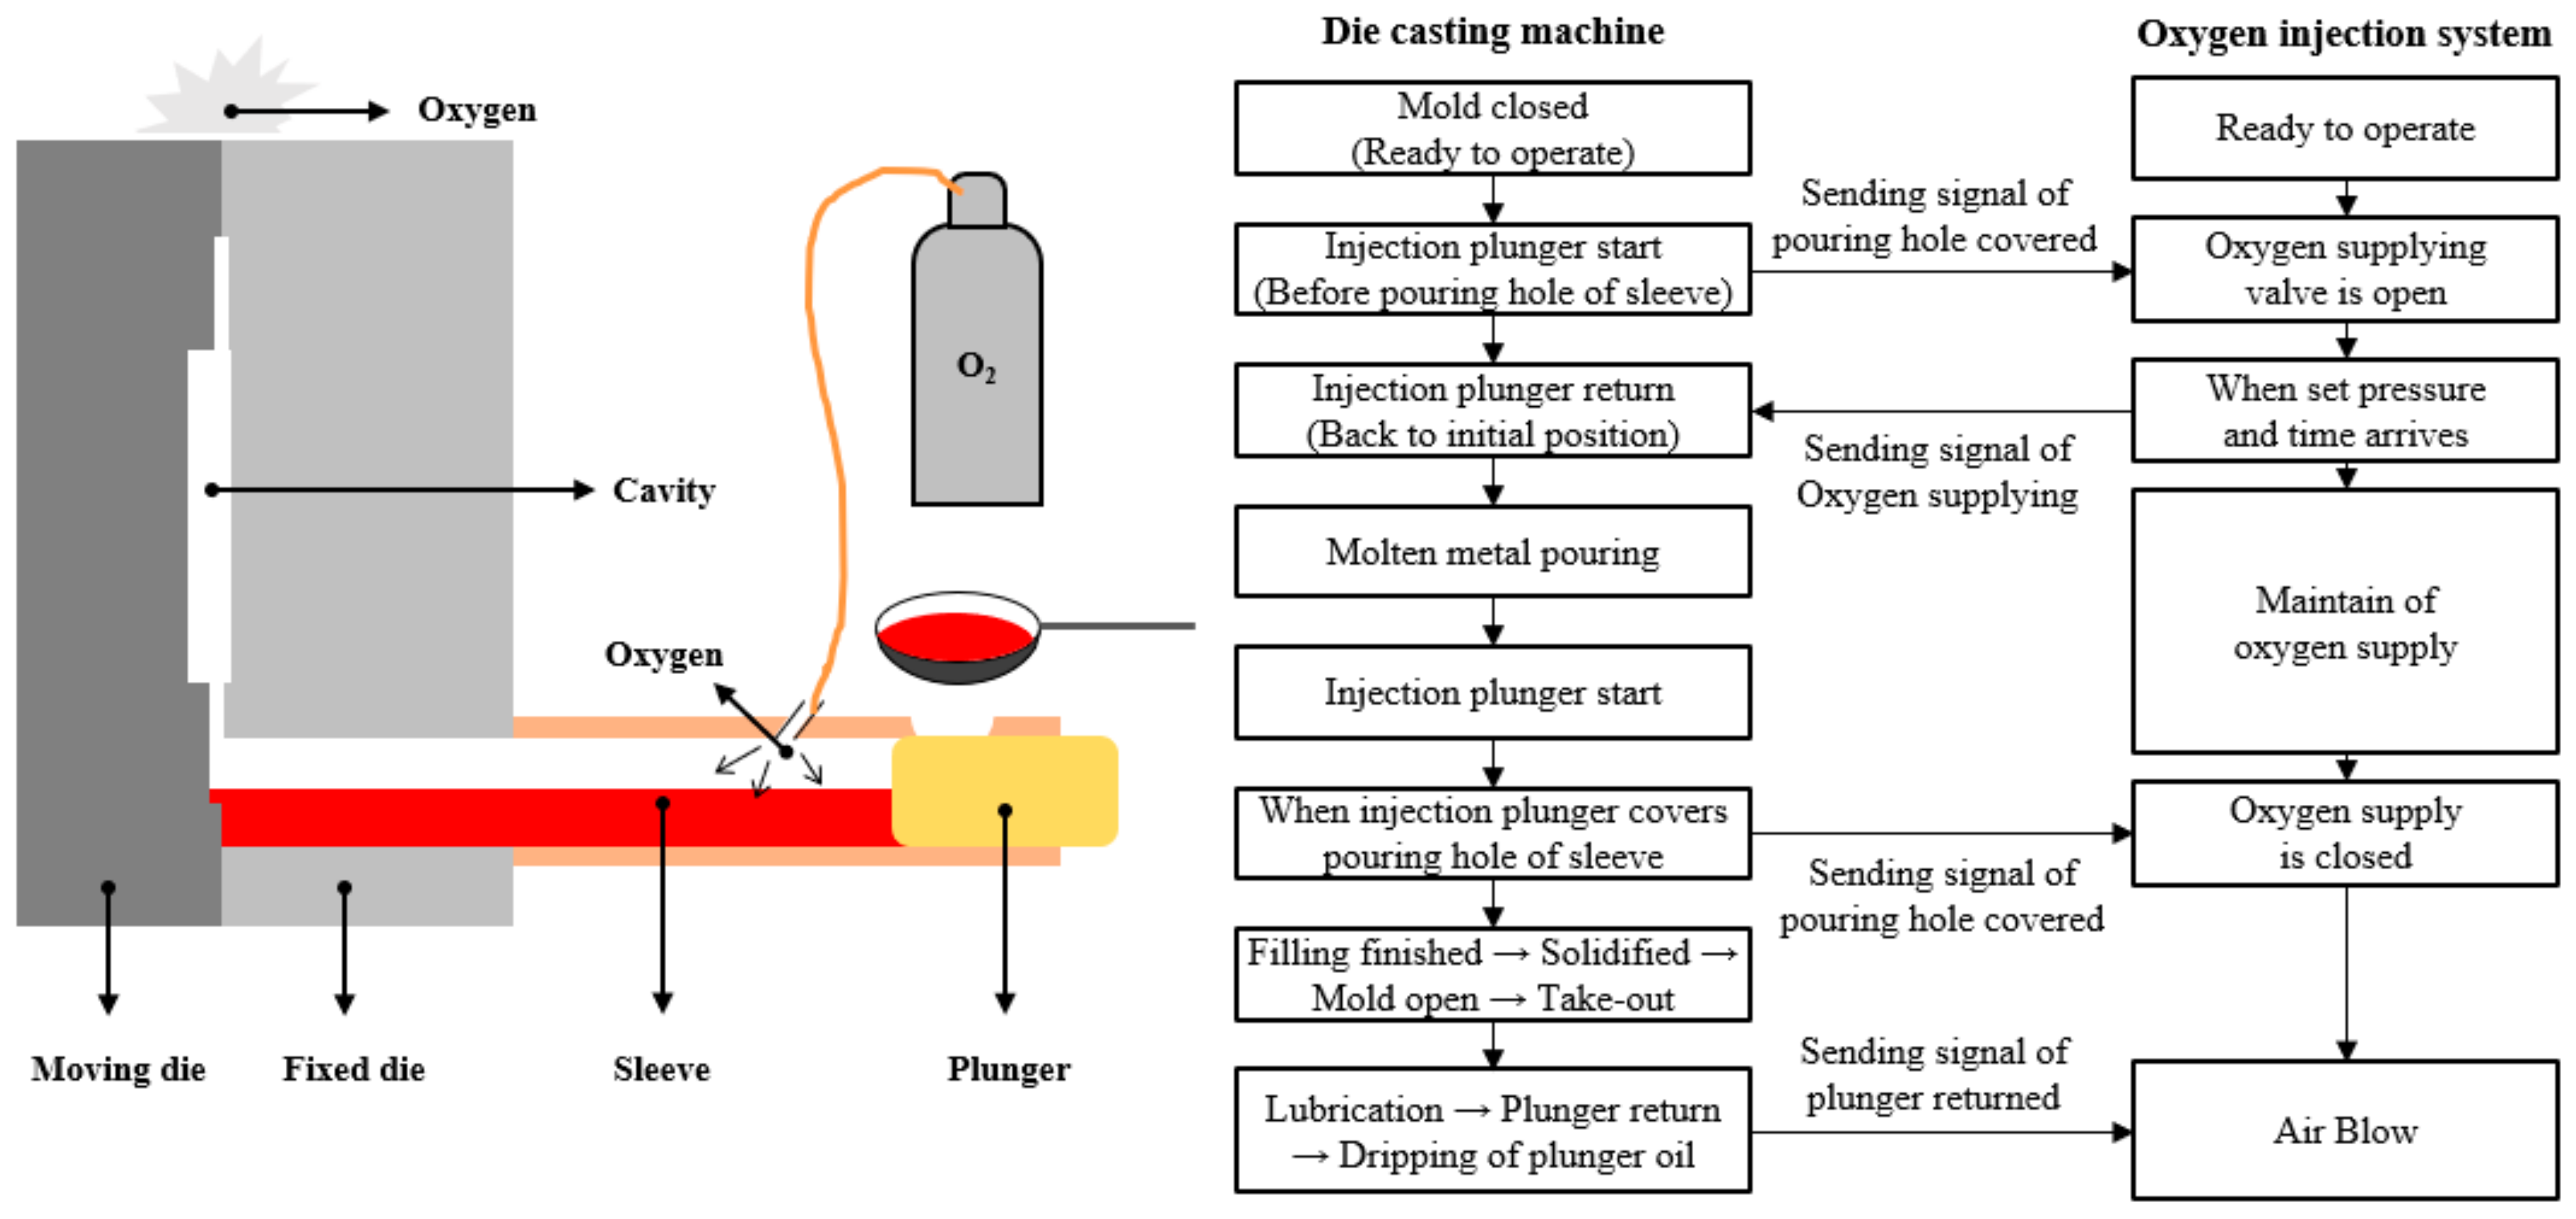
Figure 2 shows a schematic diagram of the PF die-casting process: The oxygen injection process was performed before supplying the molten metal in the sleeve. First, the plunger was pushed to close the sleeve inlet, after which oxygen was injected at a pressure of 5 bar for 2.5 s. Once the plunger returned to its original position, molten metal was poured, thereby moving the plunger and initiating the die-casting process. The other casting conditions were the same as those of the general die-casting process. As shown in
Table 2, the injected oxygen amount was set to five different values and was determined in proportion to the volume in the mold and sleeve. Thus, the mold and sleeve volumes were calculated, and the injected oxygen amount was calculated at 0 L (0%), 0.42 L (50%), 0.84 L (100%), 1.26 L (150%), and 1.68 L (200%), based on the volume of the internal empty space [
3,
7,
10].
After die casting, T6 heat treatment was performed for blister testing and mechanical property analysis. Solution heat treatment was performed at 520 °C for 3 h and aging was performed at 160 °C for 3 h. A Micro Focus 3D CT system (Nikon, XTH320L, Ulsan, Korea) was employed to analyze the gas porosity of each specimen before and after heat treatment. The CT analysis was performed on only one casting per condition, not on all castings. The volume of the measured area in the castings is 79,601 mm
3. According to the specifications, the resolution of this system approximates 30 µm; however, the actual resolution used in the experimental inspection approximated 70 µm [
3,
4,
7,
12]. The inner gas quantities of each specimen were measured with an inner gas detector (DIAVAC LIMITED, DGM-ALDC-100, Ulsan, Korea) to supplement the CT results. The inner gas detector measured the inner gas quantities by the vacuum fusion extraction method [
13]. This analytical method, established by C. E. Ransley et al. [
14], creates a high vacuum inside the device, heats the specimen inserted into the device to a high temperature to release gas, and calculates the amount of gas from the pressure change of the vacuum gauge. Accordingly, instead of one specific element, the total amount of gas in the specimen is measured. In this study, the three sections (runner and biscuit, product, and overflow and chill vent) of each specimen were measured in the vacuum state (8.0 × 10
−2 Pa) at high temperature (700 °C). The result value of each condition was measured 5 times and averaged. In addition, a residual gas analyzer was installed in the inner gas detector to measure the components of the gas formed in the molten casting [
3,
5,
7,
13,
15].
Specimens for microstructure analysis were collected from the centers of round tensile test bars. Optical microscopy (OM; Olympus BX51, Ulsan, Korea) was employed to elucidate the secondary dendrite arm spacing (SADS) and microporosity of the specimen, while scanning electron microscopy (SEM; Hitachi, SU8020, Ulsan, Korea) was performed for microstructure and oxide analyses of the specimens. X-ray diffraction (XRD; Bruker AXS, D8 ADVANCE, Ulsan, Korea) was also employed to analyze the phase composition of the specimens. Finally, tensile testing (Instron, 5989, Ulsan, Korea) was performed in accordance with ASTM E08 standard to analyze the mechanical properties of the specimens before and after heat treatment [
16,
17,
18,
19,
20]. The result value of each condition was measured 20 times and averaged. The reproducibility and repeatability of the tensile test results for each process were confirmed through Weibull statistical analysis. For this analysis, a three-parameter Weibull distribution was applied, using the expressions [
9,
16,
20]:
where
Pf represents the cumulative probability of specimen failure during tensile testing;
σ is the yield strength, maximum tensile strength, or elongation tested during tensile testing;
σu is the critical value;
σ0 is the stress or strain corresponding to a failure probability of 63.2%; and
m is the Weibull coefficient, wherein a higher Weibull coefficient indicates higher repeatability and reliability.
Pf was determined using the equation
where
i is the number of samples tested and
n is the total number of samples tested [
9,
16,
20].
3. Results and Discussion
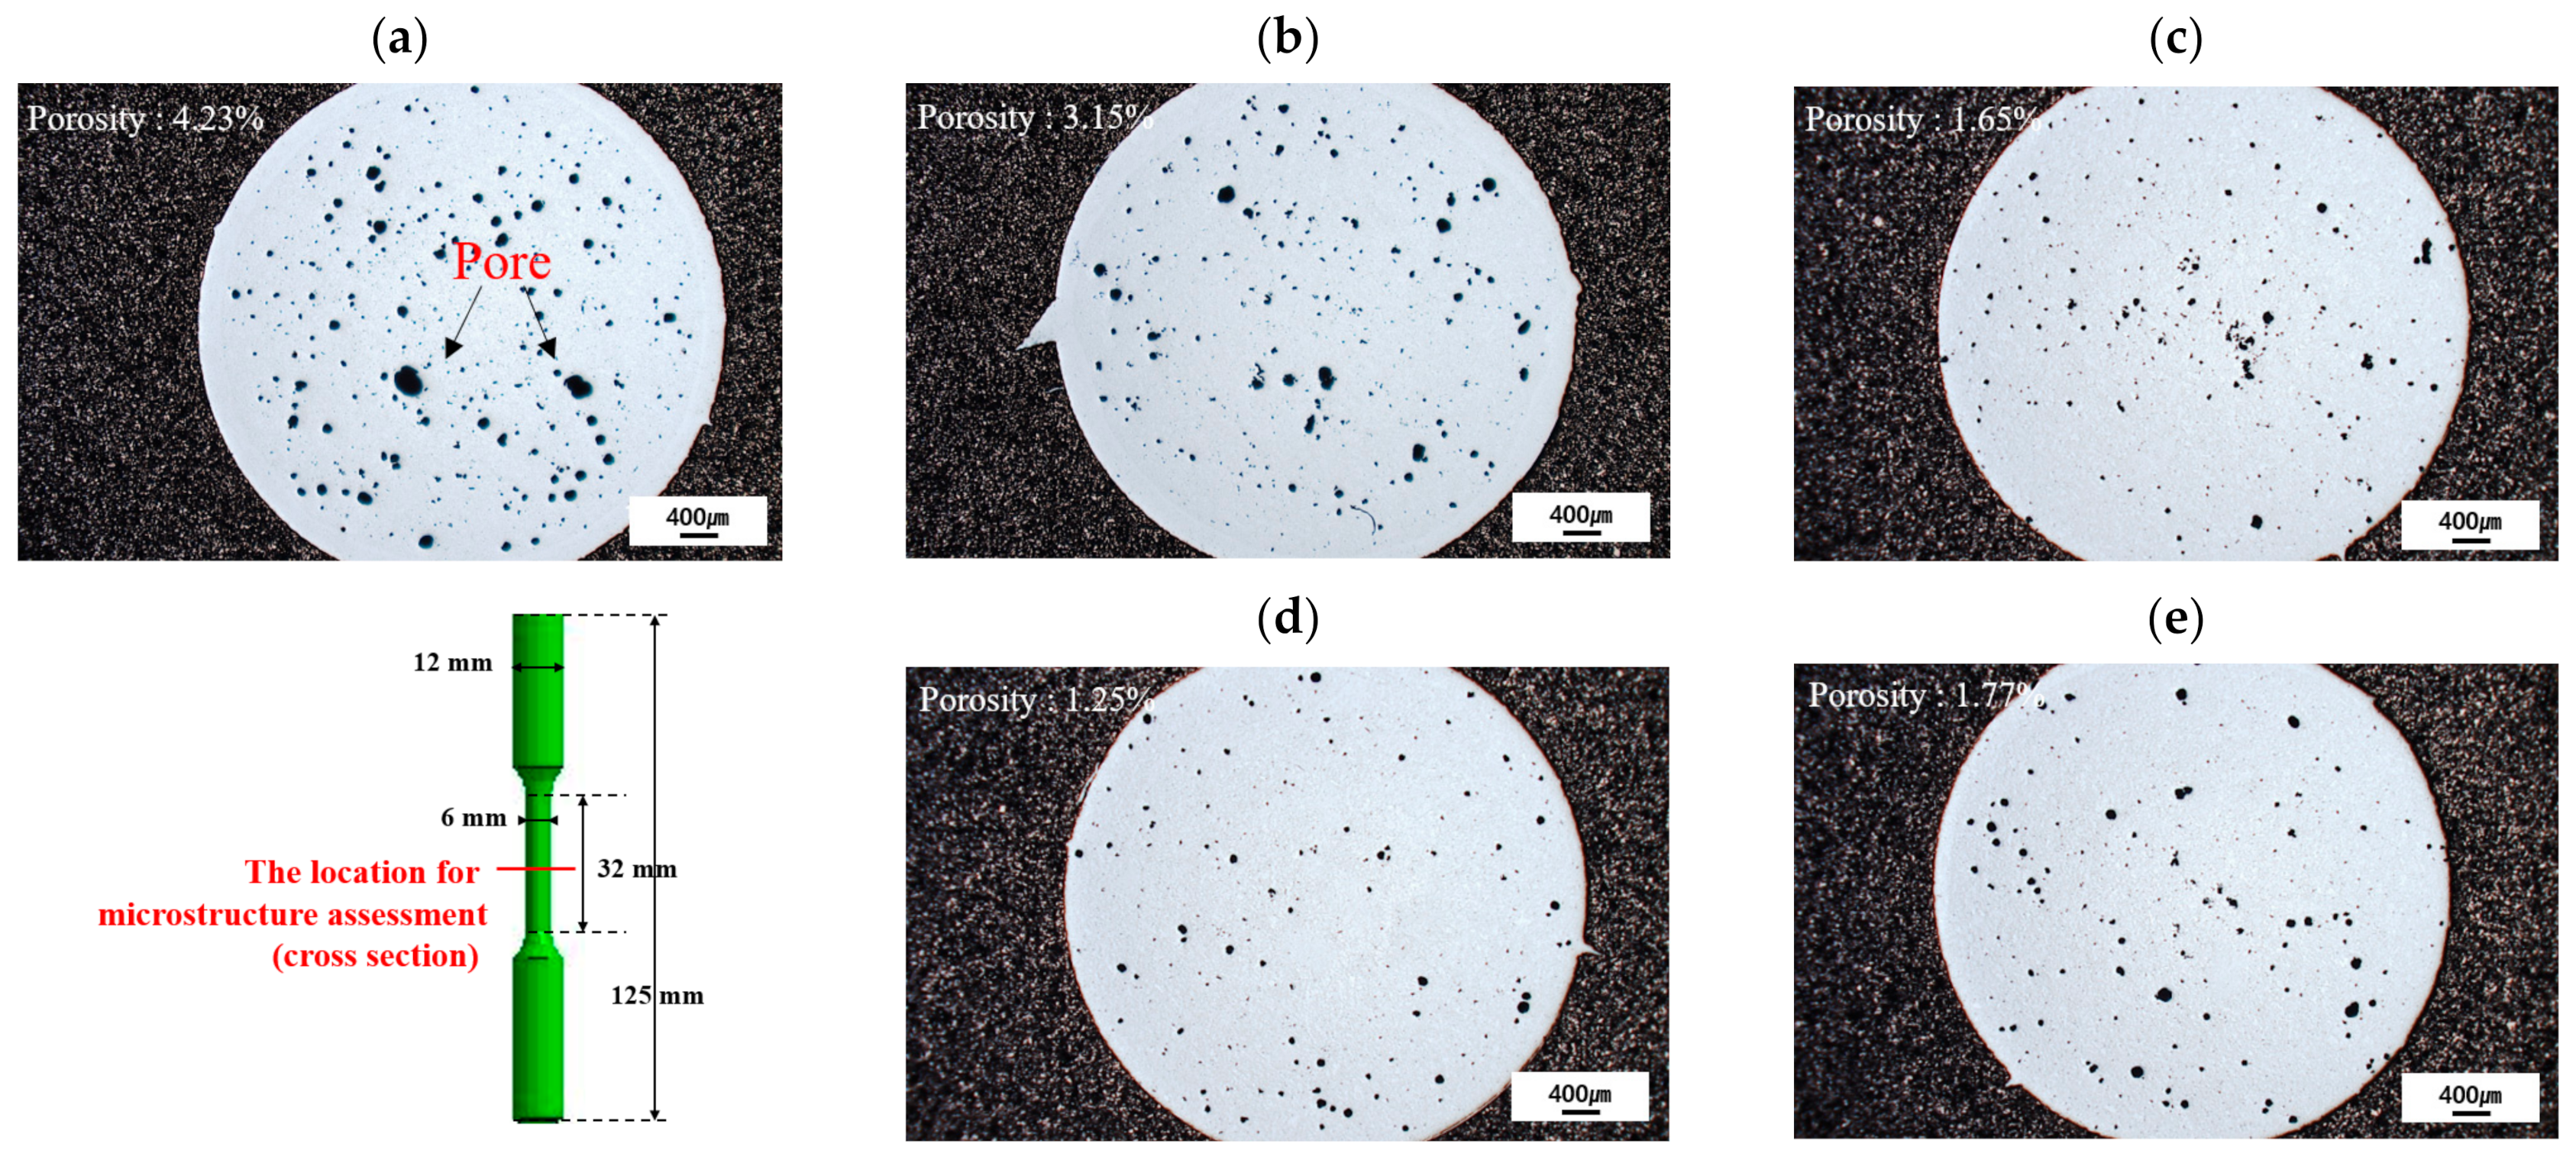
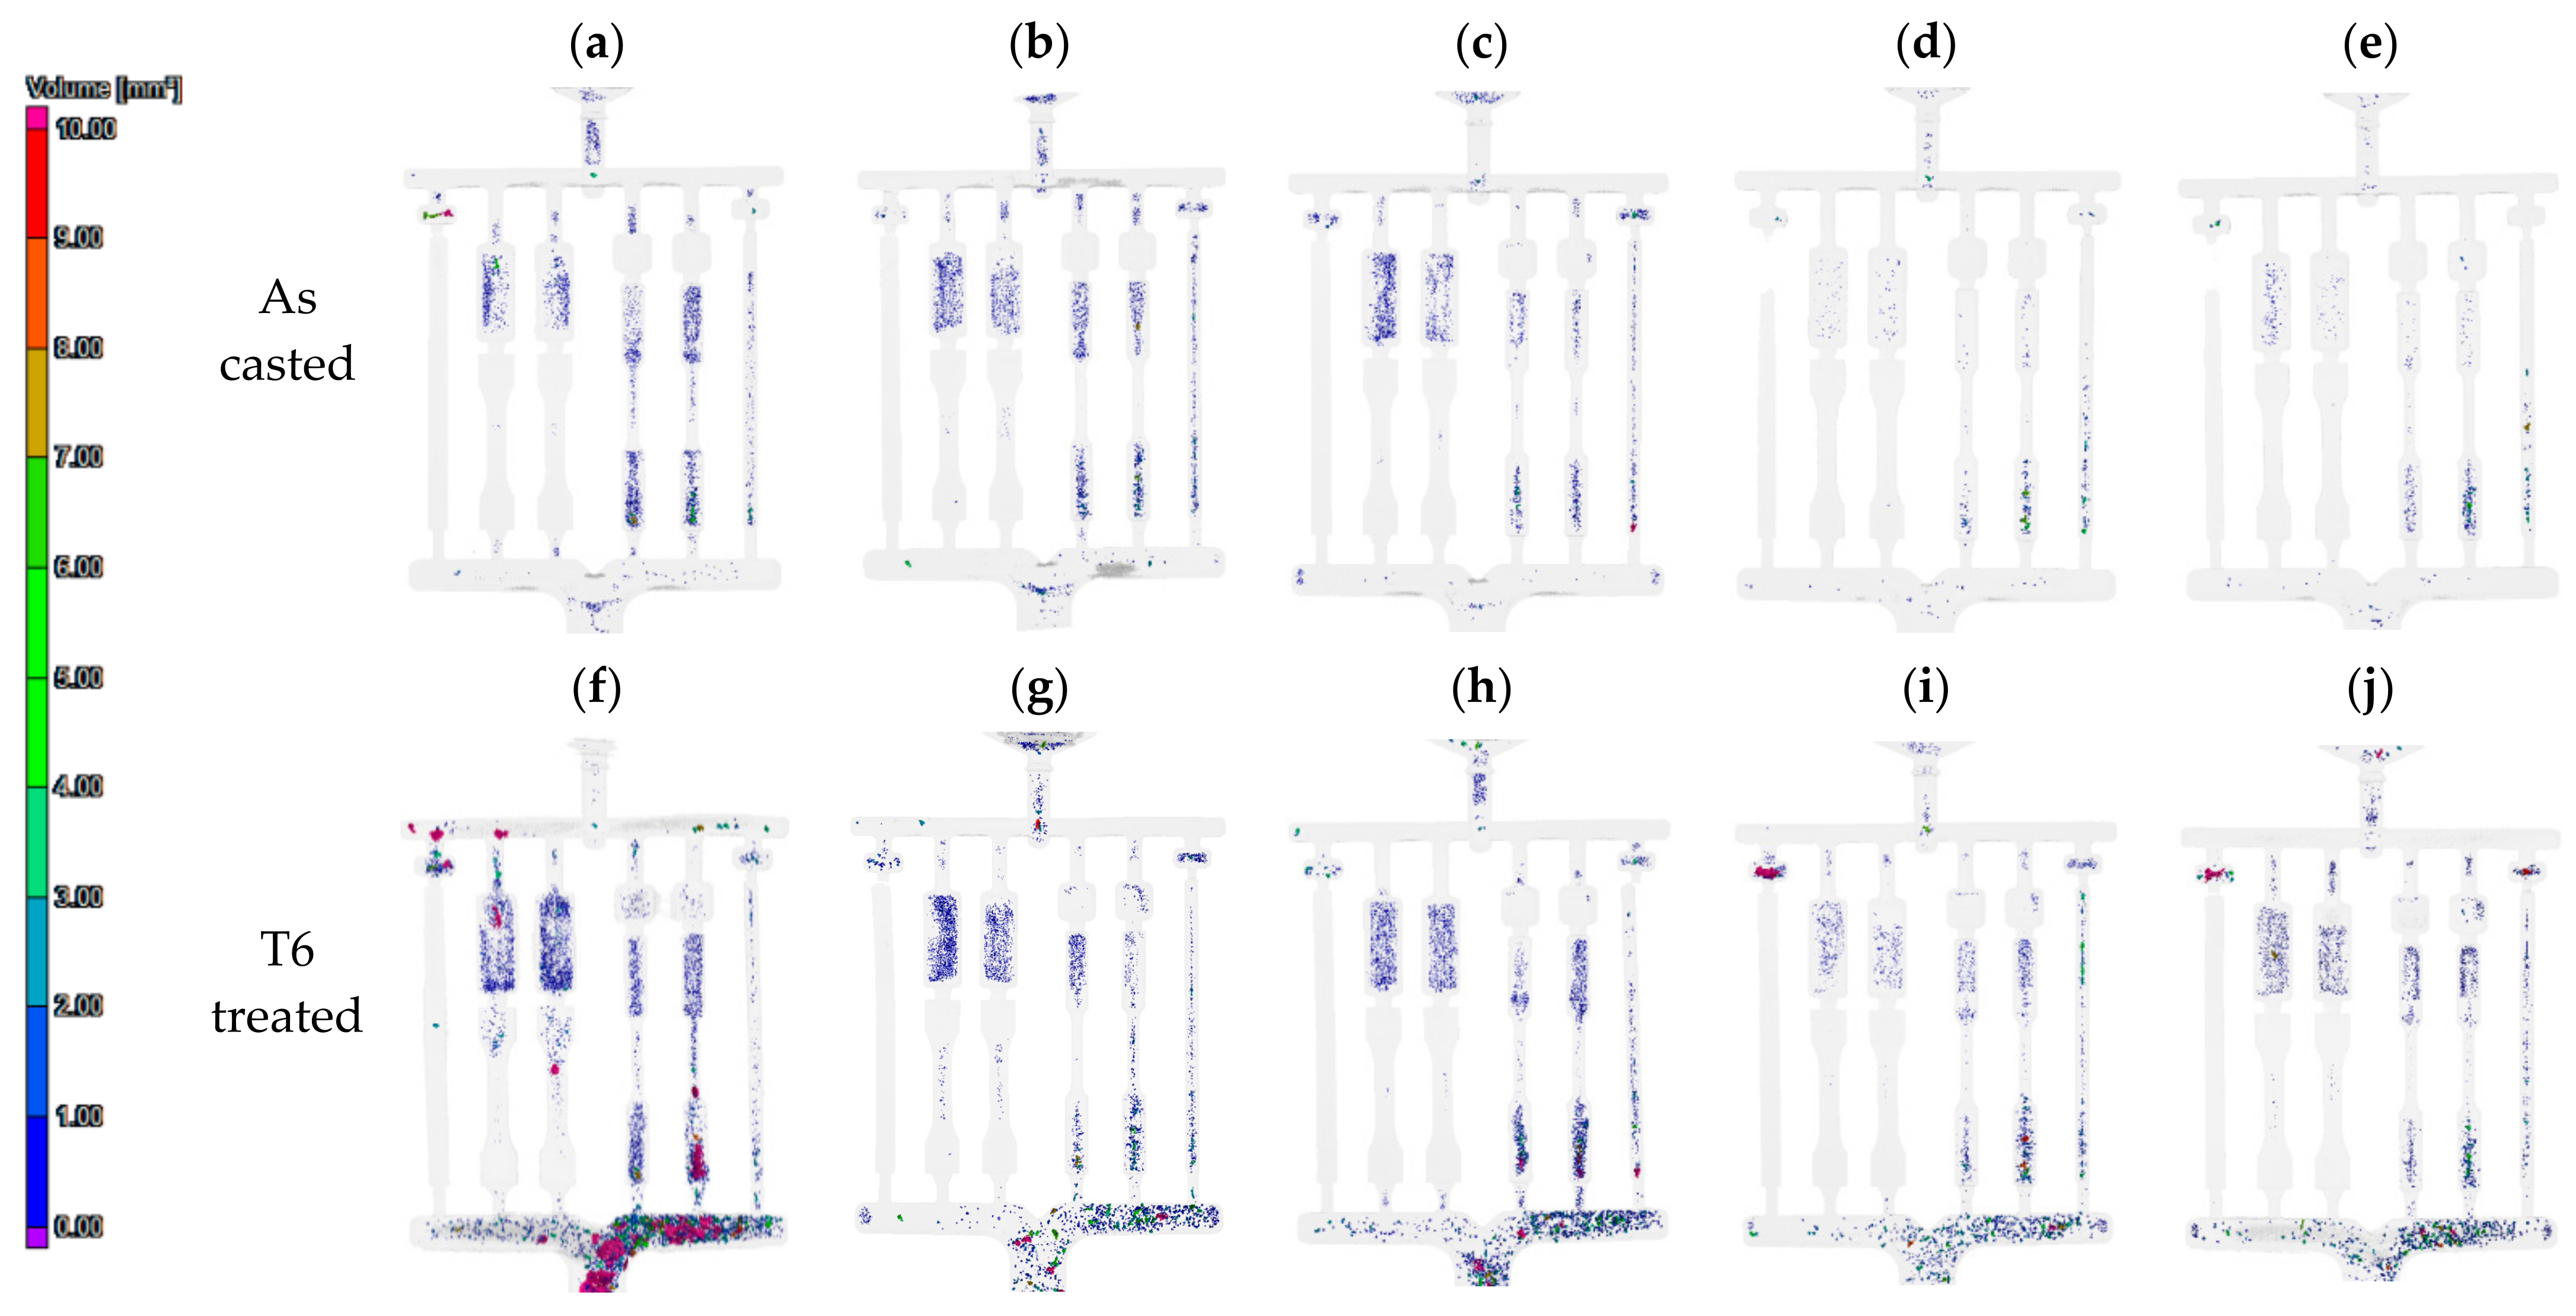
Figure 3 shows the defects of the respective as-cast and T6-treated specimens observed by computed tomography (CT) analysis. In the as-cast specimens, defects (gas porosity and shrinkage defects) were confirmed in the overflow, runner, and grip areas of the round tensile test bars (
Figure 3a–e). From
Figure 3a, it was confirmed that defects were also formed in the gauge area of the round tensile test bars under 0 L conditions. As the injected oxygen amount increased, the defects gradually decreased in the overflow, runner, and grip area, which is the thick area of the round tensile test bars, while almost no defects were formed in the gauge area. In particular, defects were significantly reduced under 1.26 L conditions compared to those under 0 L conditions (
Figure 3d). On the other hand, under 1.68 L conditions, the defects slightly increased.
Figure 3f–j reveals that the gas porosity in the defects of the as-cast specimens expanded following heat treatment. Indeed, after heat treatment, defects appeared in both the plate tensile test bars and the area where the defects were previously formed, and the defects in the runner area increased rapidly. In particular, under 0 L conditions, defects in the gauge and runner area of the plate and round tensile test bars increased more rapidly compared to those in the as-cast specimens (
Figure 3f). As the injected oxygen amount increased, the degree of expansion of the defects by heat treatment decreased and was significantly lower under the 1.26 L than under the 0 L conditions. When oxygen is injected into the sleeve, the air in the mold and sleeve is replaced with active oxygen, and reaction of the active oxygen and molten aluminum form a vacuum in the mold and sleeve [
10]. As the injected oxygen increases, the reaction with the molten metal increases, and the degree of vacuum is expected to increase. Thus, gas entrapment during molten metal injection was very small.
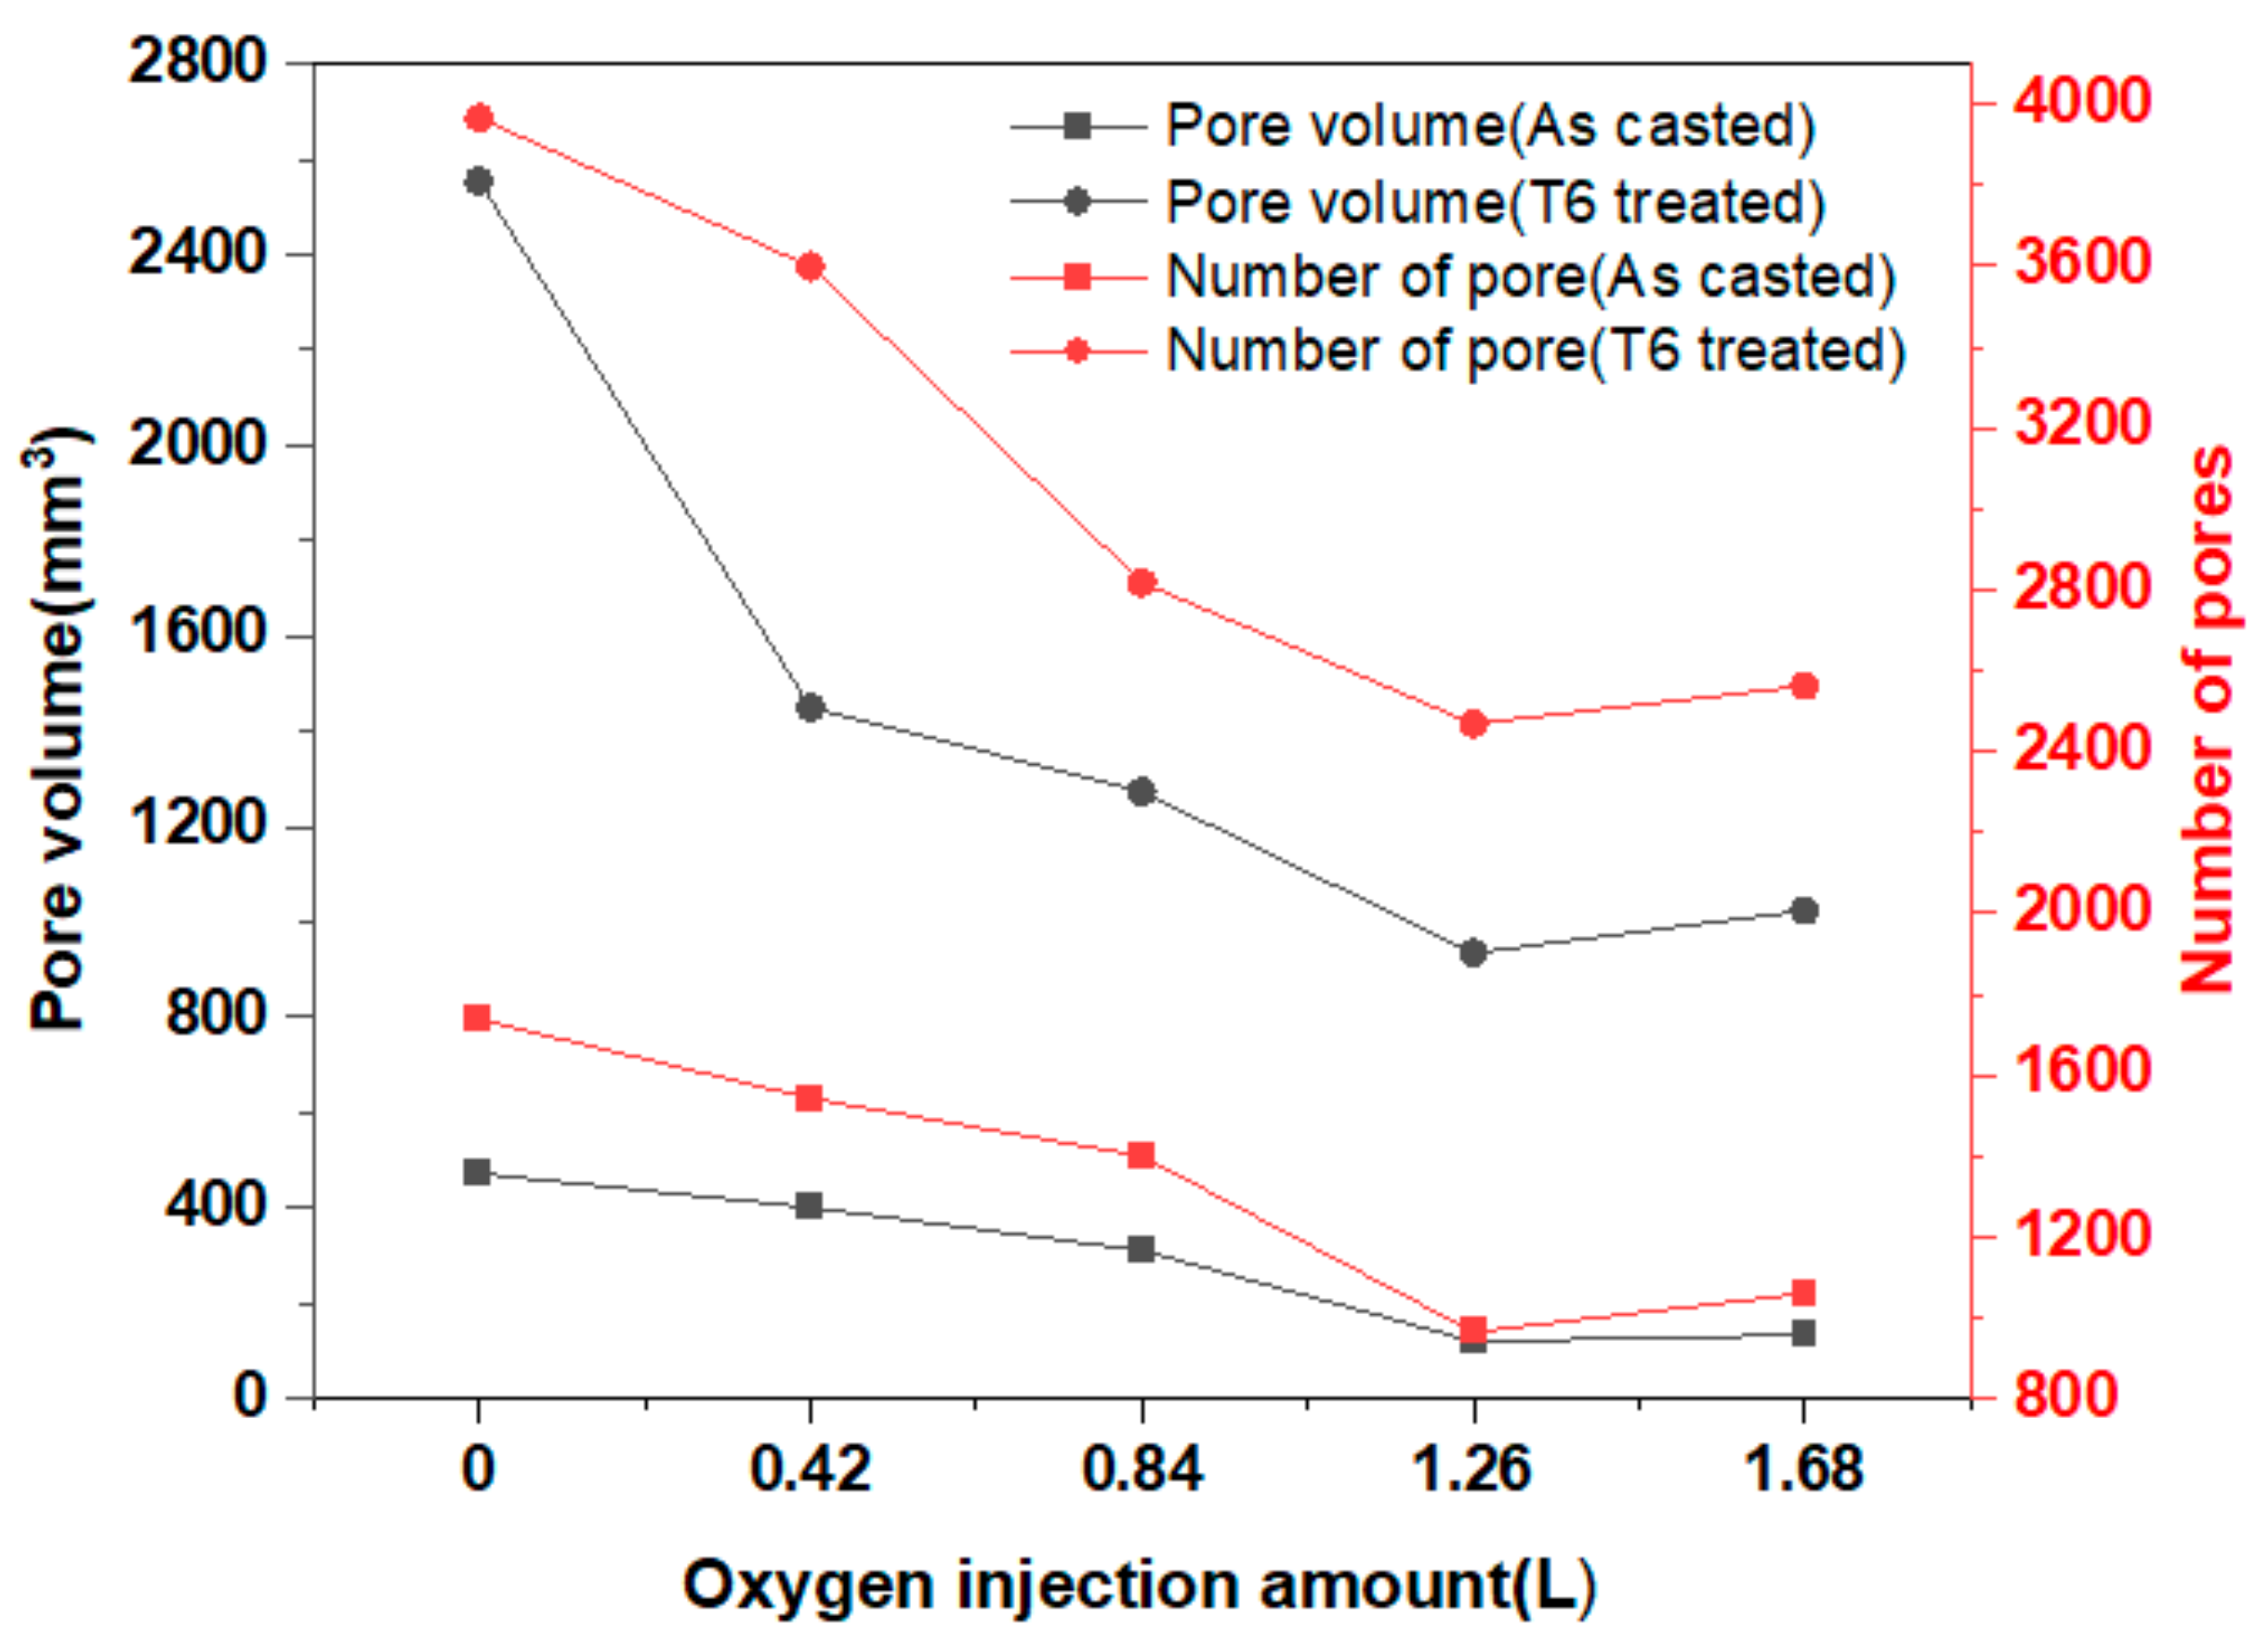
To quantitatively analyze the degree of expansion of the defects before and after heat treatment, CT was also used to numerically express the number and volume of defects of the as-cast and T6-heat-treated specimens (
Figure 4). In the 0 L specimen, to which the PF system was not applied, 1738 micro defects were identified, and the total volume of defects was 472 mm
3. These values gradually decreased as the PF system was applied and the injected oxygen amount increased. In particular, for the 1.26 L specimen, 965 micro-defects were confirmed (≈50% reduction), and the total volume of defects was reduced to 120.06 mm
2 (≈25% reduction). However, these values increased slightly for the 1.68 L/min specimen.
After heat treatment, 3967 micro-defects were identified in the 0 L specimen, to which the PF system was not applied, and the total volume of defects increased sharply to 2553.61 mm3. These values gradually decreased as the PF system was applied and the injected oxygen amount increased. In particular, in the 1.26 L specimen, 2469 micro-defects were confirmed (≈66% reduction) and the total volume of defects was reduced to 934.97 mm2 (≈33% reduction). This occurred because with the increasing amount of injected oxygen in the PF process, the mold interior is effectively vacuumed to reduce the internal gas. However, when excess oxygen is injected, it is not all consumed in the oxidation reactions. Some of this residual oxygen does not escape to the vent area and causes gas porosity.
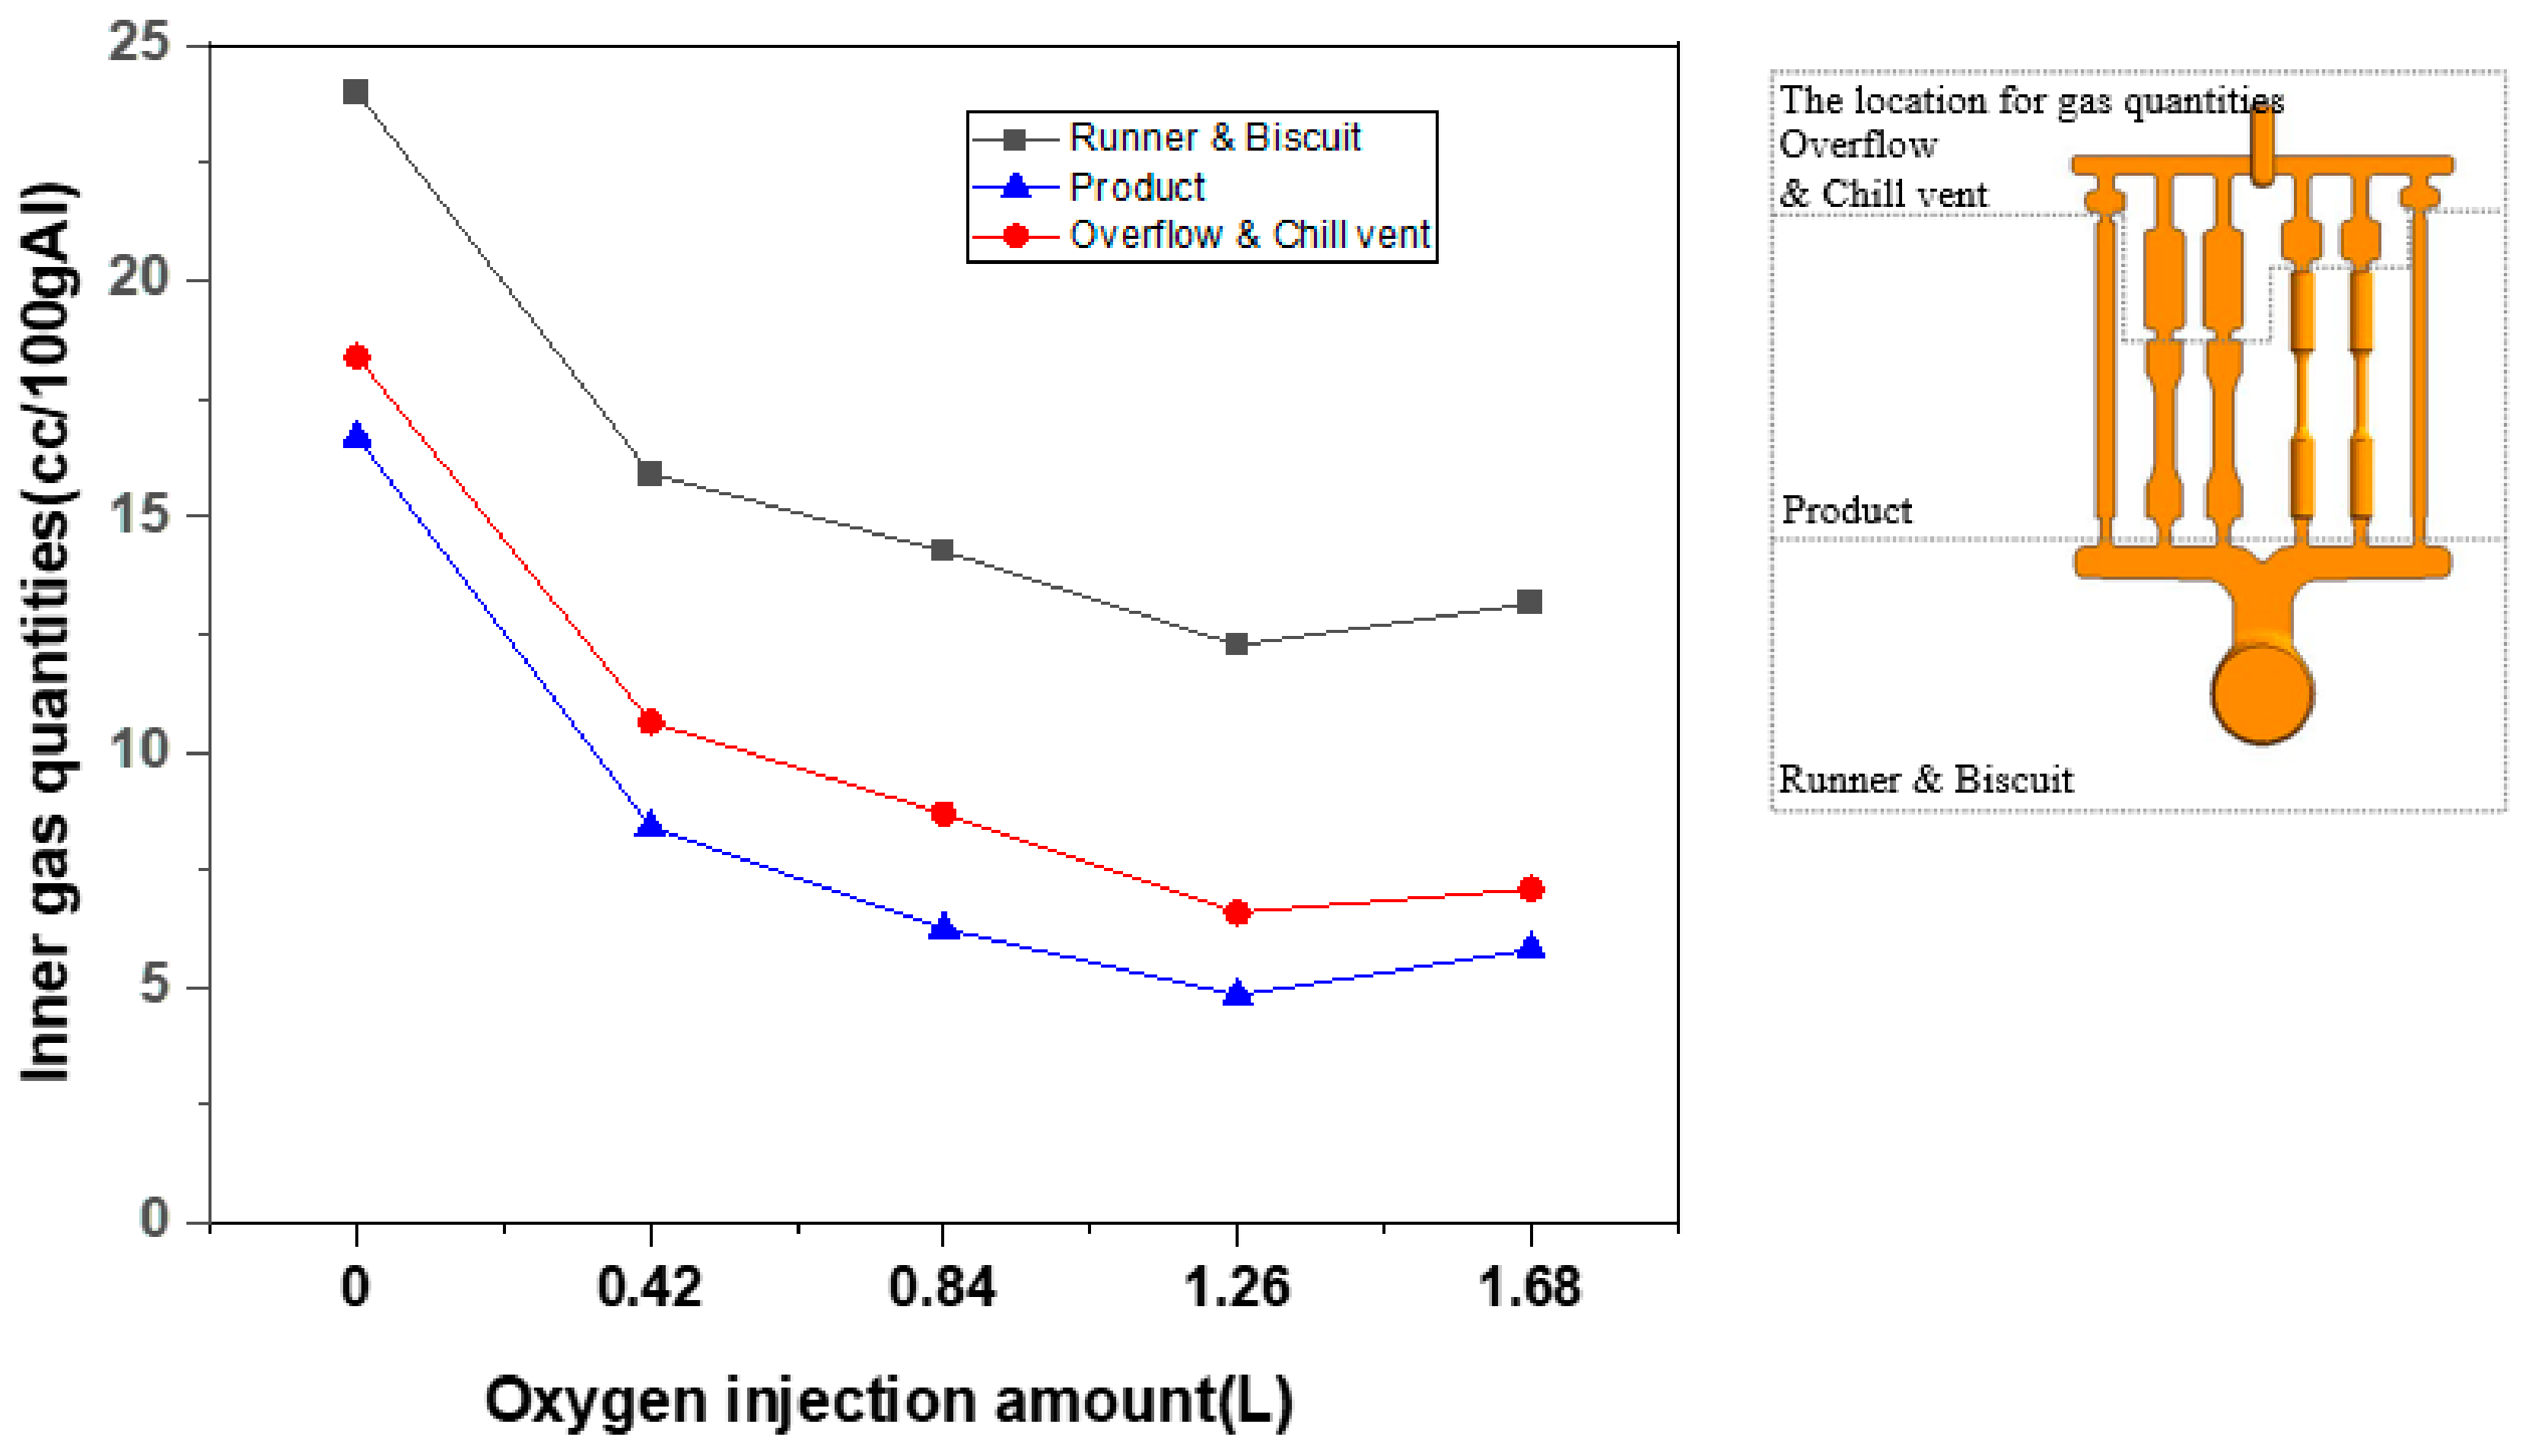
Table 3 and
Figure 5 display the inner gas quantities of the as-casted specimens under each injected oxygen condition for each casting area, as measured by the vacuum fusion extraction method. Under all conditions, the runner and biscuit had the largest amount of inner gas, while the lowest amount of gas was found in the product of the castings. The larger gas quantities in the runner and biscuit compared to those in the overflow and chill vent were attributed to the lubricant in the sleeve that was mixed during casting. Thus, at 0 L, there was 24.00 cc/100 g gas in the runner and biscuit area, 18.38 cc/100 g in the overflow and chill vent, and 16.68 cc/100 g in the product, which was the lowest observed value from all the areas. With the application of the PF process with 0.42 L of injected oxygen, these gas quantities were reduced by 66%. Thus, the gas in the product was 8.41 cc/100 g, which was less than 10 cc/100 g capable of welding and heat treatment [
21]. The gas quantities at 1.26 L were 12.27 cc/100 g at the runner and biscuit, 6.59 cc/100 g at the overflow and chill vent, and 4.84 cc/100 g at the product, which was the lowest under all conditions. However, at 1.68 L, the gas quantities were slightly higher than those at 1.26 L.
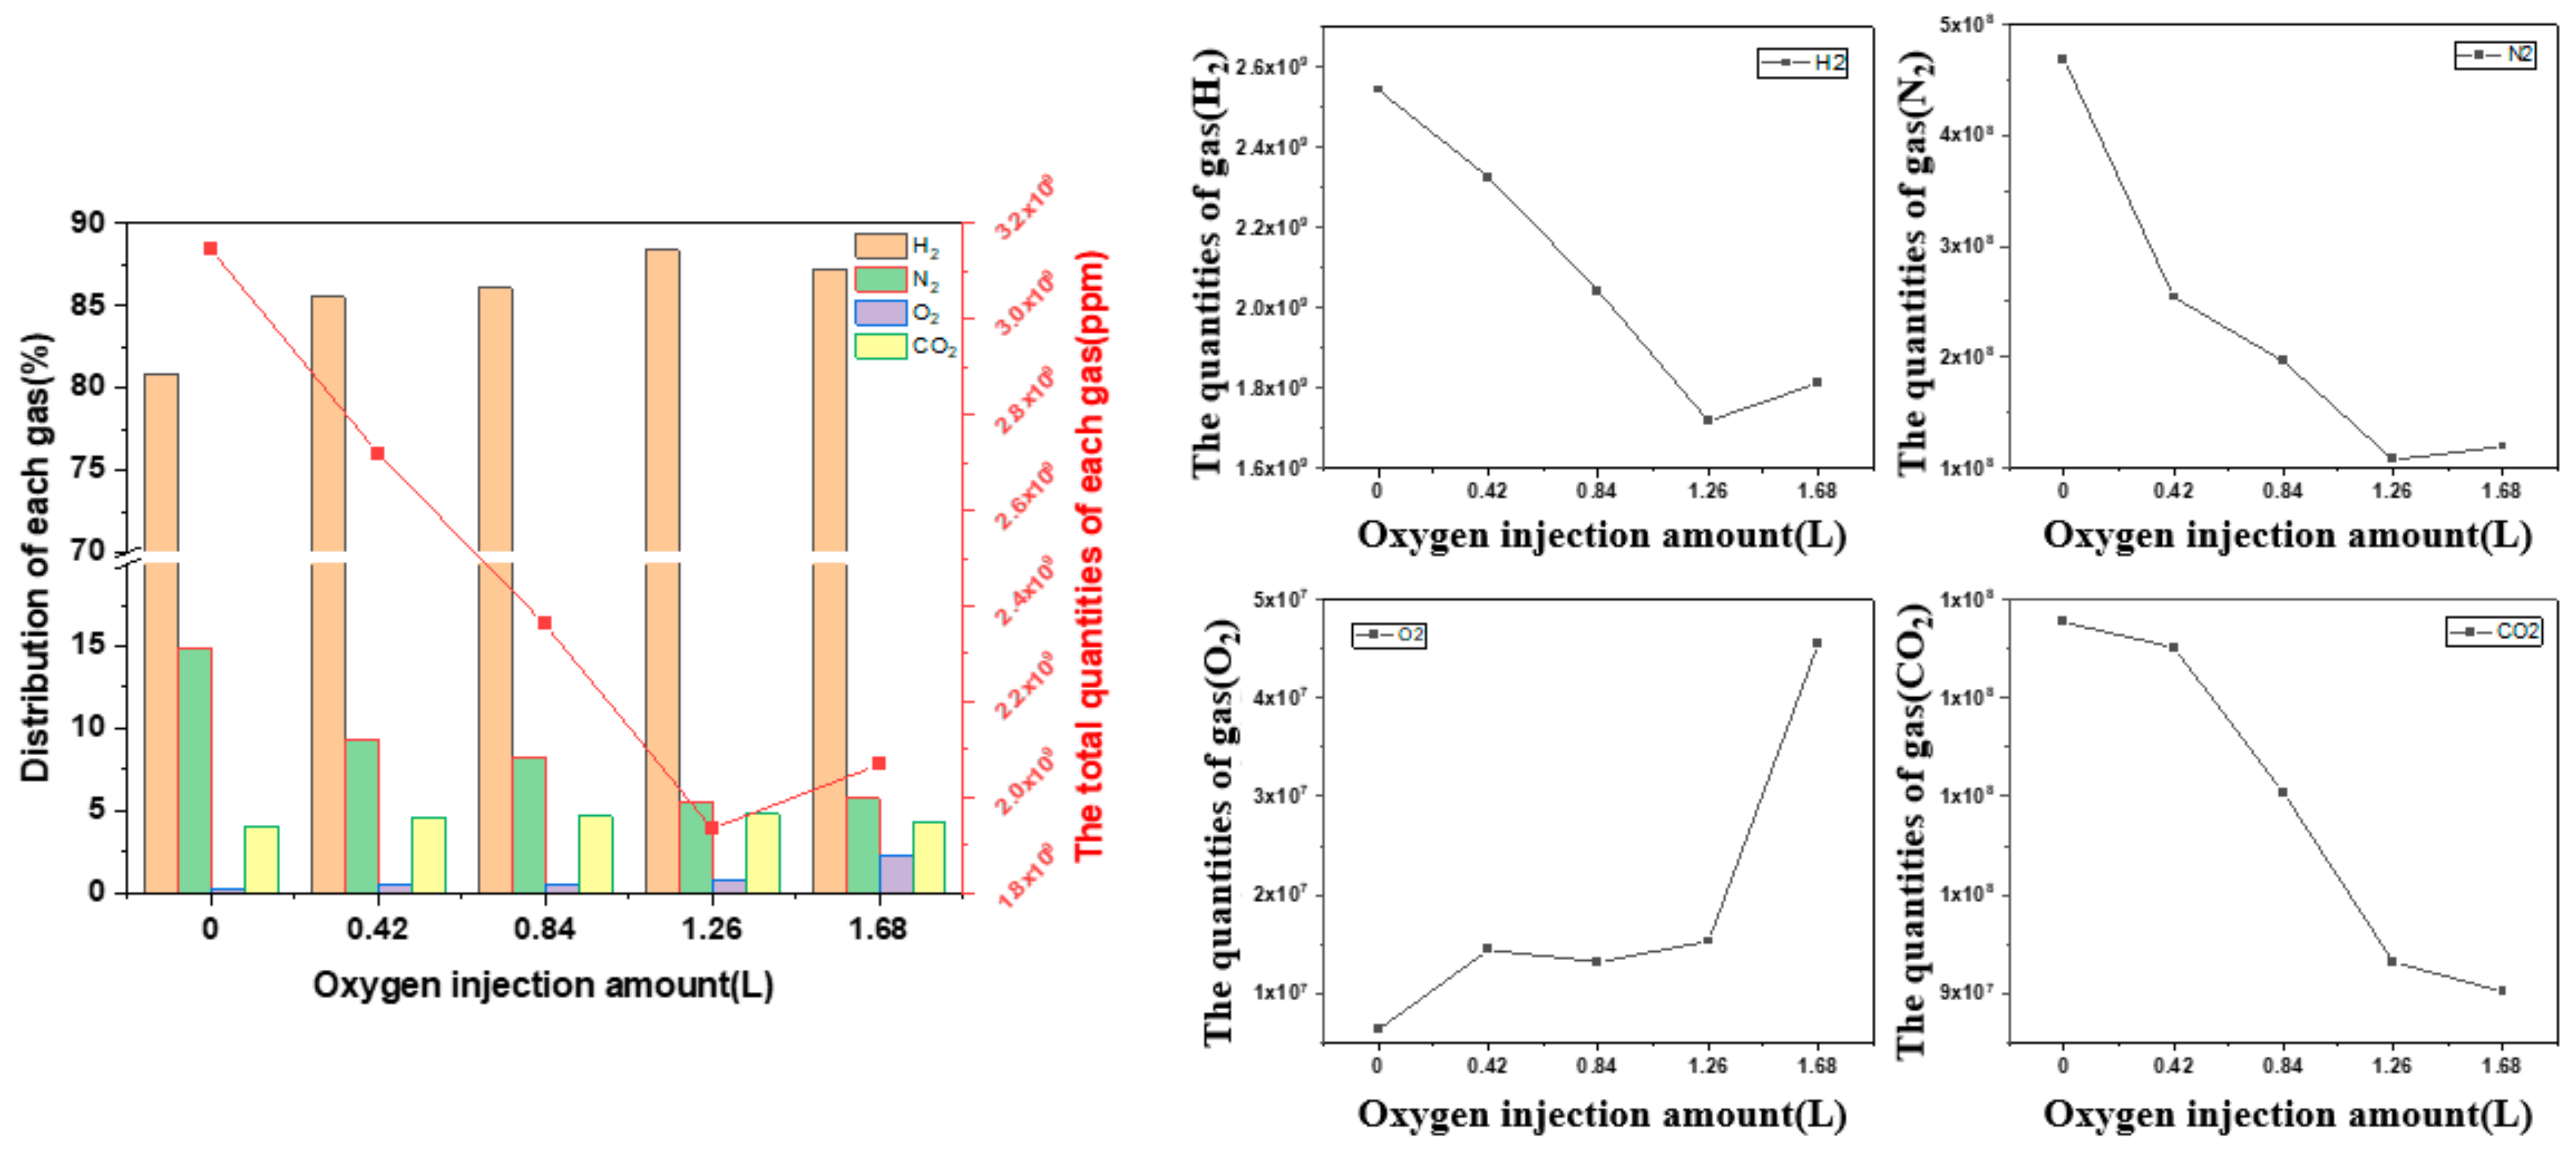
Figure 6 shows the internal gas analysis results of the castings and the total amount of each gas at each injected oxygen volume. H
2, N
2, O
2, and CO
2 were among the measured gases emitted by the dissolution of the product in vacuum state. Each ratio was measured, and the total amount of each gas was calculated. All four gases displayed the same behavior (
Figure 5), with the inner gas quantities decreasing with increasing injected oxygen. Thus, the gas distribution at 0 L injected oxygen, to which the conventional die casting process was applied, was H
2 = 76.83%, N
2 = 21.93%, O
2 = 0.34%, and CO
2 = 0.91%. As the injected oxygen amount increased, the H
2, N
2, and CO
2 gradually decreased, while O
2 gradually increased. At an oxygen injection rate of 30 L/min, the gas distribution was H
2 = 83.62%, N
2 = 14.60%, O
2 = 0.70%, and CO
2 = 1.07%. We predicted that with the increase in the injected oxygen amount, the oxygen substitution rate of the nitrogen present in the cavity and sleeve would also increase, resulting in a decrease in the internal nitrogen. As the injected oxygen amount increased, the internal oxygen slightly increased. In particular, the internal oxygen measured at 1.68 L was approximately four times greater than that at 0 L. We predicted that the oxygen injected into the cavity and sleeve would be completely consumed by the reaction during oxygen injection. However, at this volume, some oxygen was not consumed, which either escaped through the vent area or remained in the cavity and sleeve.
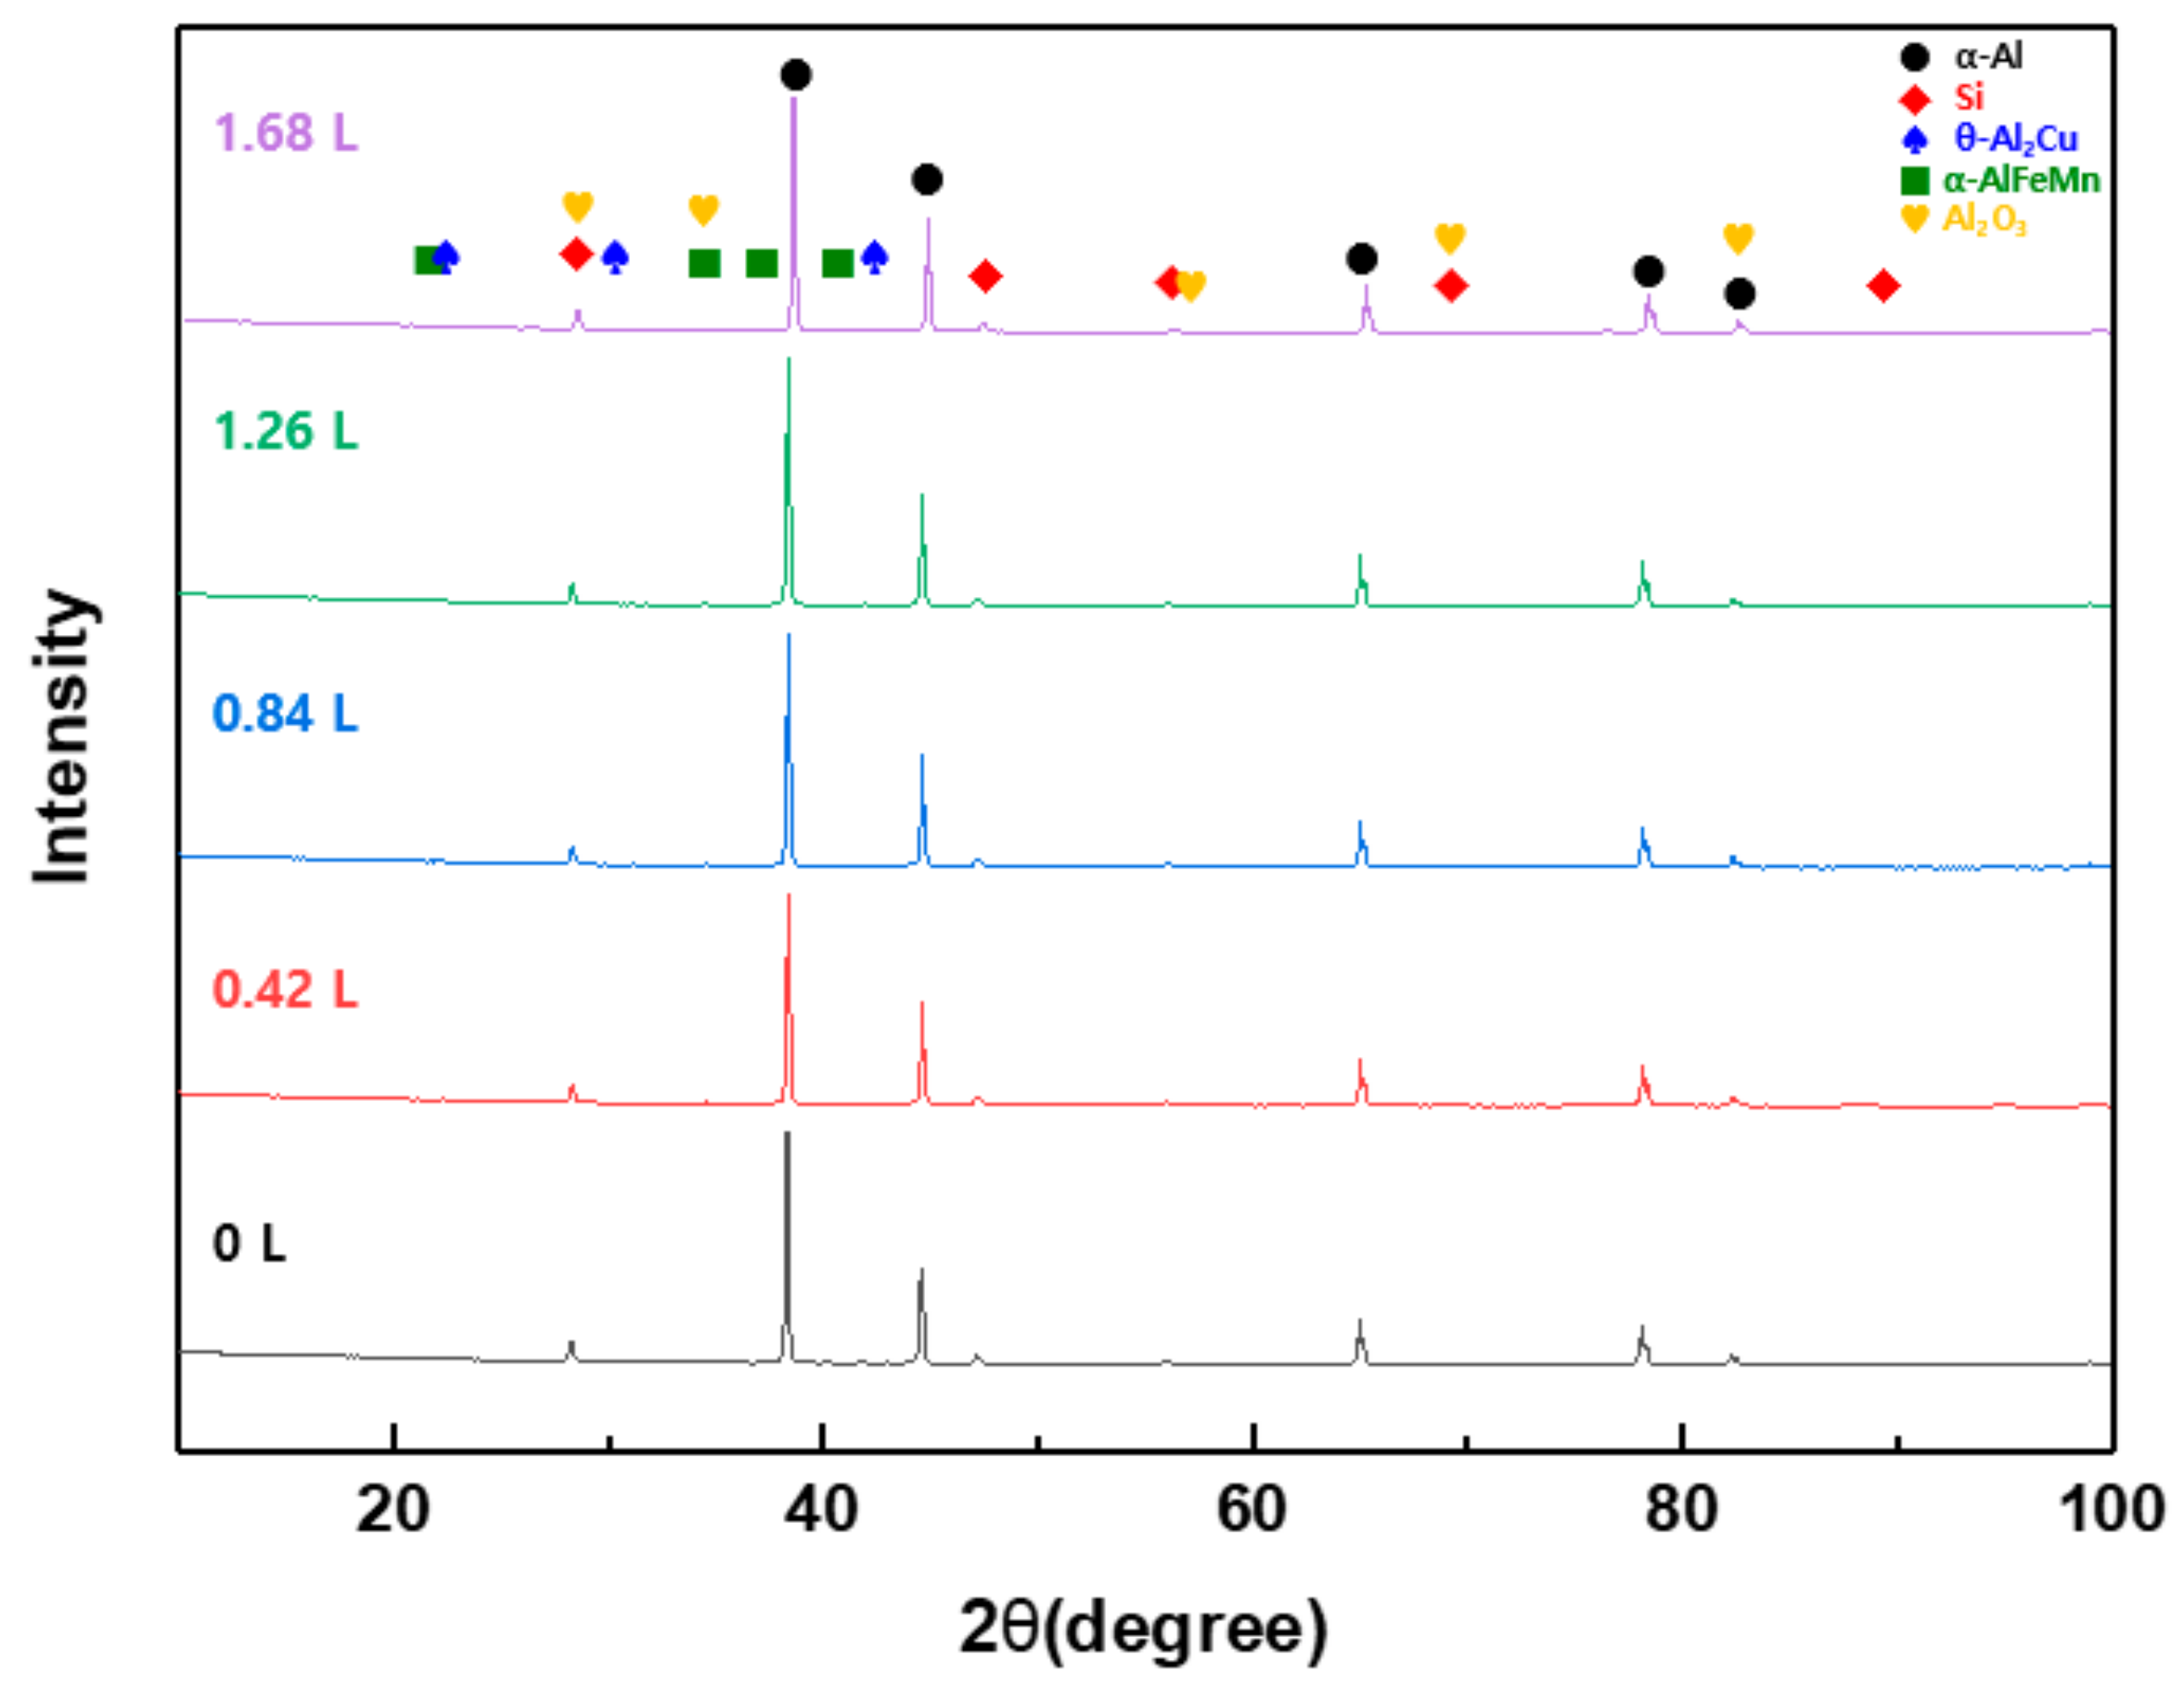
Figure 7 shows the XRD results under each injected oxygen condition. At 0 L, α-Al, Si, θ-Al
2Cu, α-AlFeMn, and Al
2O
3 were observed, and the same phase was confirmed under each injected oxygen volume, including 0 L. Thus, we supposed that the injected oxygen amount only contributes toward reducing the inner gas quantities and does not affect the formation of a new phase in the microstructure.
To analyze the micropores that could not be confirmed by CT analysis, we next studied the microstructure of the cross-section of the test bar gauge areas under each injected oxygen condition.
Figure 8 shows the optical micrographs after heat treatment for each condition. Pores of various sizes were identified, including pores with a maximum size of 380 µm at 0 L, which is the conventional casting condition. When the PF process was applied, the size and number of pores decreased with increasing amount of injected oxygen. In particular, in the 1.26 L injected oxygen, only small pores that could not be confirmed with the resolution of the CT equipment were confirmed.
Figure 9 and
Table 4 show the scanning electron micrographs of the as-cast specimens for each condition and information on the dendritic arm spacing (DAS) and eutectic Si.
Figure 9a reveals that the phases predicted as α-Al, Si, θ-Al
2Cu, and α-AlFeMn were confirmed in the microstructure of the 0 L/min process, which is the conventional die-casting process. In the microstructures of the specimens to which the PF system was applied (
Figure 9b–e), the predicted α-Al, Si, θ-Al
2Cu, and α-AlFeMn phases were confirmed, in agreement with the XRD results, and no microstructural differences were observed.
Table 4 reveals that the fraction, length, and aspect ratio of Si in the 0 L specimen were 12.19%, 2.09 µm, and 1.45, respectively, and no differences in the fraction, length, and aspect ratio of Si were observed with increasing injected oxygen. Therefore, we expected that there would be no changes in the mechanical properties with microstructural change. DAS showed no significant difference between 8 and 9 µm in all conditions. The distance between secondary dendrite arms (DAS) depends on the local solidification time. Therefore, there was no change according to the vacuum degree change.
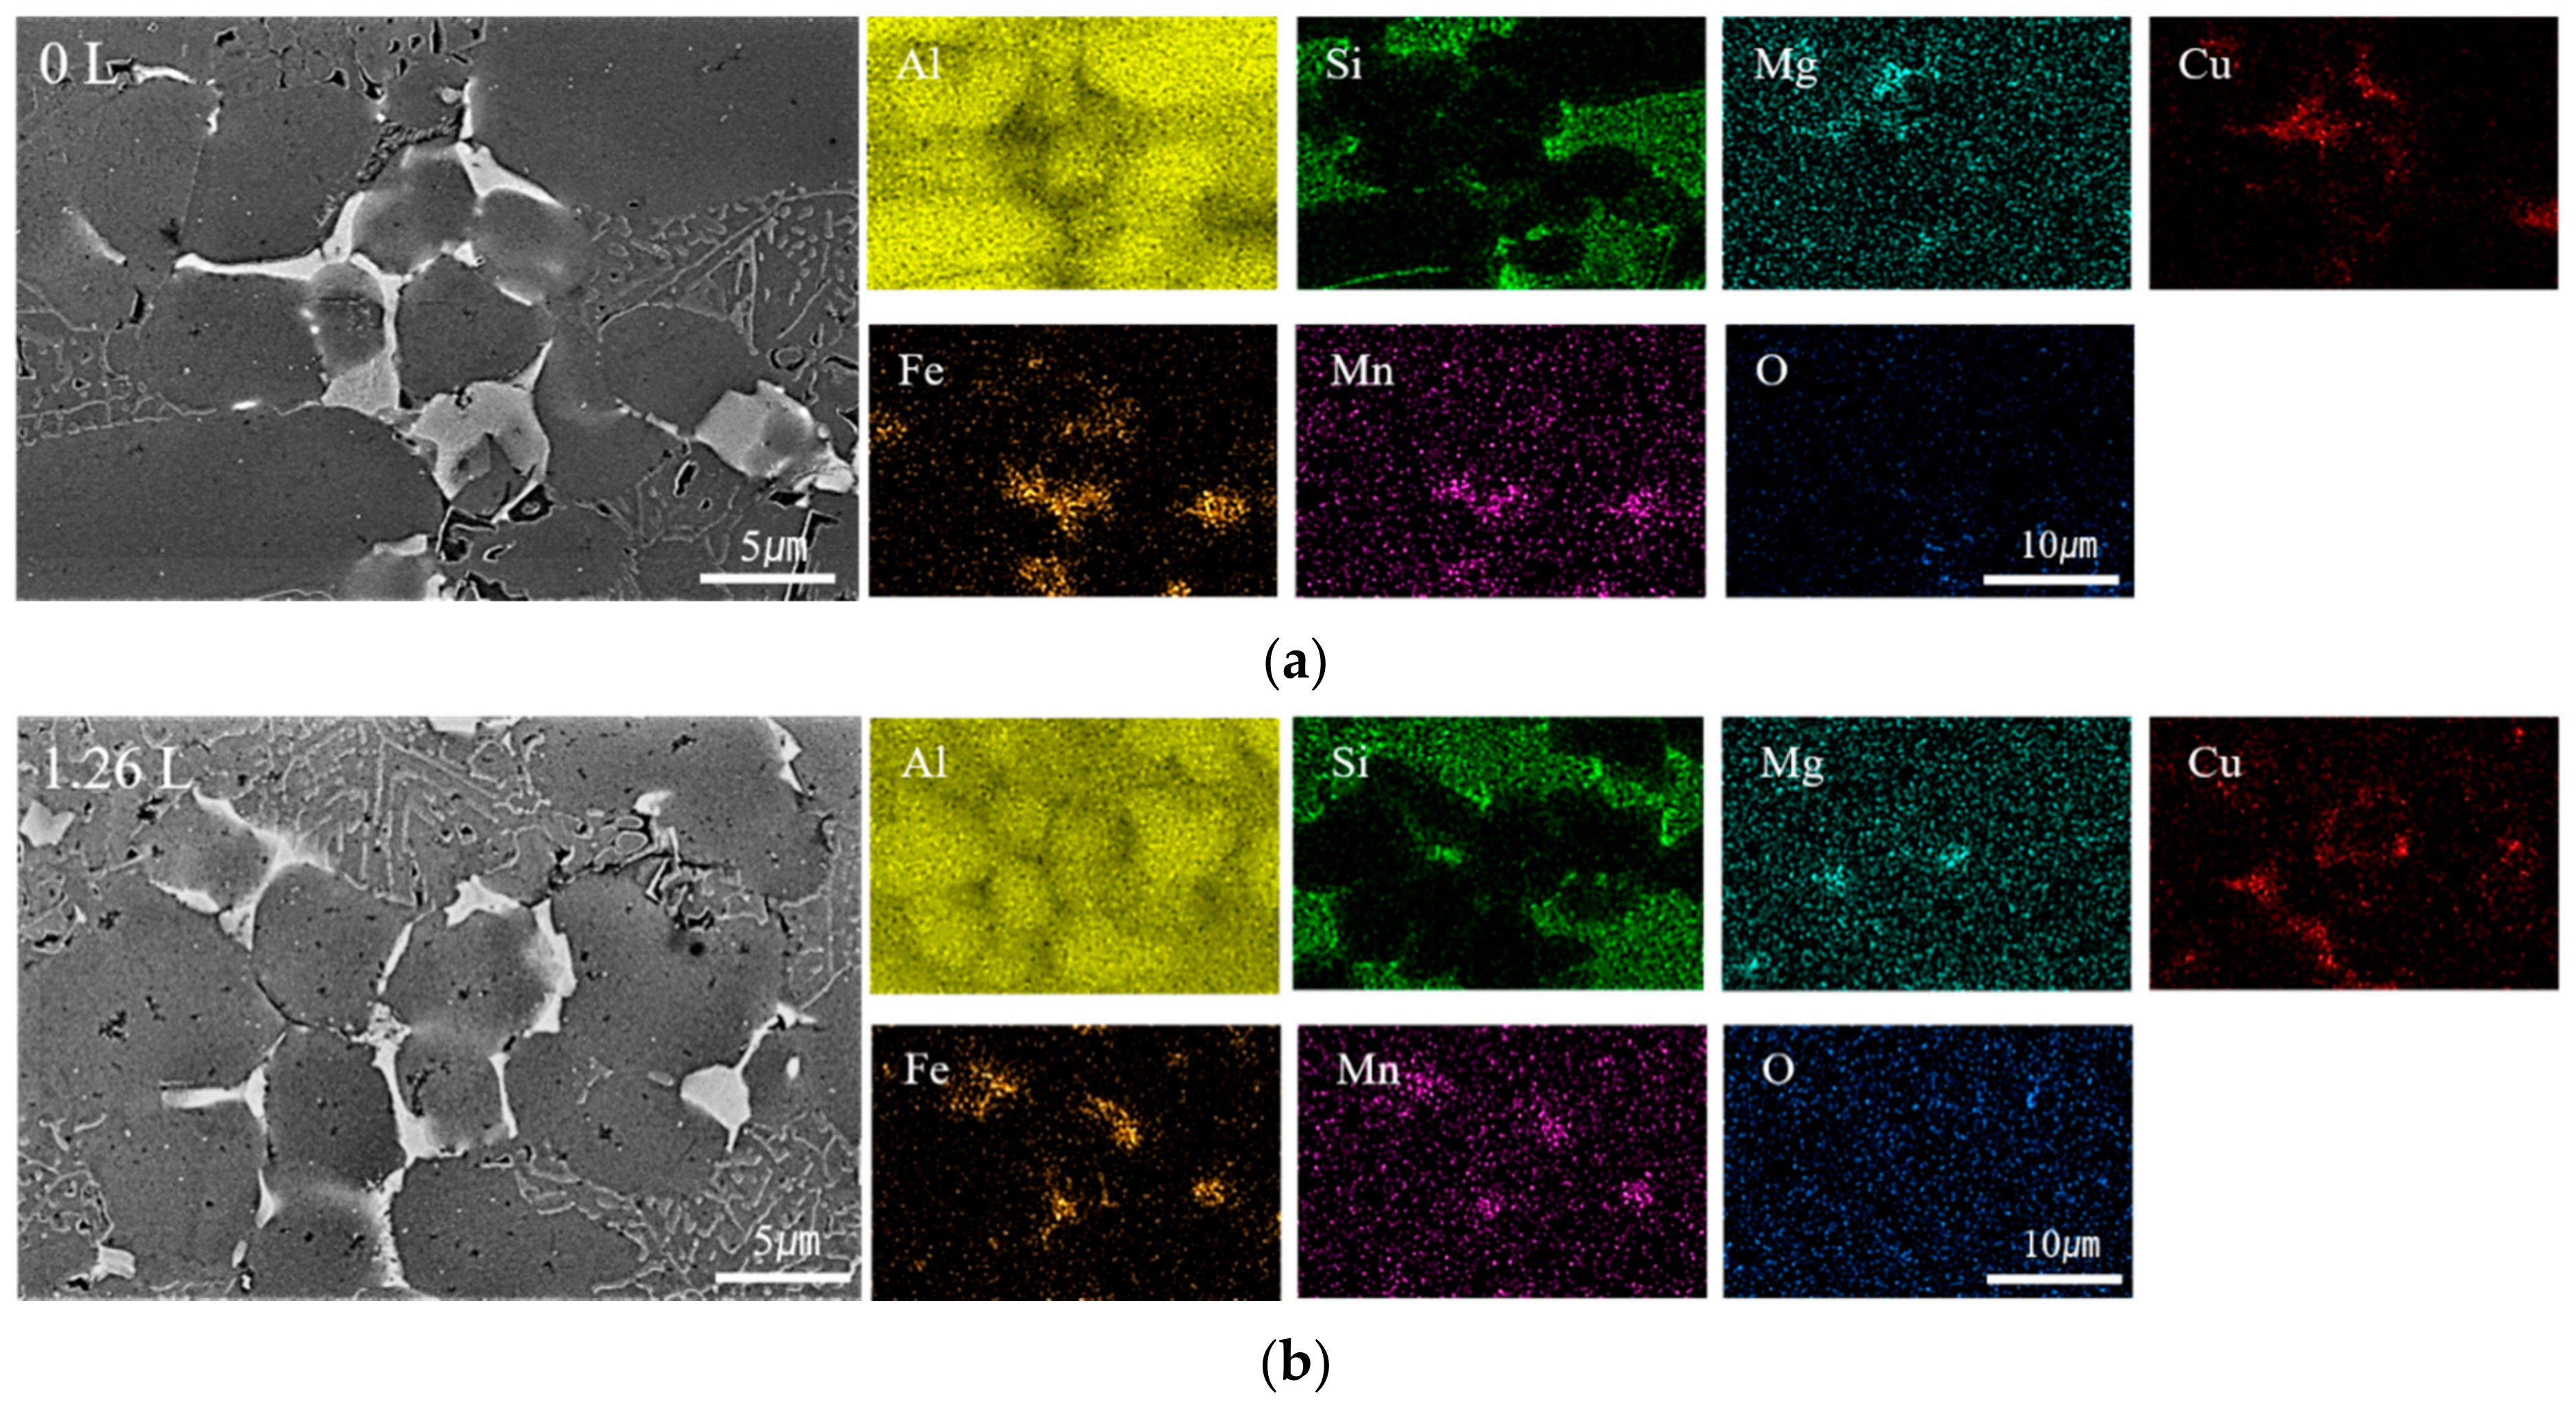
In addition, energy-dispersive X-ray spectroscopy (EDS) of the 0 L (
Figure 9a) and 30 L (
Figure 9d) specimens was performed to analyze microstructure.
Figure 10 shows the SEM/EDS results for the red area in
Figure 9a,d. Under 0 L injected oxygen, the phases predicted as α-Al, Si, θ-Al
2Cu, and α-AlFeMn were detected, and oxide was confirmed in some locations (
Figure 10a). The same phases were also detected in the EDS images (
Figure 10b) of the specimens to which the PF system was applied. In addition, it was confirmed that micro-shrinkage defects were formed in some areas. However, unlike gas porosity, defect expansion by heat treatment did not appear.
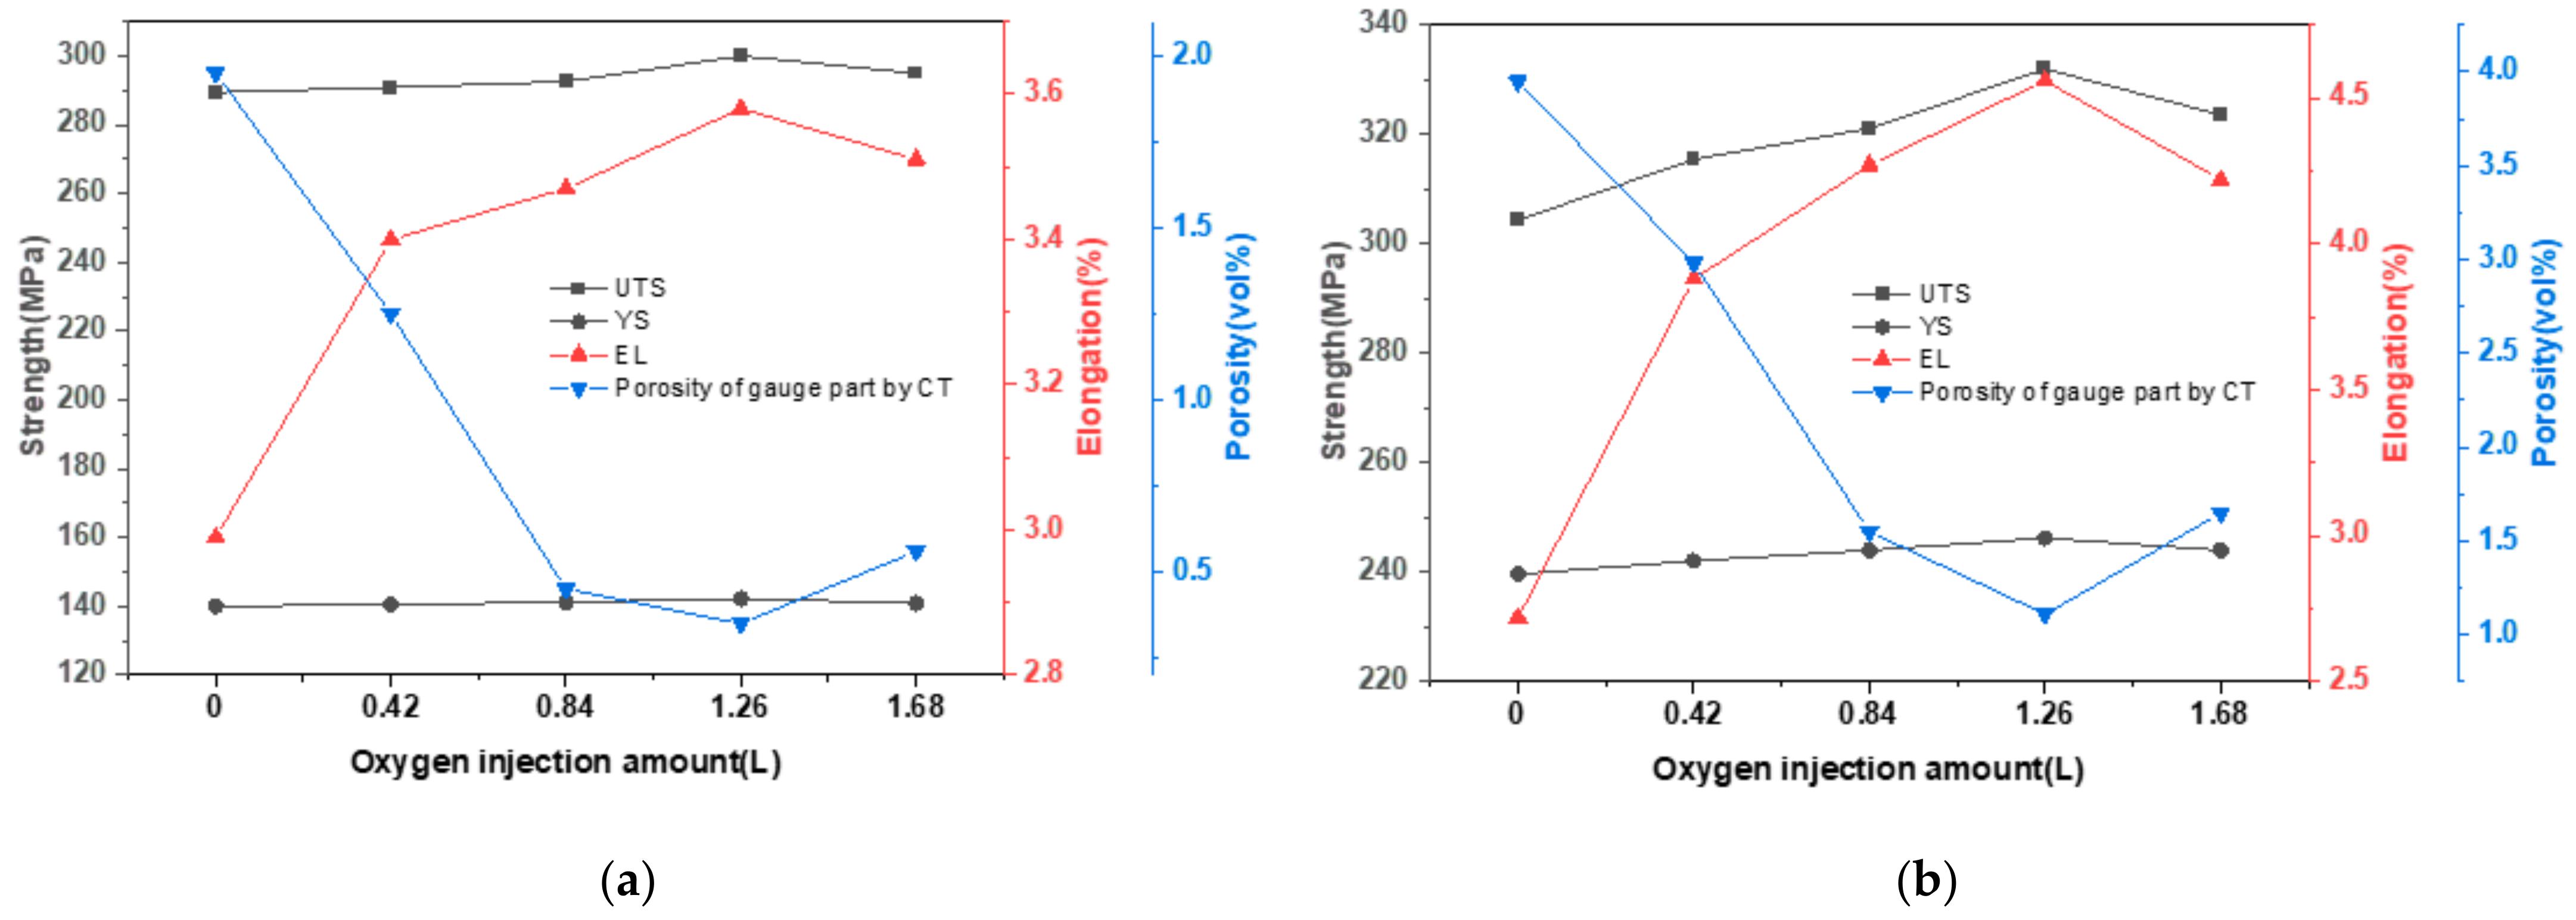
Figure 11 shows the porosity relationship of the gauge area of the round tensile test bars, which was determined by tensile test and CT analyses, according to each condition, while
Table 5 lists the average and standard deviation (SD) of the tensile test results and porosity of the gauge area. For the as-cast specimens (
Figure 11a), the tensile strength, yield strength, and elongation at 0 L injected oxygen were 289.42 MPa, 140.06 MPa, and 2.99%, respectively, while the porosity of the gauge area was 1.95%. As the PF system was applied and the injected oxygen amount increased, the porosity of the gauge area decreased, while the tensile strength and elongation increased. In particular, the best results were observed for the 1.26 L specimen, with a tensile strength, yield strength, and elongation of 299.98 MPa, 142.28 MPa, and 3.58%, respectively.
For the T6-treated specimens (
Figure 11b), the tensile and yield strengths of the 0 L specimen increased to 304.35 MPa and 239.69 MPa, respectively; however, the elongation decreased to 2.72%. This reduction in elongation was attributed to the gas porosity, which increased from 1.95% to 3.95% following heat treatment. The tensile strength, yield strength, and elongation of the 0.42 L specimen to which PF was applied increased to 315.44 MPa, 242.08 MPa, and 3.88%, respectively. As the injected oxygen amount increased, the porosity of the gauge area decreased, and the tensile strength and elongation increased. In particular, the best results (tensile strength, yield strength, and elongation = 331.98 MPa, 246.27 MPa, and 4.56%, respectively) were observed for the 1.26 L specimen. However, these values decreased when the injected oxygen was further increased to 1.68 L. This is because up to a certain volume, the oxygen injected into the cavity and sleeve react after injection and is mostly used. However, when excess oxygen is injected, not all the oxygen is consumed. Thus, while some of the unreacted oxygen escapes to the vent part, the rest remains in the cavity and sleeve, resulting in gas porosity, thereby reducing the mechanical properties.
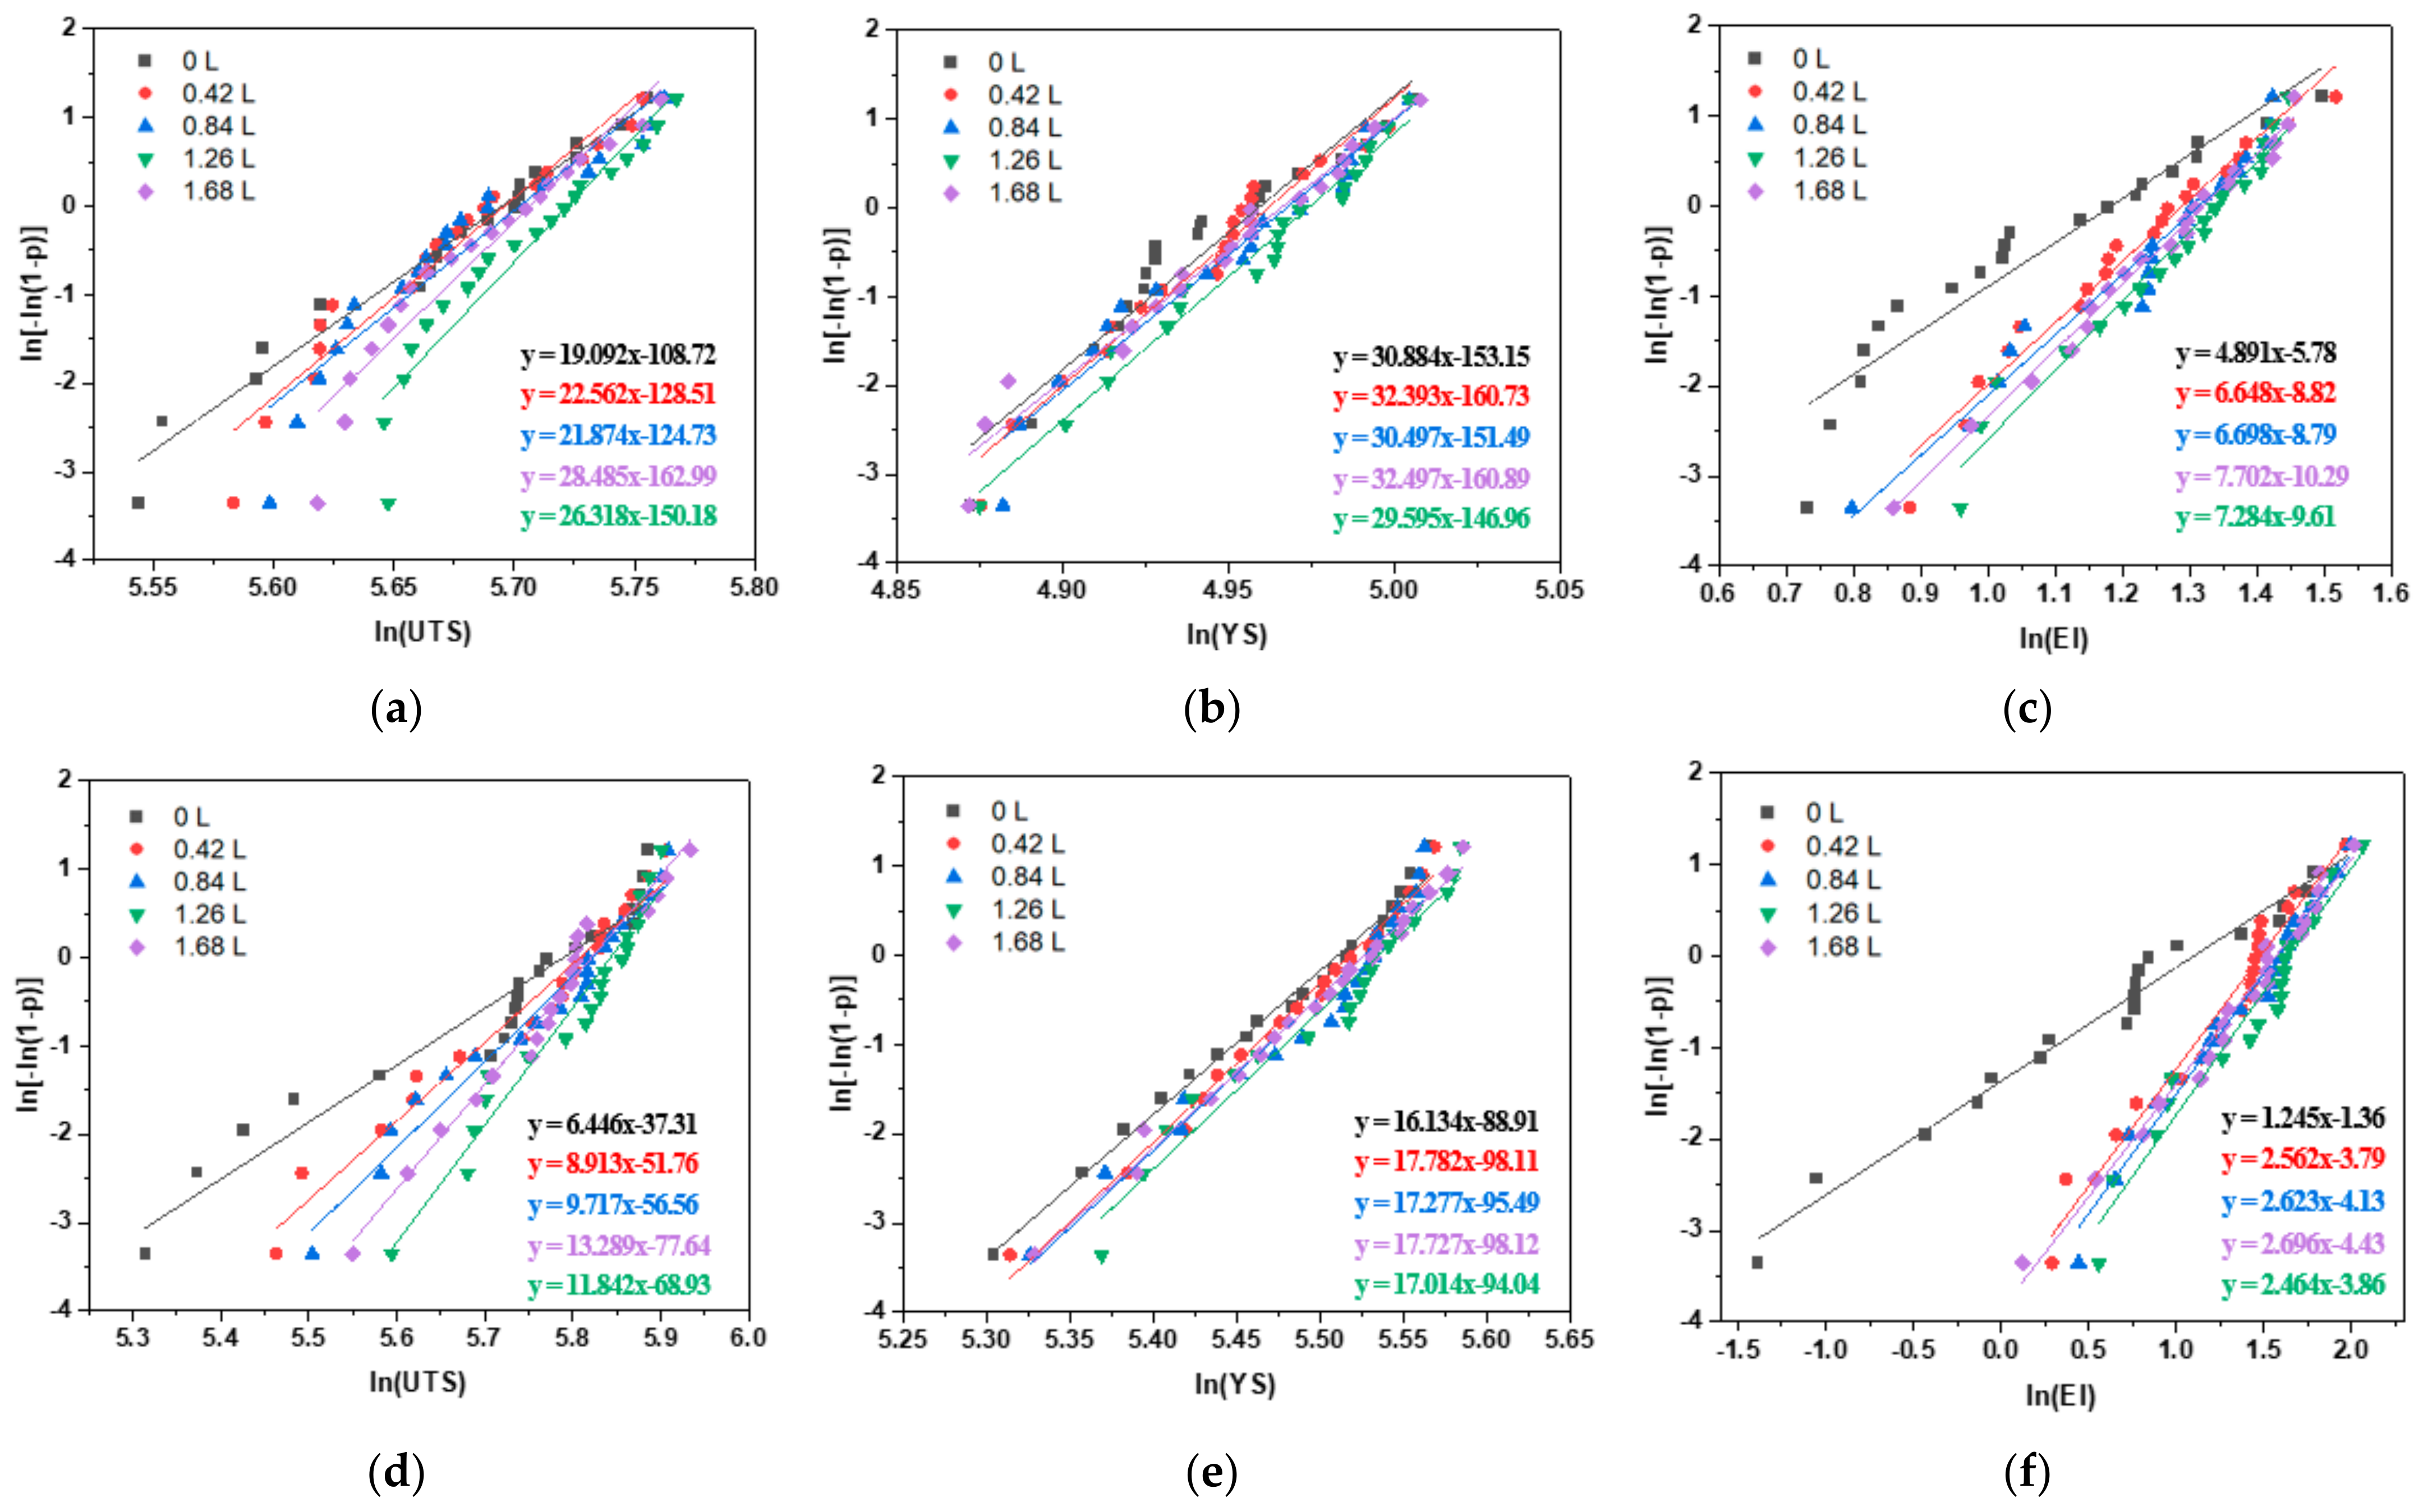
Figure 12 shows the Weibull statistical distribution graph for the tensile test results under each condition, while
Table 6 shows the detailed values for the Weibull statistical distribution. The critical value (
) of
R2 at α = 0.05 was calculated according to the formula for the compatibility evaluation of the Weibull statistical distribution as follows [
9,
16,
20]:
where
n = 20 and the critical value (
) = 0.8937. All
R2 data measured from the Weibull distribution exceeded the critical value, indicating that the measured data can be used as a Weibull distribution.
Figure 12a–c show the Weibull statistical distribution of the tensile properties of the as-cast specimen. When the slope (m) of the graph (Weibull modulus) increases, the deviation decreases and the repeatability and reproducibility increase significantly. In
Figure 12a,c, the Weibull modulus of the tensile strength and elongation increased with increasing injected oxygen amount, confirming improved repeatability and reproducibility. In particular, in the elongation illustrated in
Figure 12c, the Weibull modulus increased significantly when the PF system was applied. This was attributed to the effect of the decreasing gas porosity, owing to the increase in the vacuum degree as the injected oxygen amount increases. In the yield strength depicted in
Figure 12b, no change in the Weibull modulus was observed due to the change in the injected oxygen amount. As shown in
Table 6,
σ0, which corresponds to 63.2% failure probability, increases with increasing injected oxygen amount, with the highest tensile strength, yield strength, and elongation (305.50 MPa, 144.56 MPa, and 3.95%, respectively) observed at 1.26 L.
Figure 12d–f shows the Weibull statistical distribution of the tensile properties of the T6-treated specimens.
Figure 12d,f reveals that the Weibull modulus of the tensile strength and elongation increased with increasing injected oxygen amount, thereby confirming that the repeatability and reproducibility were improved. In particular, the difference in the Weibull modulus for each condition was higher than that observed before heat treatment. In the yield strength illustrated in
Figure 12e, there was no change in the Weibull modulus, owing to the change in the injected oxygen amount (
Figure 12b). Thus, we supposed that the change in porosity by the application of the PF system does not significantly affect the repeatability and reproducibility of the yield strength. As shown in
Table 6,
σ0 showed a tendency to increase with increasing injected oxygen amount, and the tensile strength, yield strength, and elongation (344.61 MPa, 253.42 MPa, and 5.17%, respectively) at 1.26 L were the highest. However, both the Weibull coefficient and
σ0 decreased, compared to those at 1.26 L, when the injected oxygen was further increased to 1.68 L. Thus, we supposed that while some unconsumed oxygen escapes through the vent area, some still remains and forms porosities, thereby reducing the reproducibility and repeatability.

 ,
, 


