Article

Numerical Simulation on Motion Behavior of Inclusions in the Lab-Scale Electroslag Remelting Process with a Vibrating Electrode

1
Key Laboratory for Ecological Metallurgy of Multimetallic Mineral (Ministry of Education), Northeastern University, Shenyang 110819, China
2
School of Metallurgy, Northeastern University, Shenyang 110819, China
3
High Temperature Materials Research Division, Central Iron & Steel Research Institute, Beijing 100081, China
*
Authors to whom correspondence should be addressed.
Metals 2021, 11(11), 1784; https://doi.org/10.3390/met11111784
Submission received: 15 October 2021 / Revised: 29 October 2021 / Accepted: 29 October 2021 / Published: 5 November 2021

Abstract

:
In order to meet the requirement of high-quality ingots, the vibrating electrode technique in the electroslag remelting (ESR) process has been proposed. Non-metallic inclusions in ingots may cause serious defects and deteriorate mechanical properties of final products. Moreover, the dimension, number and distribution of non-metallic inclusions should be strictly controlled during the ESR process in order to produce high-quality ingots. A transient 2-D coupled model is established to analyze the motion behavior of inclusions in the lab-scale ESR process with a vibrating electrode, especially under the influence of the vibration frequency, current, slag layer thickness, and filling ratio, as well as type and diameter of inclusions. Simulation model of inclusions motion behavior is established based on the Euler-Lagrange approach. The continuous phase including metal and slag, is calculated based on the volume of fluid (VOF) method, and the trajectory of inclusions is tracked with the discrete phase model (DPM). The vibrating electrode is simulated by the user-defined function and dynamic mesh. The results show that when the electrode vibration frequency is 0.25 Hz or 1 Hz, the inclusions will gather on one side of the slag layer. When it increases from 0.25 Hz to 1 Hz, the removal ratio of 10 μm and 50 μm inclusions increases by 5% and 4.1%, respectively. When the current increases from 1200 A to 1800 A, the flow following property of inclusions in the slag layer becomes worse. The removal ratio of inclusions reaches the maximum value of 92% with the current of 1500 A. The thickness of slag layer mainly affects the position of inclusions entering the liquid-metal pool. As the slag layer thickens, the inclusions removal ratio increases gradually from 82.73% to 85.91%. As the filling ratio increases, the flow following property of inclusions in the slag layer is enhanced. The removal ratio of 10 μm inclusions increases from 94.82% to 97%. However, for inclusions with a diameter of 50 μm, the maximum removal ratio is 96.04% with a filling ratio of 0.46. The distribution of 50 μm inclusions is significantly different, while the distribution of 10 μm inclusions is almost similar. Because of the influence of a vibrating electrode, 10 μm Al 2 O 3 and MnO have a similar removal ratios of 81.33% and 82.81%, respectively.

1. Introduction

The electroslag remelting (ESR) process is widely used in the production of high quality special steels and alloys as a secondary refining technology [1]. In the ESR process, the consumable electrode and water-cooled baseplate are fed with AC (Alternating Current) or DC (Direct Current) power. The current passes through the closed circuit, composed of a consumable electrode, slag layer, liquid-metal pool, transformer, and water-cooled baseplate. There is a high temperature in the slag layer due to high thermal resistance. The tip of consumable electrodes submerged in the slag layer will be heated and gradually melted to form metal droplets. The metal droplets fall off under the force of gravity, pass through the slag layer, and go into the liquid-metal pool. In the meanwhile, the molten metal is gradually solidified due to water-cooled mold, forming an ingot.
The vibrating electrode in the ESR process was proposed, in order to improve efficiency and steel performance. Wang et al. [2] compared the flow pattern, temperature distribution, and solidification profile of the ESR process with that of the conventional electrode and vibrating electrode by establishing a transient 3D model. They concluded that using a vibrating electrode accelerates the melting rate, enhances heat transfer between the electrode and slag layer, and increases the temperature of the slag layer in the ESR process.
Non-metallic inclusions has adverse effects on the plasticity, toughness, fatigue properties, and corrosion resistance of steel. Therefore, the dimension, number, and distribution of non-metallic inclusions should be strictly controlled during the vibrating electrode ESR process in order to produce high quality ingots [3]. There are some experiments to investigate the characteristics of non-metallic inclusions in an ESR furnace. Dong et al. [4] experimentally investigated the evolution of non-metallic inclusions under different slag systems in the ESR process of die steel. The non-metallic inclusions have different adsorption and solution processes. The results indicate that most common non-metallic inclusions are MgO-Al2O3 inclusions for multi-element slag but Al2O3 inclusions for conventional CaF2 (70%wt) + Al2O3 (30%wt) slag. The impacts of the chemical composition of slag and melt rate on inclusions behavior and removal rates have been analyzed by Mehrabi et al. [5]. They point out that the inclusions with sulfide were not found in ingots after the ESR process. Although the dimensions of inclusions in electrode was up to 100μm, the size of inclusions in ingots was dropped to 10 μm. The evolution of oxide inclusions in the ESR process of Inconel 718 superalloy was experimentally studied by Chen et al. [6]. They found that the original inclusions in the electrode were basically MgO-Al2O3 spinel, which would be removed by molten slag in ingots. However, the solubility of oxygen in molten metal dropped during the solidification process. The dissolved Mg and Al in the molten metal reacted with the supersaturated oxygen. Finally, different MgO-Al2O3 spinel was reformed in the final ingot. It was encompassed by carbonitride (Nb,Ti) CN precipitation. Shi et al. [7] mainly experimentally studied the deoxidation process of S136 die steel in the ESR process. The results show that the composition of inclusions in electrodes was different from those in the final ingot. The composition of inclusions in electrodes was two of kinds; one was mainly large (Mn,Cr)S inclusions with the other being inclusions made up of an Al2O3 core.
However, the motion trajectory of inclusions during the ESR process could not be tracked and evaluated in that experiment. A series of complex phenomena, such as alternating electromagnetic fields, two-phase flow, heat and mass transfer, and chemical reactions in the ESR process were uncharted, which observably influenced the motion behavior of inclusions [8]. In recent years, with the development of computer technology, numerical simulation technique has become an important tool to study the ESR process. Numerical simulation has the advantage of reducing cost, and provides an alternative way to acquire recondite discernments into the inclusions motion during the ESR process. Kelkar et al. [9] first simulated inclusions trajectories with different diameters and densities in the ESR process. The simulation process considered fluid flow, temperature field and solidification. The results show that inclusions with smaller diameters and lower densities tend to flow with the fluid, while inclusions with larger diameters and higher densities are mainly influenced by buoyancy. However, the formation and dripping of metal droplets were not considered in their work, which is one of the key methods for removing the inclusions. Du et al. [10] established a 2D mathematical model to study the effect of different operating conditions on inclusions in remelted ingots of die steel based on experimental and thermodynamic methods. The results show that an appropriate increase in slag volume will lead to faster fluid flow of metal and slag, thus enhancing natural convection and strengthening inclusions movement to achieve better removal results. Properly increasing the current will enhance the flow in the middle of slag layer, and the flow scouring in slag will become more intense, which will lead to a faster renewal ratio of metal surface and promote the removal of inclusions. Huang et al. [11] established a 2D axisymmetric transient model to consider the electromagnetic field, fluid flow and heat transfer. The Euler-Lagrange method was used to describe the interaction between melt and non-metallic inclusions during the ESR process. The results show that the trapping and distribution of non-metallic inclusions in the mushy zone is mainly influenced by the dragging and buoyancy forces, which are especially important for the buoyancy of large-size inclusions. The overall removal ratio of original inclusions increases from 80.47% to 94.75%, with the inclusions diameter increasing from 2 mm to 20 mm. However, since the actual ESR process is complex, to capture and predict the inclusions trajectories with a 2D axisymmetric model is immature. Scholars already have a comprehensive understanding of the electromagnetic field, flow field, and temperature distribution of the ESR process with the help of experimental and numerical simulation methods. The motion of inclusions during the vibrating electrode ESR process is also complicated. However, little efforts on the distribution, removal, and regeneration of inclusions in the ESR process with vibrating electrode have been done.
As discussed above, a comprehensive investigation to clarify the motion behavior of the original inclusions during the ESR process with vibrating electrode is desirable. In this study, a transient 2D model is established using a commercial software FLUENT 18.5, to analyze the removal, motion and distribution of non-metallic inclusions in lab-scale ESR processes. The motion behavior, distribution pattern, and removal ratio of inclusions in the slag layer and liquid-metal pool are discussed, especially under the effects of electrode vibration frequency, current, slag-layer thickness, filling ratio, inclusion type, and diameter.

2. Model Description

The ESR process contains intricate physical and chemical processes, such as electromagnetic, flow, heat transfer, solidification, etc. Based on the literature and actual circumstance, the fundamental assumptions are as follows:
  • The depth of consumable electrode immersed in the slag layer remains unchanged, and the tip of the electrode keeps flat;
  • Only the removal of original inclusions is considered, but not the generation of new inclusions, as well as the chemical reaction and dissolution of inclusions;
  • The solidification process of molten metal is not considered;
  • The physical parameters of slag and metal are assumed to be constant.
In this study, Maxwell’s equations are used to compute the electromagnetic field [12]. Then, the Lorentz force and Joule heating are incorporated into momentum and energy conservation equations. Considering the continuous-phase slag/metal in the ESR process, the VOF model is chosen to capture the slag/metal interface [13]. Flow in the slag layer and liquid-metal pool can be treated as weak turbulence using the RNG k-ε approach [14]. The temperature field is modeled by calculating the energy equation. Since the volume fraction of inclusions is small, the effect of inclusions on fluid flow can be neglected. Therefore, the DPM method is selected to track the trajectory of inclusions [15]. The 2D model of this study in the lab-scale ESR process is shown in Figure 1. A detailed description of the model and boundary conditions are listed in the Appendix A. According to the forces analysis of inclusions, the density and diameter are the main factors that affect the forces. Therefore, we selected the MnO and Al 2 O 3 inclusions with large density, which are different from research object studied in Refs. [16,17]. Details of the liquid-metal and slag-layer properties, geometry, and operating parameters used in the simulation are listed in Table 1 [8,9,12,18,19].

3. Simulation Setup

In this study, a transient 2D model is established to study the fluid flow, heat transfer, and inclusions motion behavior in the ESR process with a vibrating electrode. The inclusions motion is affected by multiple forces. In order to obtain the trajectory, distribution, and removal rate of inclusions accurately, we must track a large number of inclusions of different sizes and types over a long period. Considering the constraints of time and cost, we only established a lab-scale model to simulate the ESR process with a vibrating electrode. The continuous phases are calculated by the VOF model. Molten steel is set as the basic phase, and slag is the second phase. The DPM method is used to track the trajectory of inclusions. The user-defined function and dynamic mesh are combined to simulate the motion of electrode vibration. The continuity equation, flow equation, and energy equation adopt the first-order upwind difference scheme. The iteration of governing equations is completed by ANASYS coupling with the proper boundary conditions. Three different sizes of grid are selected for simulation. Considering the accuracy of simulation results and the time required for the simulation process, the grid size of 1.25 mm × 1.25 mm is finally selected. The time step is set to be 0.01 s, and inclusions is injected at an inlet every 20 steps.

4. Results

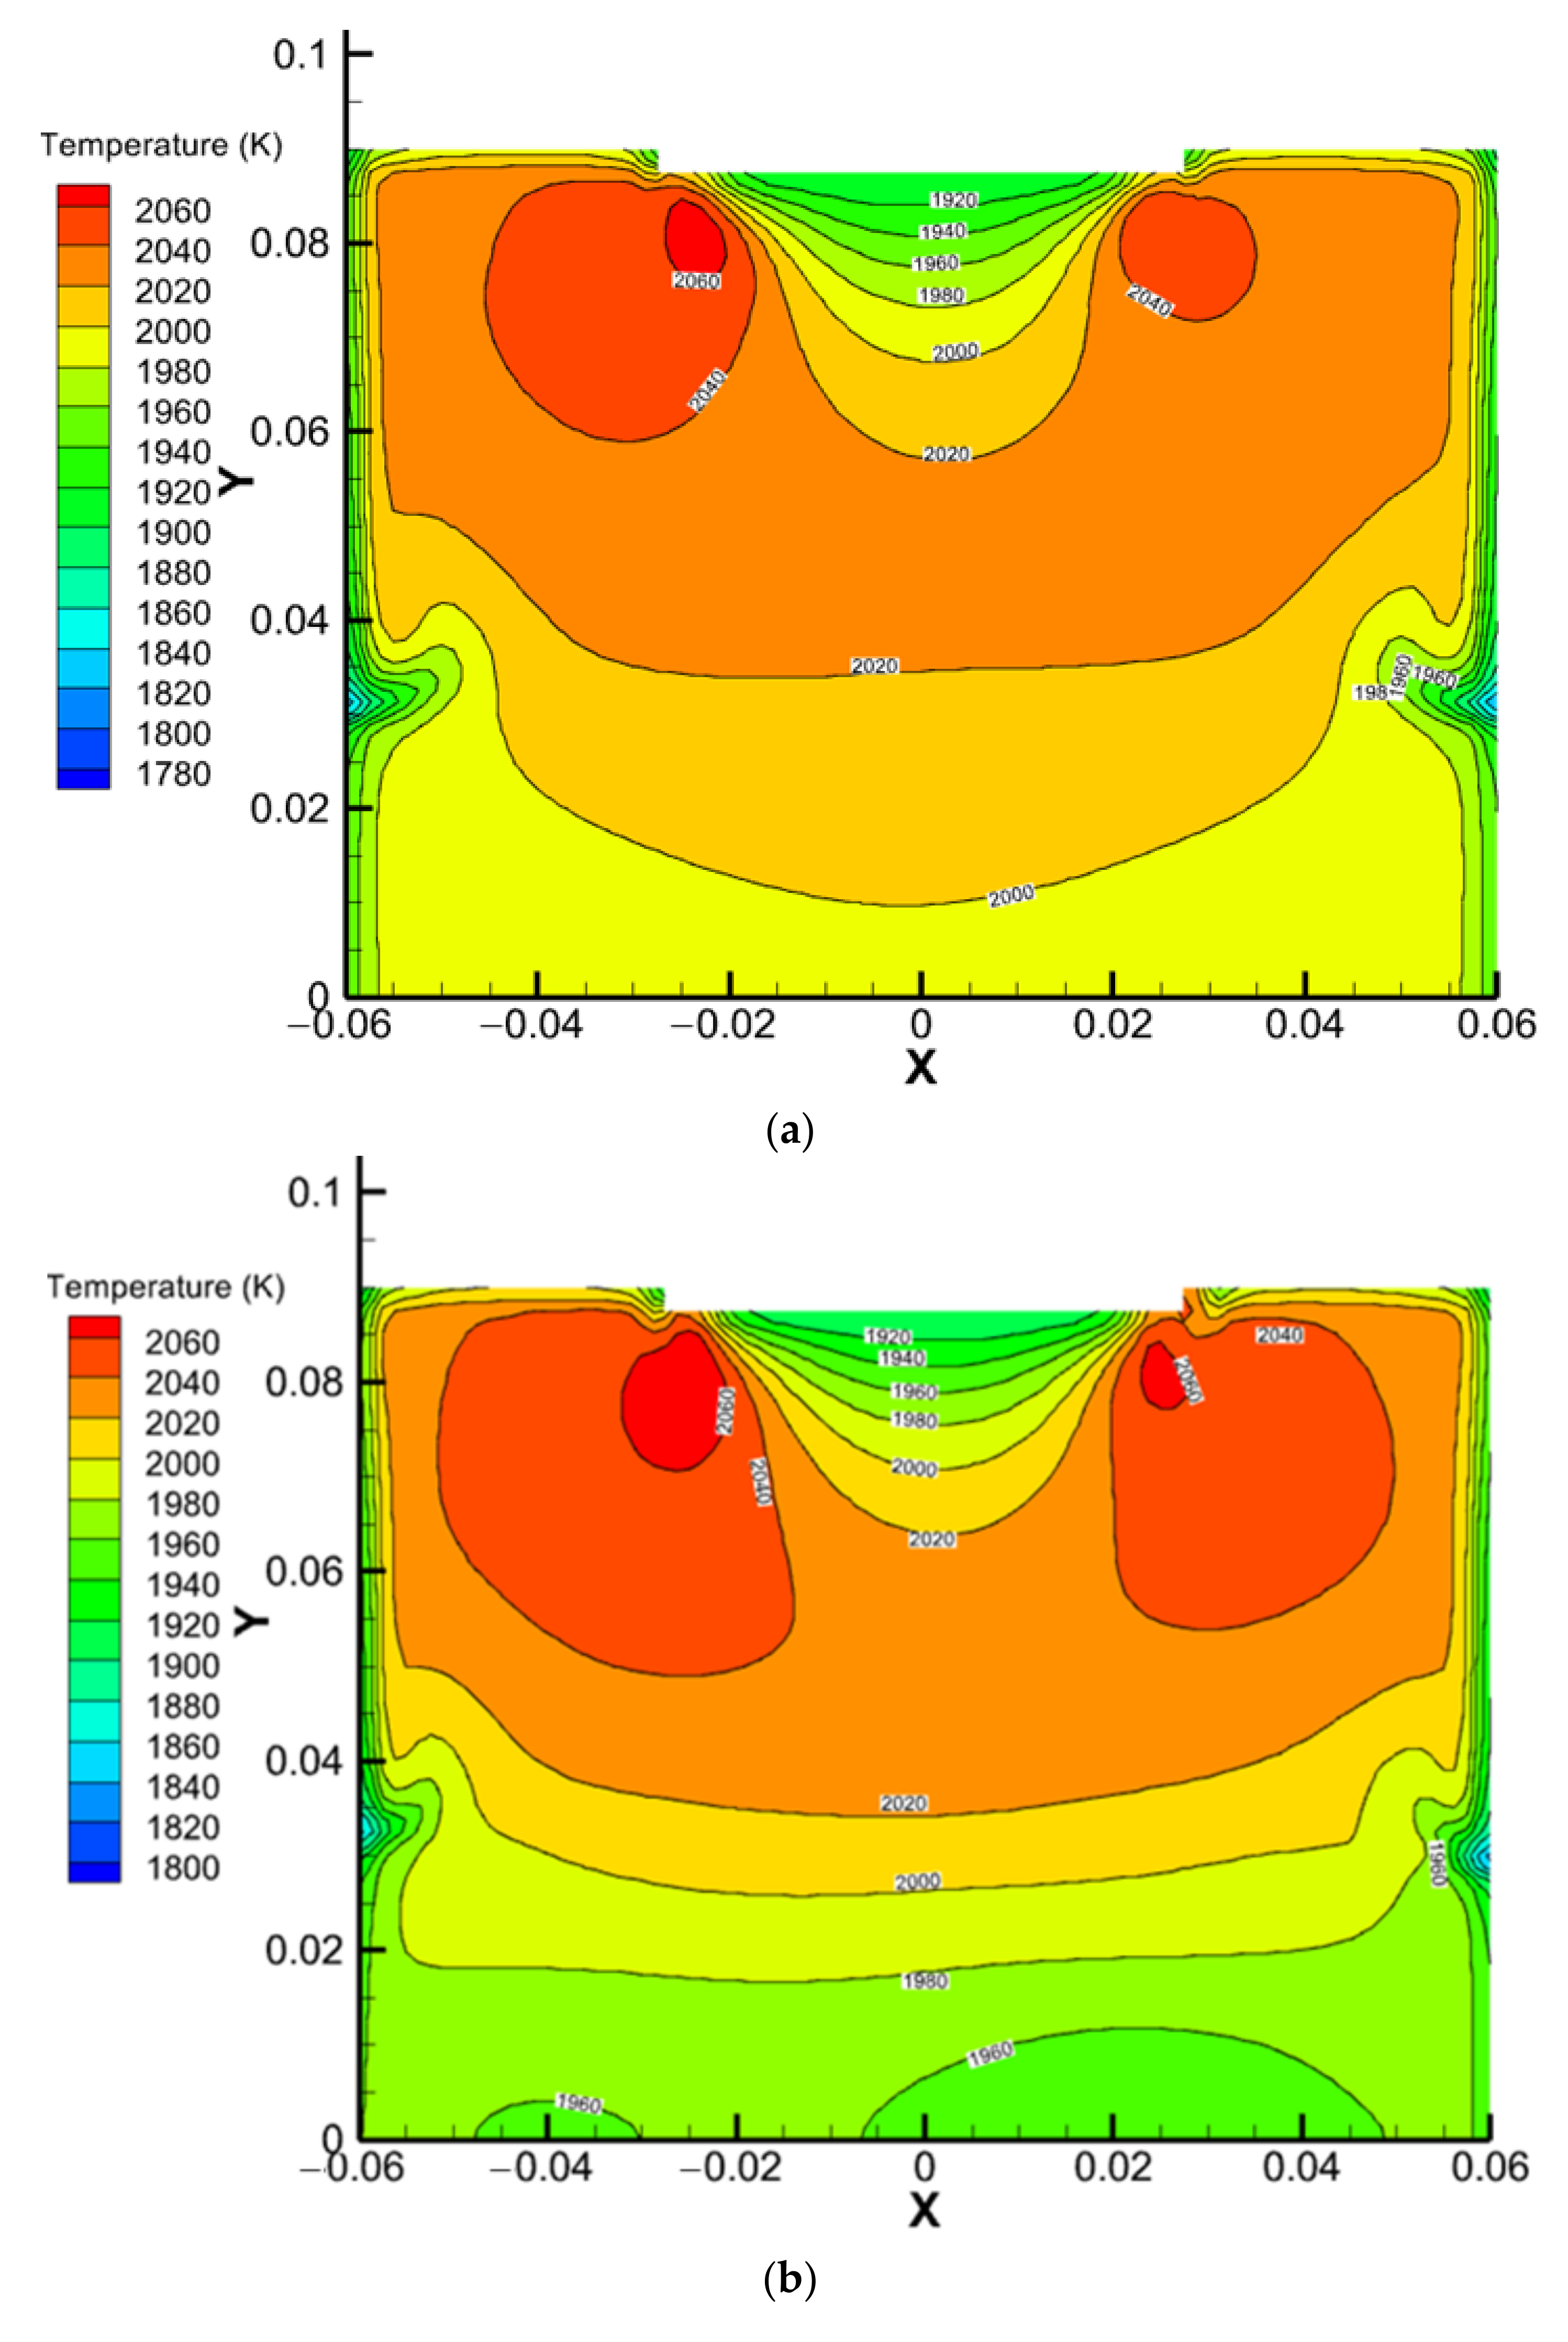
4.1. Temperature-Field Distribution

The temperature-field distribution in the ESR process with a vibrating electrode and a conventional electrode is demonstrated in Figure 2a,b respectively. The temperature field in the slag layer is distributed in a laminar pattern. The temperature is higher, and its gradient is smaller along the vertical direction as it moves away from the end of the electrode with a vibrating electrode. The temperature is lower near the mold wall because of heat transfer between the slag layer and the water-cooled mold. Considering the skin effect of alternating current, the Joule heat has a maximum value below the tip of the electrode. A large amount of heat at the tip of the electrode is used to melt the electrode to form metal a droplet, so the highest temperature is distributed on the left and right of the electrode [20]. The electric conductivity of metal droplets is 102 order larger than that of slag, which is listed in Table 1. The temperature field distribution in the liquid-metal pool is more uniform with a vibrating electrode, and the average temperature is higher than that with a conventional electrode. The range of high-temperature zones below the electrode inlet is larger, and the temperature gradient at the electrode inlet is larger with a conventional electrode. This is because, due to the vibration of the electrode, droplets has a certain horizontal initial velocity when it leaves, accelerating fluid flow in the slag layer [21]. As a result, heat transfer is enhanced, making temperature-field distribution in the slag layer and liquid-metal pool uniform. Figure 2c shows the temperature-field distribution with a current of 1800 A in the ESR process with a vibrating electrode. Because of the increase in the current, the Joule heat generated in the slag layer simultaneously increases significantly. The increment of temperature at the slag/metal interface is about 40 °C. At the same time, the high-temperature zone on both sides of the electrode has a significant increase compared with a current of 1500 A. The range of the high-temperature zone also significantly expands. When the simulation time is 22 s, the temperature-field distribution has changed significantly, as demonstrated in Figure 2d. As time goes by, the heat is continuously transferred from the slag pool to the liquid-metal pool in the vertical direction. Thus, the temperature distribution in the liquid-metal pool becomes more uniform. The range of the high-temperature zone on both sides of the electrode expands. This is similar to the effect of increasing current.
In order to verify the accuracy of the model, the slag layer temperature obtained from an experiment in an open-air environment in from the literature [22] is used. The width of the mold is 120 mm, and the height is 600 mm. The consumable electrode is made up of the AISI 201 stainless steel and the slag system is made up of CaF2 (75%wt) and Al2O3 (25%wt). The current is set as 1500 A, the filling ratio is 0.46, and the slag-layer thickness is 60mm. The temperature is measured every 3 min, by a disposable W3Re/W25Re thermocouple. The data are represented in a green hexagon in Figure 3. The variation of the slag-layer temperature in the ESR process with the conventional and vibrating electrodes based on the model of this study is obtained, respectively. These results are shown in Figure 3 by blue chain line and red dotted line, respectively. It can be seen that the experimental results are consistent with the simulation results, which verifies the accuracy of the model.

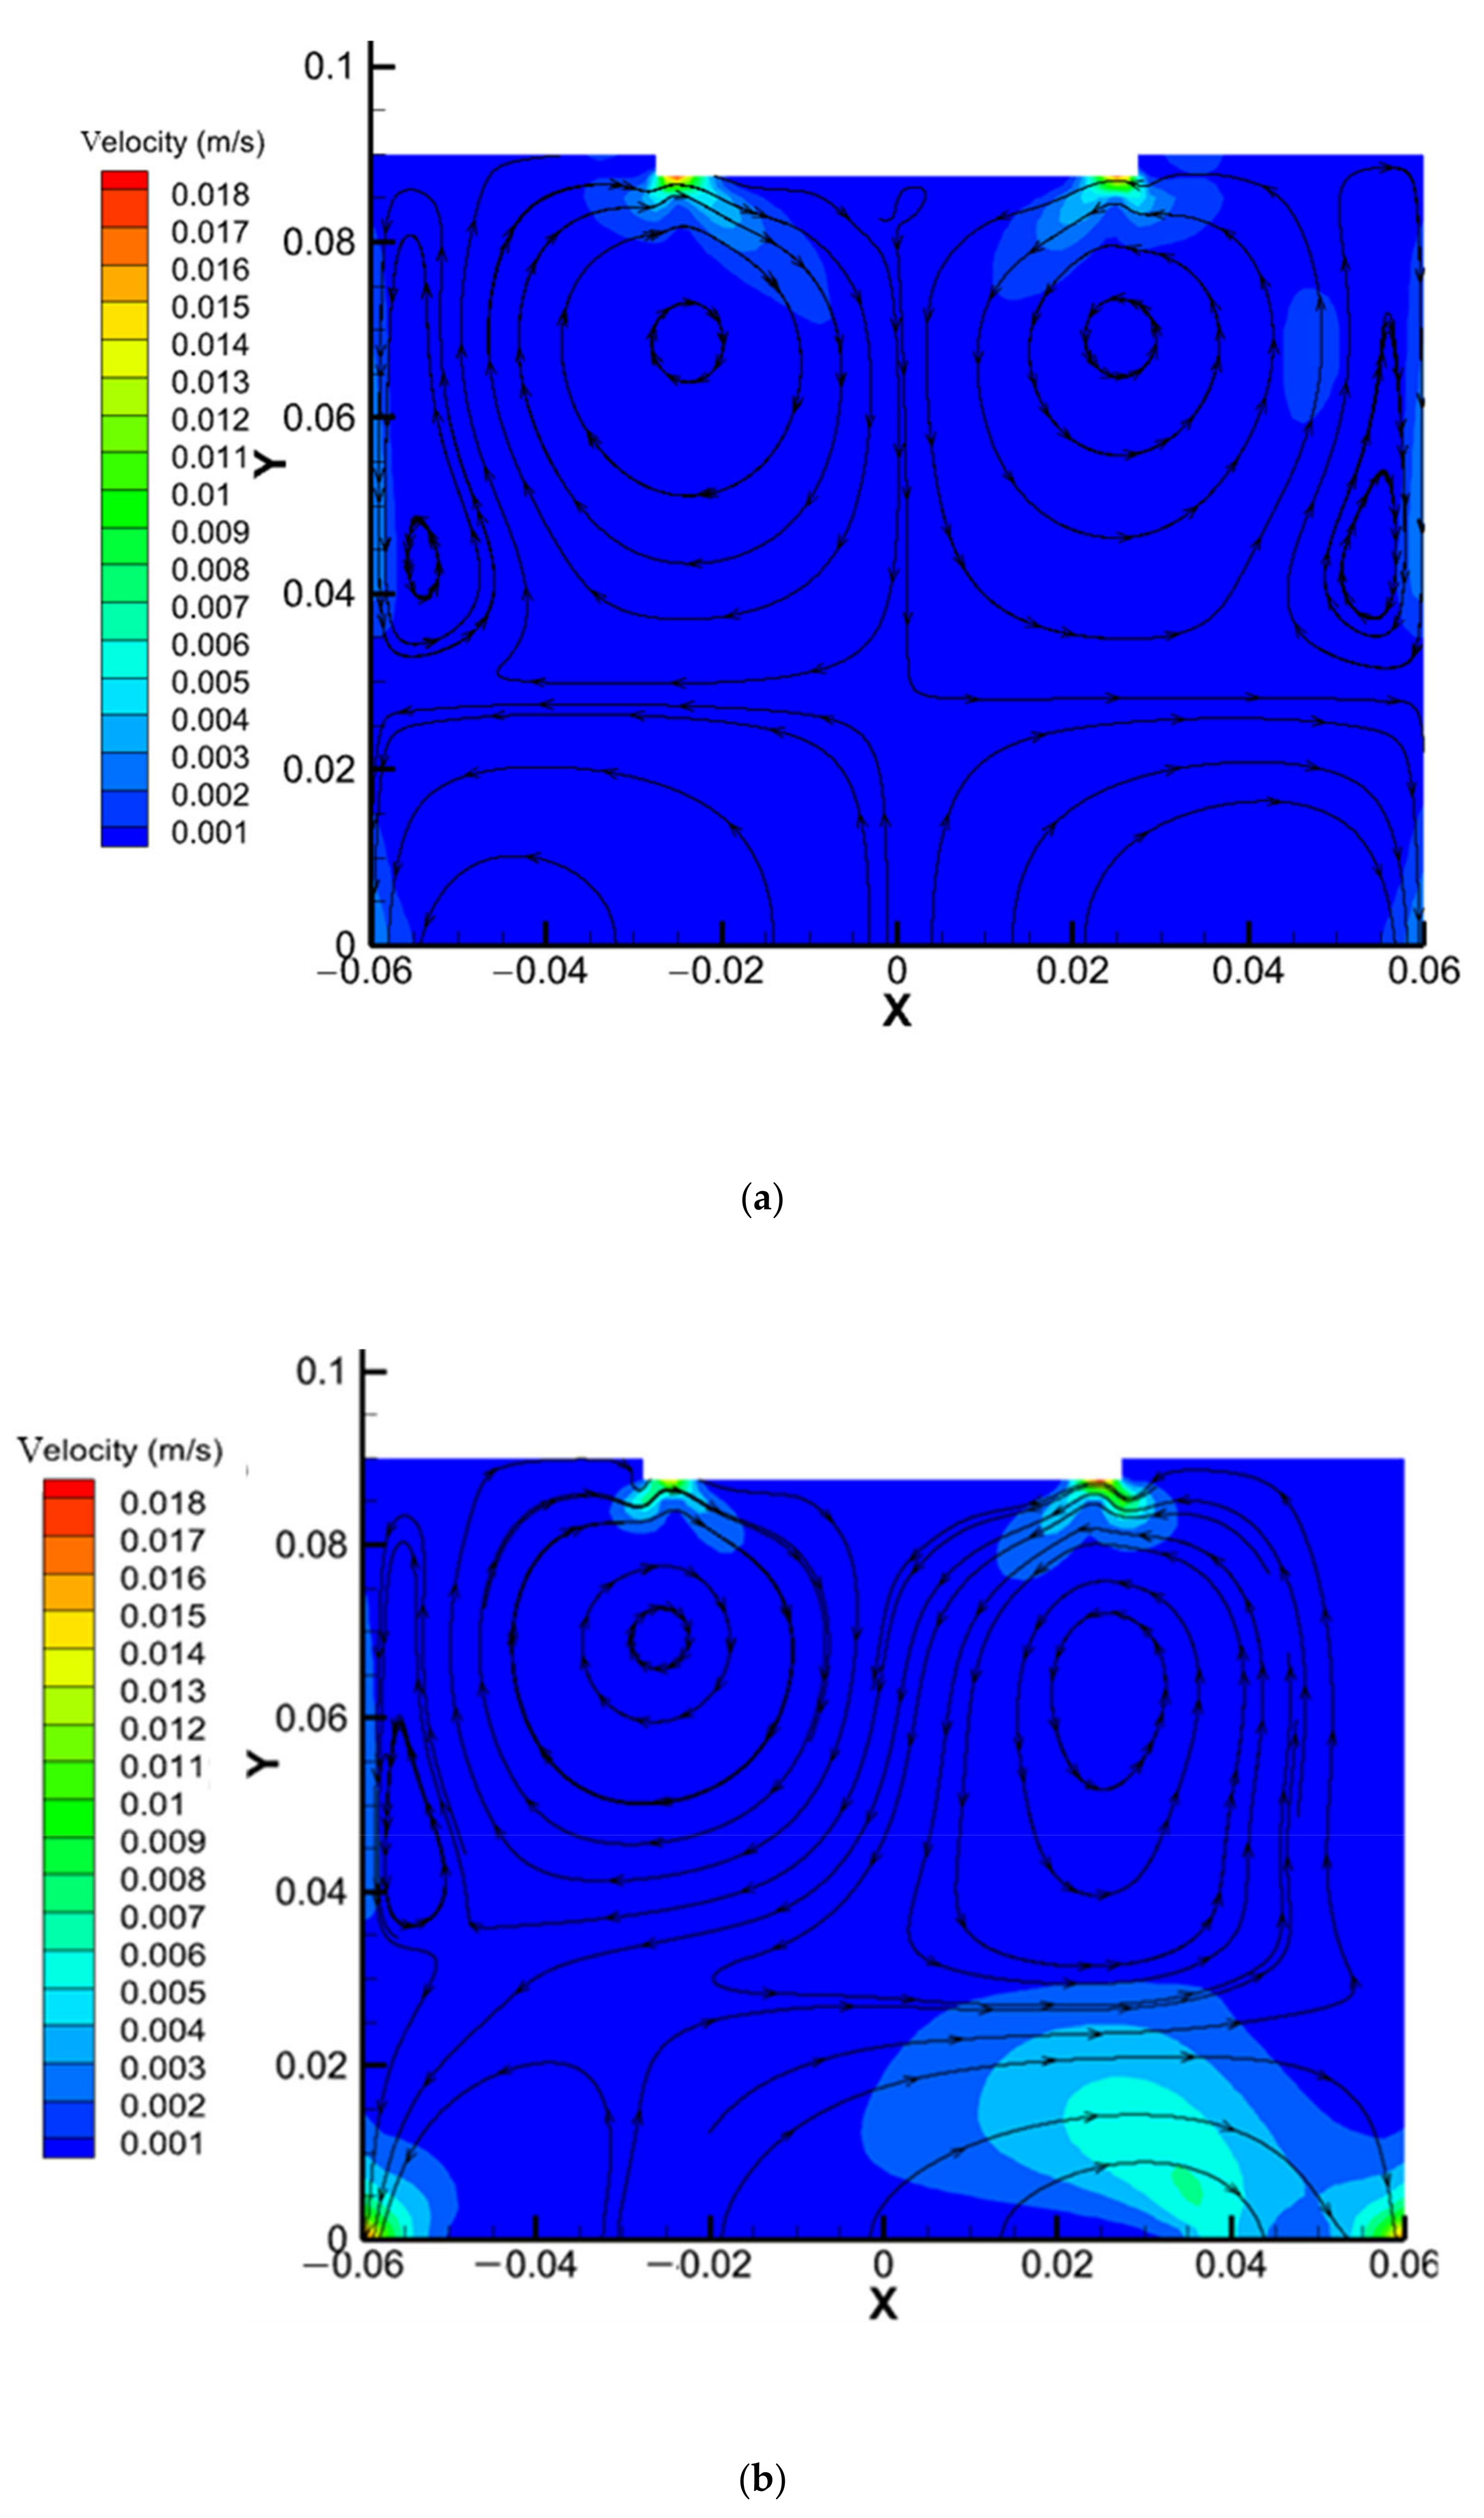
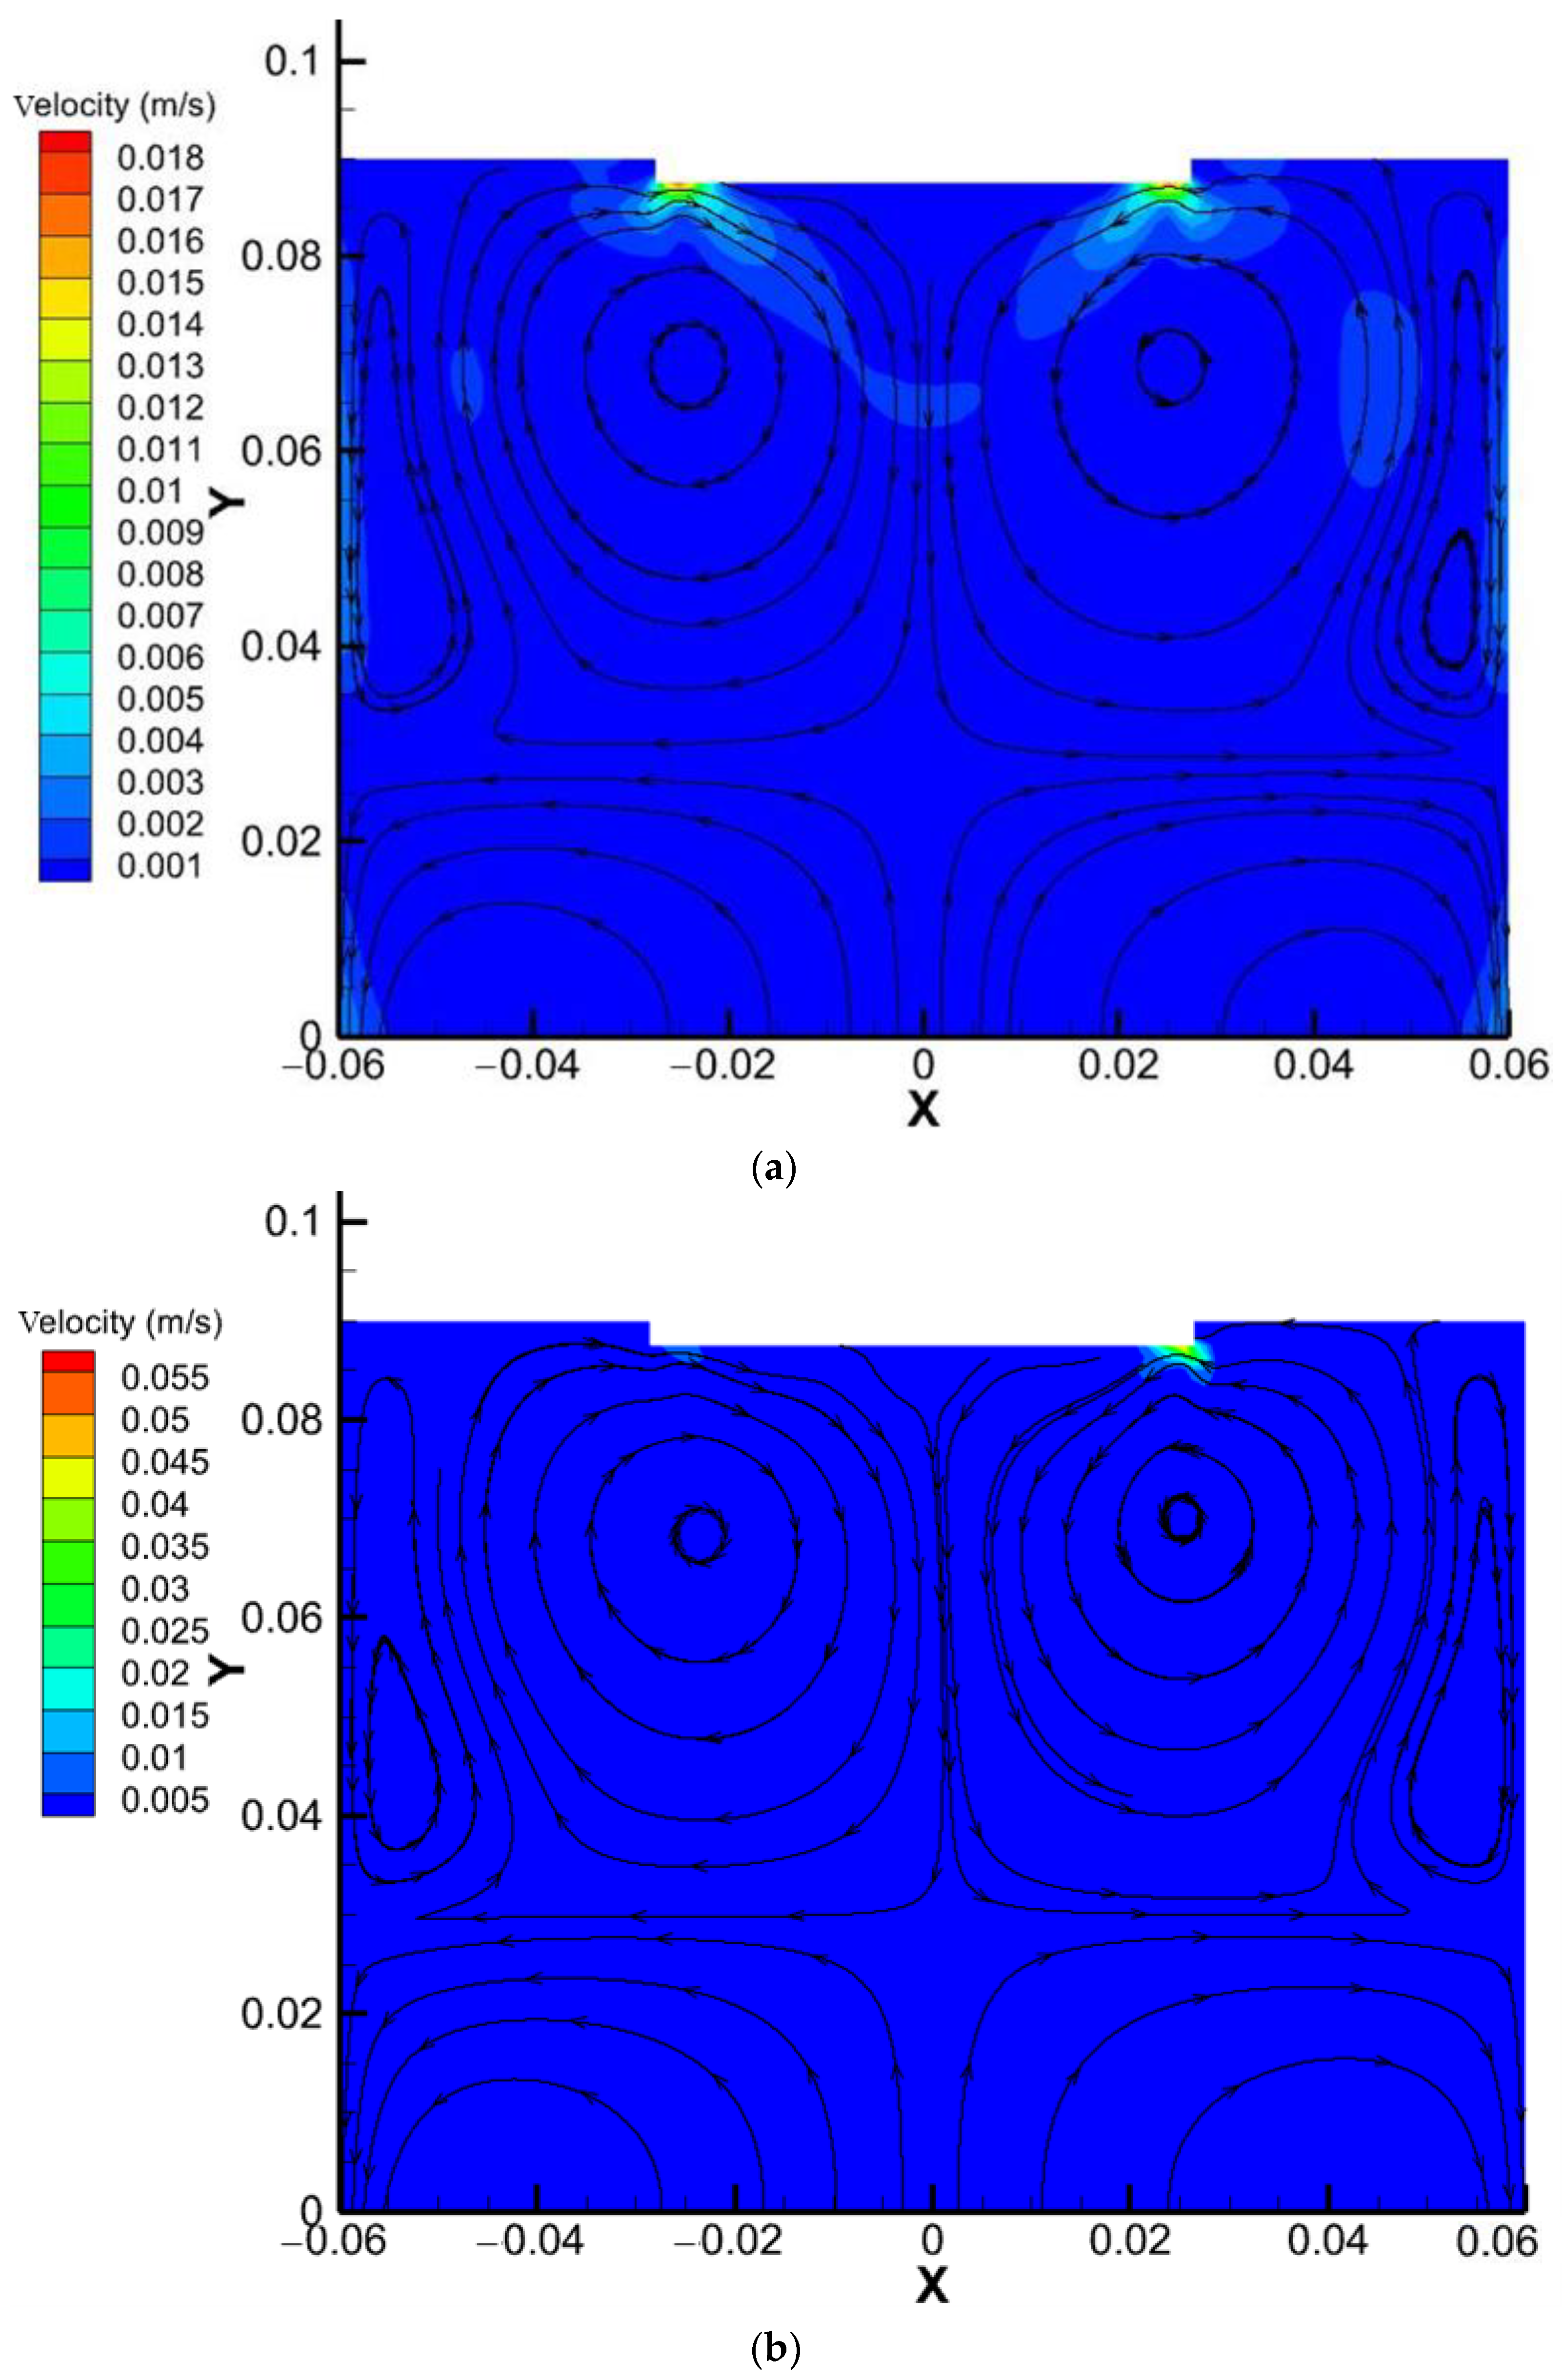
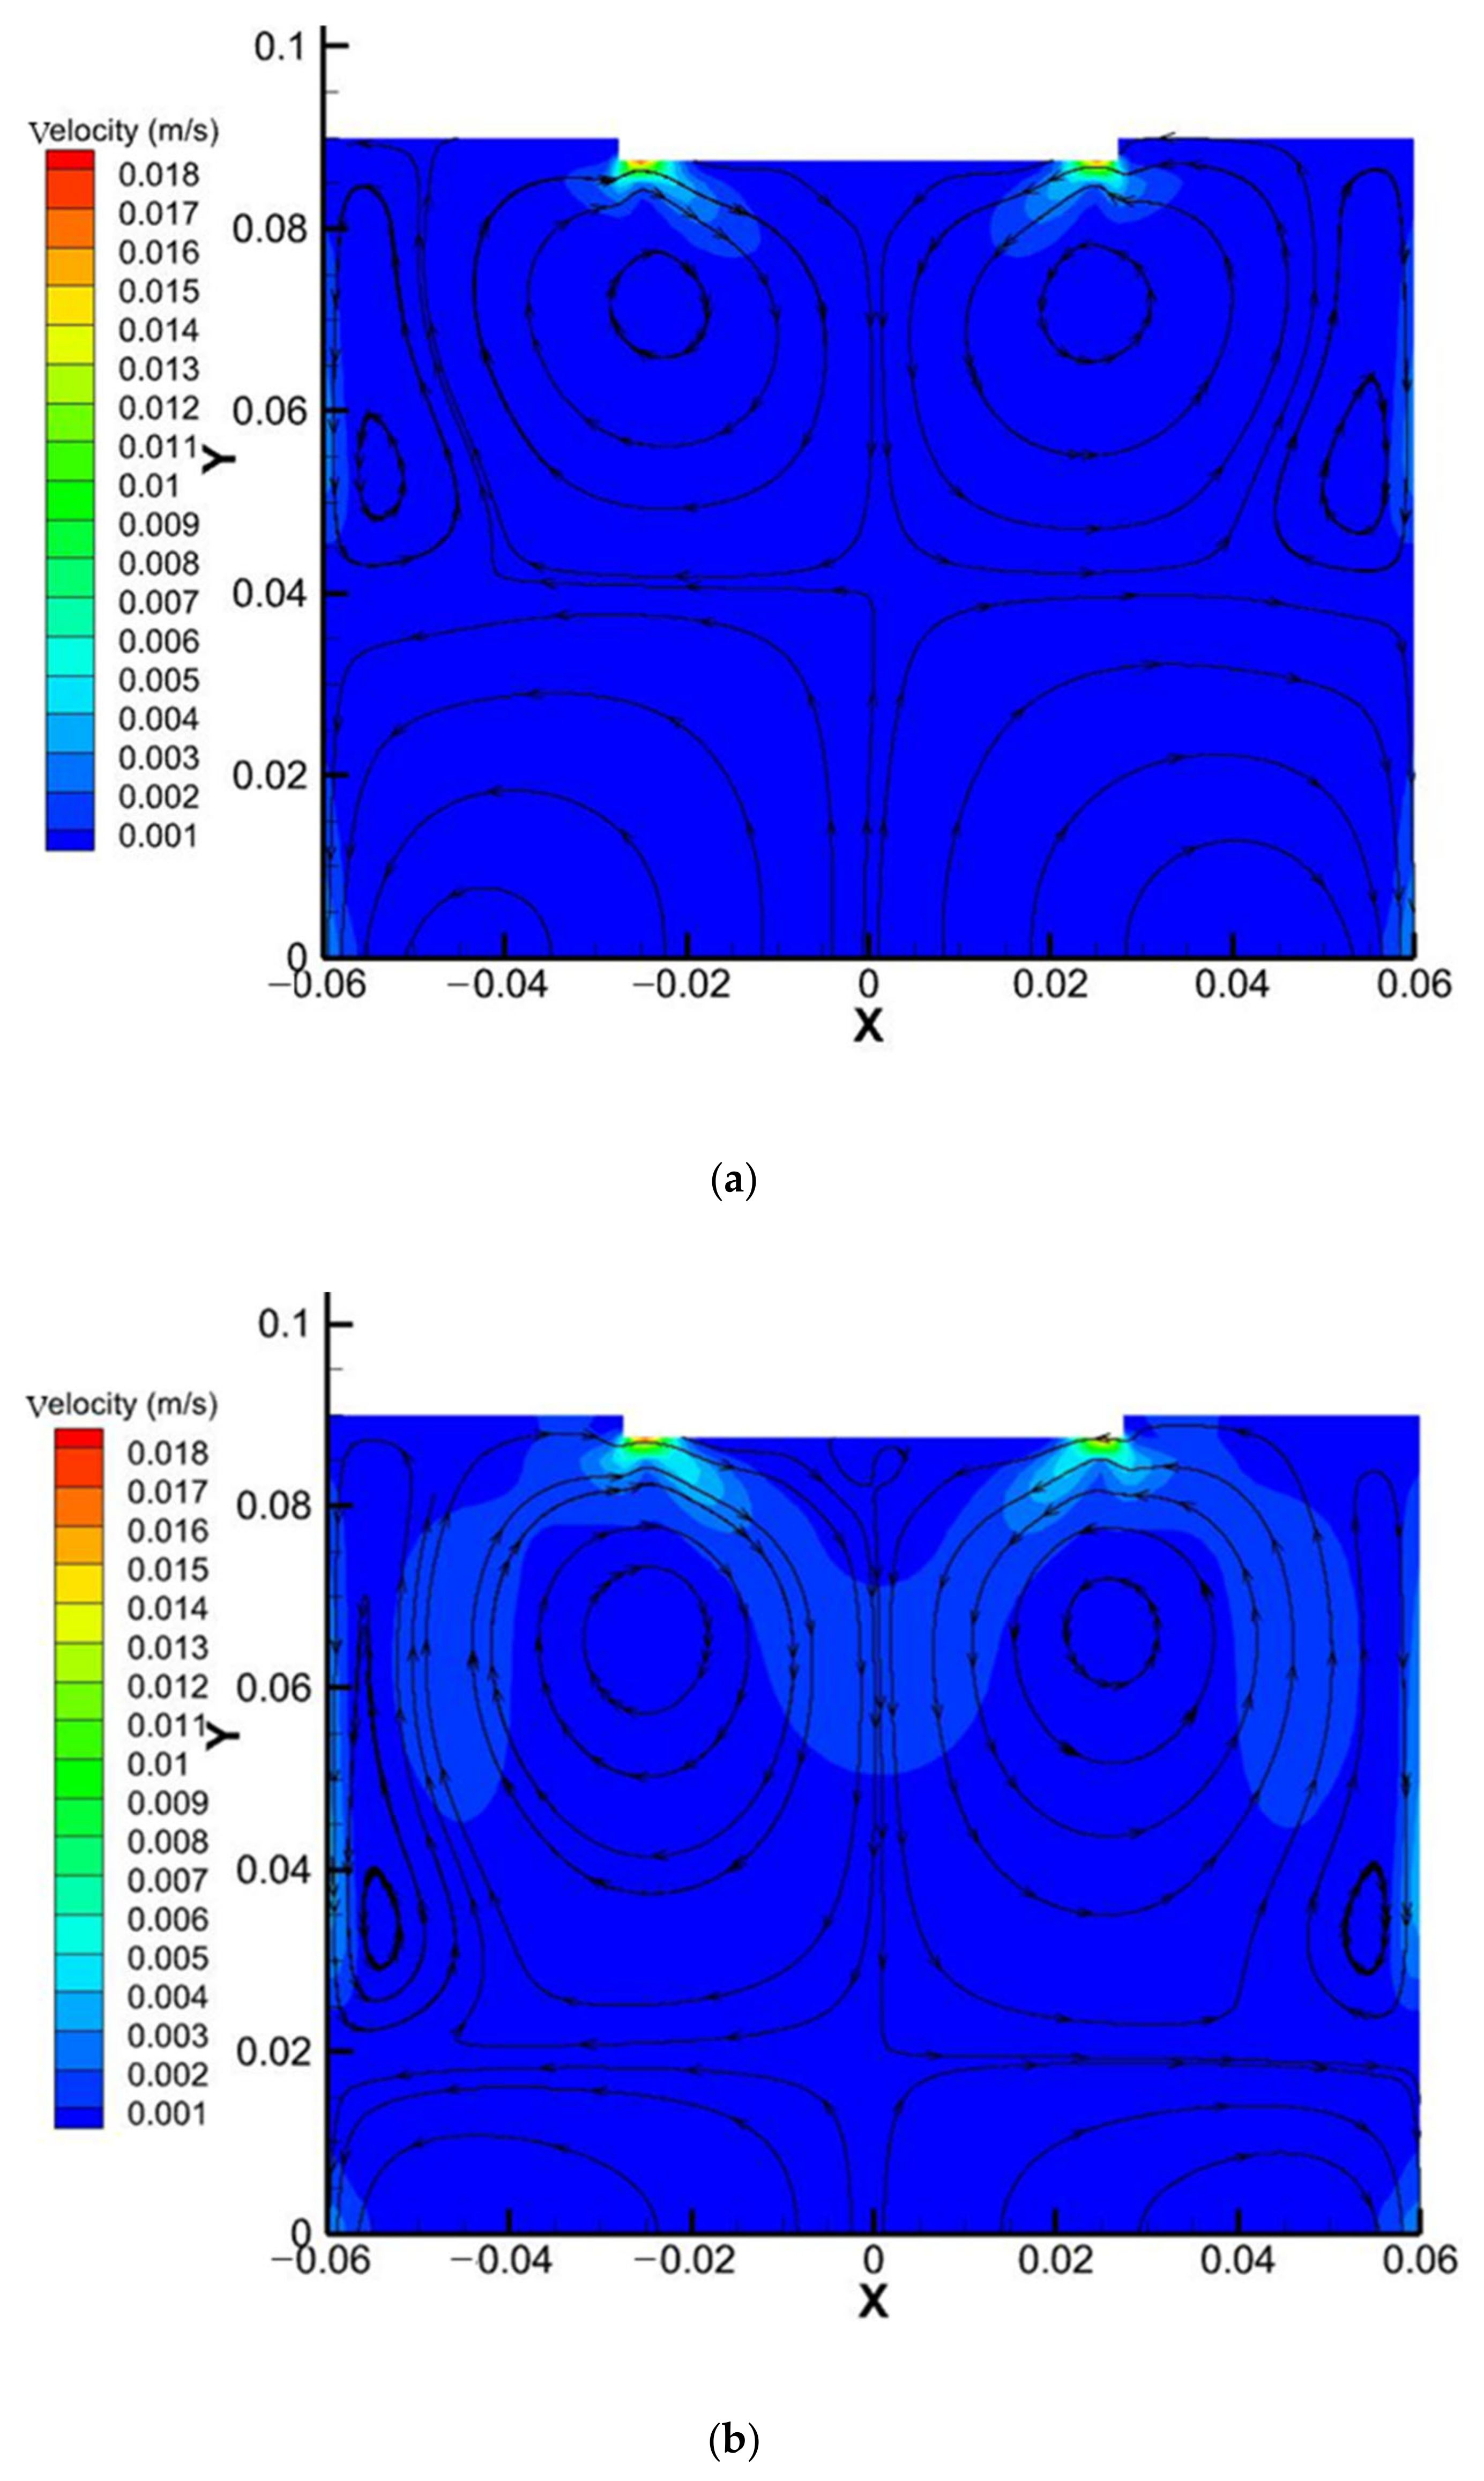
4.2. Flow Field and Streamlines Distribution

Figure 4a gives the flow field and streamlines distribution with a vibrating electrode. Two vortexes in the opposite direction can be seen clearly in the slag layer. This is because the molten metal film is subjected to gravity, Lorentz force, and surface tension. The droplets converge at the bottom center under the action of a vibrating electrode. When the combined force of Lorentz force and gravity is greater than the surface tension, the droplets will fall off. The high-temperature molten slag flows to the bottom of the slag layer under the downward shear stress and then floats from the bottom of the slag layer.
However, the streamlines distribution in the slag layer and liquid-metal pool is more disorganized and disorderly with conventional electrodes. Futhermore, the streamline distribution on the left and right sides is seriously asymmetrical, as shown in Figure 4b. The velocity at the left and right corners near the bottom of the liquid-metal pool is greater than that with a vibrating electrode. Much backflow forms in the slag layer and the liquid-metal pool. The vortex range on the left side near the mold wall is significantly larger than that on the right side.
The streamline distribution is basically the same when the vibration frequency changes, as shown in Figure 5. Nevertheless, when the vibration frequency increases to 1 Hz, the average velocity of the fluid in the slag layer and liquid-metal pool improves significantly, and the flow velocity distribution in the slag layer becomes more uniform. The flow field and streamline distribution change significantly when the thickness of the slag layer changes, which can be seen in Figure 6. The vortex size in the center of the slag layer changes with the thickness of the slag layer. This is mainly because there is often an obvious boundary between the flow in the slag layer and the liquid-metal pool in the ESR process with vibrating electrode.

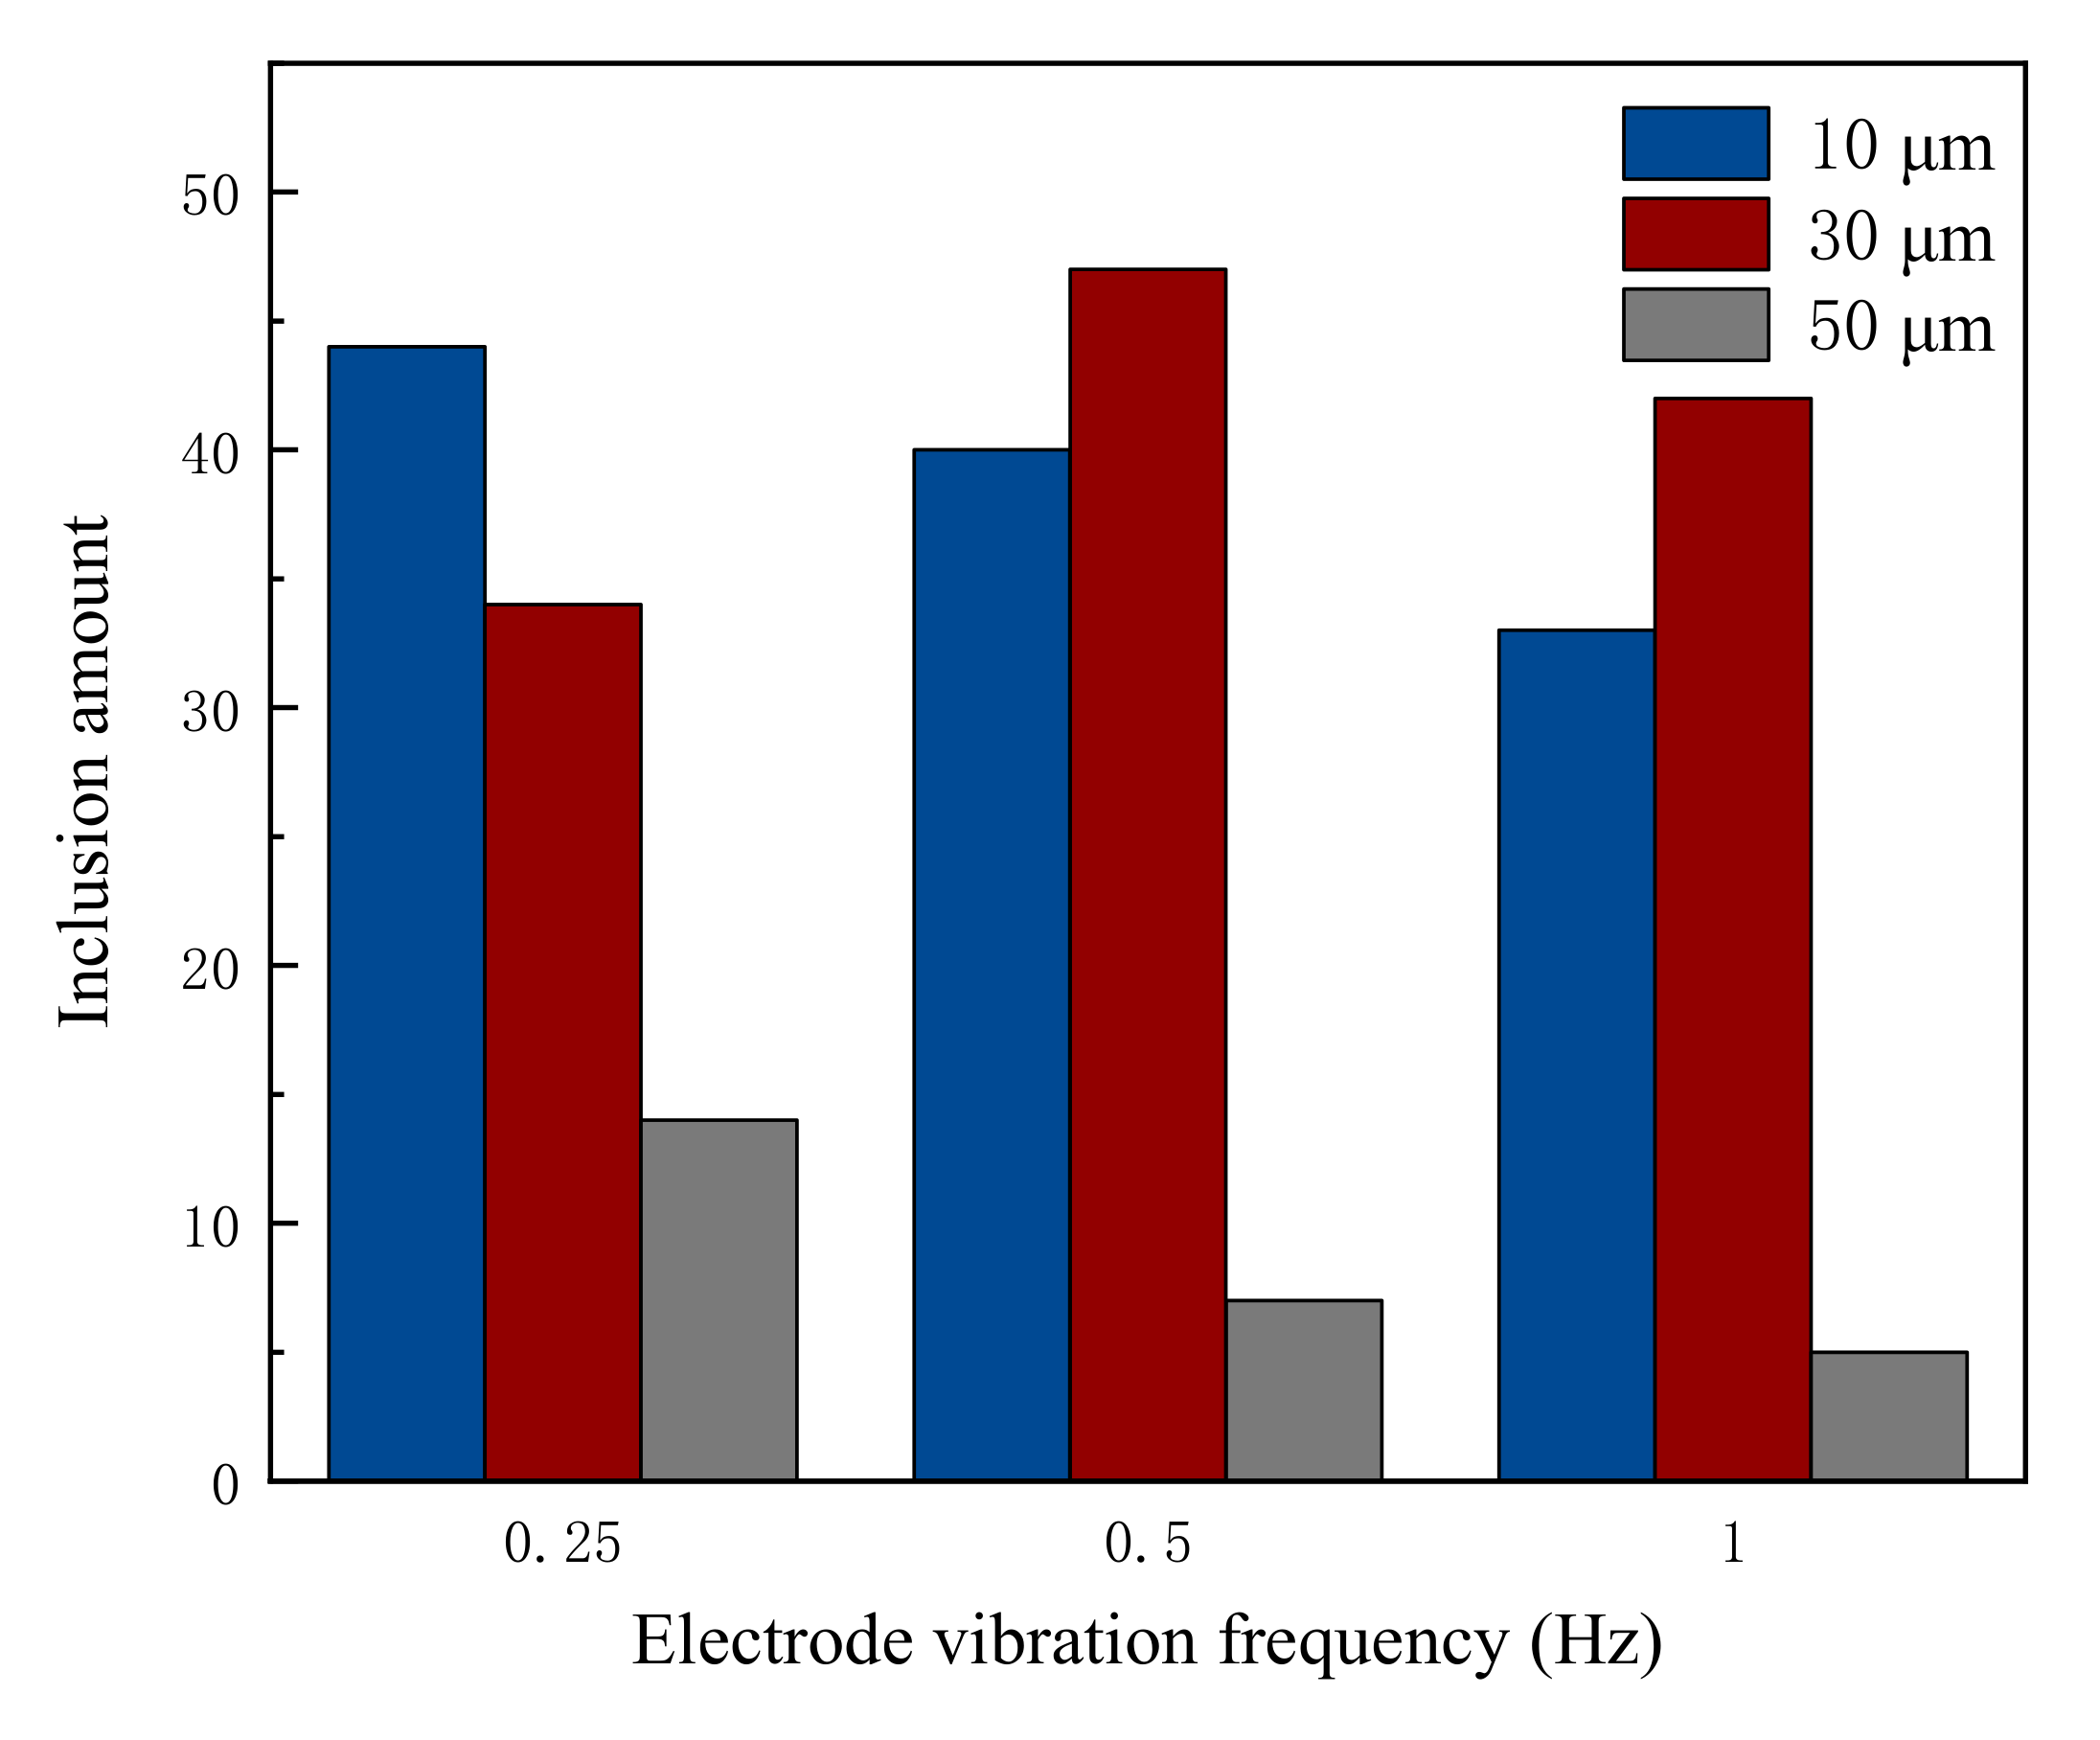
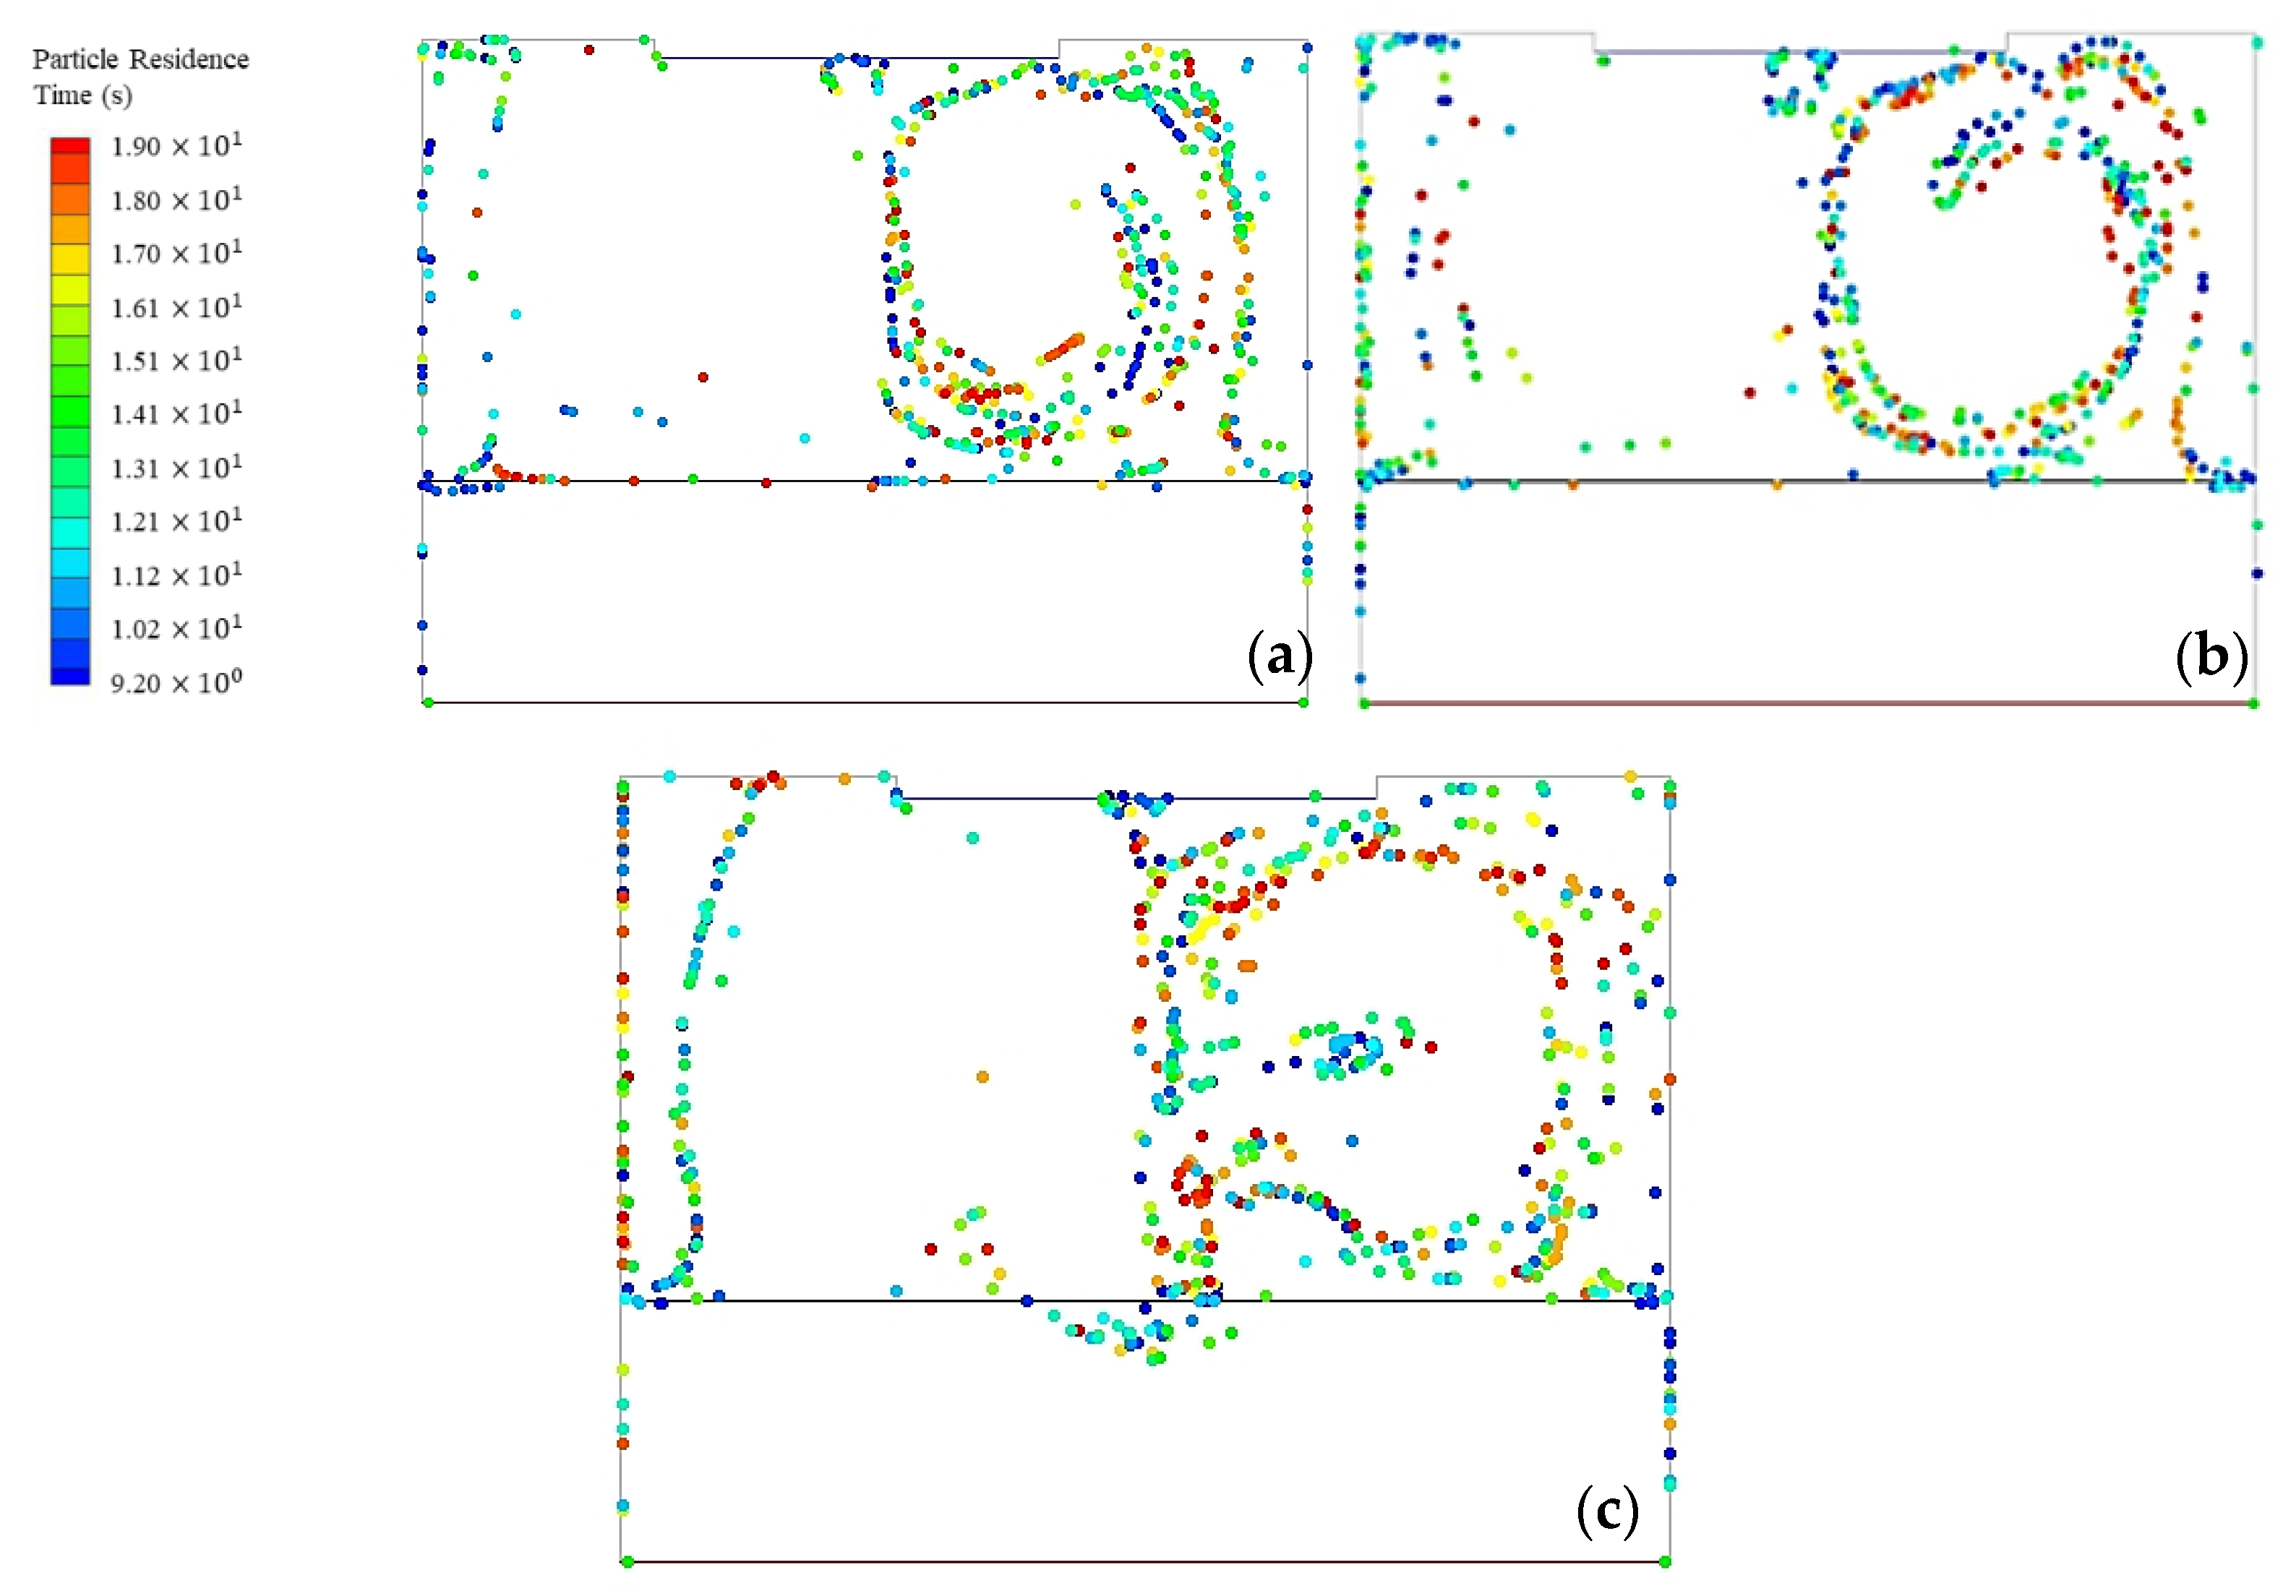
4.3. Effect of Electrode Vibration Frequency on Inclusions Motion Behavior

The electrode vibration frequencies of 0.25, 0.5, and 1 Hz are selected to study the effect of motion behavior of inclusions in the ESR process with a vibrating electrode. The distribution of inclusions in the slag layer with different electrode vibration frequencies in the ESR process is shown in Figure 7. When the electrode vibration frequency is 0.5 Hz, the inclusions distribution is uniform on both sides of the slag layer. When the electrode vibration frequency is 0.25 Hz, the majority of inclusions concentrate in the left-center vortex. When the electrode vibration frequency is 1 Hz, it is just the opposite; that is, the majority of inclusions concentrate in the right-center vortex of the slag layer. This is because the flow velocity changes with the electrode vibration frequency, which leads to the evolution of the drag force acting on the inclusions, ultimately affecting its distribution.
Electrode vibration frequency also affects the inclusions removal ratio, and statistical results are depicted in Figure 8. When the electrode vibration frequency is 0.5 Hz and 1 Hz, the 30 μm inclusions aggregate 1 mm away from the wall of the mold, and the removal ratio decreases. The removal ratio of 50 μm inclusions is significantly higher than that of 10 μm inclusions. The removal ratio of 10 μm and 50 μm inclusions increases 5% and 4.1%, respectively, when the electrode vibration frequency increases from 0.25 Hz to 1 Hz. That is, an appropriate increase in the electrode vibration frequency can improve the inclusions removal ratio. This is because under the action of the vibrating electrode, the volume of droplets becomes smaller [23,24]. As a result, the relative contact area becomes larger. The residence time of droplets in the slag layer becomes longer, and the slag/metal reaction proceeds more fully, thereby improving the removal ratio of inclusions. However, if the electrode vibration frequency is too high, it may cause intense fluctuation in the slag layer. More inclusions will be involved in the liquid-metal pool, which will affect the quality of the ingot.

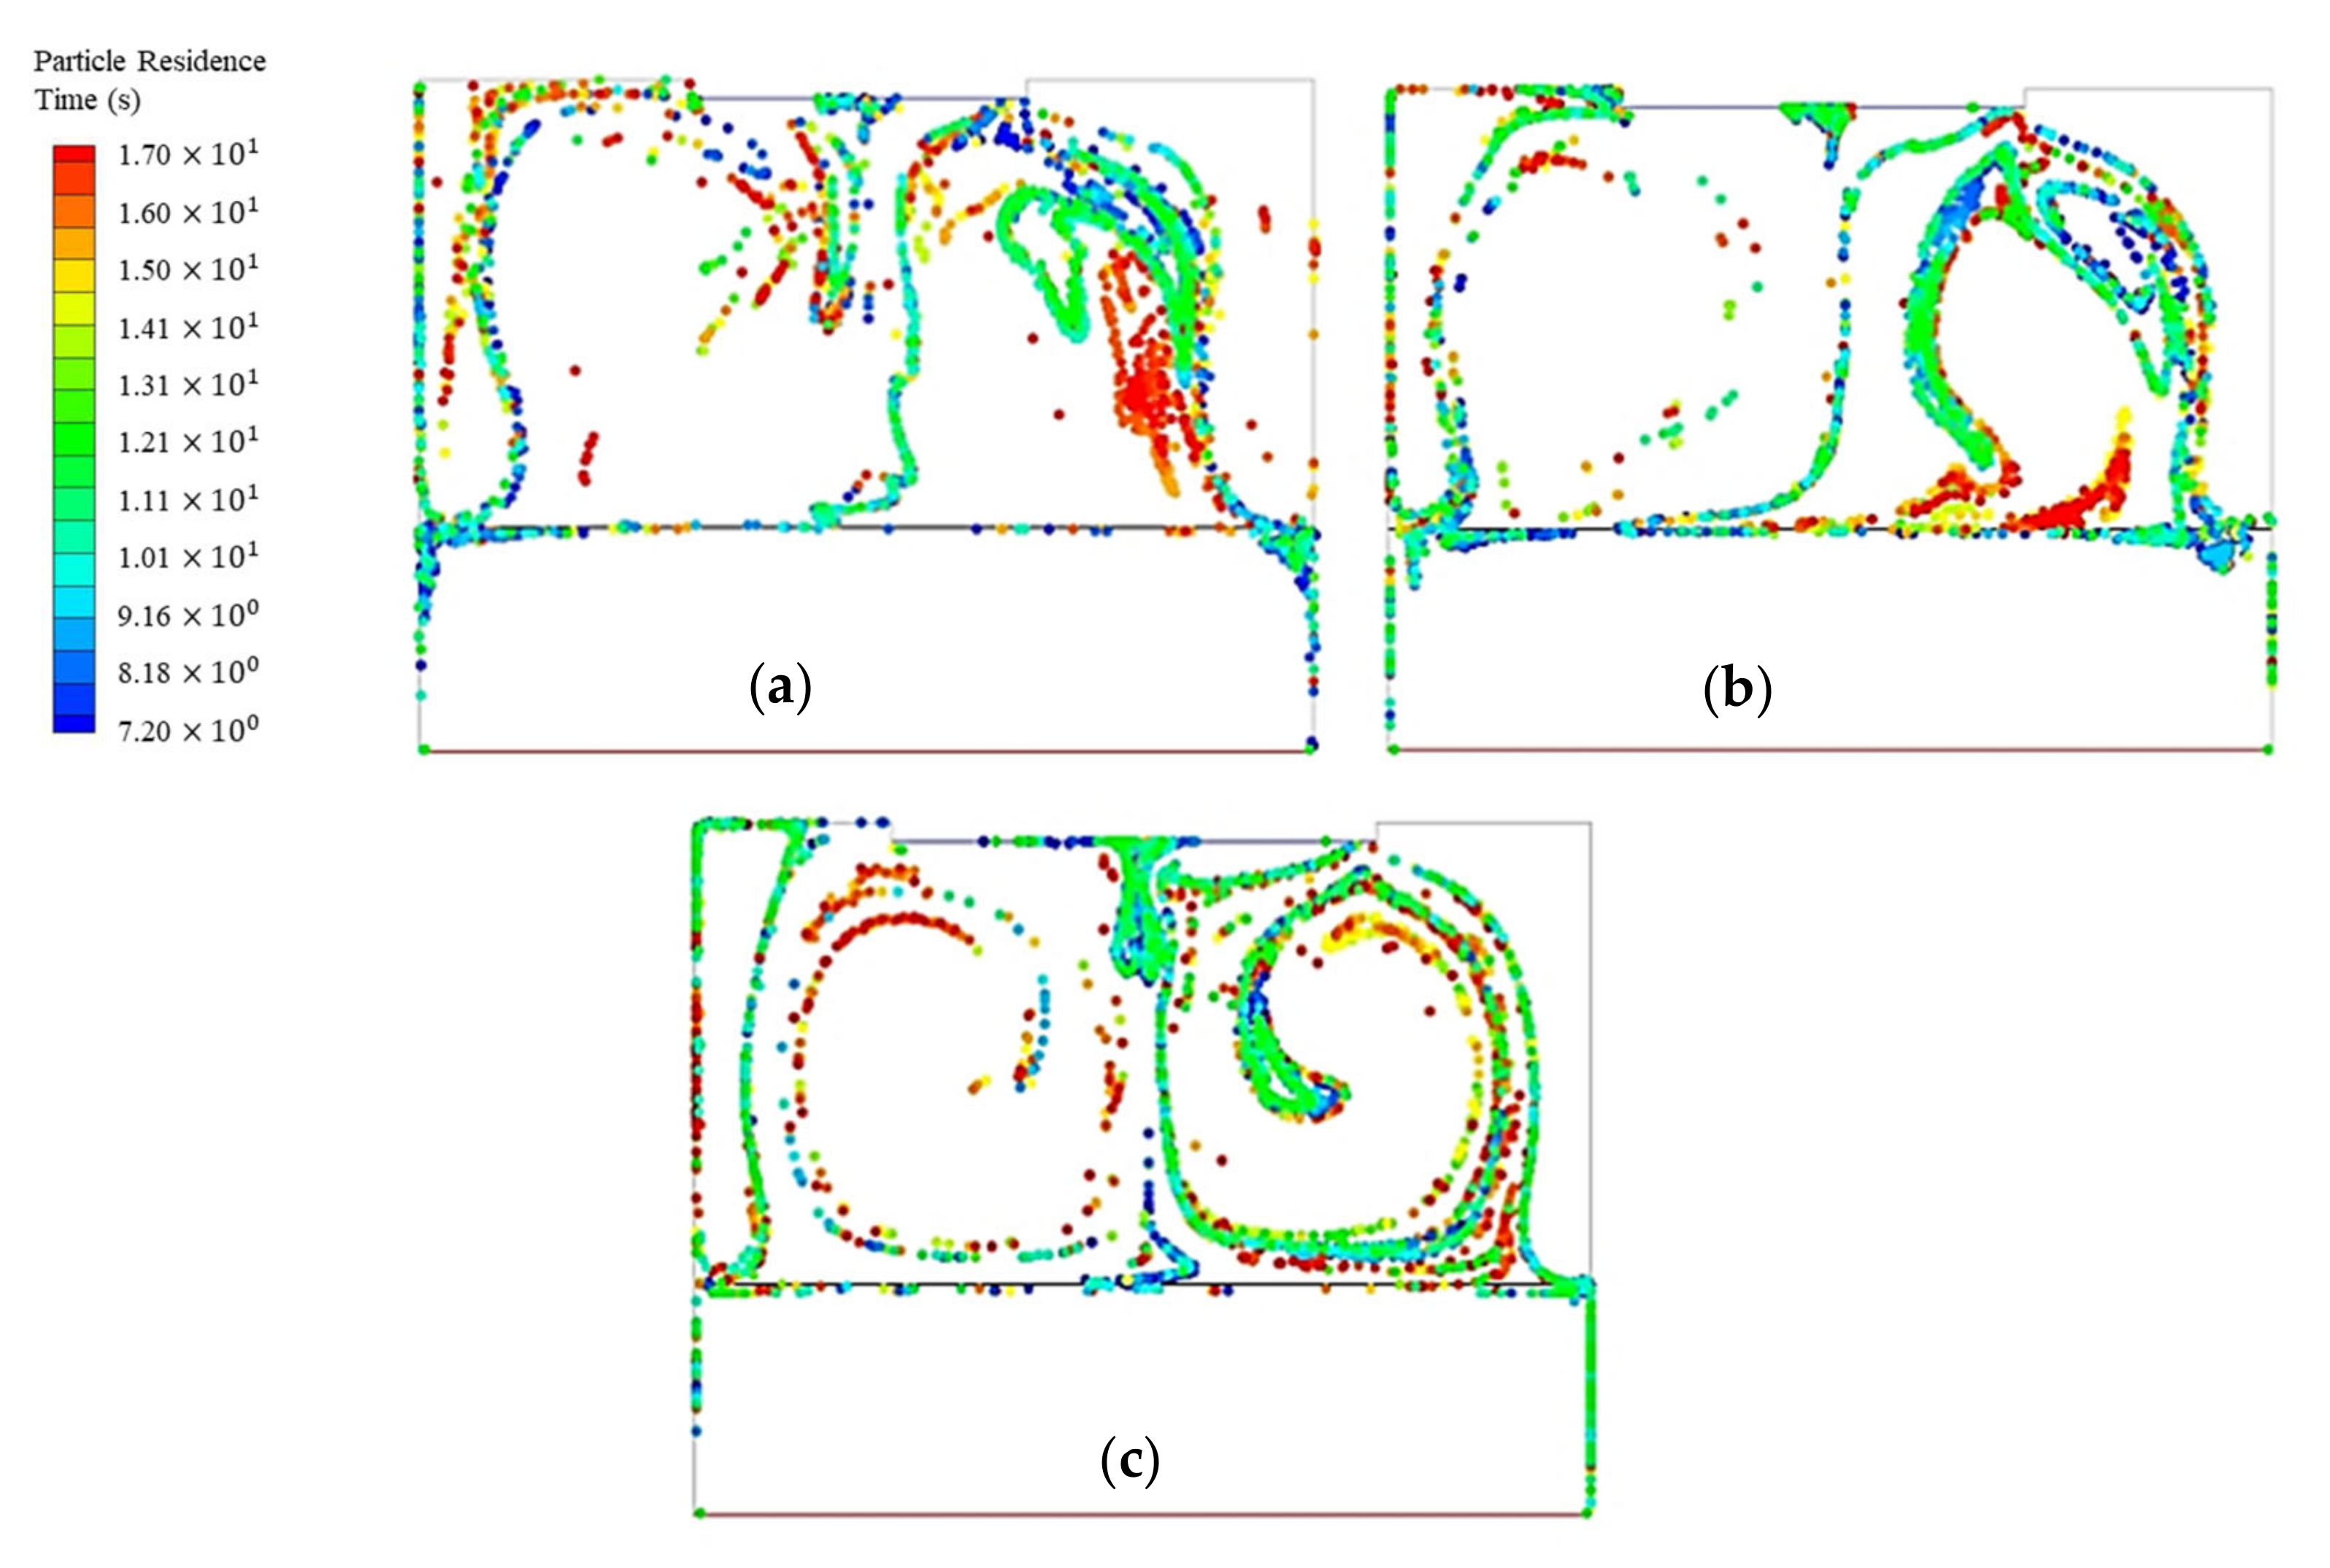
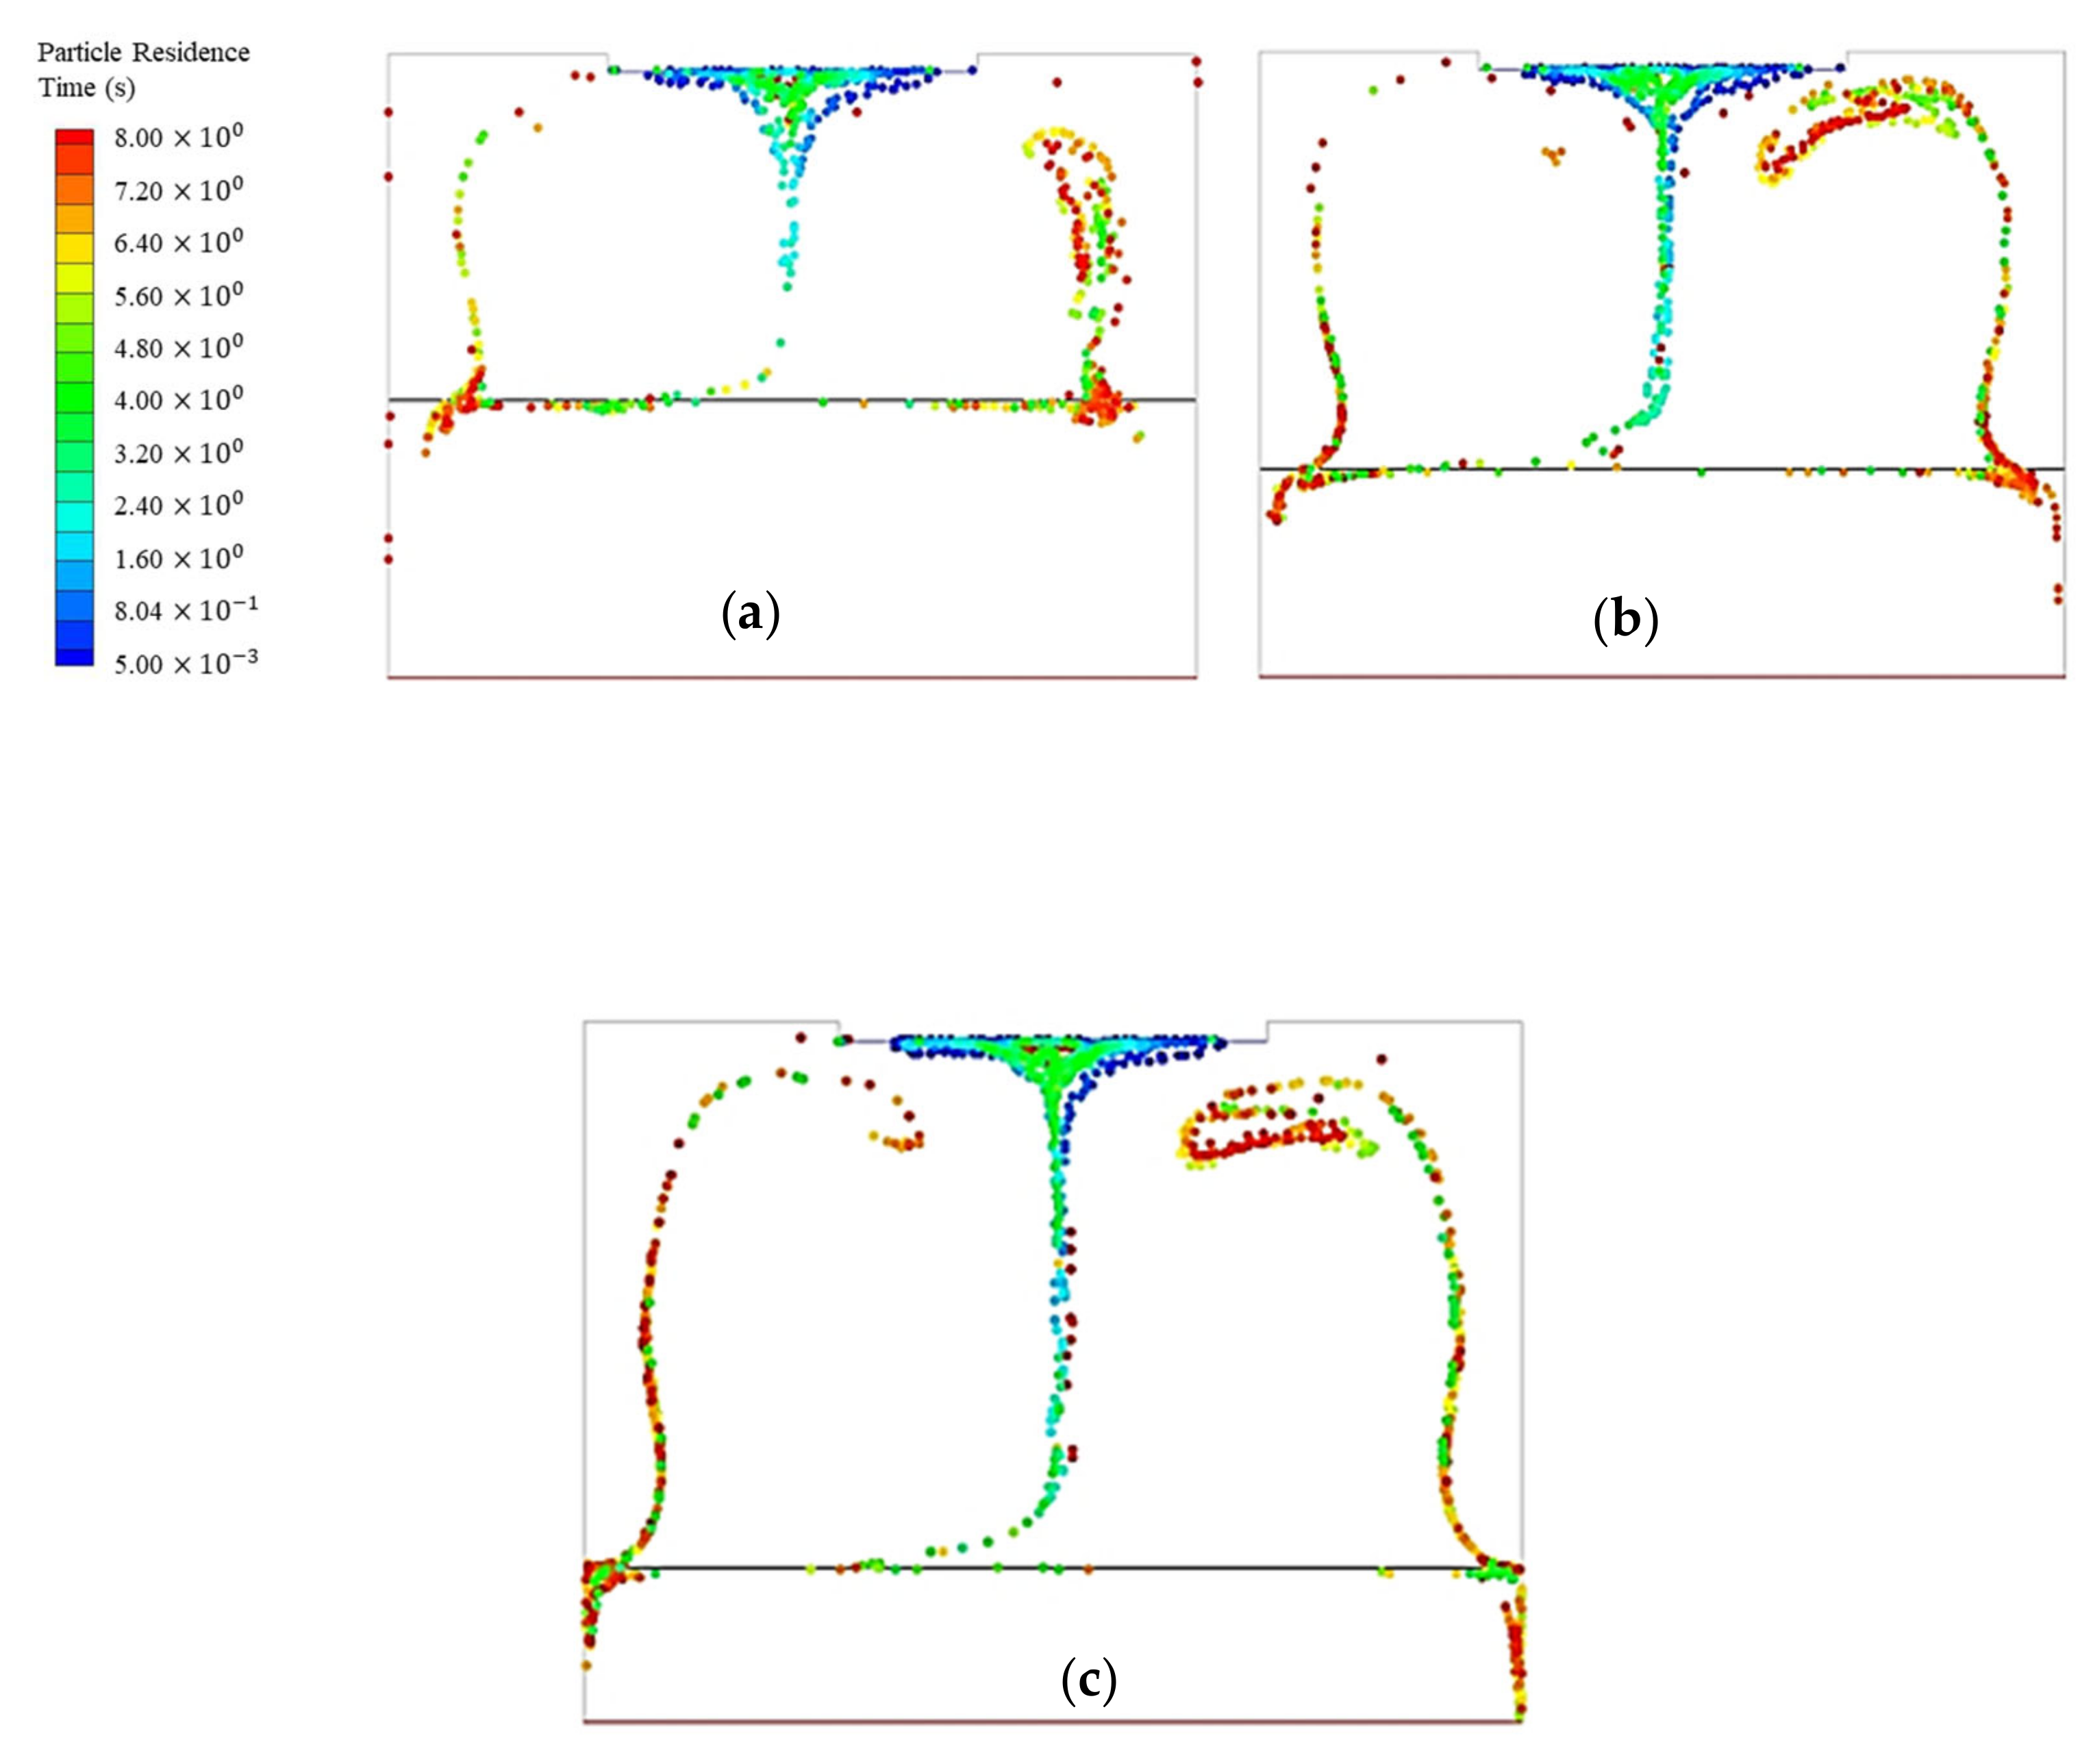
4.4. Effect of Current on Inclusion Motion Behavior

The distribution of inclusions with a the current of 1200, 1500, and 1800 A is shown in Figure 9. It is easily found that when the current increases to 1800 A, inclusion distribution in the slag layer becomes chaotic. When the current is 1200 A or 1500 A, inclusion distribution conforms to the flow field in the slag layer. This is because when the current increases, the melt rate of the electrode rises. Hence, the vortex in the slag layer becomes stronger.
Figure 10 depicts the inclusion removal ratio with different currents. MnO with a diameter of 10 μm is selected to study the inclusion removal ratio. The maximum removal ratio is 92%, with a current of 1500 A. The removal ratio is 90.91% and 86.36% with currents of 1200 A and 1800 A, respectively. It can be seen that an appropriate increase in current is conducive to inclusions removal. When the current increases, flow in the center of the slag layer enhances, and the slag/metal interface renewal becomes faster. Thus, the absorption rate of inclusions can be improved. In addition, an increase in current leads to a decrease in inclusions size, ultimately improving the removal ratio of inclusions. However, if the current is too fast, the slag/metal interface disturbance becomes severe, which is not conducive to the floating of inclusions.

4.5. Effect of Slag-Layer Thickness on Inclusion Motion Behavior

The inclusions distribution with different thicknesses of slag layer is depicted in Figure 11. When the thickness of the slag layer is 50 mm, the inclusions within the slag/metal interface are mainly influenced by the vortex in the center of the slag layer, and they enter the liquid-metal pool at a certain angle. As the thickness of the slag layer increases, more inclusions is influenced by the falling flow near the mold wall and enters the liquid-metal pool along the left and right sides of the mold wall. This is because streamline distribution changes with the thickness of the slag layer [21,25], which influences the inclusions motion. The flow following property of inclusions is good with the three different thicknesses of the slag layer. When the slag layer thickness is 50 mm, due to the larger range of the vortex near the mold wall, the number of inclusions adsorbed in the vortex near the mold wall is significantly more than that with the slag-layer thickness of 60 mm or 70 mm.
The removal ratio of inclusions is 82.73%, 84.55%, and 85.91%, with a the slag-layer thickness of 50, 60, and 70 mm, respectively, as shown in Figure 12. It can be seen that an appropriate increase in the slag layer thickness is beneficial to the removal of inclusions in the ESR process. The following reason can illustrate this fact: the increasing thickness of the slag layer certainly prolongs the inclusions residence time in the slag layer, and then the slag/metal reaction carries out more fully, and the inclusion removal ratio becomes higher.

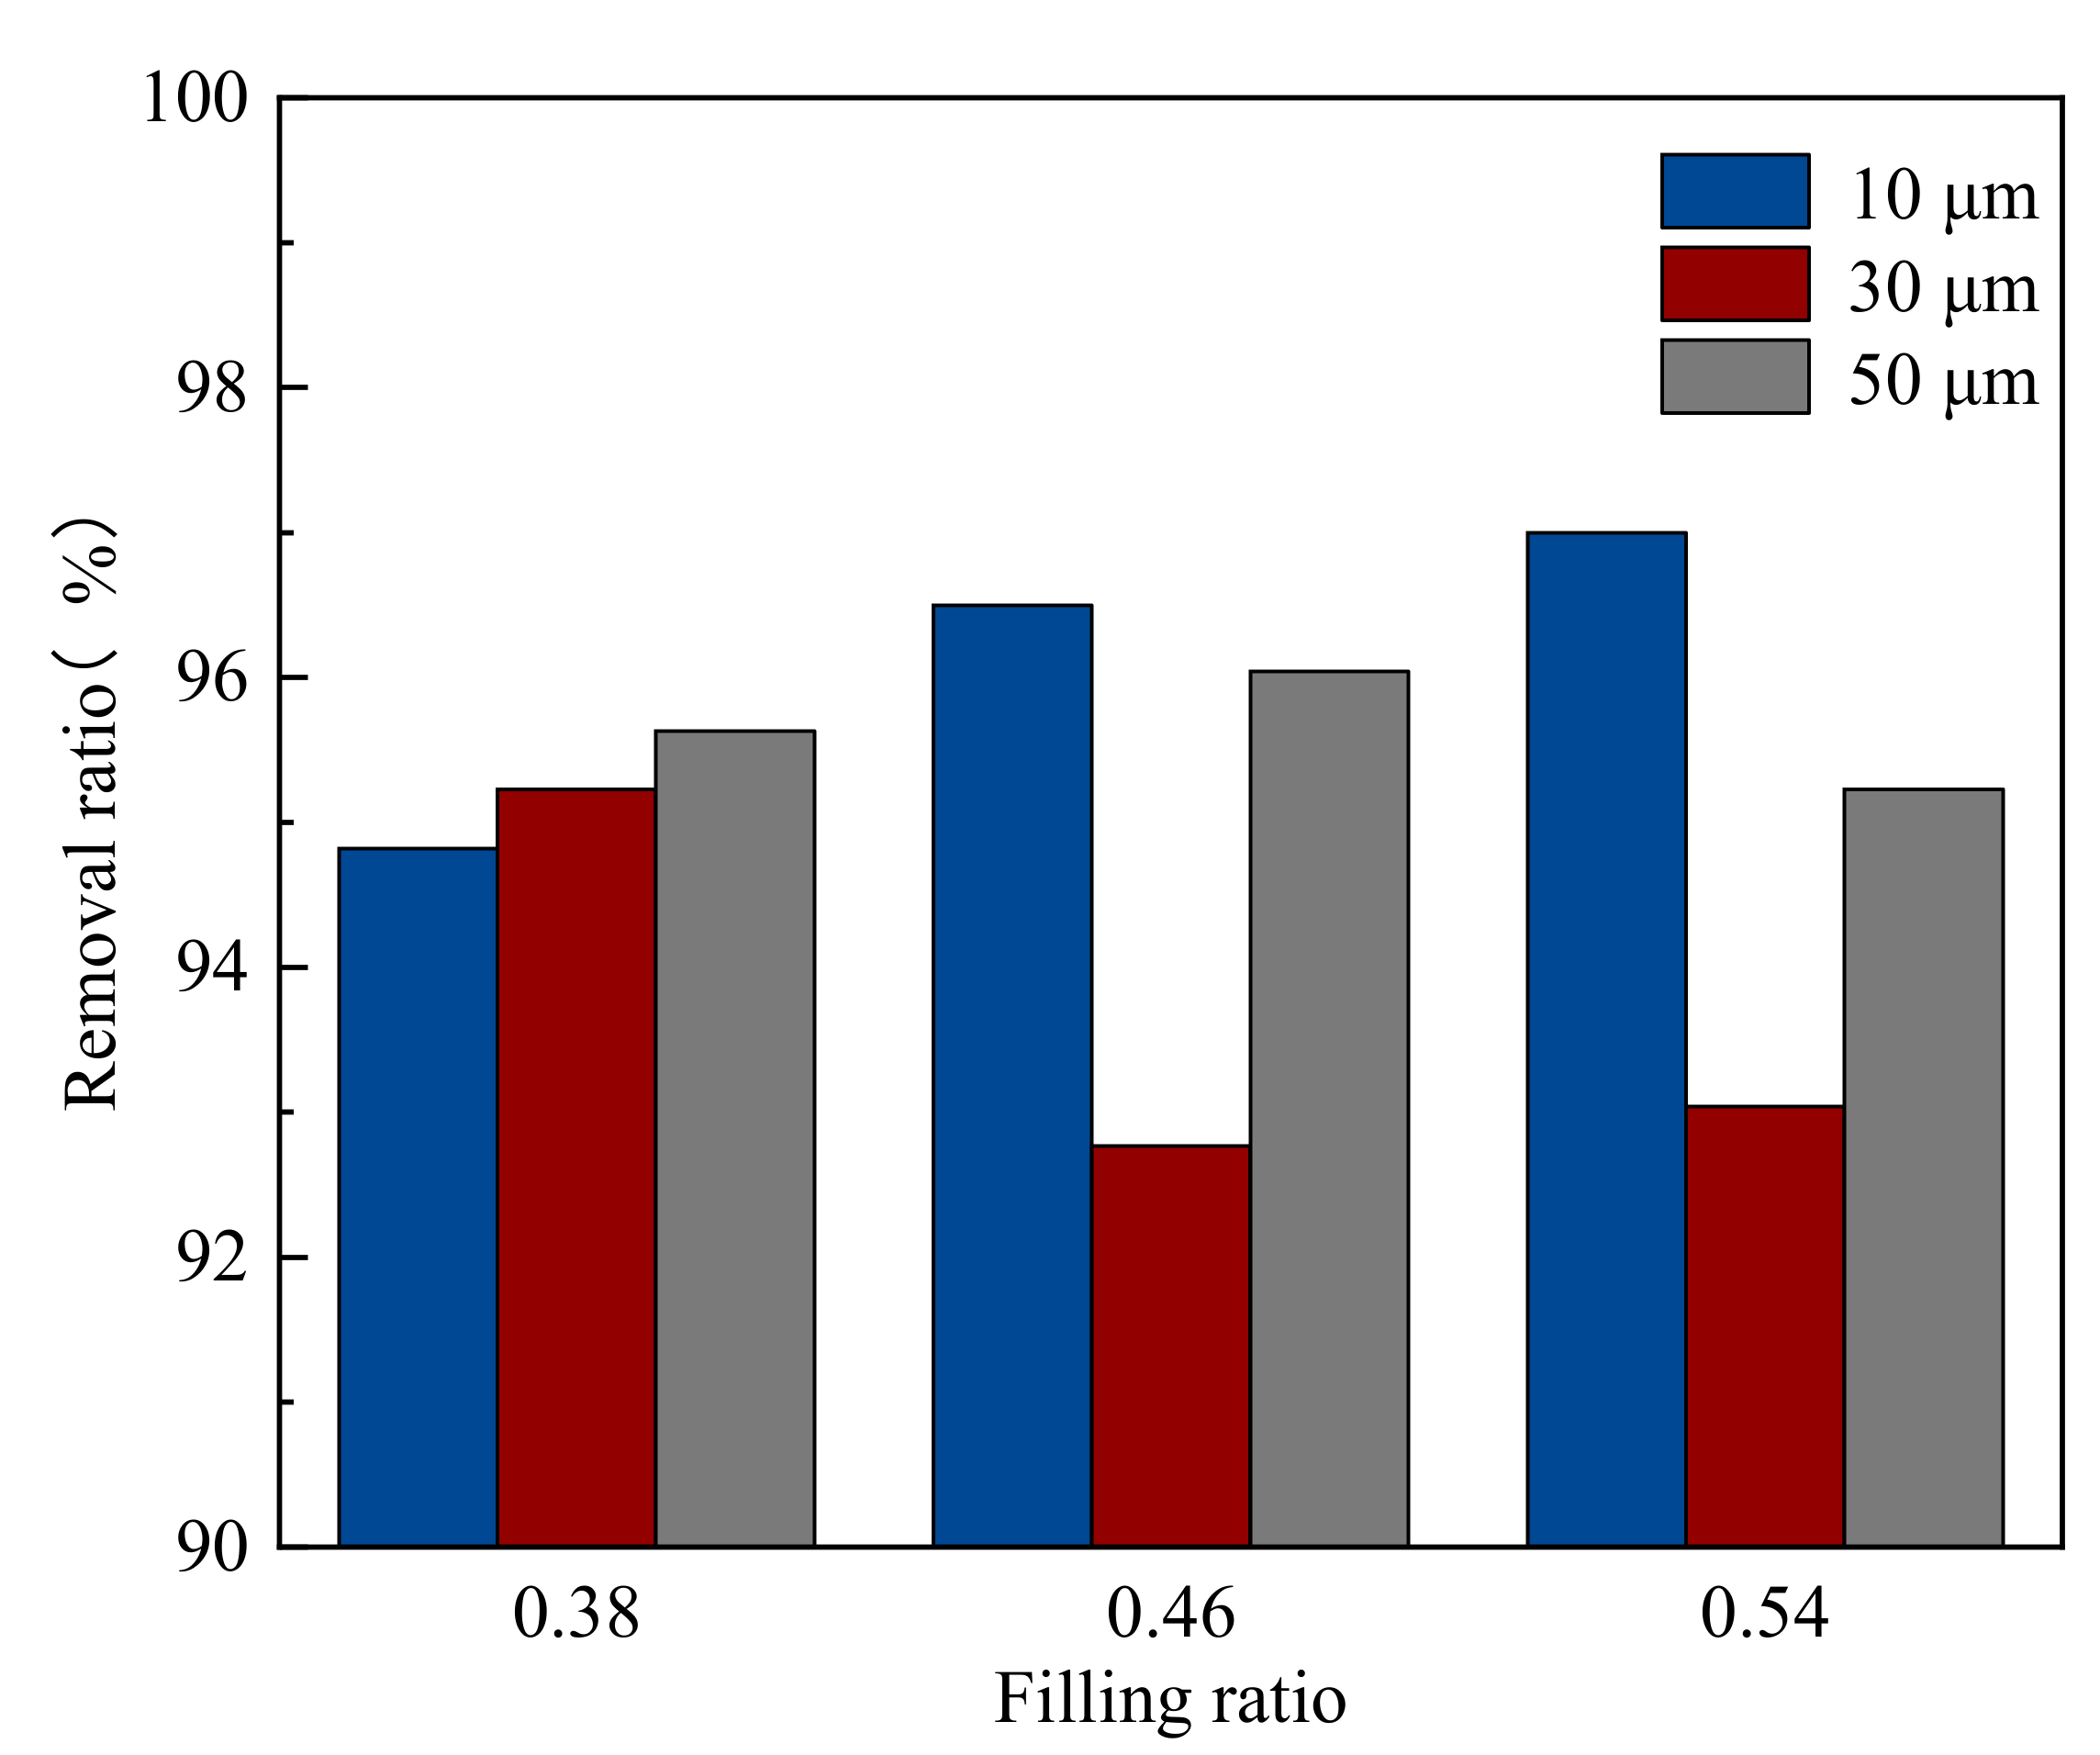
4.6. Effect of Filling Ratio on Inclusion Motion Behavior

When the electrode filling ratio changes, the inclusion distribution in the slag layer and liquid-metal pool shows a large difference in the ESR process, as shown in Figure 13. The electrode filling ratio refers to the ratio of electrode diameter to mold width. When the filling ratio is 0.54, the flow-following property of the inclusions in the slag layer is better. However, when the filling ratio is 0.38 or 0.46, the inclusions in the slag layer mainly gather in a position with dense streamlines, the area with the higher flow velocity. It can be seen from the figures that when the filling ratio is 0.54, there is still a lot of inclusions accumulated at the center of electrode inlet, while the number of inclusions at the center of the electrode inlet is obviously reduced when the filling ratio is 0.38 or 0.46. This is because when the filling ratio increases, the convergence time of the metal/liquid film also increases, thus making the time required for the descent of inclusions increases.
During the ESR process with different filling ratio, the removal ratio of inclusions was counted separately in Figure 14. For the 50 μm inclusions, the removal ratio reaches more than 95% for three different filling ratio. When the filling ratio is 0.46, the inclusions removal ratio is the highest. For the 30 μm inclusions, they accumulated at the bottom of the liquid-metal pool when the filling ratio is 0.46, resulting in a significant decrease in the inclusions removal ratio, but the removal ratio is higher when the filling ratio is 0.54 than when itis 0.46. For the 10 μm inclusions, the removal ratio reaches the maximum value, 97%, with a filling ratio of 0.54.

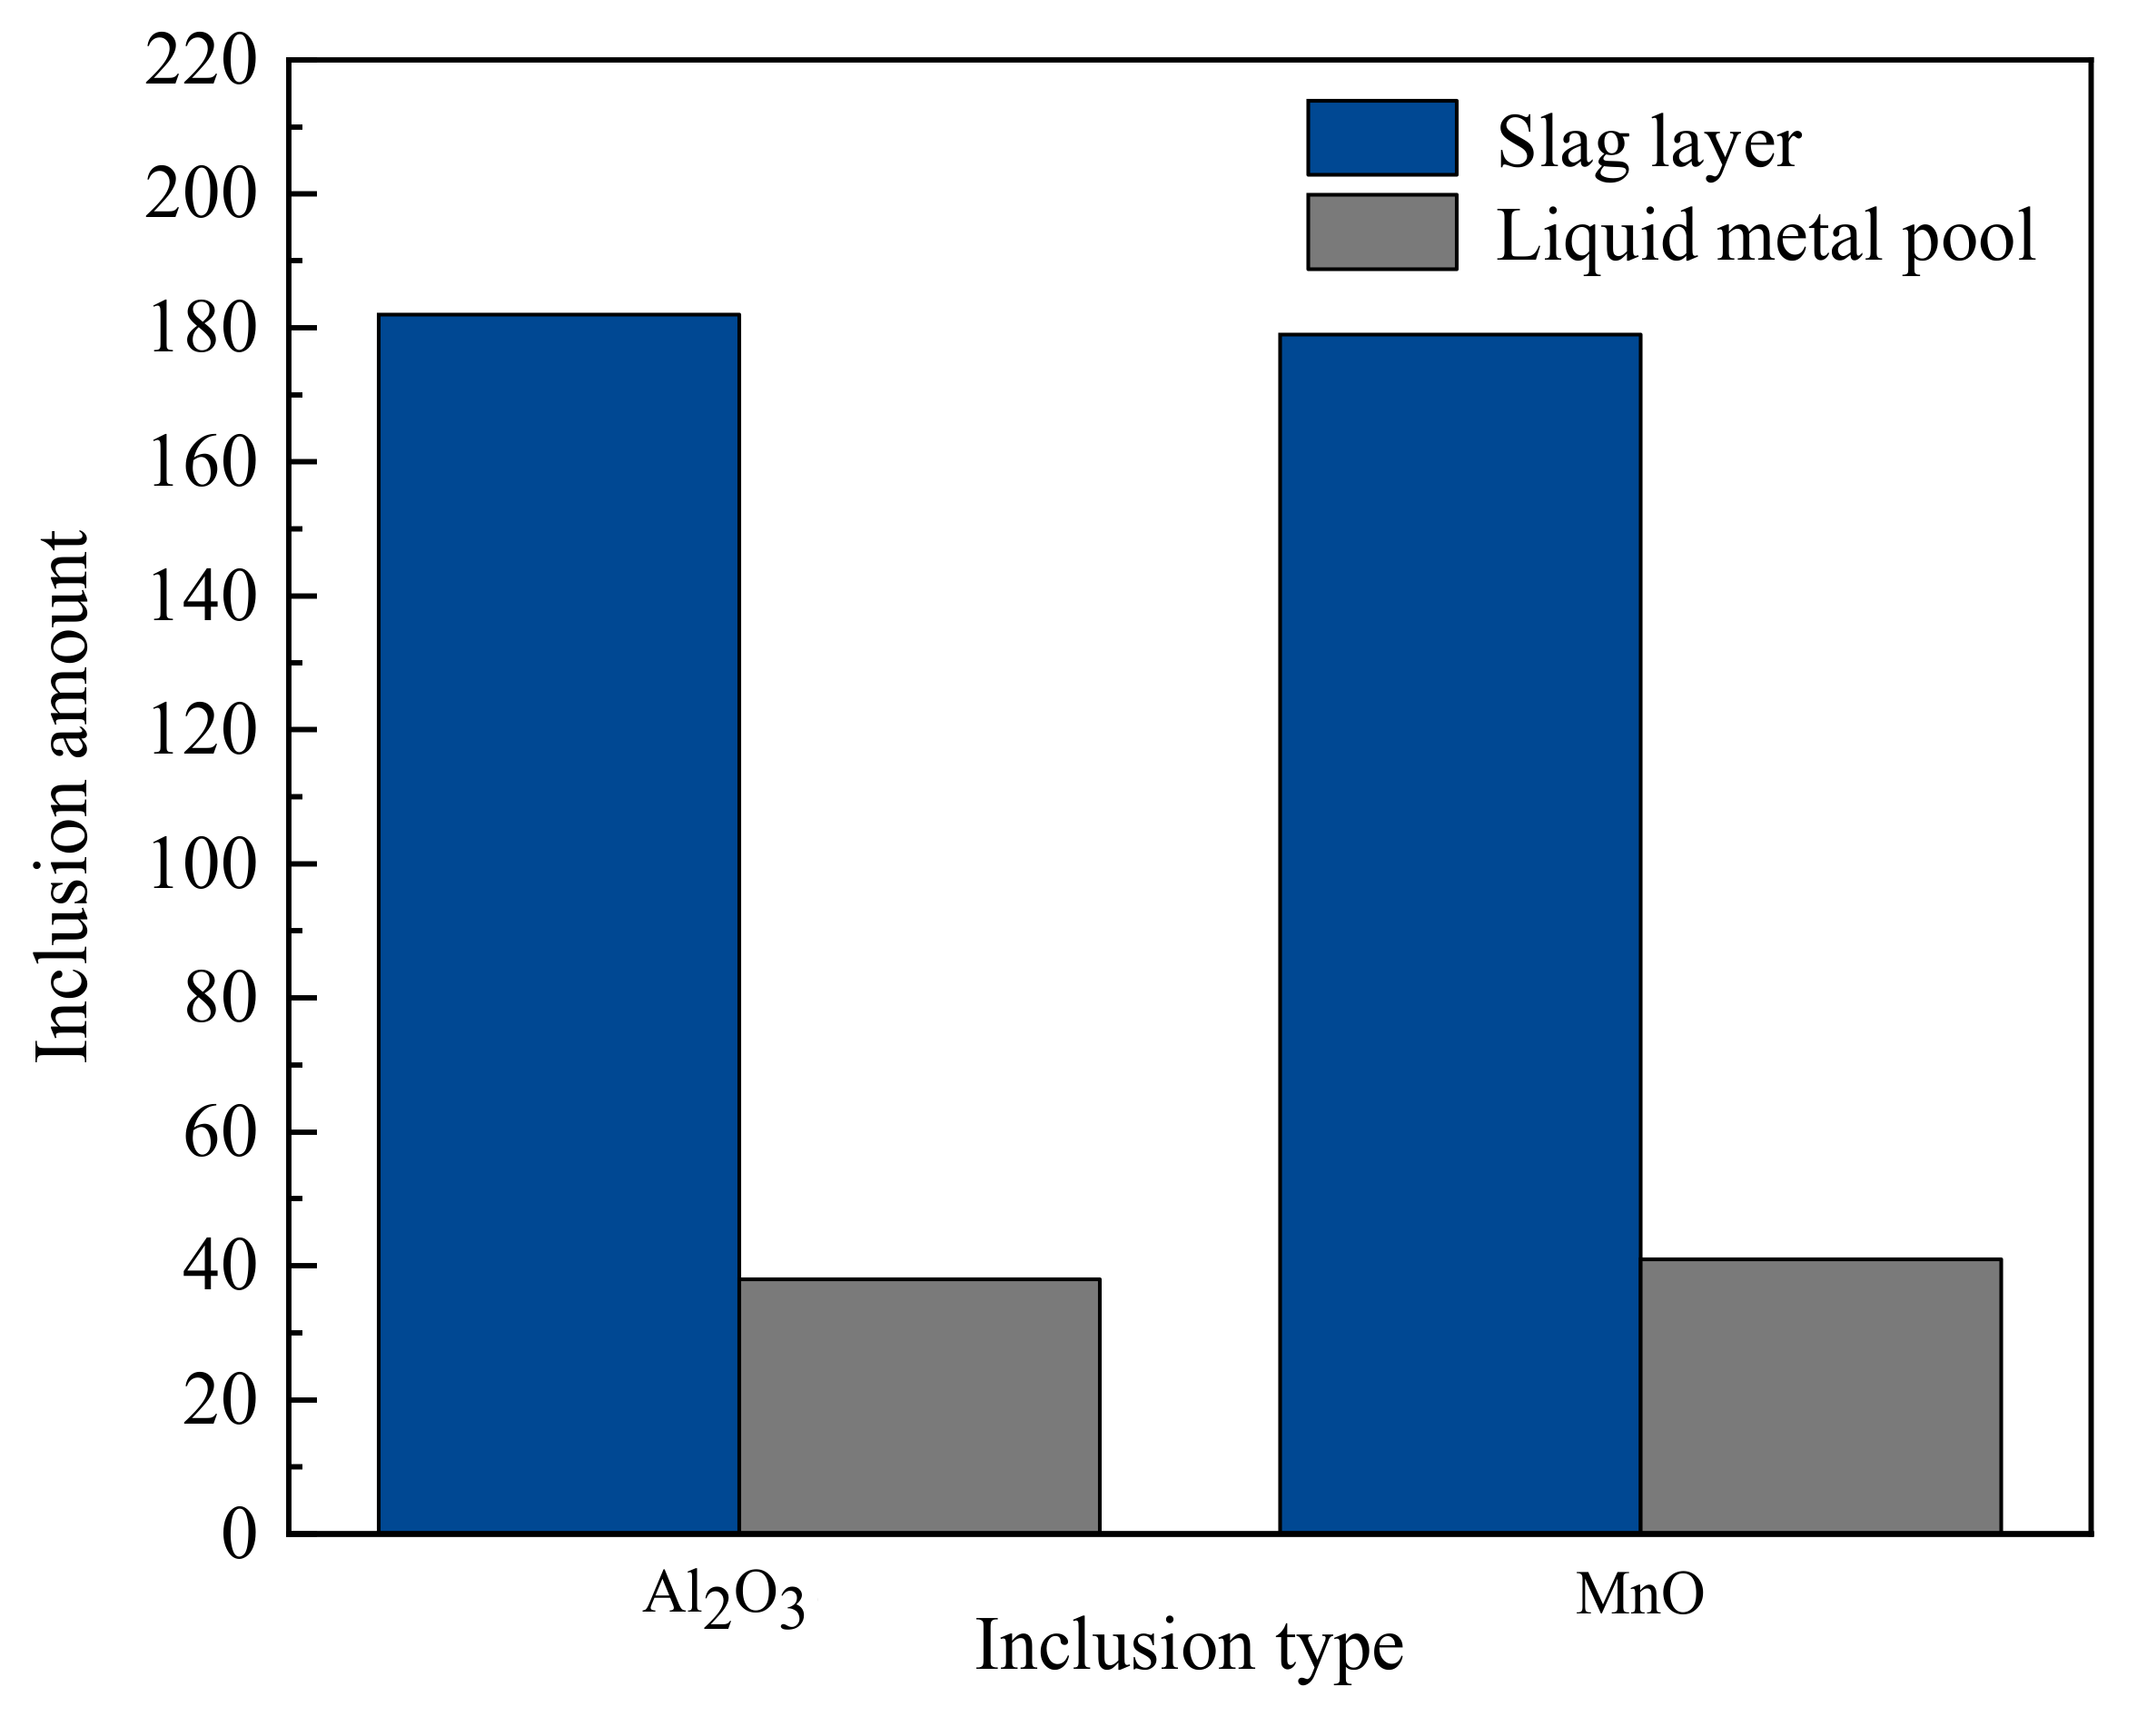
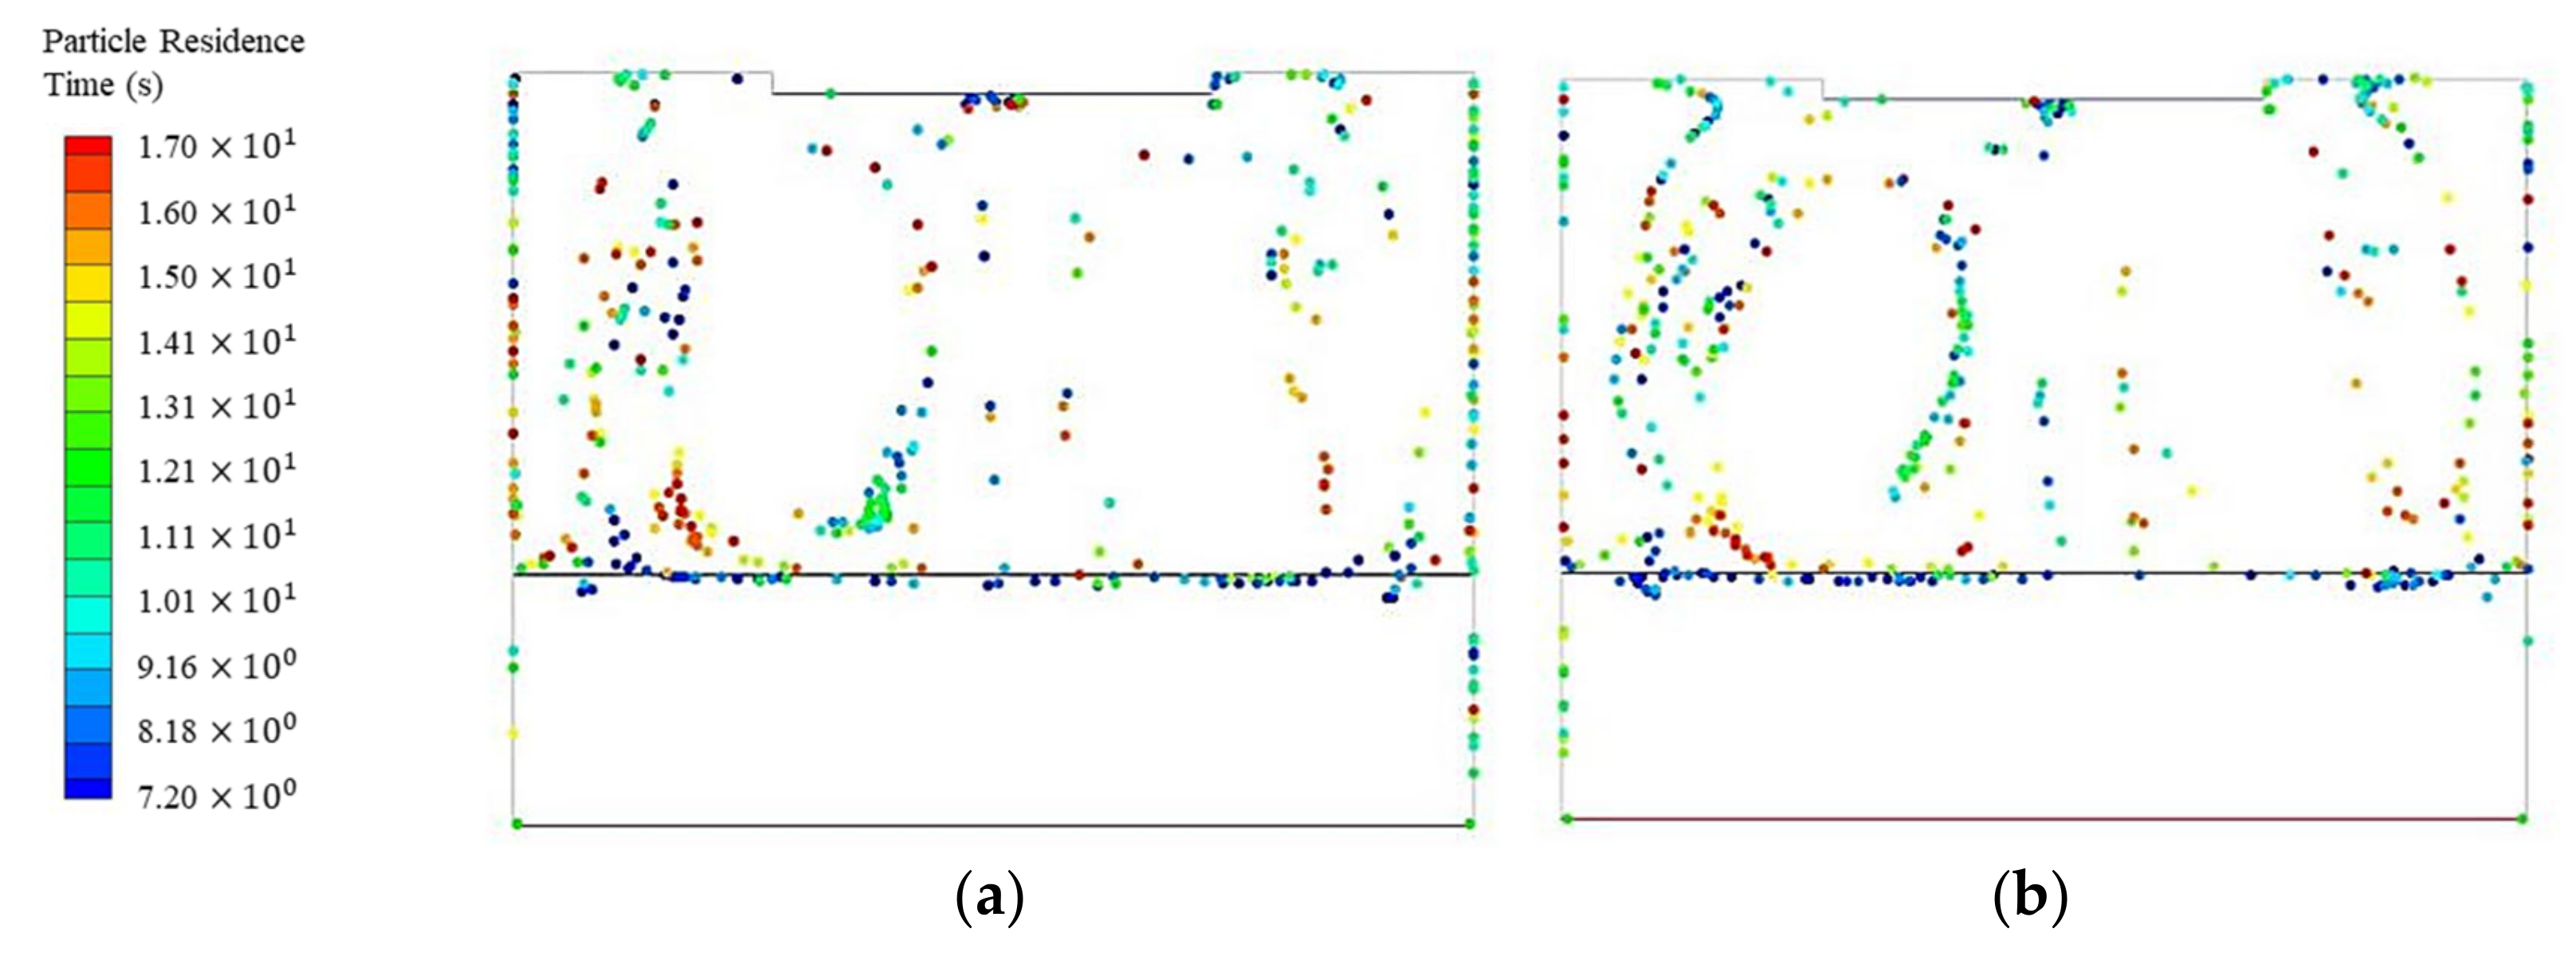
4.7. Effect of Type and Diameter of Inclusion on Its Motion Behavior

The inclusions of MnO and Al 2 O 3 are selected to study the influence of the type and diameter on inclusion motion behavior in the ESR process. Figure 15 shows the 50 μm inclusions distribution with different types. It can be seen from the figure that as time goes by, the majority of Al 2 O 3 inclusions congregate at the electrode entrance and the top of the slag layer, while MnO inclusions evenly distribute throughout the slag layer. In addition, the distribution of inclusions in the slag layer shows that there are more MnO than Al 2 O 3 in the vortex near the mold wall, and the number of MnO inclusions on both sides of the center vortex is similar, while for Al 2 O 3 , the number of inclusions on the left side of the center vortex is significantly more than that on the right side. This is because the density of Al 2 O 3 is lower than that of MnO , and its movement and distribution are mainly affected by buoyancy force. There’s no significant difference in the distribution of MnO and Al 2 O 3 inclusions with a diameter of 10 μm, as shown in Figure 16.
The removal rate of MnO is significantly lower than that of Al 2 O 3 with an inclusion diameter of 50μm in the ESR process. This is mainly due to the difference in density. According to the buoyancy calculation formula, it can be seen that inclusions with higher density suffer less buoyancy, so MnO is more likely to remain in a liquid-metal pool, resulting in a similar removal ratio to that of Al 2 O 3 . The distribution of MnO and Al 2 O 3 inclusions with a diameter of 10μm is shown in Figure 17. The removal ratio is 81.33% and 82.81%, respectively. This is because affected by a vibrating electrode, a number of Al 2 O 3 inclusions gather under the slag/metal interface, which makes it difficult to float up to be removed.

5. Discussion

The removal ratios of inclusions are the important indicator of the ESR process, and they influence the quality of final ingot. In this paper, the multi-physical fields were simulated with a vibrating electrode and conventional electrode during the ESR process, based on a lab-scale transient coupled model. Due to the motion of the vibrating electrode, fluid flow, and temperature, as well as the motion of metal droplets, are significantly different from those of the traditional electrode, as described in Refs. [2,24]. The vibrating electrode ESR process would change and enhance the heat-transfer performance between electrode and slag, leading to an increase in the melting rating and temperature distribution in slag layer. The predicted temperature in slag layer is compared with the experimentally measured one (Figure 3) in a conventional ESR process. A fairly good agreement with the experiment results.
Compared with the conventional electrode, the temperature distribution in the liquid-metal pool is more uniform with a vibrating electrode, and the average temperature is significantly higher than that with a conventional electrode at the same time. Moreover, in the ESR process with a vibrating electrode, the streamline in the slag layer and the liquid-metal pool are nearly symmetrically distributed, and there is a clear demarcation at the slag/metal interface. Through parameter studies, it was found that the maximum removal ratio of inclusions in our work is 97% when the filling ratio is equal to 0.54. That means that the variation of the diameter of electrodes dramatically impacts the slag layer temperature, as described in Ref. [21]. They conclude that when the fill ratio increases from 0.45 to 0.64, the high-temperature zone becomes larger and the temperature in the center of the slag layer becomes lower. Meanwhile, as both the highest temperature and time-average temperature rises, the maximum metal-bath depth reduces from 0.099 to 0.087 m. The effect of current is in the second place, and its removal ratio of inclusions is around 92%. Both the vibrating frequency and slag thickness will influence the removal ratio of inclusions, but not change it much.
Some inclusions are able to flow through the interface of a droplet when they are close to the interface, and other inclusions are rebounded to the core of the droplet. The majority of inclusions can be removed during the formation process of liquid film and metal droplets. Moreover, inclusions more than 15μm in diameter are basically removed by adsorption of the molten slag [18]. This also points out that the ESR process is able to efficientlyremove inclusions with a diameter larger than 10 µm. Hence, the dimension of inclusions used in this work is larger than 10 µm.
Only the motion behavior, distribution pattern, and removal ratio of inclusions have been considered and analyzed in this paper since we have not found a proper numerical simulation module to describe the chemical reaction and the dissolution of inclusions. Furthermore, the model established in this work is coupled with electromagnetism, two-phase flow, heat transfer and inclusions movement. The cost and time of computation are large and difficult if more numerical modules are added. Here, we want to emphasize that this work is based on a small laboratory ESR model. It will not have the same chemical or thermal conditions as in an industrial furnace. Further study is needed with a large -scale ESR furnace with a vibrating electrode implemented.

6. Conclusions

In this study, a transient 2D laboratory-scale model is established using FLUENT. The vibrating electrode is simulated with the help of UDF and dynamic mesh. The DPM method, which is based on the Euler-Lagrange method, is used to track the trajectory of inclusions. Firstly, the fluid flow, temperature field and formation of metal droplets in the ESR process with a vibrating electrode are analyzed. Then, the motion behavior, distribution pattern, and removal ratio of inclusions in the slag layer and liquid-metal pool are discussed, especially under the effect of electrode vibration frequency, current, slag-layer thickness, electrode filling ratio, and inclusions type and diameter. The main conclusions are as follows:
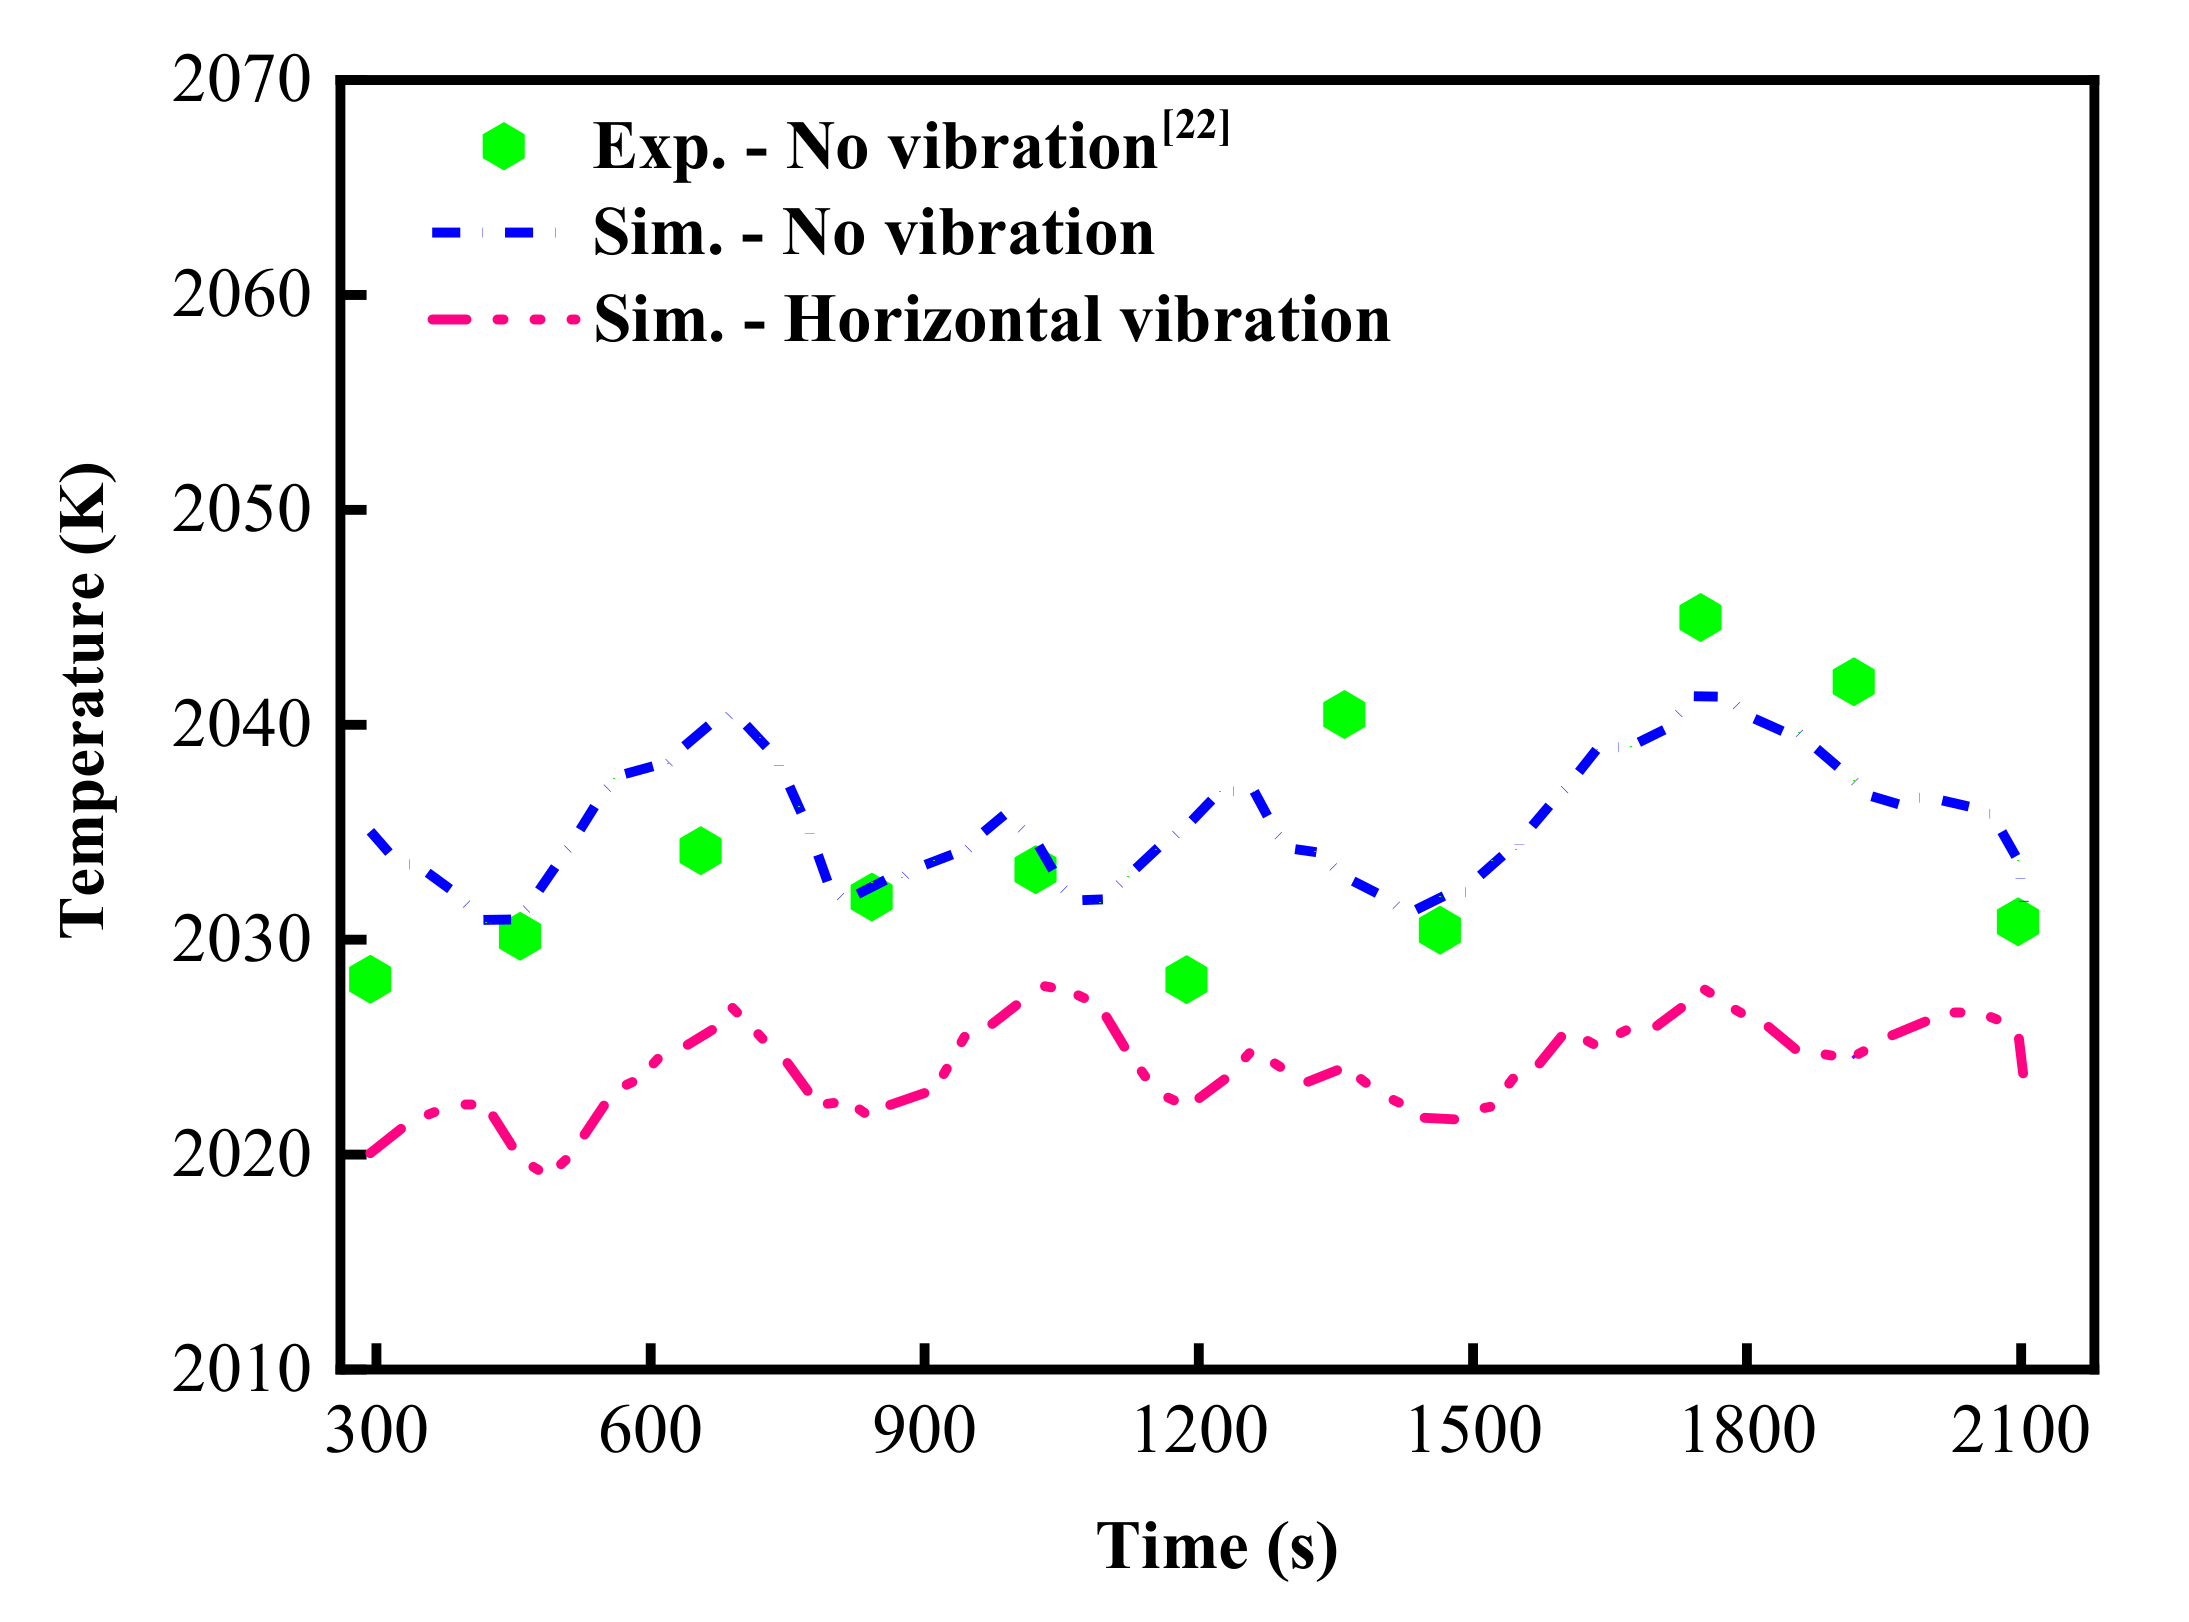
  • Compared with a conventional electrode, the temperature distribution in the liquid-metal pool is more uniform, and the average temperature is significantly higher than that with a conventional electrode at the same time. Besides, the streamlines in the slag layer and liquid-metal pool are symmetrical, showing a clear demarcation at the slag/metal interface with a vibrating electrode.
  • Distribution of streamlines in the slag layer and liquid-metal pool is chaotic in the ESR process with conventional electrode. However, in the ESR process with a vibrating electrode, the streamlines in the slag layer and the liquid-metal pool are symmetrically distributed, and there is a clear demarcation at the slag/metal interface.
  • When the electrode vibration frequency is 0.25 Hz or 1 Hz, inclusions will gather on one side of the slag layer. When the electrode vibration frequency increases from 0.25 Hz to 1 Hz, the removal ratio of 10 μm and 50 μm inclusions increases by 5% and 4.1%, respectively. When the electrode vibration frequency is 0.5 Hz, inclusions are distributed uniformly on both sides of the slag layer in the ESR process.
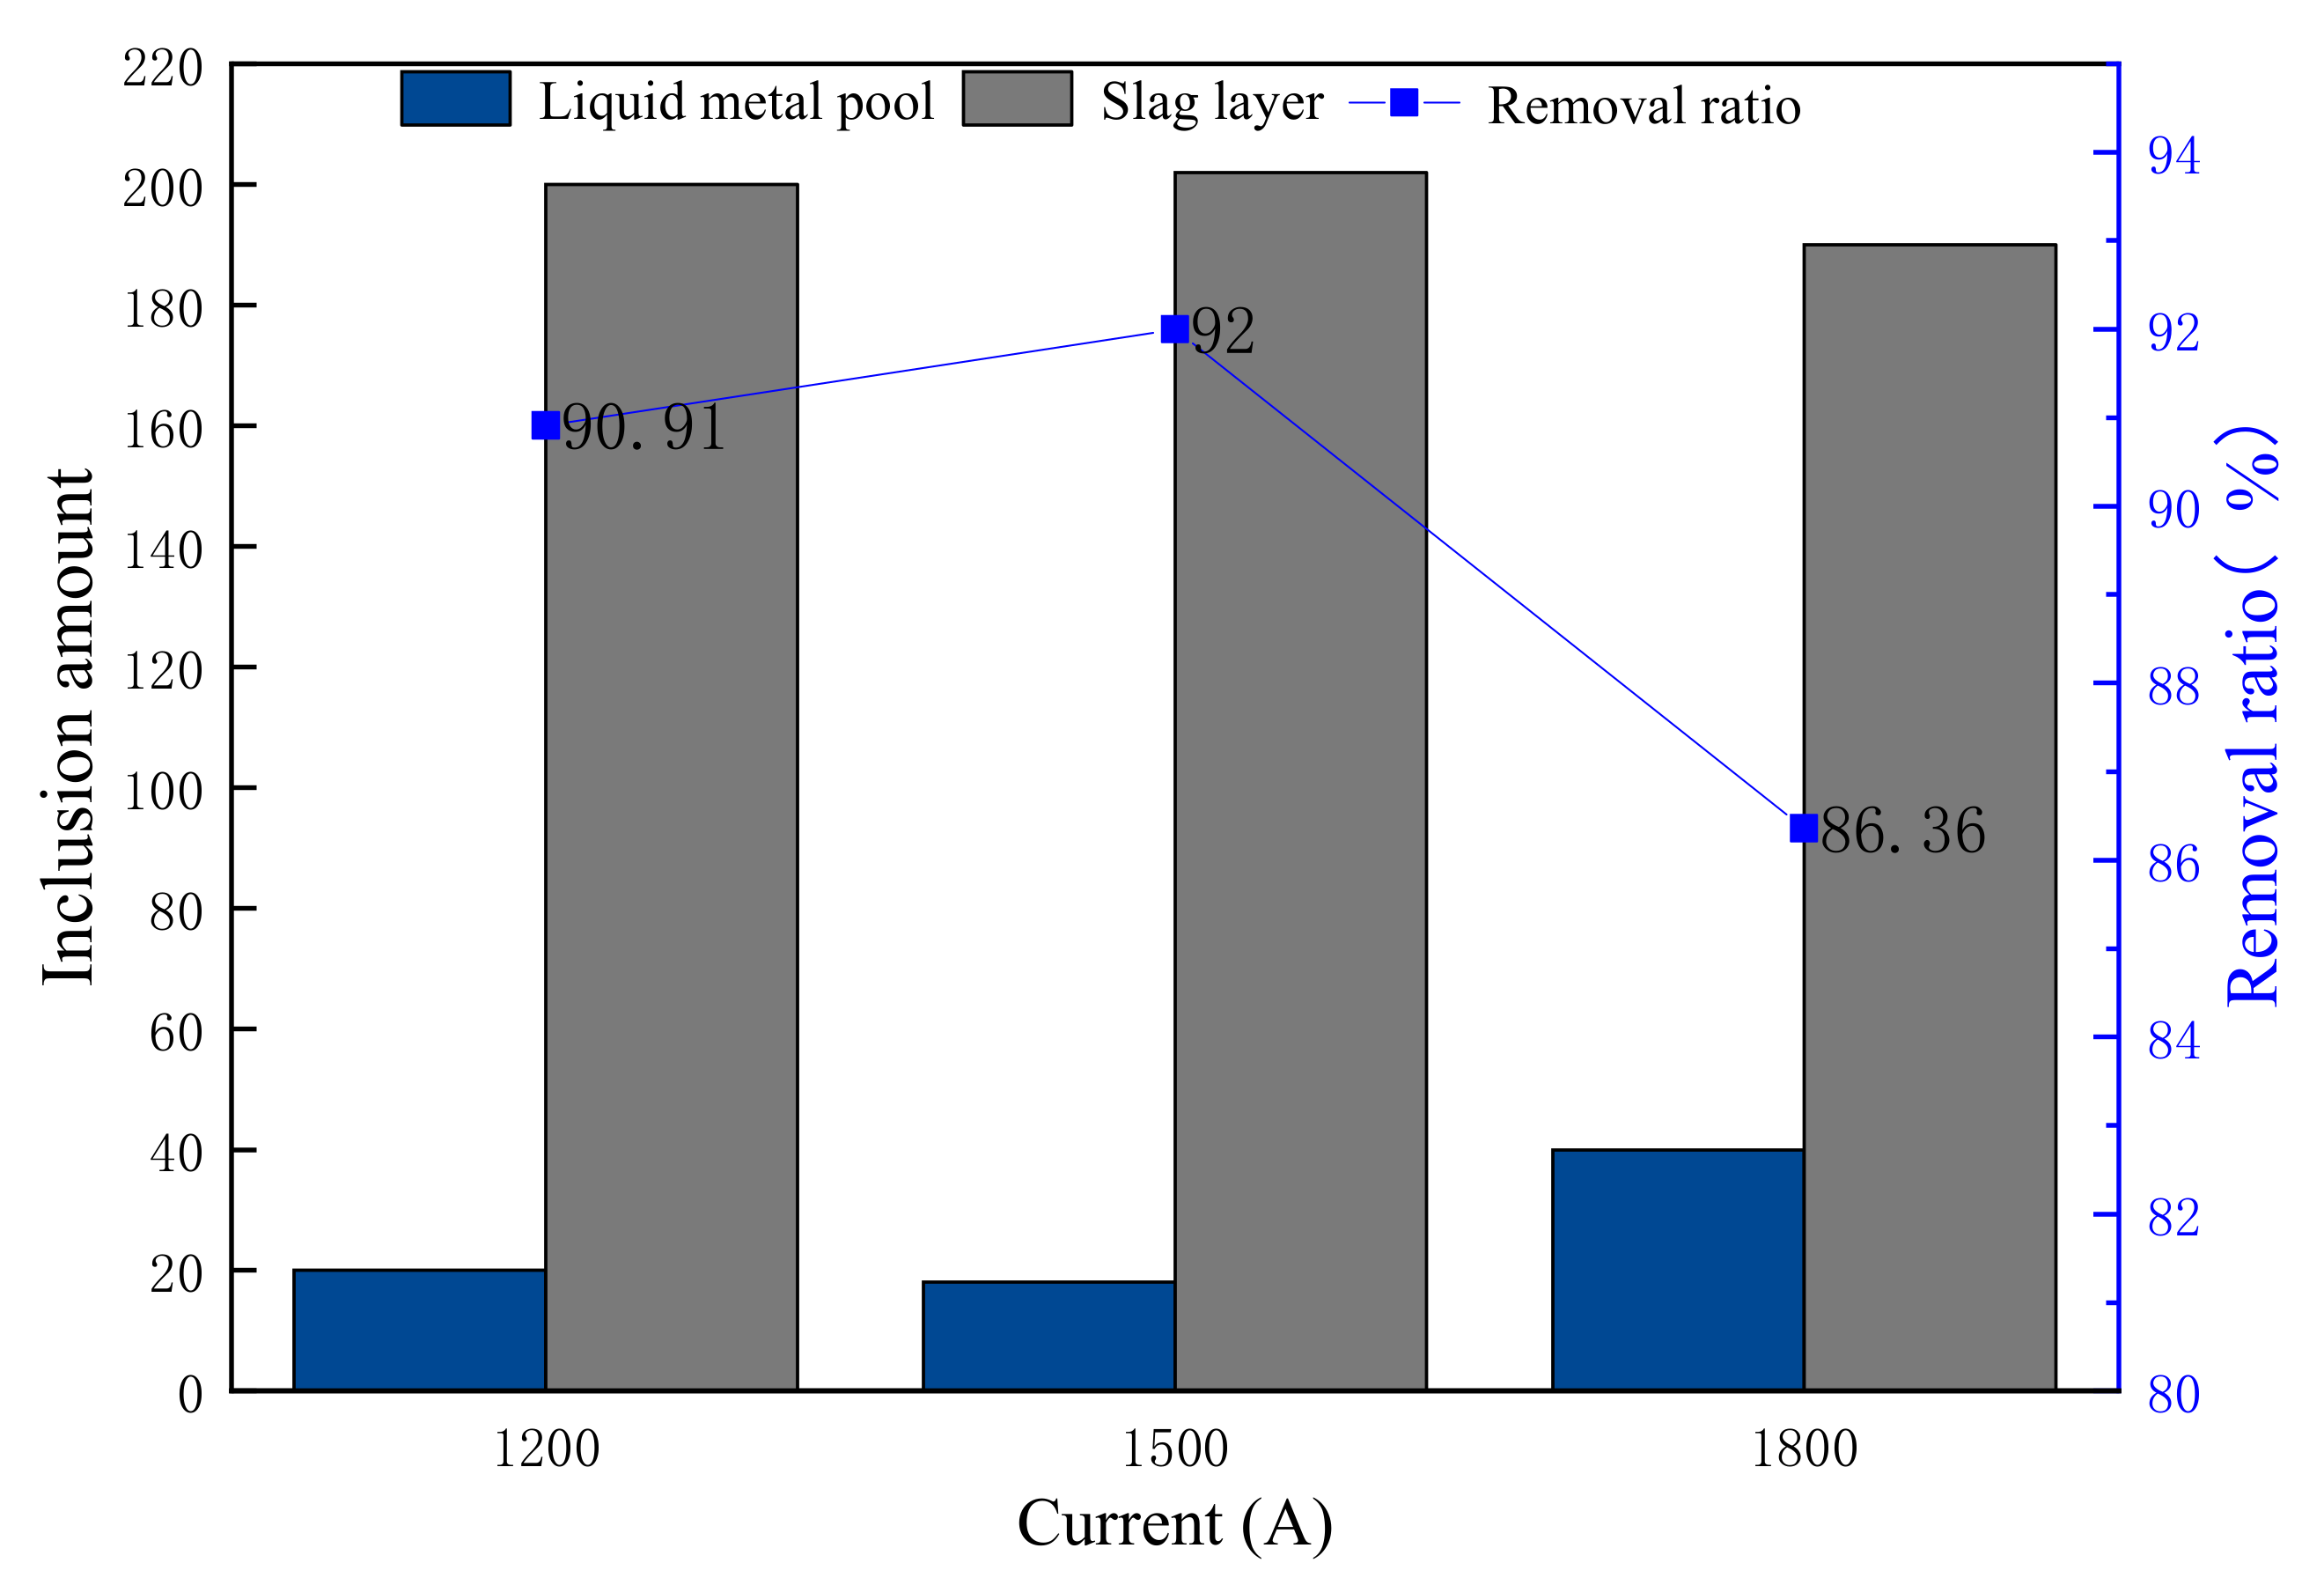
  • When the current increases, the flow-following property of inclusions property in the slag layer becomes worse in the ESR process. When the current is 1200 A, it is obvious to see that inclusions flow with the vortex in the center of the slag layer. The removal ratio of inclusions reaches the maximum value, 92%, with a current of 1500 A.
  • As the thickness of the slag layer increases, the inclusions removal ratio increases gradually. the number of inclusions entering the liquid-metal pool at a certain angleunder the influence of the vortex in the center of the slag layer gradually decreases, while the number of inclusions entering the liquid-metal pool near the left and right side walls gradually increases under the influence of the falling flow near the mold wall. The maximum is 85.91%.
  • With the filling ratio increasing, the flow-following property of inclusions in the slag layer enhances. The maximum removal ratio of 10 μm inclusions is 97%. However, the maximum removal ratio of 50 μm inclusions is 96.04% when the electrode filling ratio is 0.46.
  • Most of the 50 μm Al 2 O 3 inclusions congregate at the electrode entrance and the top of the slag layer, while MnO inclusions uniformly distributes in the slag layer. However, the distribution of Al 2 O 3 inclusions and MnO inclusions with a diameter of 10 μm in slag layer are similar. Due to the influence of the vibrating electrode, 10 μm Al 2 O 3 inclusions and MnO inclusions have a similar inclusions ratio of 81.33% and 82.81%, respectively.

Author Contributions

Conceptualization, F.W.; methodology, F.W. and B.S.; formal analysis, Z.L.; investigation, B.L.; writing—original draft preparation, B.S.; writing—review and editing, F.W. and B.S.; supervision, S.H. and B.Z. All authors have read and agreed to the published version of the manuscript.

Funding

The authors appreciate the financial support of the National Natural Science Foundation of China (No. 52171031), the Fundamental Research Funds for the Central Universities (Nos. N2125039 and N2025020), and the National Science and Technology Major Projects (Nos. 2017-VI-0015-0087 and 2017-VI-0018-0090).

Institutional Review Board Statement

Not applicable.

Informed Consent Statement

Not applicable.

Data Availability Statement

Data sharing is not applicable.

Conflicts of Interest

The authors declare that there are no conflict of interest.

Appendix A

Appendix A.1. Electromagnetic Field

The electromagnetic field is the most basic and important step of multi-physical field in the ESR process. The model of the electromagnetic field is mainly based on Maxwell’s equations. Considering the slag layer, liquid-metal pool, and ingot are good conductors and are in a low-frequency state, the displacement current can be ignored [26]. Maxwell equations can be simplified as:
× H = J
× E = B t
· B = 0
· J = 0
where H denotes magnetic field intensity; B denotes magnetic induction; E denotes electric field strength; J expresses current density, which can be calculated as follows:
J = σ E + U × B
where U denotes fluid velocity.
The time average of Lorentz force and Joule heat can be calculated as:
F e = J × B
Q J = J × J σ
The ESR process involves multiphase flow. The molten slag and molten metal liquid are the two continuous phases. The VOF model is used in this study. It can capture the slag/metal interface under the premise of maintaining mass conservation with a high precision grid [27]. The distribution of slag and liquid metal can be described by the phase volume fraction α :
α t + · α v = 0
where α denotes the volume fraction of slag.

Appendix A.2. Fluid Flow and Heat Transfer

During the ESR process, the flow in the slag layer and liquid-metal pool can be considered weakly turbulent. The continuity equation and Navier-Stokes equation can describe the melt flow in the ESR process:
ρ t + ρ v = 0
ρ v t + · ρ v × v = p + μ e f f 2 v + F e + F s + F t + S
where μ e f f is the effective viscosity of the fluid. The RNG k-ε turbulent model calculates the turbulent flow. F e denotes the Lorentz force calculated by the electromagnetic field; F s t express the surface tension; F t denotes the thermal buoyancy force determined by the Boussinesq approximation; S is the source term accounting for the momentum exchange between melt and inclusions. They can be calculated as follows, respectively:
F s = φ κ 1 α
F t = ρ g β T T ref
S = 1 Δ V c i c e l l F D
where φ denotes the surface tension coefficient; β expresses the thermal expansion coefficient; T denotes temperature; T ref denotes the reference temperature; κ denotes curvature:
κ = · n
where n is unit normal vector, which can be calculated by:
n = α α
The heat-transfer problem is solved by calculating the energy equation:
t ρ m i x E + · ρ m i x v E = · k e f f T + Q J
where k e f f denotes the effective thermal conductivity; E denotes the internal energy of the mixture phase. The specific heat and temperature based on the two phases are calculated according to the following formula:
E = α ρ m c p , m T + 1 α ρ s c p , s T α ρ m + 1 α ρ s
where ρ m denotes the density of molten metal; ρ s denotes the density of slag; c p , m denotes the specific heat capacity of molten metal; c p , s denotes the specific heat capacity of slag.

Appendix A.3. Inclusions Motion

Since the volume fraction of inclusions is small, the effect of inclusions on fluid flow can be neglected. The DPM method is selected to track the trajectory of inclusions. The inclusions are affected by the drag force, buoyancy force, lift force, interfacial tension force, virtual mass force, electromagnetic pressure, and pressure gradient force [28], as shown in Figure A1:
m p d v p d t = F D + F B + F G + F L + F V m + F P + F E m f + F M a
The drag force and buoyancy force are considered to be the two most important forces. The drag force is exerted by the continuous and discrete phases, making the motion of the two phases consistent [29,30]. The buoyancy force is particularly important for the movement of inclusions with larger diameters [31]. They can be calculated as follows:
F D = 1 8 π d p 2 ρ C D v v p v v p
F B + F G = 1 6 ρ p ρ π d p 3 g
where d p denotes the diameter of inclusions; ρ denotes density; ρ p denotes the density of inclusions; C D denotes the drag coefficient; v denotes the mixture velocity of the two continuous phases; v p denotes the velocity of inclusions; g represents the acceleration of gravity.
The lift force caused by velocity gradient can be calculated as follows [32]:
F L = 1.615 μ d p 2 v v p s g n G ρ G μ 1 2   , G = d v d n
The discrete phase and continuous phase not only differ in speed but also in acceleration. When the discrete phase accelerates relative to the continuous phase, the additional force will be generated, that is, virtual mass force:
F V m = C V M ρ p π d p 3 6 d d t v v p
where C V M is the coefficient of virtual mass force, which is set to be constant in this study. It is related to α , ρ p , ρ s , the relative velocities and relative mass fluxes [23]. In addition, the pressure gradient force caused by dynamic pressure is also considered:
F P = ρ p π d p 3 6 D v D t
The electromagnetic force due to pressure gradient in the melt can be calculated according to the following formula:
F E m f = π d p 3 8 F e
The Marangoni force is related to the gradient of surface tension:
F M a = 2 π d p 2 3 σ m s T · g r a d T
Figure A1. Schematic diagram of force analysis of inclusions.
Metals 11 01784 g0a1

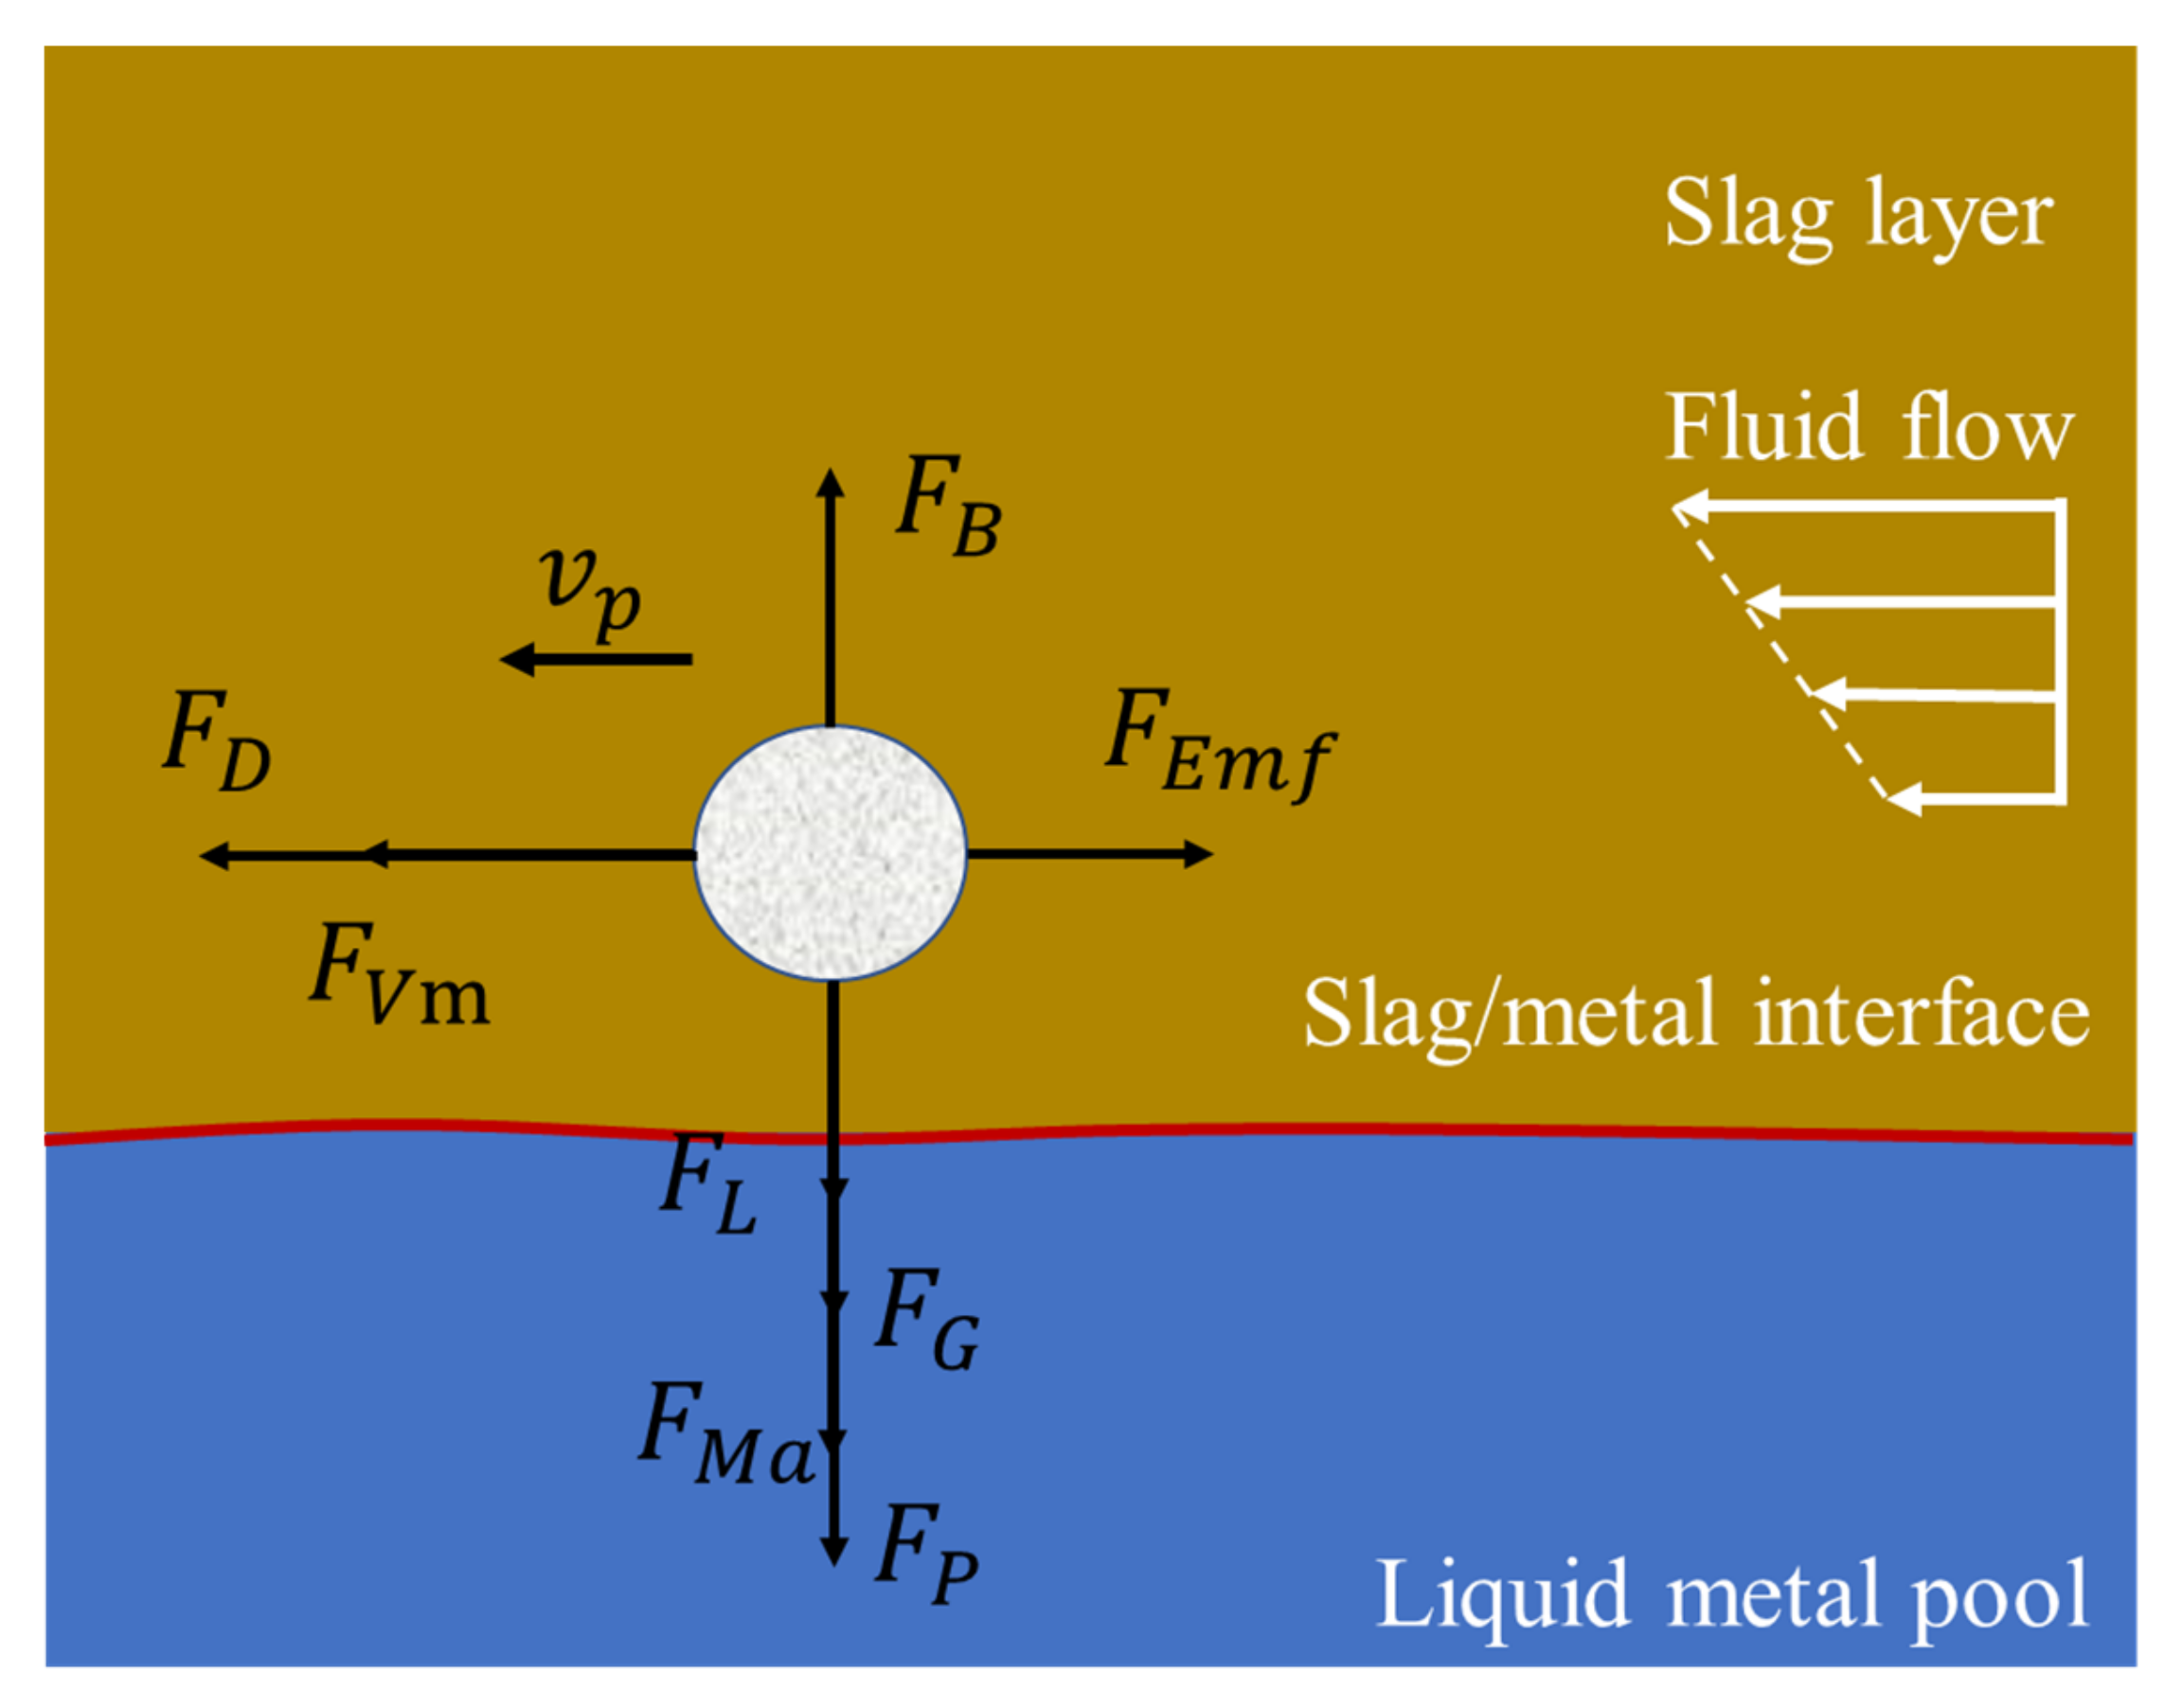
Appendix A.4. Boundary Conditions

As shown in Figure A1, the lower recess at the upper part of the model is the electrode tip specified as the inlet. The two main parts of the model are the slag layer and the liquid-metal pool.
The current is continuous in the ESR process. Thus, the magnetic field at the electrode tip and bottom is continuous as well. In addition, because the current is only distributed along the vertical direction, according to the right-hand screw rule, the magnetic field is only distributed along the radial direction. Therefore, the boundary condition at the inlet and bottom can be expressed as:
H ^ θ y = 0
where H ^ θ denotes the complex amplitude of H and y denotes the distance from the inlet.
The boundary condition at the electrode wall can be demonstrated as:
H ^ θ = J 2 π R e
where R e denotes the radius of the electrode. The current flows radically at the top, and the magnetic field is only distributed along the axial direction at this interface, which can be denoted as:
H = J 2 π r
where r is the distance between the electrode and the mold wall, and the current is only distributed along the axial direction at the interface of the slag layer, liquid-metal pool, and mold sidewall. Thus, only the radial component of the magnetic field needs to be considered:
H = J 2 π L
where L is the width of the mold.
Zero shear stress is applied to the top surface, and the no-slip boundary is applied to the wall and the bottom. The inlet condition of mass flow is used at the electrode tip.
Since the electrode tip is heated and melted to form droplets, the temperature at the bottom of the electrode is set to be the liquidus temperature of steel. Heat convection and radiation are considered at the inlet, and the total heat exchange can be calculated through the following equation:
Q = Q c + Q r = h t w t A
where Q c denotes the convection heat transfer; Q r denotes the radiant heat transfer, h depicts the comprehensive convective heat transfer coefficient, and A depicts the heat-exchange area. In the actual calculation process, radiative heat transfer is equivalent to convective heat transfer generally:
h = h c + h r
where h c denotes the radiation heat-transfer coefficient; h r denotes the convection heat-transfer coefficient.
The remaining contact surfaces are treated according to the third boundary condition:
λ T n w = h c o m T w T f
where n denotes the external normal of the heat-transfer surface; T w and T f depict wall temperature and fluid temperature, respectively. h c o m represents the comprehensive heat-transfer coefficient, which is generally measured by experiments.
The boundary condition for the DPM method is set to be reflected. The types of inclusions in this study are Al 2 O 3 and MnO , and their diameters are 10, 30, and 50 μm, respectively.

References

  1. Hernandez-Morales, B.; Mitchell, A. Review of mathematical models of fluid flow, heat transfer, and mass transfer in electroslag remelting process. Ironmak. Steelmak. 1999, 26, 423–438. [Google Scholar]
  2. Wang, F.; Wang, Q.; Li, B.K. Comparison of Thermo-electromagnetic-hydrodynamic Multi-physical Fields in ESR Furnace with Vibrating and Traditional Electrodes. ISIJ Int. 2017, 57, 91–99. [Google Scholar] [CrossRef] [Green Version]
  3. Zhang, A.M. Effect of non-metallic inclusion on property of steel. Phys. Exam. Test. 2006, 4, 42–44. [Google Scholar]
  4. Dong, Y.W.; Jiang, Z.H.; Cao, Y.L.; Yu, A.; Hou, D. Effect of slag on inclusions during electroslag remelting process of die steel. Metall. Mater. Trans. B 2014, 45, 1315–1324. [Google Scholar] [CrossRef]
  5. Mehrabi, K.; Rahimipour, M.R.; Shokuhfar, A. The effect of slag types and melting rate on electro-slag remelting processing. Int. J. Iron Steel Soc. Iran 2005, 2, 37–42. [Google Scholar]
  6. Chen, X.C.; Shi, C.B.; Guo, H.J. Investigation of oxide inclusions and primary carbonitrides in inconel 718 superalloy refined through electroslag remelting process. Metall. Mater. Trans. B 2012, 43, 1596–1607. [Google Scholar]
  7. Shi, X.; Chang, L.Z.; Zhu, Z. Effect of noncontact ultrasonic technology on solidification quality of electroslag steel. J. Iron Steel Res. Int. 2016, 23, 1168–1176. [Google Scholar] [CrossRef]
  8. Kharicha, A.; Sibaki, E.K.; Wu, M. Review on modeling and simulation of electroslag remelting. Steel Res. Int. 2017, 89, 201700100. [Google Scholar] [CrossRef]
  9. Kelkar, M.; Patankar, S.V.; Srivatsa, S.K.; Minisandram, R.S.; Evans, D.G.; de Barbadillo, J.J.; Smith, R.H.; Helmink, R.C.; Mitchell, A.; Sizek, H.A. Computational modeling of electroslag remelting process used for the production of high performance alloys. In Proceedings of the International Symposium on Liquid Metal Processing and Casting, Austin, TX, USA, 22–25 September 2013; pp. 3–12. [Google Scholar]
  10. Du, G.; Li, J.; Wang, J.B. Effect of operating conditions on inclusion of die steel during electroslag remelting. ISIJ Int. 2017, 58, 78–87. [Google Scholar] [CrossRef] [Green Version]
  11. Huang, X.C.; Li, B.K.; Liu, Z.Q. Numerical study on the removal and distribution of non-metallic inclusion in electroslag remelting process. Int. J. Heat Mass Transf. 2019, 135, 1300–1311. [Google Scholar] [CrossRef]
  12. Hugo, M.; Dussoubs, B.; Jardy, A.; Escaffre, J.; Poisson, H. Influence of the mold current on the electroslag remelting process. Metall. Mater. Trans. B 2016, 47, 2607–2622. [Google Scholar] [CrossRef]
  13. Hirt, C.W.; Nichols, B.D. Volume of fluid (VOF) method for the dynamics of free boundaries. Comput. Phys. 1981, 39, 201–225. [Google Scholar] [CrossRef]
  14. Huang, X.C.; Li, B.K.; Liu, Z.Q. A coupled mathematical model of oxygen transfer in electroslag remelting process. Int. J. Heat Mass Transf. 2018, 120, 458–470. [Google Scholar] [CrossRef]
  15. Singh, A.K.; Basu, B.; Ghosh, A. Role of appropriate permeability model on numerical prediction of macrosegregation. Metall. Mater. Trans. B 2006, 37, 799–809. [Google Scholar]
  16. Wang, H.; Li, J.; Shi, C.; Qi, Y.; Dai, Y. Formation and evolution of non-metallic inclusion in calcium treatment H13 steel during electroslag remelting process. ISIJ Int. 2019, 59, 828–838. [Google Scholar]
  17. Wen, T.; Ren, Q.; Zhang, L.; Wang, J.; Ren, Y.; Zhang, J.; Yang, W.; Wu, A. Evolution of non-metallic inclusion during the electroslag remelting process. Steel Res. Int. 2021, 92, 2000629. [Google Scholar] [CrossRef]
  18. Wang, Q.; Wang, R.T.; He, Z.; Li, G.Q.; Li, B.K.; Li, H.B. Numerical analysis of inclusion motion behavior in electroslag remelting process. Int. J. Heat Mass Transf. 2018, 125, 1333–1344. [Google Scholar] [CrossRef]
  19. Huang, X.C.; Li, B.; Liu, Z. Numerical investigation and experimental validation of motion and distribution of nonmetallic inclusions in Argon protection electroslag remelting Process. Metals 2018, 8, 392. [Google Scholar] [CrossRef] [Green Version]
  20. Wang, R.T.; Li, G.Q.; Wang, Q.; Wang, Q. Numerical simulation of inclusion movement in electroslag remelting process. J. Iron Steel Res. 2018, 2, 104–112. [Google Scholar]
  21. Wang, F.; Xiong, Y.L.; Li, B.K. Impact of fill ratio on temperature profile and metal bath configuration in electroslag remelting process with vibrating electrode. Steel Res. Int. 2019, 90, 1800092. [Google Scholar] [CrossRef]
  22. Wang, Q.; He, Z.; Li, G.; Li, B.; Zhu, C.; Chen, P. Numerical investigation of desulfurization behavior in electroslag remelting process. Int. J. Heat Mass Transf. 2017, 104, 943–951. [Google Scholar] [CrossRef]
  23. Song, Z.W.; Chen, R.; Xiong, Y.L. Effects of electrode vibration on inclusion of ZG04Cr13Ni14Mo stainless steel during Electrode Remelting. Foundry 2015, 64, 1108–1112. [Google Scholar]
  24. Wang, F.; Wang, Q.; Baleta, J.; Li, B.K. A dynamic mesh-based approach for simulation of the electromagnetically-controlled vibrating electrode electroslag-remelting furnace. JOM 2019, 71, 4198–4205. [Google Scholar]
  25. Wang, Q.; Li, B.K. Numerical investigation on the effect of slag thickness on metal pool profile in electroslag remelting process. ISIJ Int. 2016, 56, 282–287. [Google Scholar]
  26. Huang, X.C.; Duan, Y.R.; Liu, Z.Q.; Li, B.K.; Wang, F. Role of eleetrode rotating on improvement of metal pool profile in electroslag remetling process. Metals 2021, 11, 1675–1689. [Google Scholar]
  27. Jardy, A.; Ablitzer, D.; Wadier, J.F. Study on sulfur transfer behavior during refining of rejected electrolytic manganese metal. Metals 2019, 9, 751–770. [Google Scholar]
  28. Zhang, L.F.; Aoki, J.; Thomas, B.G. Inclusion removal by bubble flotation in a continuous casting mold. Metall. Mater. Trans. B 2006, 37, 361–379. [Google Scholar] [CrossRef]
  29. Sun, X.S.; Sakai, M. Three-dimensional simulation of gas-solid-liquid flows using the DEM-VOF method. Chem. Eng. Sci. 2015, 134, 531–548. [Google Scholar]
  30. Liu, Z.Q.; Niu, R.; Wu, Y.D.; Li, B.K.; Gan, Y.; Wu, M.H. Physical and numerical simulation of mixed columnar-equiaxed solidification during cold strip feeding in continuous casting. Int. J. Heat Mass Transf. 2021, 173, 121237. [Google Scholar] [CrossRef]
  31. Wang, Q.; Squires, K.D.; Chen, M.; Mclaughlin, J.B. On the role of the lift force in turbulence simulations of particle deposition. Int. J. Multiph. Flow 1997, 23, 749–763. [Google Scholar] [CrossRef]
  32. Pudasaini, S.P. A fully analytical model for virtual mass force in mixture flows. Int. J. Multiph. Flow 2019, 113, 142–152. [Google Scholar] [CrossRef]
Figure 1. Grid simulation diagram.
Metals 11 01784 g001
Figure 2. Temperature-field distribution with (a) vibrating electrode (t = 10 s) (b) conventional electrode (t = 10 s) (c) current of 1800 A in the ESR process with vibrating electrode (t = 10 s) (d) vibrating electrode (t = 22 s).
Metals 11 01784 g002aMetals 11 01784 g002b
Figure 3. Comparison of the slag layer temperature between simulation and experiment.
Metals 11 01784 g003
Figure 4. Flow field and streamlines distribution with (a) vibrating electrode (t = 10 s) (b) conventional electrode (t = 10 s).
Metals 11 01784 g004
Figure 5. Flow field and streamlines distribution with different electrode vibration frequency (a) 0.25 Hz and (b) 1 Hz.
Metals 11 01784 g005
Figure 6. Flow field and streamlines distribution with different slag layer thickness (a) 50 mm and (b) 70 mm.
Metals 11 01784 g006
Figure 7. Inclusion distribution with different electrode vibrating frequency (a) 0.25 Hz (b) 0.5 Hz and (c) 1 Hz.
Metals 11 01784 g007
Figure 8. Effect of electrode vibration frequency on inclusion removal ratio with different diameter.
Metals 11 01784 g008
Figure 9. Inclusion distribution with different current (a) 1200 A (b) 1500 A and (c) 1800 A.
Metals 11 01784 g009
Figure 10. Comparison of removal ratio with different current.
Metals 11 01784 g010
Figure 11. Inclusions distribution with different slag layer thickness (a) 50 mm (b) 60 mm and (c) 70 mm.
Metals 11 01784 g011
Figure 12. Comparison of removal ratio with different slag-layer thickness.
Metals 11 01784 g012
Figure 13. Inclusions distribution with different filling ratio (a) 0.38 (b) 0.46 and (c) 0.54.
Metals 11 01784 g013
Figure 14. Effect of filling ratio on inclusions removal ratio with different diameters.
Metals 11 01784 g014
Figure 15. 50 μm inclusions distribution with different types (a) MnO and (b) Al 2 O 3 .
Metals 11 01784 g015
Figure 16. 10 μm inclusions distribution with different types (a) MnO and (b) Al 2 O 3 .
Metals 11 01784 g016
Figure 17. Comparison of removal ratio with different types.
Metals 11 01784 g017
Table 1. Physical properties, geometry and process parameters.
ParameterValue
Physical properties of liquid metal
Density 7850   ( kg / m 3 )
Viscosity0.006 (kg/m·s)
Specific heat866 (J/kg·K)
Thermal conductivity 30.5 (W/m·K)
Electric conductivity 7.14 × 10 5 (S/m)
Liquidus/solidus temperature1798/1768 (K)
Latent heat of fusion270 (kJ/kg)
Physical properties of slag layer
Density 2500   ( kg / m 3 )
Viscosity0.03 kg/(m·s)
Specific heat1255 J/(kg·K)
Thermal conductivity10.5 W/(m·K)
Electric conductivity 3.3 × 10 3 (S/m)
Liquidus/solidus temperature1610/1590 (K)
Dimension of geometry model
Length120 (mm)
Height90 (mm)
Electrode filling ratio0.46/0.38/0.54
slag layer thickness 60/50/70 (mm)
Electrode immersing depth5.0 (mm)
Operating condition
Electrode vibration frequency 0.50/0.25/1 (Hz)
Current1500/1200/1800 (A)
Inclusions density 3500 / 5030   ( kg / m 3 )
Inclusions diameter10/30/50 (μm)
Publisher’s Note: MDPI stays neutral with regard to jurisdictional claims in published maps and institutional affiliations.

