
Comparison of Impact Toughness in Simulated Coarse-Grained Heat-Affected Zone of Al-Deoxidized and Ti-Deoxidized Offshore Steels

 , ,
, ,  , , ,
, , ,
Abstract
:1. Introduction
2. Materials and Methods
2.1. Materials and Heat Treatments
2.2. Mechanical Testing
2.3. Microstructural Characterization
2.3.1. Prior Austenite Reconstruction
2.3.2. Non-Metallic Inclusion Characterization
2.3.3. Precipitate Characterization
2.3.4. Retained Austenite Determination
3. Results and Discussion
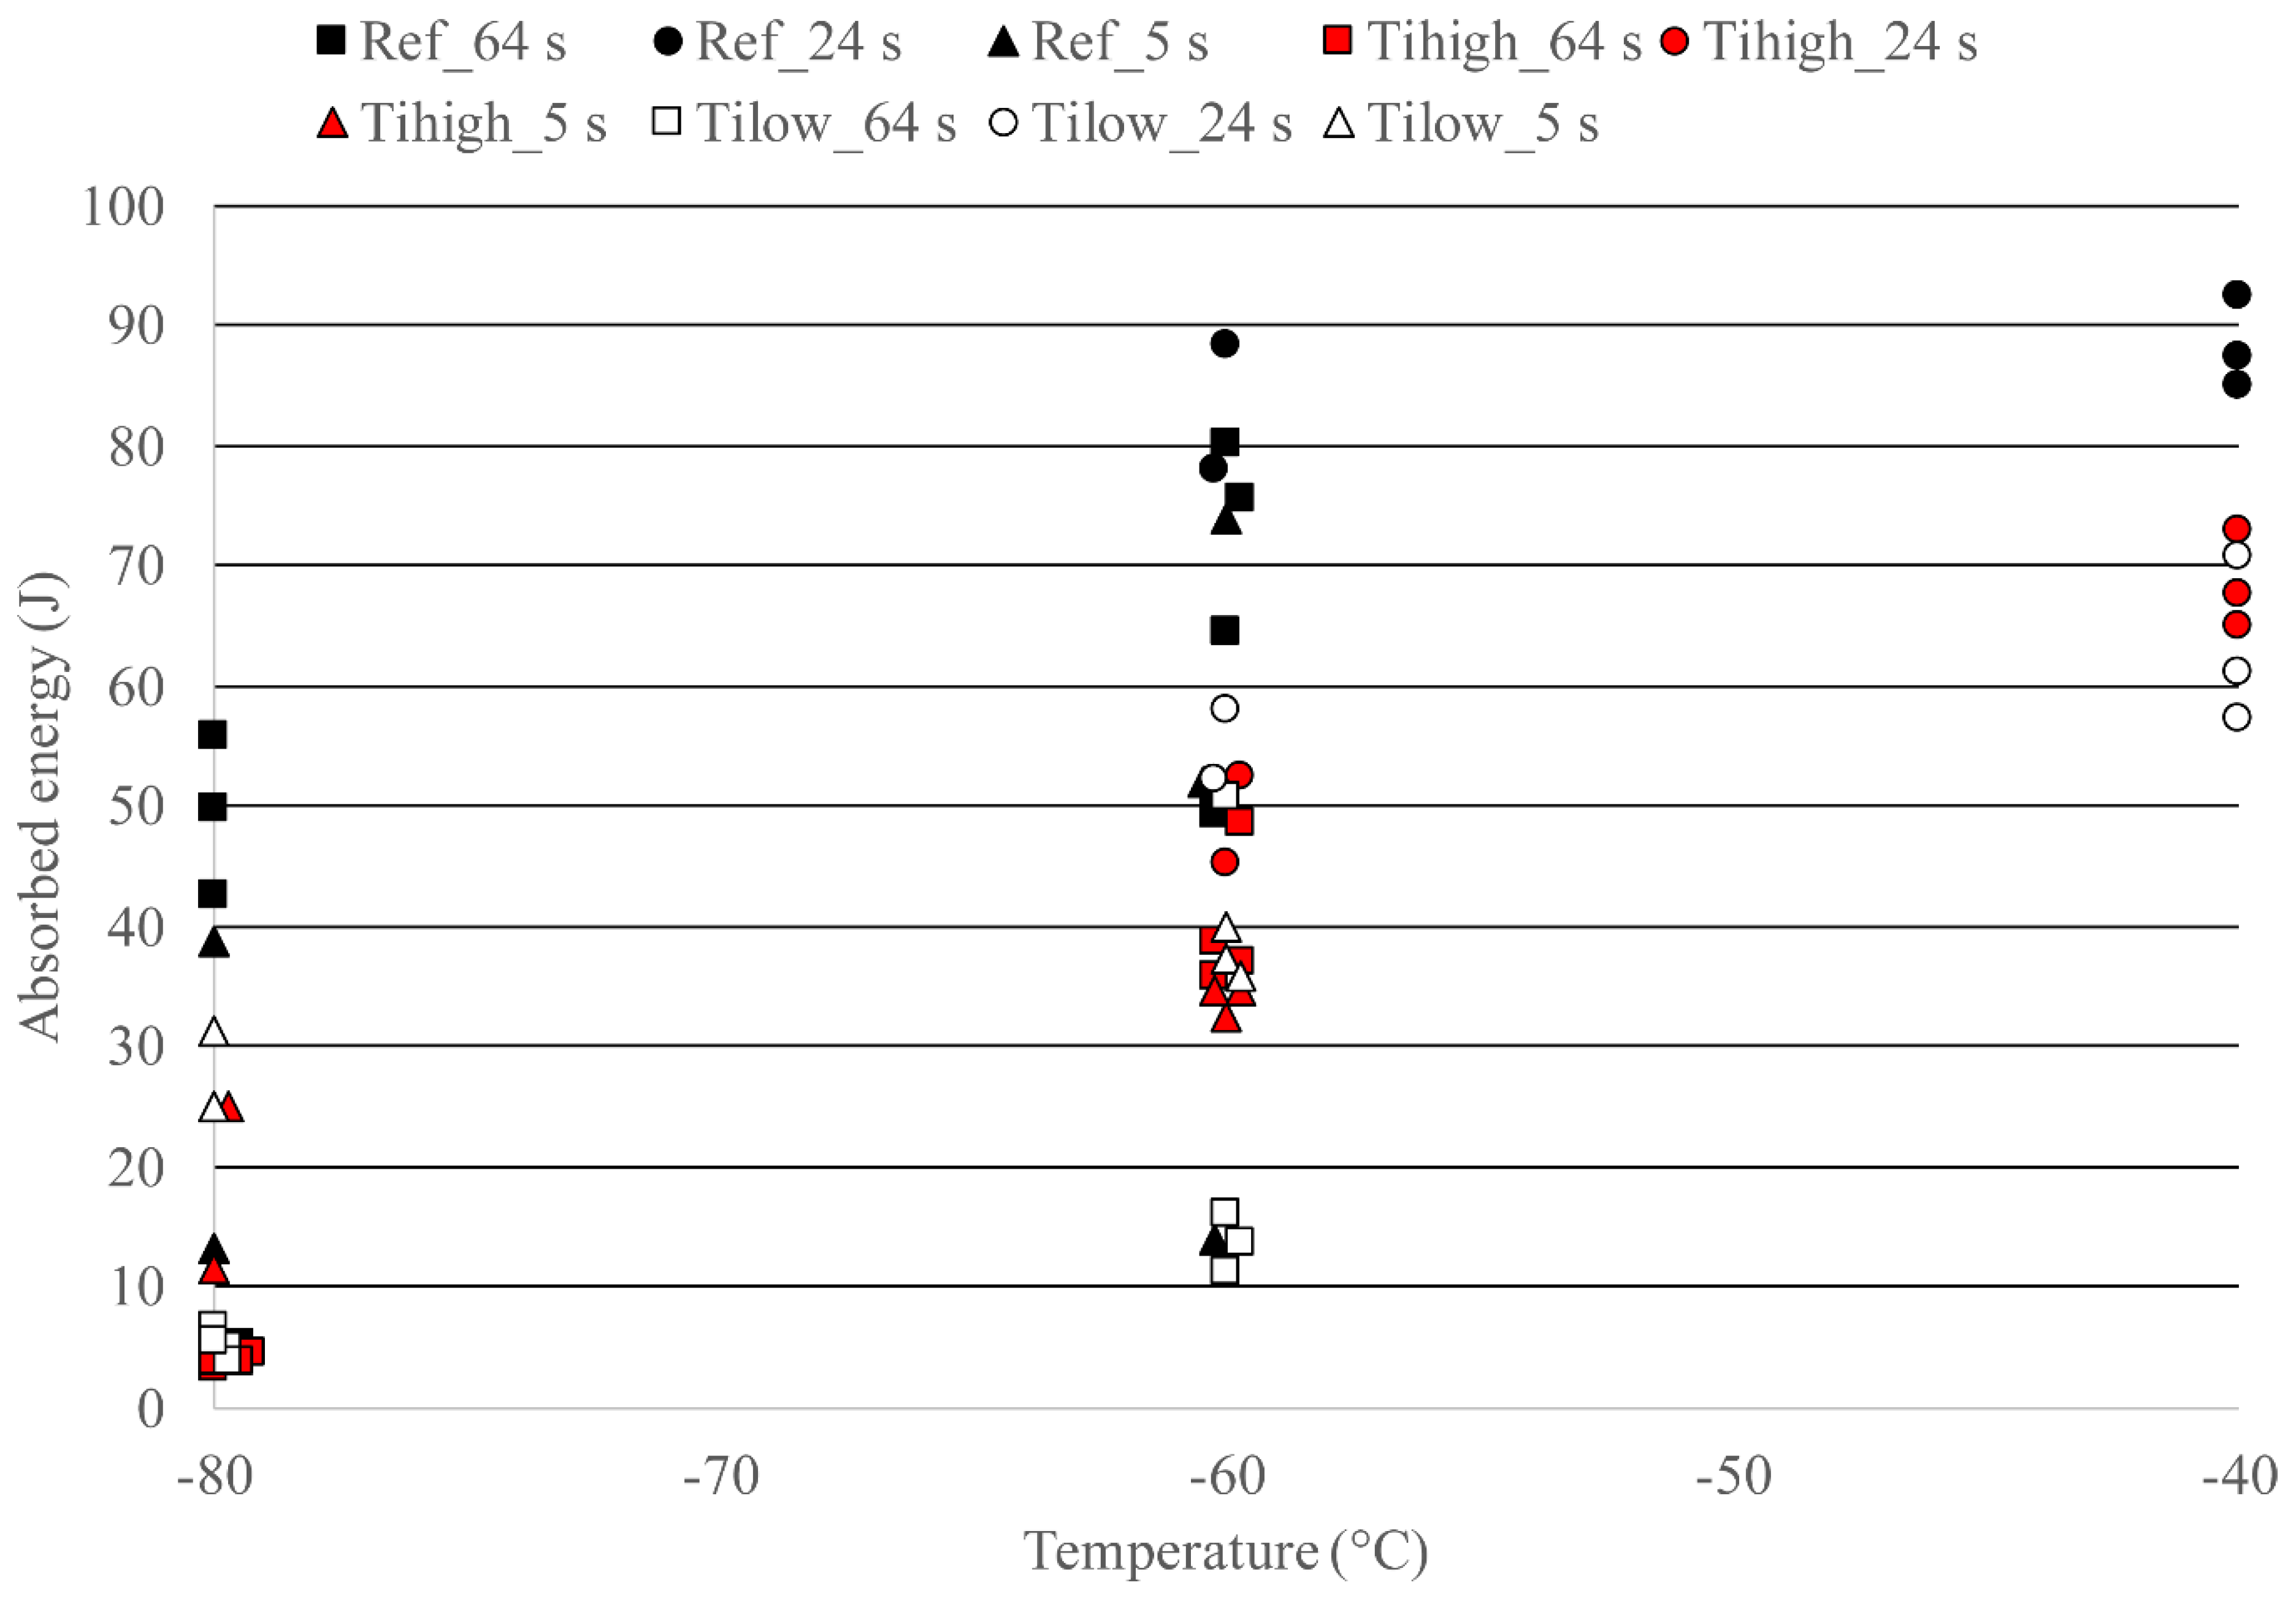
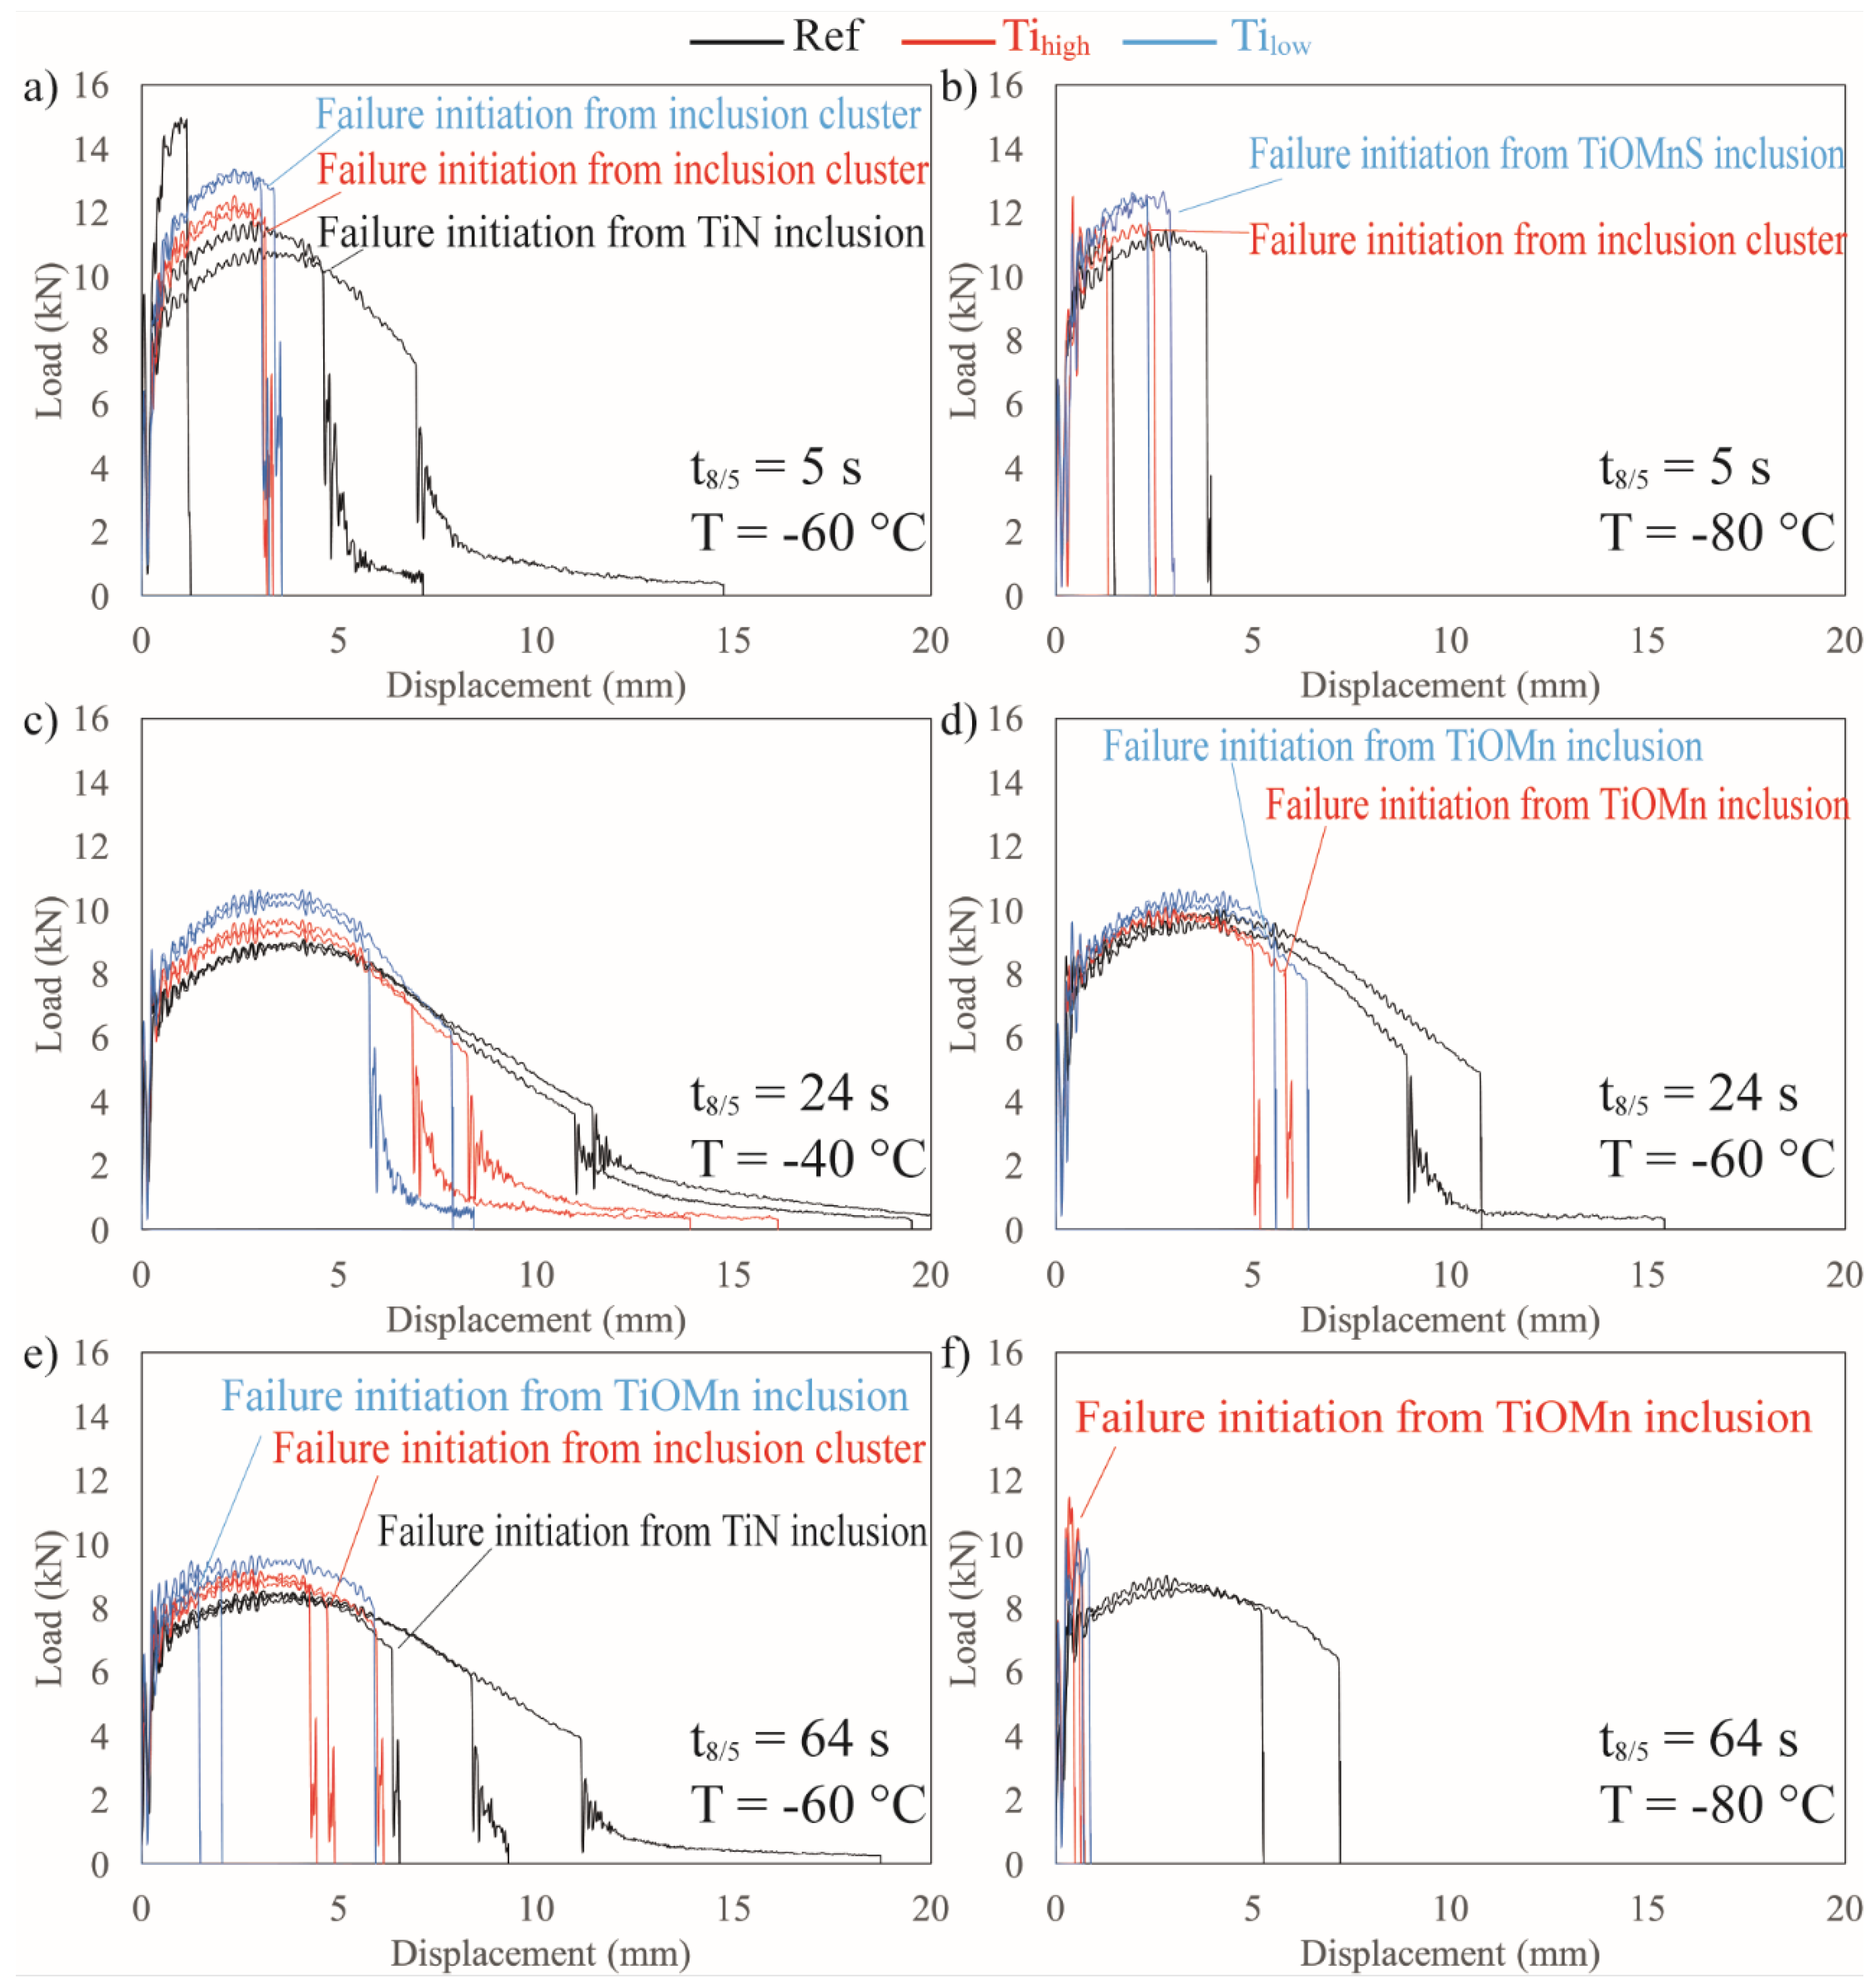
3.1. Analysis of Toughness Testing
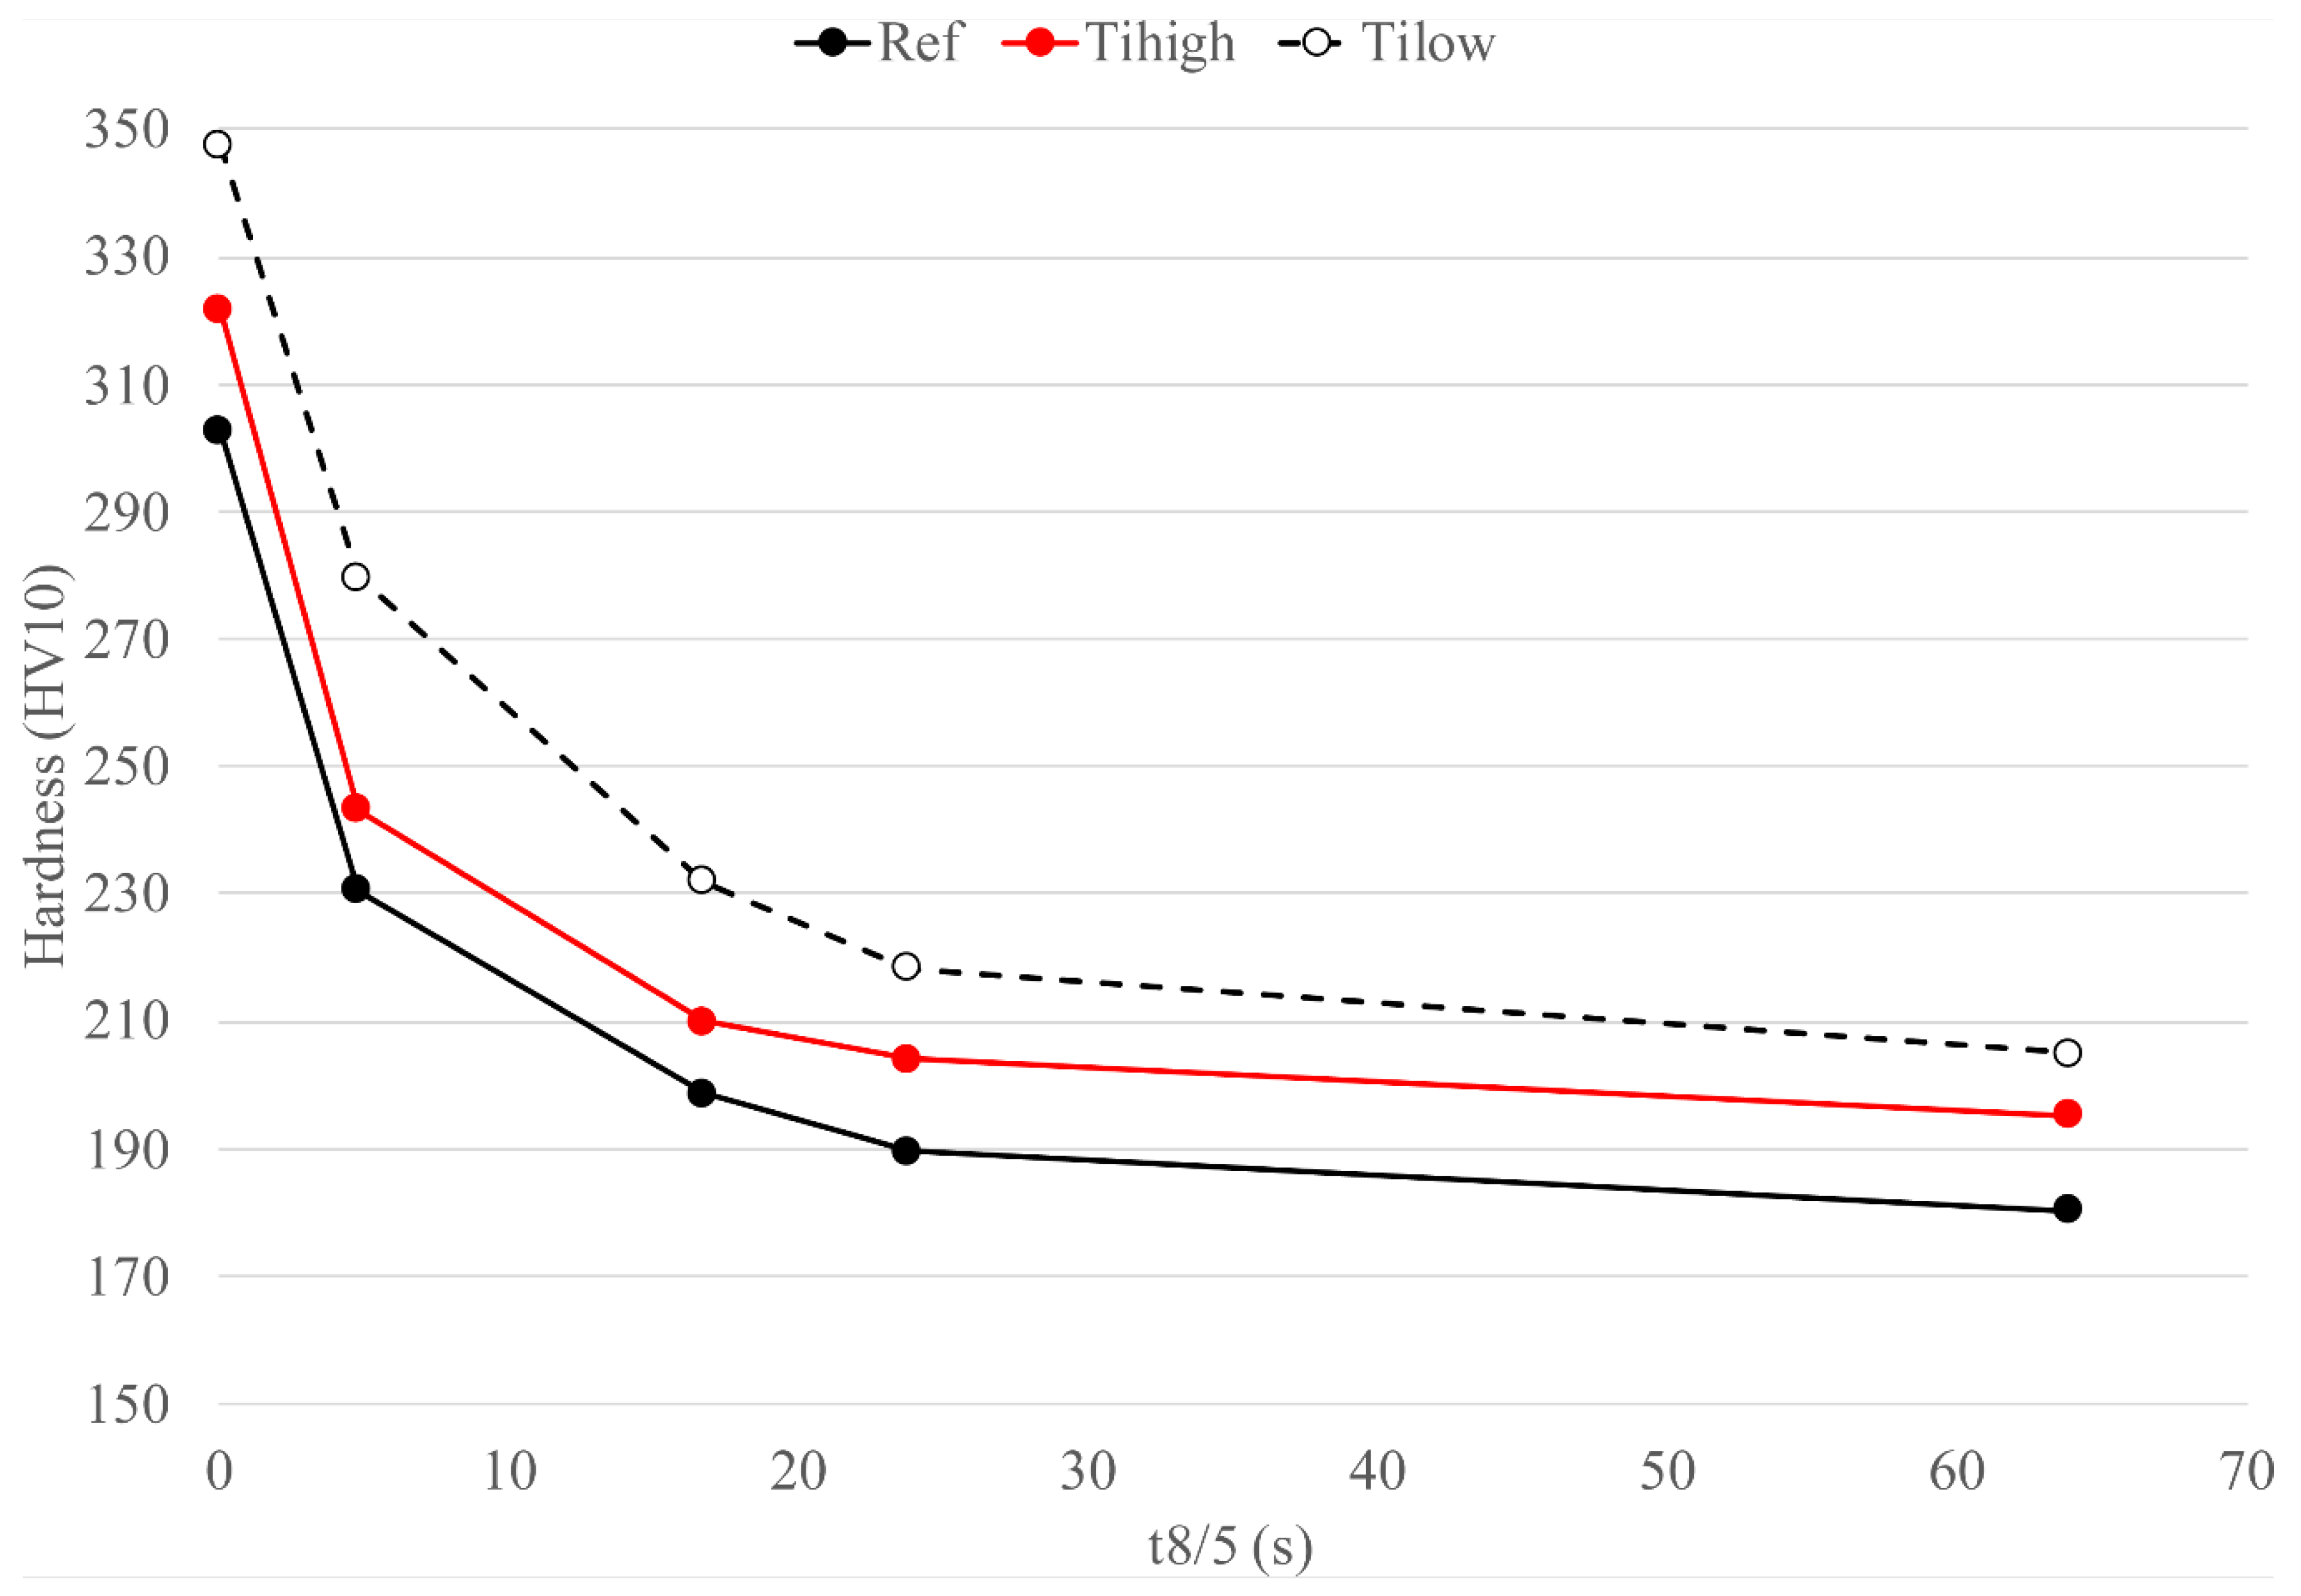
3.2. Hardness Differences in Simulated CGHAZ
3.3. Role of Cooling Time
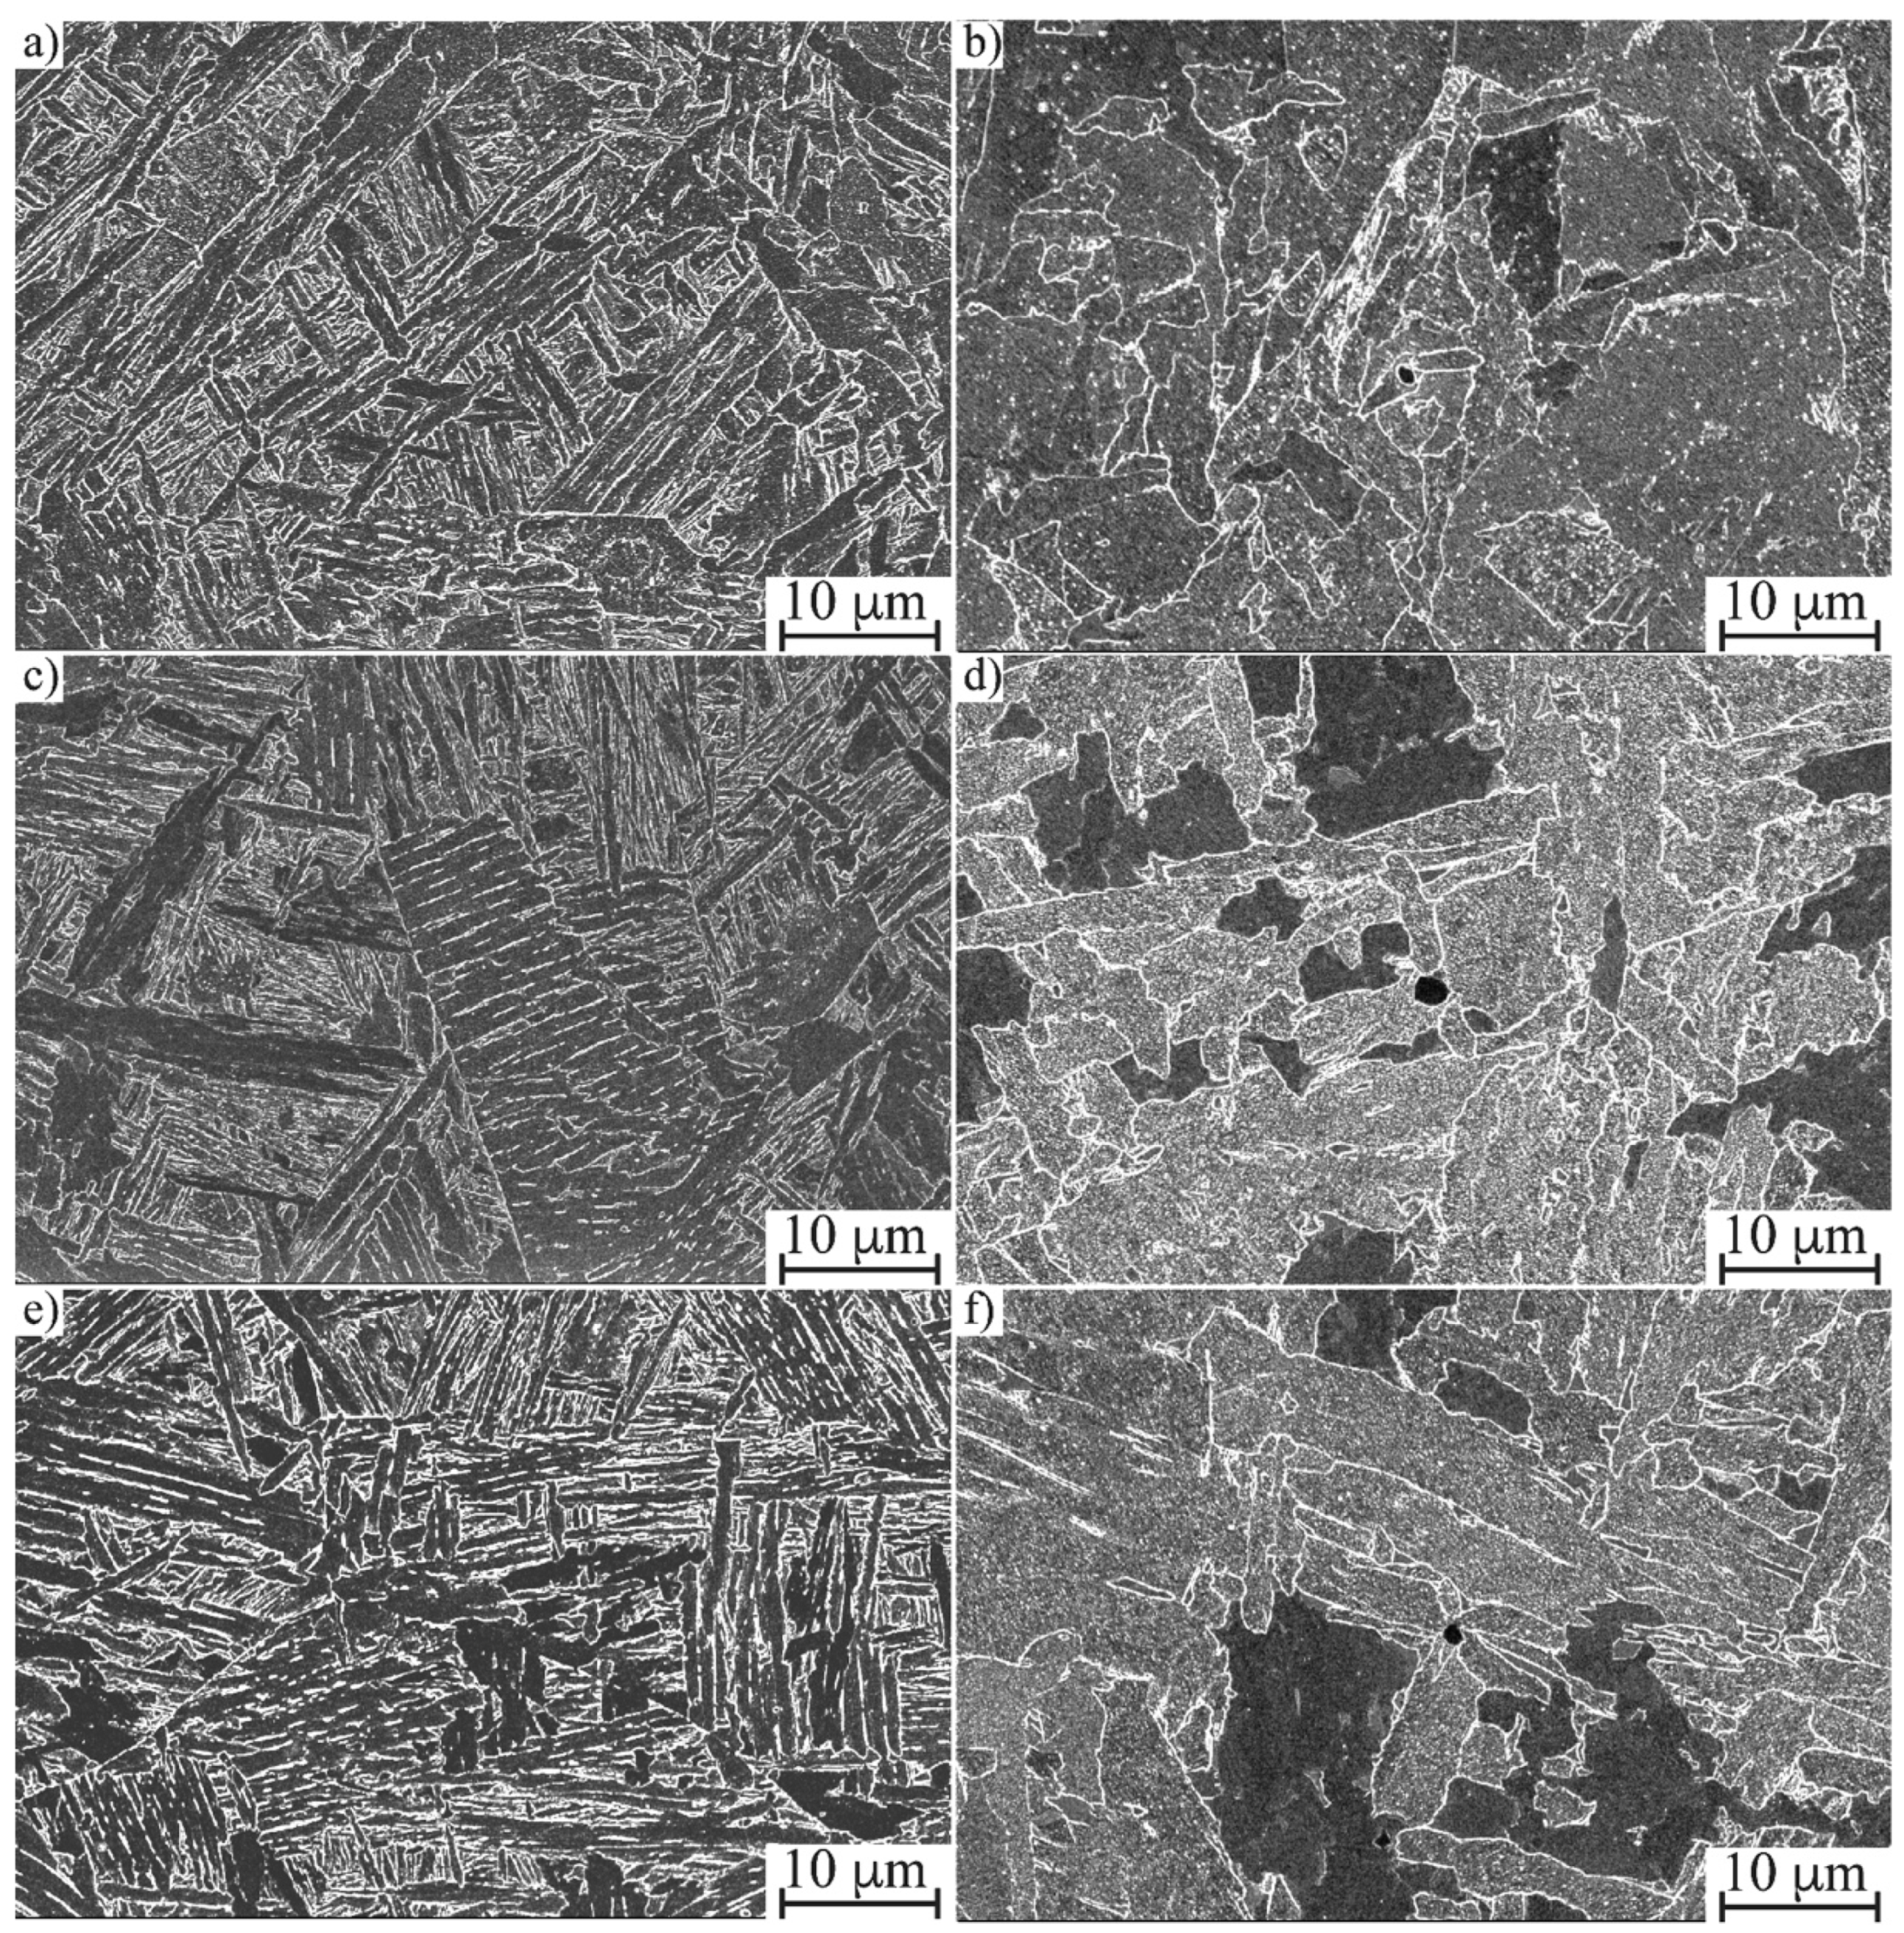
3.3.1. Microstructural Characterization
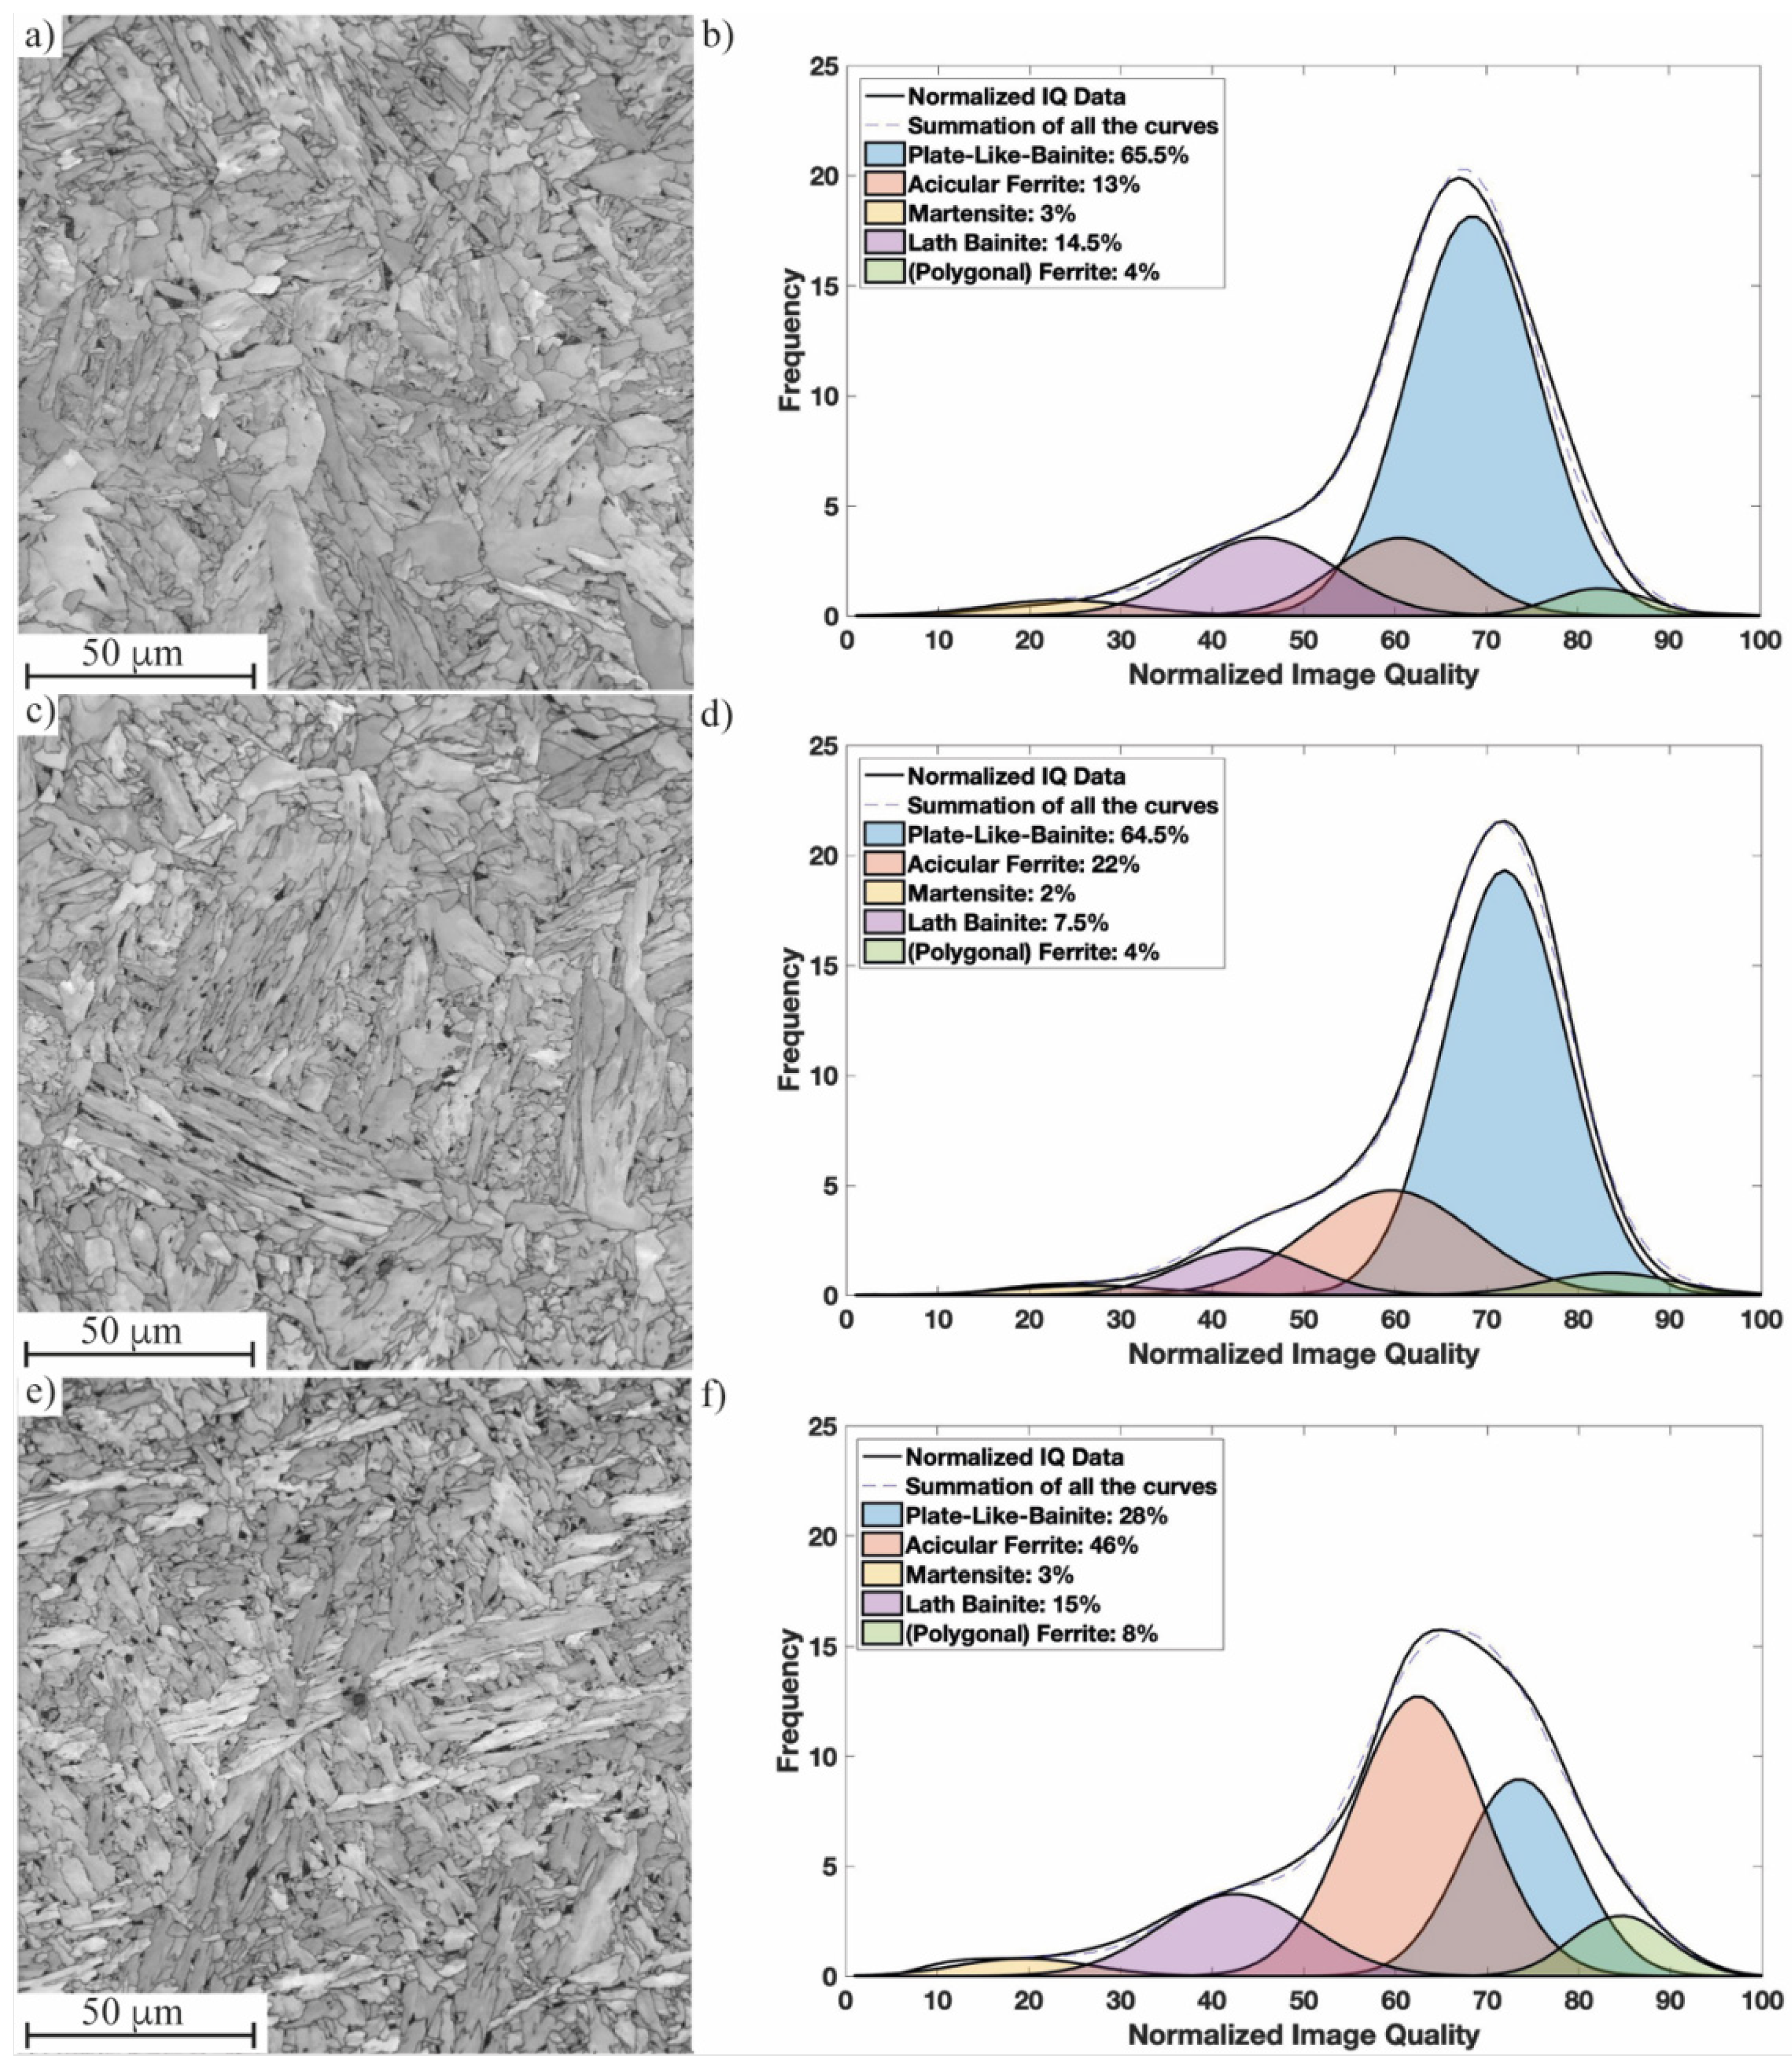
3.3.2. Phase Fractions
3.3.3. Role of Prior Austenite Grain Size
3.3.4. Effective Grain Size
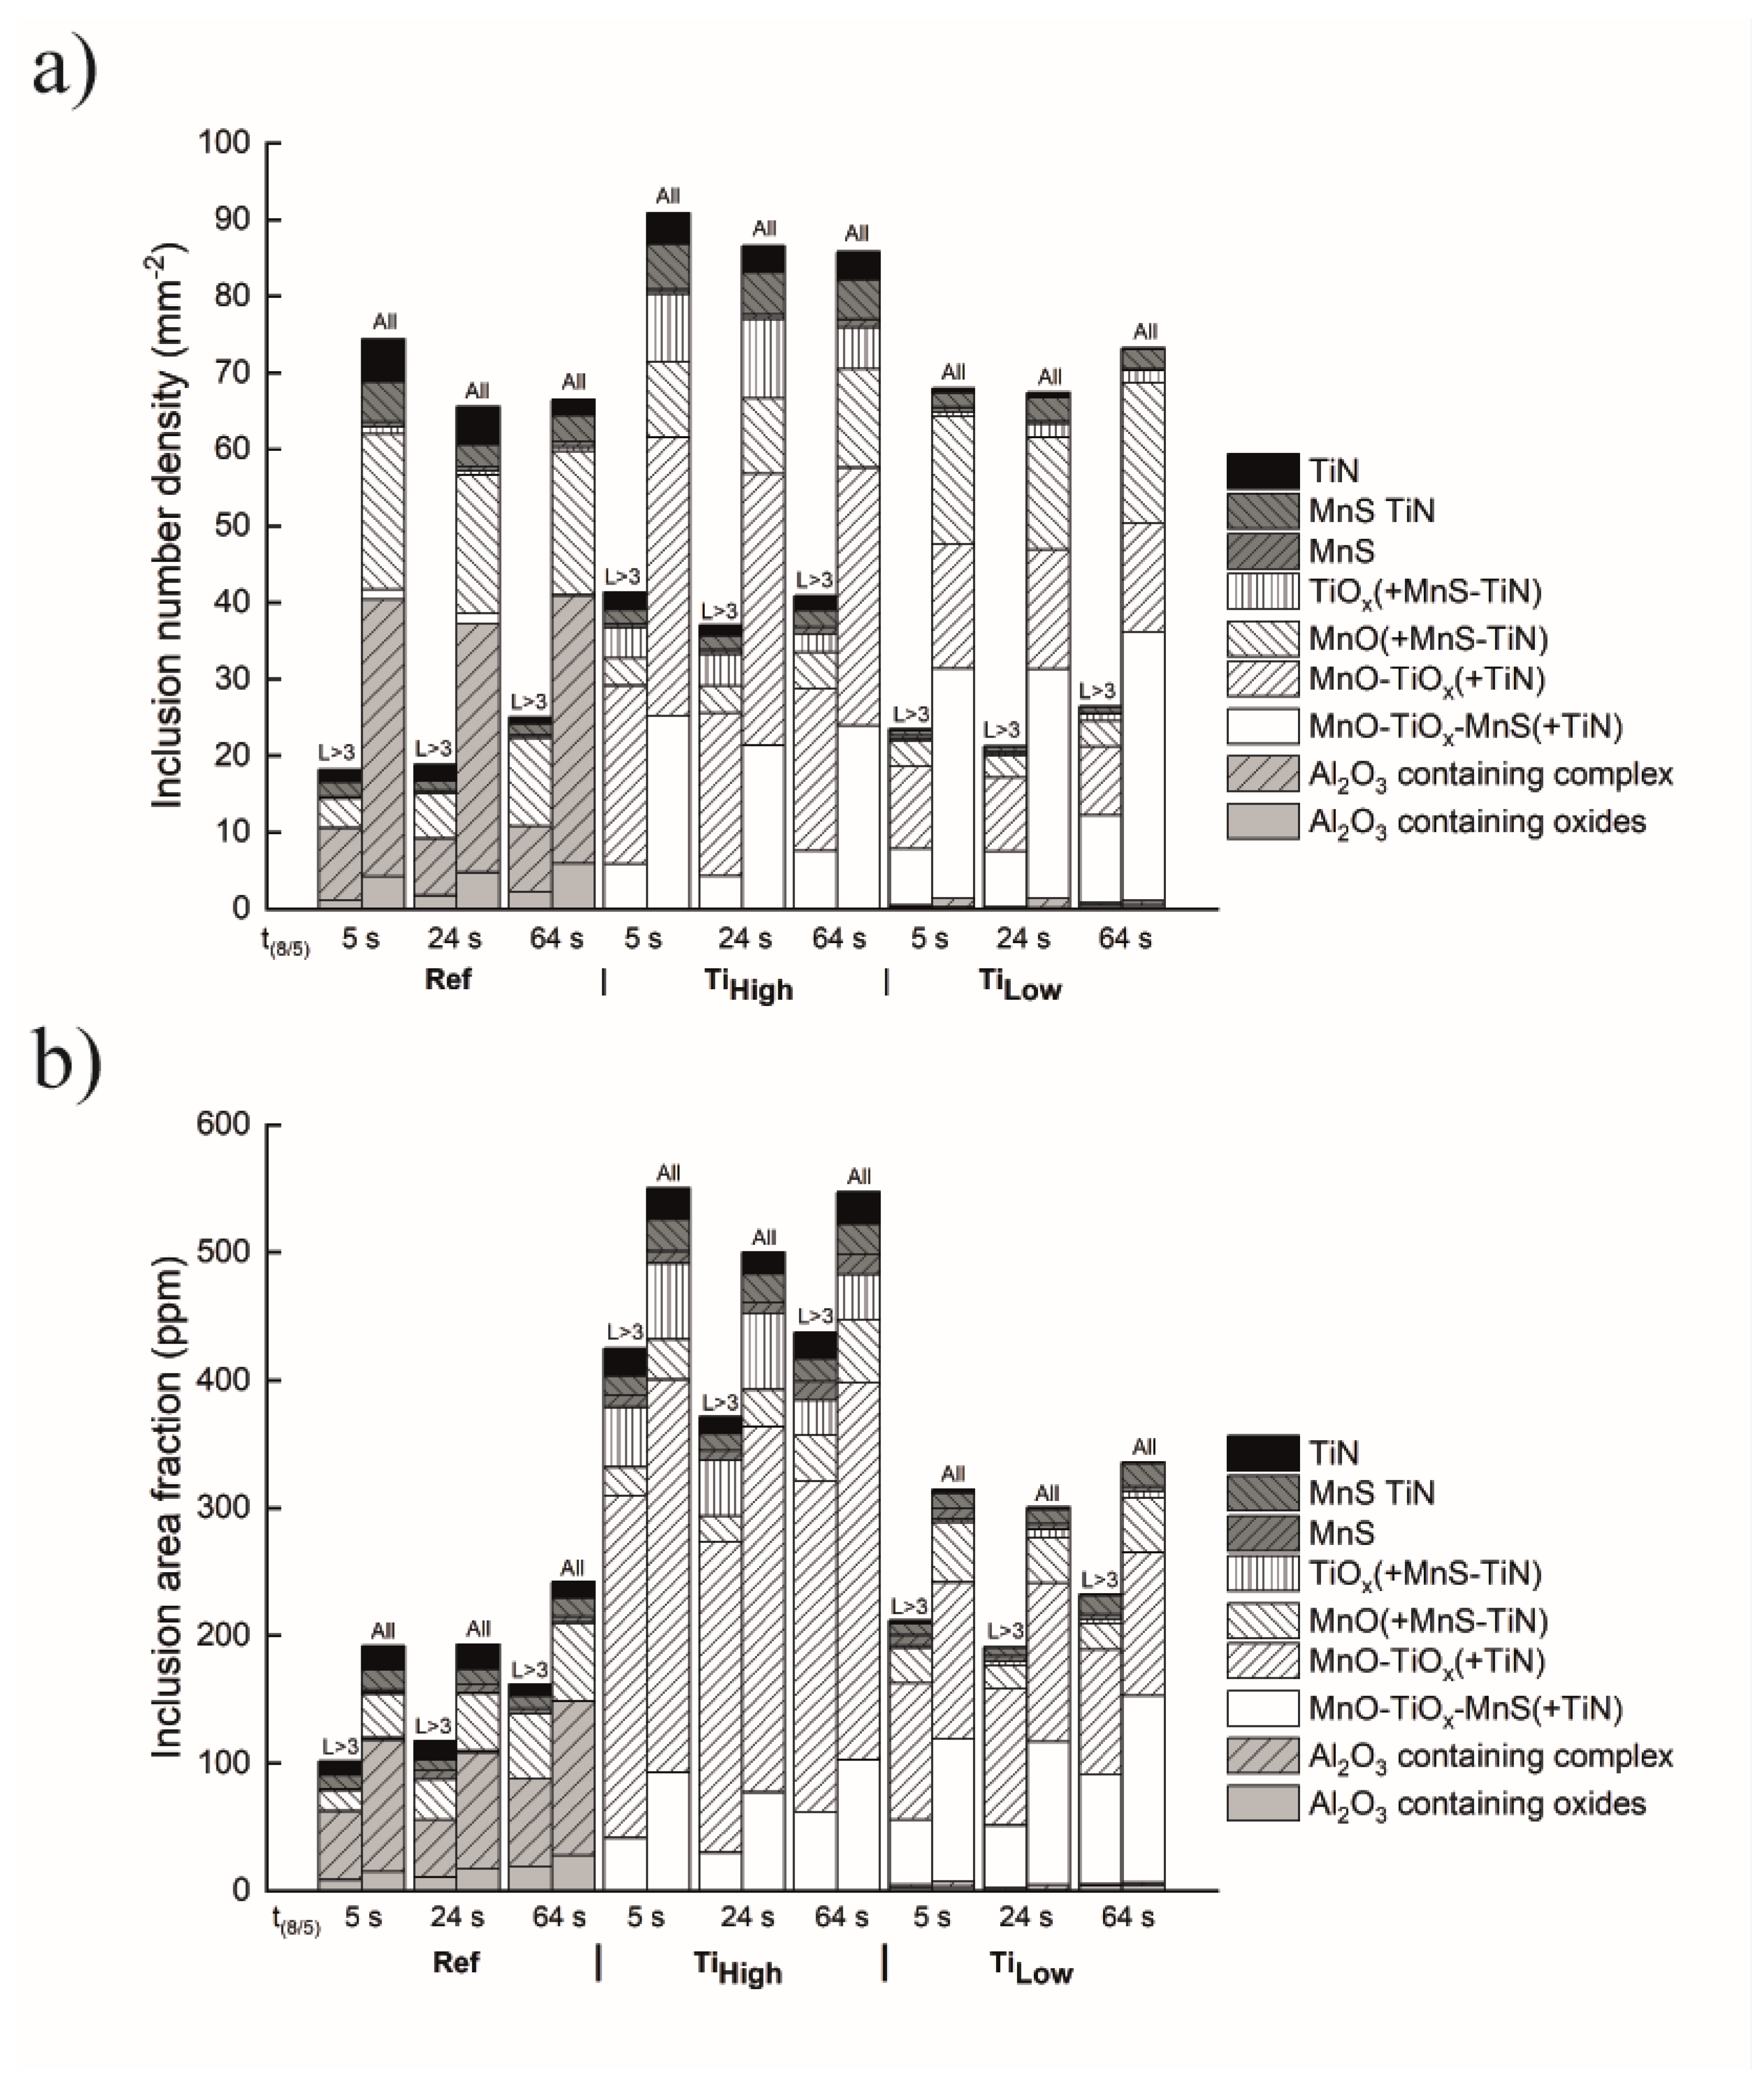
3.4. Role of Inclusions
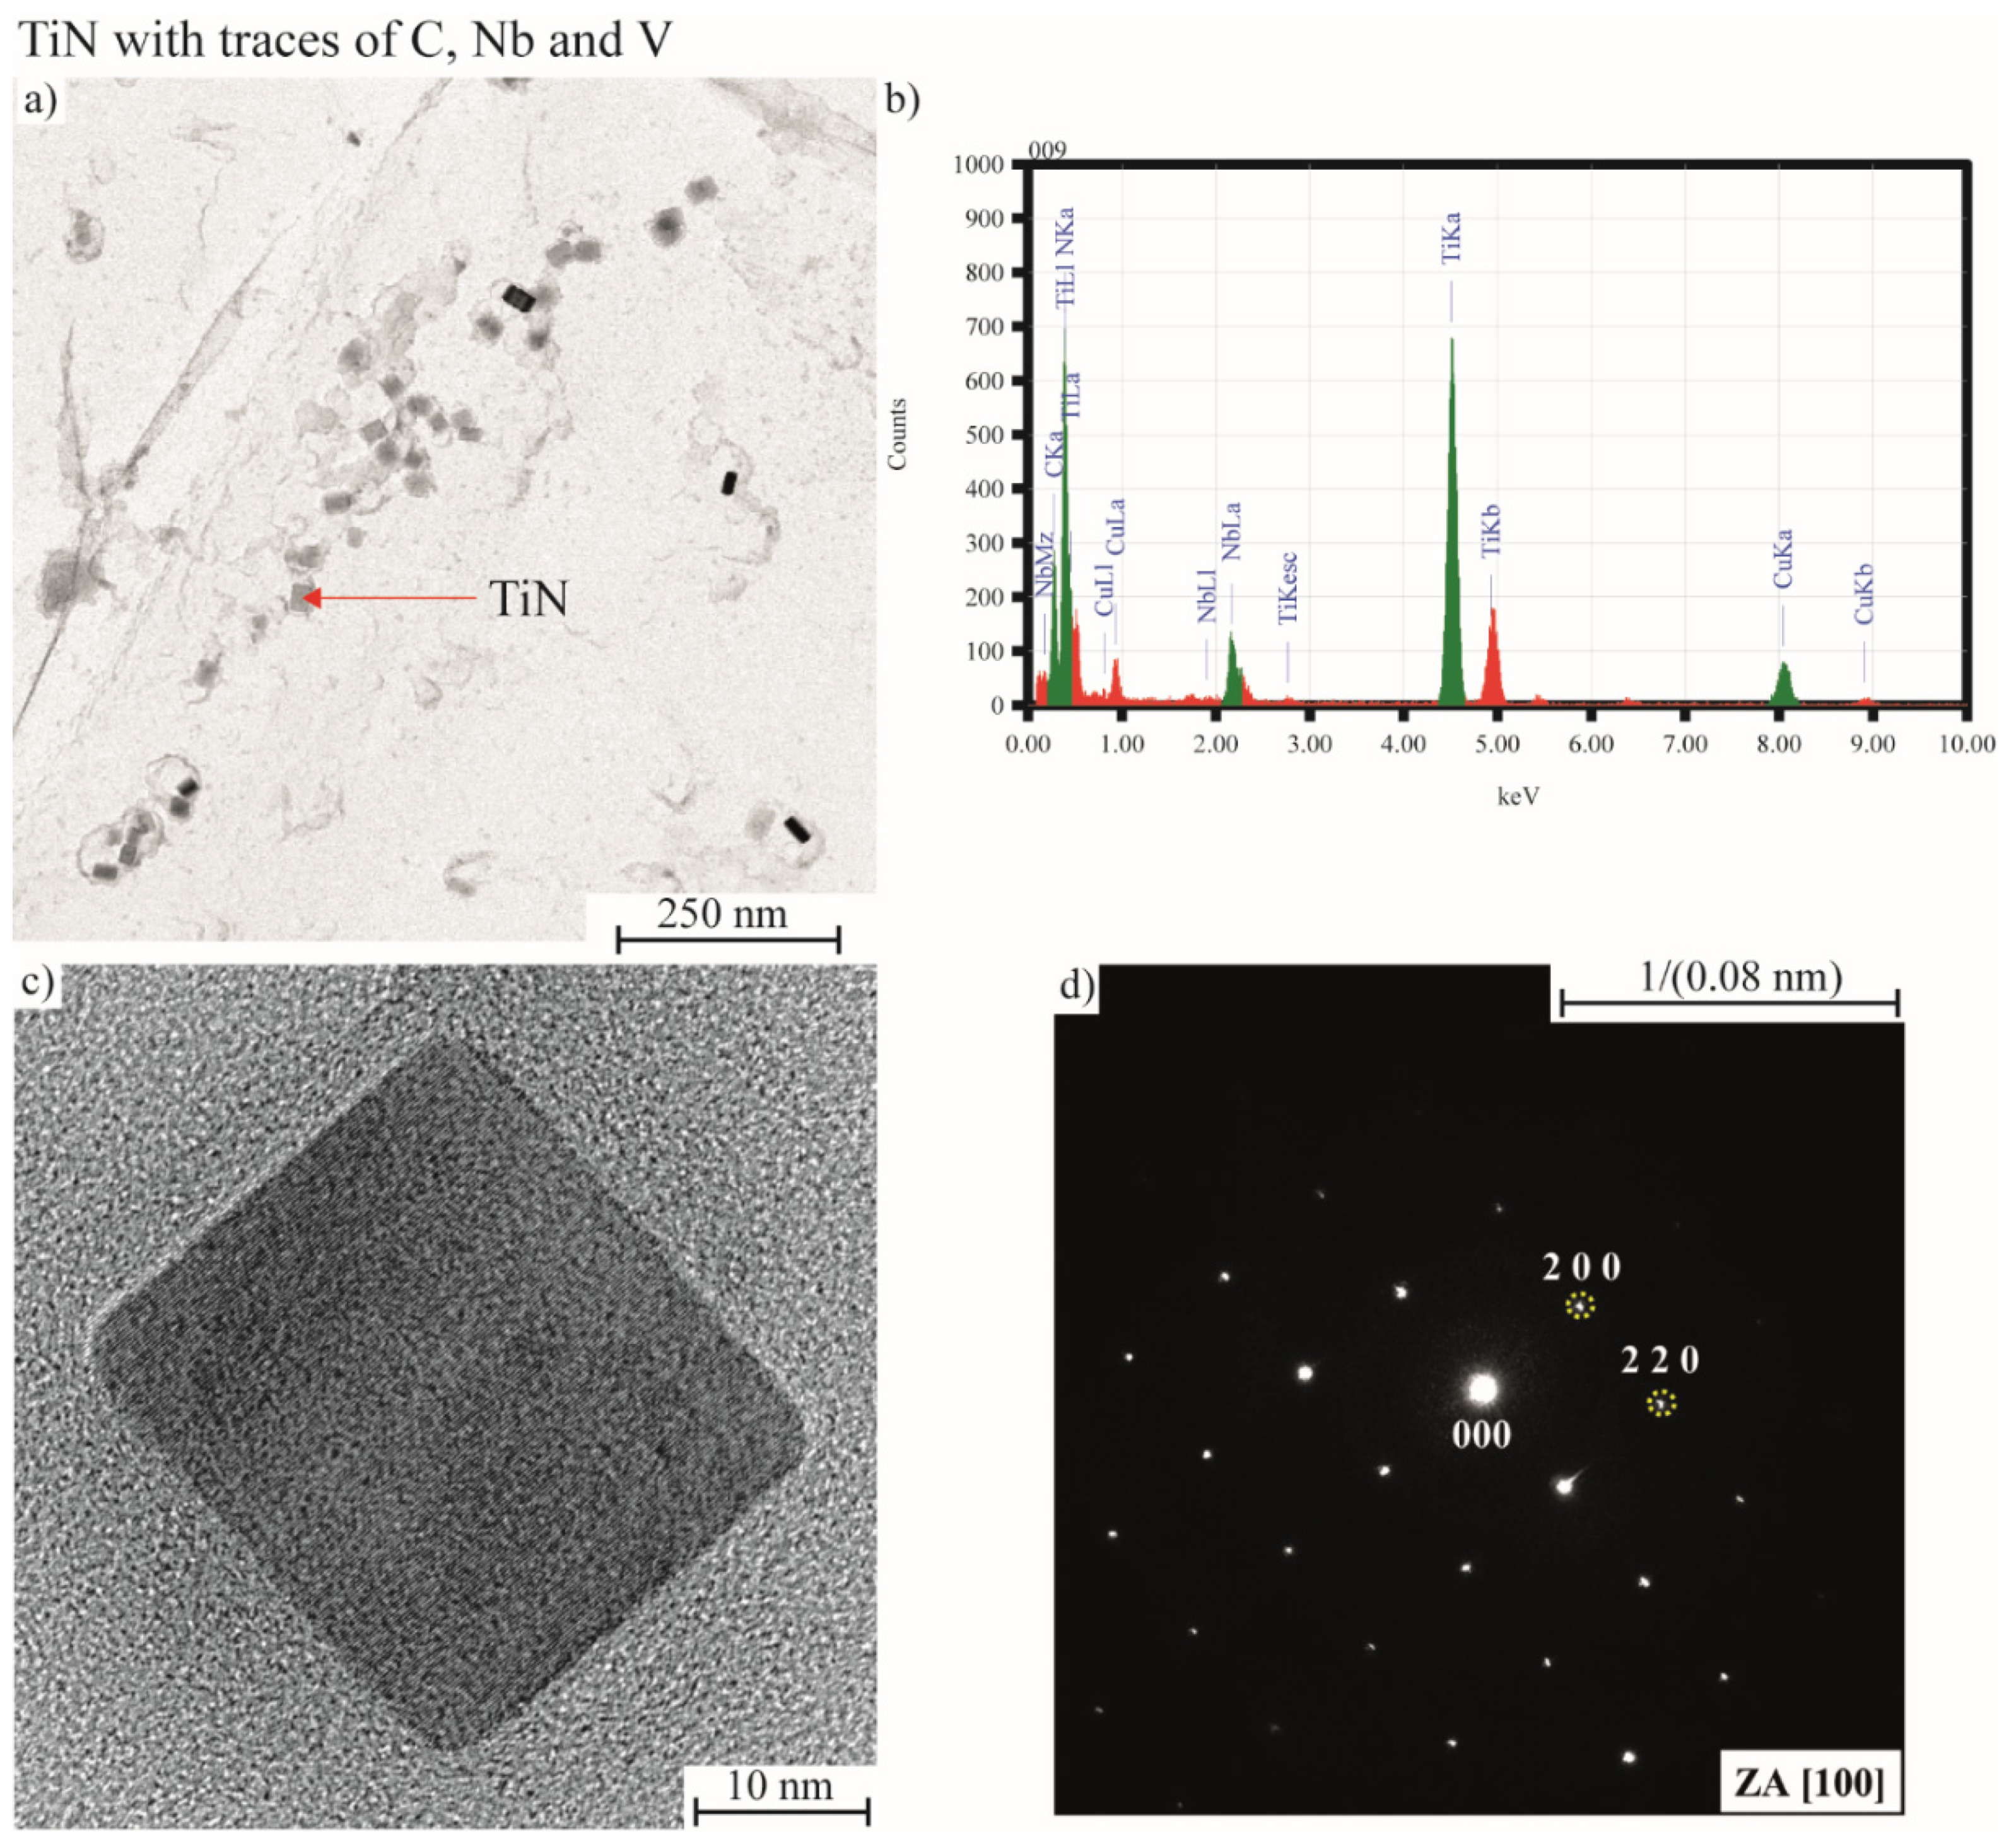
3.5. Precipitates
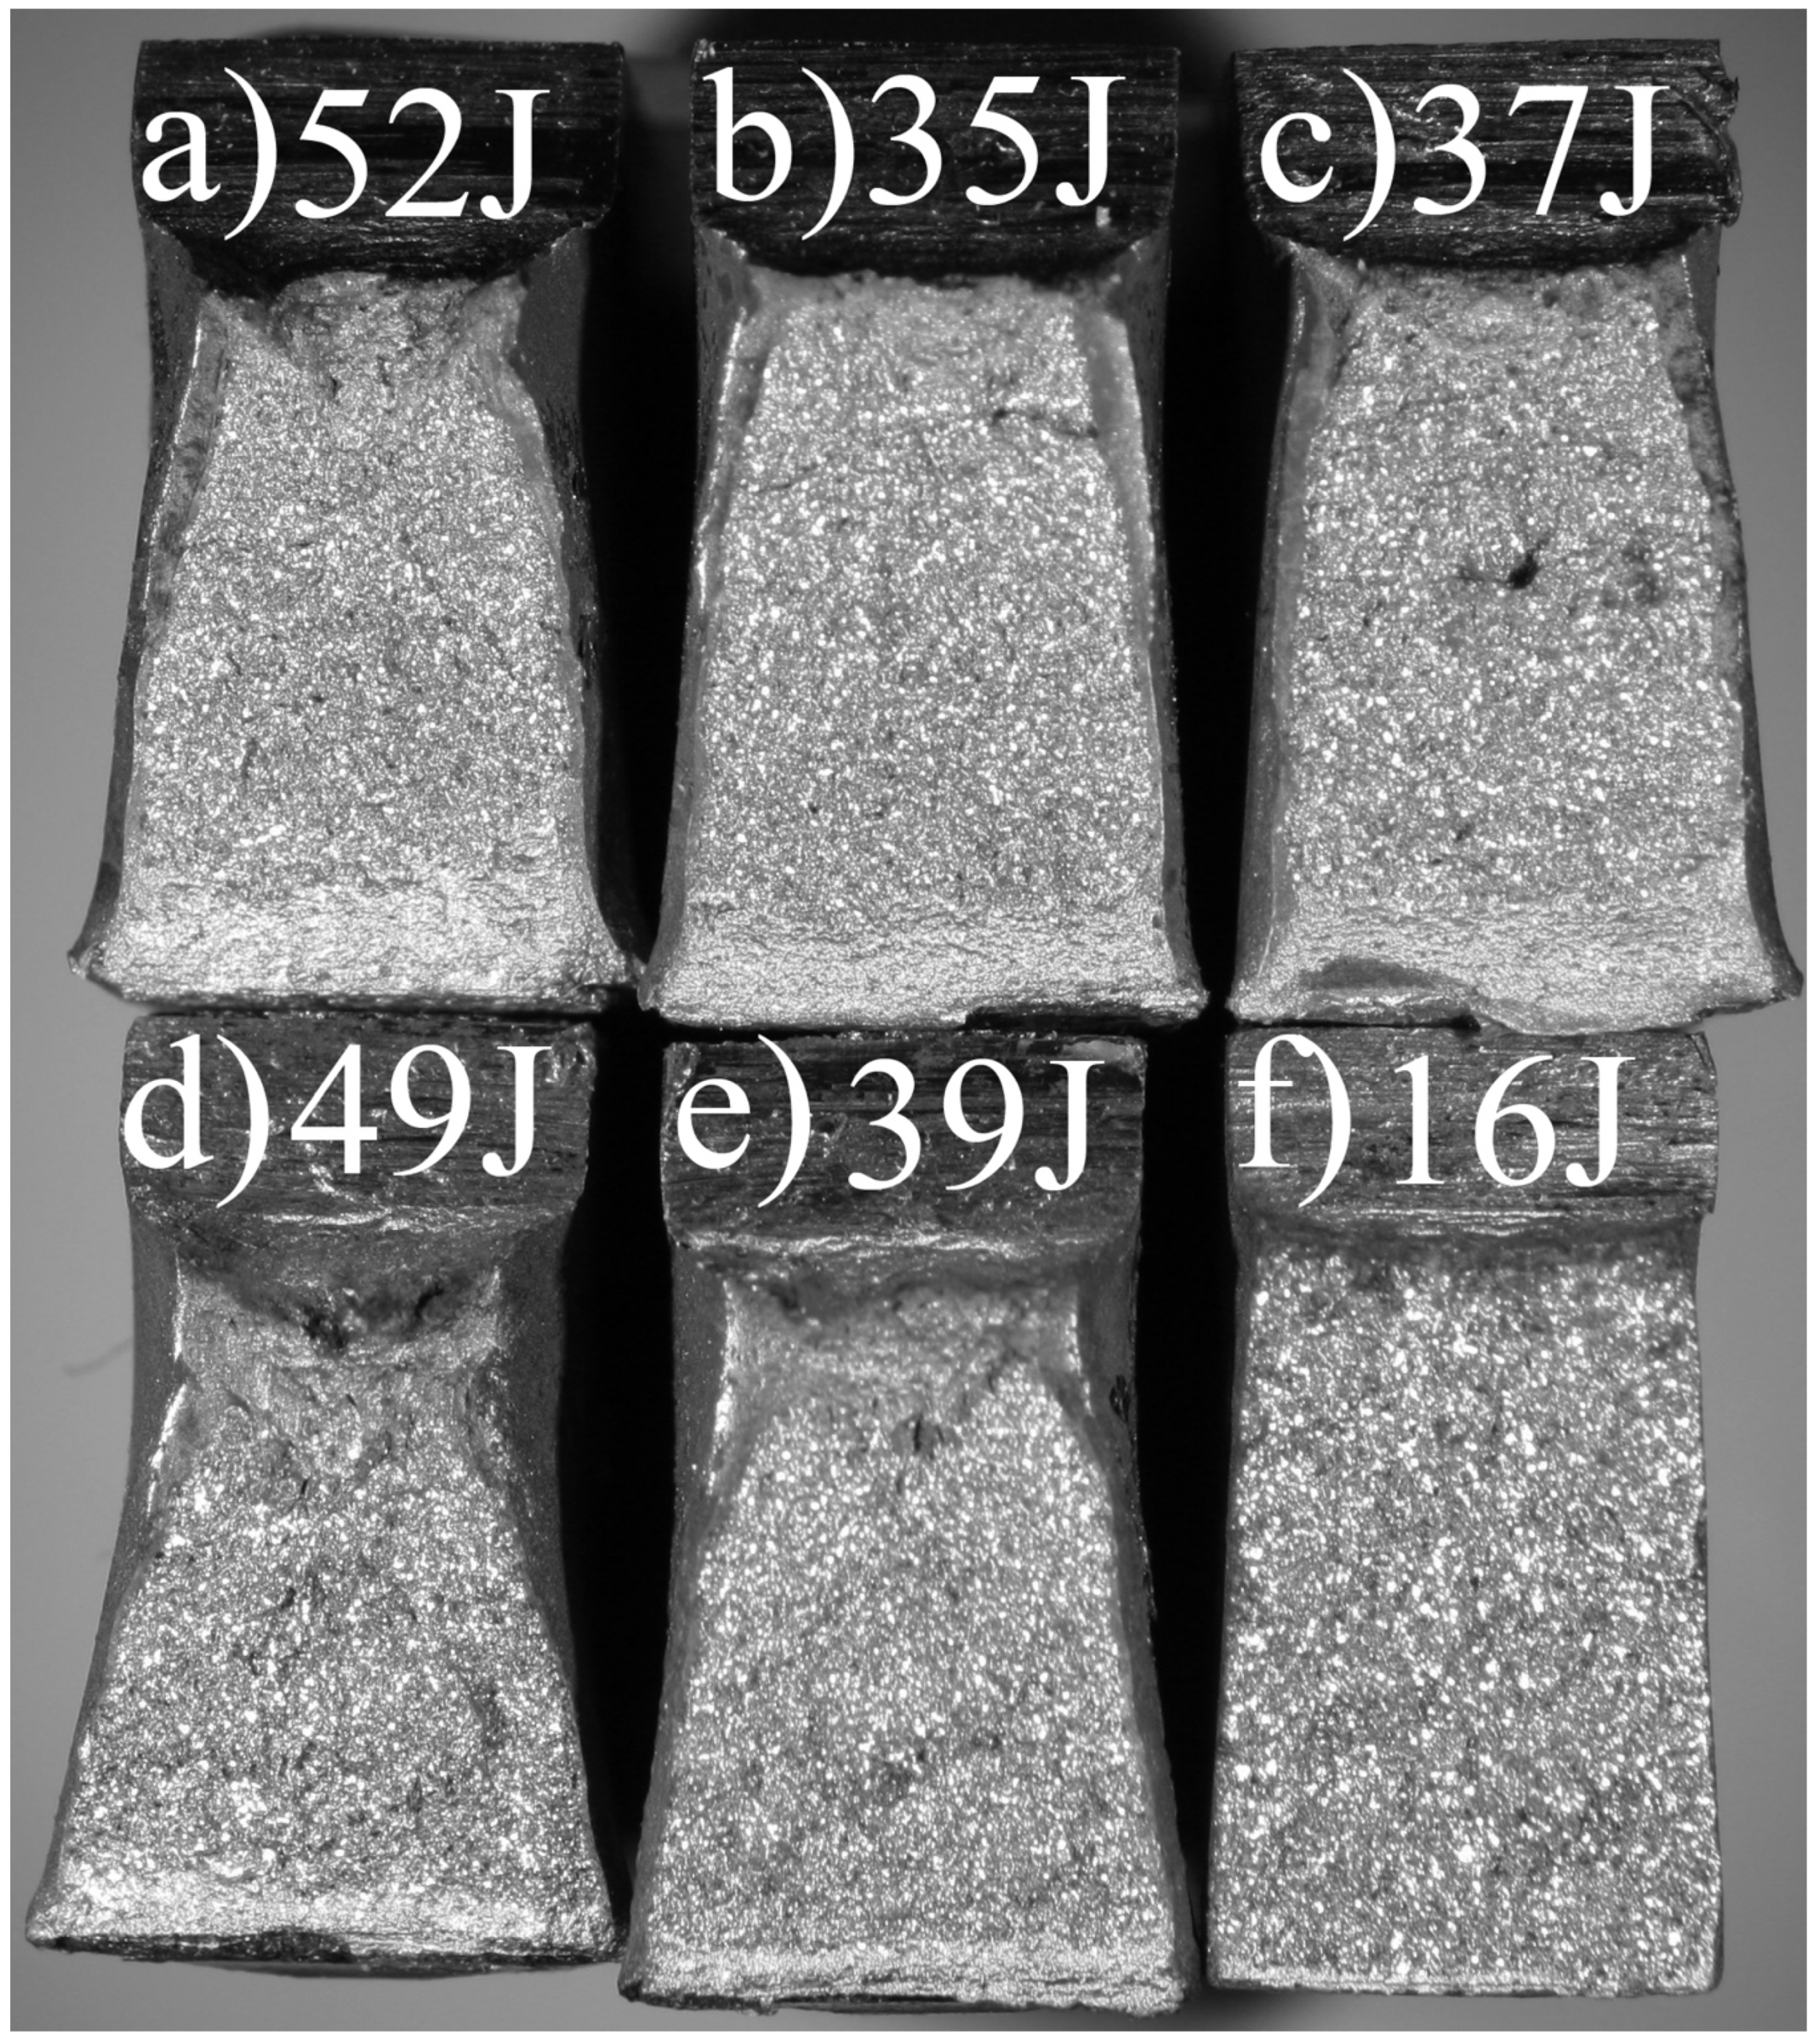
3.6. Fractography
3.7. Regression Modeling
4. Conclusions
Author Contributions
Funding
Institutional Review Board Statement
Informed Consent Statement
Data Availability Statement
Acknowledgments
Conflicts of Interest
References
- Willms, R. High strength steel for steel constructions. In Proceedings of the Nordic Steel Construction Conference, Malmö, Sweden, 2–4 September 2009; pp. 597–604. [Google Scholar]
- SFS SFS-EN 10225: Weldable Structural Steels For Fixed Offshore Structures. Technical Delivery Conditions. 2009. Available online: https://sales.sfs.fi/fi/index/tuotteet/SFS/CEN/ID2/1/772841.html.stx (accessed on 7 October 2021).
- Lan, L.; Qiu, C.; Zhao, D.; Gao, X.; Du, L. Microstructural characteristics and toughness of the simulated coarse grained heat affected zone of high strength low carbon bainitic steel. Mater. Sci. Eng. A 2011, 529, 192–200. [Google Scholar] [CrossRef]
- Di Schino, A. Analysis of heat treatment effect on microstructural features evolution in a micro-alloyed martensitic steel. Acta Met. Slovaca 2016, 22, 266. [Google Scholar] [CrossRef] [Green Version]
- Loder, D.; Michelic, S.K.; Bernhard, C. Acicular ferrite formation and its influencing factors—A review. J. Mater. Sci. Res. 2017, 6, 24–43. [Google Scholar] [CrossRef] [Green Version]
- Sarma, D.S.; Karasev, A.V.; Jönsson, P.G. On the role of non-metallic inclusions in the nucleation of acicular ferrite in steels. ISIJ Int. 2009, 49, 1063–1074. [Google Scholar] [CrossRef] [Green Version]
- Zhang, D.; Terasaki, H.; Komizo, Y. In situ observation of the formation of intragranular acicular ferrite at non-metallic inclusions in C–Mn steel. Acta Mater. 2010, 58, 1369–1378. [Google Scholar] [CrossRef]
- Homma, H.; Ohkita, S.; Matsuda, S.; Yamamoto, K. Improvement of HAZ in HSLA steel by introducing finely dispersed Ti-Oxide. Weld. Res. Suppl. 1987, 66, 301–309. [Google Scholar]
- Laitinen, R. Improvement of Weld HAZ Toughness at Low Heat Input by Controlling the Distribution of M-A Constituents; University of Oulu: Oulu, Finland, 2006. [Google Scholar]
- Haaland, D.; Van Der Eijk, C.; Grong, Ø. The role of interactive particles in steel. In Proceedings of the International Symposium “Safety in Application of High Strength Steel”, Trondheim, Norway, 1–2 July 1997. [Google Scholar]
- Kim, B.; Uhm, S.; Lee, C.; Lee, J.; An, Y. Effects of inclusions and microstructures on impact energy of high heat-input submerged-Arc-weld metals. J. Eng. Mater. Technol. 2005, 127, 204–213. [Google Scholar] [CrossRef]
- Thewlis, G. Transformation kinetics of ferrous weld metals. Mater. Sci. Technol. 1994, 10, 110–125. [Google Scholar] [CrossRef]
- Barbaro, F.J.; Krauklis, P.; Easterling, K.E. Formation of acicular ferrite at oxide particles in steels. Mater. Sci. Technol. 1989, 5, 1057–1068. [Google Scholar] [CrossRef]
- Shim, J.-H.; Cho, Y.; Chung, S.; Shim, J.-D.; Lee, D. Nucleation of intragranular ferrite at Ti2O3 particle in low carbon steel. Acta Mater. 1999, 47, 2751–2760. [Google Scholar] [CrossRef]
- Byun, J.-S.; Shim, J.-H.; Suh, J.-Y.; Oh, Y.-J.; Cho, Y.W.; Shim, J.-D.; Lee, D.N. Inoculated acicular ferrite microstructure and mechanical properties. Mater. Sci. Eng. A 2001, 319–321, 326–331. [Google Scholar] [CrossRef]
- Yamamoto, K.; Matsuda, S.; Haze, T.; Chijiiwa, R.; Mimura, H. A newly developed Ti-Oxide bearing steel having high HAZ toughness. In Residual and Unspecified Elements in Steel; Melilli, A.S., Nisbett, E.G., Eds.; ASTM International: West Conshohocken, PA, USA, 1989; pp. 266–284. ISBN 978-0-8031-5097-3. [Google Scholar]
- Fukunaga, K.; Yoshii, K.; Shinohara, Y.; Yoneda, T.; Watanabe, Y.; Usuki, H.; Iki, H. High Strength TMCP Steel Plate for Offshore Structure with Excellent HAZ Toughness at Welded Joints. 2015. Available online: https://www.nipponsteel.com/en/tech/report/nssmc/pdf/110-08.pdf (accessed on 4 November 2021).
- Tomita, Y.; Saito, N.; Tsuzuki, T.; Tokunaga, Y.; Okamoto, K. Improvement in HAZ toughness of steel by TiN-MnS addition. ISIJ Int. 1994, 34, 829–835. [Google Scholar] [CrossRef]
- Wang, X.; Wang, C.; Kang, J.; Wang, G.; Misra, D.; Yuan, G. Relationship between impact toughness and microstructure for the As-Rolled and simulated HAZ of low-carbon steel containing Ti-Ca oxide particles. Met. Mater. Trans. A 2020, 51, 2927–2938. [Google Scholar] [CrossRef]
- Lee, S.G.; Lee, D.H.; Sohn, S.S.; Kim, W.G.; Um, K.-K.; Kim, K.-S.; Lee, S. Effects of Ni and Mn addition on critical crack tip opening displacement (CTOD) of weld-simulated heat-affected zones of three high-strength low-alloy (HSLA) steels. Mater. Sci. Eng. A 2017, 697, 55–65. [Google Scholar] [CrossRef]
- Huang, G.; Wan, X.L.; Wu, K.M. Effect of Cr content on microstructure and impact toughness in the simulated coarse-grained heat-affected zone of high-strength low-alloy steels. Steel Res. Int. 2016, 87, 1426–1434. [Google Scholar] [CrossRef]
- Xiong, Z.; Liu, S.; Wang, X.; Shang, C.; Li, X.; Misra, R.D.K. The contribution of intragranular acicular ferrite microstructural constituent on impact toughness and impeding crack initiation and propagation in the heat-affected zone (HAZ) of low-carbon steels. Mater. Sci. Eng. A 2015, 636, 117–123. [Google Scholar] [CrossRef]
- Grong, Ø. Metallurgical Modelling of Welding; Bhadeshia, H.K.D.H., Ed.; Materials; The Institute of Materials: Cambridge, UK, 1994. [Google Scholar]
- Tervo, H.; Kaijalainen, A.; Pallaspuro, S.; Anttila, S.; Mehtonen, S.; Porter, D.; Kömi, J. Low-temperature toughness properties of 500 MPa offshore steels and their simulated coarse-grained heat-affected zones. Mater. Sci. Eng. A 2020, 773, 138719. [Google Scholar] [CrossRef]
- Spachinger, S.J.; Ernst, W.; Enzinger, N. Influence of Ti on the toughness of the FGHAZ and the CGHAZ of high-strength microalloyed S700MC steels. Weld. World 2017, 61, 1117–1131. [Google Scholar] [CrossRef]
- Zhang, L.P.; Davis, C.L.; Strangwood, M. Effect of TiN particles and microstructure on fracture toughness in simulated heat-affected zones of a structural steel. Met. Mater. Trans. A 1999, 30, 2089–2096. [Google Scholar] [CrossRef]
- Liang, G.L.; Yang, S.W.; Wu, H.B.; Liu, X.L. Microstructure and mechanical performances of CGHAZ for oil tank steel during high heat input welding. Rare Met. 2013, 32, 129–133. [Google Scholar] [CrossRef] [Green Version]
- Wang, X.-N.; Chen, X.-M.; Wen, F.; Guo, P.-F.; Yang, L.; Yan, Q.; Di, H.-S. Effect of cooling time t 8/5 on microstructure and toughness of Nb–Ti–Mo microalloyed C–Mn steel. J. Iron Steel Res. Int. 2018, 25, 1078–1085. [Google Scholar] [CrossRef]
- Ding, Q.; Wang, T.; Shi, Z.; Wang, Q.; Wang, Q.; Zhang, F. Effect of welding heat input on the microstructure and toughness in simulated CGHAZ of 800 MPa-grade steel for hydropower penstocks. Metals 2017, 7, 115. [Google Scholar] [CrossRef]
- Shi, Z.; Wang, R.; Su, H.; Chai, F.; Wang, Q.; Yang, C. Effect of nitrogen content on the second phase particles in V-Ti microalloyed shipbuilding steel during weld thermal cycling. Mater. Des. 2016, 96, 241–250. [Google Scholar] [CrossRef]
- Kumar, S.; Nath, S.K. Effect of heat input on impact toughness in transition temperature region of weld CGHAZ of a HY 85 steel. J. Mater. Process. Technol. 2016, 236, 216–224. [Google Scholar] [CrossRef]
- Kumar, S.; Nath, S.K.; Kumar, V. Continuous cooling transformation behavior in the weld coarse grained heat affected zone and mechanical properties of Nb-microalloyed and HY85 steels. Mater. Des. 2016, 90, 177–184. [Google Scholar] [CrossRef]
- Zhou, Y.; Jia, T.; Zhang, X.; Liu, Z.; Misra, R.D.K. Microstructure and toughness of the CGHAZ of an offshore platform steel. J. Mater. Process. Technol. 2015, 219, 314–320. [Google Scholar] [CrossRef]
- Lan, L.; Qiu, C.; Zhao, D.; Gao, X.; Du, L. Analysis of martensite-austenite constituent and its effect on toughness in submerged arc welded joint of low carbon bainitic steel. J. Mater. Sci. 2012, 47, 4732–4742. [Google Scholar] [CrossRef]
- Lambert-Perlade, A.; Gourgues, A.F.; Besson, J.; Sturel, T.; Pineau, A. Mechanisms and modeling of cleavage fracture in simulated heat-affected zone microstructures of a high-strength low alloy steel. Met. Mater. Trans. A Phys. Met. Mater. Sci. 2004, 35, 1039–1053. [Google Scholar] [CrossRef]
- Lan, L.; Kong, X.; Qiu, C.; Zhao, D. Influence of microstructural aspects on impact toughness of multi-pass submerged arc welded HSLA steel joints. Mater. Des. 2016, 90, 488–498. [Google Scholar] [CrossRef]
- Tervo, H.; Kaijalainen, A.; Javaheri, V.; Kolli, S.; Alatarvas, T.; Anttila, S.; Kömi, J. Characterization of coarse-grained heat-affected zones in Al and Ti-deoxidized offshore steels. Metals 2020, 10, 1096. [Google Scholar] [CrossRef]
- Gáspár, M. Effect of welding heat input on simulated HAZ areas in S960QL high strength steel. Metals 2019, 9, 1226. [Google Scholar] [CrossRef] [Green Version]
- Luo, X.; Chen, X.; Wang, T.; Pan, S.; Wang, Z. Effect of morphologies of martensite–austenite constituents on impact toughness in intercritically reheated coarse-grained heat-affected zone of HSLA steel. Mater. Sci. Eng. A 2018, 710, 192–199. [Google Scholar] [CrossRef]
- ISO 14556: 2015: Metallic Materials. Charpy V-Notch Pendulum Impact Test. Instrumented Test Method. Available online: https://www.iso.org/standard/63814.html (accessed on 4 November 2021).
- Javaheri, V.; Pohjonen, A.; Asperheim, J.I.; Ivanov, D.; Porter, D. Physically based modeling, characterization and design of an induction hardening process for a new slurry pipeline steel. Mater. Des. 2019, 182, 108047. [Google Scholar] [CrossRef]
- DeArdo, A.J.; Garcia, C.I.; Cho, K.; Hua, M. New method of characterizing and quantifying complex microstructures in steels. Mater. Manuf. Process. 2010, 25, 33–40. [Google Scholar] [CrossRef]
- Nyyssönen, T.; Isakov, M.; Peura, P.; Kuokkala, V.-T. Iterative determination of the orientation relationship between austenite and martensite from a large amount of grain pair misorientations. Met. Mater. Trans. A 2016, 47, 2587–2590. [Google Scholar] [CrossRef]
- Nyyssönen, T.; Peura, P.; Kuokkala, V.-T. Crystallography, morphology, and martensite transformation of prior austenite in intercritically annealed high-aluminum steel. Met. Mater. Trans. A 2018, 49, 6426–6441. [Google Scholar] [CrossRef]
- Javaheri, V.; Nyyssönen, T.; Grande, B.; Porter, D. Computational design of a novel medium-carbon, low-alloy steel microalloyed with niobium. J. Mater. Eng. Perform. 2018, 27, 2978–2992. [Google Scholar] [CrossRef] [Green Version]
- Javaheri, V.; Kolli, S.; Grande, B.; Porter, D. Insight into the induction hardening behavior of a new 0.40% C microalloyed steel: Effects of initial microstructure and thermal cycles. Mater. Charact. 2019, 149, 165–183. [Google Scholar] [CrossRef] [Green Version]
- Kurdjumow, G.; Sachs, G. Uber den mechanismus der stahlhärtung. Zeitschrift für Physik 1930, 64, 325–343. [Google Scholar] [CrossRef]
- Ali, M.; Porter, D.; Kömi, J.; Eissa, M.; El Faramawy, H.; Mattar, T. Characterization of the microstructure and precipitates formed during the thermomechanical processing of a CrNiMoWMnV ultrahigh-strength steel. Steel Res. Int. 2020, 91, 1900580. [Google Scholar] [CrossRef]
- Ali, M.; Porter, D.; Kömi, J.; Eissa, M.; El Faramawy, H.; Mattar, T. The effect of electroslag remelting on the microstructure and mechanical properties of CrNiMoWMnV ultrahigh-strength steels. Metals 2020, 10, 262. [Google Scholar] [CrossRef] [Green Version]
- Zajac, S.; Komenda, J.; Morris, P.; Matera, S.; Penalba Diaz, F. Quantitative Structure-Property Relationships for Complex. Bainitic Microstructure. RFCS Final Report; European Commission: Luxembourg, 2005. [Google Scholar]


| Steel | C | Si | Mn | P | S | Al | Nb | V | Ti | N | O | Others |
|---|---|---|---|---|---|---|---|---|---|---|---|---|
| Ref | 0.05 | 0.01 | 1.6 | 0.005 | 0.003 | 0.037 | 0.01 | 0.01 | 0.016 | 0.006 | 0.0023 | Cr, Mo, Cu, |
| Tihigh | 0.05 | 0.03 | 1.7 | 0.005 | 0.003 | 0.002 | 0.01 | 0.07 | 0.027 | 0.006 | 0.0080 | Ni in equal |
| Tilow | 0.05 | 0.23 | 1.7 | 0.007 | 0.003 | 0.003 | 0.01 | 0.07 | 0.016 | 0.008 | 0.0047 | proportions |
| Cooling Time (s) | Temp (°C) | Ref (J) | Tihigh (J) | Tilow (J) |
|---|---|---|---|---|
| 5 | −60 | 47 ± 30 | 34 ± 1 | 38 ± 2 |
| −80 | 26 ± 18 | 19 ± 9 | 28 ± 4 | |
| 24 | −40 | 89 ± 4 * | 69 ± 4 | 63 ± 7 |
| −60 | 83 ± 7 | 49 ± 6 | 55 ± 4 | |
| 64 | −60 | 68 ± 14 * | 40 ± 6 | 23 ± 19 |
| −80 | 39 ± 23 | 4 ± 1 | 5 ± 1 |
| Cooling Time (s) | Ref | Tihigh | Tilow | ||||||
|---|---|---|---|---|---|---|---|---|---|
| Ei (J) | Ep (J) | Ea (J) | Ei (J) | Ep (J) | Ea (J) | Ei (J) | Ep (J) | Ea (J) | |
| 5 | 29 | 19 | 4 | 26 | 7 | 0 | 37 | 10 | 1 |
| 5 | 13 | 0 | 0 | 26 | 9 | 0 | 29 | 6 | 1 |
| 5 | 32 | 34 | 8 | 25 | 9 | 1 | 26 | 13 | 1 |
| 24 | 37 | 52 | 0 | 28 | 17 | 0 | 33 | 19 | 0 |
| 24 | 33 | 40 | 5 | 29 | 24 | 0 | 33 | 25 | 0 |
| 64 | 25 | 24 | 0 | 24 | 15 | 0 | 11 | 0 | 0 |
| 64 | 30 | 46 | 4 | 27 | 21 | 0 | 16 | 0 | 0 |
| 64 | 30 | 33 | 1 | 23 | 14 | 0 | 14 | 0 | 0 |
| 64 | 29 | 43 | 4 | 29 | 6 | 0 | 28 | 22 | 0 |
| Microstructure | Ref 5 s | Tihigh 5 s | Tilow 5 s | Ref 24 s | Tihigh 24 s | Tilow 24 s | Ref 64 s | Tihigh 64 s | Tilow 64 s |
|---|---|---|---|---|---|---|---|---|---|
| Acicular Ferrite | - | - | 19 | - | - | 28 | 13 | 22 | 46 |
| Plate-Like Bainite | 44 | 50 | 44 | 60 | 64 | 52 | 66 | 65 | 28 |
| Lath Bainite | 13 | 21 | 32 | 15 | 8 | 13 | 15 | 8 | 15 |
| Polygonal Ferrite | 3 | 1 | 4 | 3 | 6 | 6 | 4 | 4 | 8 |
| Granular Bainite | 35 | 22 | - | 20 | 22 | - | - | - | - |
| Martensite | 6 | 7 | 2 | 3 | 2 | 2 | 3 | 2 | 3 |
| Retained Austenite * | 1.48 ± 0.06 | 2.02 ± 0.07 | 2.30 ± 0.07 | 1.59 ± 0.06 | 2.97 ± 0.16 | 4.02 ± 0.12 | 1.14 ± 0.04 | 3.45 ± 0.05 | 3.38 ± 0.04 |
| Cγ | 1.07 | 0.94 | 0.56 | 0.83 | 0.95 | 1.07 | 1.05 | 1.02 | 0.92 |
| Data Type | Ref 5 s | Tihigh 5 s | Tilow 5 s | Ref 24 s | Tihigh 24 s | Tilow 24 s | Ref 64 s | Tihigh 64 s | Tilow 64 s |
|---|---|---|---|---|---|---|---|---|---|
| Median (µm) | 1.54 | 1.37 | 1.26 | 1.84 | 2.44 | 1.61 | 1.37 | 1.93 | 1.04 |
| 95th percentile (µm) | 8.76 | 8.54 | 6.27 | 15.40 | 15.62 | 11.22 | 14.15 | 14.19 | 10.39 |
| D80% (µm) | 14.27 | 11.20 | 8.92 | 21.71 | 20.71 | 17.49 | 20.66 | 23.05 | 22.08 |
| Data Type | Ref 5 s | Tihigh 5 s | Tilow 5 s | Ref 24 s | Tihigh 24 s | Tilow 24 s | Ref 64 s | Tihigh 64 s | Tilow 64 s |
|---|---|---|---|---|---|---|---|---|---|
| No. of precipitates | 305 | 709 | 230 | 375 | 340 | 299 | 470 | 603 | 551 |
| Average ECD (nm) | 31 | 38 | 35 | 29 | 39 | 39 | 32 | 36 | 32 |
| Confidence Level (95%) | 2 | 1 | 3 | 1 | 2 | 3 | 2 | 1 | 1 |
| D90% (nm) | 62 | 94 | 113 | 50 | 80 | 101 | 94 | 80 | 62 |
| Min. ECD (nm) | 16 | 18 | 20 | 20 | 20 | 17 | 10 | 19 | 16 |
| Max. ECD (nm) | 143 | 160 | 147 | 226 | 138 | 208 | 138 | 189 | 178 |
| Parameter | Model A | Model B | Model C | Model D | Model E |
|---|---|---|---|---|---|
| n | 27 | 52 | 54 | 53 | 54 |
| Constant | 23.9 | * | ** | *** | **** |
| Plate-like bainite | 1.183 | 0.802 | 0.223 | 0.421 | - |
| Lath-like bainite | - | - | - | −0.445 | - |
| Acicular ferrite | - | - | −0.331 | - | - |
| ECD 90% | - | - | - | - | −0.044 |
| Retained austenite | - | -6.27 | - | −4.20 | −1.198 |
| Inclusions > 3 µm/mm2 | −1.343 | −1.130 | - | −0.721 | - |
| MnS TiN > 3 µm/mm2 | - | - | −9.650 | - | - |
| R-sq(adj) | 0.57 | 0.85 | 0.69 | 0.78 | 0.66 |
| SE | 14 | 10 | 6 | 7 | 2 |
| Model A = CVN absorbed energy at −60 °C Model B = CVN absorbed energy at −80…−40 °C, two outliers (±3SD) removed * 29.45 (−80 °C), 54.55 (−60 °C) and 73.58 (−40 °C) Model C = CVN crack initiation energy at −80…−40 °C ** 23.61 (−80 °C), 33.85 (−60 °C) and 34.16 (−40 °C) Model D = CVN crack propagation energy at −80…−40 °C *** 21.99 (−80 °C), 36.02 (−60 °C) and 46.10 (−40 °C) Model E = CVN crack arrest energy at −80…−40 °C **** 6.54 (−80 °C), 7.69 (−60 °C) and 12.73 (−40 °C) | |||||
Publisher’s Note: MDPI stays neutral with regard to jurisdictional claims in published maps and institutional affiliations. |
© 2021 by the authors. Licensee MDPI, Basel, Switzerland. This article is an open access article distributed under the terms and conditions of the Creative Commons Attribution (CC BY) license (https://creativecommons.org/licenses/by/4.0/).
Share and Cite
Tervo, H.; Kaijalainen, A.; Javaheri, V.; Ali, M.; Alatarvas, T.; Mehtonen, M.; Anttila, S.; Kömi, J. Comparison of Impact Toughness in Simulated Coarse-Grained Heat-Affected Zone of Al-Deoxidized and Ti-Deoxidized Offshore Steels. Metals 2021, 11, 1783. https://doi.org/10.3390/met11111783
Tervo H, Kaijalainen A, Javaheri V, Ali M, Alatarvas T, Mehtonen M, Anttila S, Kömi J. Comparison of Impact Toughness in Simulated Coarse-Grained Heat-Affected Zone of Al-Deoxidized and Ti-Deoxidized Offshore Steels. Metals. 2021; 11(11):1783. https://doi.org/10.3390/met11111783
Chicago/Turabian StyleTervo, Henri, Antti Kaijalainen, Vahid Javaheri, Mohammed Ali, Tuomas Alatarvas, Mikko Mehtonen, Severi Anttila, and Jukka Kömi. 2021. "Comparison of Impact Toughness in Simulated Coarse-Grained Heat-Affected Zone of Al-Deoxidized and Ti-Deoxidized Offshore Steels" Metals 11, no. 11: 1783. https://doi.org/10.3390/met11111783
APA StyleTervo, H., Kaijalainen, A., Javaheri, V., Ali, M., Alatarvas, T., Mehtonen, M., Anttila, S., & Kömi, J. (2021). Comparison of Impact Toughness in Simulated Coarse-Grained Heat-Affected Zone of Al-Deoxidized and Ti-Deoxidized Offshore Steels. Metals, 11(11), 1783. https://doi.org/10.3390/met11111783