Article

Effect of Al Content on Phase Compositions of FeNiCoCrMo0.5Alx High Entropy Alloy

1
Institute of Mechanical Engineering, Materials and Transport, Peter the Great St. Petersburg Polytechnic University (SPbPU), Polytechnicheskaya 29, 195251 St. Petersburg, Russia
2
Institute of Laser and Welding Technologies, State Marine Technical University, Lotsmanskaya Ulitsa, 10, 190121 St. Petersburg, Russia
*
Author to whom correspondence should be addressed.
Metals 2021, 11(11), 1734; https://doi.org/10.3390/met11111734
Submission received: 29 September 2021 / Revised: 18 October 2021 / Accepted: 22 October 2021 / Published: 29 October 2021
(This article belongs to the Special Issue Advanced Manufacturing of Novel Metallic Related Materials)

Abstract

:
The FeCoNiCrMo0.5Alx system with x up to 2.13 was analyzed from the point of view of evolution of the phase composition and microstructure. Cast samples were synthesized by induction melting and analyzed by X-ray diffraction, energy dispersive spectroscopy, scanning electron microscopy, and Vickers microhardness test methods. Phase compositions of these alloys in dependance on Al concentration consist of FCC solid solution, σ-phase, NiAl-based B2 phase, and BCC solid solution enriched with Mo and Cr. Phase formation principles were studied. Al dissolves in a FeCoNiCrMo0.5 FCC solid solution up to 8 at.%.; at higher concentrations, Al attracts Ni, removing it from FCC solid solution and forming the B2 phase. Despite Al not participating in σ-phase formation, an increase in Al concentration to about 20 at.% leads to a growth in the σ-phase fraction. The increase in the σ-phase was caused by an increase in the amount of B2 because the solubility of σ-forming Mo and Cr in B2 was less than that in the FCC solution. A further increase in Al concentration led to an excess of Mo and Cr in the solution, which formed a disordered BCC solid solution. The hardness of the alloys attained the maximum of 630 HV at 22 and 32 at.% Al.

1. Introduction

The concept of high-entropy alloys (HEA) arose in 2004. It was initiated by the works of Cantor et al. [1] and Yeh et al. [2]. In the former [1], there was a single-phase five component Fe20Cr20Mn20Ni20Co20 alloy reported [1], after that, this composition was named the Cantor alloy. In the latter [2], the idea of high entropy stabilization of multi-principal solid solution was proposed, and the term “high-entropy alloys” was introduced. It was postulated that high entropy promotes the formation of disordered substitutional solid solutions instead of intermetallic phases due to a decrease in free energy. Later in [3,4], based on the experimental data, other criteria of multicomponent solid-solution stabilization have been proposed, namely, atomic-size difference (δ), which should not be higher than 6.6%; mixing enthalpy of solid solution (∆Hmix), which should be in the range of −15–5 KJ/mol; and Ω, defined as Tm∆Smix/|∆Hmix|, which should be ≥1.1. However, these values are based on back-tested correlations, and have little evidence of predictive capability [5]. The unique features attributed to HEA such as solid solution strengthening due to severe lattice-distortion, sluggish diffusion, and the cocktail effect [5,6,7], were supposed to be caused by the multiprincipal solid solution effect, so in this context, the term HEA should refer to single-phase multiprincipal alloys [8]. However, the majority of HEA considered nowadays in the equilibrium state at an ambient temperature has several phases [9,10,11,12,13,14,15,16,17,18,19,20,21,22,23,24,25], even those that were considered to be single-phase in early research [16,17]. It is likely that during solidification, the different atoms distribute in accordance with their affinity, leading to liquation, namely, the appearance of regions of different compositions not satisfying the criteria of solid solution formation. On the other hand, when the temperature is lowered, the effect of entropy decreases, so the solid solution tends to decompose or order, but due to sluggish diffusion, these processes may go slowly, and so are not completed at ambient conditions [8,17]. Precipitation behavior in HEA is complex and abstruse and may induce the formation of useful properties as well as their deterioration and instability. Currently, methods are being developed to predict the formation and stability of HEA taking into account the formation enthalpies of competing phases [13,26]. To date, among all the others that ever proposed HEA, the alloys based on an AlCoCrFeNi system have been the most studied [2,5,9,10,11,12,13,14,15,19,20,21,22,23,24,25]. The reason for this are the outstanding mechanical properties and phase formation phenomena. In AlCoCrFeNi alloys, Al has the largest impact on the structure: a crystal structure transforms from FCC to BCC as the Al content increases [2]. In [27], an effect of valence electron concentration (VEC) on the stability of FCC and BCC solid solutions was demonstrated: the FCC solid solution was found to be stable at higher VEC and instead, BCC phase is stable at lower VEC (<6.87). In [28], the effect of Al on the crystal structures was analyzed using first-principles electronic structure calculations. It was demonstrated that due to strongly attractive interactions between Al and other elements, partially disordered structures (L12, DO3, and B2) became more stable than the disordered solid solutions. As a result, the elements segregate, forming Ni-Al-rich and Fe-Cr-rich areas [9,13,15,22]. Cr and Fe stabilize the BCC structure [11,12,28], while Ni and Co stabilize the FCC solid solution [10,22,28]. Compared to disordered solid solutions, ordered BCC (B2) compounds based on NiAl have a unique set of strength characteristics at elevated and high temperatures, and their strength practically does not degrade up to temperatures of 800–900 °C [29]. The high hardness of AlCrFeCoNi and AlCrFeCoNiTi alloys was attributed namely to the formation of the NiAl-B2 phase [19,20]. Partially disordered NiAl-based B2 alloys with refractory metals may be considered as promising structural materials for high-temperature applications [29]. An addition of Nb to AlCoCrFeNi studied in [30] results in the formation of a Laves phase of the (CoCr)Nb type and BCC solid solution and an increase in strength and hardness. An effect of V addition was studied in [31] and it was found that V addition reduces element segregation and homogenizes the microstructure. An addition of Mo significantly increased the strength and thermal stability of CoCrFeNiMo alloys, and the effect was caused by the σ or σ and μ phase formation [32,33]. The σ-phase occurs in the majority of transition-metal alloys [16,17,21,23,33,34,35,36]. It is a hard and brittle topologically close packed phase, and its appearance in stainless steels usually results in the deterioration of the properties due to brittleness and the removal of Cr from the solid solution matrix [35,36].
In this work, the AlxFeCoNiCrMo system was analyzed from the point of view of the evolution of phase composition and microstructure. Mo is a refractory metal and is added to AlCoCrFeNi with the aim to increase alloy strength and thermal stability, however, it is known to be a strong promoter of the σ-phase. Al, in contrast, suppresses σ-phase formation, and tends to form an ordered NiAl-based B2 structure with high strength characteristics at elevated and high temperatures. Thus, AlxFeCoNiCrMo HEA may be considered as promising structural materials for high-temperature applications, and understanding of the phase formation principles and structure stability in this system is necessary for the development of further alloys. The aim of the study was to observe and analyze the effect of Al concentration on the crystal structure of HEA containing Mo.

2. Materials and Methods

A series of multicomponent alloys of the FeNiCoCrMo0.5Alx system with x varying from 0 to 2.13 (0–32 at.% Al) were melted in a high-frequency induction furnace in quartz crucibles under an argon atmosphere. Elemental components with a purity of 99.93% or greater were used. The induction melting process took about 2 min, then the samples were cooled in water. Melting of refractory elements occurred via their gradual dissolution in the melt. For homogenization of the melts, the alloys were remelted three times. The prepared ingots were approximately 30 g. The designation of the samples and the exact composition of the ingots are presented in Table 1.
Scanning electron microscopy (SEM) and energy dispersion spectroscopy (EDS) were performed on using a MIRA 3 microscope (TESCAN, Brno-Kohoutovice Czech Republic). In order to determine the volume fraction of the structural components, the images of the microstructures were analyzed with the software THIXOMET (THIXOMET Pro, Thixomet, Saint-Petersburg, Russia).
The phase composition was examined with a D8 Advance diffractometer (BRUKER, Billerica, MA, USA) under Cu Ka radiation. The solid solution lattice parameter was determined based on the XRD patterns, which were collected in the 2Θ range from 20° to 140° with a speed of 2°/min. In order to eliminate the systematic error, the definition of the lattice parameter was calculated using the Nelson–Riley extrapolation function [36]. For convenience, we calculated the shortest interatom distance for each cubic lattice using the lattice parameters determined by XRD. The shortest interatomic distance for FCC was ½ [110] and ½ [111] for BCC. Quantitative phase analysis was fulfilled using DIFFRAC.EVA software (DIFFRAC.EVA V6, BRUKER, Billerica, MA, USA).
Vickers microhardness was tested with a Micromet 5103 (BUEHLER, Lake Bluff, IL, USA) under a load of 1 N and with a dwelling time of 10 s, at least six measurements per point were made. The density of the samples was determined by hydrostatic weighing at a water temperature of 24 °C.

3. Results

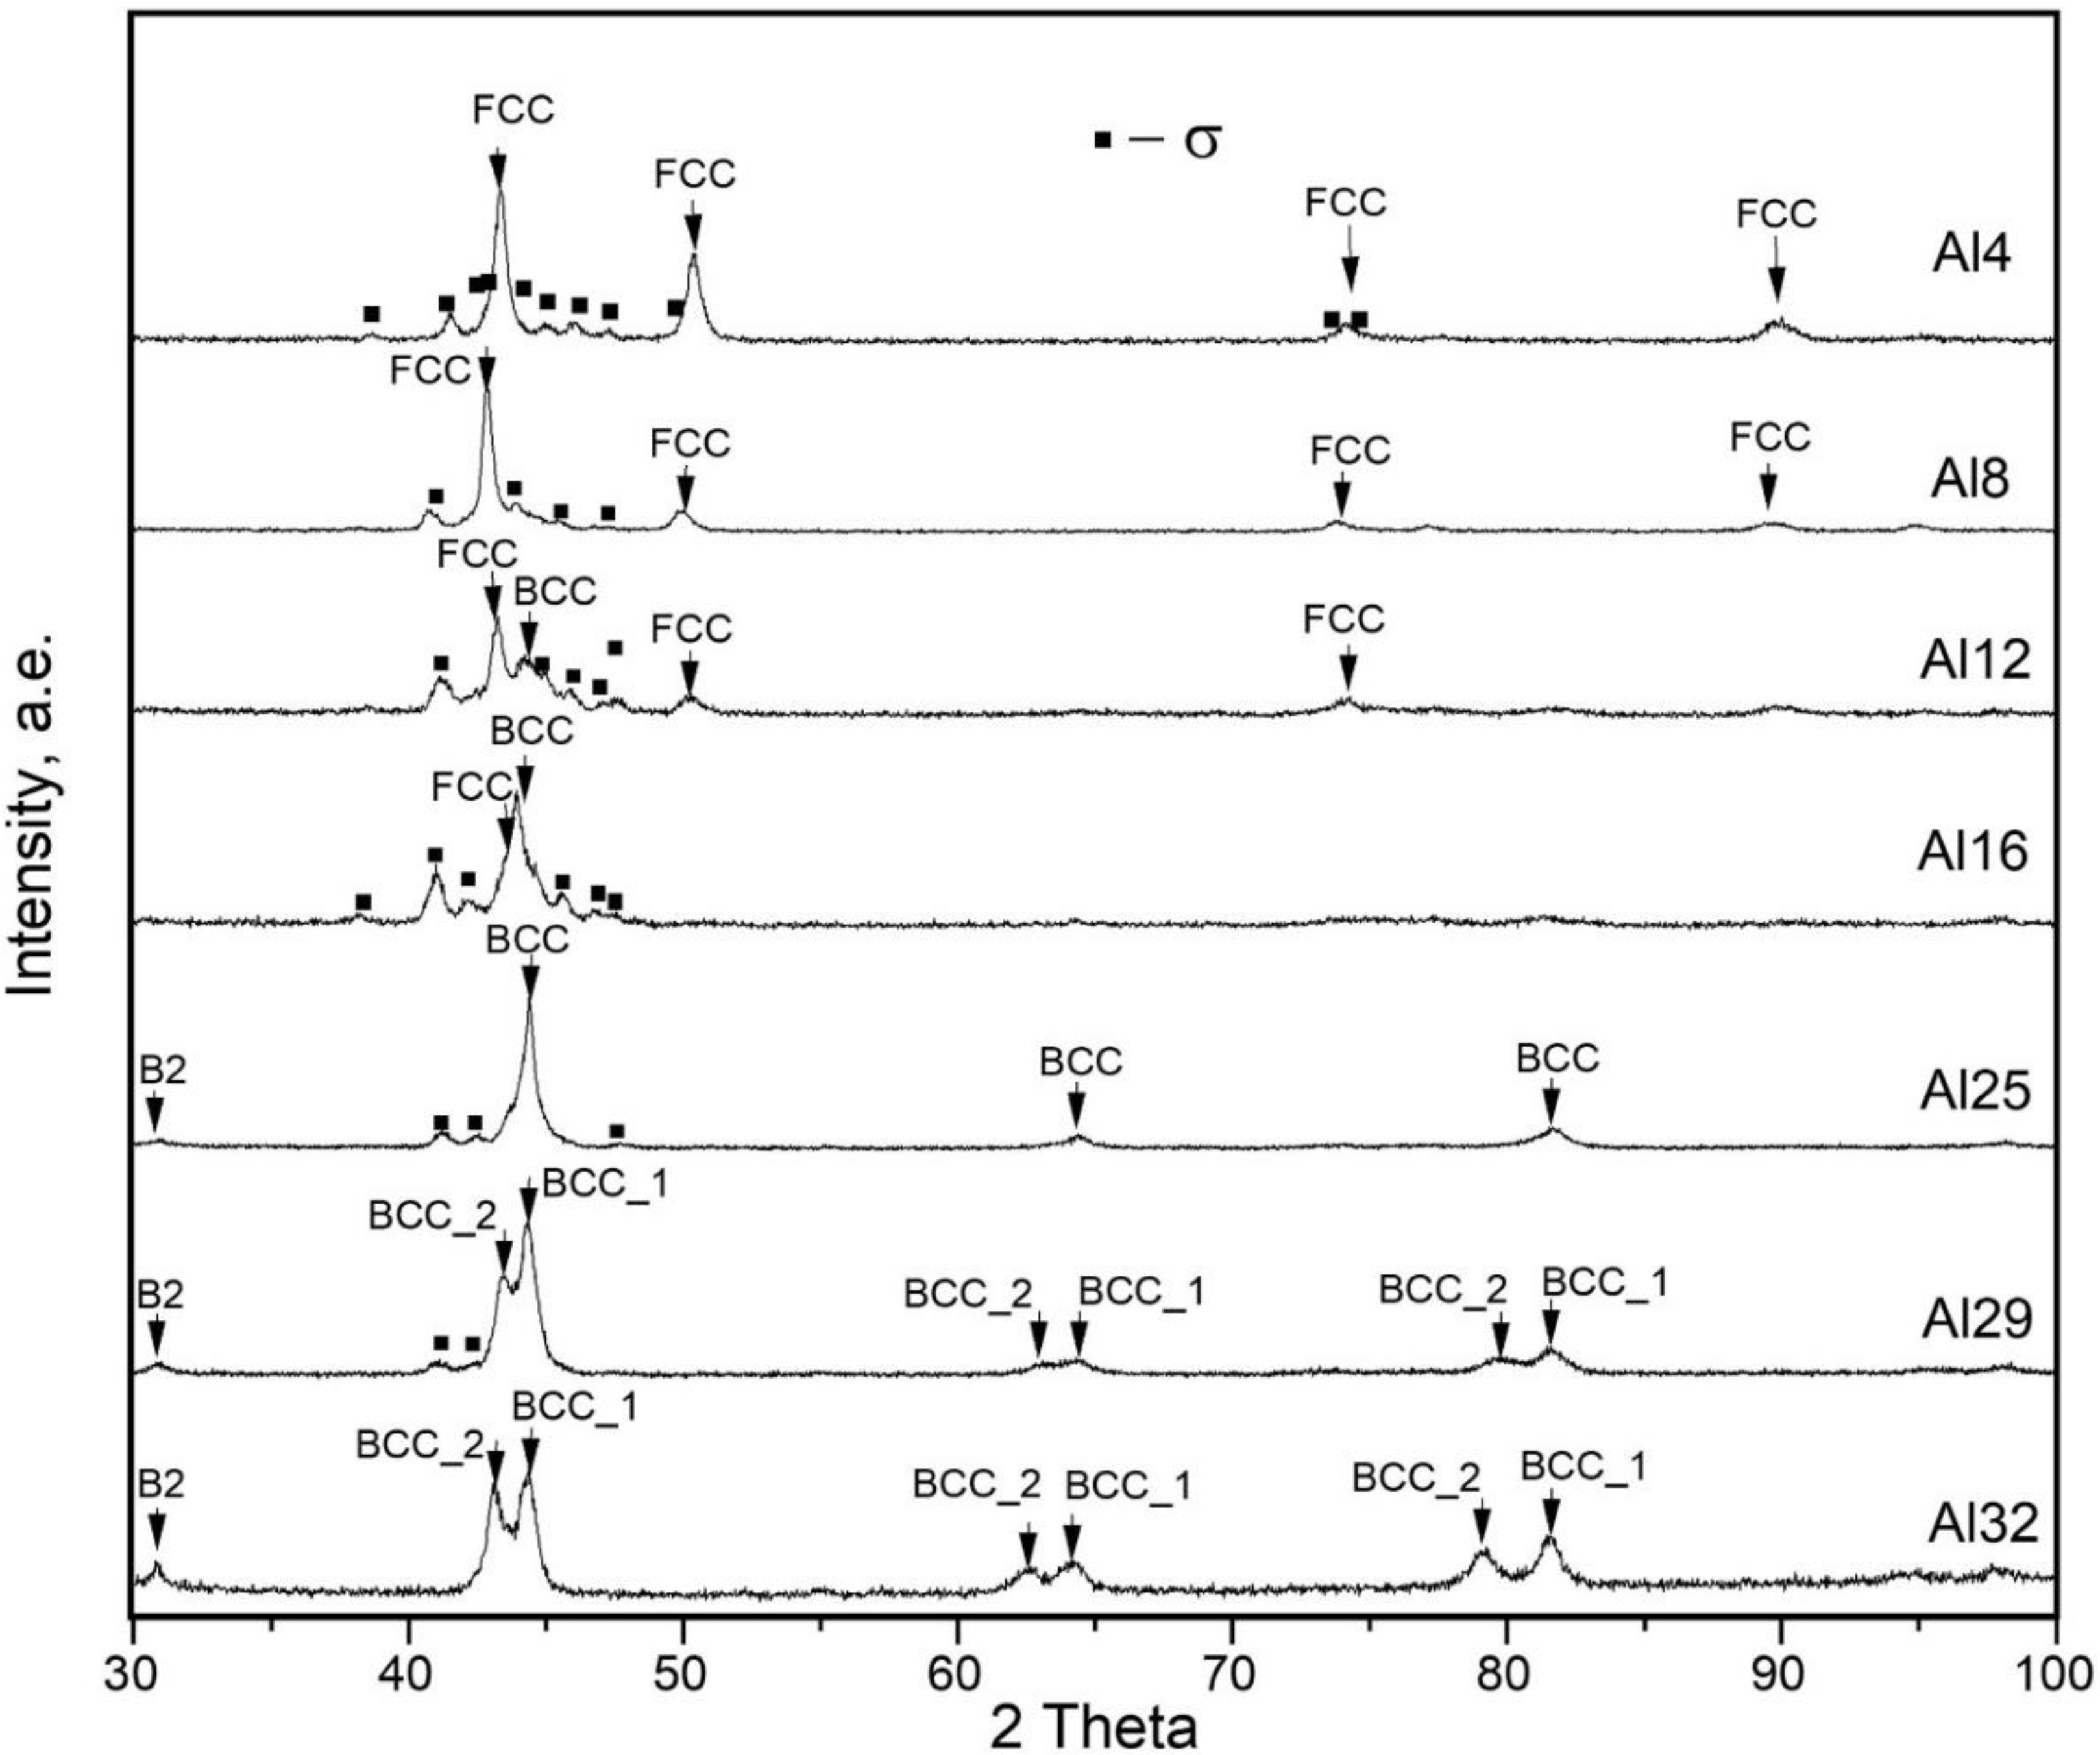
3.1. Phase Compositions (XRD Results)

Figure 1 demonstrates the XRD patterns of the samples. FCC, BCC solid solutions, B2, and σ-phase were determined. Al4 consists of an incoherent FCC solid solution and σ-phase. In Al8, the peaks of FCC shifted left as evidence of its lattice parameter increase due to a dissolution of Al. Apart from this, in Al12, a peak belonging to the BCC may be observed. Further increase in Al concentration in the alloys (Al25–Al32) led to a total disappearance of the reflexes belonging to the FCC phase and a development of BCC reflexes; besides, a peak at 2Θ = 32° denoting the BCC solution ordering becomes pronounced. In the alloys with an Al concentration higher than 25 at.% (Al25), there were two sets of reflexes of BCC structures observed and intervals between the peaks belonging to each phase increase with an increase in Al concentration in the alloys. The found phases for each alloy are listed in Table 2.

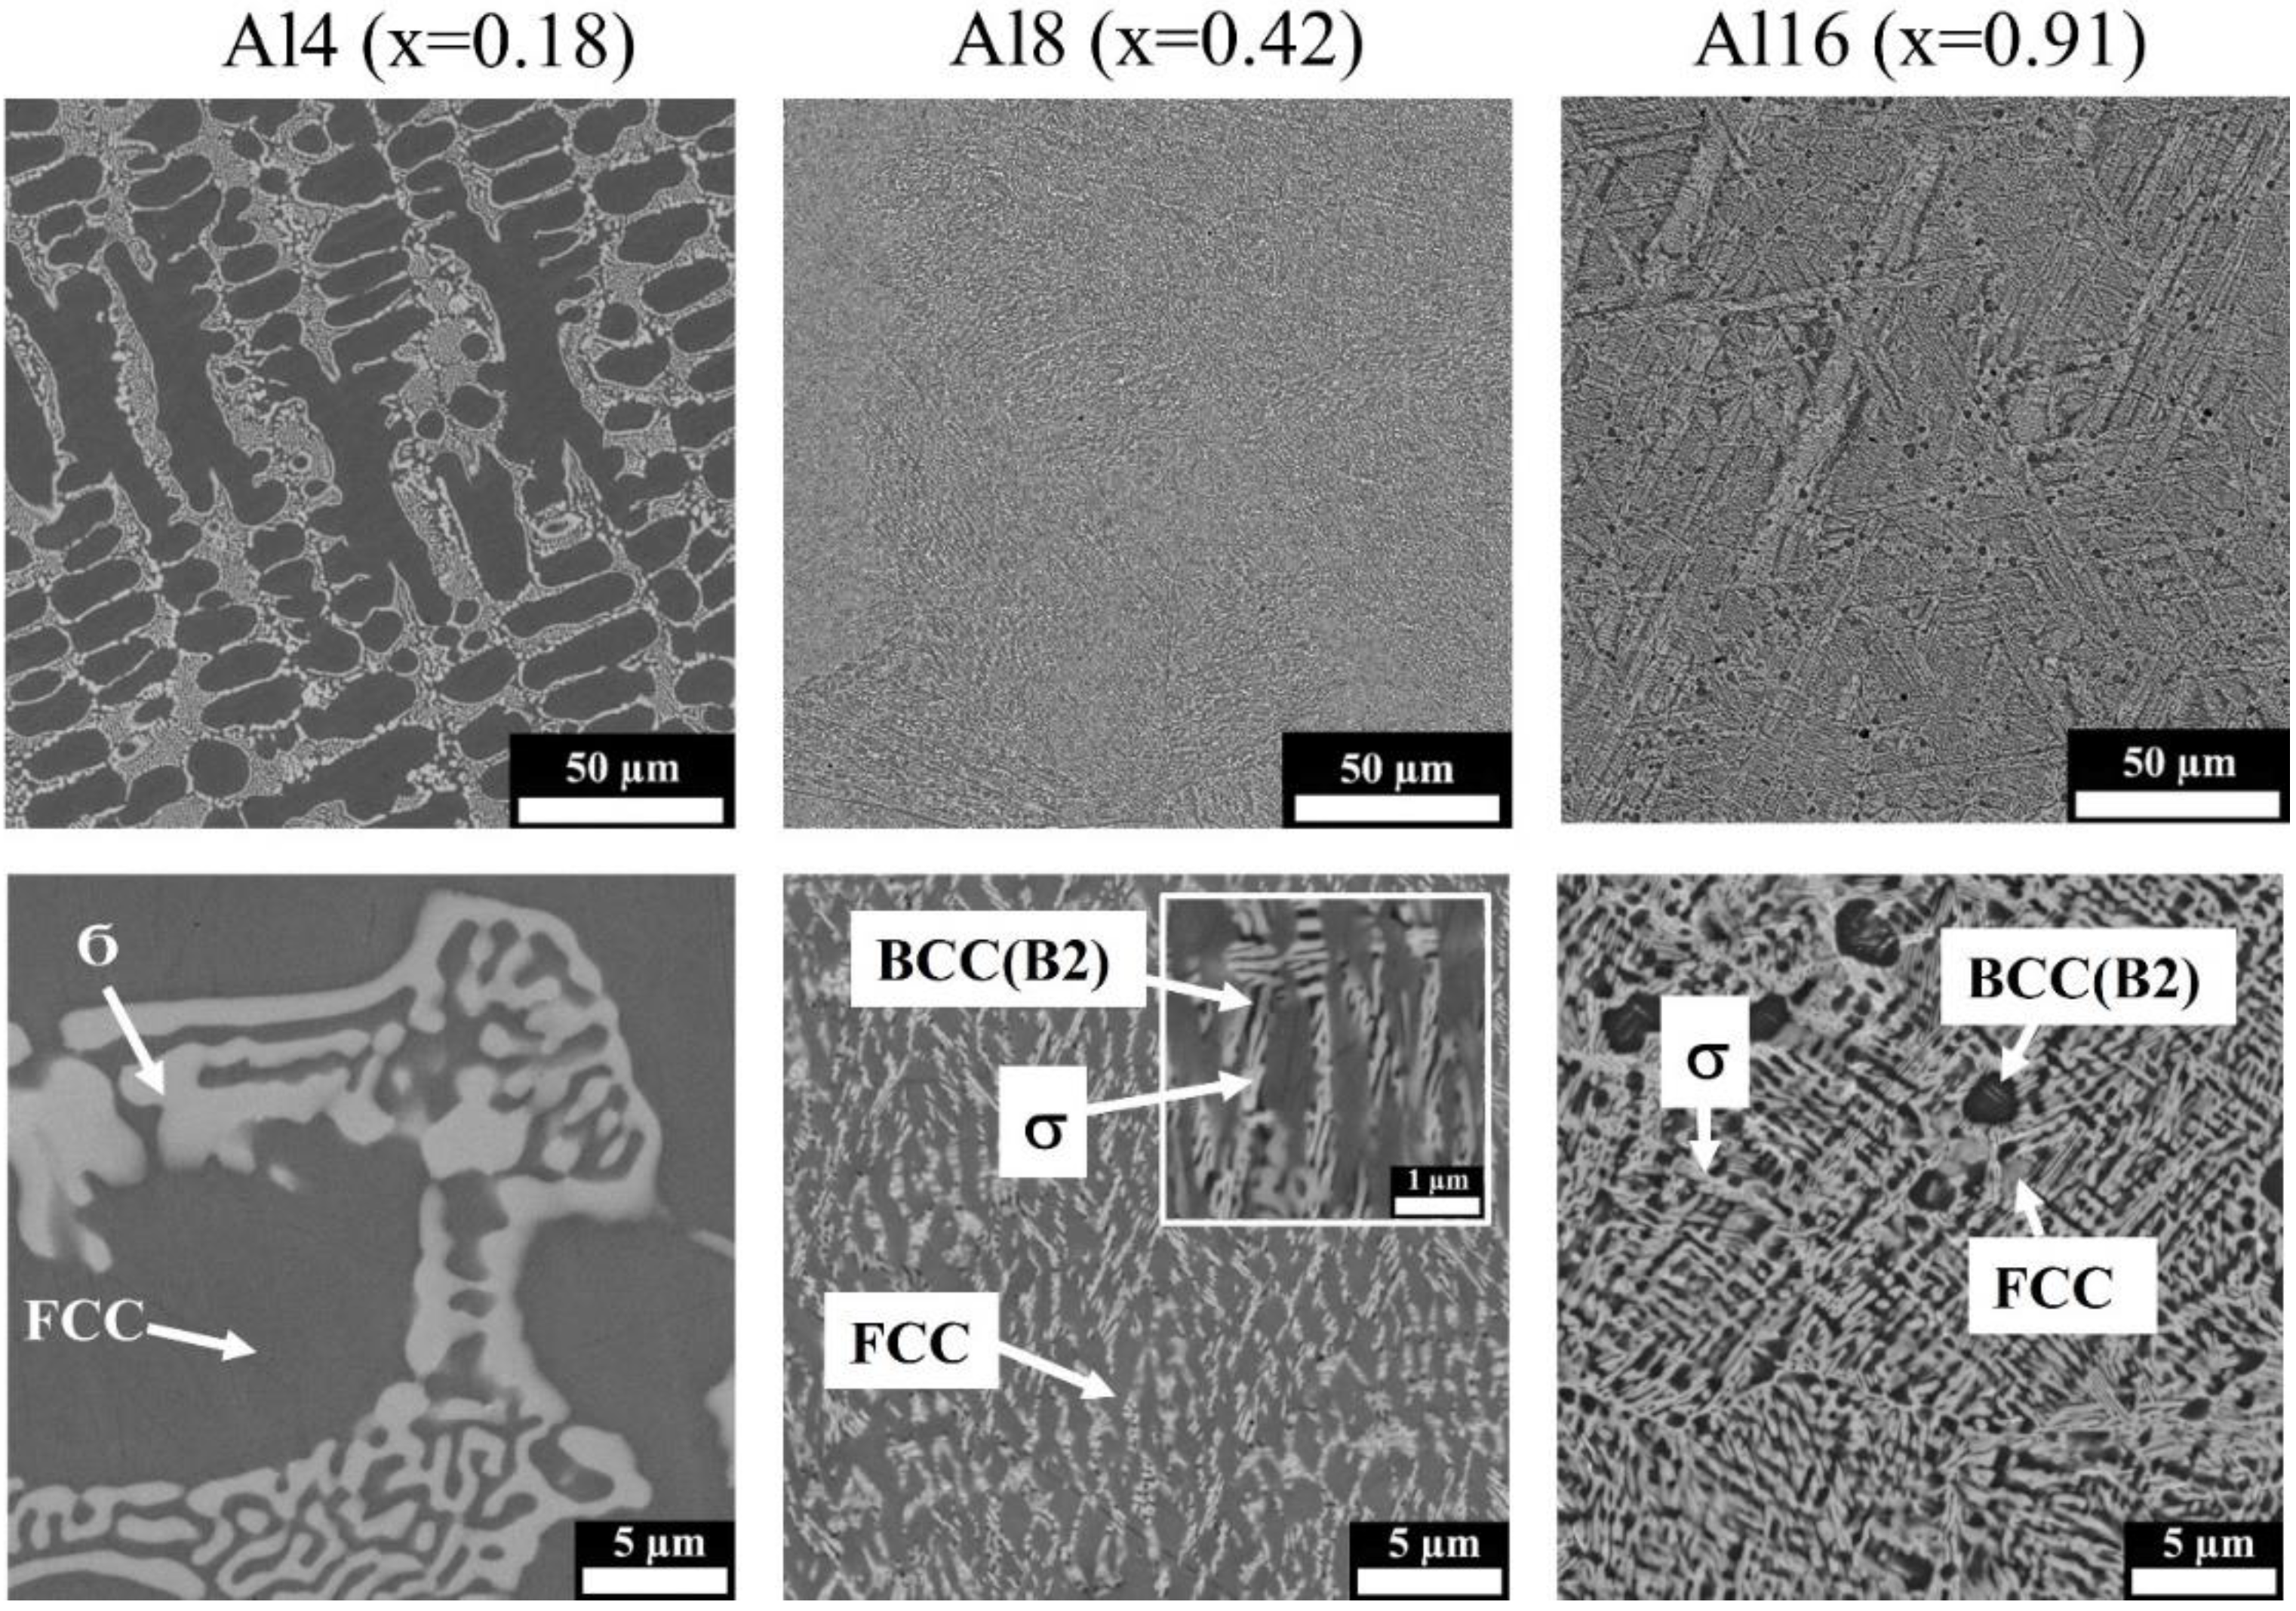
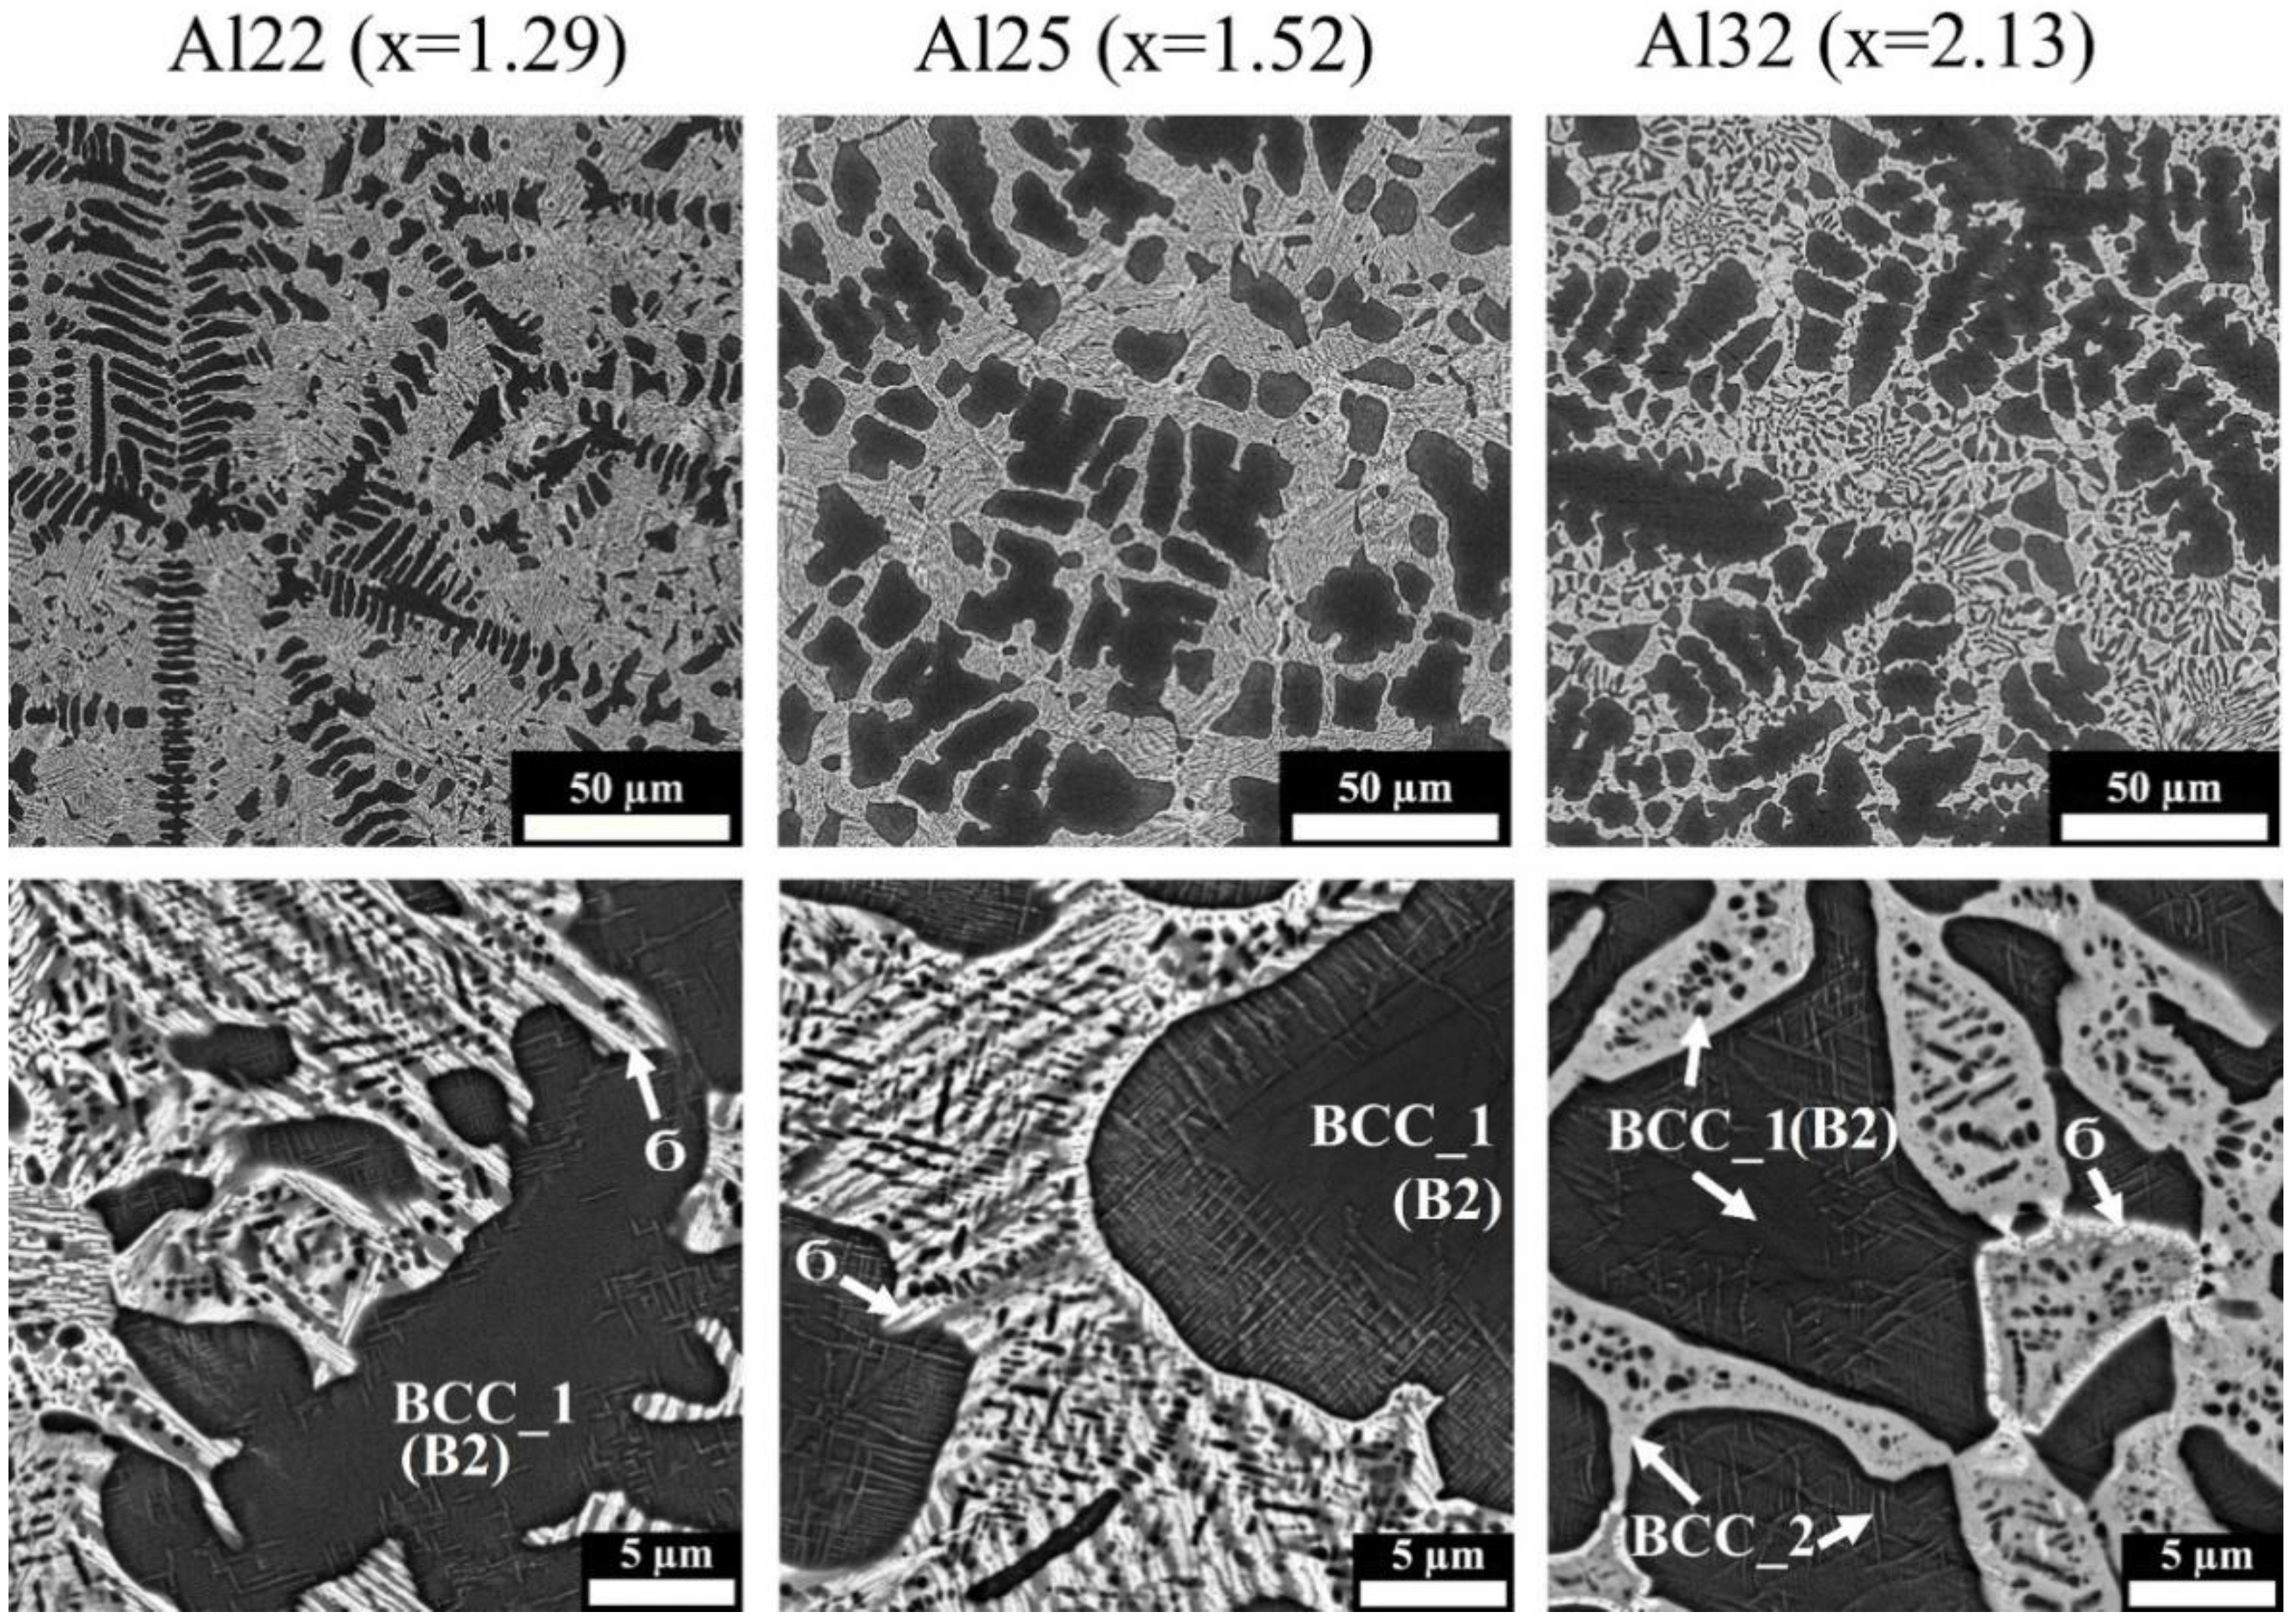
3.2. Microstructure Observation

The microstructures and the element distribution for the alloys with an Al content of 4, 8, and 16 at.% are presented in Figure 2 and Figure 3. The structural components of Al4 are primary FCC solid solution dendrites and interdendritic eutectic consisting of the FCC solid solution and σ-phase. When Al content is increased to 8 at.%, the microstructure changes considerably, and the structural components become much smaller. Instead of an eutectic on peripheries of the FCC dendrites, there is a layered structure consisting of two phases; one of these consists predominantly of Mo, Cr, and Fe, and another of Al and Ni. According to the XRD, the results show the former is the σ-phase, and the latter is BCC(B2). Obviously, the layered structure formed as a result of FCC solid solution decomposition, the composition of which became unstable due to dendritic liquation. The length of the σ-phase did not exceed 2 μm, the thickness was 200 nm, and the size of the FCC dendrites was reduced by about 10 times compared to the previous alloy.
Further increase in Al to 16 at.% considerably reduced the solution stability; one can see the σ and BCC(B2) phases, which is in agreement with the XRD observations, where only a small amount of FCC may be found. According to EDS, the σ-phase is enriched with Mo, Cr, and Fe; Al and Ni preferably form BCC(B2); Co is homogeneously distributed between both phases. The composition of the phases determined with EDS are presented in Table 3. It should be noted that the determined composition of the phases is not precise because of the small size of the phases and the limitations of the method.
The microstructures of the alloys with 22, 25, and 32 at.% Al and their elemental distributions are presented in Figure 4 and Figure 5. All alloys had primary dendrites of BCC_1(B2), and its volume fraction increased with an increase in Al concentration. Inside the BCC_1(B2) dendrites, one can see thin coherent precipitates obviously caused by a decomposition of the solid solution. Interdendritic space in Al22 and Al25 is filled with a complex structure consisting of the σ-phase, BCC_1(B2), and BCC_2. However, in Al32, there were only traces of the sigma phase observed, and interdendritic space was predominantly filled with BCC_2 with spherical precipitates of BCC_1(B2).

4. Discussion

The volume fractions of the phases found in the investigated alloys were determined by two methods, XRD and SEM, and are presented in Figure 6.
At Al additions up to 8 at.%, a fraction of the FCC slightly increased; this may be explained by the dissolution of Al in the FCC solid solution. At higher Al concentration, the BCC phase occurs. Al is known as a BCC stabilizer, and an increase in Al content in Fe–Co–Ni–Cu–Cr–Mn–Al HEA leads to a change in the solid solution crystal lattice from FCC to BCC. This fact has been repeatedly demonstrated by different authors and is usually connected with valent electron concentration [27]. According to [27], at VEC less than 6.87, the FCC solid solution disappears and only the BCC structure forms, which is consistent with our observation for the Fe–Co–Ni–Mo–Cr–Al system (Figure 6). However, according to our observation, the formed BCC phase is an ordered NiAl-based B2 structure. Apart from the B2 phase, Al additions influence the amount of σ-phase. σ-phase was observed in HEA containing Cr, Fe, Co, and others after prolonged annealing [16,17,23,33] and in as-cast HEA alloys containing Mo and Fe [18,24,32]. Al does not participate in the σ-phase and suppresses its formation [34]. It is interesting that according to our observation, an increase in Al to 16–20 at.% led to a growth in σ-phase content (up to 50%) in spite of a decrease in the concentration of σ forming elements. At Al content over 22 at.%, the fraction of the σ-phase began to decrease and almost disappeared at 32 at.% Al. The decrease of σ-phase coincided with the formation of the second BCC_2 solid solution enriched with Mo, Cr, and Fe.
To explain this observation, a simplified scheme of the phase composition formation in dependence on Al content is proposed in Figure 7. σ-phase has AB stoichiometry, where A is an element of bigger atomic radius and less d electrons [34]. In the Fe–Co–Ni–Cr–Mo system, Cr and Mo are A elements, and Fe, Co, Ni–B elements. Despite Ni entering the σ-phase as a B element, it was reported as a destabilizer of the σ-phase in CrMnCoFeNi HEA [23]. In the composition of FeCoNiCrMo0.5 (0% Al) the ratio of A elements (Cr and Mo) to B elements (Fe, Co, and Ni) was 1:2. Because Ni is less prone to form the σ-phase compared to Fe and Co [35], it remains in excess and promotes FCC solid solution formation. This is consistent with [23], where it was reported that an excess of Ni results in FCC stabilization and σ-phase suppression.
It can be suggested that in the multicomponent solution, each atom is most likely to be surrounded by other atoms, with which it has a higher negative enthalpy of mixing. Figure 8 presents the enthalpy of mixing for each pair of atoms in the system [37]. Based on this, Al attracts Ni first of all, leading to Al–Ni segregation. Thus, the more Al is added, the more Ni is bound to Al and, correspondingly, is removed from the solid solution. The removal of Ni from the FCC solid solution destabilizes it, leading to an additional σ-phase precipitation. It should be noted that the proposed scheme is only a simplified presentation, and it is obvious that not only do B elements (Ni, Co, and Fe) compose the FCC solid solution, but also that Cr and Mo have some solubility in it. Solubility of Cr and Mo in FCC was about 20 and 8 at.%; however, their solubility in B2 was only about 13 and 5 at.% correspondingly (Table.3). Therefore, an increase in the amount of B2 is followed by an increase in the amount of σ-phase. Further increase in Al concentration causes bonding not only with Ni, but also with Co and Fe, which occupy Ni positions in B2. This results in an excess of A elements (Mo, Cr) in the solution, which forms another BCC structure.
Figure 9 shows a change of interatomic distance in FCC, BCC_1(B2), and BCC_2 lattices depending on the alloy’s concentration. An increase in Al content to 8 at.% caused an expansion of the FCC crystal lattice, taking into account an increase in the fraction of FCC (Figure 6), which proves that up to this concentration, Al dissolves in the FCC solid solution.
In the alloys with an Al concentration higher than 8 at.%, the FCC lattice parameter decreased, which showed a change in the FCC solid solution composition. As we proposed earlier, at this Al content, Ni leaves the solid solution after being attracted to Al. It is known that Ni has the smallest atom radius among the other elements of this system, and its removal from the solid solution should result in a growth of its lattice parameter, which contradicts with our observation. However, destabilization of the FCC solid solution due to Ni removal also leads to a removal of other elements with larger radii such as Mo, Cr, and Fe, which form the σ-phase, and the growth of the fraction of the σ-phase proves our assumption. On the other hand, a decrease in the FCC solid solution lattice parameter may be connected with the formation of a coherent BCC_1(B2) phase based on Al–Ni segregations, so the coherent boundaries may lead to elastic shrinkage of the FCC crystal structure.
The lattice parameter of the BCC_1(B2) phase was almost the same for all compositions, which may be a consequence of more rigid interatomic bonds or more constant composition compared to the FCC solid solution.
The lattice parameter of the second BCC_2 solid solution enriched with Cr and Mo strongly increased with an increase in Al concentration. As we suggested, Al bonds to σ-forming B elements, namely Ni, Co, and Fe into the BCC_1(B2) phase, and A elements with bigger atomic radius (Mo, Cr) remain in the BCC_2 solid solution, resulting in the increase in its lattice parameter.

5. Properties

Changes of the microhardness and density of the alloys in dependence on the Al content are shown in Figure 10. An increase in Al results in hardness growth; at an interval of 25–29 at.% Al, microhardness falls by 100 HV and then rises up again to 630 HV.
The microhardness rising with an Al concentration of up to 22 at.% is caused by both an increase in the amount of σ-phase and a formation of B2 instead of the soft FCC solid solution (Figure 3). The slight decline in the microhardness at the interval of 25–29 at.% may be associated with a decrease in the fraction of hard σ-phase. It is interesting that at 32 at.% Al, when the σ-phase almost disappeared, the microhardness leapt up by 100 HV, which may be explained by an increase in the amount of BCC_2 as well as its hardness due to a high concentration of Mo and Cr. As was said previously, an increase in Al (in interval of 25–32 at.%) led to an increase in Mo and Cr in the BCC_2 solid solution, which was confirmed by an increase in its lattice parameter (Figure 9). Thus, the composition of FeCoNiCrMo0.5Al2.13 had the highest hardness of 630 HV and the lowest density of 6.65 g/cm3.

6. Conclusions

Multicomponent alloys of the FeCoNiCrMo0.5Alx system with x varying up to 2.13 were analyzed by XRD, SEM, EDS, and microhardness test. It was found that:
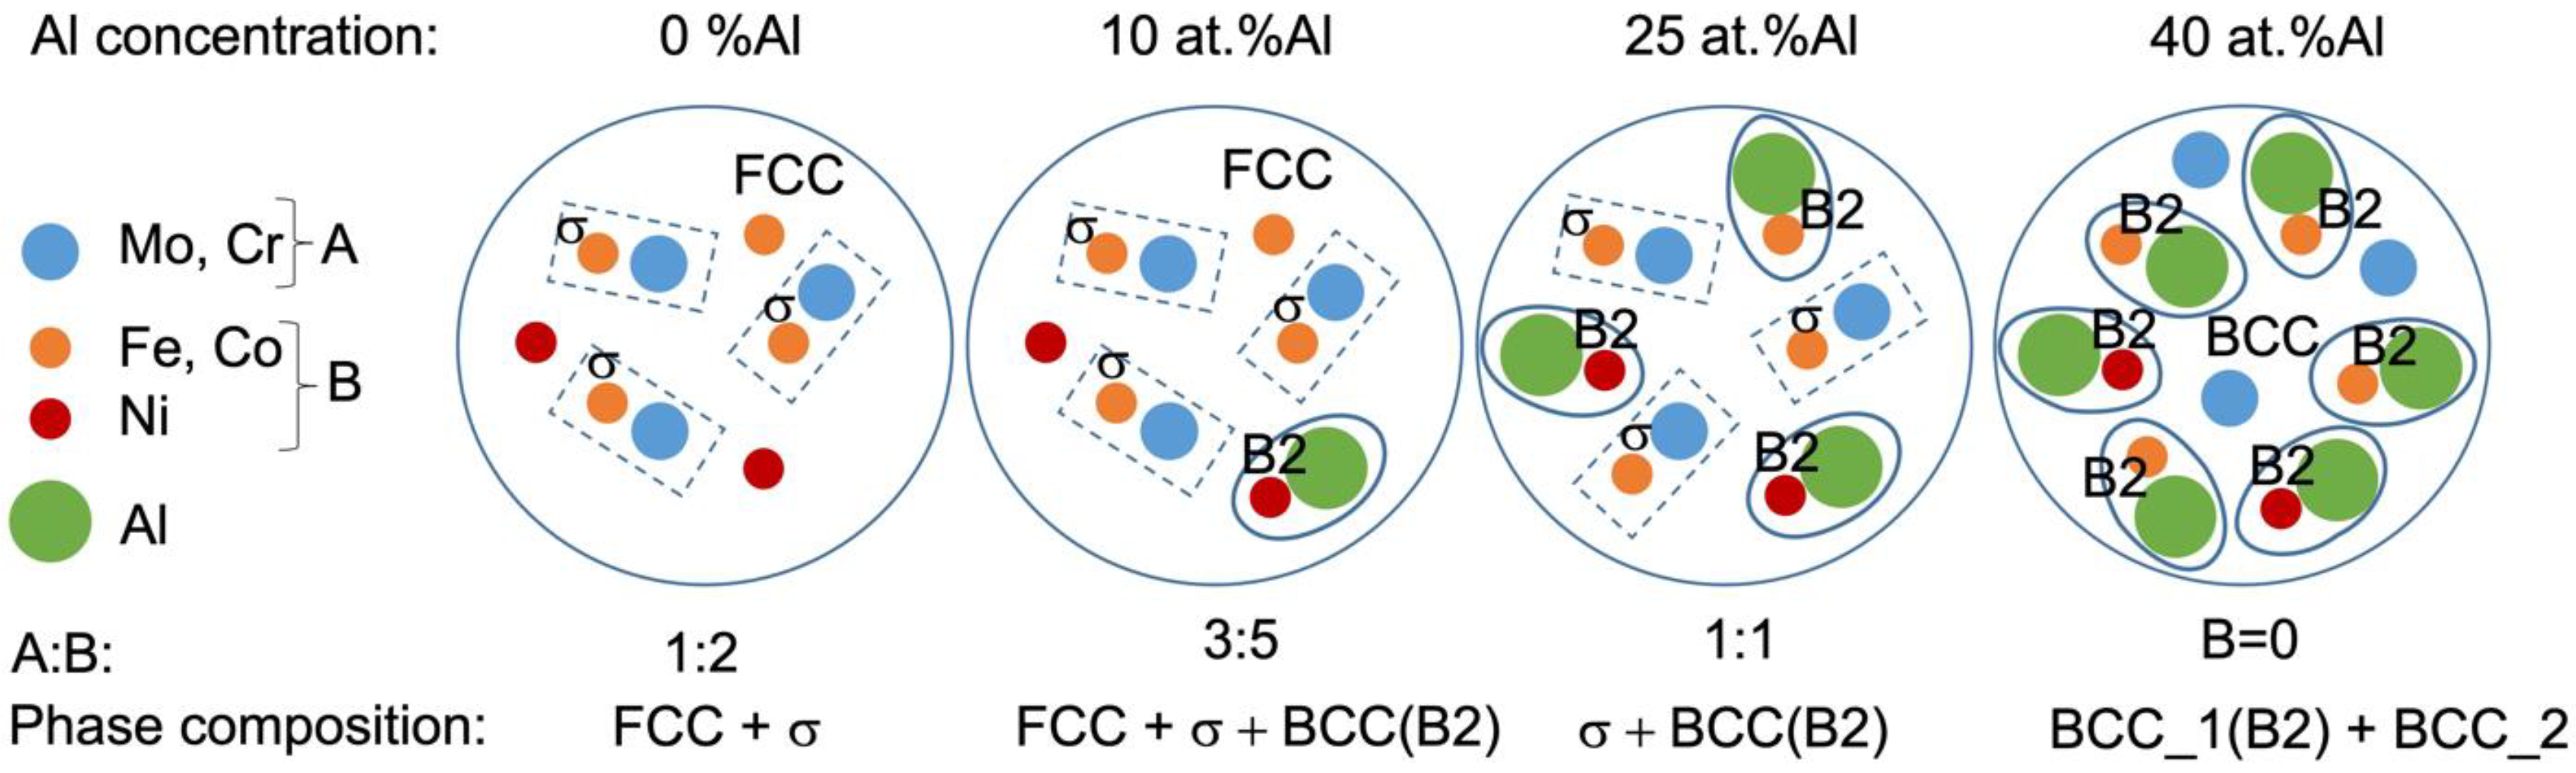
  • Al dissolves in an FeCoNiCrMo0.5 FCC solid solution up to 8 at.%. At higher concentrations, Al attracts Ni, removing it from the FCC solid solution and thereby destabilizing it. At an Al content of 22 at.% and higher, corresponding to VEC ≤ 6.87, the FCC phase disappears. The Al and Ni formed the ordered BCC (B2) phase, in which Co and Fe also dissolve, occupying Ni positions.
  • Additions of Al to FeCoNiCrMo0.5 strongly influence the fraction of the σ-phase. Despite Al not participating in σ-phase formation, an increase in Al concentration to about 20 at.% led to a growth in the σ-phase fraction to 50%. The increase in σ-phase was caused by an increase in the amount of B2 instead of the FCC solid solution because the solubility of Mo and Cr in B2 was less than that in the FCC solution. A further increase in Al concentration led to an excess of Mo and Cr in the solution, which formed a disordered BCC solid solution. At an Al content of 32%, the alloy consisted of two BCC phases: a solid solution enriched with Cr and Mo and ordered B2 (Ni, Co)Al-based phase.
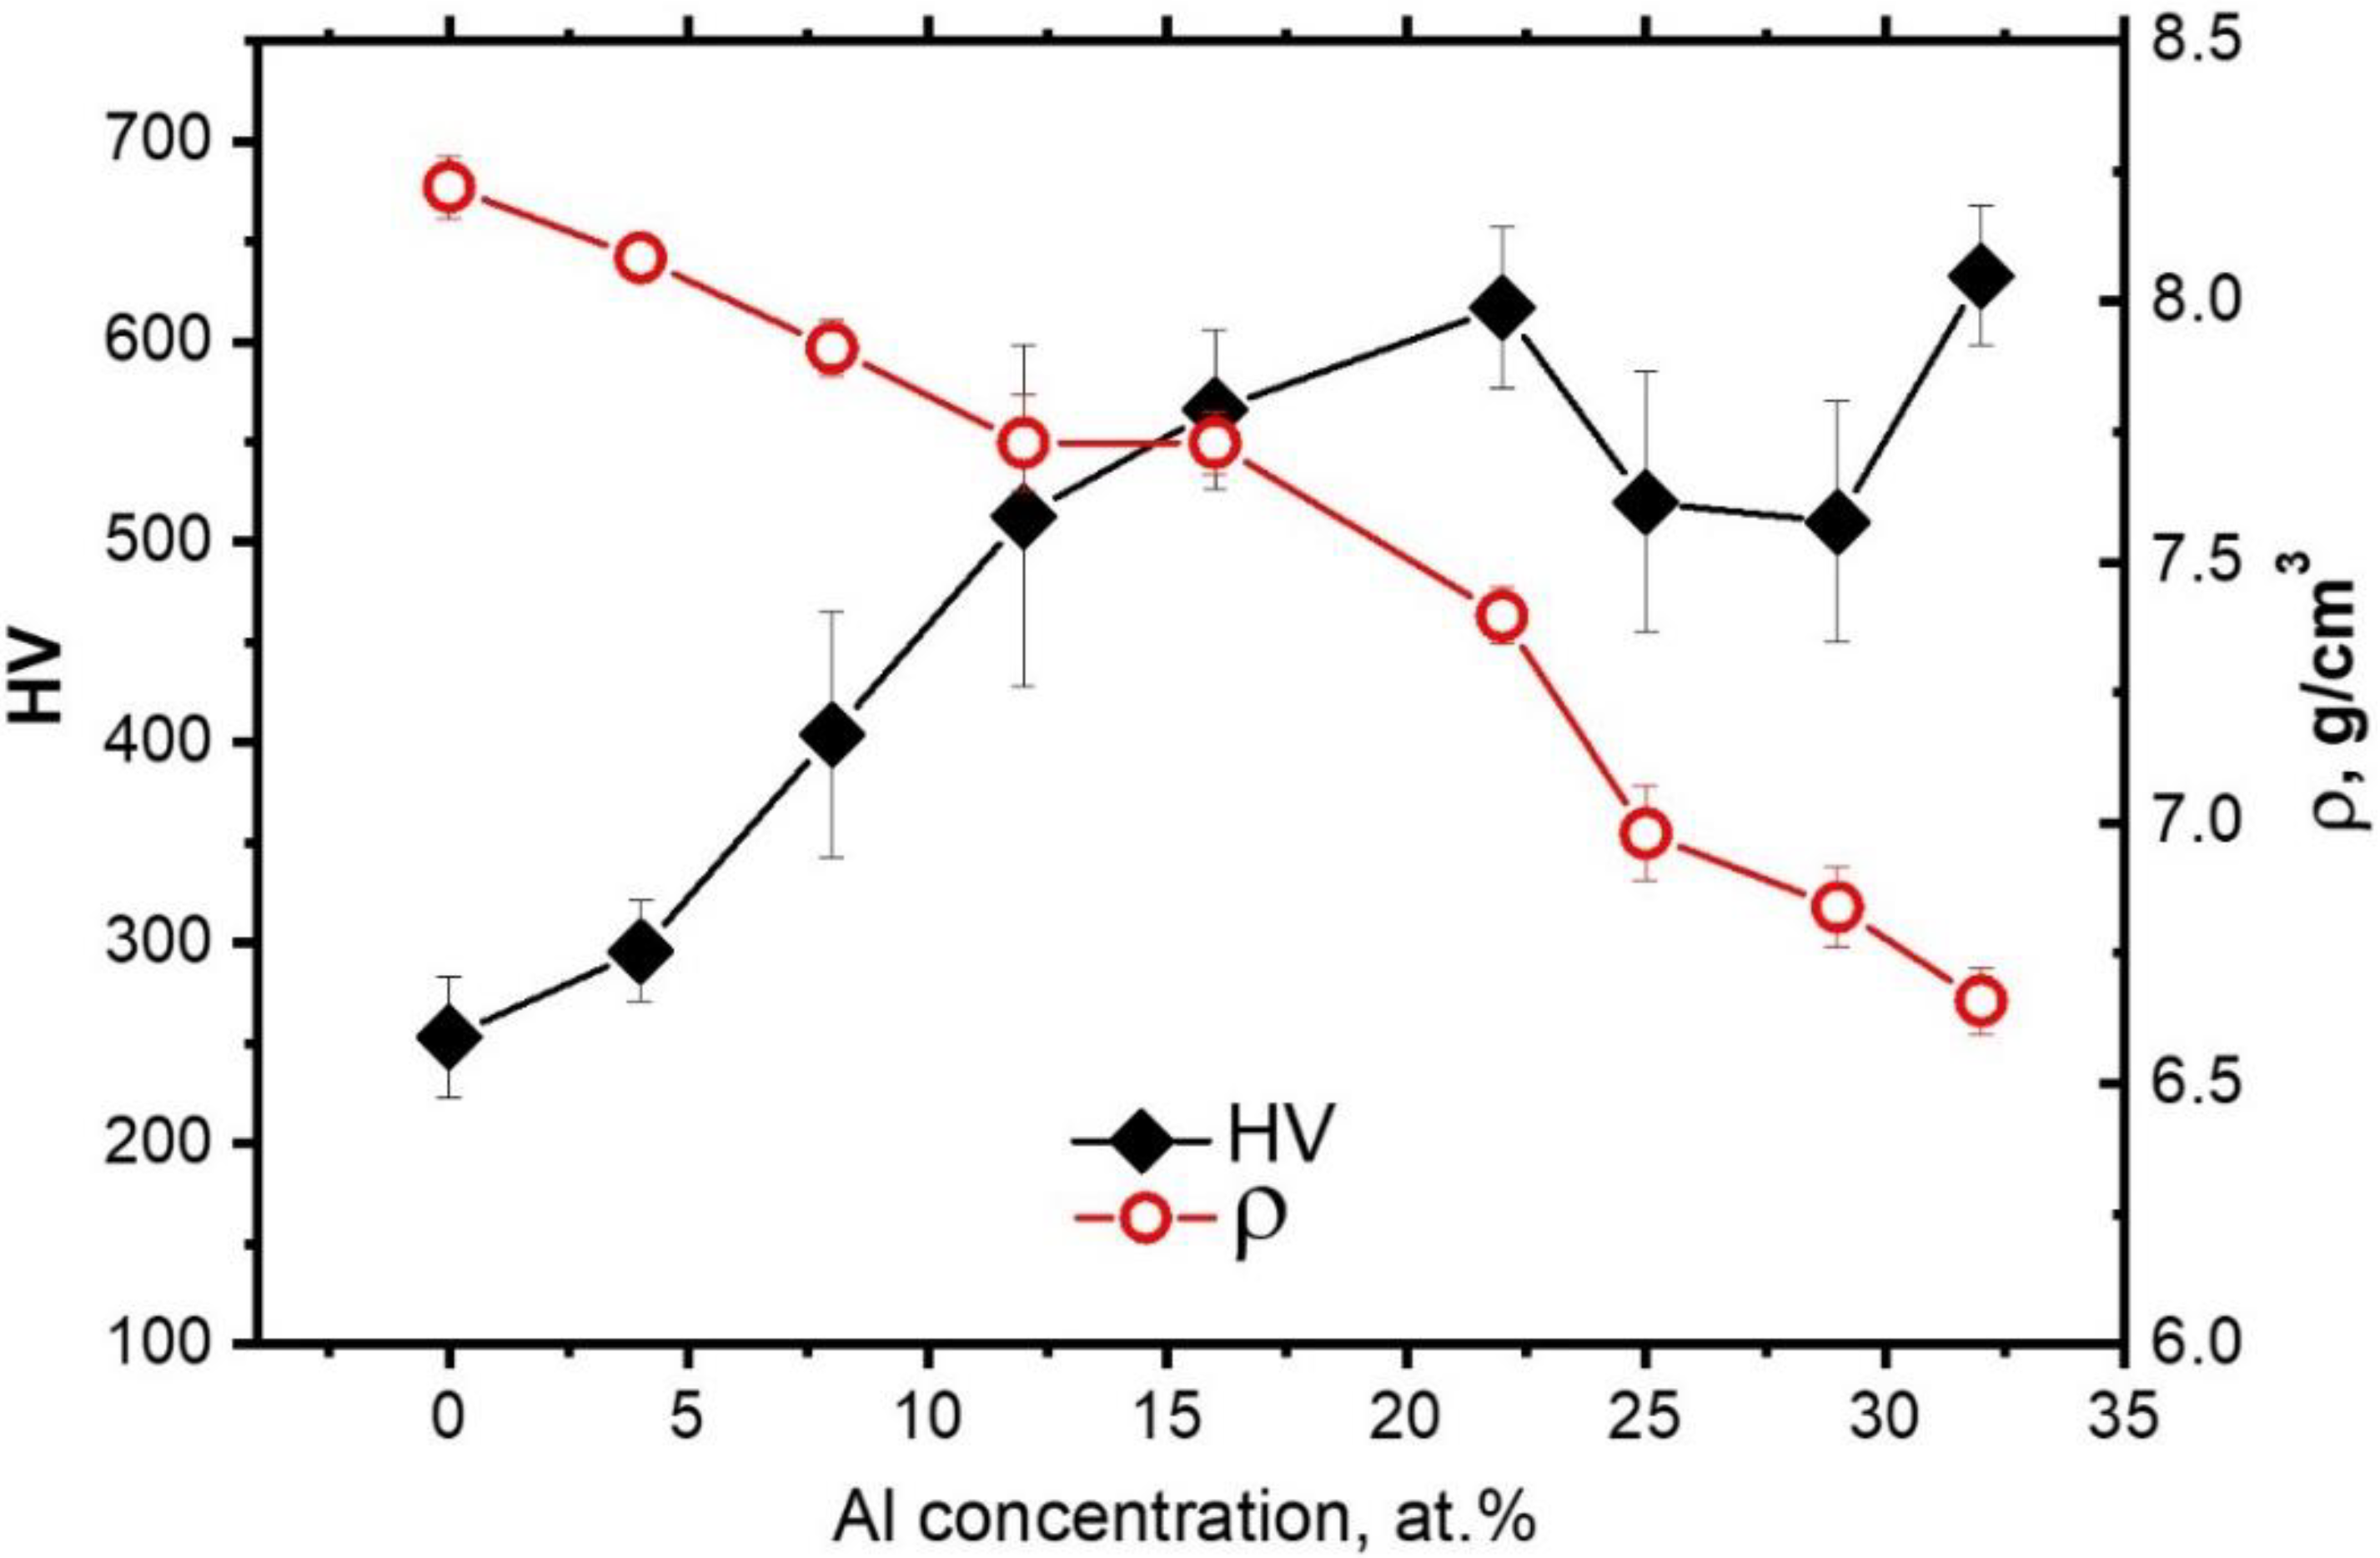
  • The rise in microhardness with an increase in Al concentration to 22 at.% was caused by both an increase in the amount of σ-phase and the formation of B2 instead of a soft FCC solid solution. In a composition with 32 at.% Al, when the σ-phase almost disappeared, the microhardness reached a maximum of 630 HV, which may be explained by both an increase in the fraction of disordered BCC enriched with Mo, and by the increase in Mo concentration in it. Thus, the composition FeCoNiCrMo0.5Al2.13 had the highest hardness of 630 HV and the lowest density of 6.65 g/cm3 among the considered compositions.

Author Contributions

A.S., S.S. and T.L.: investigation, visualization; V.A. and M.S.: methodology, SEM and XRD measurements; V.K.: validation; T.L., O.T. and V.K.: writing—original draft; O.T.: supervision. All authors have read and agreed to the published version of the manuscript.

Funding

The research was supported by the Ministry of Science and Higher Education of the Russian Federation (State Assignment for basic research 0784-2020-0022).

Institutional Review Board Statement

Not applicable.

Informed Consent Statement

Not applicable.

Data Availability Statement

The data presented in this study are available on request from the corresponding author.

Conflicts of Interest

The authors declare no conflict of interest.

References

  1. Cantor, B.; Chang, I.T.H.; Knight, P.; Vincent, A.J.B. Microstructural development in equiatomic multicomponent alloys. Mater. Sci. Eng. A 2004, 375–377, 213–218. [Google Scholar] [CrossRef]
  2. Yeh, J.W.; Chen, S.K.; Lin, S.J.; Gan, J.Y.; Chin, T.S.; Shun, T.T.; Tsau, C.H.; Chang, S.Y. Nanostructured high-entropy alloys with multiple principal elements: Novel alloy design concepts and outcomes. Adv. Eng. Mater. 2004, 6, 299–303. [Google Scholar] [CrossRef]
  3. Zhang, Y.; Zhou, Y.J.; Lin, J.P.; Chen, G.L.; Liaw, P.K. Solid-solution phase formation rules for multi-component alloys. Adv. Eng. Mater. 2008, 10, 534–538. [Google Scholar] [CrossRef]
  4. Yang, X.; Zhang, Y. Prediction of high-entropy stabilized solid-solution in multi-component alloys. Mater Chem. Phys. 2012, 132, 233–238. [Google Scholar] [CrossRef]
  5. George, E.P.; Raabe, D.; Ritchie, R.O. High-entropy alloys. Nat. Rev. Mater. 2019, 4, 515–534. [Google Scholar] [CrossRef]
  6. Yeh, J.W. Recent progress in high-entropy alloys. Ann. Chim. Sci. Mater. 2006, 31, 633–648. [Google Scholar] [CrossRef]
  7. Zhang, Y.; Zuo, T.T.; Tang, Z.; Gao, M.C.; Dahmen, K.A.; Liaw, P.K.; Lu, Z.P. Microstructures and properties of high-entropy alloys. Prog. Mater. Sci. 2014, 61, 1–93. [Google Scholar] [CrossRef]
  8. Pickering, E.J.; Jones, N.G. High-entropy alloys: A critical assessment of their founding principles and future prospects. Int. Mater. Rev. 2016, 61, 183–202. [Google Scholar] [CrossRef] [Green Version]
  9. Singh, S.; Wanderka, N.; Murty, B.S.; Glatzel, U.; Banhart, J. Decomposition in multi-component AlCoCrCuFeNi high-entropy alloy. Acta Mater. 2011, 59, 182–190. [Google Scholar] [CrossRef]
  10. López Ríos, M.; Socorro Perdomo, P.P.; Voiculescu, I. Effects of nickel content on the microstructure, microhardness and corrosion behavior of high-entropy AlCoCrFeNix alloys. Sci. Rep. 2020, 10, 21119. [Google Scholar] [CrossRef] [PubMed]
  11. Shun, T.-T.; Hung, W.-J. Effects of Cr Content on Microstructure and Mechanical Properties of AlCoCrxFeNi High-Entropy Alloy. Adv. Mater. Sci. Eng. 2018, 5826467. [Google Scholar] [CrossRef] [Green Version]
  12. Guo, L.; Xiao, D.; Wu, W.; Ni, S.; Song, M. Effect of Fe on Microstructure, Phase Evolution and Mechanical Properties of (AlCoCrFeNi)100-xFex High Entropy Alloys Processed by Spark Plasma Sintering. Intermetallics 2018, 103, 1–11. [Google Scholar] [CrossRef]
  13. Reverte, E.; Cornide, J.; Lagos, M.A.; Campos, M.; Alvaredo, P. Microstructure Evolution in a Fast and Ultrafast Sintered Non-Equiatomic Al/Cu HEA. Metals 2021, 11, 848. [Google Scholar] [CrossRef]
  14. Tong, C.-J.; Chen, Y.-L.; Yeh, J.-W.; Lin, S.-J.; Chen, S.-K.; Shun, T.-T.; Tsau, C.-H.; Chang, S.-Y. Microstructure characterization of AlxCoCrCuFeNi high-entropy alloy system with multiprincipal elements. Metall. Mater. Trans. A 2005, 36, 881–893. [Google Scholar] [CrossRef]
  15. Manzoni, A.; Daoud, H.; Völkl, R.; Glatzel, U.; Wanderka, N. Phase separation in equiatomic AlCoCrFeNi high-entropy alloy. Ultramicroscopy 2013, 132, 212–215. [Google Scholar] [CrossRef]
  16. Stepanov, N.D.; Shaysultanov, D.G.; Ozerov, M.S.; Zherebtsov, S.V.; Salishchev, G.A. Second phase formation in the CoCrFeNiMn high entropy alloy after recrystallization annealing. Mater. Lett. 2016, 185, 1–4. [Google Scholar] [CrossRef]
  17. Otto, F.; Dlouhý, A.; Pradeep, K.G.; Kuběnová, M.; Raabe, D.; Eggeler, G.; George, E.P. Decomposition of the single-phase high-entropy alloy CrMnFeCoNi after prolonged anneals at intermediate temperatures. Acta Mater. 2016, 112, 40–52. [Google Scholar] [CrossRef] [Green Version]
  18. Juan, C.C.; Hsu, C.Y.; Tsai, C.W.; Wang, W.R.; Sheu, T.S.; Yeh, J.W.; Chen, S.K. On microstructure and mechanical performance of AlCoCrFeMo0.5Nix high-entropy alloys. Intermetallics 2013, 32, 401–407. [Google Scholar] [CrossRef]
  19. Li, C.; Ma, Y.; Hao, J.; Yan, Y.; Wang, Q.; Dong, C.; Liaw, P.K. Microstructures and mechanical properties of body-centered-cubic (Al, Ti)0.7(Ni, Co, Fe, Cr)5 high entropy alloys with coherent B2/L21 nanoprecipitation. Mater. Sci. Eng. A 2018, 737, 286–296. [Google Scholar] [CrossRef]
  20. Ma, Y.; Jiang, B.; Li, C.; Wang, Q.; Dong, C.; Liaw, P.K.; Xu, F.; Sun, L. The BCC/B2 Morphologies in AlxNiCoFeCr High-Entropy Alloys. Metals 2017, 7, 57. [Google Scholar] [CrossRef] [Green Version]
  21. Detrois, M.; Antonov, S.; Tin, S. Phase Stability and Thermodynamic Database Validation in a Set of Nonequiatomic Al-Co-Cr-Fe-Nb-Ni High-Entropy Alloys. Intermetallics 2019, 104, 103–112. [Google Scholar] [CrossRef]
  22. Pickering, E.J.; Stone, H.J.; Jones, N.G. Fine-scale precipitation in the high-entropy alloy Al0.5CrFeCoNiCu. Mater. Sci. Eng. A 2015, 645, 65–71. [Google Scholar] [CrossRef] [Green Version]
  23. Christofidou, K.A.; McAuliffe, T.P.; Mignanelli, P.M.; Stone, H.J.; Jones, N.G. On the prediction and the formation of the sigma phase in CrMnCoFeNix high entropy alloys. J. Alloys Compd. 2019, 770, 285–293. [Google Scholar] [CrossRef]
  24. Mukarram, M.; Munir, M.A.; Mujahid, M.; Yaqoob, K. Systematic Development of Eutectic High Entropy Alloys by Thermodynamic Modeling and Experimentation: An Example of the CoCrFeNi-Mo System. Metals 2021, 11, 1484. [Google Scholar] [CrossRef]
  25. Tokarewicz, M.; Grądzka-Dahlke, M. Review of Recent Research on AlCoCrFeNi High-Entropy Alloy. Metals 2021, 11, 1302. [Google Scholar] [CrossRef]
  26. Troparevsky, M.C.; Morris, J.; Daene, M.; Wang, Y.; Lupini, A.; Stocks, G.M. Beyond Atomic Sizes and Hume-Rothery Rules: Understanding and Predicting High-Entropy Alloys. JOM 2015, 67, 2350–2363. [Google Scholar] [CrossRef]
  27. Guo, S.; Ng, C.; Lu, J.; Liu, C.T. Effect of valence electron concentration on stability of fcc or bcc phase in high entropy alloys. J. Appl. Phys. 2011, 109, 103505. [Google Scholar] [CrossRef] [Green Version]
  28. Ogura, M.; Fukushima, T.; Zeller, R.; Dederichs, P.H. Structure of the High-Entropy Alloy AlxCrFeCoNi: Fcc versus Bcc. J. Alloys Compd. 2017, 715, 454–459. [Google Scholar] [CrossRef]
  29. Frommeyer, G.; Rablbauer, G. High temperature resistant intermetallic NiAl-based alloys with refractory metals Cr, Mo, Re. Mater. Res. Soc. Symp. Proc. 2003, 753, BB4.6.1–BB4.6.15. [Google Scholar] [CrossRef]
  30. Ma, S.G.; Zhang, Y. Effect of Nb Addition on the Microstructure and Properties of AlCoCrFeNi High-Entropy Alloy. Mater. Sci. Eng. A 2012, 532, 480–486. [Google Scholar] [CrossRef]
  31. Dong, Y.; Zhou, K.; Lu, Y.; Gao, X.; Wang, T.; Li, T. Effect of Vanadium Addition on the Microstructure and Properties of AlCoCrFeNi High Entropy Alloy. Mater. Des. 2014, 57, 67–72. [Google Scholar] [CrossRef]
  32. Shun, T.T.; Chang, L.Y.; Shiu, M.H. Microstructure and mechanical properties of multiprincipal component CoCrFeNiMox alloys. Mater. Charact. 2012, 70, 63–67. [Google Scholar] [CrossRef]
  33. Pickering, E.J.; Muñoz-Moreno, R.; Stone, H.J.; Jones, N.G. Precipitation in the equiatomic high-entropy alloy CrMnFeCoNi. Scr. Mater. 2016, 113, 106–109. [Google Scholar] [CrossRef]
  34. Hall, E.O.; Algie, S.H. The sigma phase. Int. Mater. Rev. 1966, 11, 61–88. [Google Scholar] [CrossRef]
  35. Lee, C.; Lee, Y.; Lee, C.; Hong, S. Precipitation behavior of the sigma phase with Ni and Mn content variations in superaustenitic stainless steel weld metal. Mater. Charact. 2018, 144, 148–154. [Google Scholar] [CrossRef]
  36. Nelson, J.B.; Riley, D.P. An Experimental Investigation of Extrapolation Methods in the Derivation of Accurate Unit Cell Dimensions of Crystals. Proc. Phys. Soc. 1945, 57, 160–177. [Google Scholar] [CrossRef]
  37. Takeuchi, A.; Inoue, A. Classification of Bulk Metallic Glasses by Atomic Size Difference, Heat of Mixing and Period of Constituent Elements and Its Application to Characterization of the Main Alloying Element. Mater. Trans. 2005, 46, 2817–2829. [Google Scholar] [CrossRef] [Green Version]
Figure 1. XRD patterns of the FeNiCoCrMo0.5Alx.
Metals 11 01734 g001
Figure 2. SEM microphotographs of the Al4, Al8, and Al16 alloys. σ-phase—the lightest, BCC(B2)—the darkest, and FCC—grey structural components.
Metals 11 01734 g002
Figure 3. Elemental distribution in the Al4, Al8, and Al16 alloys.
Metals 11 01734 g003
Figure 4. SEM microphotographs of the Al22, Al25, and Al32 alloys. σ-phase—the lightest, BCC_1(B2)—the darkest, and BCC_2—grey structural components.
Metals 11 01734 g004
Figure 5. Elemental distribution in the Al22, Al25, and Al32 alloys.
Metals 11 01734 g005
Figure 6. Volume fraction of phase in dependence of Al concentration determined by XRD (open circles) and SEM (squares).
Metals 11 01734 g006
Figure 7. Atom distribution and the formation of the phase composition scheme. The indicated A:B ratio refers to the atoms, which are not bound with Al.
Metals 11 01734 g007
Figure 8. Negative enthalpy of mixing for the elements [37].
Metals 11 01734 g008
Figure 9. Change in the shortest interatomic distance in the crystal lattice of the solid solutions (FCC or BCC) in dependance of Al concentration in the alloy. The distance was calculated as ½ (110) for FCC and as ½ (111) for BCC lattices.
Metals 11 01734 g009
Figure 10. Microhardness and density of the alloys in dependence on Al concentration.
Metals 11 01734 g010
Table 1. Chemical composition and designation of the FeNiCoCrMo0.5Alx alloys.
Alloy DesignationAtomic Concentration, %ΔHmix (kJmol−1)ΔSmix (JK−1mol−1)δ (%)VEC
FeNiCoCrMoAl
Al0 (x = 0)21.9821.9721.8422.2211.99-−4.3913.183.637.97
Al4 (x = 0.18)21.2421.3521.1520.8211.623.82−6.1414.034.327.799
Al8 (x = 0.42)20.0920.1620.0120.3310.988.42−8.0414.474.937.555
Al12 (x = 0.64)19.2219.3119.1519.3810.5312.41−9.4214.645.357.359
Al16 (x = 0.91)18.4018.4518.3218.1710.0716.69−10.9814.745.717.161
Al22 (x = 1.29)17.2117.2817.1416.869.4322.08−12.4714.676.066.887
Al25 (x = 1.52)16.5616.5416.5516.558.6525.15−13.214.546.216.735
Al29 (x = 1.84)15.7115.6815.7315.78.2628.92−14.014.346.376.546
Al32 (x = 2.13)14.9815.0314.9915.018.0431.95−14.4314.176.446.392
Table 2. Phase found by XRD.
AlloyPhase/Lattice Parameter, Å
Al0FCC/3.5960; σ-phase
Al4FCC/3.6158; σ-phase
Al8FCC/3.6248; BCC/2.8908; σ-phase
Al12FCC/3.6151; BCC/2.8893; σ-phase
Al16FCC/3.5885; BCC/2.8880; σ-phase
Al22BCC(B2)/2.8823; σ-phase
Al25BCC(B2)/2.8852; BCC_2/2.9098; σ-phase
Al29BCC_1(B2)/2.8863; BCC_2/2.9434; σ-phase
Al32BCC_1(B2)/2.8893; BCC_2/2.9636
Table 3. Composition of the phases determined with EDS.
AlloyPhaseAtomic Concentration, %
FeNiCoCrMoAl
Al4FCC2222222194
σ18141825214
Al8FCC2122211988
BCC(B2) *18242017714
σ *19171923156
Al12FCC2419222178
BCC(B2)17251916518
σ19161920169
Al16BCC(B2)15281714421
σ201619221311
Al22BCC(B2)13241810331
Interdendritic211117261311
Al25BCC_1(B2)14201813530
Interdendritic191418201018
Al29BCC_1(B2)14201812532
Interdendritic22713261516
Al32BCC_1(B2)1319179537
BCC_220611242019
* Low accuracy due to the small size of the phase.
Publisher’s Note: MDPI stays neutral with regard to jurisdictional claims in published maps and institutional affiliations.

