
Measurement Uncertainty and Representation of Tensile Mechanical Properties in Metals


Abstract
:1. Introduction
2. Experimental Observations of Measurement Uncertainty
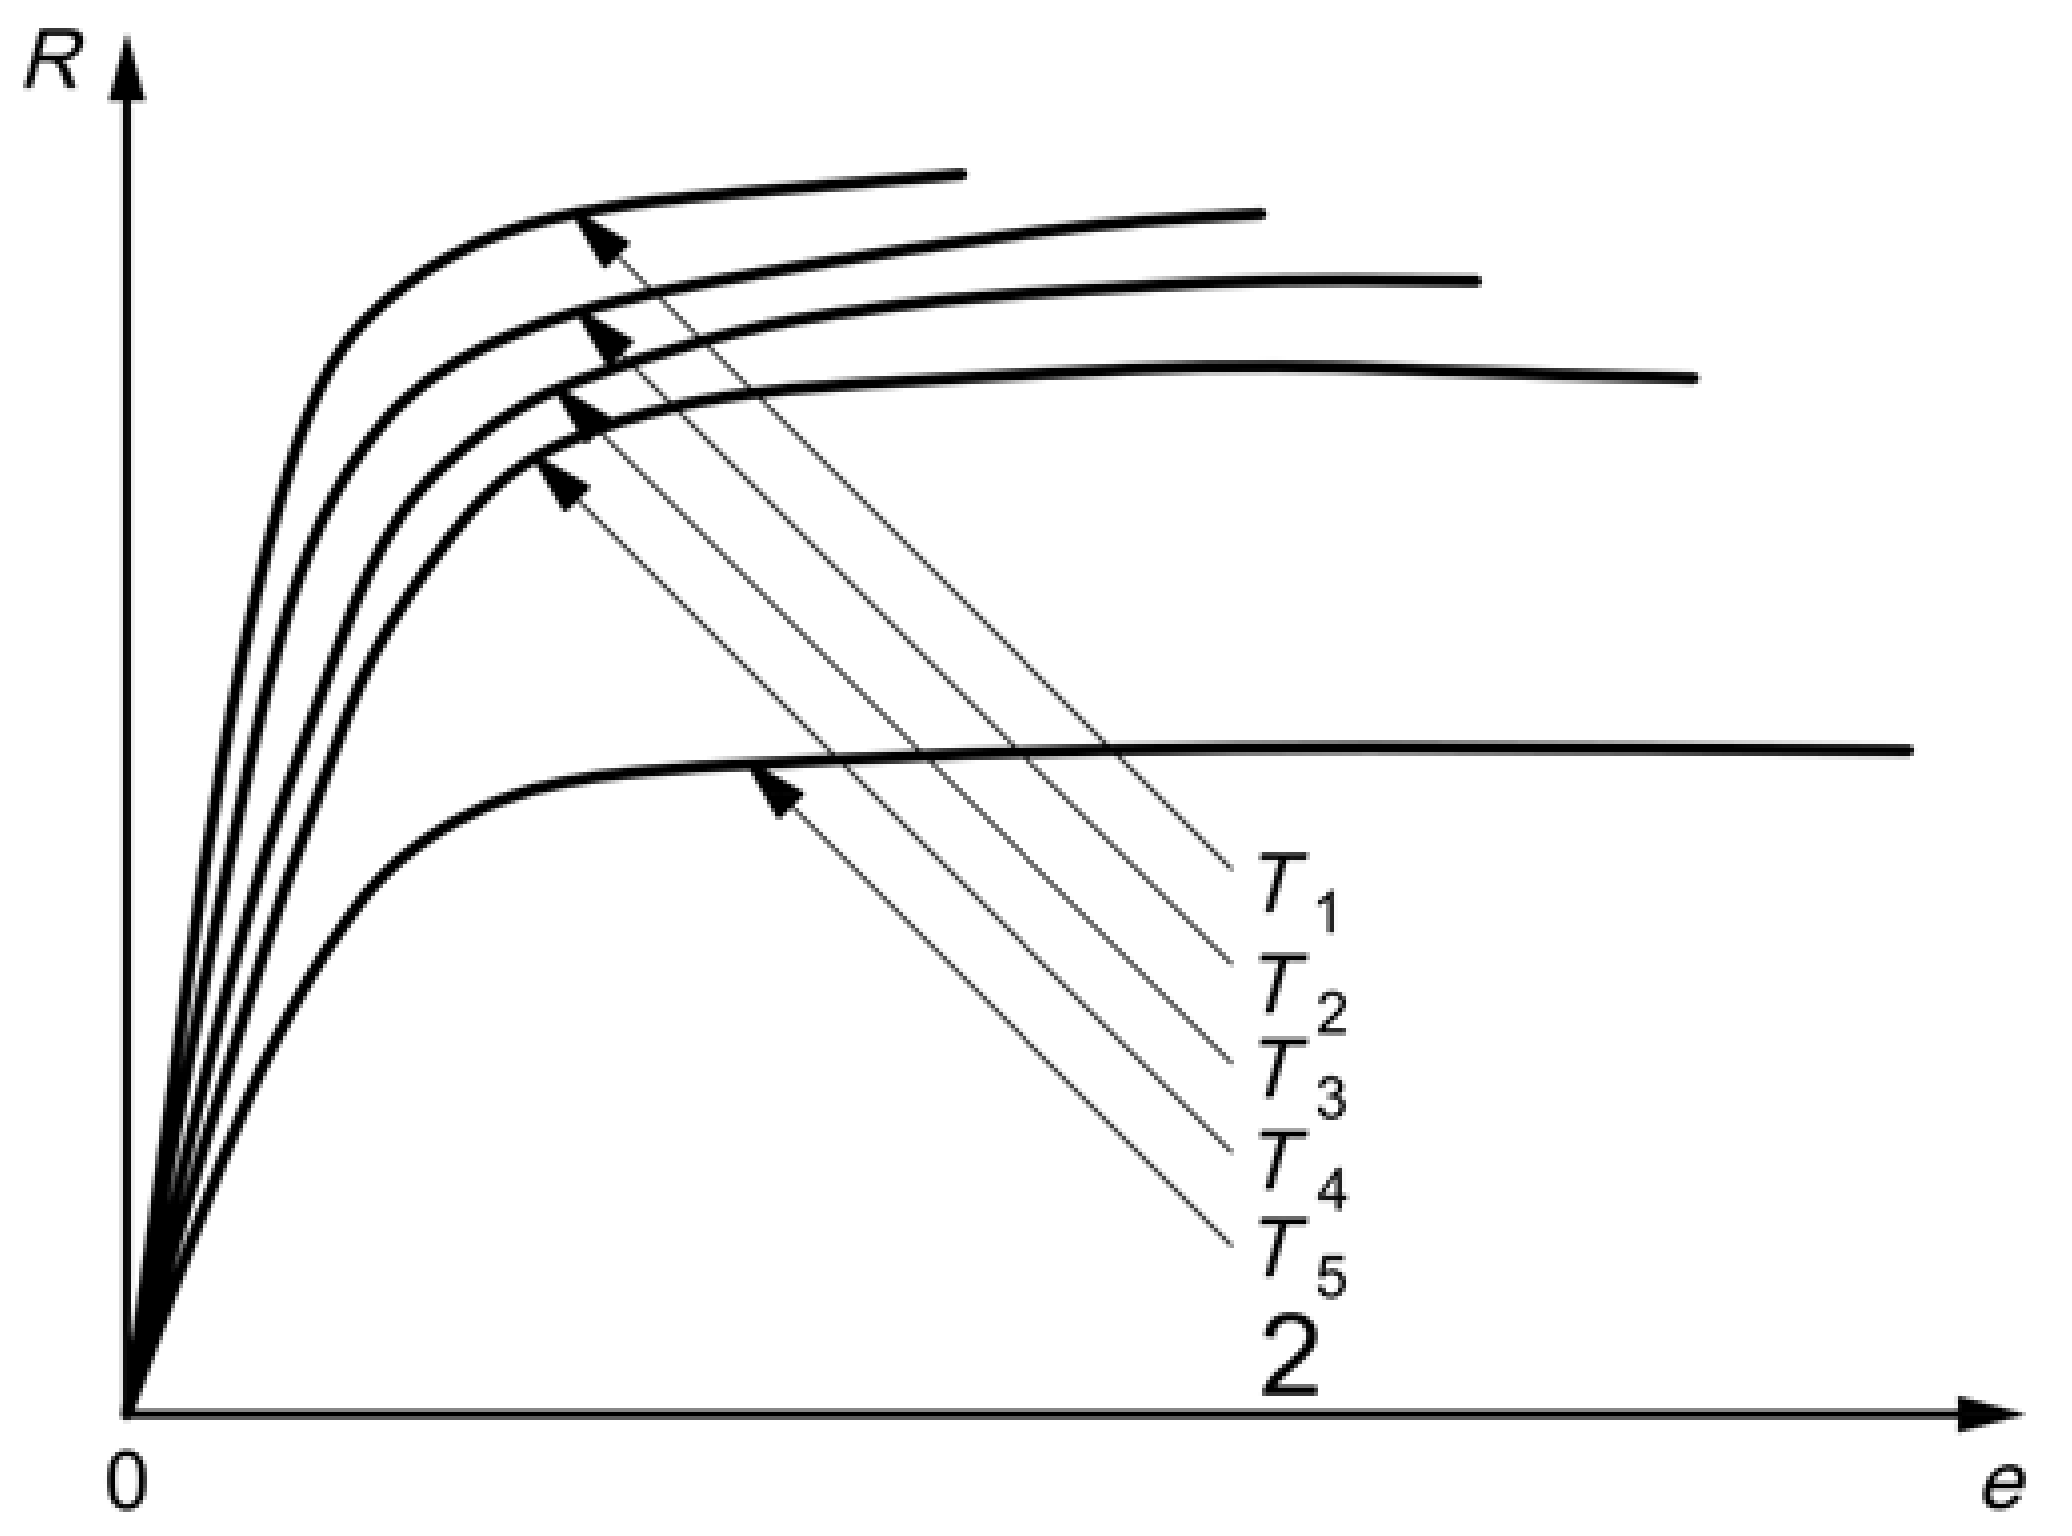
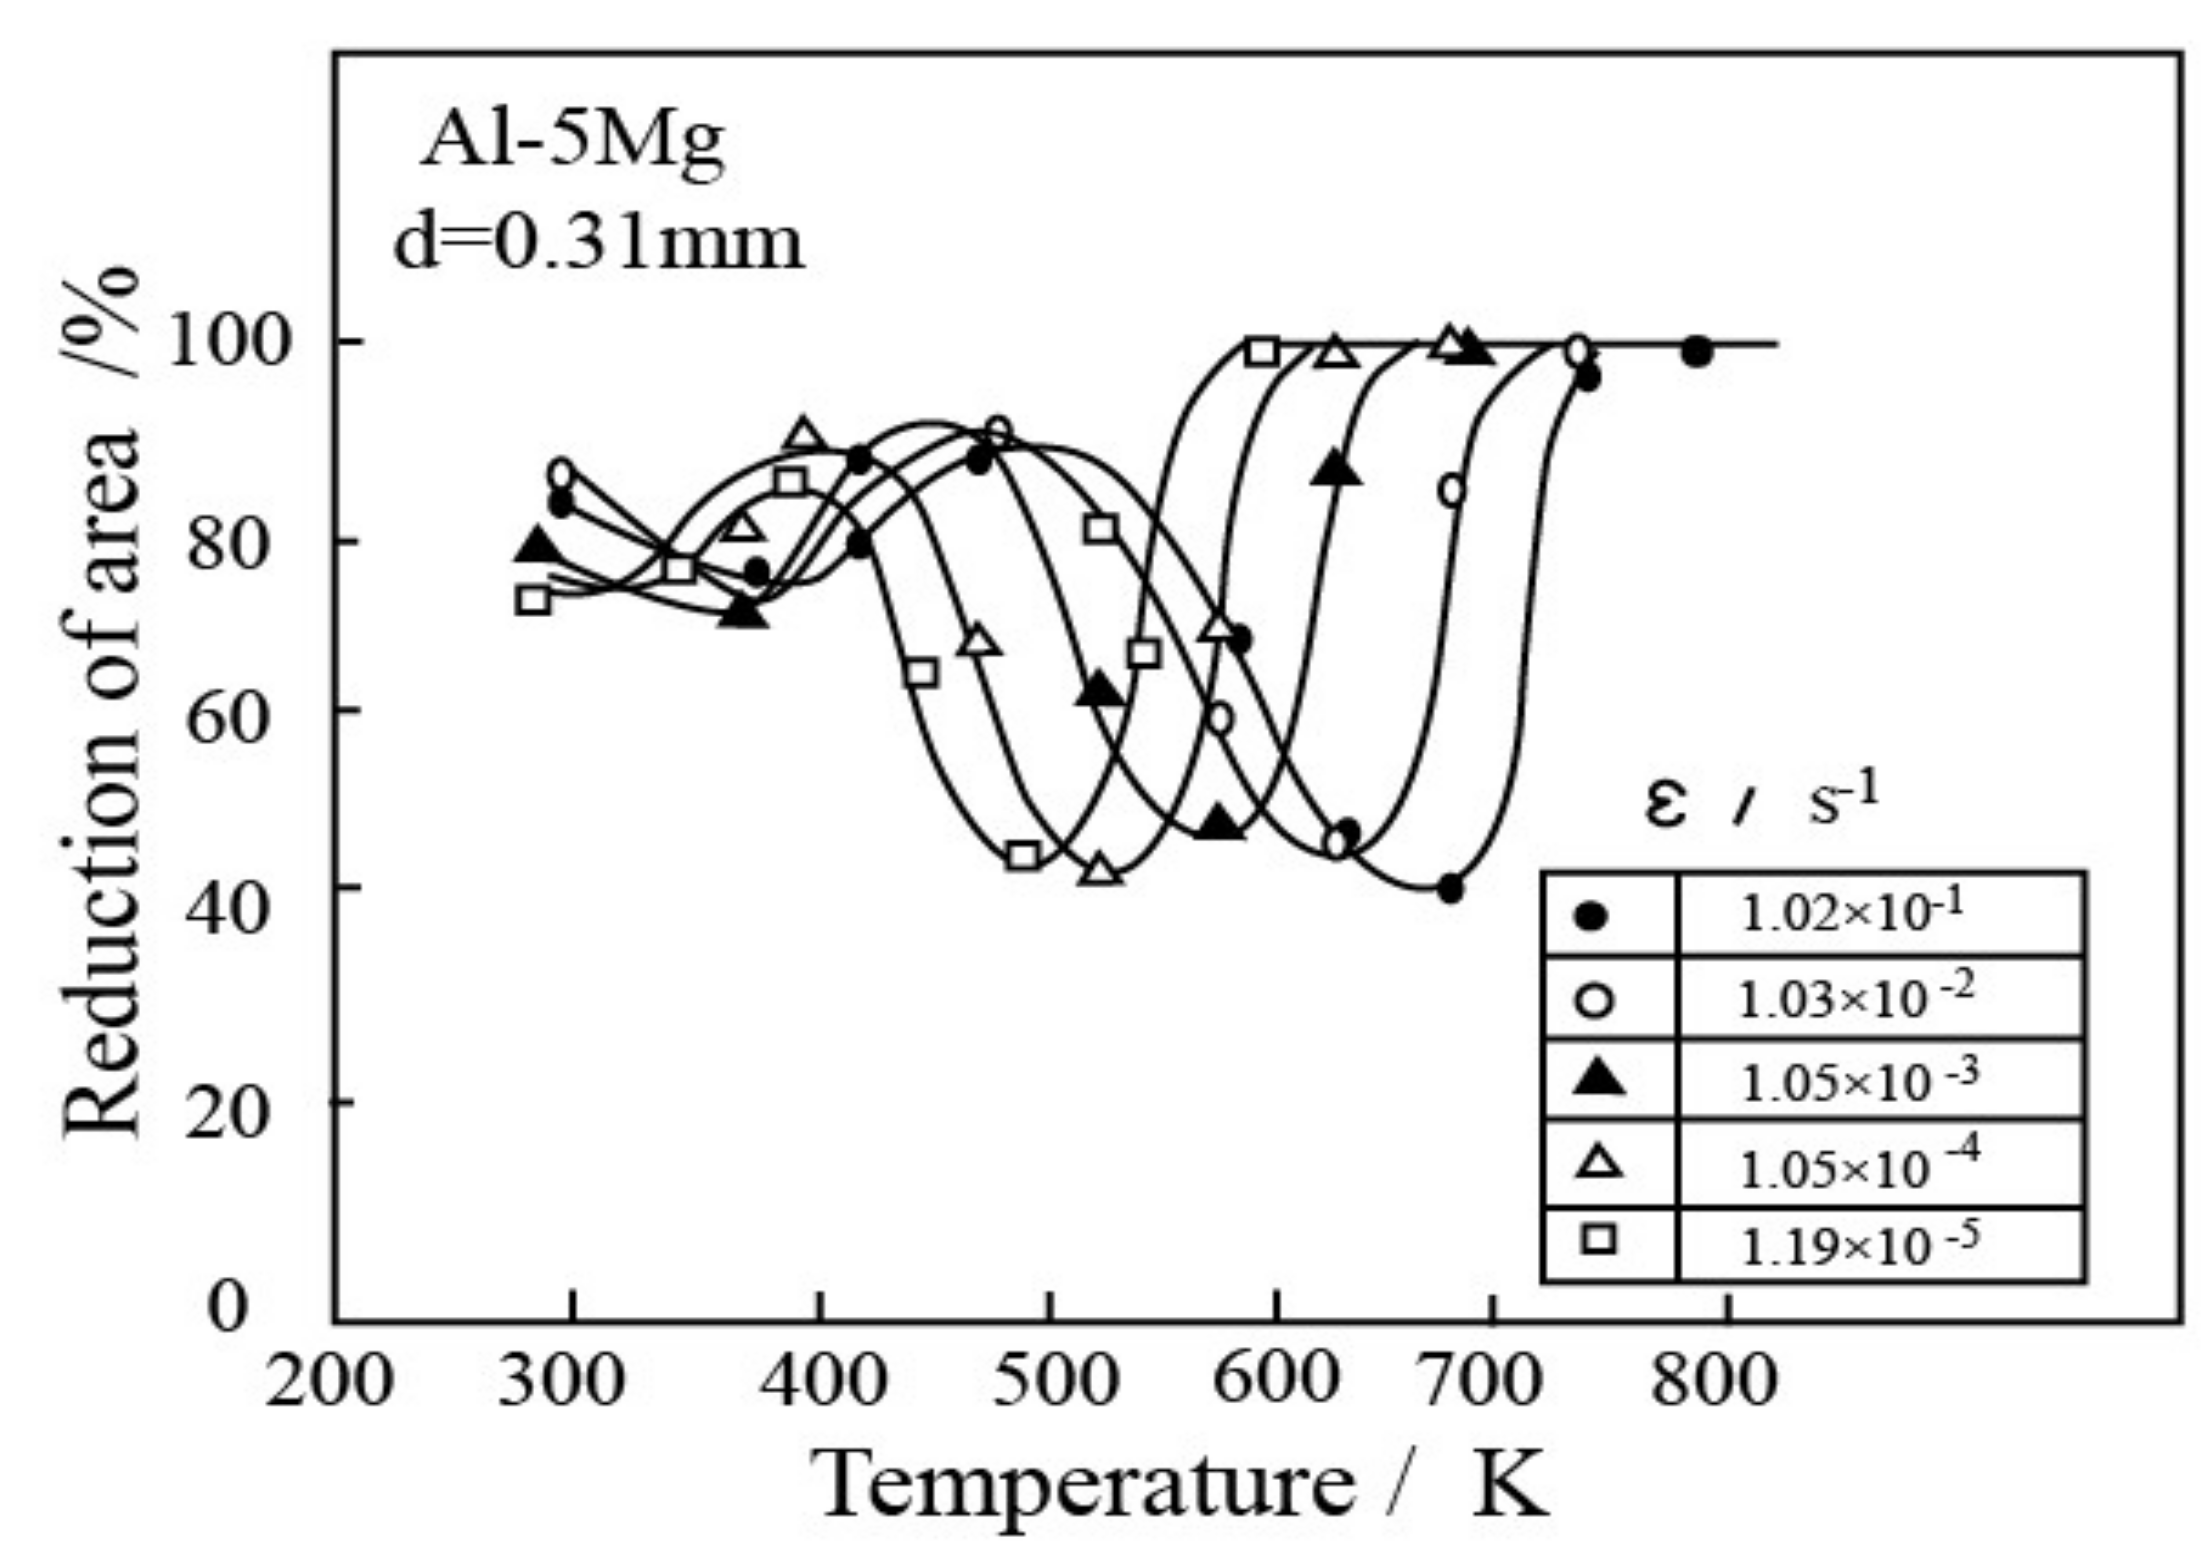
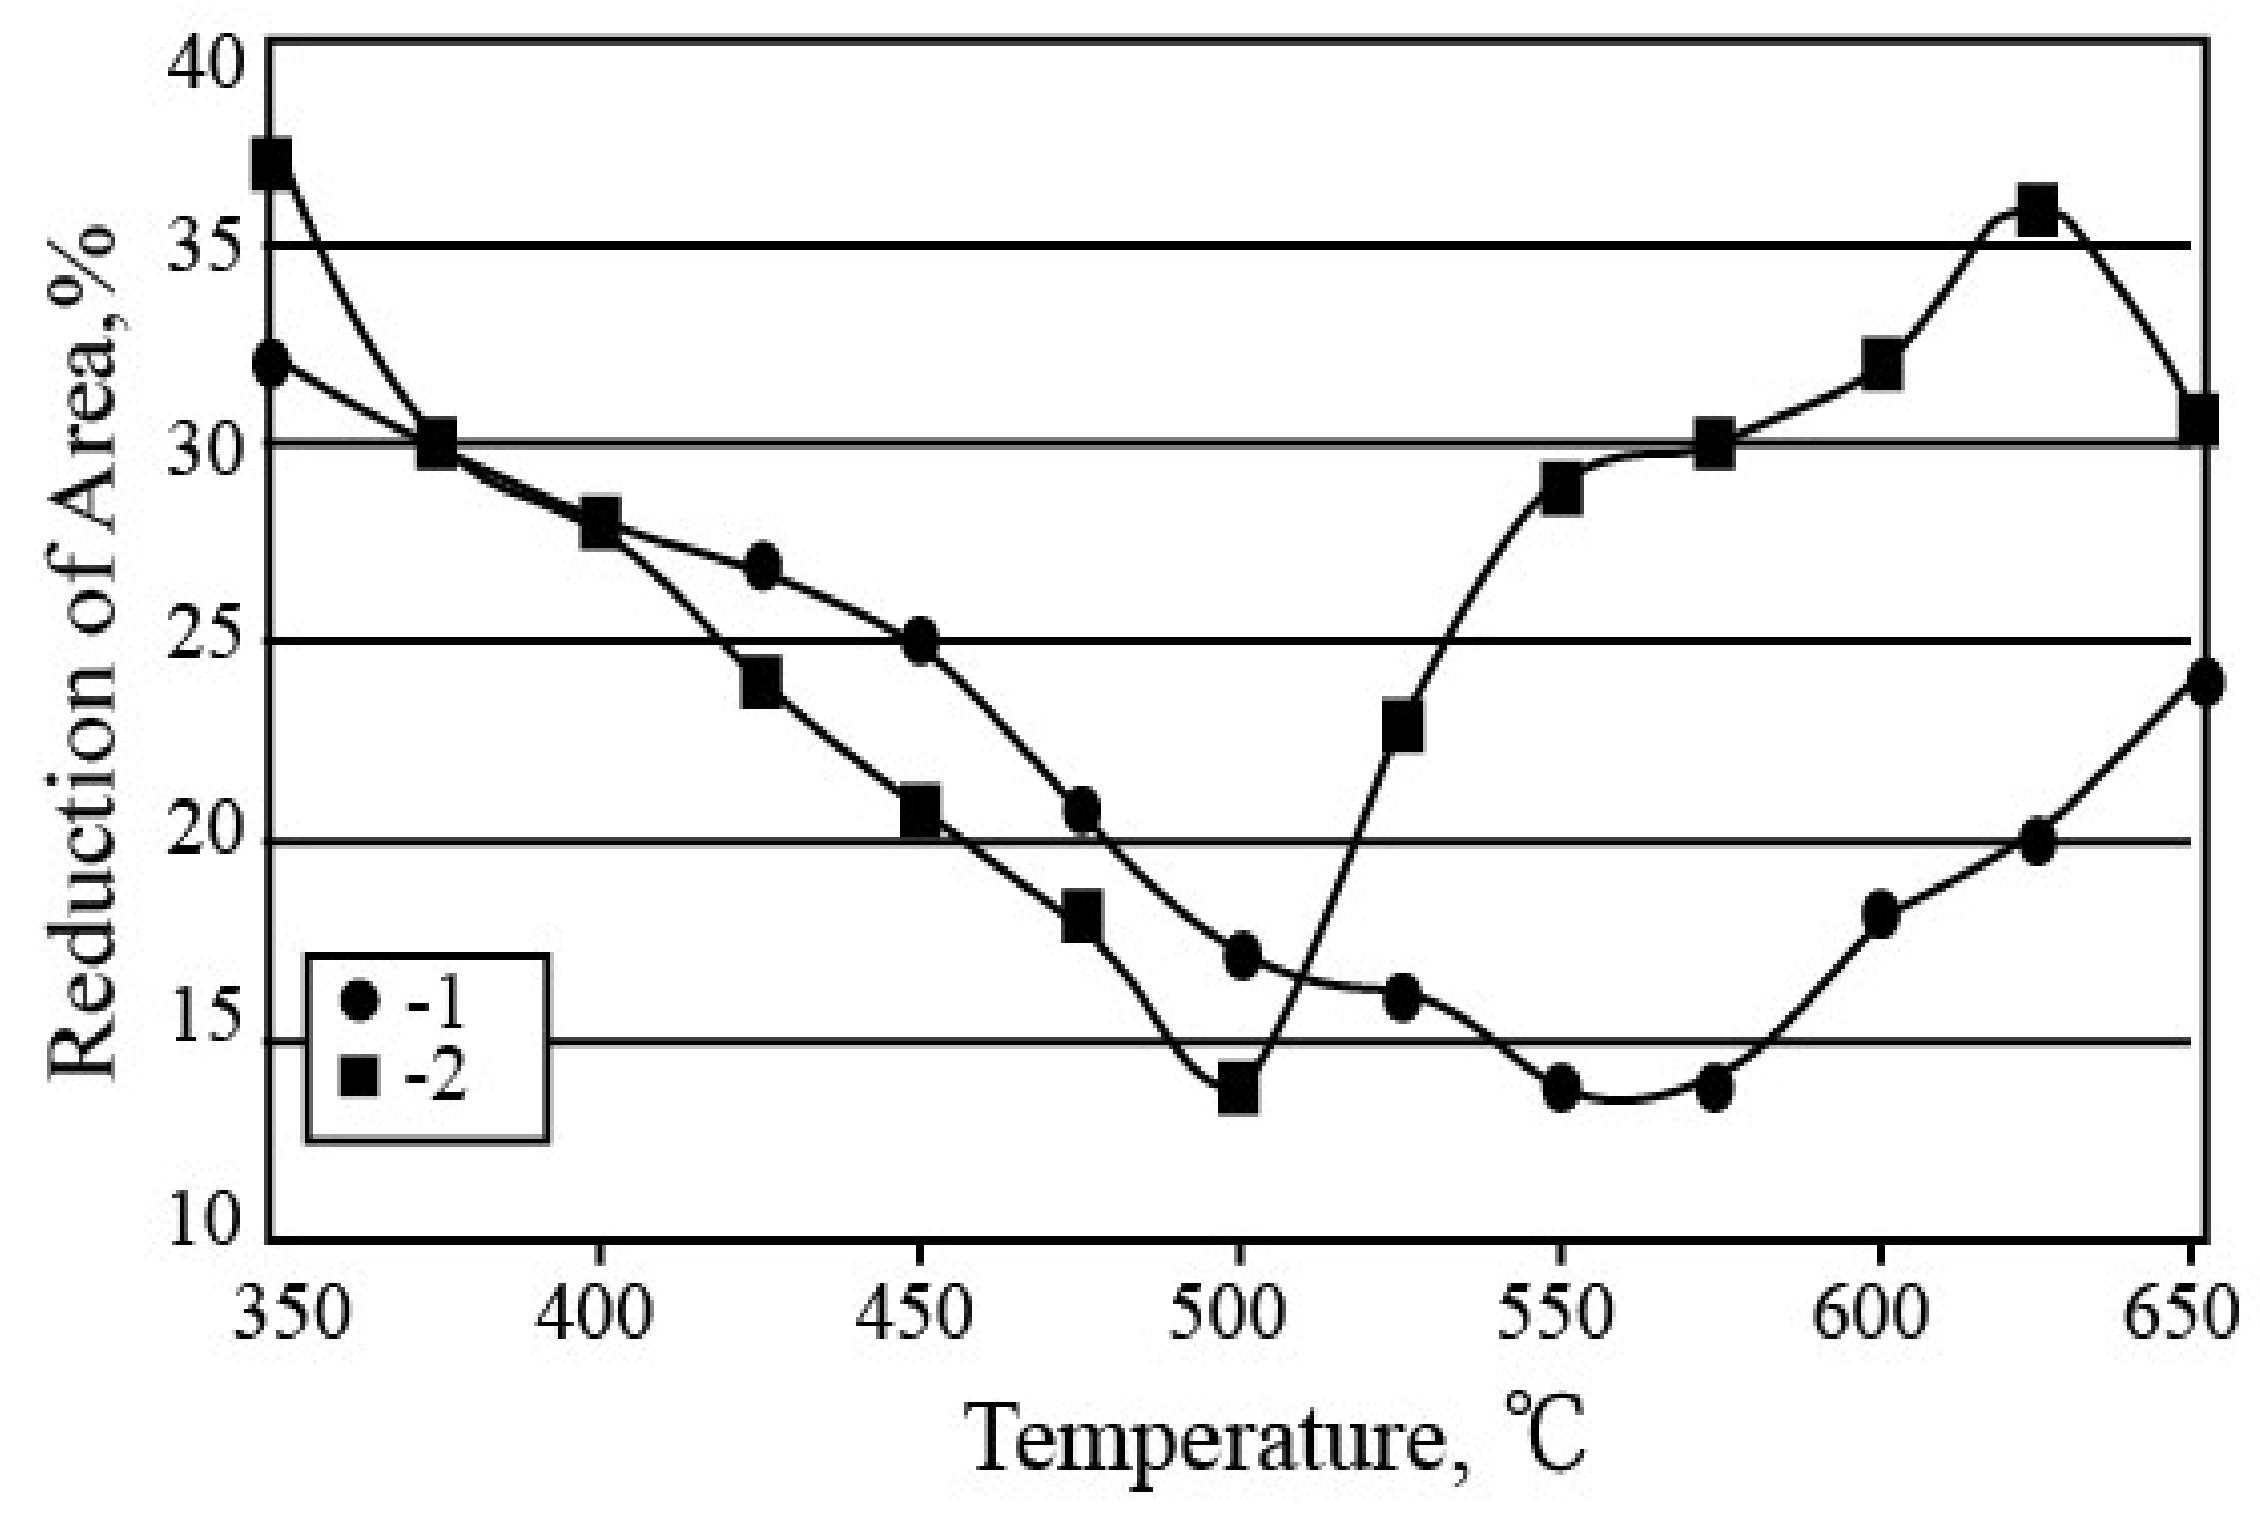
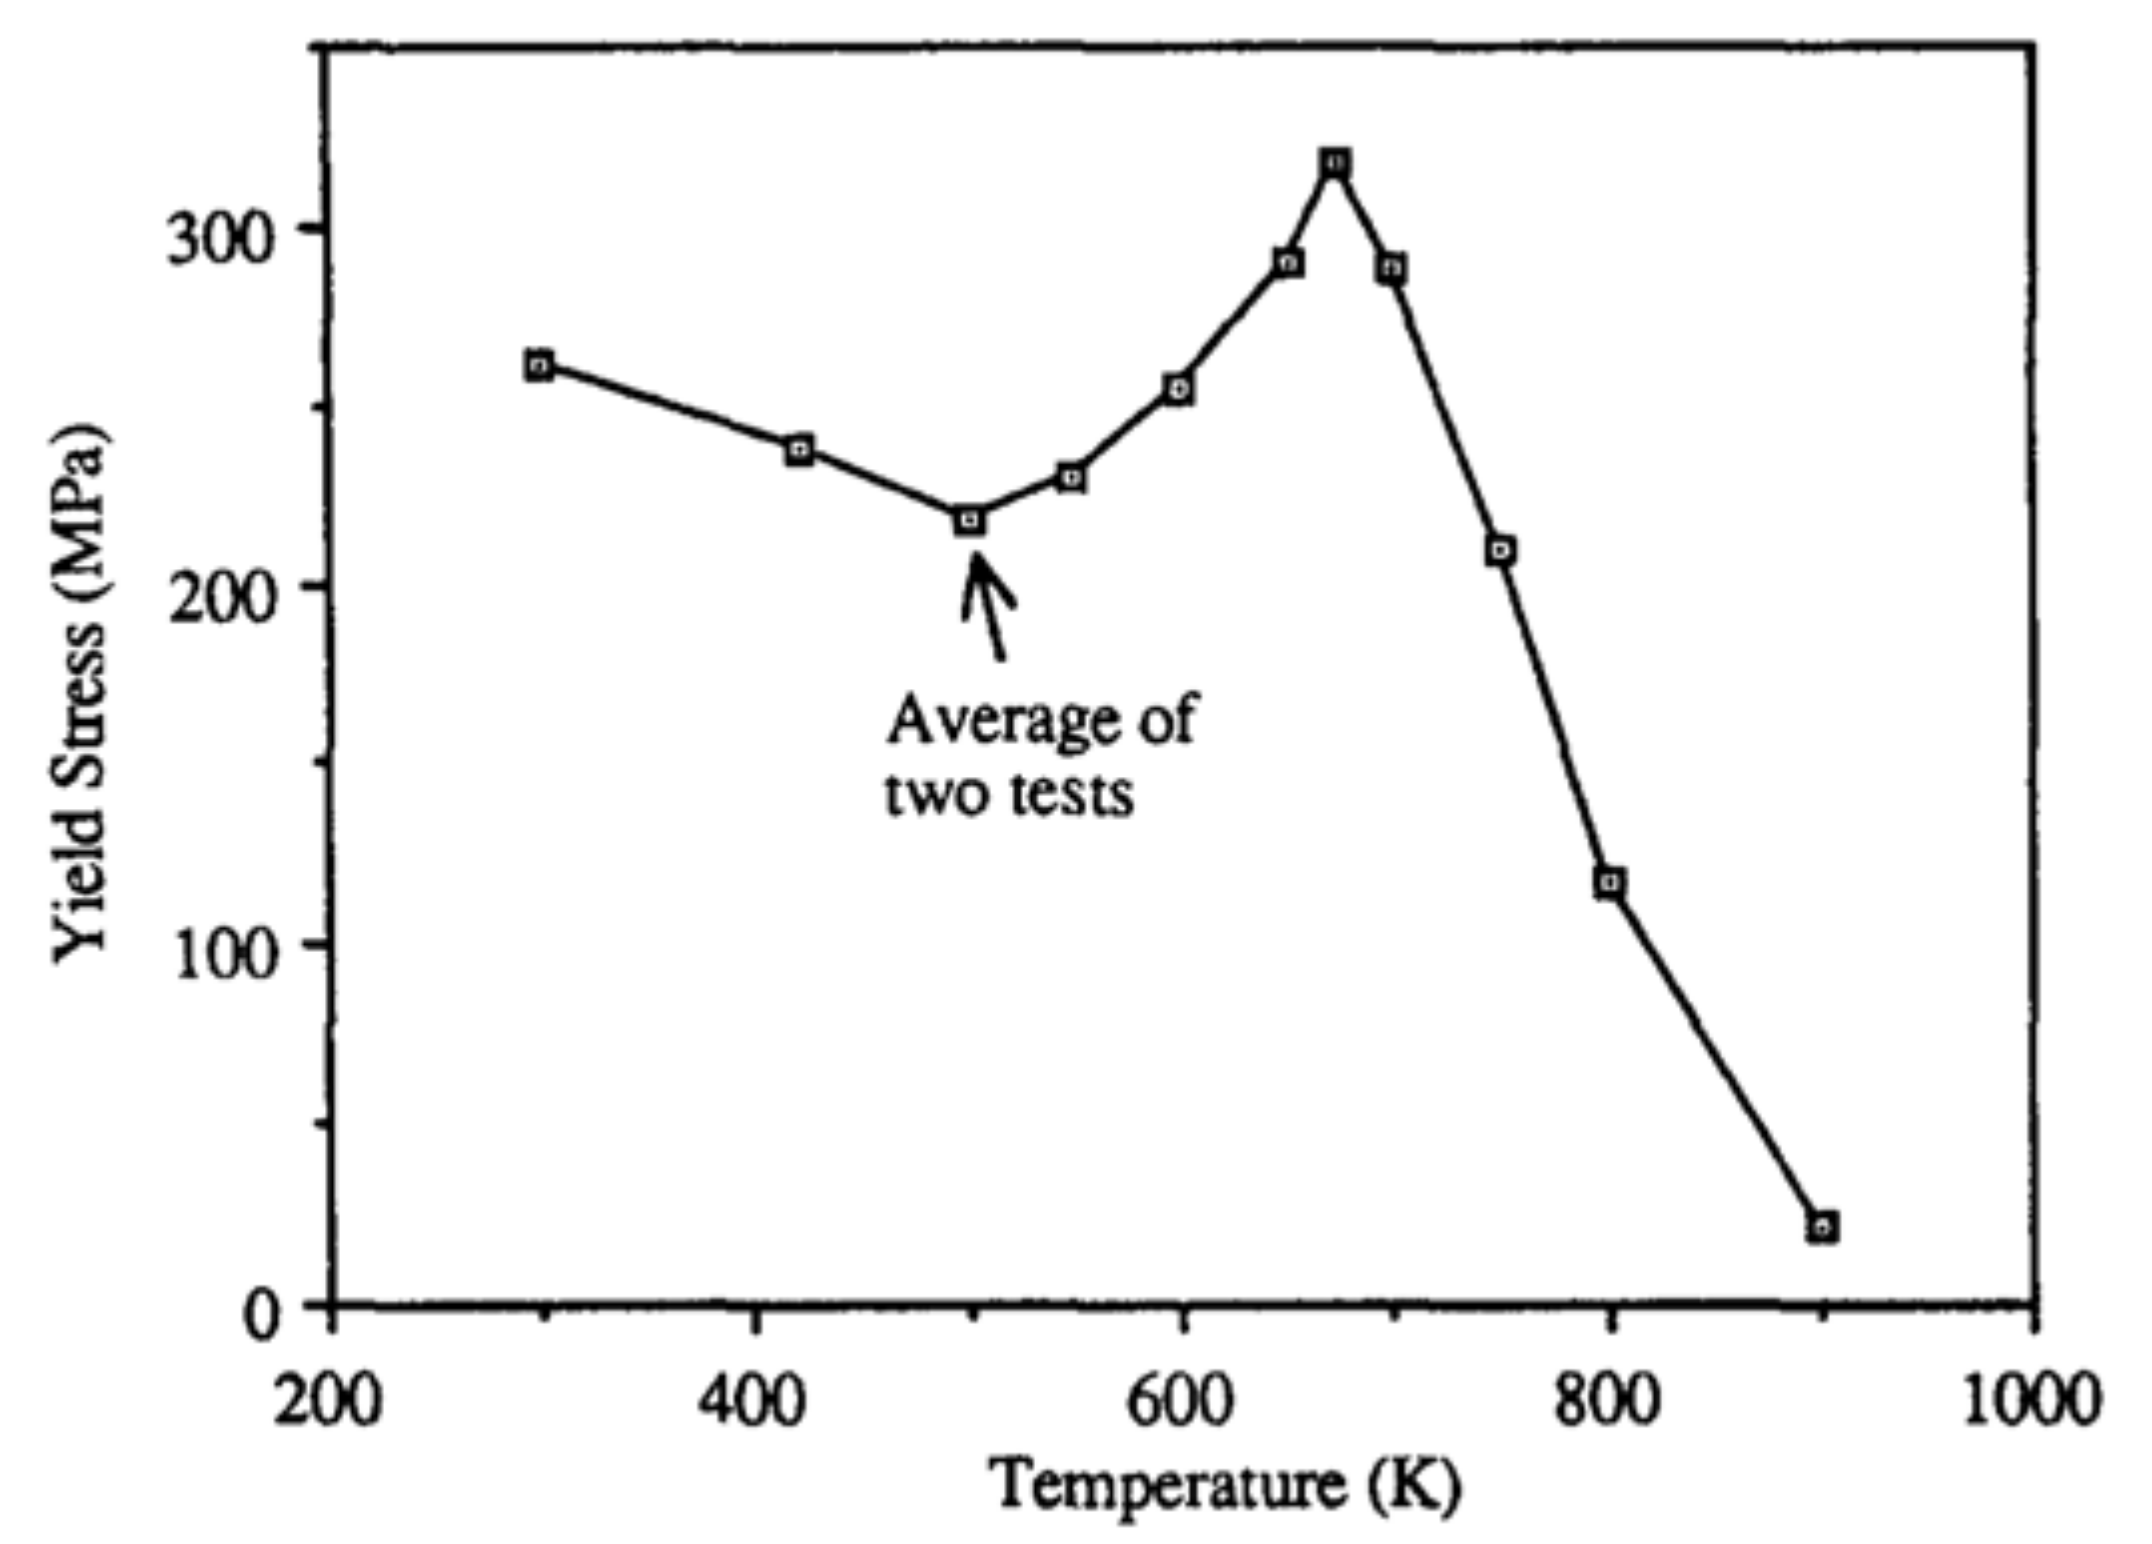
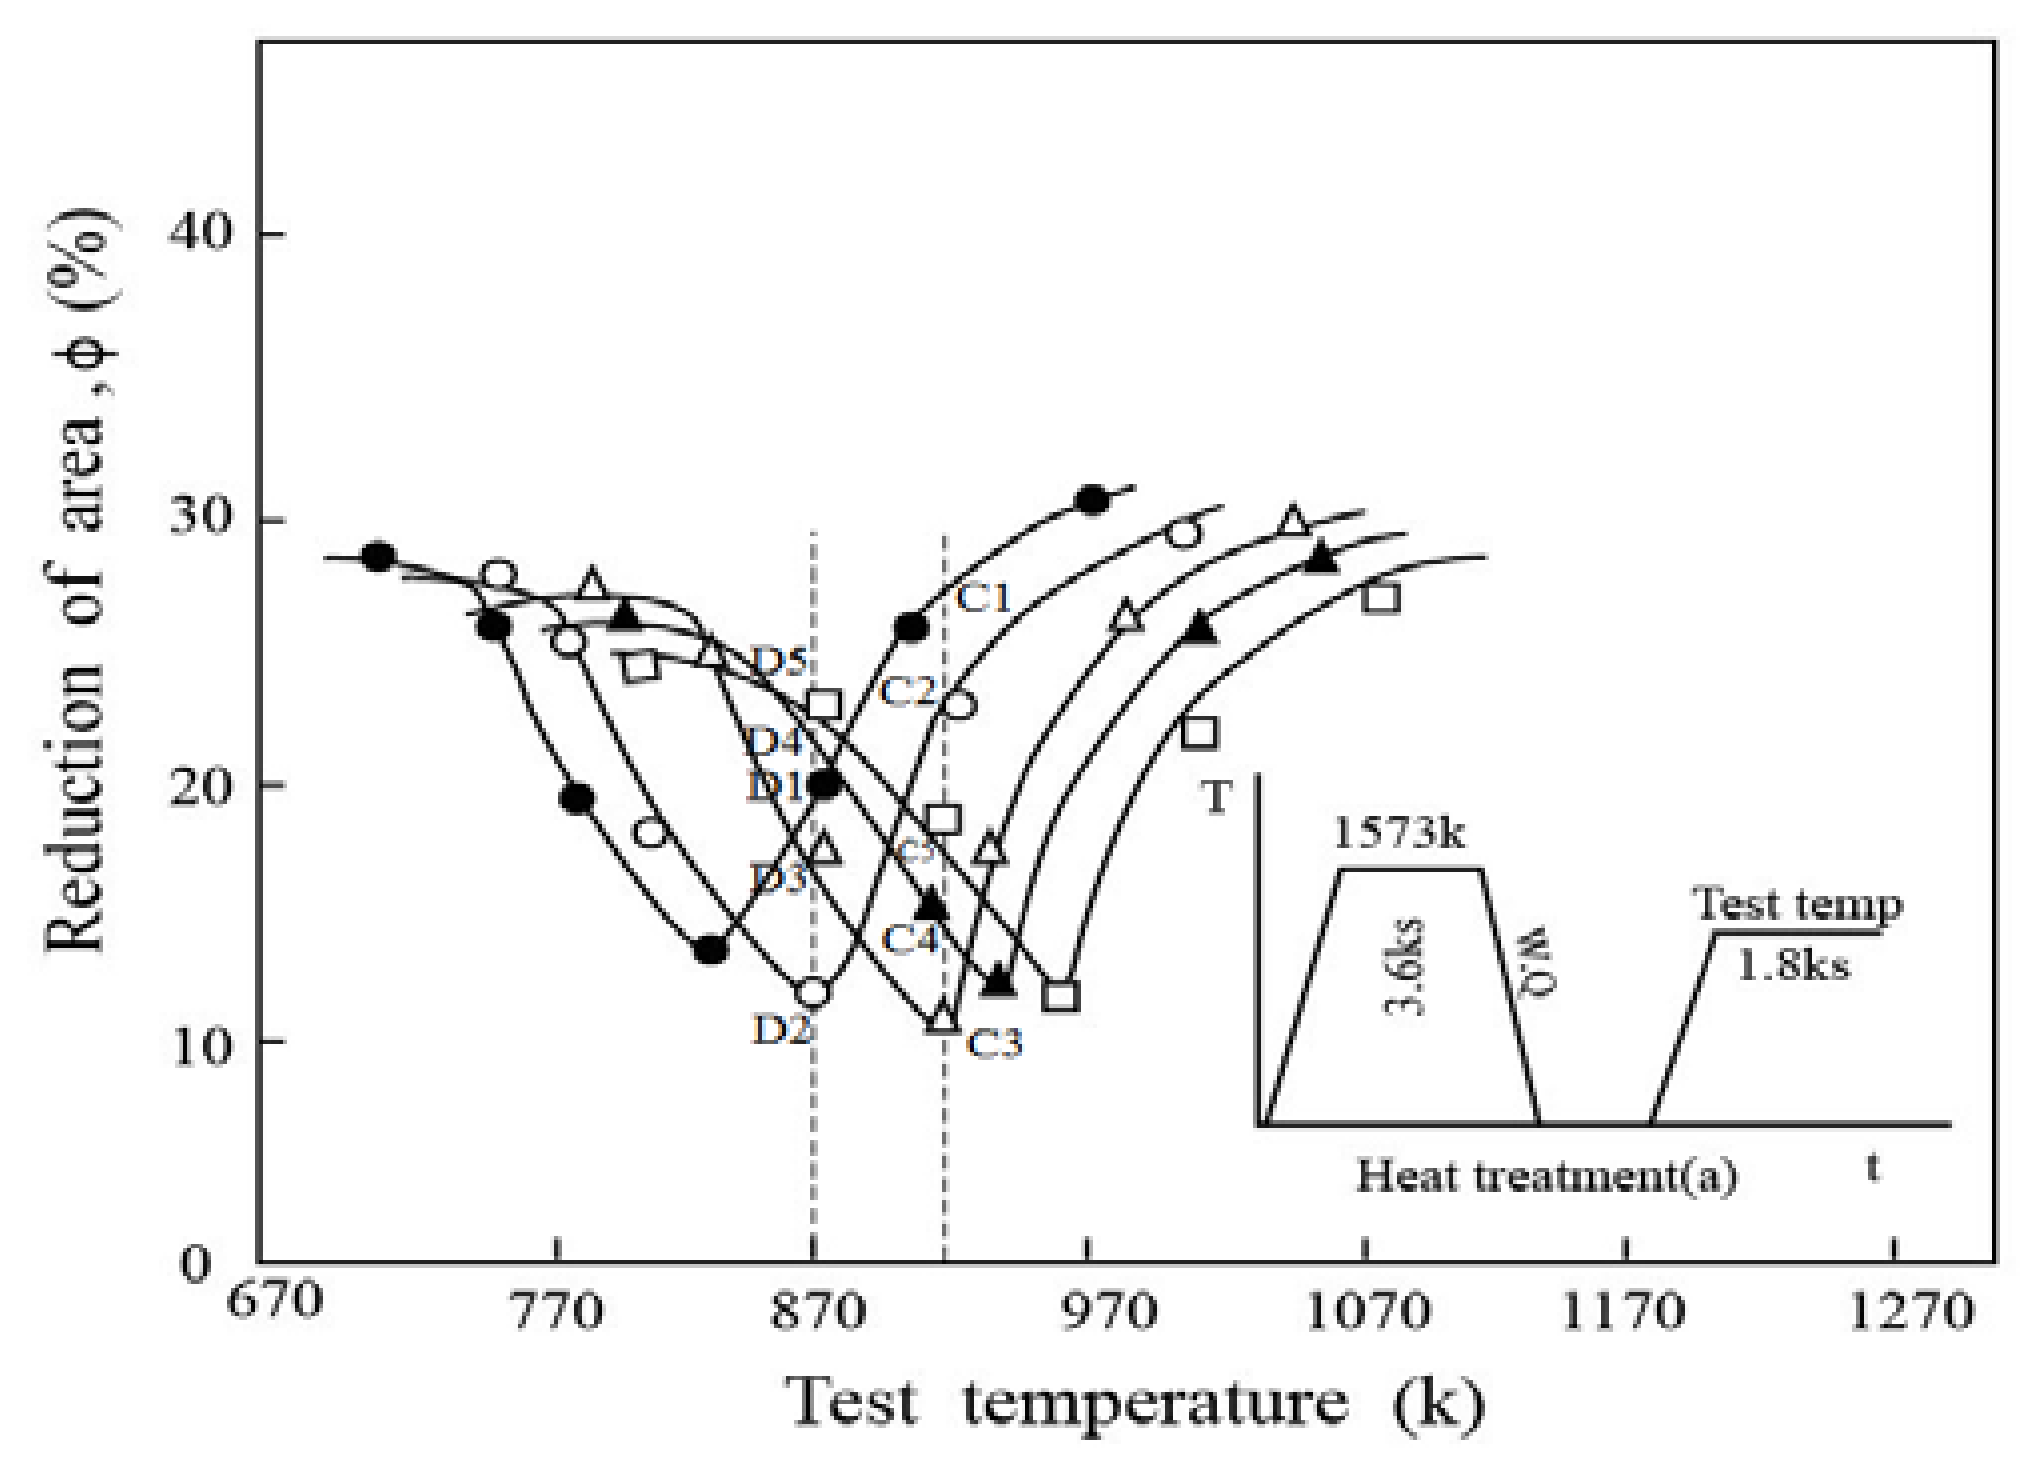
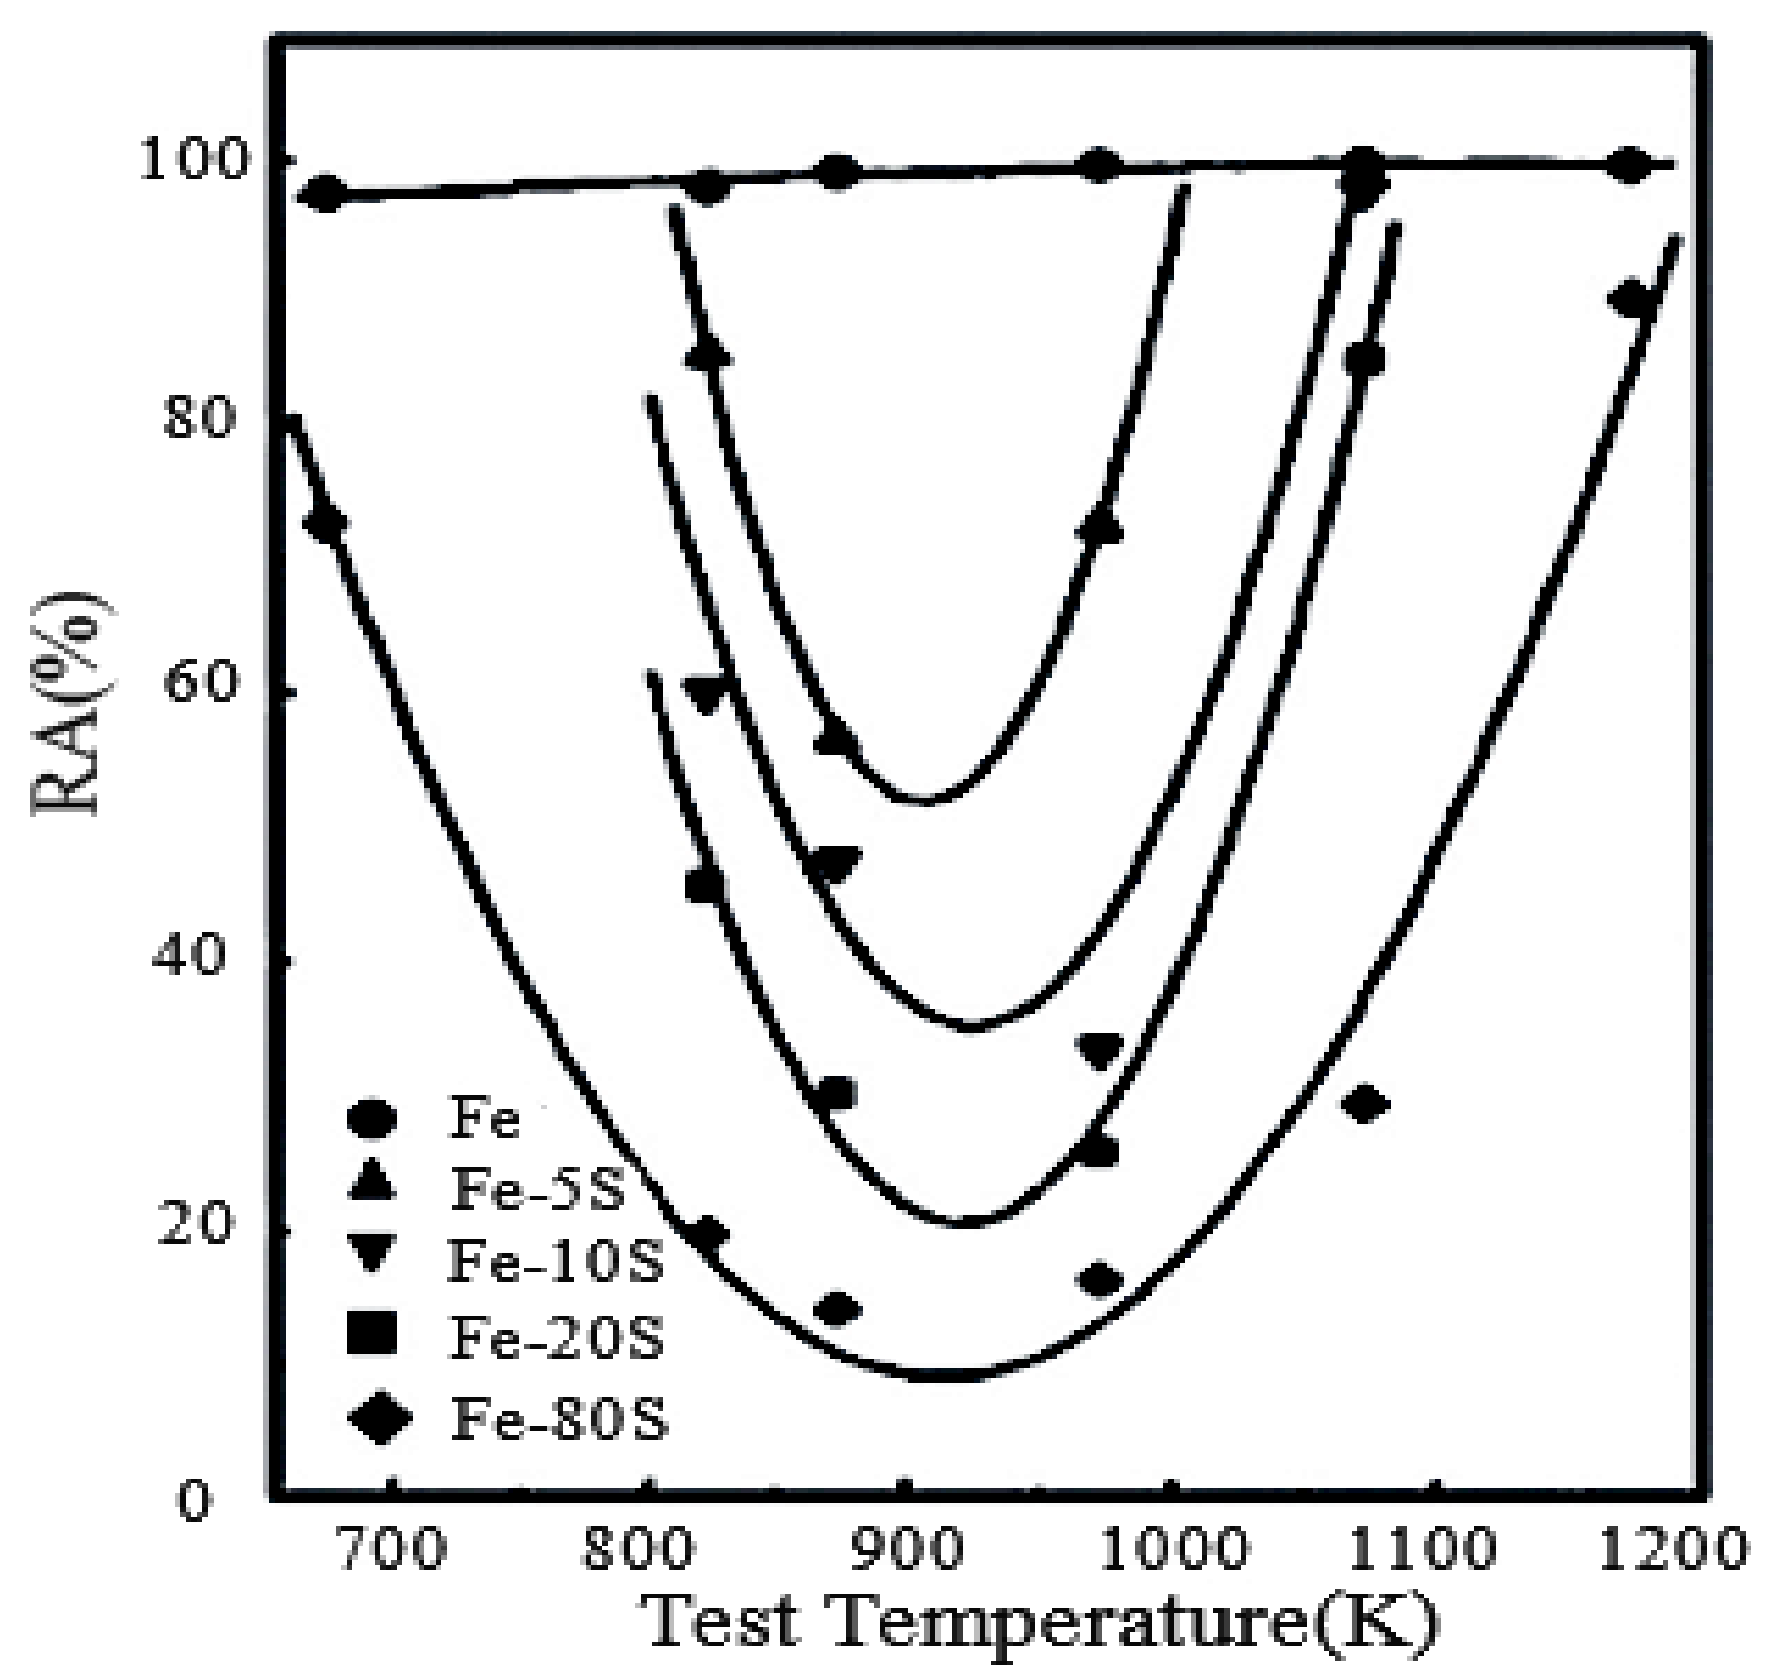
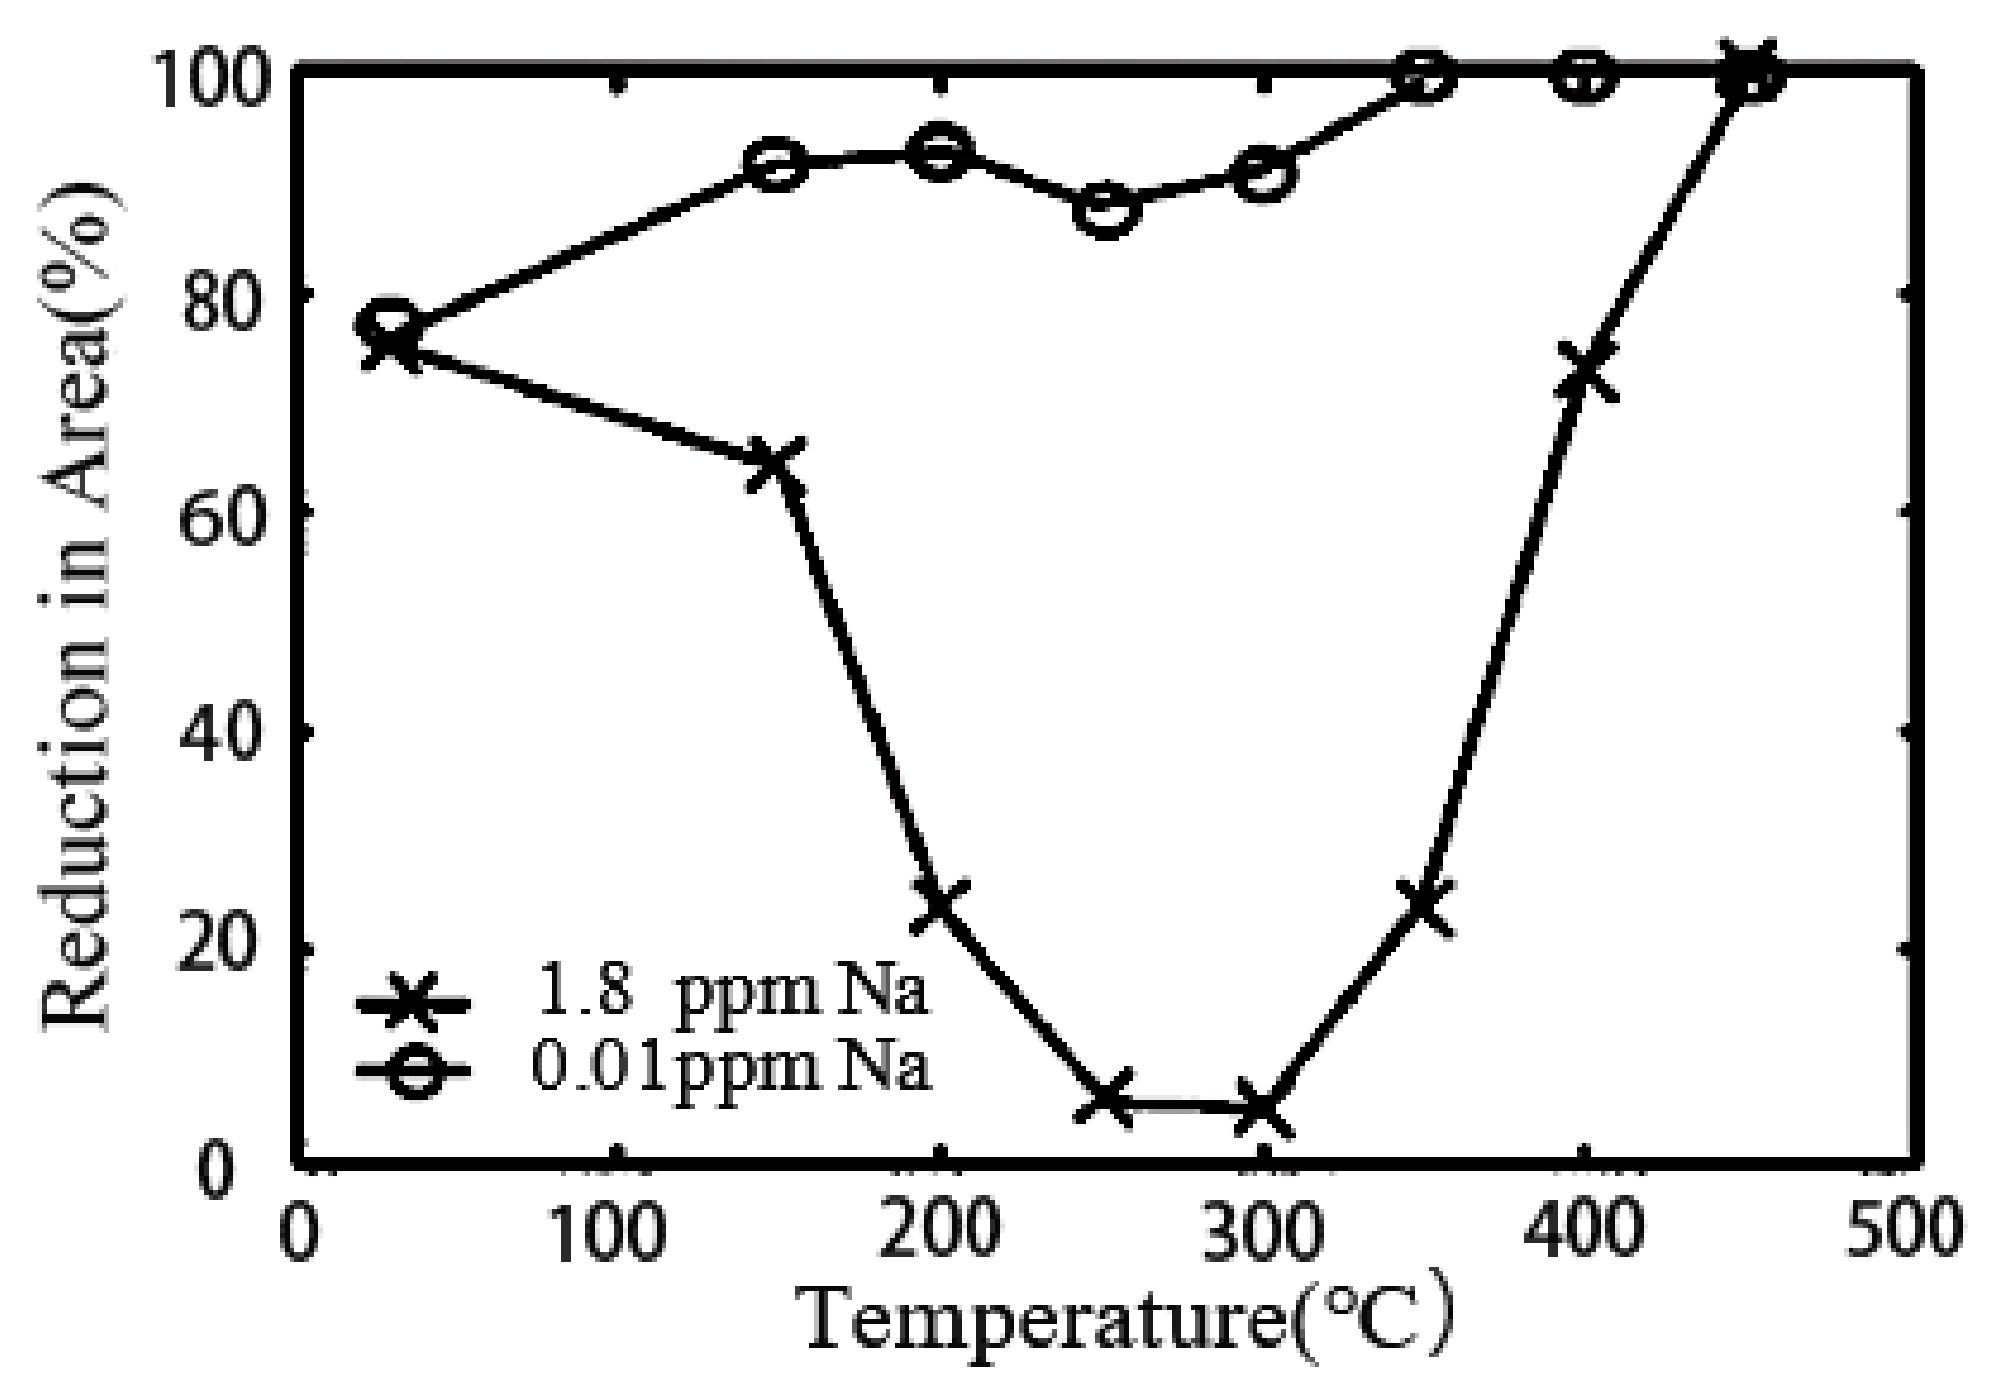
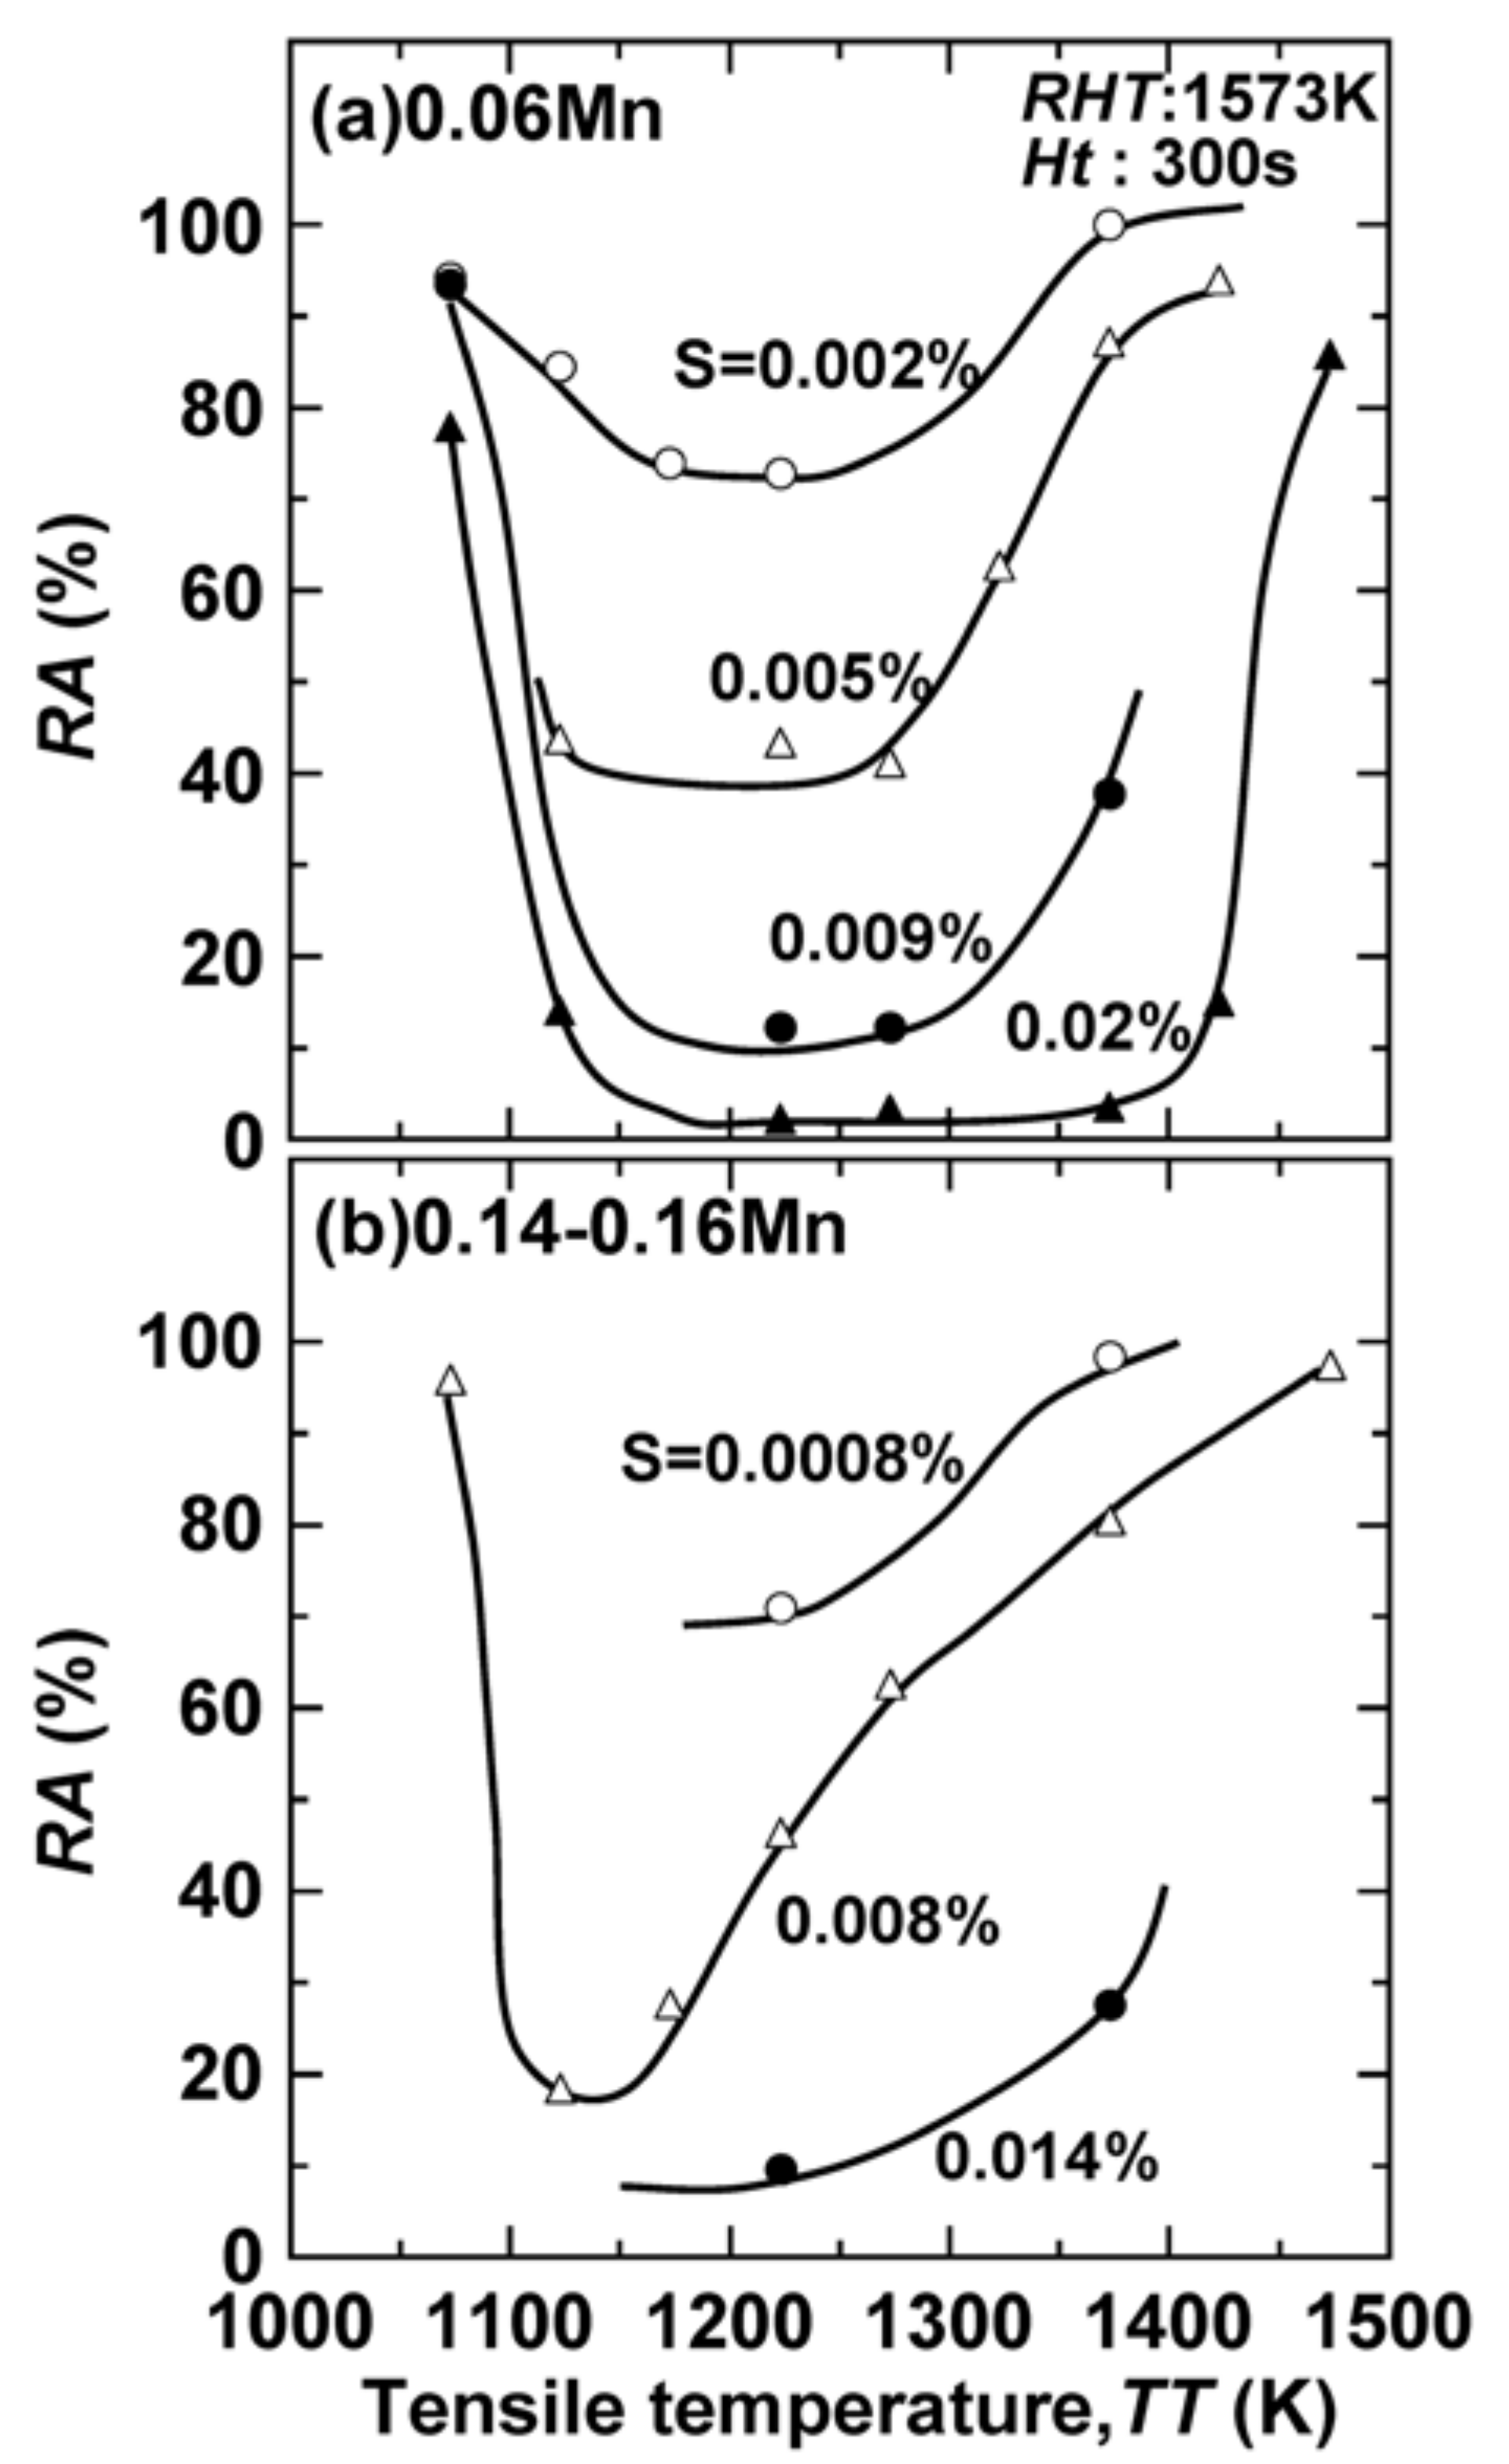
2.1. Uncertainty Relative to Temperature: Intermediate Temperature Embrittlement
- (1)
- Reduction of area varies with testing temperature for a given strain rate.
- (2)
- There is a testing temperature at which the reduction of area reaches a minimum.
- (3)
- The testing temperature corresponding to the minimum reduction of area shifts to lower temperatures with decreasing strain rate.
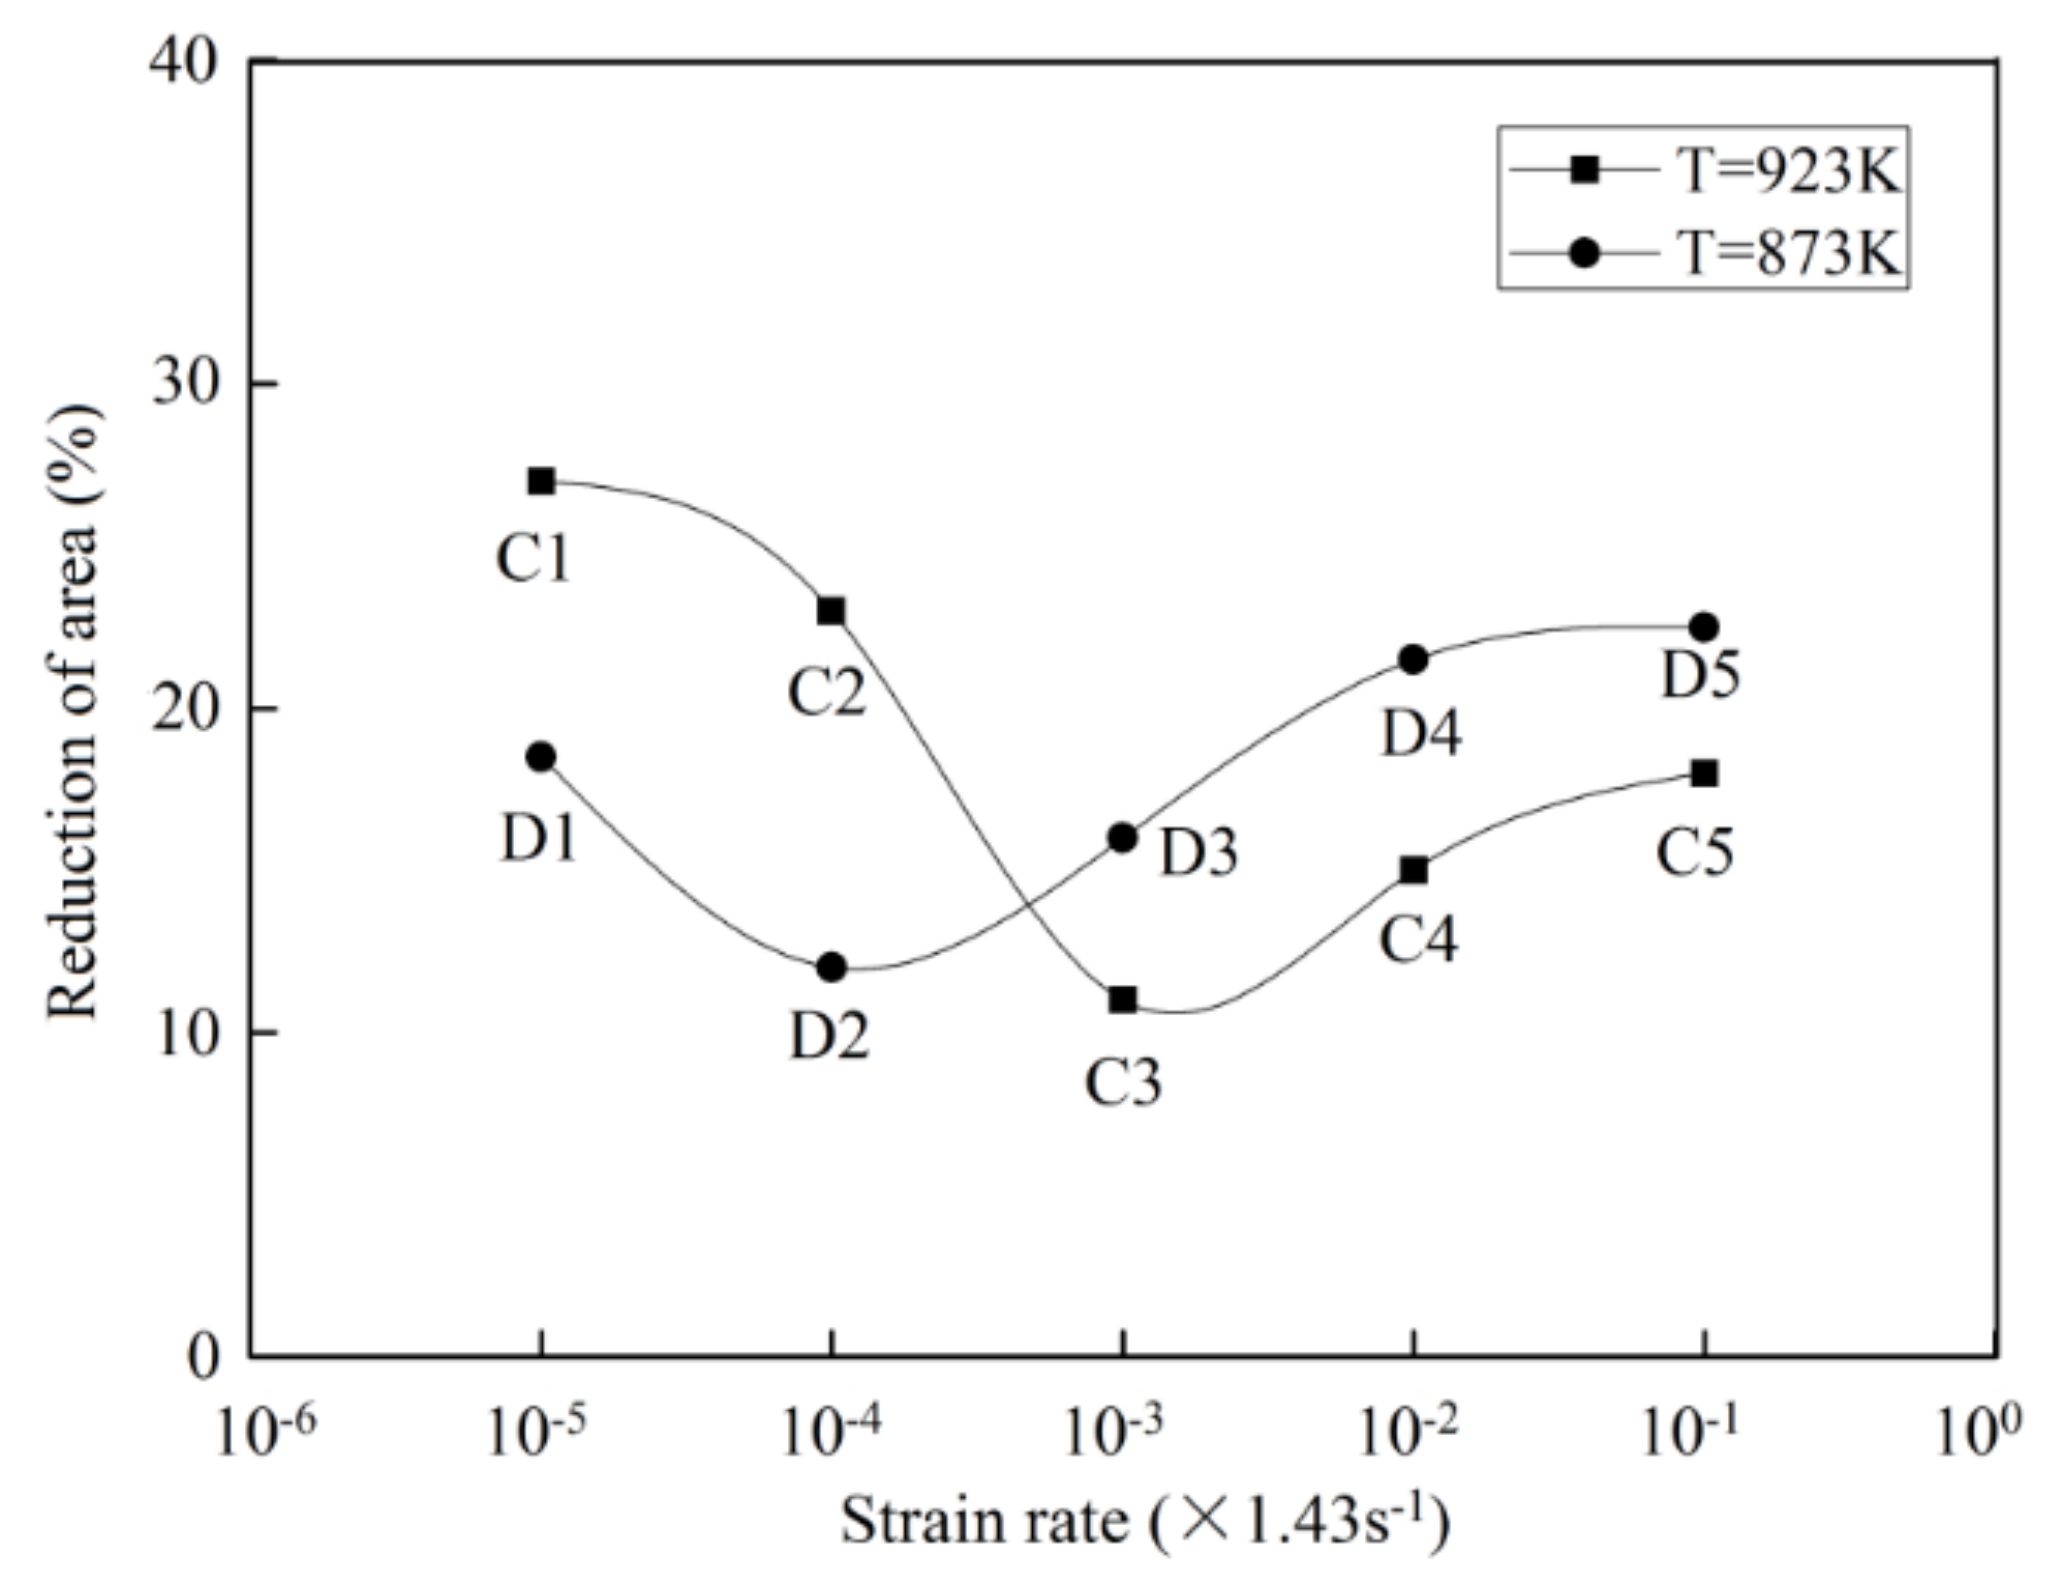
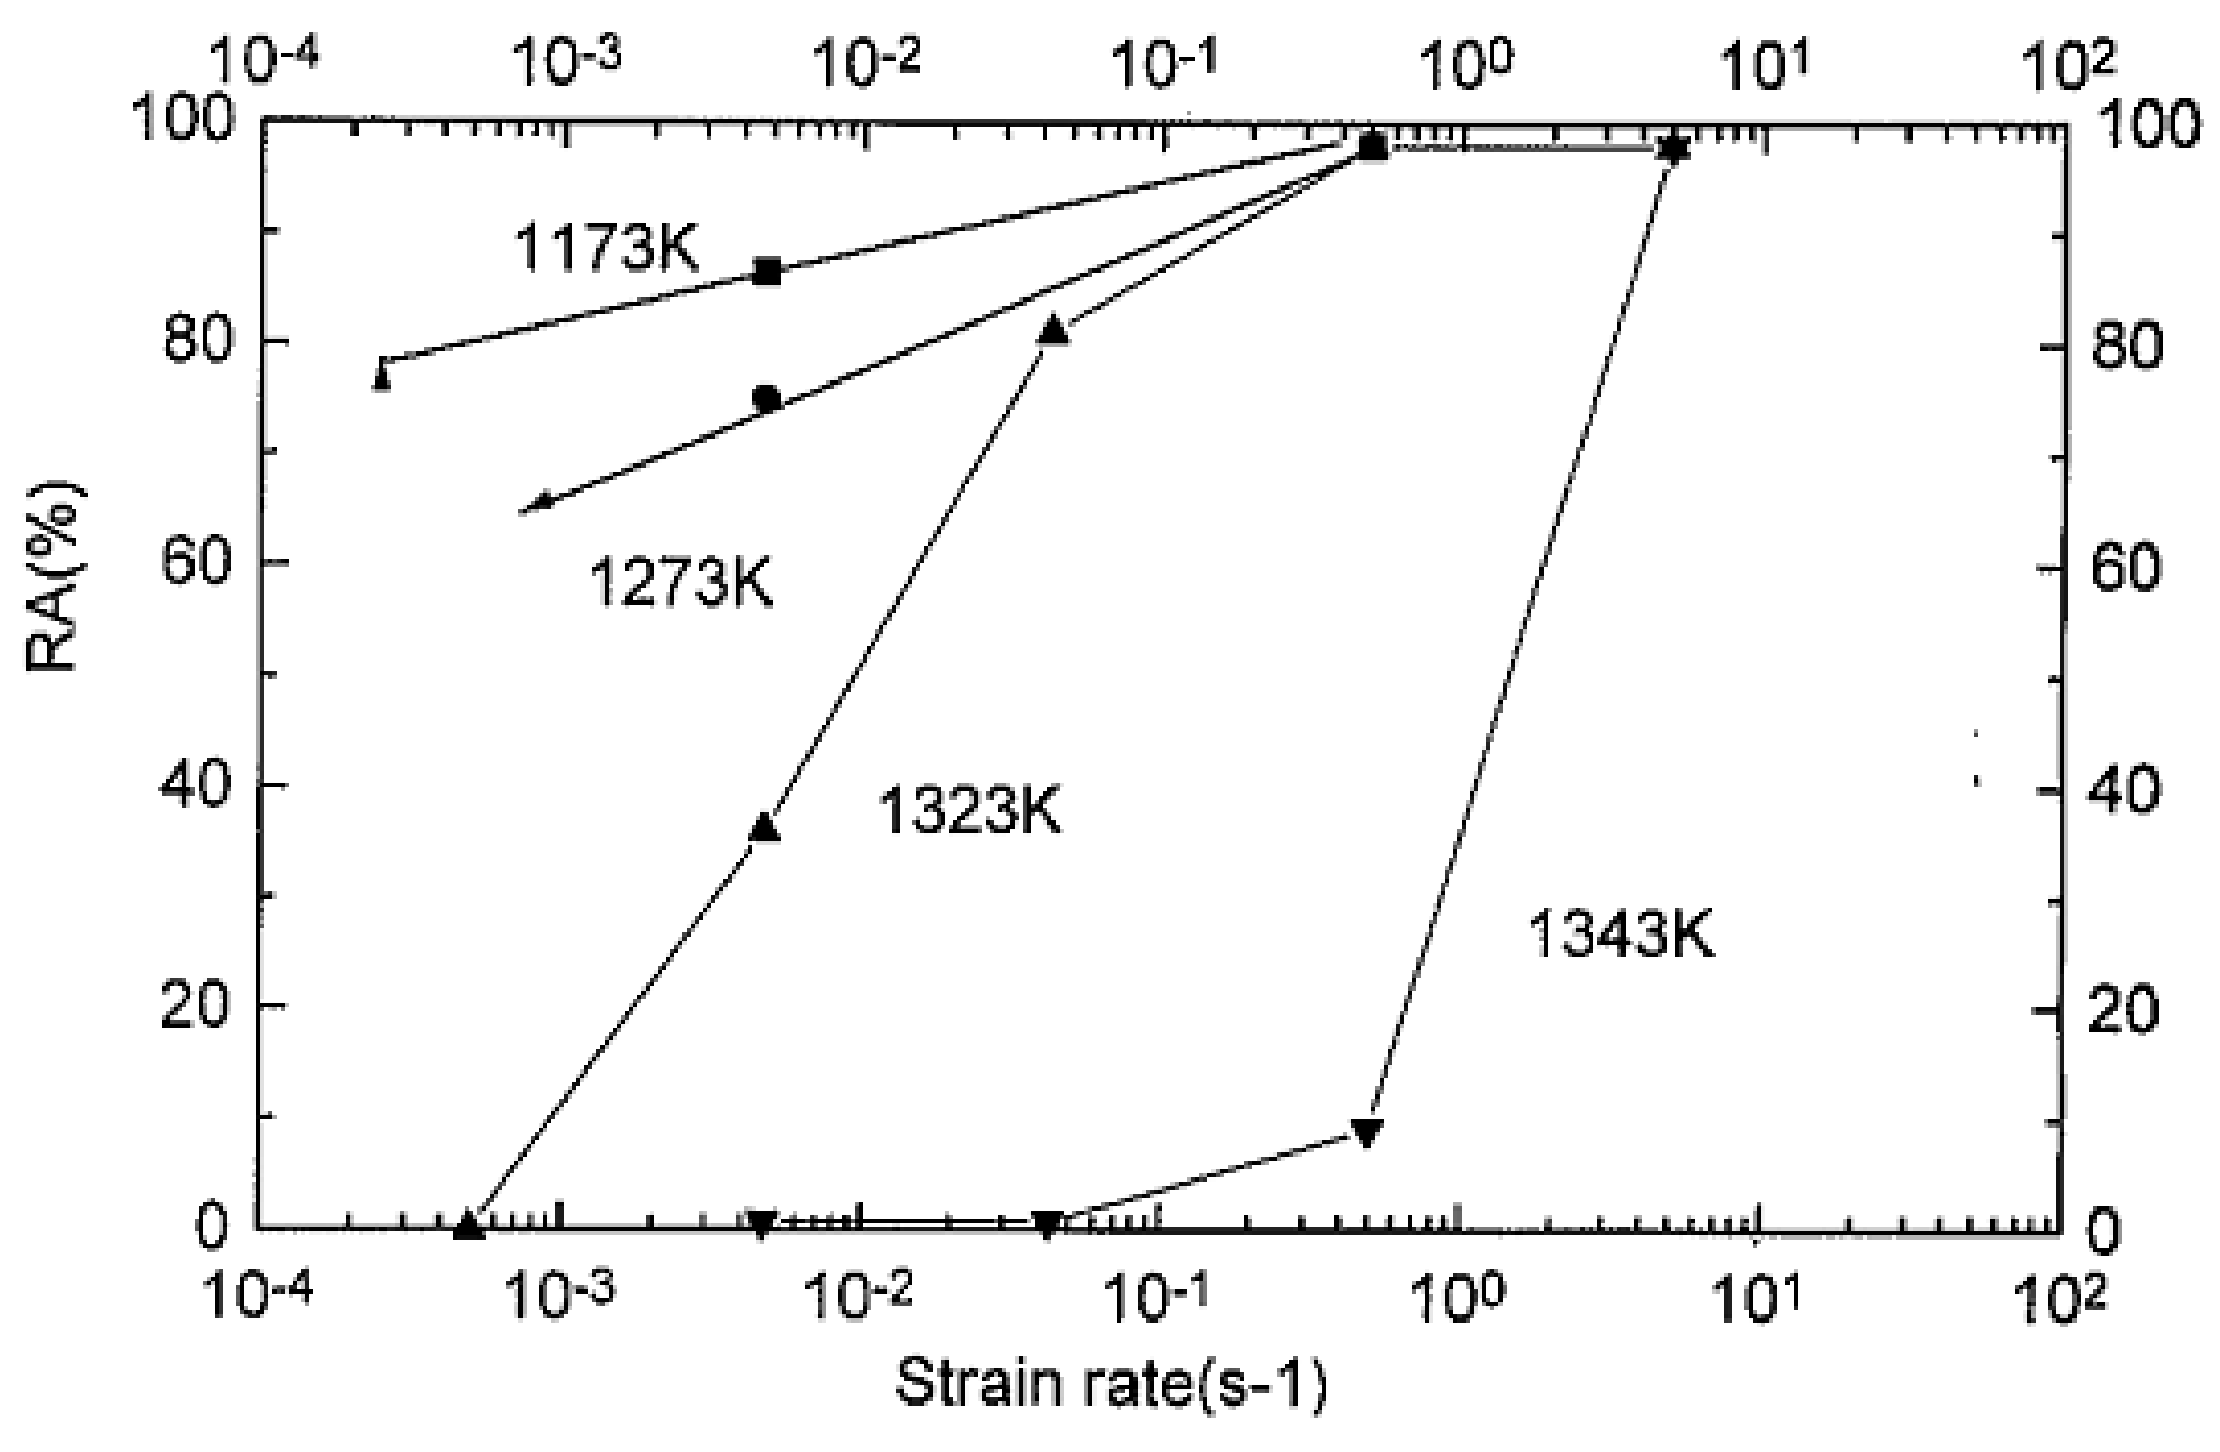
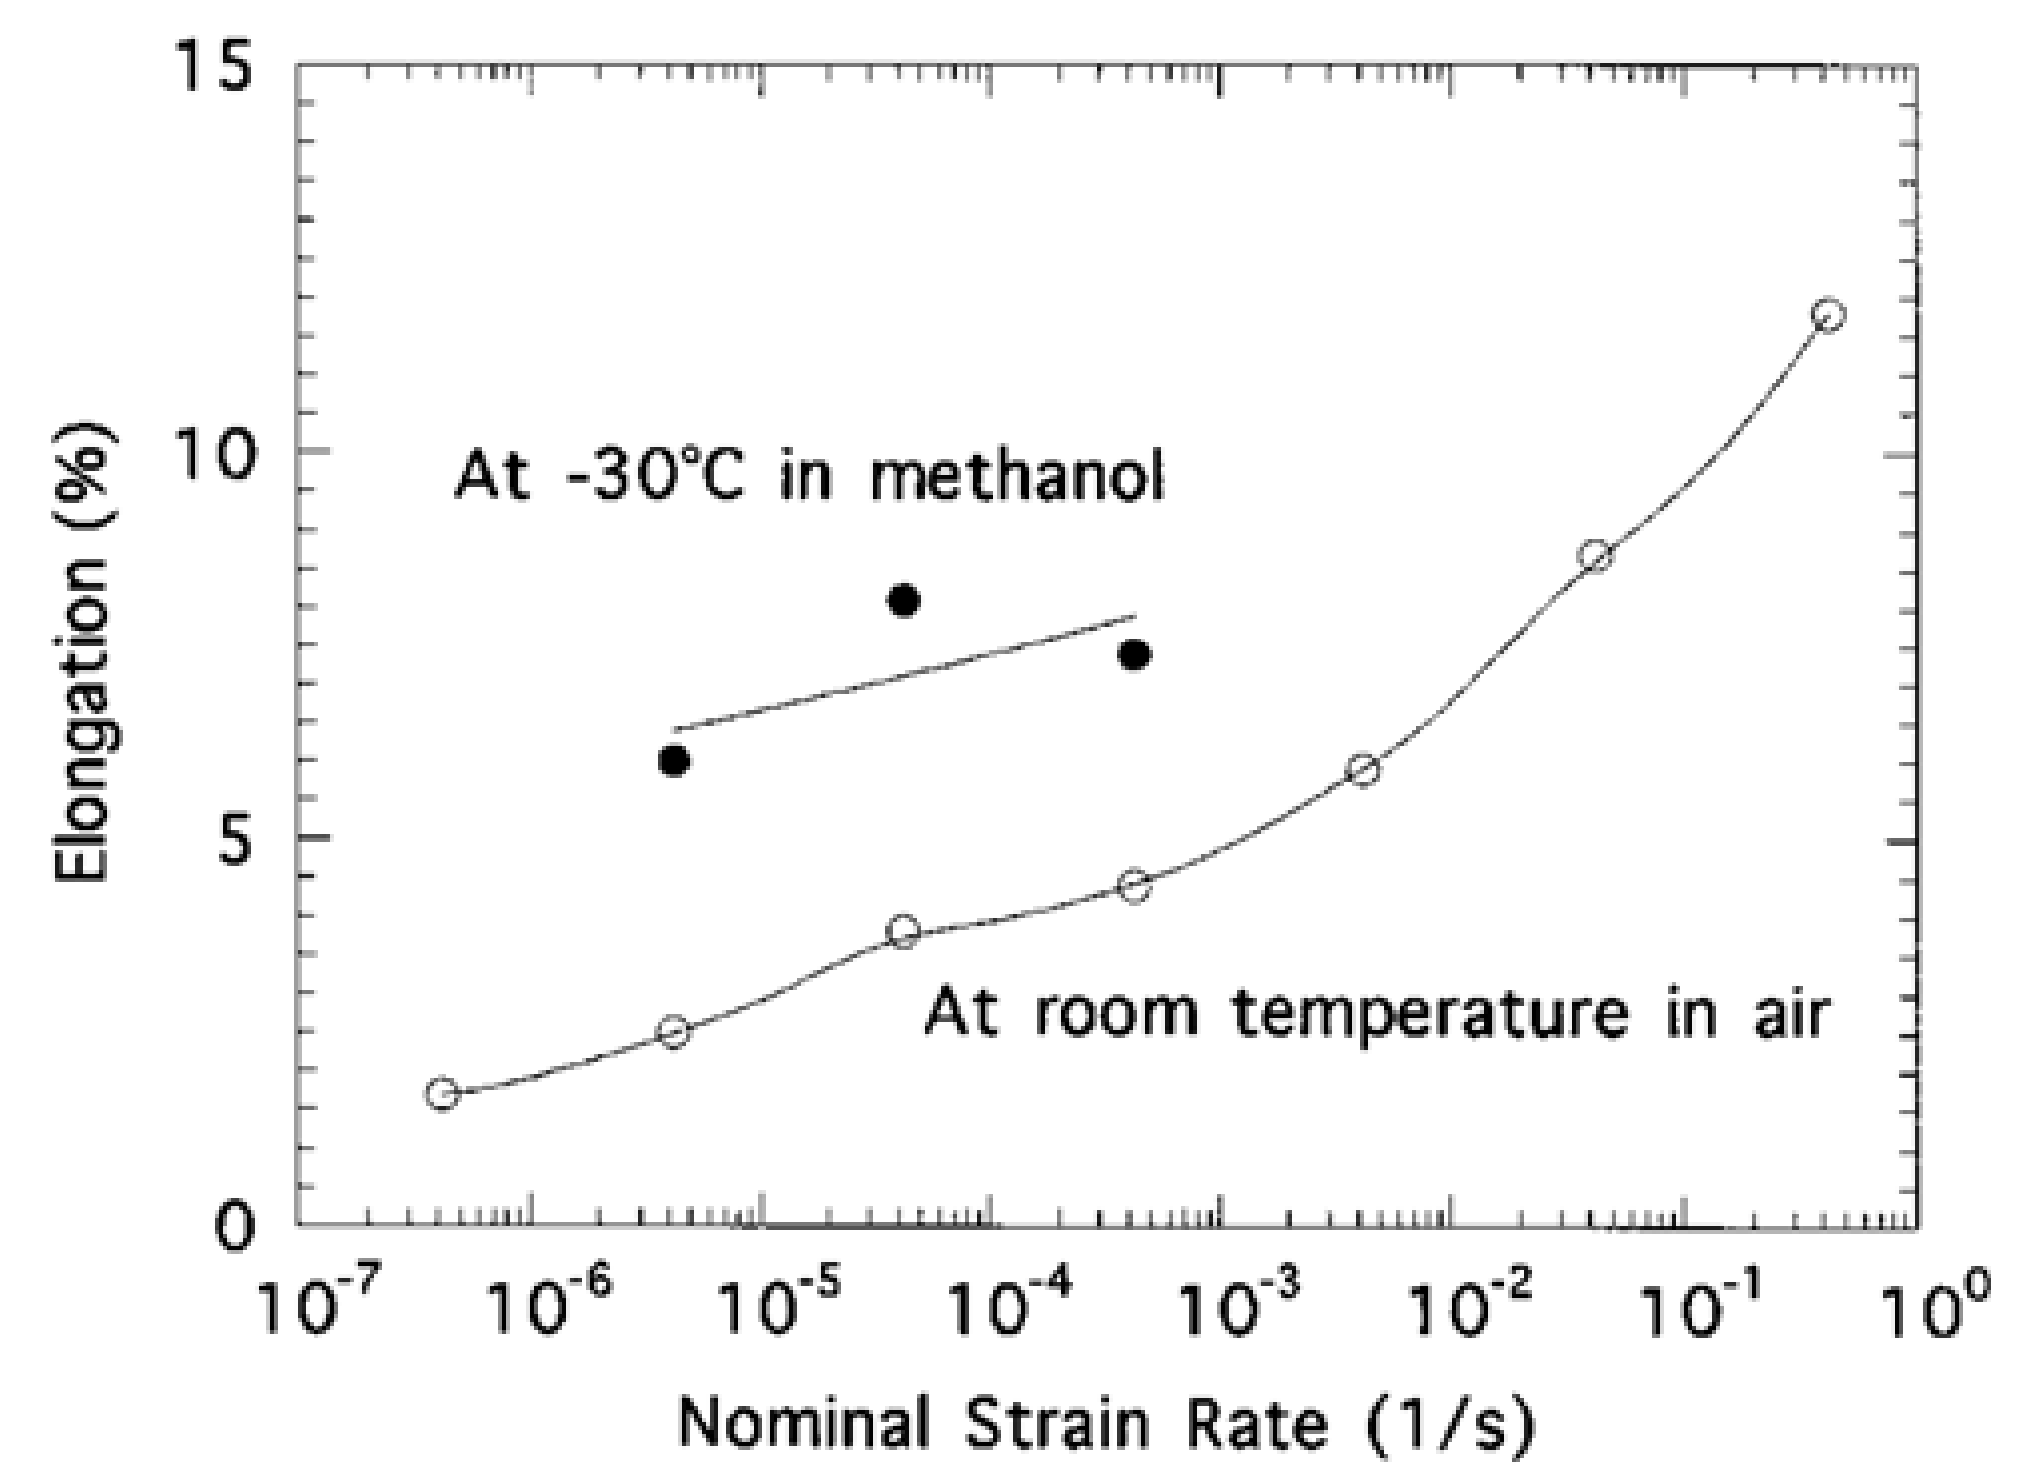
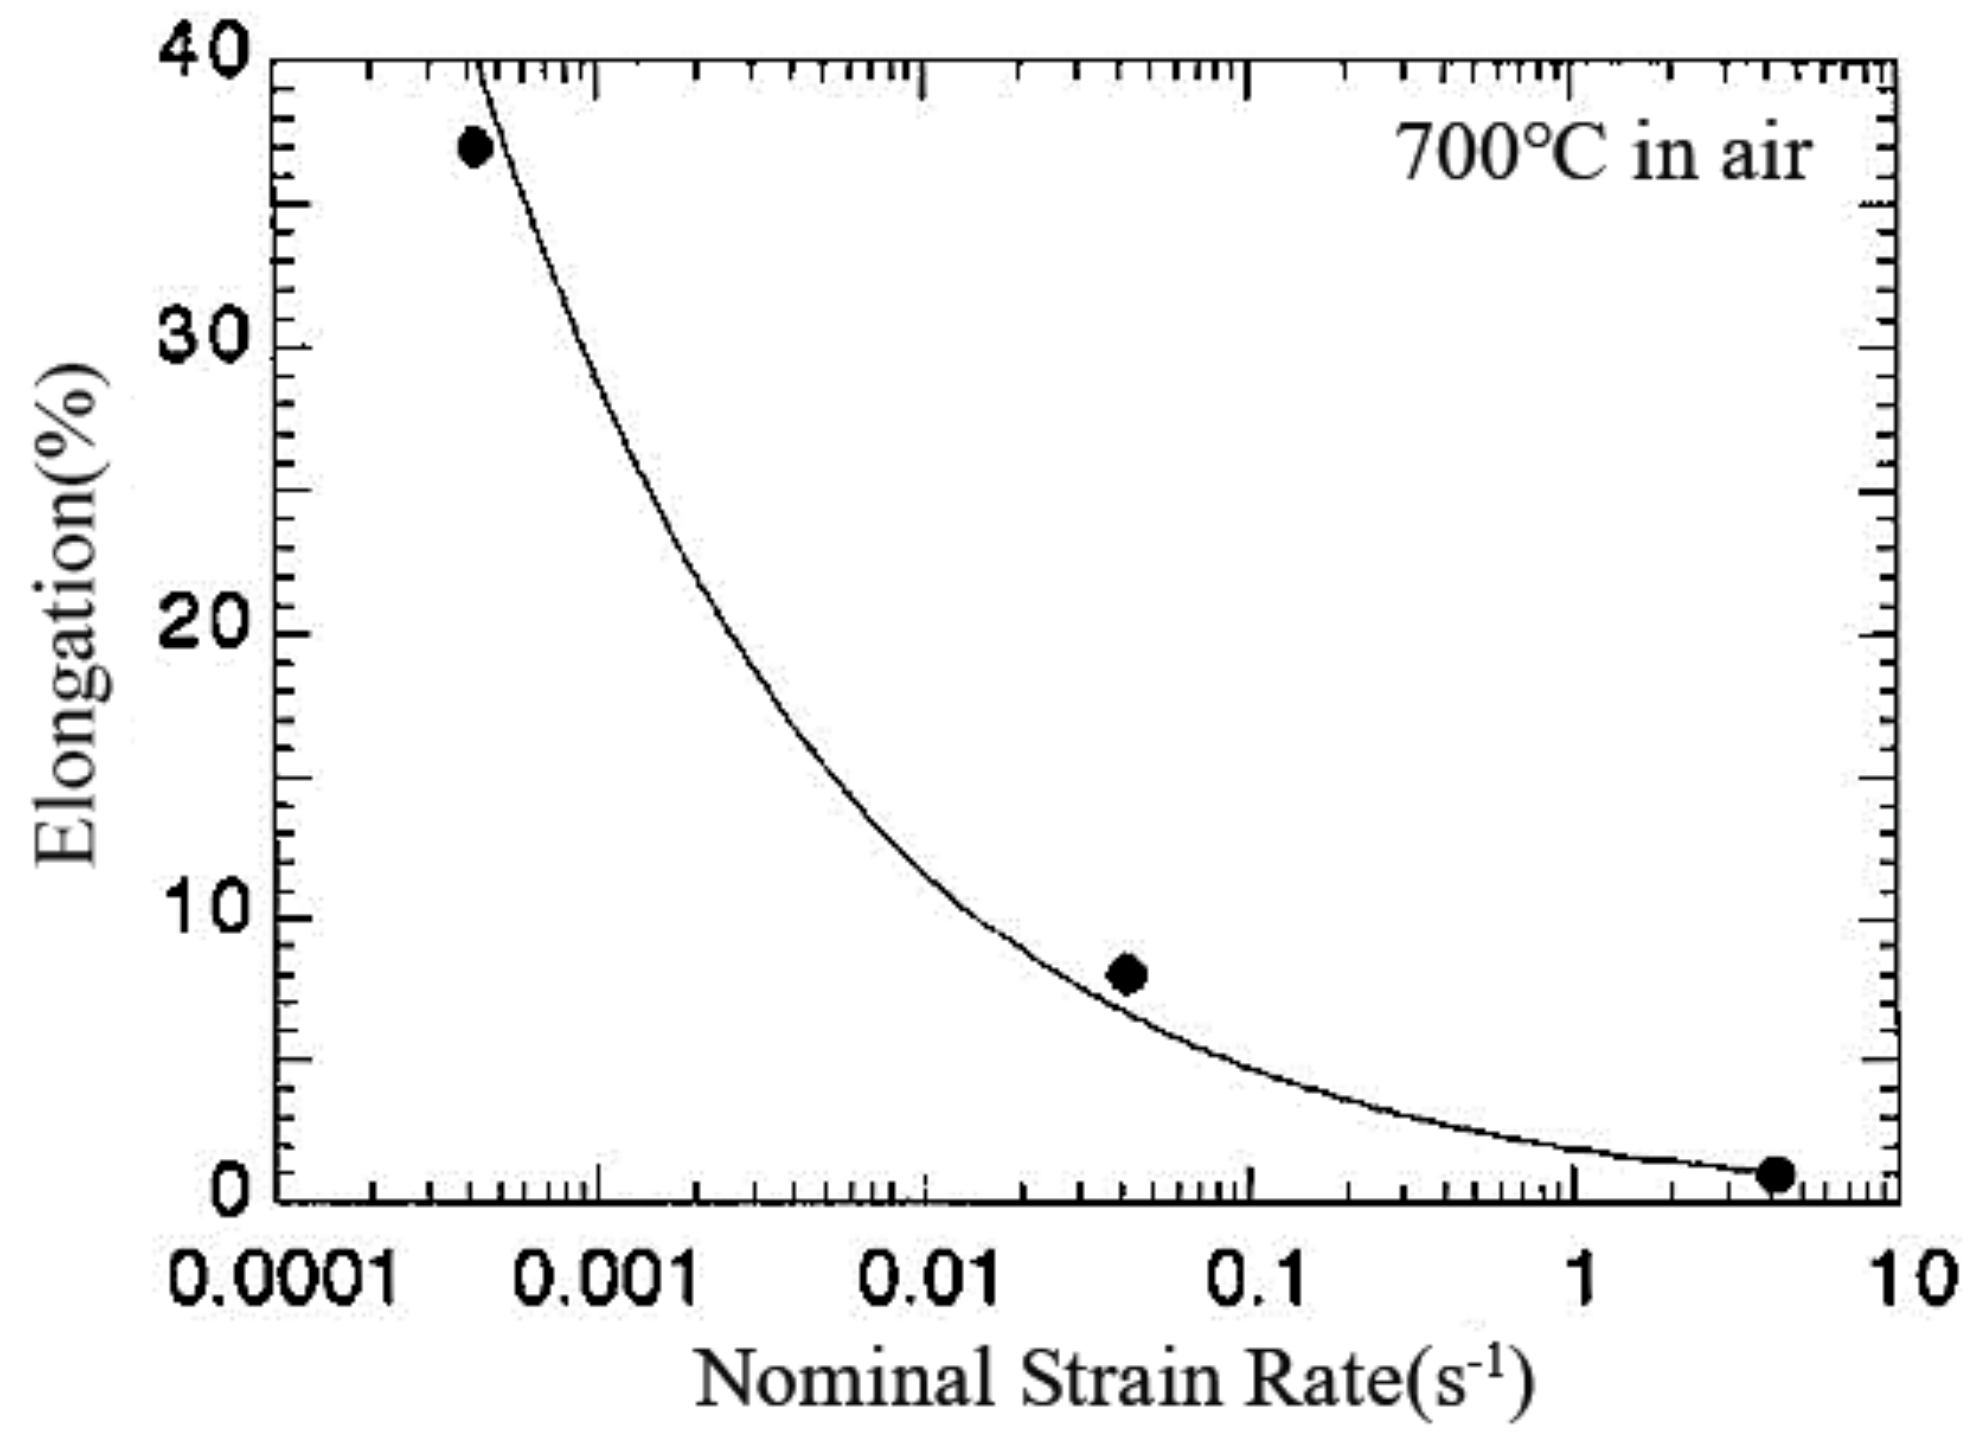
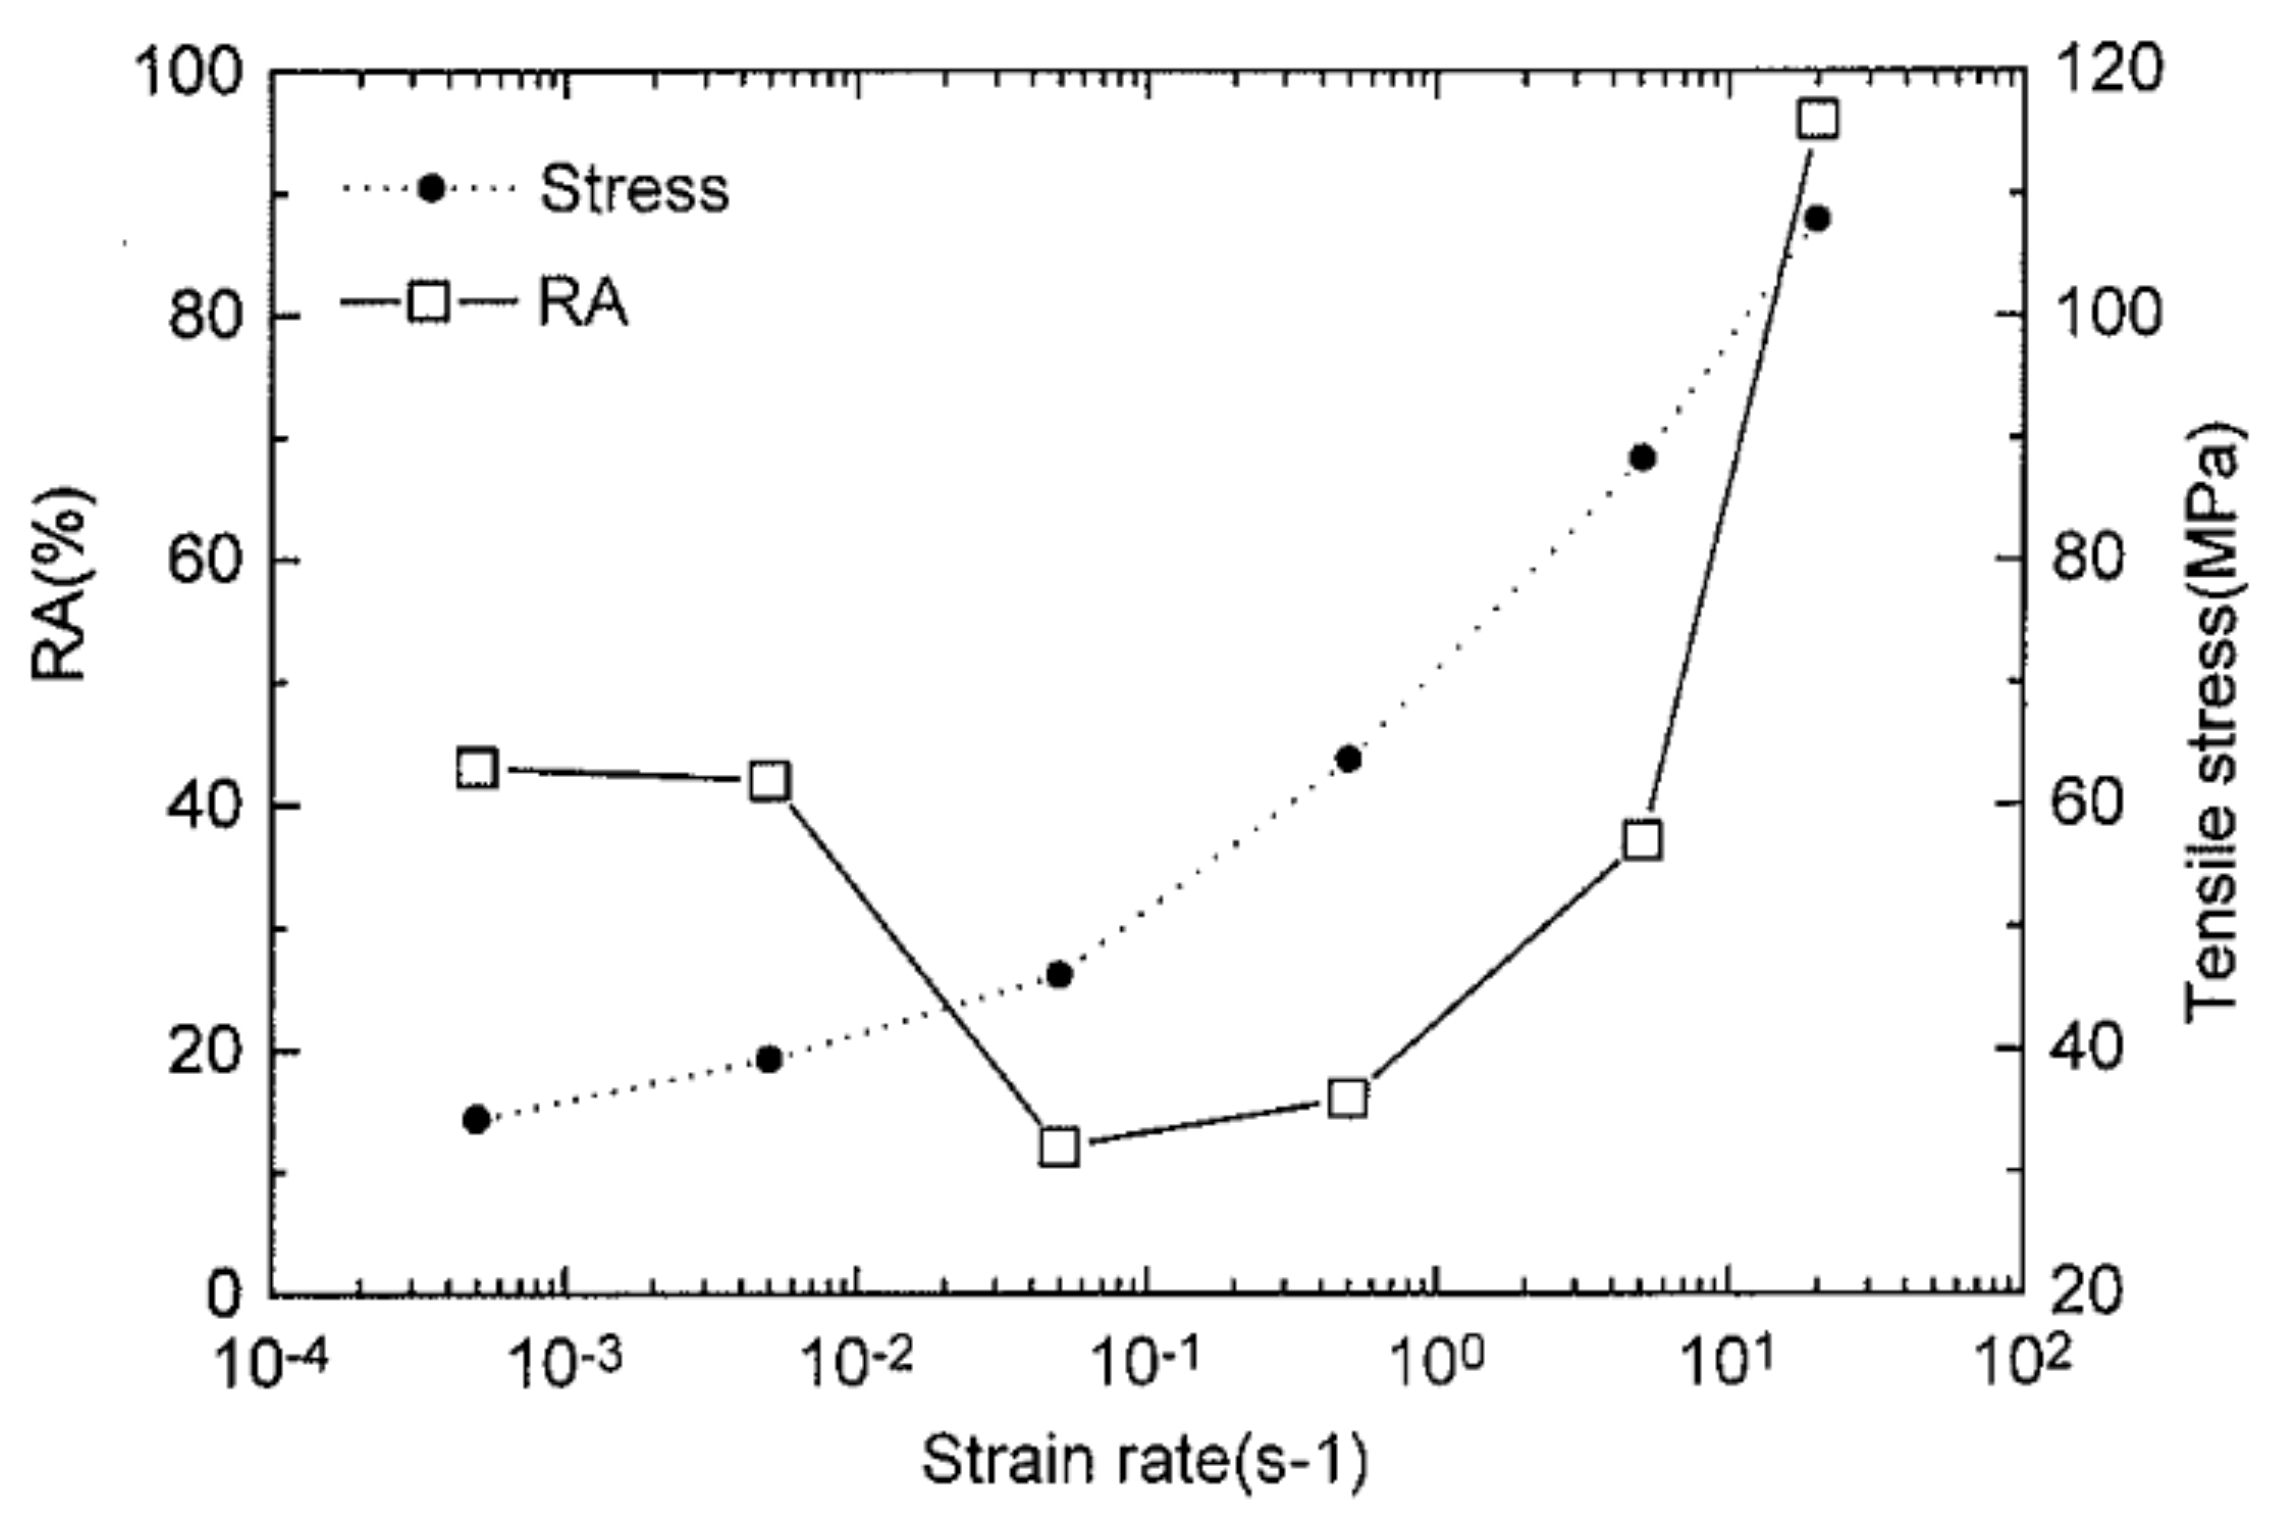
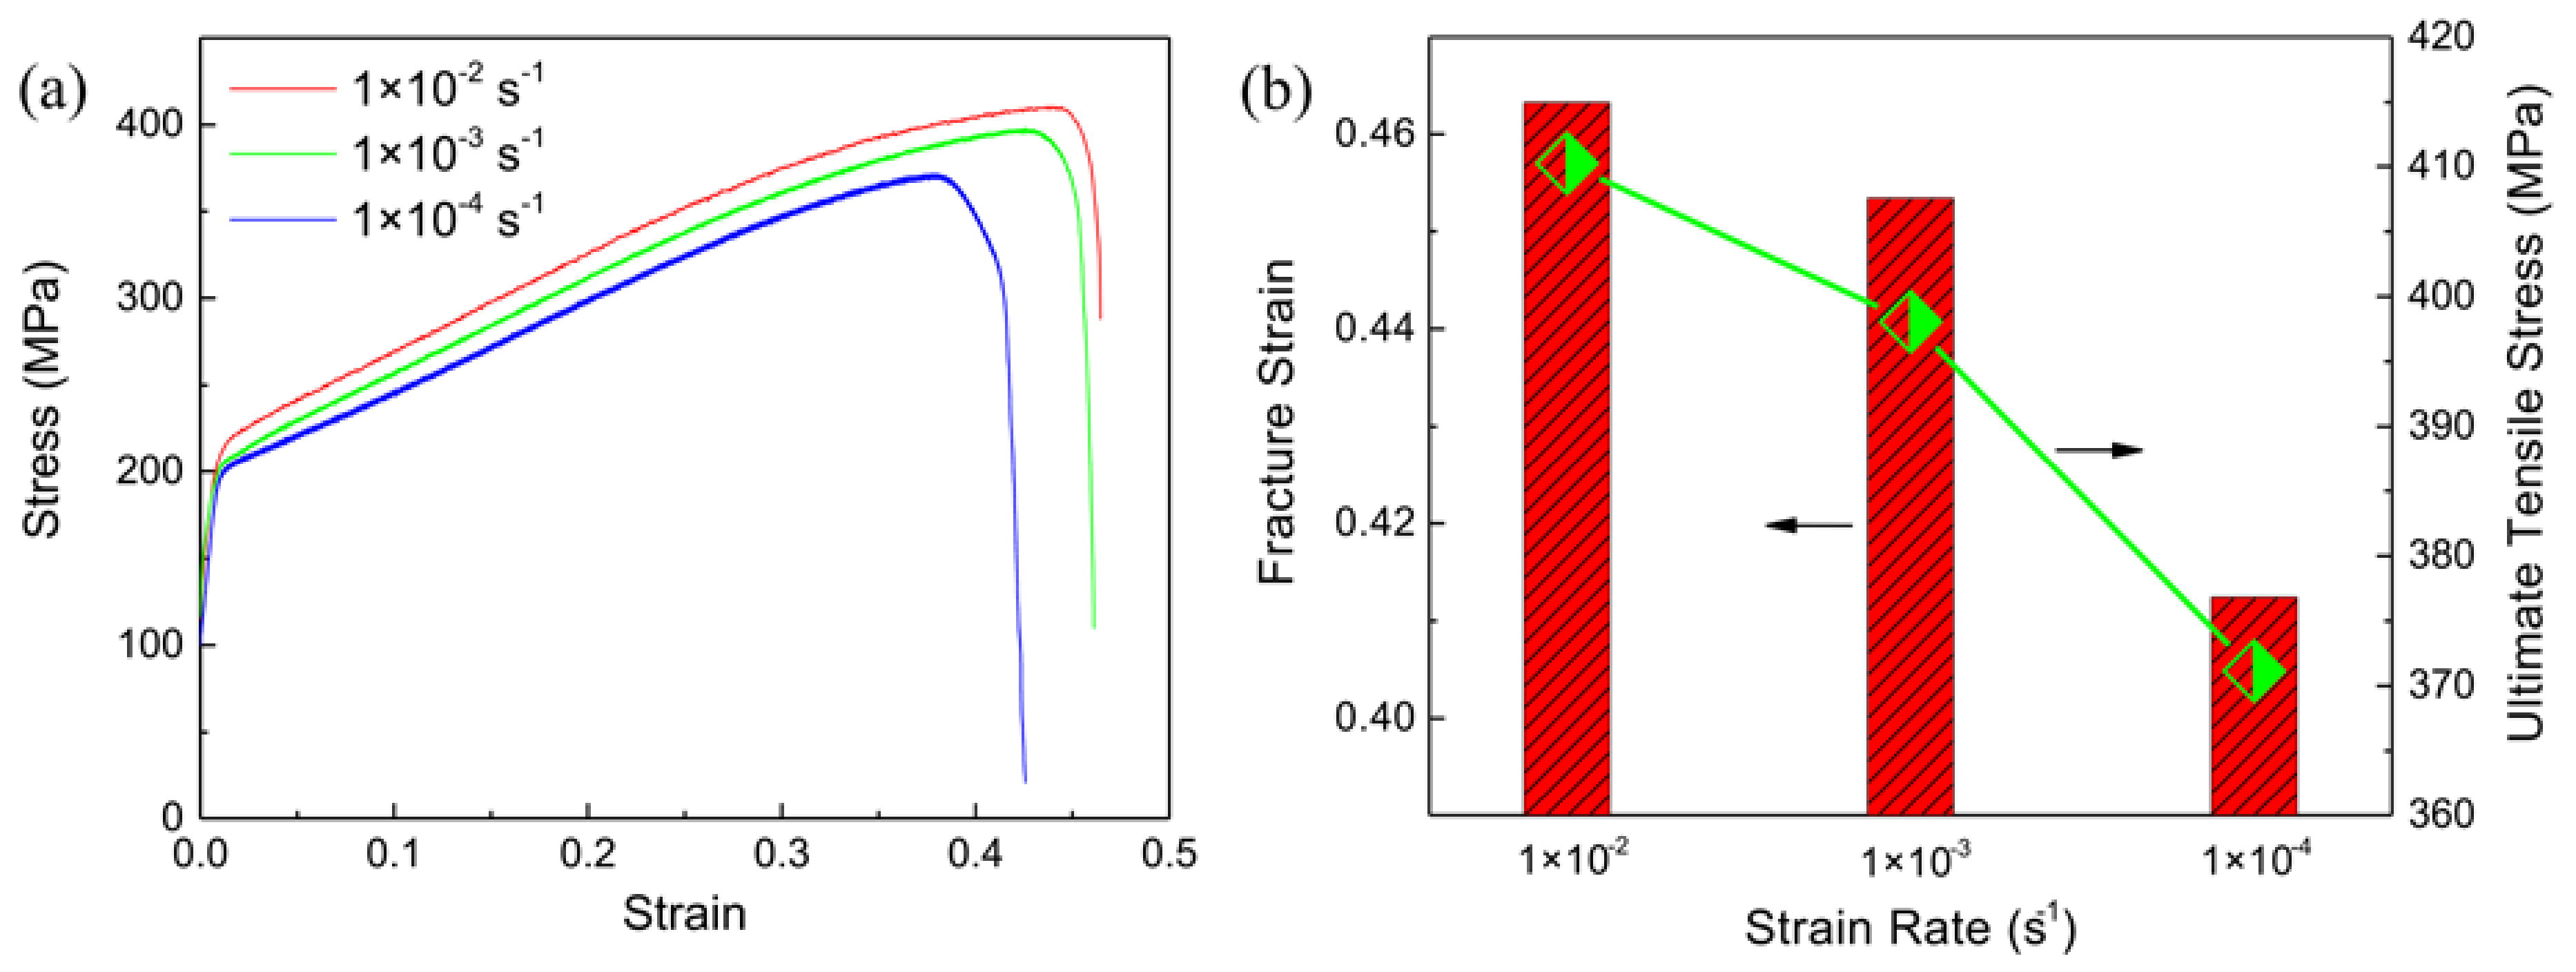
2.2. Uncertainty Relative to Strain Rate: Strain Rate Embrittlement
- (1)
- The change in strain rate can cause a variation in the reduction of area or elongation when tensile-tested at a fixed temperature, termed the strain rate embrittlement.
- (2)
- There is usually a strain rate at which a maximum embrittlement occurs, termed the critical strain rate.
- (3)
- The critical strain rate decreases with the decrease in test temperature.
- (4)
- For the case with no critical strain rate present, the reduction of area may increase or decrease continuously with increasing strain rate. When the reduction of area decreases with strain rate, the curve of the RA–strain rate at a higher temperature is always above that at a lower temperature. Nevertheless, when the reduction of area increases with strain rate, the curve of the RA–strain rate (or elongation–strain rate) at a lower temperature is always above that at a higher temperature.
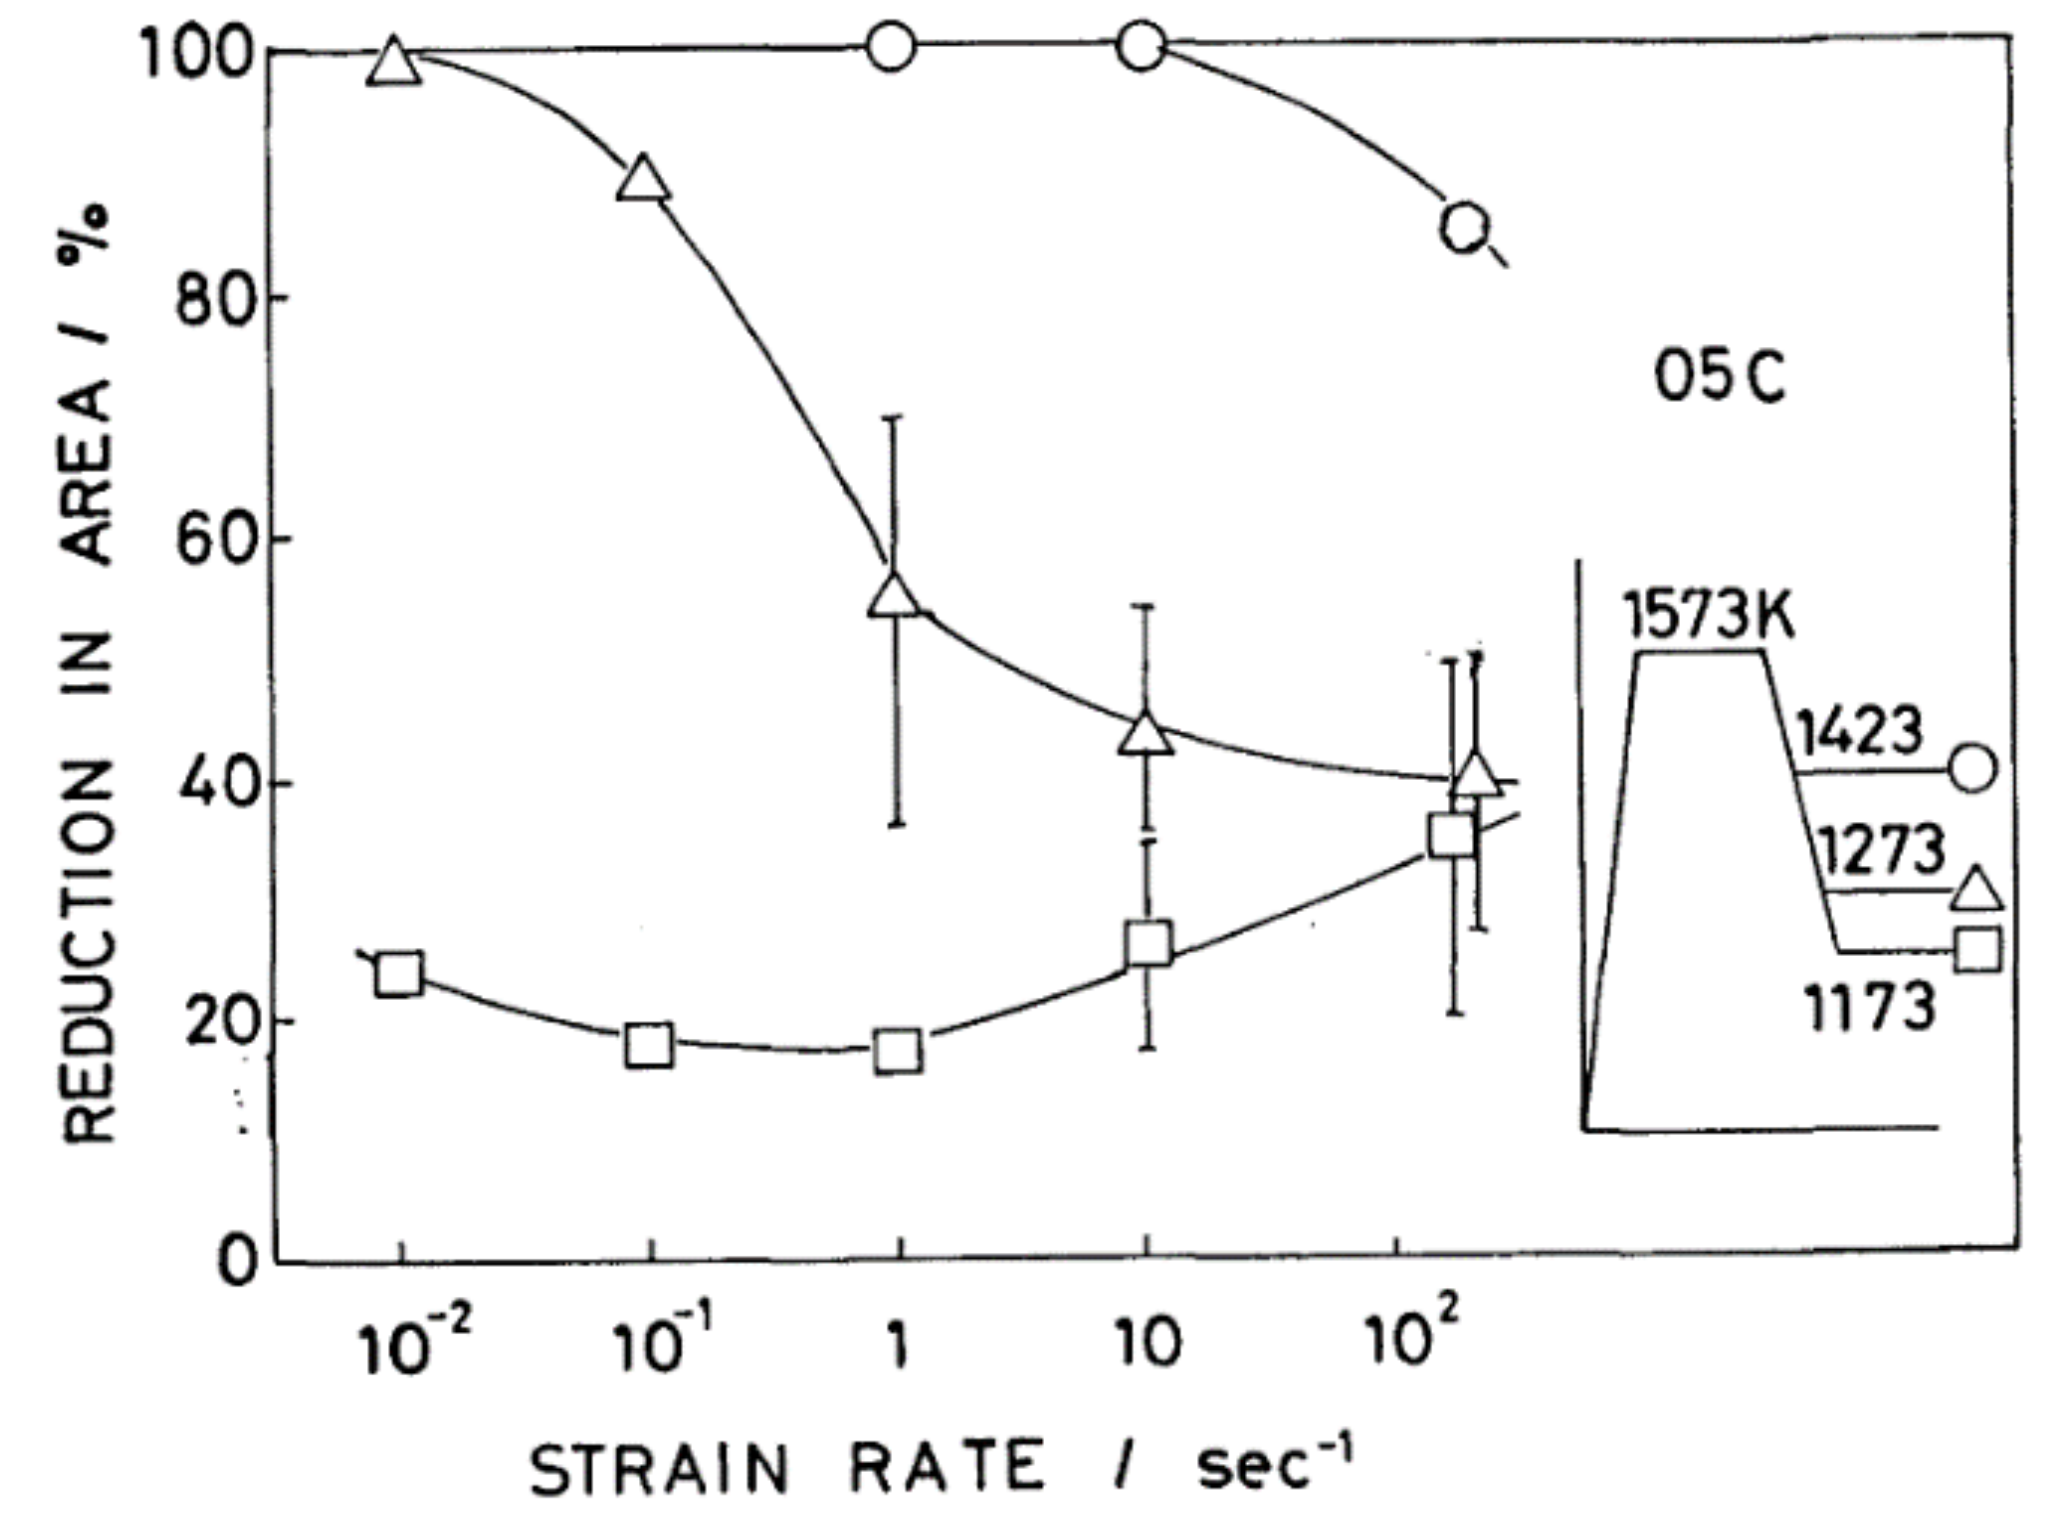
- (5)
- For an alloy that undergoes a given thermal cycle, the reduction of area may increase or decrease with strain rate when tensile-tested at different temperatures.
2.3. Tensile Testing Results of Pure Metals
3. Paradox of Tensile Test
4. Mechanism of Measurement Uncertainty
4.1. Microscopic Theory of Elastic Deformation
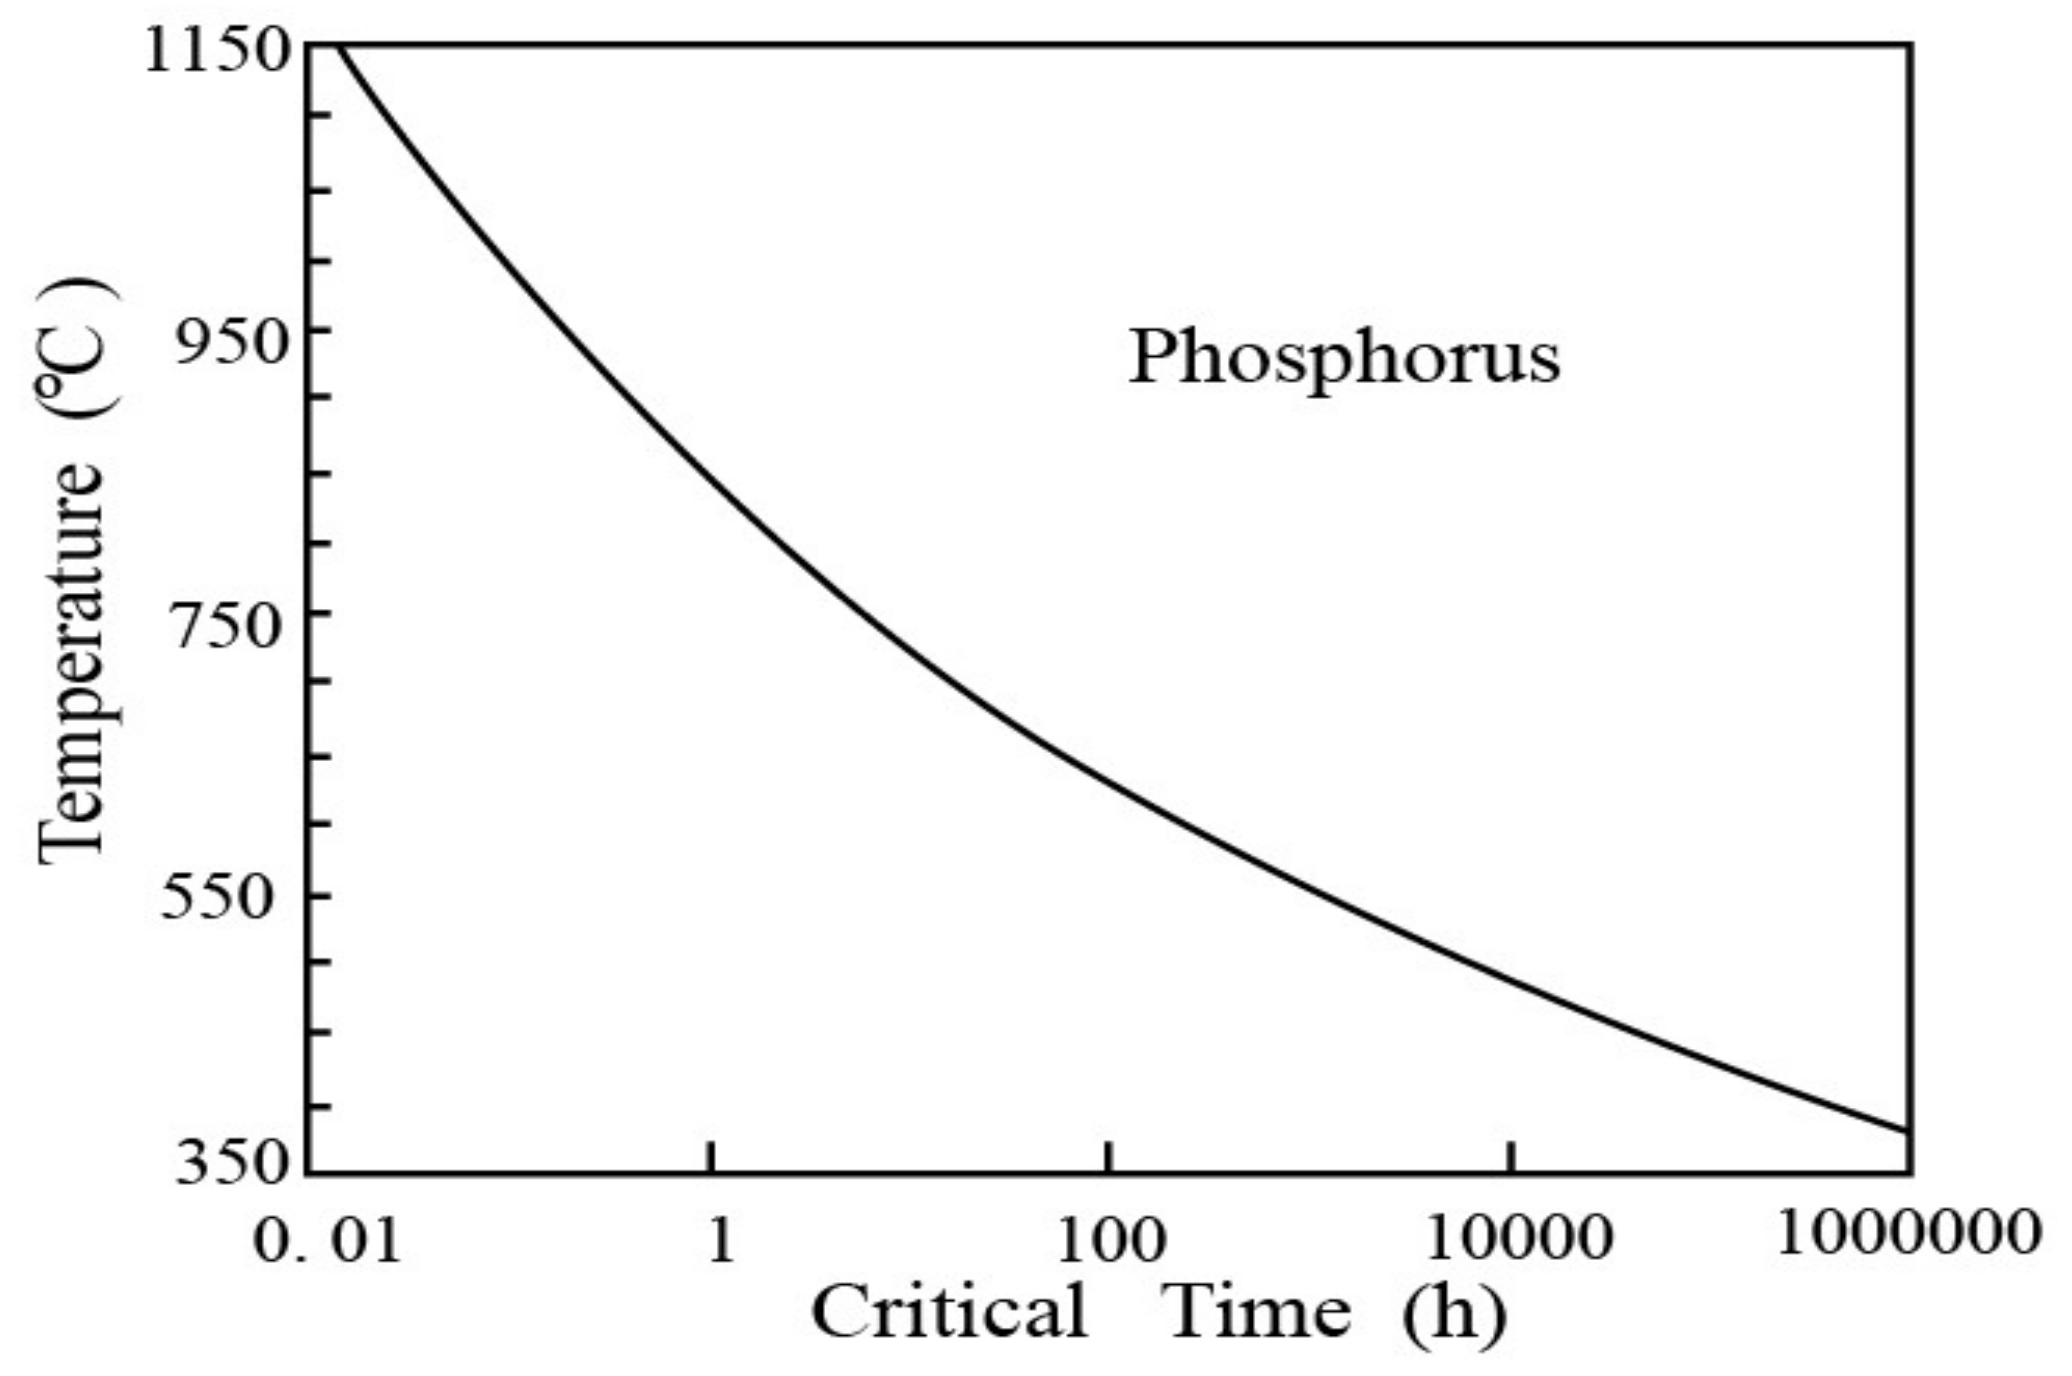
4.1.1. Microscopic Mechanism and Critical Time
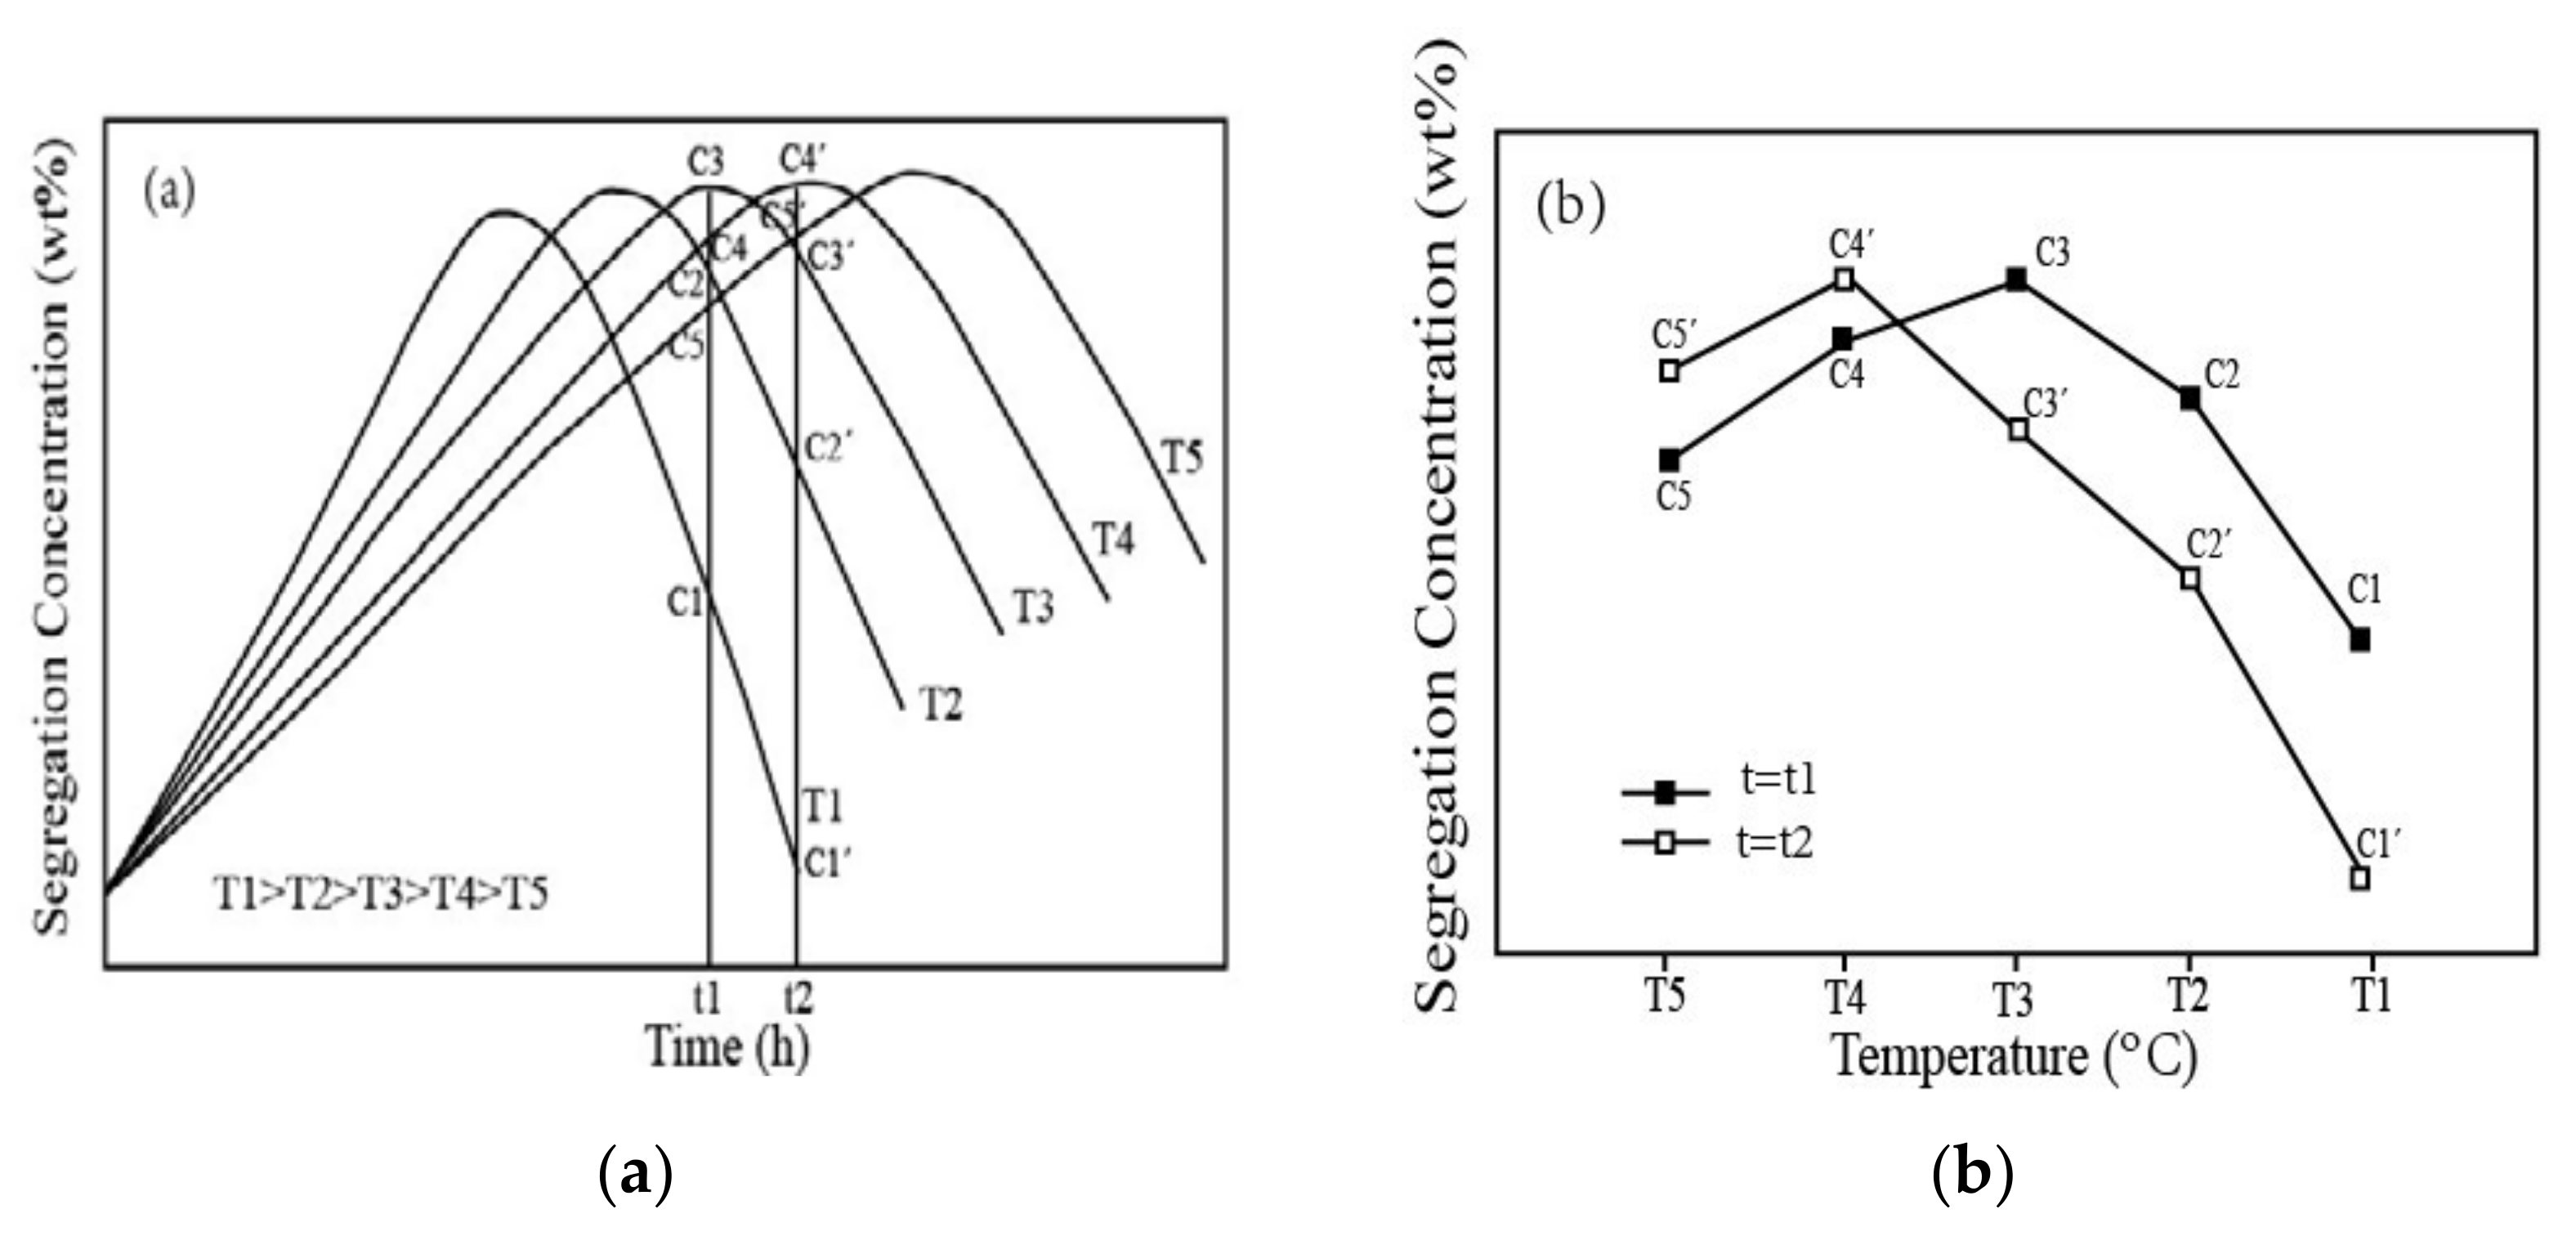
4.1.2. Peak Temperature of Segregation and Its Variation
4.2. Elastic Deformation Induced Measurement Uncertainty
4.2.1. Critical Time Induced Strain Rate Embrittlement
4.2.2. Peak Temperature Induced Intermediate Temperature Embrittlement
5. Measurement Uncertainty of Yield Strength
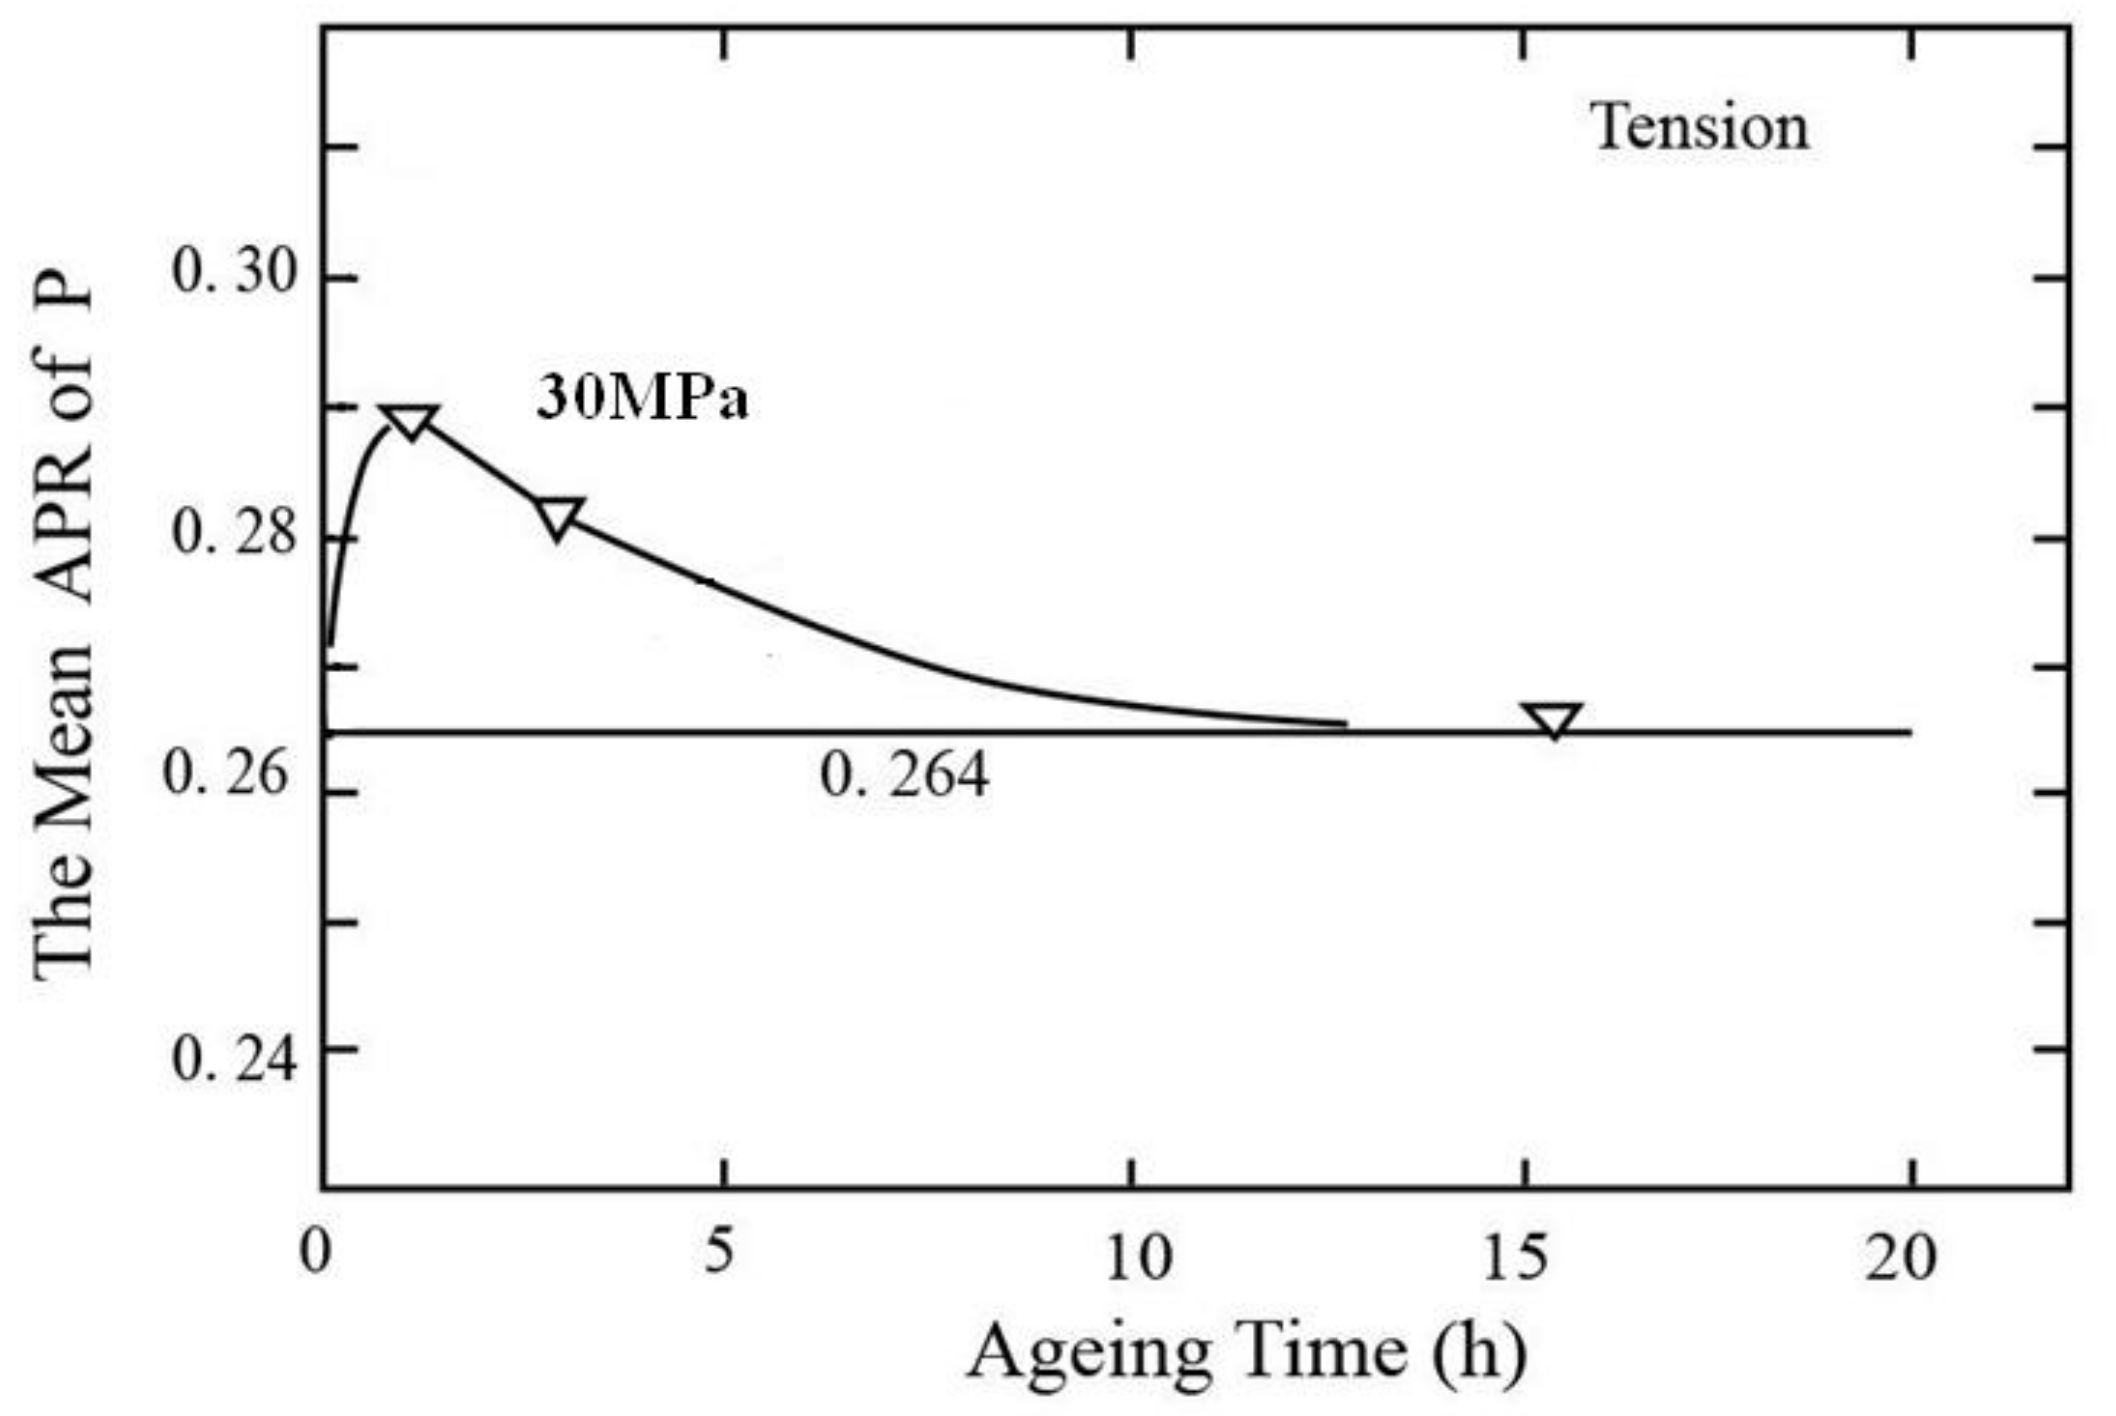
- (1)
- For an elastic deformation process where the metal is deformed for an identical time at different temperatures, one temperature must exist at which the segregation concentration of the solute at the atmosphere has a maximum (peak) value. The critical time at this temperature is equal or close to the EDT. This temperature is called the peak temperature of atmosphere induced by elastic deformation.
- (2)
- The peak temperature of atmosphere shifts to lower temperatures when the EDT is prolonged at various temperatures.
6. A New Technology System of Tensile Testing
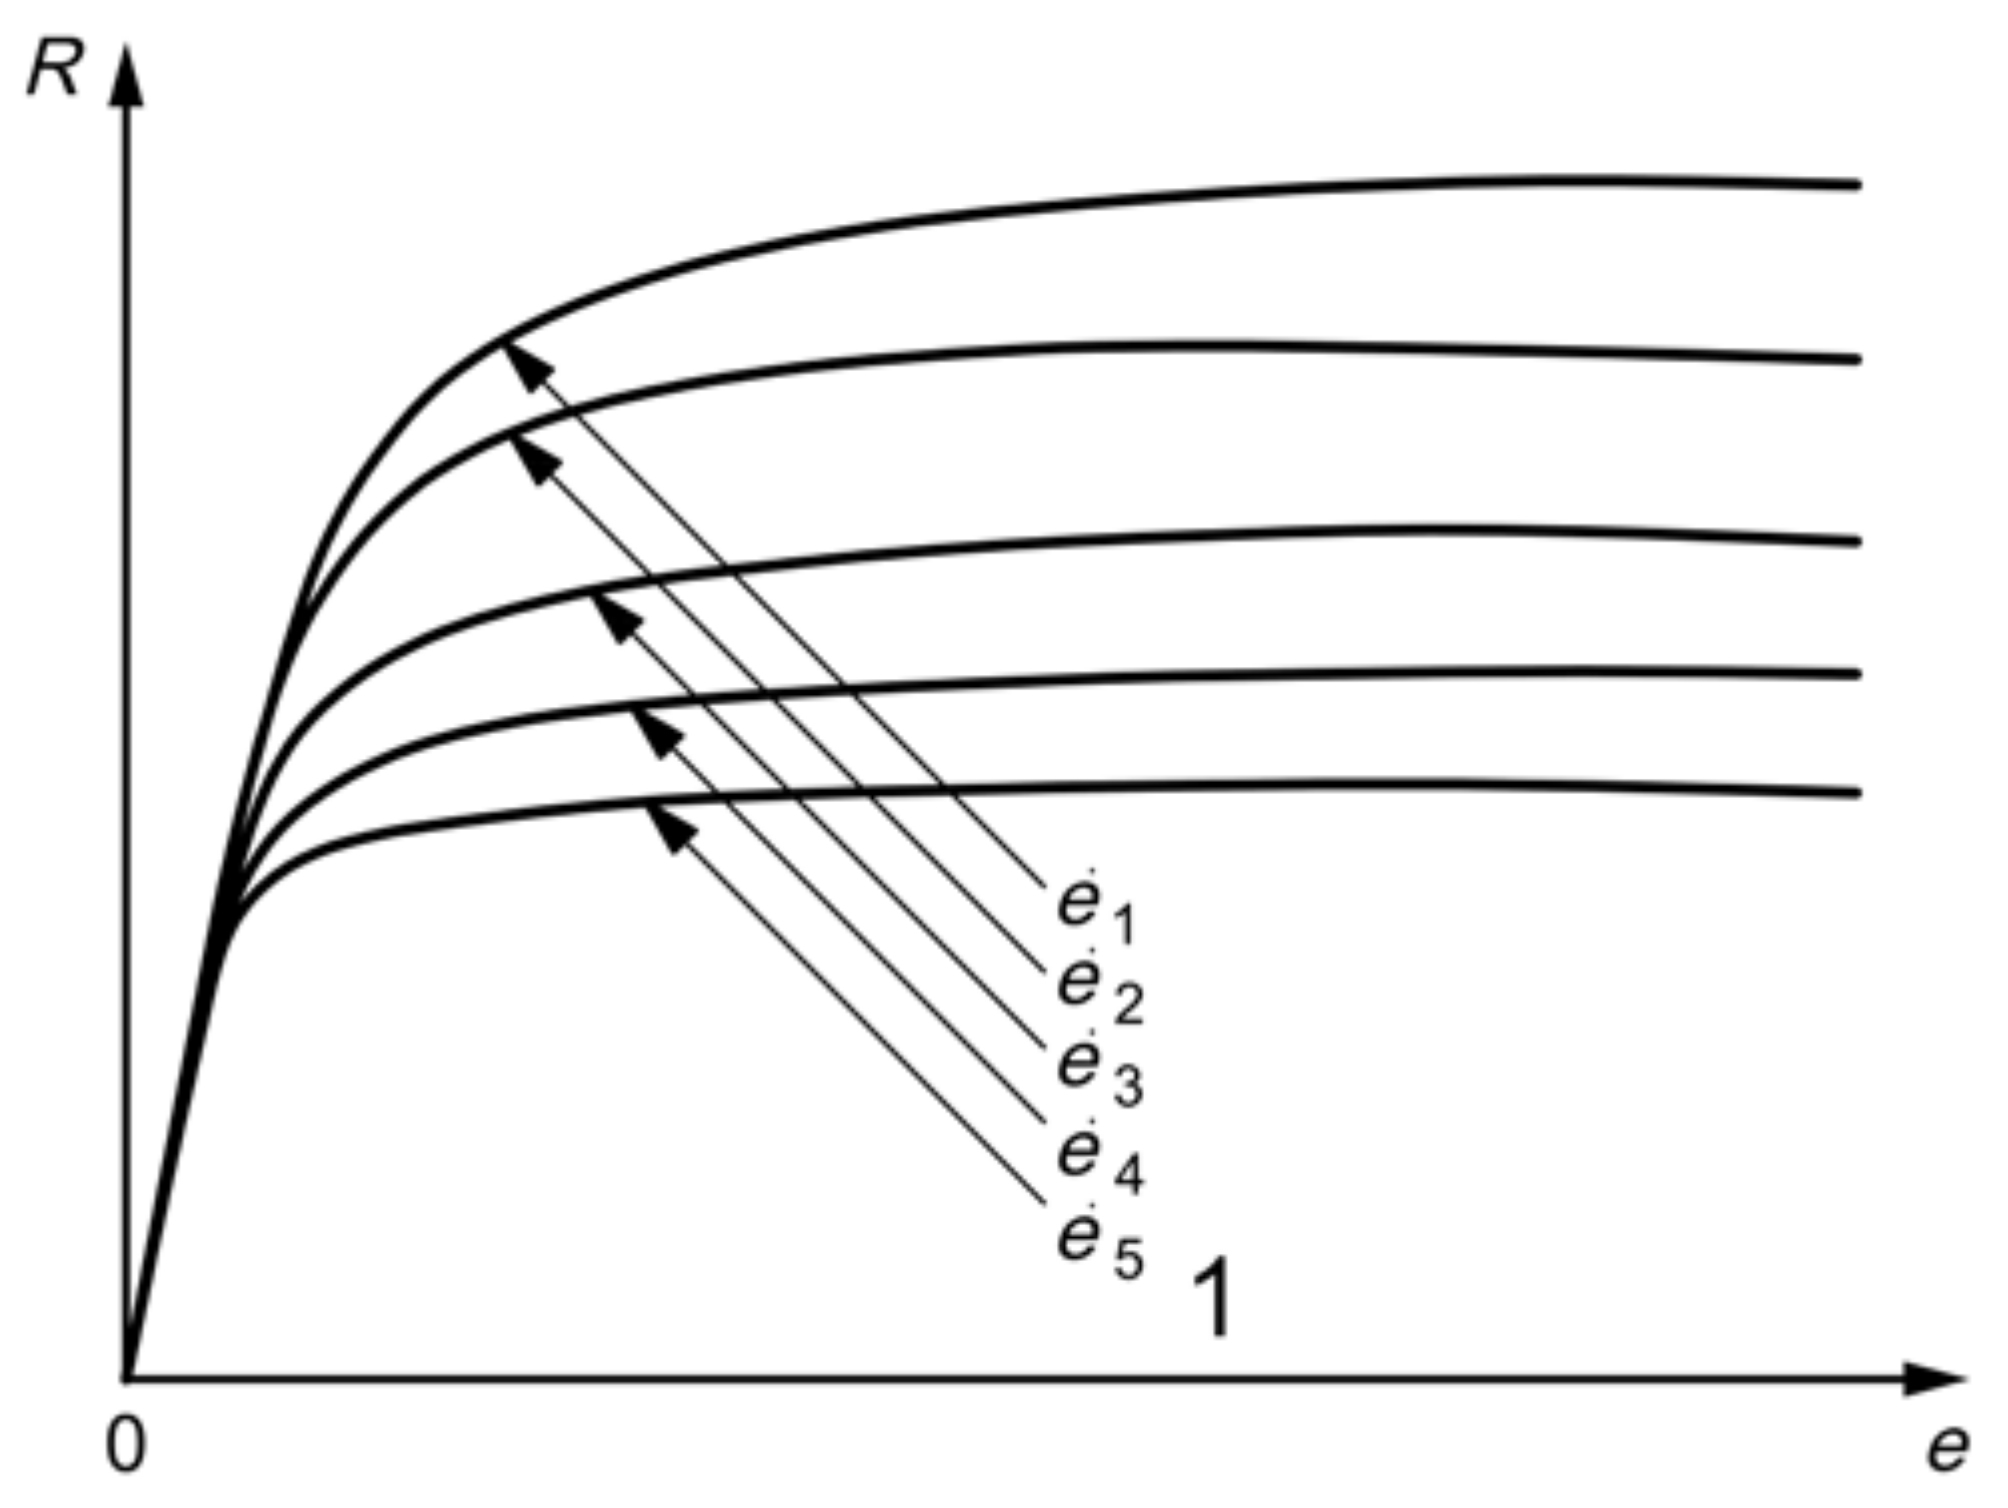
6.1. “Mechanical Property–Tensile Strain Rate” Curve
6.2. Original Mechanical Properties
6.3. Service Mechanical Properties
6.4. Mechanical Properties during Processing Deformation
7. Measurement of Original Mechanical Property
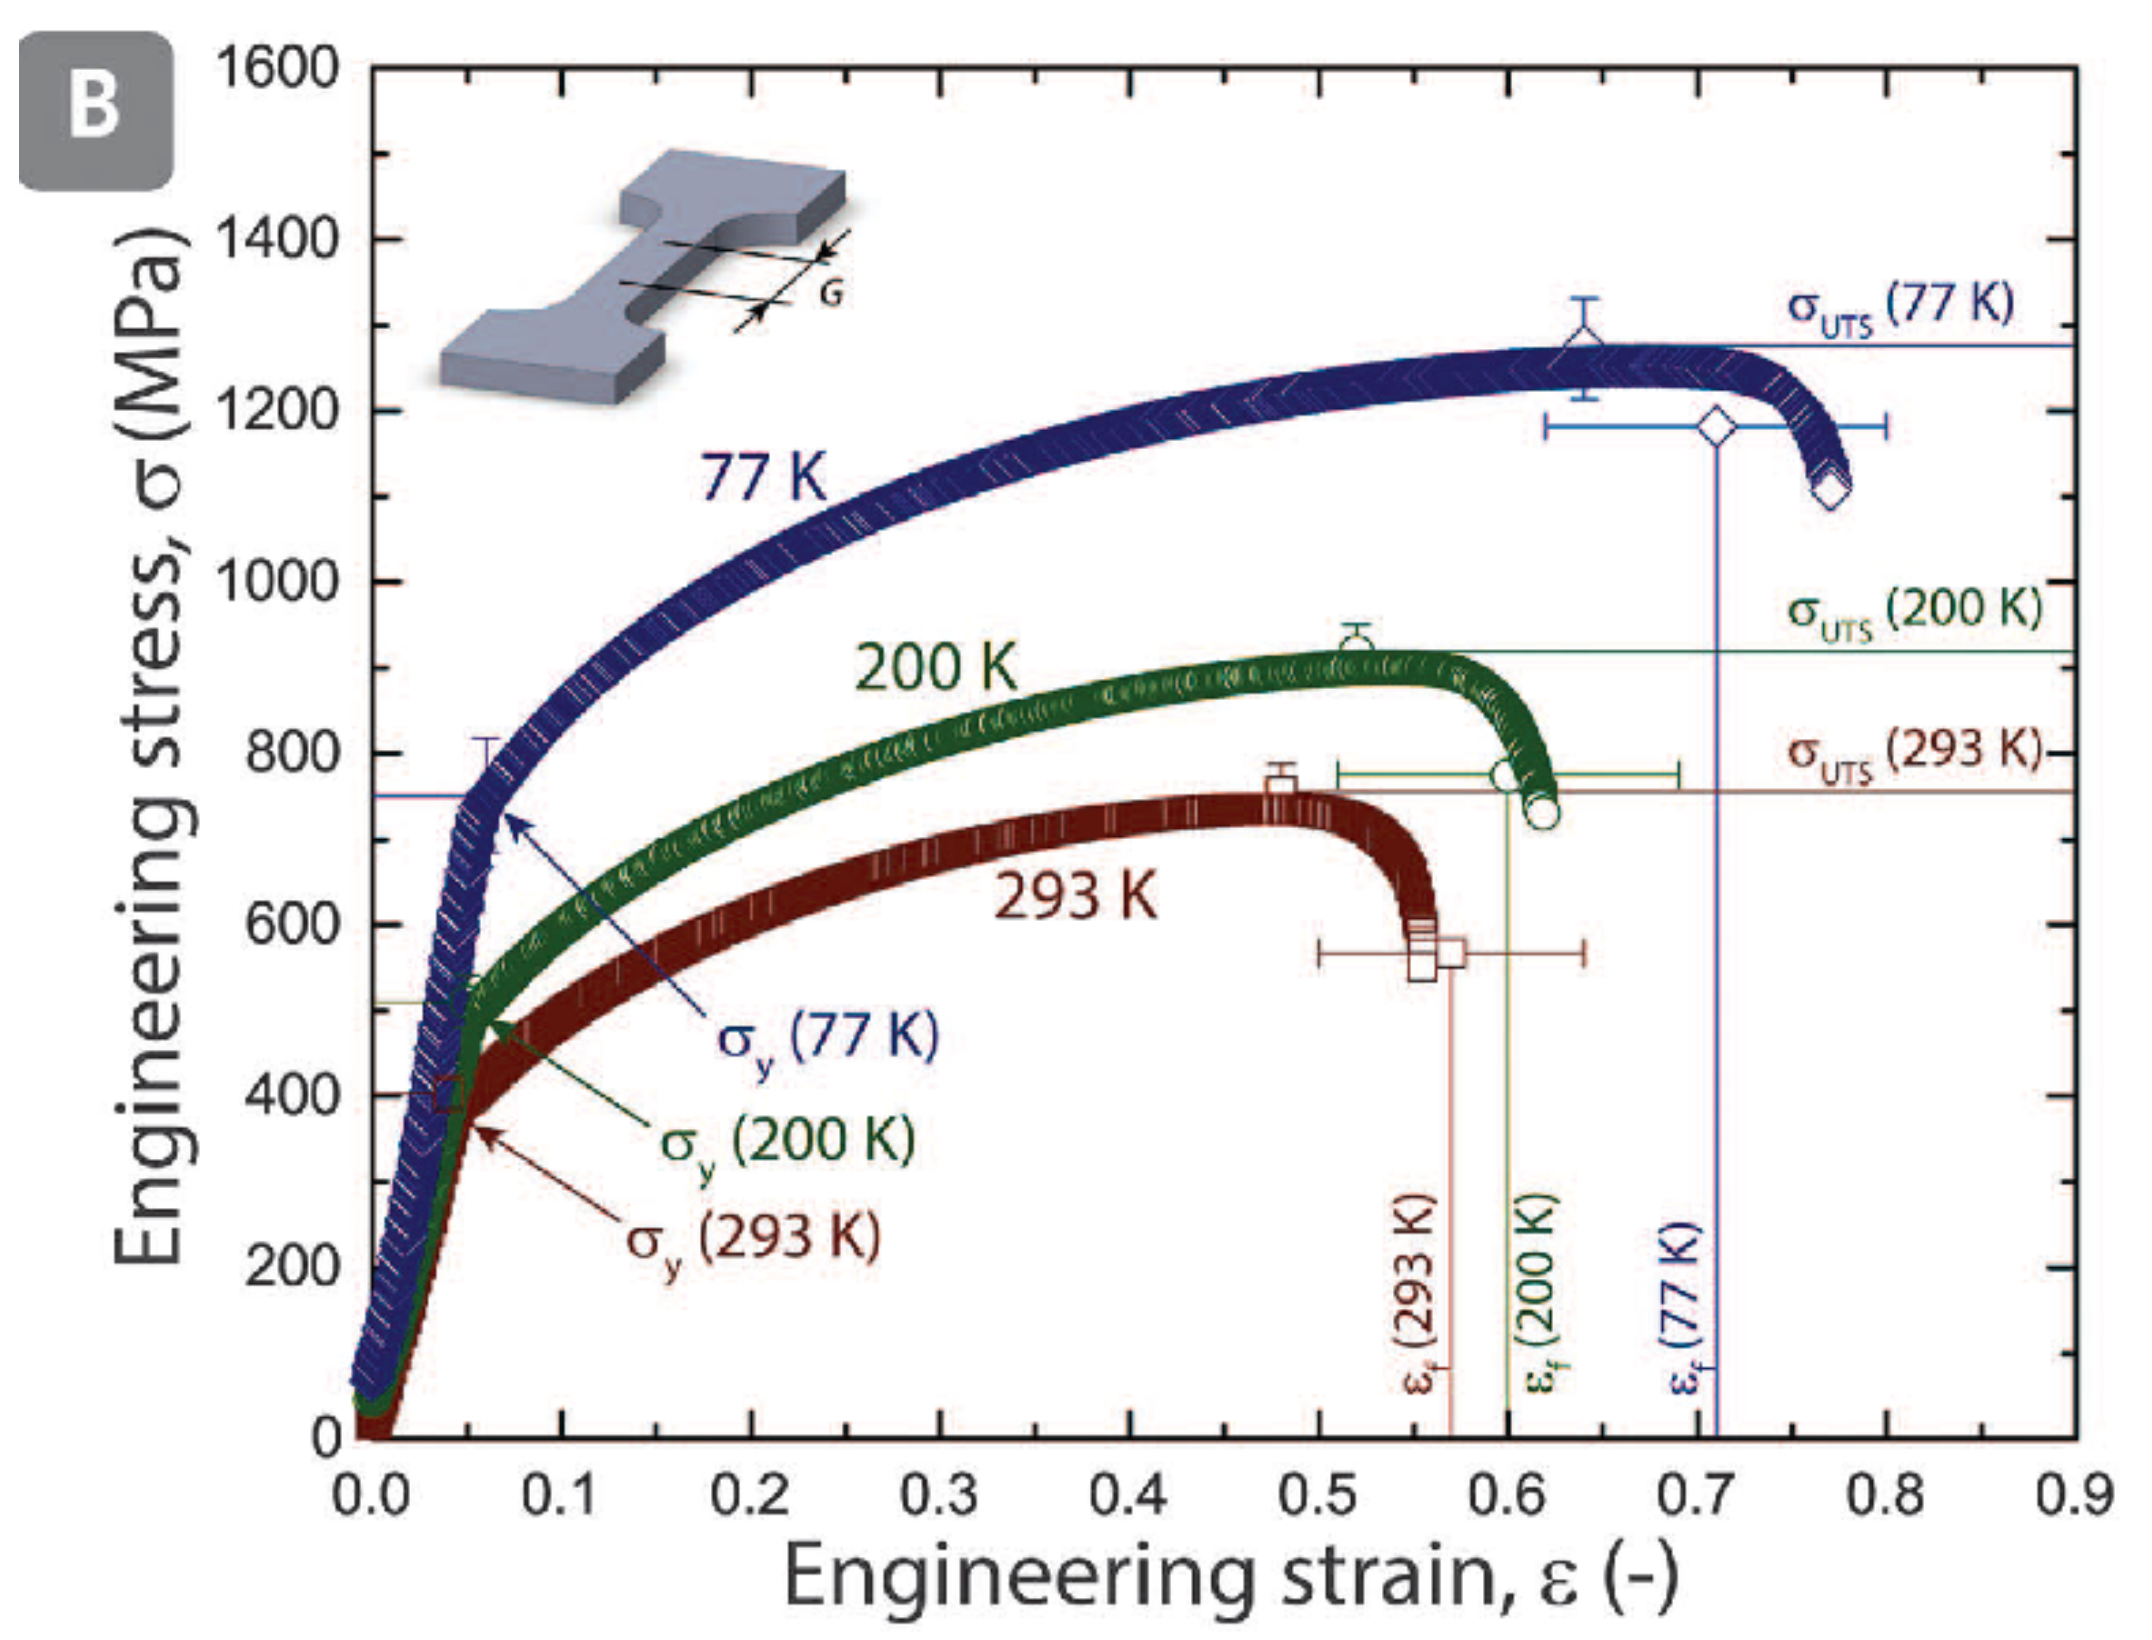
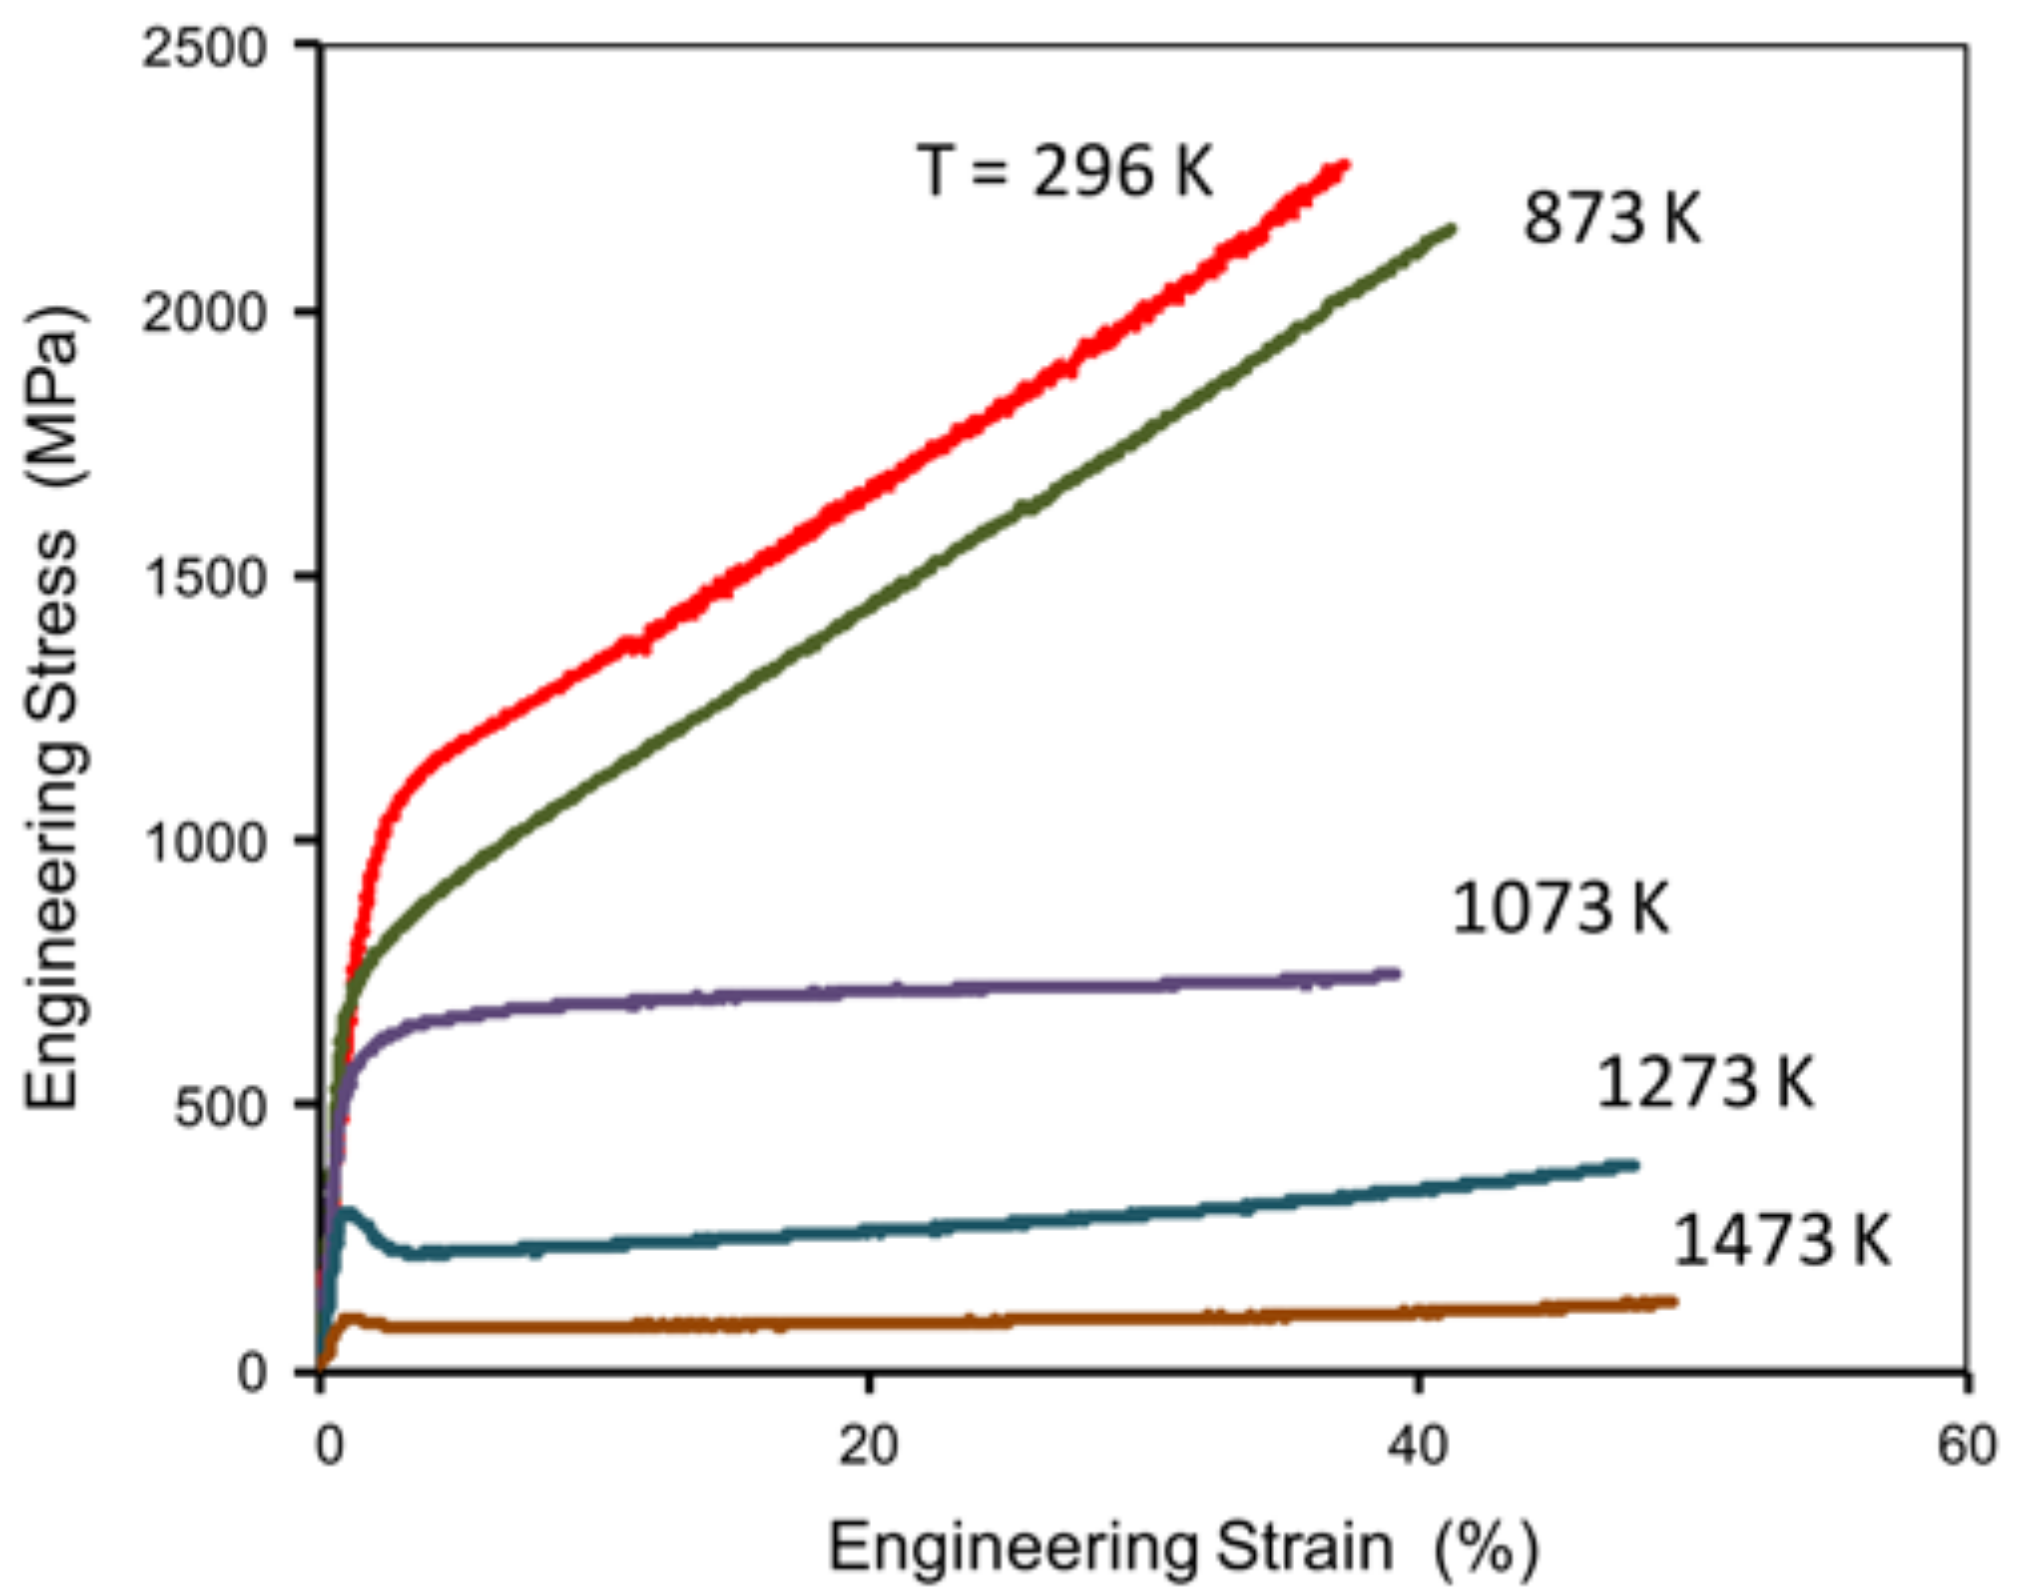
8. Representation of Mechanical Properties for High-Entropy Alloys
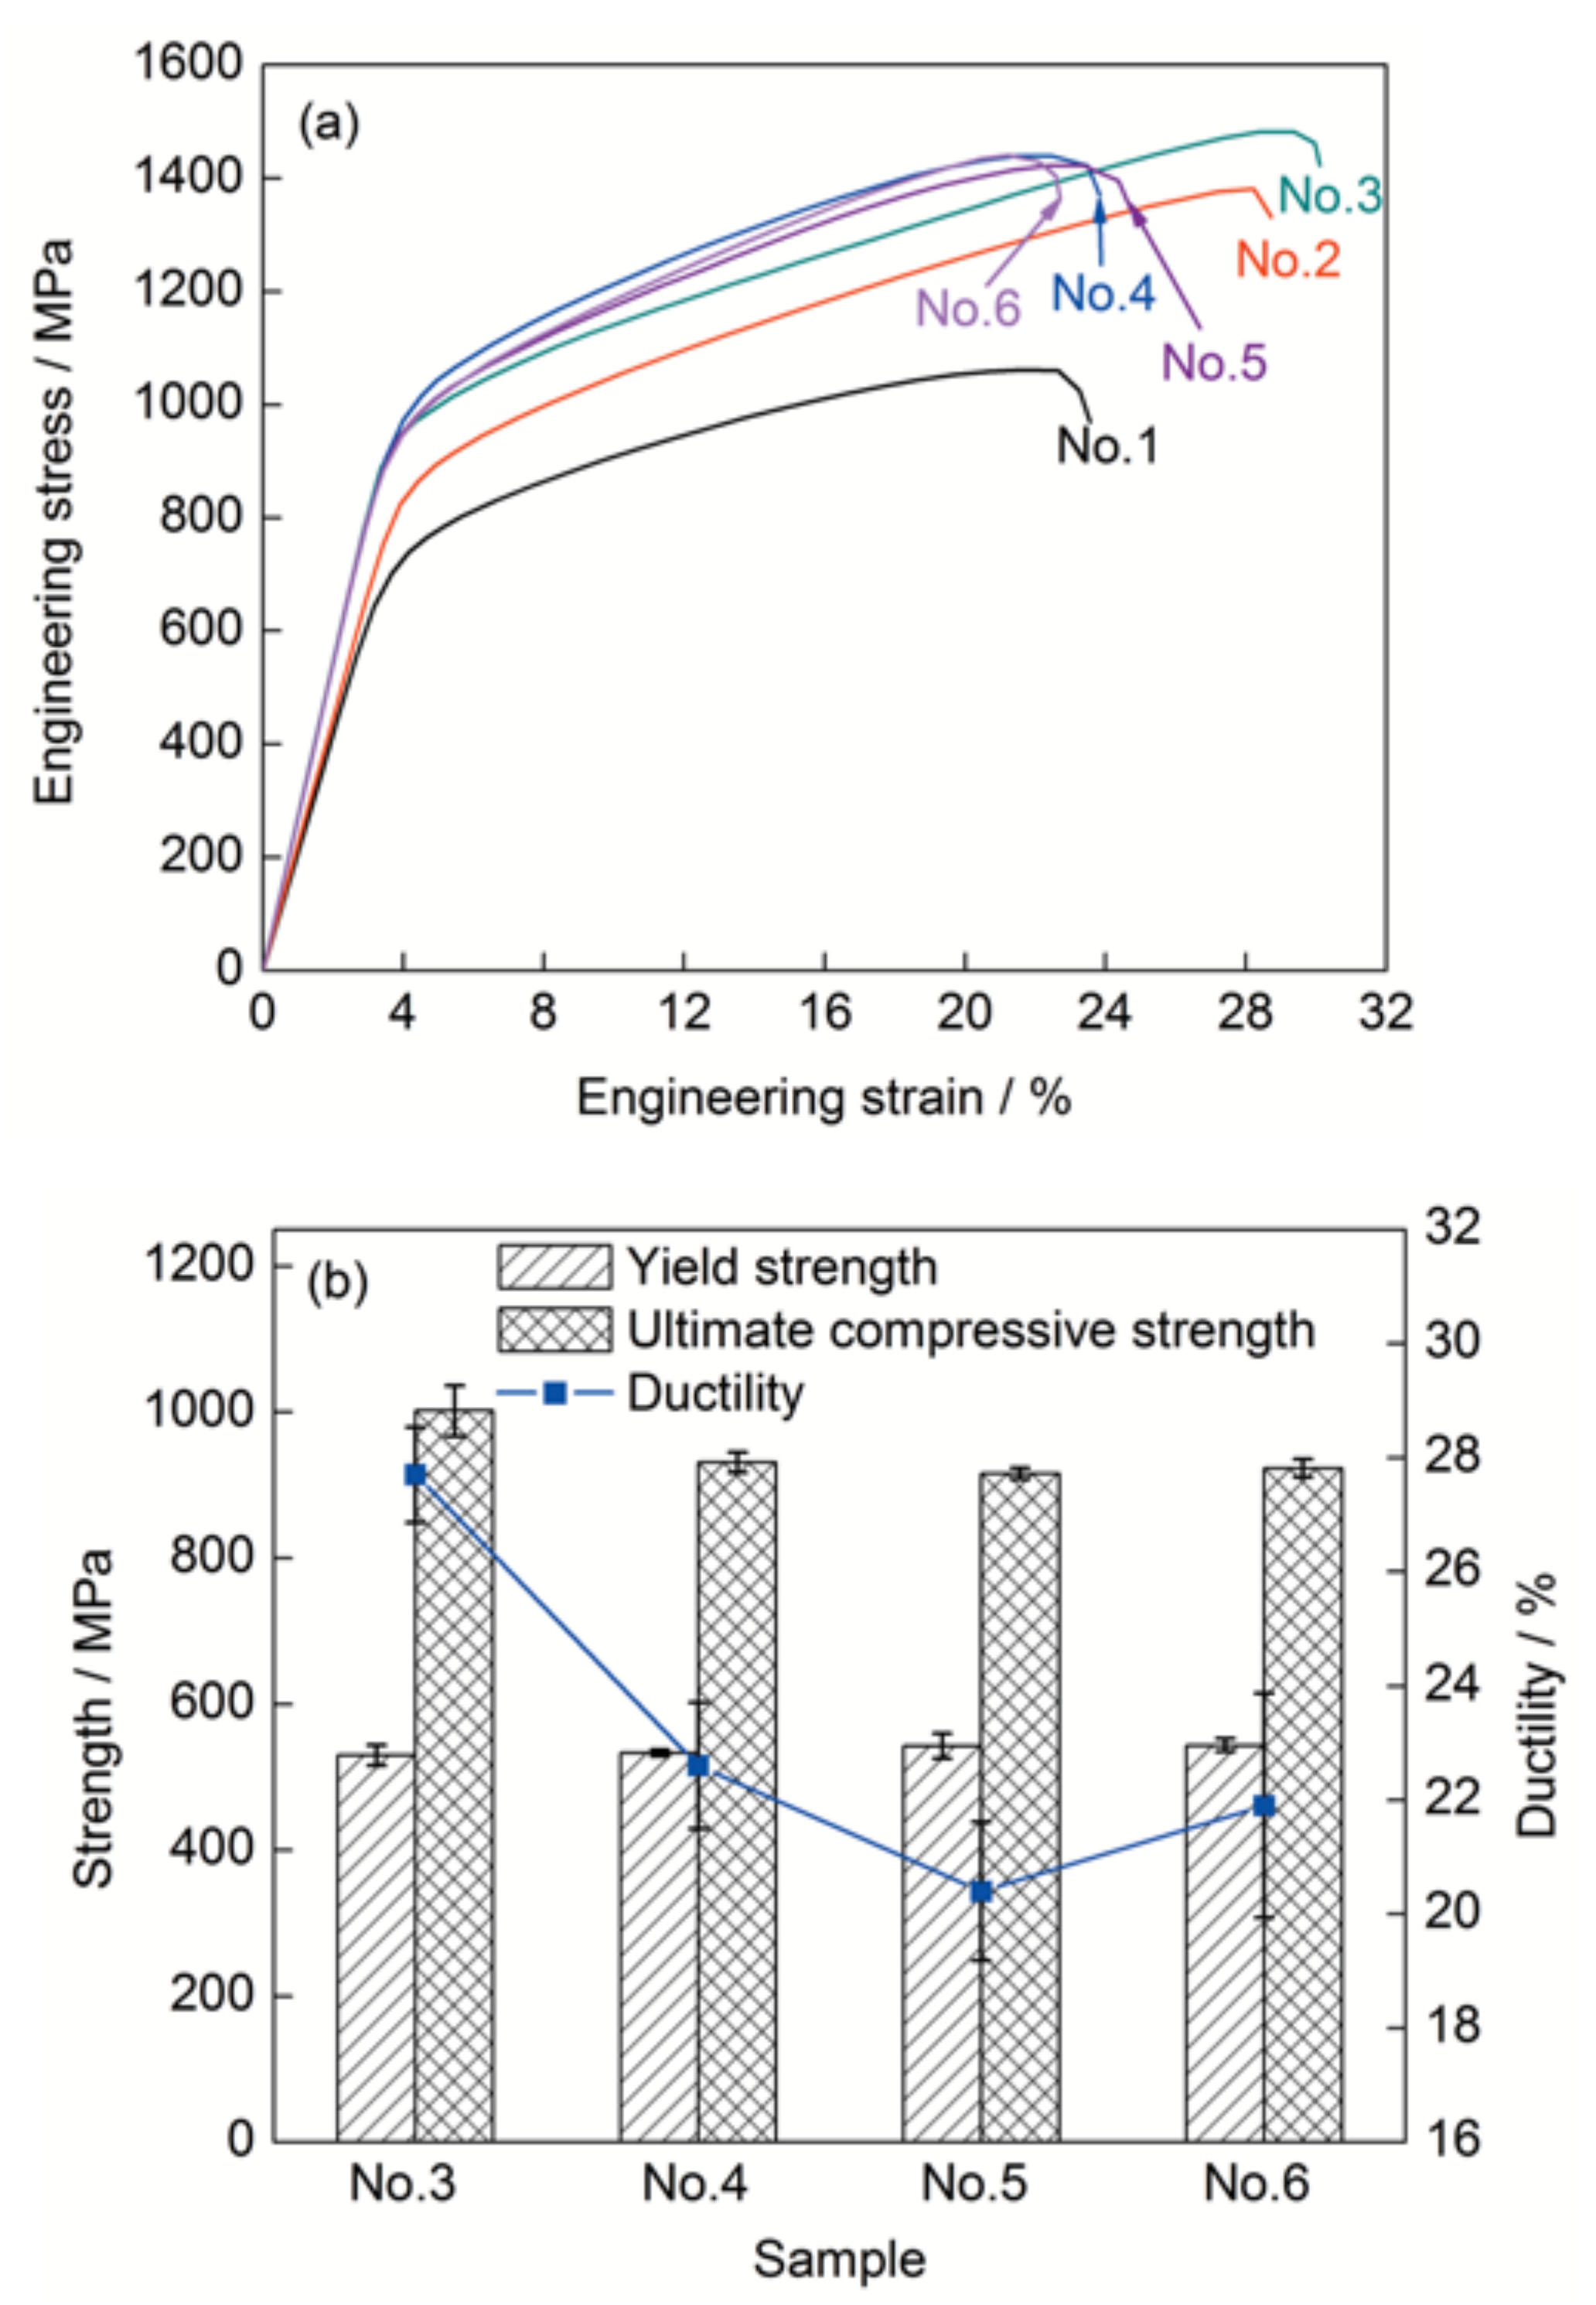
8.1. Experimental Results and Discussion
8.1.1. Measurement Uncertainty Induced by Temperature Variation
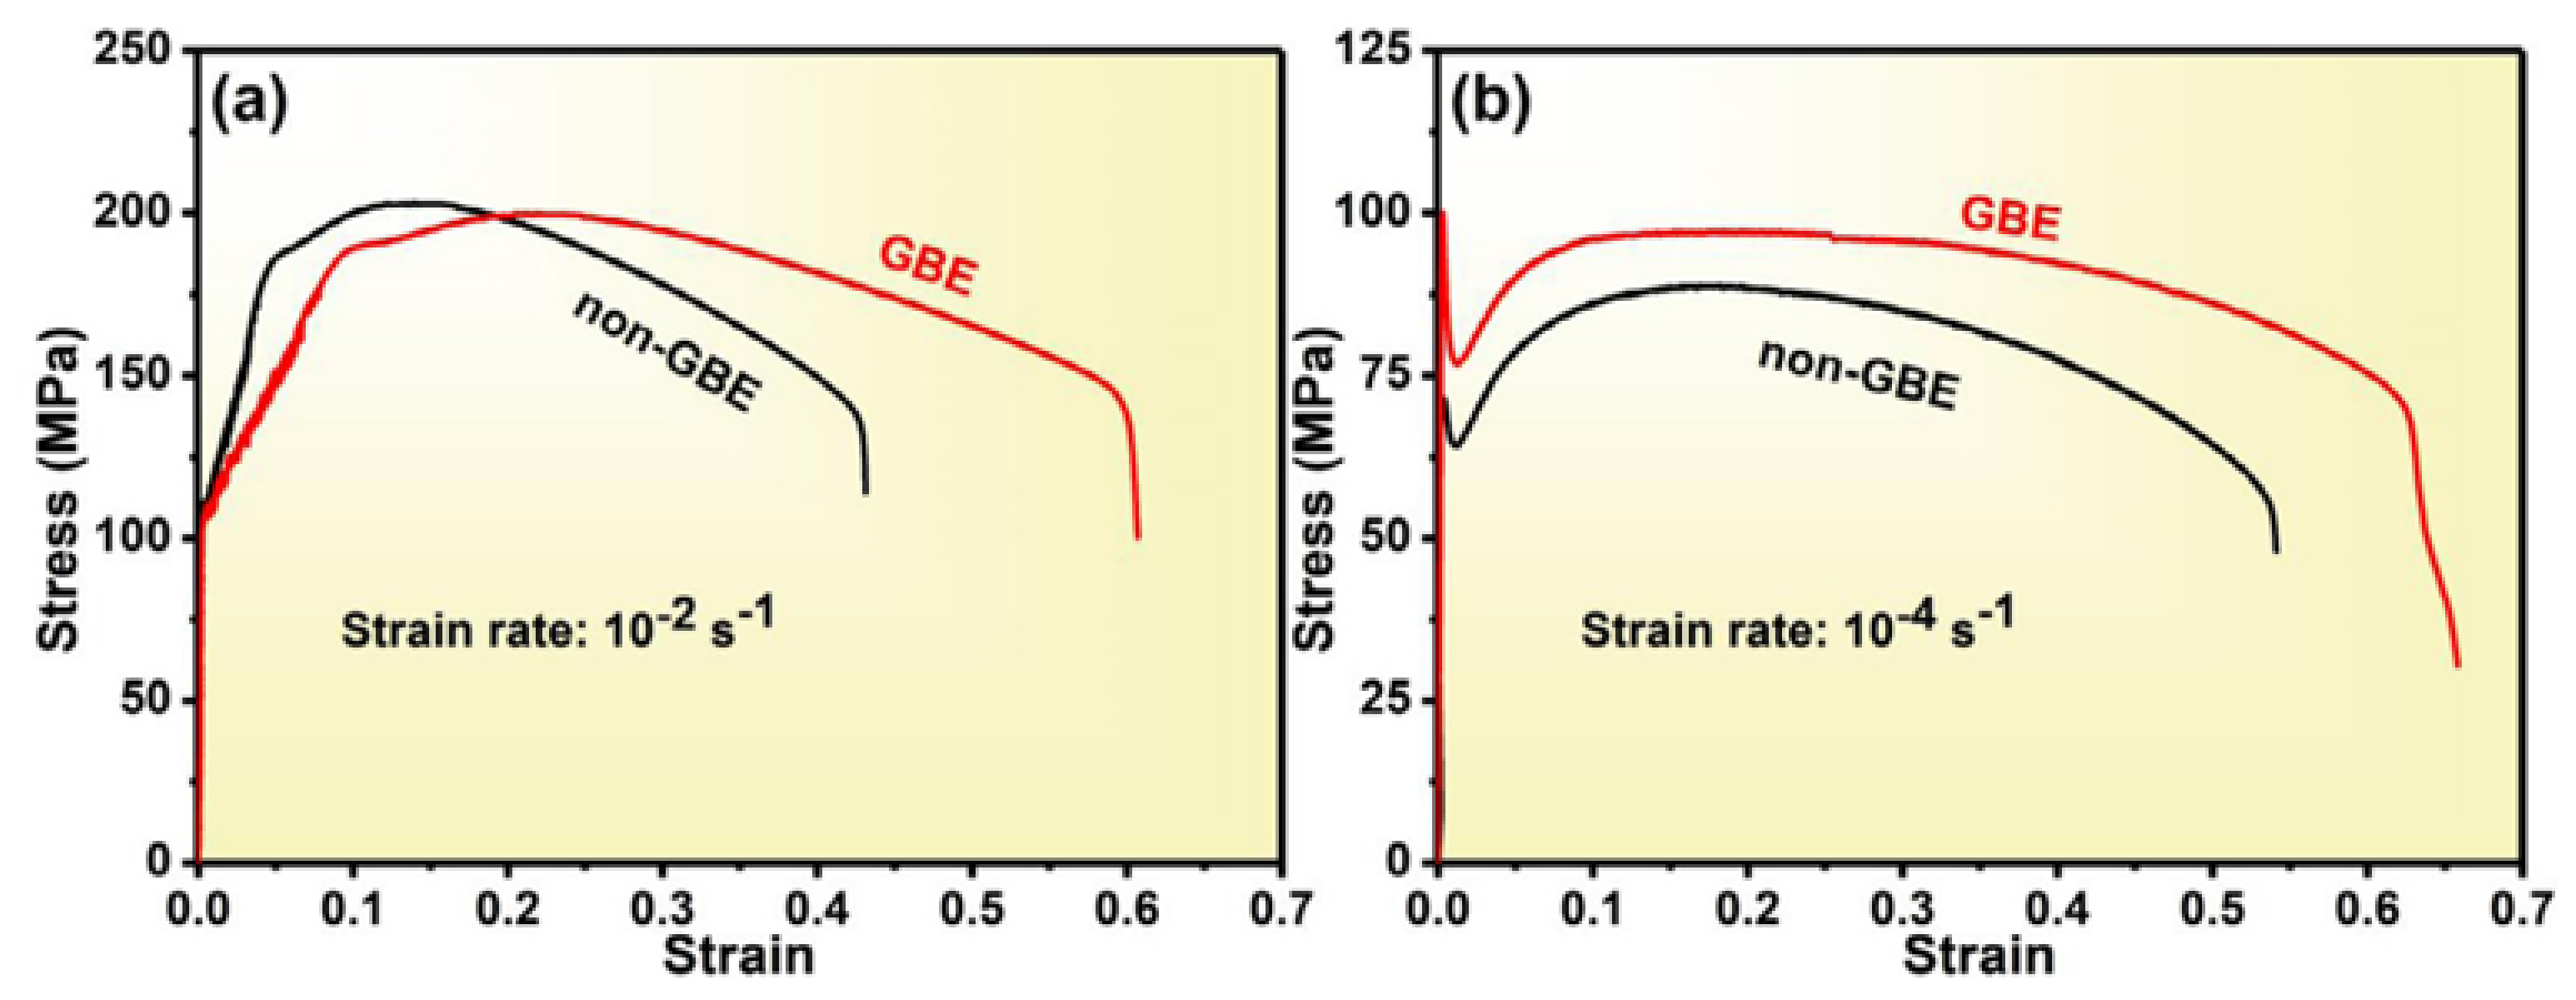
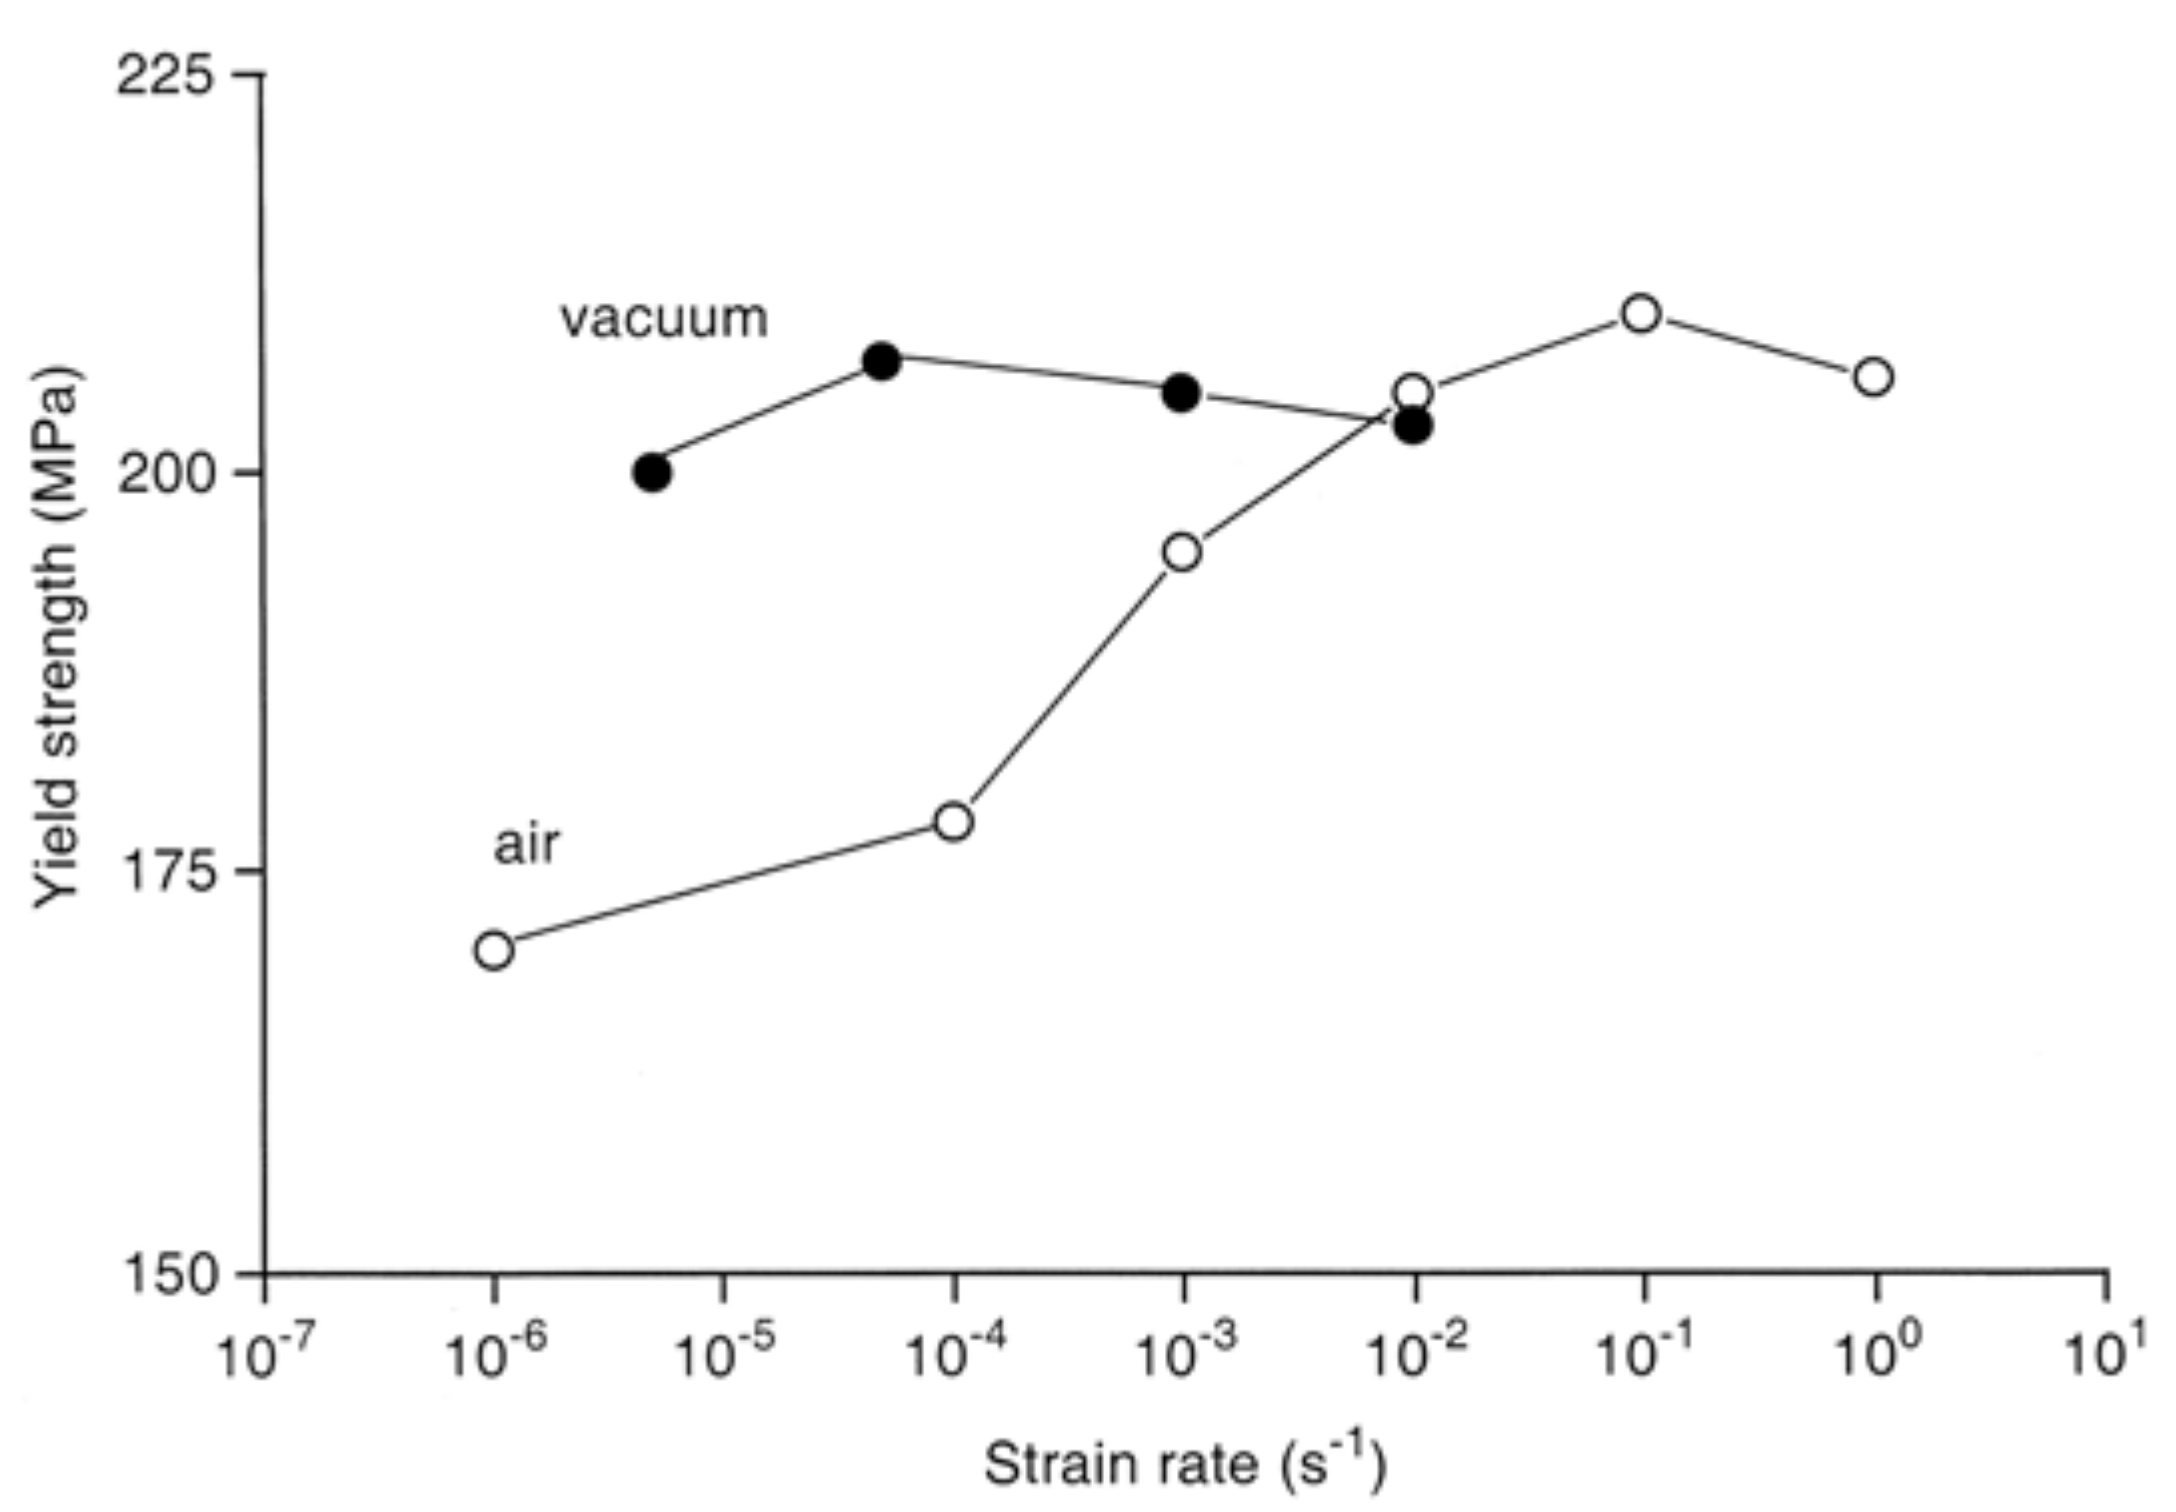
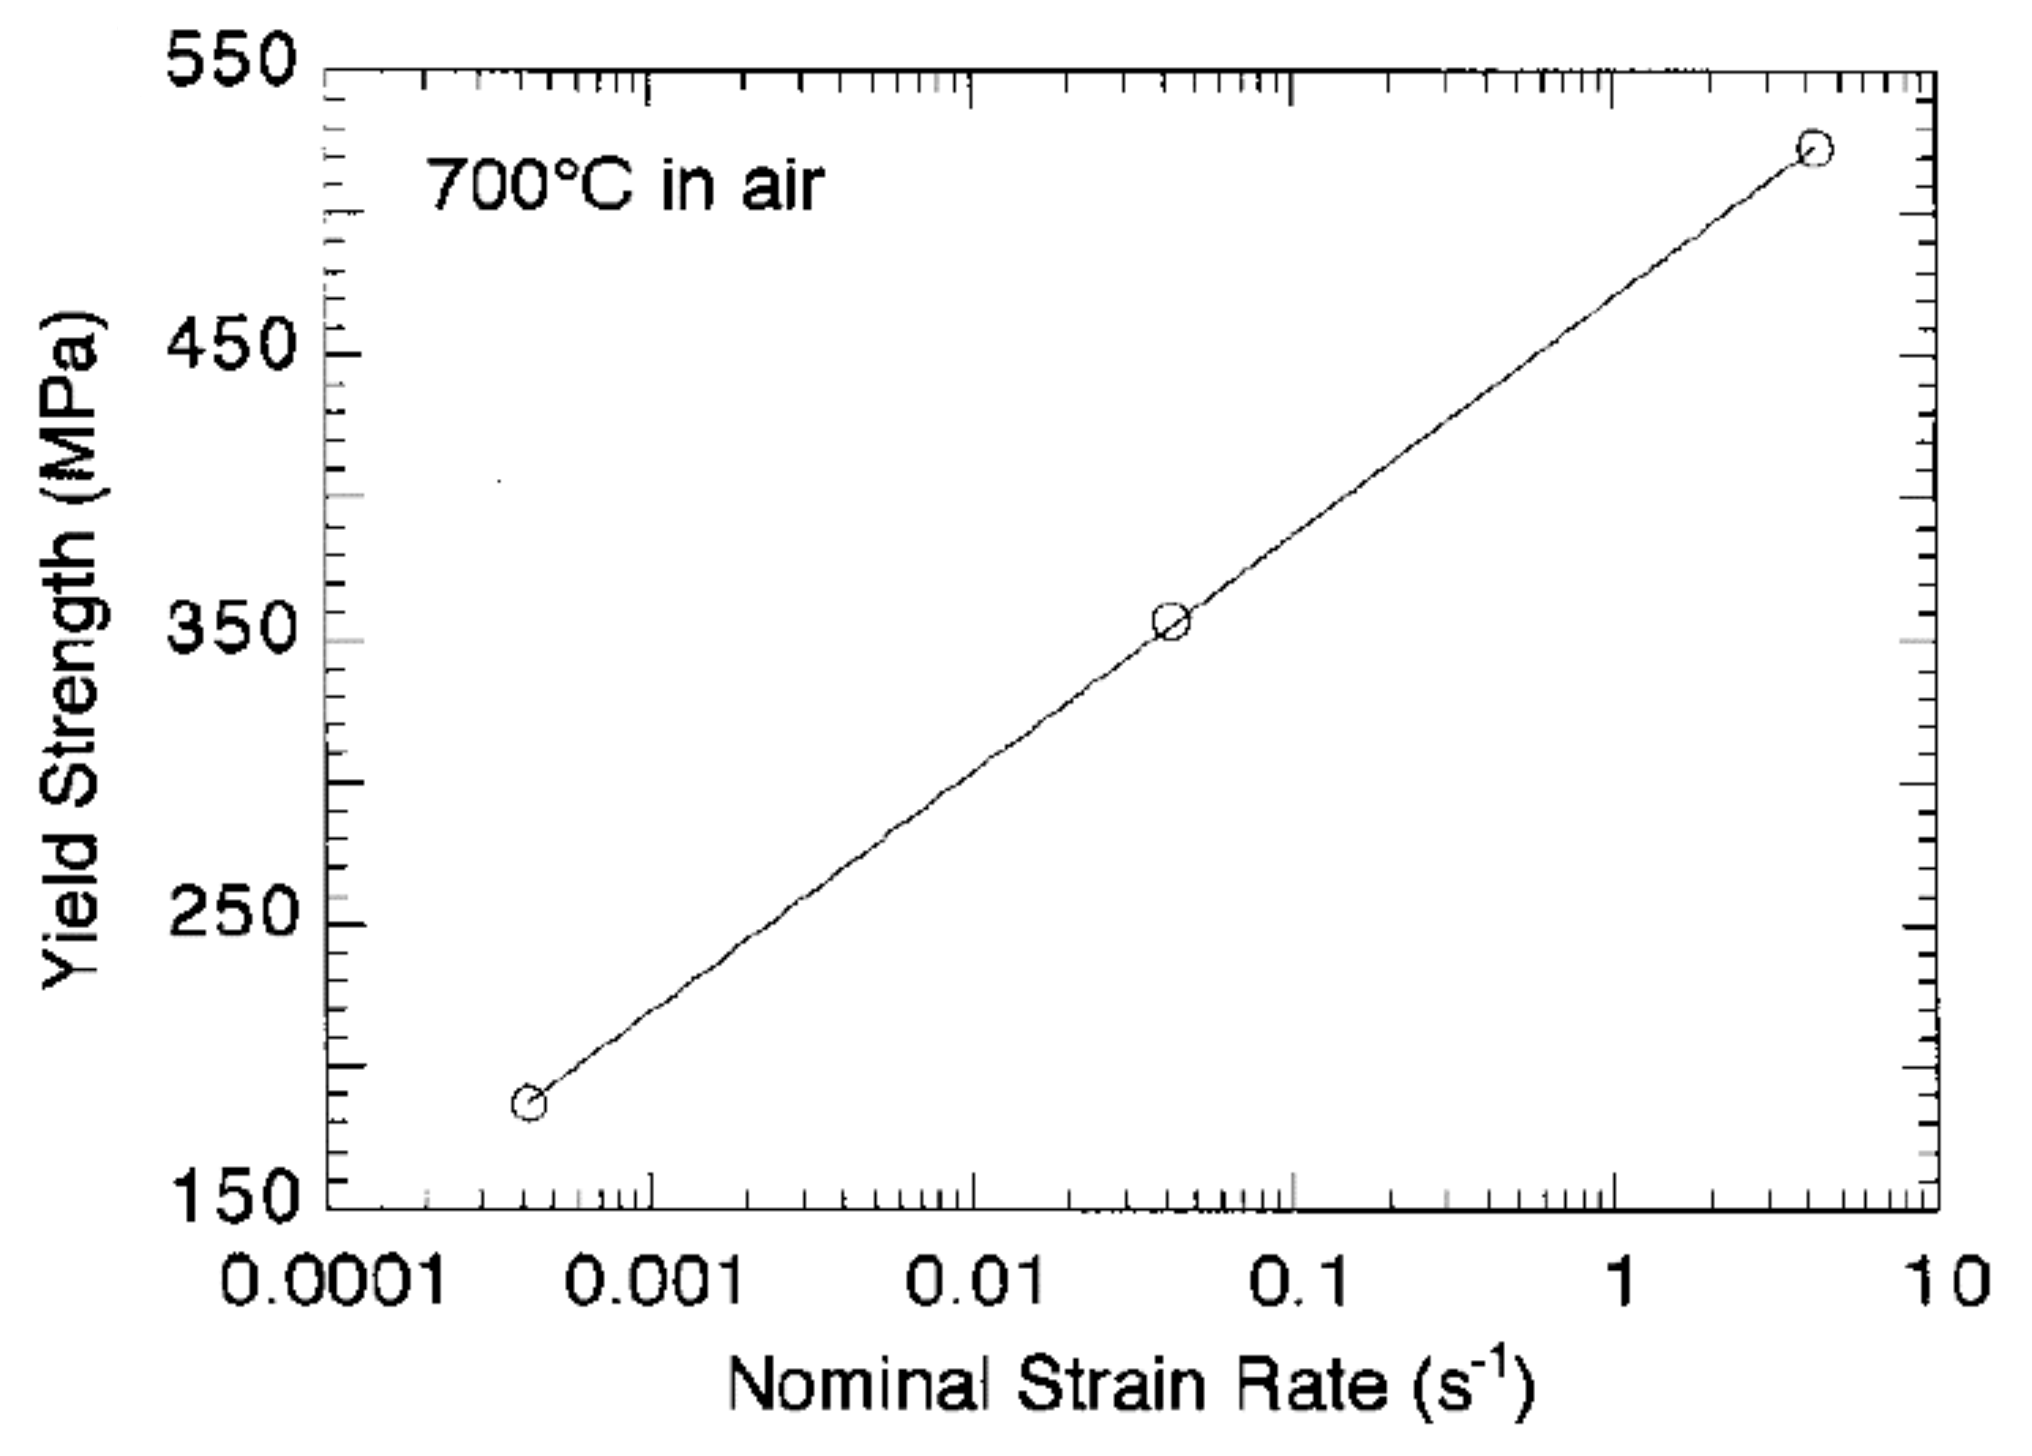
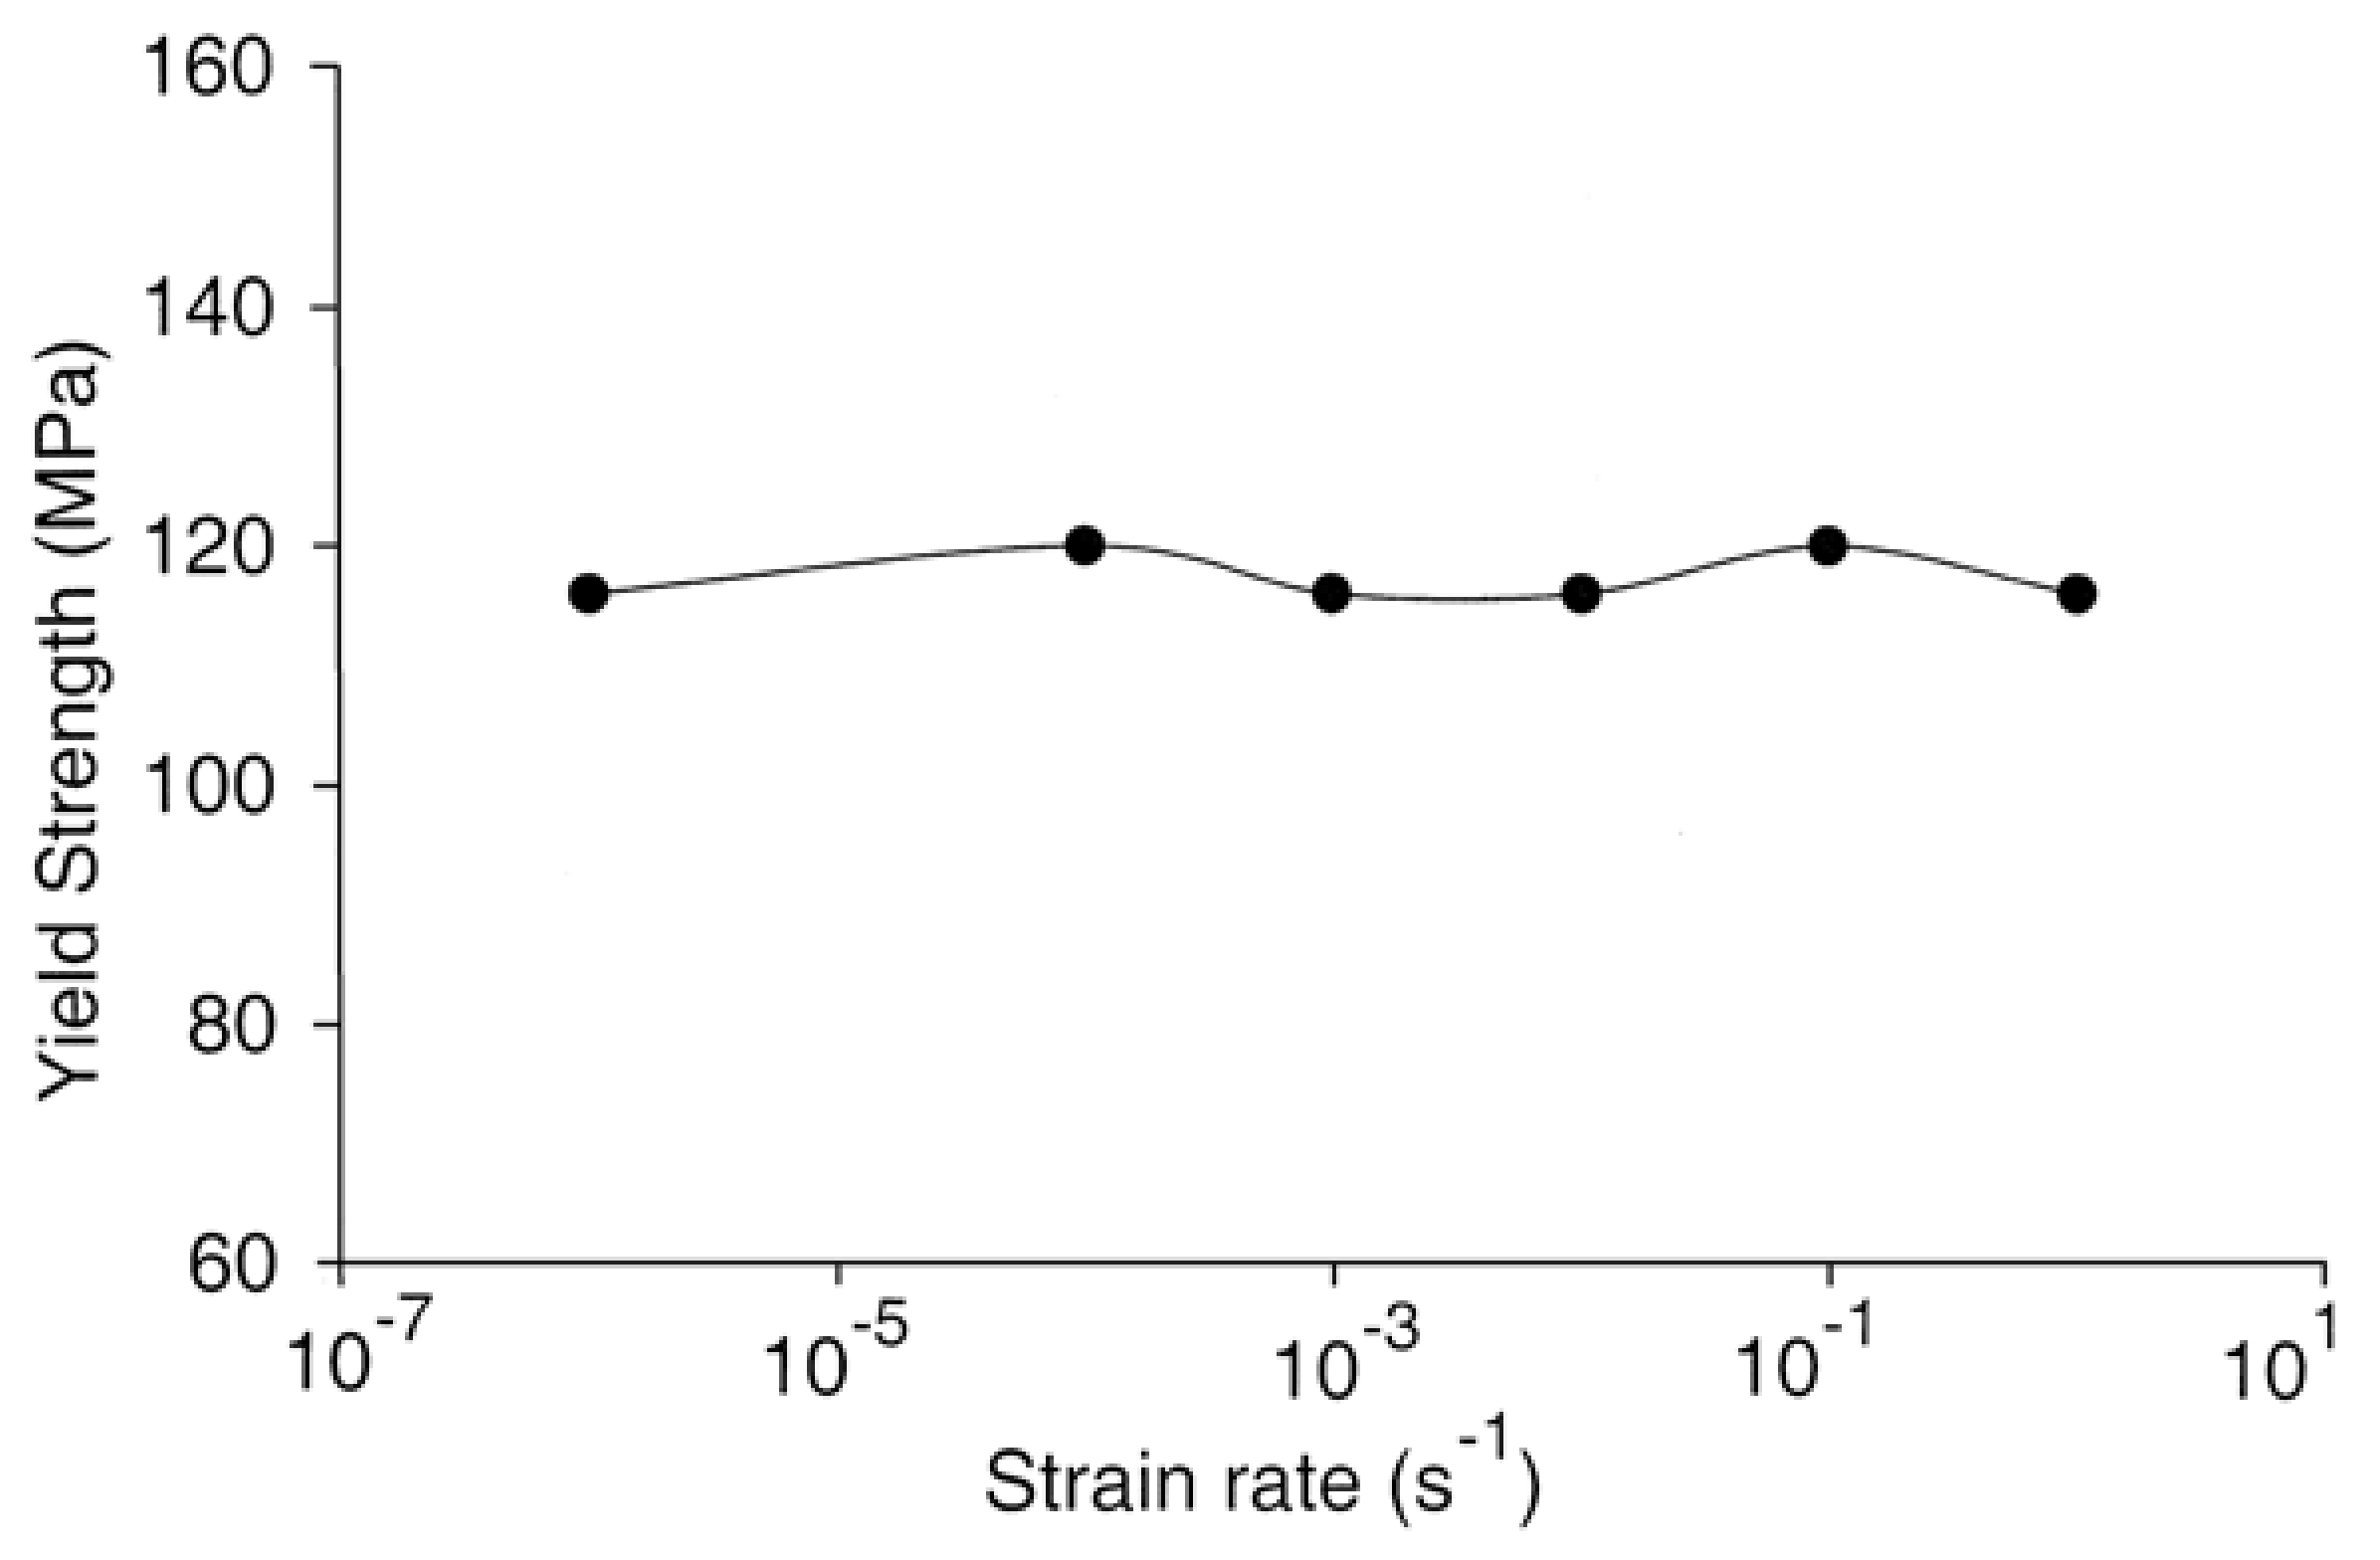
8.1.2. Measurement Uncertainty Induced by Strain Rate Variation
8.2. Mechanical Property Characterization
8.2.1. Original Mechanical Property
8.2.2. Service Mechanical Property
8.2.3. Processing Deformation Mechanical Property
9. Summary
Author Contributions
Funding
Conflicts of Interest
References
- ASTM International. ASTM E21-03a: Standard Test Methods for Elevated Temperature Tension Tests of Metallic Materials; ASTM: West Conshohocken, PA, USA, 2003. [Google Scholar]
- International Standard. ISO 6892-2:2011(E): Metallic Materials—Tensile Testing—Part 2: Method of Test at Elevated Temperature, 1st ed.; International Organization for Standardization: Geneva, Switzerland, 2011. [Google Scholar]
- Sun, D.S.; Yamane, T.; Hirao, K. Intermediate-temperature brittleness of a ferritic 17Cr stainless steel. J. Mater. Sci. 1991, 26, 689–694. [Google Scholar] [CrossRef]
- Sun, D.S.; Yamane, T.; Hirao, K. Influence of thermal histories on intermediate temperature embrittlement of an Fe-17Cr alloy. J. Mater. Sci. 1991, 26, 5767–5769. [Google Scholar] [CrossRef]
- Otsuka, M.; Horiuchi, R. Ductility Loss of Al-Mg Aloys at High Temperatures. J. Jpn. Inst. Met. 1984, 48, 688–693. [Google Scholar] [CrossRef] [Green Version]
- Nowosielski, R.; Sakiewicz, P.; Mazurkiewicz, J. Ductility minimum temperature phenomenon in as cast CuNi25 alloy. J. Achiev. Mater. Manuf. Eng. 2006, 17, 93–196. [Google Scholar]
- Xu, T.; Zheng, L.; Wang, K.; Misra, R.D.K. Unified mechanism of intergranular embrittlement based on non-equilibrium grain boundary segregation. Int. Mater. Rev. 2013, 58, 263–295. [Google Scholar] [CrossRef]
- Xu, T.D. Intermediate Temperature Brittleness in Metal and Alloy: A Trouble in Materials Science for Over 100 Years. In 10000 Selected Problems in Sciences, Physics; Committee of 10000 Selected Problems in Sciences, Physics: Beijing, China, 2009; pp. 523–525. [Google Scholar]
- Suzuki, H.G. Strain Rate Dependence of Cu Embrittlement in Steels. ISIJ Int. 1997, 37, 250–254. [Google Scholar] [CrossRef]
- Xu, T.D.; Liu, Z.J.; Yu, H.Y.; Kai, W. Measurement uncertainty of metallic ductility in tensile tests: Intermediate temperature embrittlement and strain rate embrittlement. Acta Phys. Sin. 2014, 63, 228101. [Google Scholar]
- Nagasaki, C.; Aizawa, A.; Kihara, J. Influence of manganese and sulfur on hot ductility of carbon steels at high strain rate. ISIJ Int. 1987, 27, 506–512. [Google Scholar] [CrossRef]
- Kumar, K.S.; Pang, L. Effect of temperature and strain rate on the mechanical properties of Fe–40Al–0.6C. Mater. Sci. Eng. A 1998, 258, 153–160. [Google Scholar] [CrossRef]
- Kraai, D.A.; Floreen, S. The hot ductility of nickel. Trans. AIME 1964, 230, 833. [Google Scholar]
- Liu, C.M.; Abiko, K.; Tanino, M. Relation between the intergranular segregation of S and the hot ductility in high purity Fe-S alloys. Acta Metall. Sin. (Engl. Lett.) 1999, 12, 637–644. [Google Scholar]
- Horikawa, K.; Kuramoto, S.; Kanno, M. Intergranular fracture caused by trace impurities in an Al–5.5 mol% Mg alloy. Acta Mater. 2001, 49, 3981–3989. [Google Scholar] [CrossRef]
- Nachtrab, W.T.; Chou, Y.T. High temperature ductility loss in carbon-manganese and niobium-treated steels. Metall. Trans. A 1986, 17, 1995–2006. [Google Scholar] [CrossRef]
- Xu, T.; Yu, H.; Liu, Z.; Zheng, Z. The measurement uncertainty of reduction in area of metals in tensile testing system. Measurement 2015, 66, 1–9. [Google Scholar] [CrossRef]
- Xu, T.D. Interfacial Segregation and Embrittlement. In Reference Module in Materials Science and Materials Engineering; Hashmi, S., Ed.; Elsevier: Oxford, UK, 2016. [Google Scholar]
- Guan, X.J.; Shi, F.; Ji, H.M.; Li, X.W. A possibility to synchronously improve the high-temperature strength and ductility in face-centered cubic metals through grain boundary engineering. Scr. Mater. 2020, 187, 216–220. [Google Scholar] [CrossRef]
- Xu, T.D. A model for intergranular segregation/dilution induced by applied stress. J. Mater. Sci. 2000, 35, 5621–5628. [Google Scholar]
- Xu, T.D. Kinetics of non-equilibrium grain-boundary segregation induced by applied tensile stress and its computer simulation—ScienceDirect. Scr. Mater. 2002, 46, 759–763. [Google Scholar] [CrossRef]
- Xu, T.D. Creating and destroying vacancies in solids and non-equilibrium grain-boundary segregation. Philos. Mag. 2003, 83, 889–899. [Google Scholar]
- Xu, T.D. Grain-boundary anelastic relaxation and non-equilibrium dilution induced by compressive stress and its kinetic simulation. Philos. Mag. 2007, 87, 1581–1599. [Google Scholar] [CrossRef]
- Shinoda, T.; Nakamura, T. The effects of applied stress on the intergranular phosphorus segregation in a chromium steel. Acta Metall. 1981, 29, 1631–1636. [Google Scholar] [CrossRef]
- Song, S.H.; Wu, J.; Wang, D.Y.; Weng, L.Q.; Zheng, L. Stress-induced non-equilibrium grain boundary segregation of phosphorus in a Cr–Mo low alloy steel. Mater. Sci. Eng. A 2006, 430, 320–325. [Google Scholar] [CrossRef]
- Misra, R. Issues concerning the effects of applied tensile stress on intergranular segregation in a low alloy steel. Acta Mater. 1996, 44, 885–890. [Google Scholar] [CrossRef]
- Xu, T.D.; Cheng, B.Y. Kinetics of non-equilibrium grain-boundary segregation. Prog. Mater. Sci. 2004, 49, 109–208. [Google Scholar] [CrossRef]
- Zheng, Z.W.; Xu, T.D.; Wang, K.; Shao, C. Progress in the theory of grain boundary anelastic relaxation. Acta Phys. Sin. 2012, 61, 246202. [Google Scholar]
- Xu, T.D. Kinetics of Non-Equilibrium Grain-Boundary Segregation and Intergranular Fracture (Mechanism of Measurement Uncertainty); Science Press: Beijing, China, 2017. [Google Scholar]
- Cadel, E.; Launois, S.; Fraczkiewicz, A.; Blavette, D. Investigation of boron-enriched Cottrell atmospheres in FeAl on atomic scale by three-dimensional atom-probe field-ion microscopy. Philo. Mag. Lett. 2000, 80, 725–736. [Google Scholar] [CrossRef]
- Xiao, H.; Baker, I. The temperature dependence of the flow and fracture of Fe-40Al. Scr. Metall. Mater. 1993, 28, 1411–1416. [Google Scholar] [CrossRef]
- Klein, O.; Baker, I. The effect of boron on the temperature dependence of the flow and fracture of Fe 45Al. Scr. Metall. Mater. 1994, 30, 1413–1417. [Google Scholar] [CrossRef]
- Wu, D.; Baker, I. The effect of environment and strain rate on the room temperature tensile properties of FeAl single crystals. Intermetallics 2001, 9, 57–65. [Google Scholar] [CrossRef]
- Xu, T.D.; Wang, M.Q.; He, H.M. Mechanical property-tensile strain rate curve of metals. Phys. Exam. Test. 2019, 37, 54–59. [Google Scholar]
- Xu, T.D.; Yu, H.Y.; Wang, K.; Zheng, Z.W.; Gan, B. Uncertainty and Mechanical Properties Characterization of High Entropy Alloy in Tensile Testing. J. Iron Steel Res. 2020, 32, 909–925. [Google Scholar]
- Xu, T.D. A discussion on measurement for original mechanical properties of tensile samples in metals. Phys. Exam. Test. 2021, in press. [Google Scholar]
- Kobayashi, H. Hot-ductility recovery by manganese sulphide precipitation in low manganese mild steel. Trans. Iron Steel Inst. Jpn. 1991, 31, 268–277. [Google Scholar] [CrossRef] [Green Version]
- Kizu, T.; Urabe, T. Hot ductility of sulfur-containing low manganese mild steels at high strain rate. ISIJ Int. 2009, 49, 1424–1431. [Google Scholar] [CrossRef] [Green Version]
- Xu, T.D. Exchanging information with authors of 15 papers. Private Communications, 2020. [Google Scholar]
- Lin, Z.Q.; Zheng, W.; Li, H.; Wang, D.J. Microstructures and mechanical properties of TA15 titanium alloy and graphene reinforced TA15 composites prepared by spark plasma sintering. Acta Metall. Sin. 2021, 57, 111–120. [Google Scholar]
- Maciakowski, P.; Augustyniak, B.; Chmielewski, M.; Piotrowski, L. Application of mechanical Barkhausen noise in assessment of X20 steel properties after heat treatment. J. Electr. Eng. 2012, 63, 102–105. [Google Scholar]
- Vourna, P.; Ktena, A.; Tsarabaris, P.; Hristoforou, E. Magnetic Residual Stress Monitoring Technique for Ferromagnetic Steels. Metals 2018, 8, 592. [Google Scholar] [CrossRef] [Green Version]
- Hu, Z.B.; Fan, J.C.; Wu, S.N.; Dai, H.Y.; Liu, S.J. Characteristics of Metal Magnetic Memory Testing of 35CrMo Steel during Fatigue Loading. Metals 2018, 8, 119. [Google Scholar] [CrossRef] [Green Version]
- García-Martín, J.; Gómez-Gil, J.; Vázquez-Sánchez, E. Non-Destructive Techniques Based on Eddy Current Testing. Sensors 2011, 11, 2525–2565. [Google Scholar] [CrossRef] [Green Version]
- Senkov, O.N.; Semiatin, S.L. Microstructure and properties of a refractory high-entropy alloy after cold working. J. Alloy. Compd. 2015, 649, 1110–1123. [Google Scholar] [CrossRef]
- Laplanche, G.; Kostka, A.; Horst, O.M.; Eggeler, G.; George, E.P. Microstructure evolution and critical stress for twinning in the CrMnFeCoNi high-entropy alloy. Acta Mater. 2016, 118, 152–163. [Google Scholar] [CrossRef] [Green Version]
- Senkov, O.N.; Wilks, G.B.; Miracle, D.B.; Chuang, C.P.; Liaw, P.K. Refractory high-entropy alloys. Intermetallics 2010, 18, 1758–1765. [Google Scholar] [CrossRef]
- Lu, Z.P.; Lei, Z.F.; Huang, H.L.; Liu, S.F.; Zhang, F.; Duan, D.B.; Cao, P.P.; Wu, Y.; Liu, X.J.; Wang, H. Deformation behavior and toughening of high entropy alloys. Acta Metall. Sin. 2018, 54, 1553–1566. [Google Scholar]
- Gludovatz, B.; Hohenwarter, A.; Catoor, D.; Chang, E.H.; George, E.P.; Ritchie, R.O. A fracture-resistant high-entropy alloy for cryogenic applications. Science 2014, 345, 1153. [Google Scholar] [CrossRef] [Green Version]
- Senkov, O.N.; Scott, J.M.; Senkova, S.V.; Meisenkothen, F.; Miracle, D.B.; Woodward, C.F. Microstructure and elevated temperature properties of a refractory TaNbHfZrTi alloy. J. Mater. Sci. 2012, 47, 4062–4074. [Google Scholar] [CrossRef]
- Senkov, O.N.; Wilks, G.B.; Scott, J.M.; Miracle, D.B. Mechanical properties of NbMoTaW and VNbMoTaW refractory high entropy alloys. Intermetallics 2011, 19, 698–706. [Google Scholar] [CrossRef]
- Bishop-Moser, J.; Miracle, D. A call to action: High entropy alloy manufacturing. J. Mater. Res. 2018, 33, 2855–2856. [Google Scholar] [CrossRef]
- Huo, W.; Hui, Z.; Feng, F.; Hu, X.; Xie, Z.; Jiang, J. Strain-rate effect upon the tensile behavior of CoCrFeNi high-entropy alloys. Mater. Sci. Eng. A 2017, 689, 366–369. [Google Scholar] [CrossRef]


| Heat | C | Mn | P | S | Si | Cu | Ni | Cr |
|---|---|---|---|---|---|---|---|---|
| C | 0.24 | 1.06 | 0.011 | 0.002 | 0.230 | 0.110 | 0.100 | 0.055 |
| D | 0.19 | 1.32 | 0.009 | 0.019 | 0.218 | 0.263 | 0.203 | 0.160 |
| Mo | As | Sb | Sn | Al | Alsol | N | ||
| C | 0.052 | 0.0082 | 0.0013 | 0.005 | 0.046 | 0.045 | 0.0176 | |
| D | 0.061 | 0.0096 | 0.0035 | 0.036 | 0.036 | 0.030 | 0.0096 |
| Alloy | As-Annealed/Pre-Strained | Strainrate(s−1) | Yieldstrength(MPa) |
|---|---|---|---|
| Vacuum | |||
| Fe-40Al | As-annealed | 1 × 10⁻⁵ | 200 |
| 1 × 10⁻⁴ | 207 | ||
| 1 × 10⁻³ | 205 | ||
| 1 × 10⁻² | 203 | ||
| Air | |||
| Fe-40Al | As-annealed | 1 × 10⁻⁶ | 170 |
| 1 × 10⁻⁴ | 178 | ||
| 1 × 10⁻³ | 195 | ||
| 1 × 10⁻² | 205 | ||
| 1 × 10⁻¹ | 210 | ||
| 1 | 206 | ||
| Pre-strained | 1 × 10⁻⁴ | 258 | |
| 1 × 10⁻² | 380 | ||
| 1 | 280 | ||
| Fe-40Ai-1Y | As-annealed | 1 × 10⁻⁶ | 230 |
| 1 × 10⁻⁴ | 250 | ||
| 1 × 10⁻² | 290 | ||
| 1 | 280 | ||
| Pre-strained | 1 × 10⁻⁶ | 250 | |
| 1 × 10⁻² | 510 | ||
| 1 | 460 |
| T (K) | 296 | 673 | 873 | 1073 | 1273 | 1473 |
|---|---|---|---|---|---|---|
| σ0.2 (MPa) | 929 | 790 | 675 | 535 | 295 | 92 |
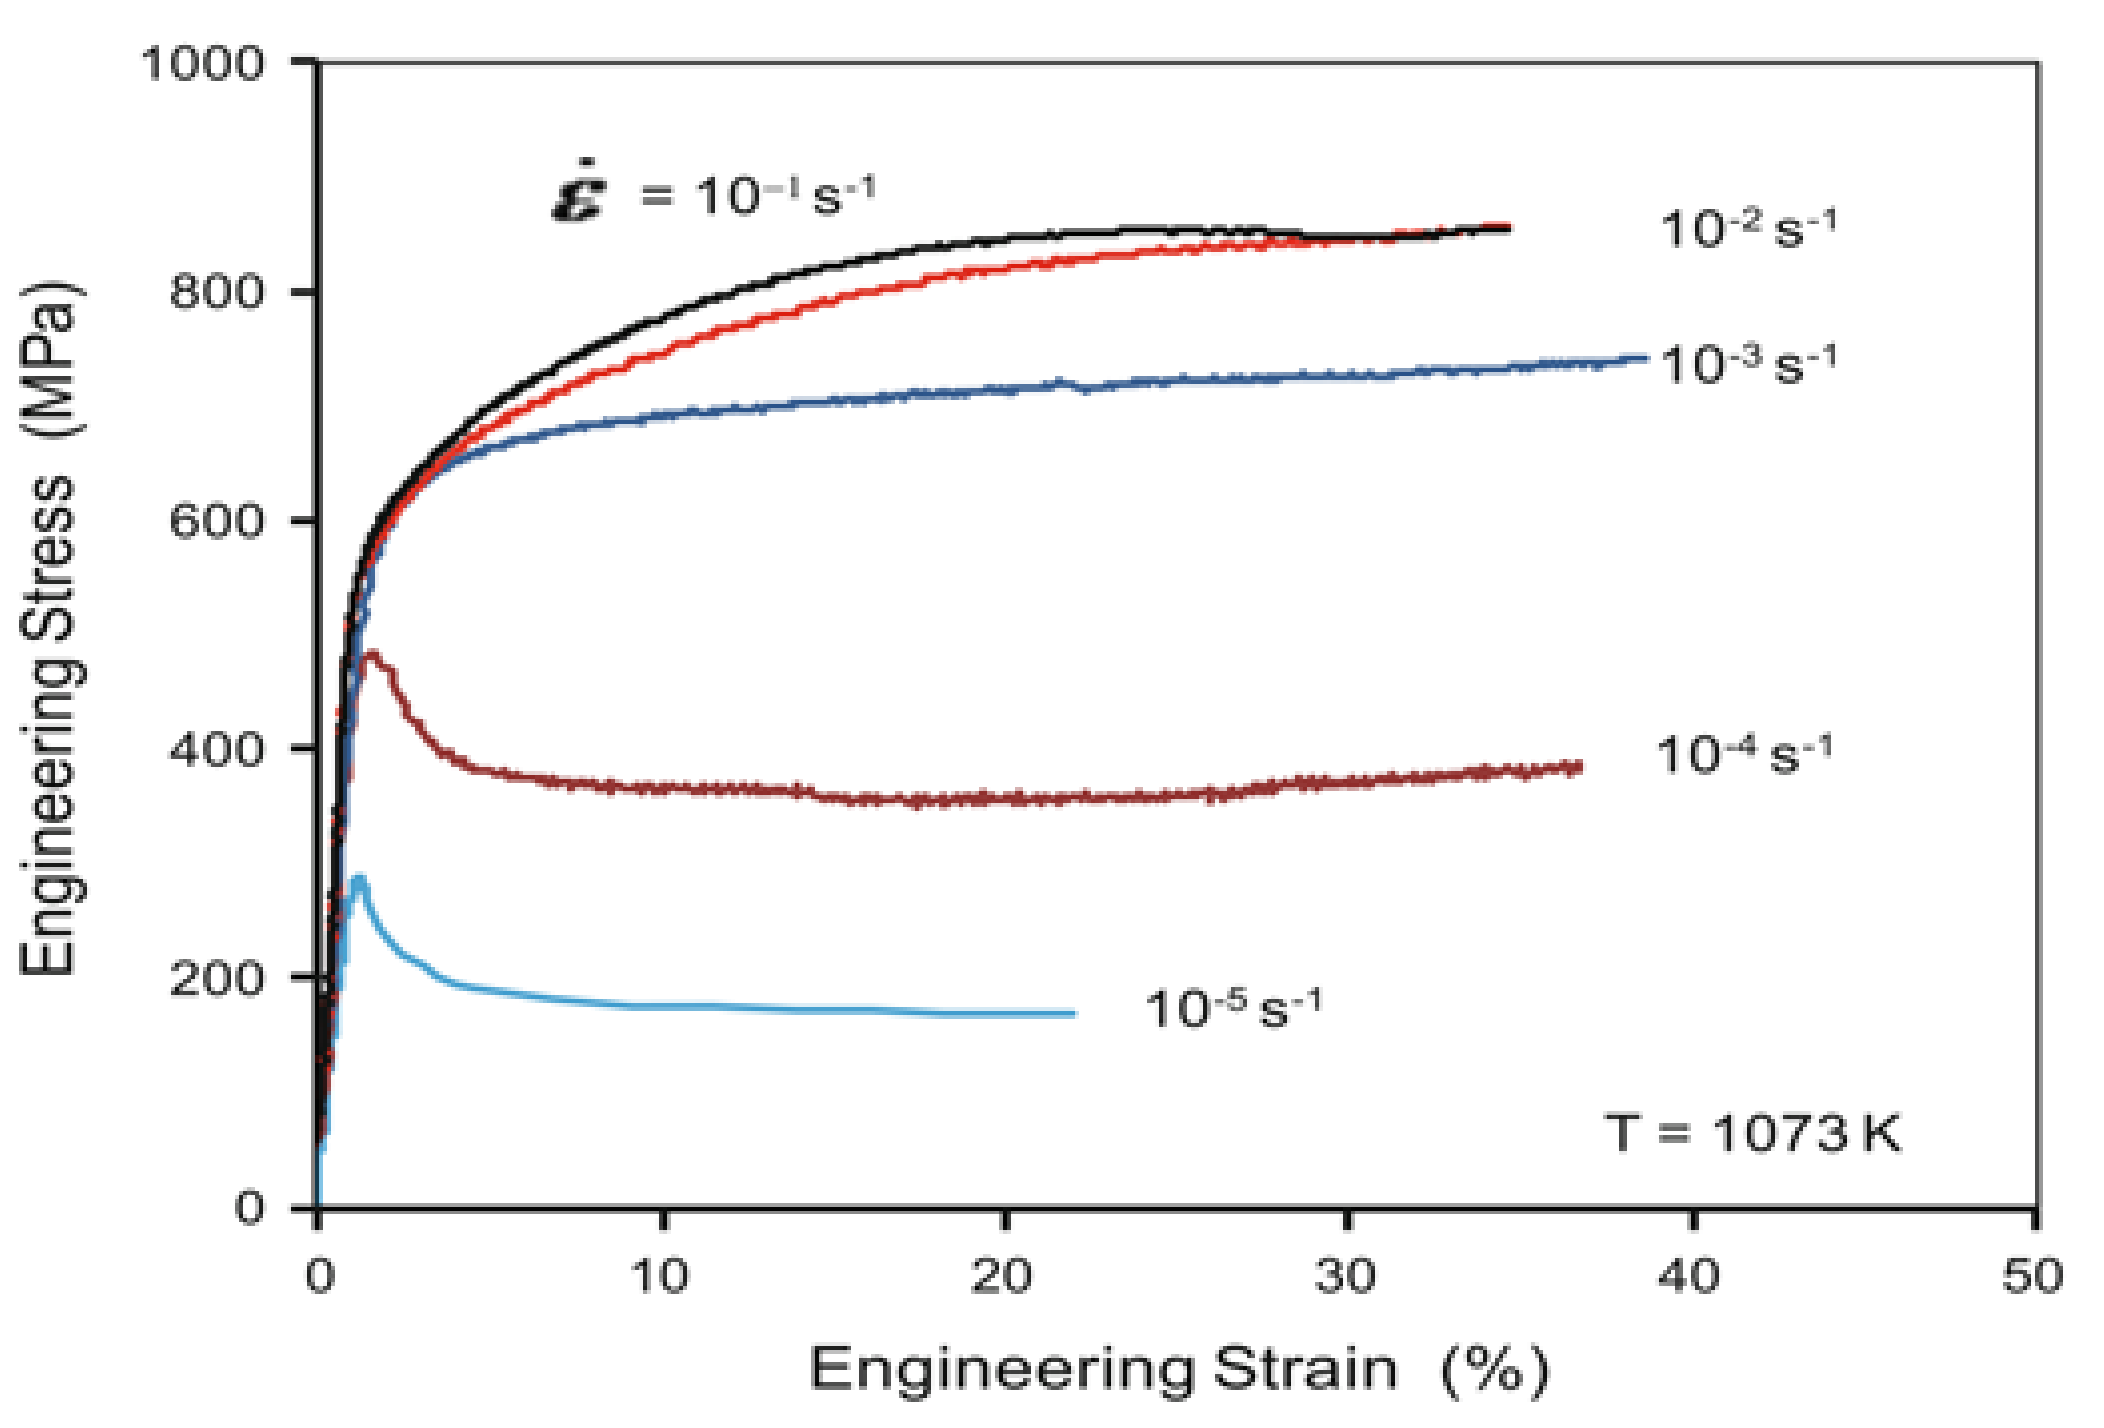
| Strain Rate (s−1) | 10−5 | 10−4 | 10−3 | 10−2 | 10−1 |
|---|---|---|---|---|---|
| σ0.2 (MPa) | 285 | 475 | 535 | 543 | 550 |
Publisher’s Note: MDPI stays neutral with regard to jurisdictional claims in published maps and institutional affiliations. |
© 2021 by the authors. Licensee MDPI, Basel, Switzerland. This article is an open access article distributed under the terms and conditions of the Creative Commons Attribution (CC BY) license (https://creativecommons.org/licenses/by/4.0/).
Share and Cite
Xu, T.; Wang, K.; Song, S. Measurement Uncertainty and Representation of Tensile Mechanical Properties in Metals. Metals 2021, 11, 1733. https://doi.org/10.3390/met11111733
Xu T, Wang K, Song S. Measurement Uncertainty and Representation of Tensile Mechanical Properties in Metals. Metals. 2021; 11(11):1733. https://doi.org/10.3390/met11111733
Chicago/Turabian StyleXu, Tingdong, Kai Wang, and Shenhua Song. 2021. "Measurement Uncertainty and Representation of Tensile Mechanical Properties in Metals" Metals 11, no. 11: 1733. https://doi.org/10.3390/met11111733
APA StyleXu, T., Wang, K., & Song, S. (2021). Measurement Uncertainty and Representation of Tensile Mechanical Properties in Metals. Metals, 11(11), 1733. https://doi.org/10.3390/met11111733