Article

Investigation of Factors Influencing the Autoclave Tests Results of Internal Anticorrosive Polymer Coatings

Institute of Advanced Manufacturing Technologies, Peter the Great St. Petersburg Polytechnic University (SPbPU), 195251 St. Petersburg, Russia
*
Author to whom correspondence should be addressed.
Metals 2021, 11(11), 1713; https://doi.org/10.3390/met11111713
Submission received: 28 September 2021 / Revised: 22 October 2021 / Accepted: 25 October 2021 / Published: 27 October 2021

Abstract

:
Polymer coatings are one of the most common methods for protecting metal structures from corrosion damage. For example, in the oil and gas industry, polymer coatings are used to protect the inner surfaces of oilfield pipelines. Forecasting the service life of the coating is an unsolved problem. Existing test methods allow to assess the quality of coating application and compliance with the declared properties, for example, resistance at a certain temperature, but do not allow to understand the expected service life or degradation dynamics. One solution to this problem may be the development of existing methods of autoclave testing of coatings with the addition of more criteria for assessing degradation. This paper considers the methodological features of autoclave testing with rapid pressure relief. The decompression autoclave test was considered from the point of view of the principles of its conduct and evaluation of test results. The tests were carried out in environments containing hydrogen sulfide and carbon dioxide. The main object of the tests was anticorrosive polymer powder coatings applied in industrial conditions. The work assessed the influence of the following factors on the test result: pressure relief time, test cycle, and coating quality. Attention was also paid to the evaluation methods; aside from the adhesion assessment, optical microscopy and the evaluation of the microhardness of coatings were used. As a result of the work carried out, it was shown that the pressure relief rate within 5 s affects the test results. An increase in micropores and a drop in the microhardness of coatings after cyclic autoclave tests were also shown. The method of assessing the degradation of coatings using microhardness also showed the convergence of the results with the traditional method of assessing adhesion. The results of the work can be used to modify the autoclave testing method and transition to resource forecasting.

1. Introduction

In the oil and gas industry, corrosion is one of the major causes of equipment failure. Most of the infrastructure for production and transportation comprises pipelines, so there are many solutions to protect them from corrosion damage [1]. One method to protect the inner wall of pipes is to apply a protective coating. Various types of coatings are used in their composition [2]. This article discusses polymer powder coatings.
Polymer powder coatings have been used in the oil and gas industry for over 30 years [3], but the issues related to the assessment of their durability under expected operating conditions remain relevant [4]. There is an extensive list of tests to determine the quality of polymer coatings and resistance to aggressive conditions. Tests comprise exposure of coated samples in aggressive solutions at elevated temperatures and climatic tests. The disadvantage of this type of research is its duration. For example, when developing a new paint system, a 1000-h test will significantly lengthen the development cycle. An autoclave test is the option for accelerating research: it combines the effect of temperature, pressure, and an aggressive environment.
Autoclave testing is used to assess the resistance of both metals and coatings [5,6]. There are standards and recommendations for conducting such tests, but such documents describe general steps for conducting [7,8]. When they are implemented, each specific laboratory may have its own methodological features of research.
There are two types of autoclave tests for resistance to decompression release and immersion autoclave test, followed by slow release of pressure. A decompression autoclave test is a simulation of an operational emergency, but also, because of the harsh test conditions, this test allows you to quickly assess the resistance of coatings and the quality of their application. Typically, the duration of such tests is 24 h.
When planning autoclave decompression testing of coatings, special consideration should be given to the test operating temperature. When choosing it, it is necessary to consider both the operating conditions and the specifications for the selected coating. As mentioned above, the method for conducting autoclave tests in different laboratories may differ. This article discusses the features of autoclave tests as the repeatability of test results, assessment of coating quality using a 24-h autoclave test, the effect of pressure release rate, and methods for assessing coating degradation after autoclave testing.

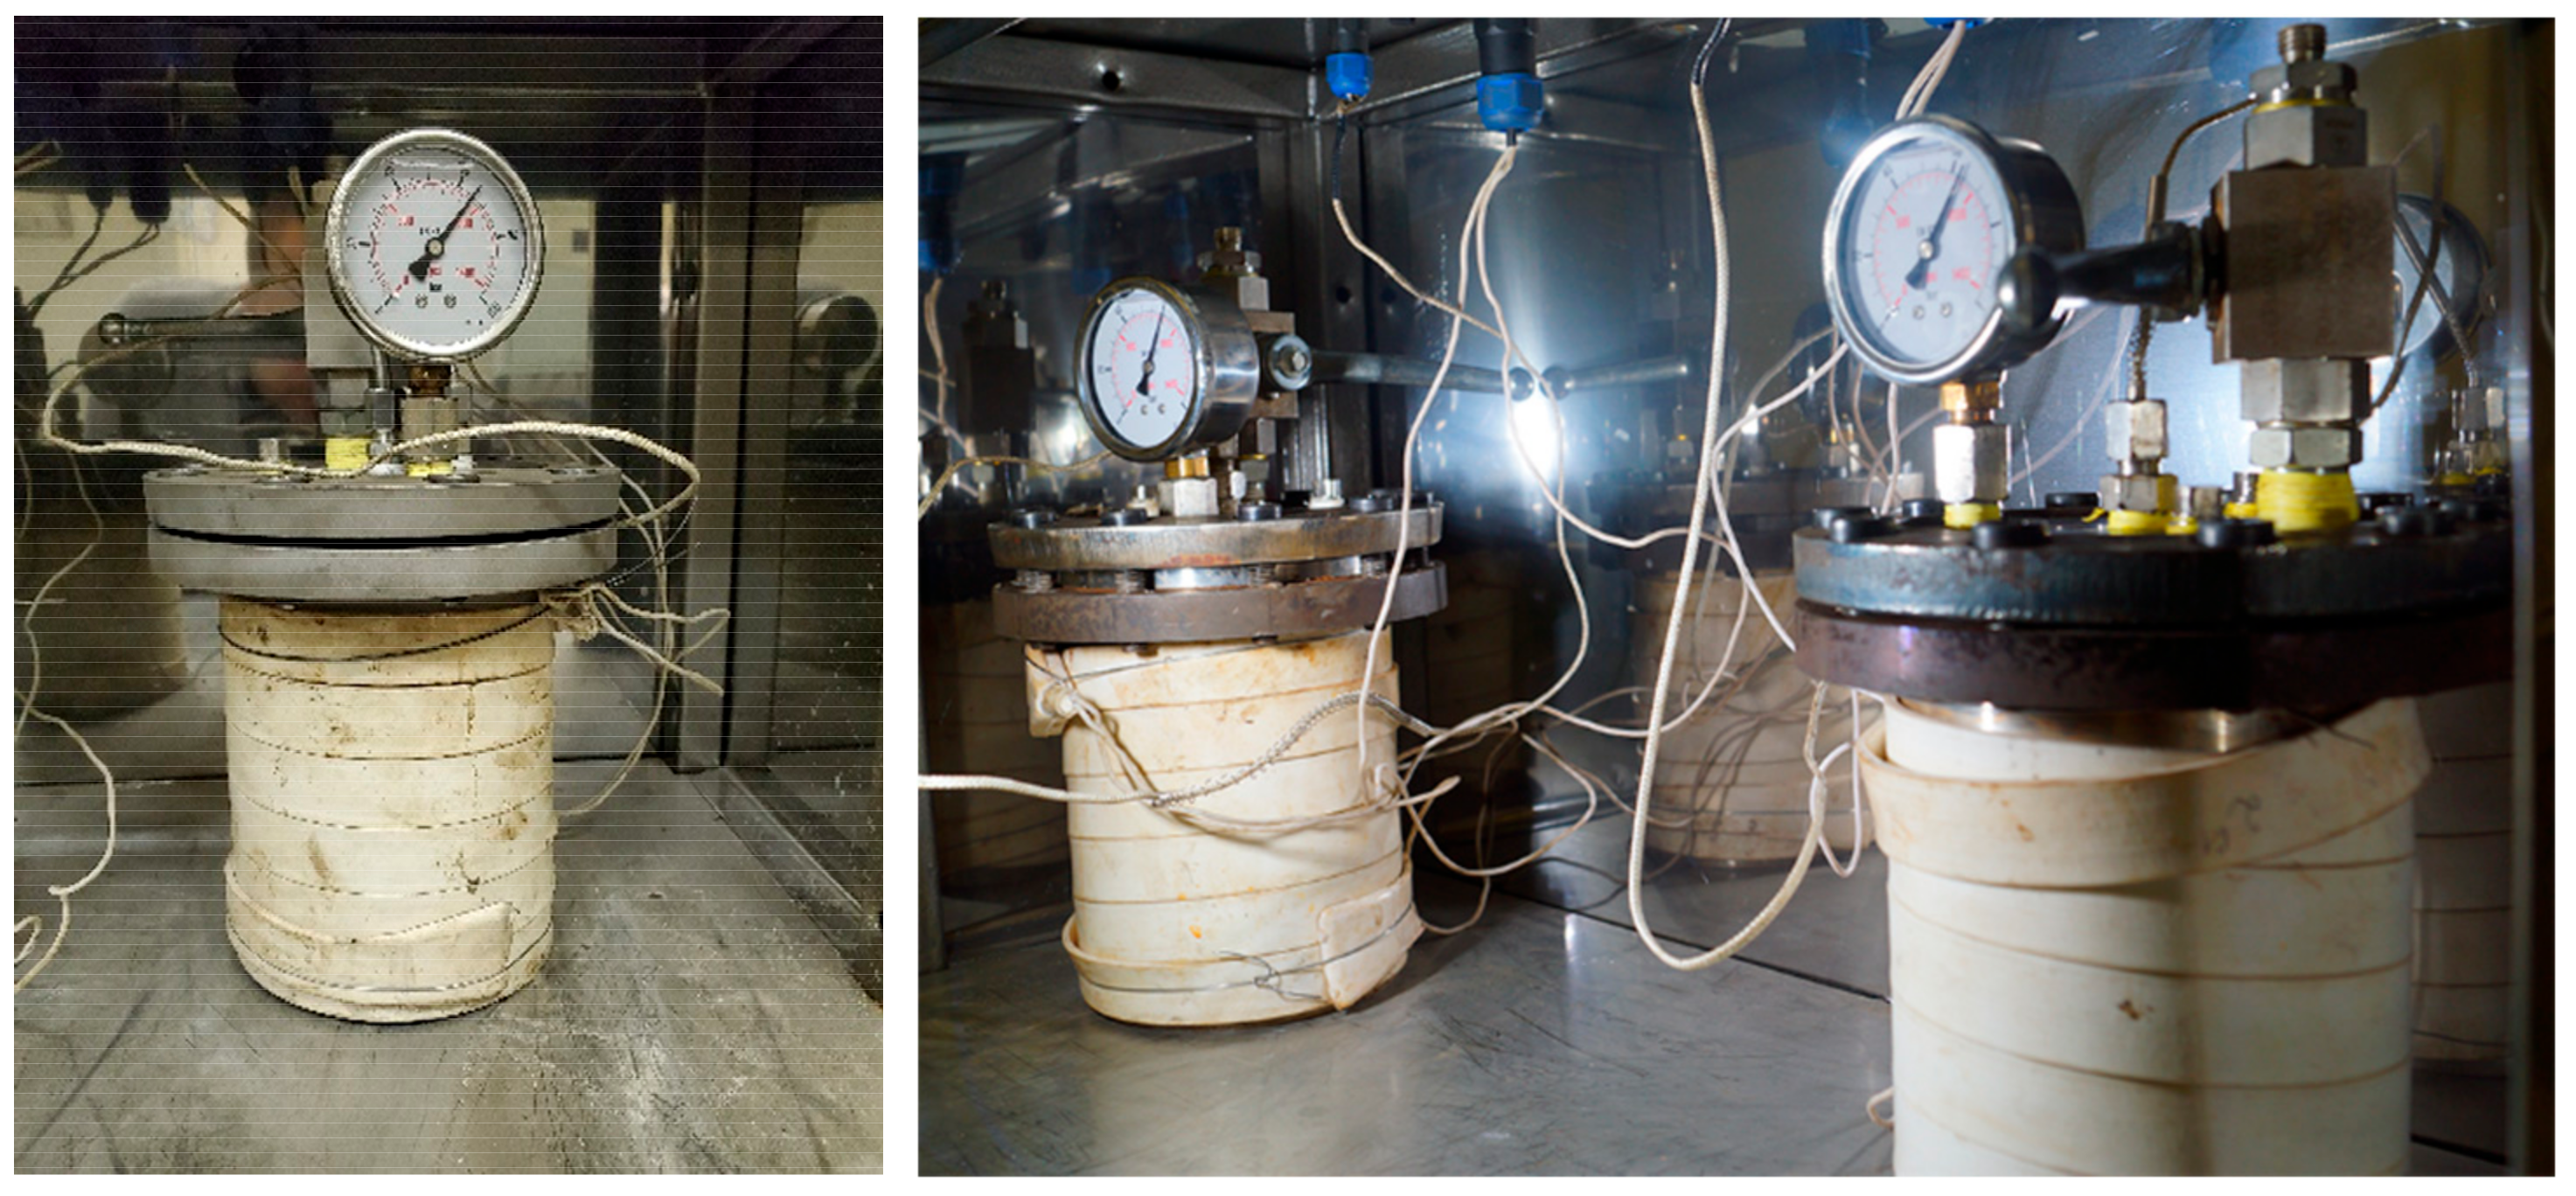
2. Materials and Methods

The autoclave test with rapid pressure relief is an express method for evaluating the properties of coatings. A complex gas–liquid system is created during the tests, the behavior of which can vary depending on the methodological parameters of the tests. It is necessary to clarify that the test method was considered in the work, and not the test of any coating. An important factor is that all the coatings studied belong to a two-layer polymer powder coating with an average thickness of 500 microns and all these coatings must undergo decompression tests before commissioning.
The choice of samples is usually determined by the type of test. When developing a new coating system, tests are carried out on flat samples with a size of 100 by 50 mm. In addition, studies can be carried out on segments cut from the samples of pipes during initial or acceptance tests. When assessing the quality of the application, it is possible to combine tests of flat plates and segments cut from pipes. This makes it possible to assess compliance with the application technology in the conditions of mass production since the application of a coating in laboratory conditions on flat samples is a simpler operation. It is also necessary to rely on the parameters of the autoclave installation and on methods for assessing the degradation of coatings after testing when choosing the types and sizes of samples. Over 300 samples of various types were tested in the work. Figure 1 shows a general view of the samples studied.
Most of the research was carried out on samples with a two-layer powder polymer coating. The average coating thickness was 500 µm. Samples were prepared with a water-cooled band saw. The tests were carried out on flat specimens and pipe segments. All samples were obtained from manufacturers of pipe products. All the studied brands of coatings are already used and, in some cases, are competitors, so the commercial names of the protective systems are not given.
By its design, the autoclave is a container with a lid with holes for supply, a gas outlet, and an internal thermocouple. Two autoclaves of 1.5 and 3 L were used in the work. In addition to the volume, the autoclaves differed in the material of manufacture. The 1.5-L autoclave is made of stainless steel and was used for testing with carbon dioxide. The autoclave with a volume of 3 L is made of titanium alloy and was used for testing with hydrogen sulfide. The autoclaves had a cylindrical shape. The drawback of the cylindrical bottom is the additional difficulty in placing the samples. During testing, coated samples should be placed vertically to assess the effect of liquid and gaseous phases. It is also necessary to provide free access to the solution to the test surface. Therefore, this limits the number of samples per autoclave. Figure 2 shows the appearance of the autoclave installations.
The autoclaves were heated using heating tape. The tape was on the outer wall of the autoclave. This heating method ensures uniform heating of the test vessel, and the temperature is controlled by an external and internal thermocouple. The readings of the sensors are sent to the control-measuring unit, which automatically adjusts the operating time of the heating tape. Temperature is one of the key factors affecting the durability of polymer coatings, therefore it is important to maintain minimum inertia of values during autoclave testing. A distinctive feature of decompression resistance tests is a fast release of pressure at the end of the test. The pressure must be relieved less than in 5 s. A valve with an increased outlet diameter was used to achieve this parameter. At the end of the tests, the valve was opened manually, and the pressure from the autoclave was released into the ventilation. Adapters of different diameters were used to change the time of decompression. The pressure release time was monitored visually according to the pressure gauge readings, and the release time was also controlled during video recording.
The main test method was based on the standard regulating the test methods for oilfield pipes [9]. Table 1 shows the conditions of the autoclave tests carried out.
Table 1 shows the main parameters of the tests carried out in the work. The type of samples for each test is not specified, since studies were also carried out on flat samples and pipe segments. A 5% sodium chloride solution has always been used as the liquid phase. Preliminary tests with alkaline solutions showed no effect on the tests. The pH level of the solution was between 6 and 7. Distilled water was used to prepare the solution. Carbon dioxide and hydrogen sulfide were used as the gas phase. The autoclave was saturated directly from the cylinders. The tests were carried out at an operating pressure of 5 and 10 MPa, which was also achieved by pumping gases from the cylinders. The initial test temperature was selected based on the operational recommendations of the coating manufacturer. The duration of the tests was 24 h.
Another important task of the study was to evaluate the test results. If in the case of testing of metal products, it is always possible to estimate the rate of corrosion by weight loss, then the assessment of the coating degradation can be difficult in the absence of obvious damage as blisters. The pull-off test was used to numerically determine the adhesion value, as well as to compare the structure and microhardness of the coating before and after testing.
The adhesion strength was determined by ISO standard [10]. The tensile dollies had a diameter of 25 mm and were fixed on a coated sample using a two-component epoxy adhesive. It should be noted that this method of determining adhesion largely depends on the actions of the operator, on the condition of the coating surface, and on the type of coating. The following sequence of actions was chosen experimentally: manual grinding of the sample with a coating of abrasive paper with a grain size of P 120; cleaning and grinding the surface of the dollies, decreasing the surfaces, mixing the glue, and applying it to the surface of the sample, fixing the dollies on the sample at the place of glue application; and exposure for 24 h, removing the coating along the contour of the dollies with a drill, testing. The value was estimated using a pull-off adhesion test using a tensile testing machine (UM-10T, Saint-Petersburg, Russia). The load increase rate did not exceed 1 MPa per second, the total test duration did not exceed 90 s.
A microscope Reichert Jung MeF3A (NY, USA) with a prefix for measuring the microhardness was used to determine the change in the coating’s structure and its hardness. The microhardness was measured at a load of 100 grams and held for 10 s. Cross-sectional sections of coated samples were prepared for the studies. The slots were made from samples of witnesses and samples after testing. The surface under study was prepared on a flat-grinding wheel using abrasive papers and polishing fabrics. The final stage of preparation was a polishing cloth of 1 µm. The assessment of the change in the surface’s state was carried out at values ×25–×500.
The research plan can be summarized as a flowchart in Figure 3.
The research is based on an autoclave decompression test described in the standard [9]. Three samples with a coating size of 100 by 50 mm were prepared for testing. Both flat samples and pipe segments were tested. The samples were placed vertically on the bottom of the autoclave. A prepared solution of 5% NaCl was poured into an autoclave. The autoclave was filled with a solution of 80% of the total volume. After filling, the autoclave was closed with a lid and sealed. The tests began with nitrogen purging for half an hour with the outlet valve open. After that, carbon dioxide was supplied with the outlet valve closed until a pressure of 1 MPa was reached; the pressure was maintained for 10 min and reset. This operation was repeated 3 times. Then, carbon dioxide was supplied with the outlet valve closed until it reached 5 MPa. The autoclave was kept at this pressure for 30 min, and when the pressure dropped, carbon dioxide was additionally supplied. After half an hour of exposure, the autoclave heating was turned on. When the operating temperature was reached, the test time counted. The duration of the tests during the standard autoclave test was 24 h. At the end of the tests, the autoclave heating was turned off and the pressure was relieved by opening the outlet valve. After pressure relief, the autoclave was disassembled and samples were extracted. The technique described above corresponds to the first stage in the block diagram. According to this method, the convergence of the results was evaluated by testing the same coating under the same conditions in different autoclaves. The effect of the number of samples placed in one autoclave was evaluated using tests of one coating, but with a different number of samples per test. To assess the effect of the pressure relief rate, outlet valves with different hole diameters were used. The tests were carried out at a drop rate of 4.8 s and 1.5 s. The effect of the gas phase composition on the results was evaluated using decompression tests in the presence of hydrogen sulfide. To assess the degradation of coatings during cyclic decompression, tests were carried out for 48 h with two pressure drops, where one cycle was 24 h.
A pull-off test was used as a standard method for assessing degradation; optical microscopy and microhardness assessment using the Vickers method were used as additional methods.

3. Results

The autoclave test of coatings for resistance to decompression allows to quickly assess the quality of the application and the resistance of the coating under selected conditions, but interpreting the test results may vary, so the scenarios of autoclave tests and options for interpreting these tests are also considered.

3.1. Decompression Test Results with CO2 Gas Phase

The results obtained during autoclave decompression tests can be both obvious for interpretation and controversial. Figure 4 shows examples of tested coatings with obvious negative results.
The samples shown in Figure 4 were tested at a temperature of +90 °C, carbon dioxide was used as a gas, the working pressure was 5 MPa, and the pressure was relieved in 4.8 s. The test was carried out as part of the development of a new paint system on flat samples. The obvious negative test results mean the formation of blisters of different diameters on all samples.
Sometimes, it may be difficult to interpret only the appearance of the coating after testing. Samples after testing had a change in the coating’s roughness, but no blisters, delamination, or other defects were formed.
The repeatability of the test results is an important factor. The results obtained on a single coating system after a series of autoclave tests are considered below. Figure 5 shows the samples after the autoclave decompression test. The samples were taken from the pipe, and the coating was applied at the factory. The studies were conducted at temperatures of +60 °C and +100 °C. The working pressure was 5 MPa, carbon dioxide was used as the gas phase. During the tests, 3 samples were placed in one autoclave. The duration of exposure was 24 h.
The examples of samples given in Figure 5 show that samples of the same coating tested at the same temperature differed in their appearance: there are blisters on some tested coatings, while other samples have no features of degradation. Differences in the appearance of surface samples after testing may indicate either the heterogeneity of the quality of the coatings or the unequal effect on the samples during the test, as well as the methodological features during each autoclave test. However, in this case, the most likely reason is the recommended operating temperature, which is +60 °C. The issue of repeatability of the results becomes more relevant.
An important advantage of the autoclave decompression test is the ability to quickly detect poor-quality coating. Figure 6 shows samples with an identical protective system but applied at different production facilities. The tests were carried out at a temperature of +90 °C, the samples were in one autoclave, the gas phase was CO2. The duration of the tests was 24 h, the pressure relief time was 4.8 s.
With the samples in Figure 6, the test temperature was lower than recommended by the manufacturer of this coating. The operating temperature is +120 °C and the tests were carried out at +90 °C; this did not affect the results. After autoclave tests, the coatings samples from supplier 2 either completely peeled off the coating from the substrate or large-diameter bulges formed. The samples of manufacturer 1 did not show any degradation effect. It is known that the quality of surface preparation before application and compliance with technological processes is crucial for polymer anti-corrosion coatings. Therefore, in this case, the most likely reason is noncompliance with these procedures. This case demonstrates one of the distinct advantages of the autoclave decompression test, as the quality of the coating can be determined within 24 h.
The effect of exposure time was also tested during coating studies. Figure 7 shows samples of coatings after autoclave decompression tests under the same conditions for one and three days.
Based on Figure 7, differences are seen in the surface’s state of the samples after 24 h of exposure and holding in an autoclave for 72 h. There were no blisters on the samples after 72 h of testing, although samples exposed in the media for 24 h had blisters on the surface. Thus, the exposure duration of the autoclave testing gives an ambiguous effect.
Since a decompression test comprises a sudden release of pressure at the end of the test, it is also necessary to understand the effect of the release time on test results. Typically, the pressure is released in less than 5 s. Therefore, in this set of testing, there were changes in the time of pressure relief within 5 s. Figure 8 shows samples after autoclave decompression tests with pressure release times 1.5 and 4.9 s. The test conditions were 5 MPa CO2, +90 °C, and 24 h exposure.
It can be seen from Figure 8 that during the discharge, blistering occurred in 1.5 s, and during the discharge close to 5 s, only a change in the coating roughness occurred. Therefore, various laboratories may get a low convergence in the results due to pressure relief time. Thus, in the standards, time of relief should be defined.

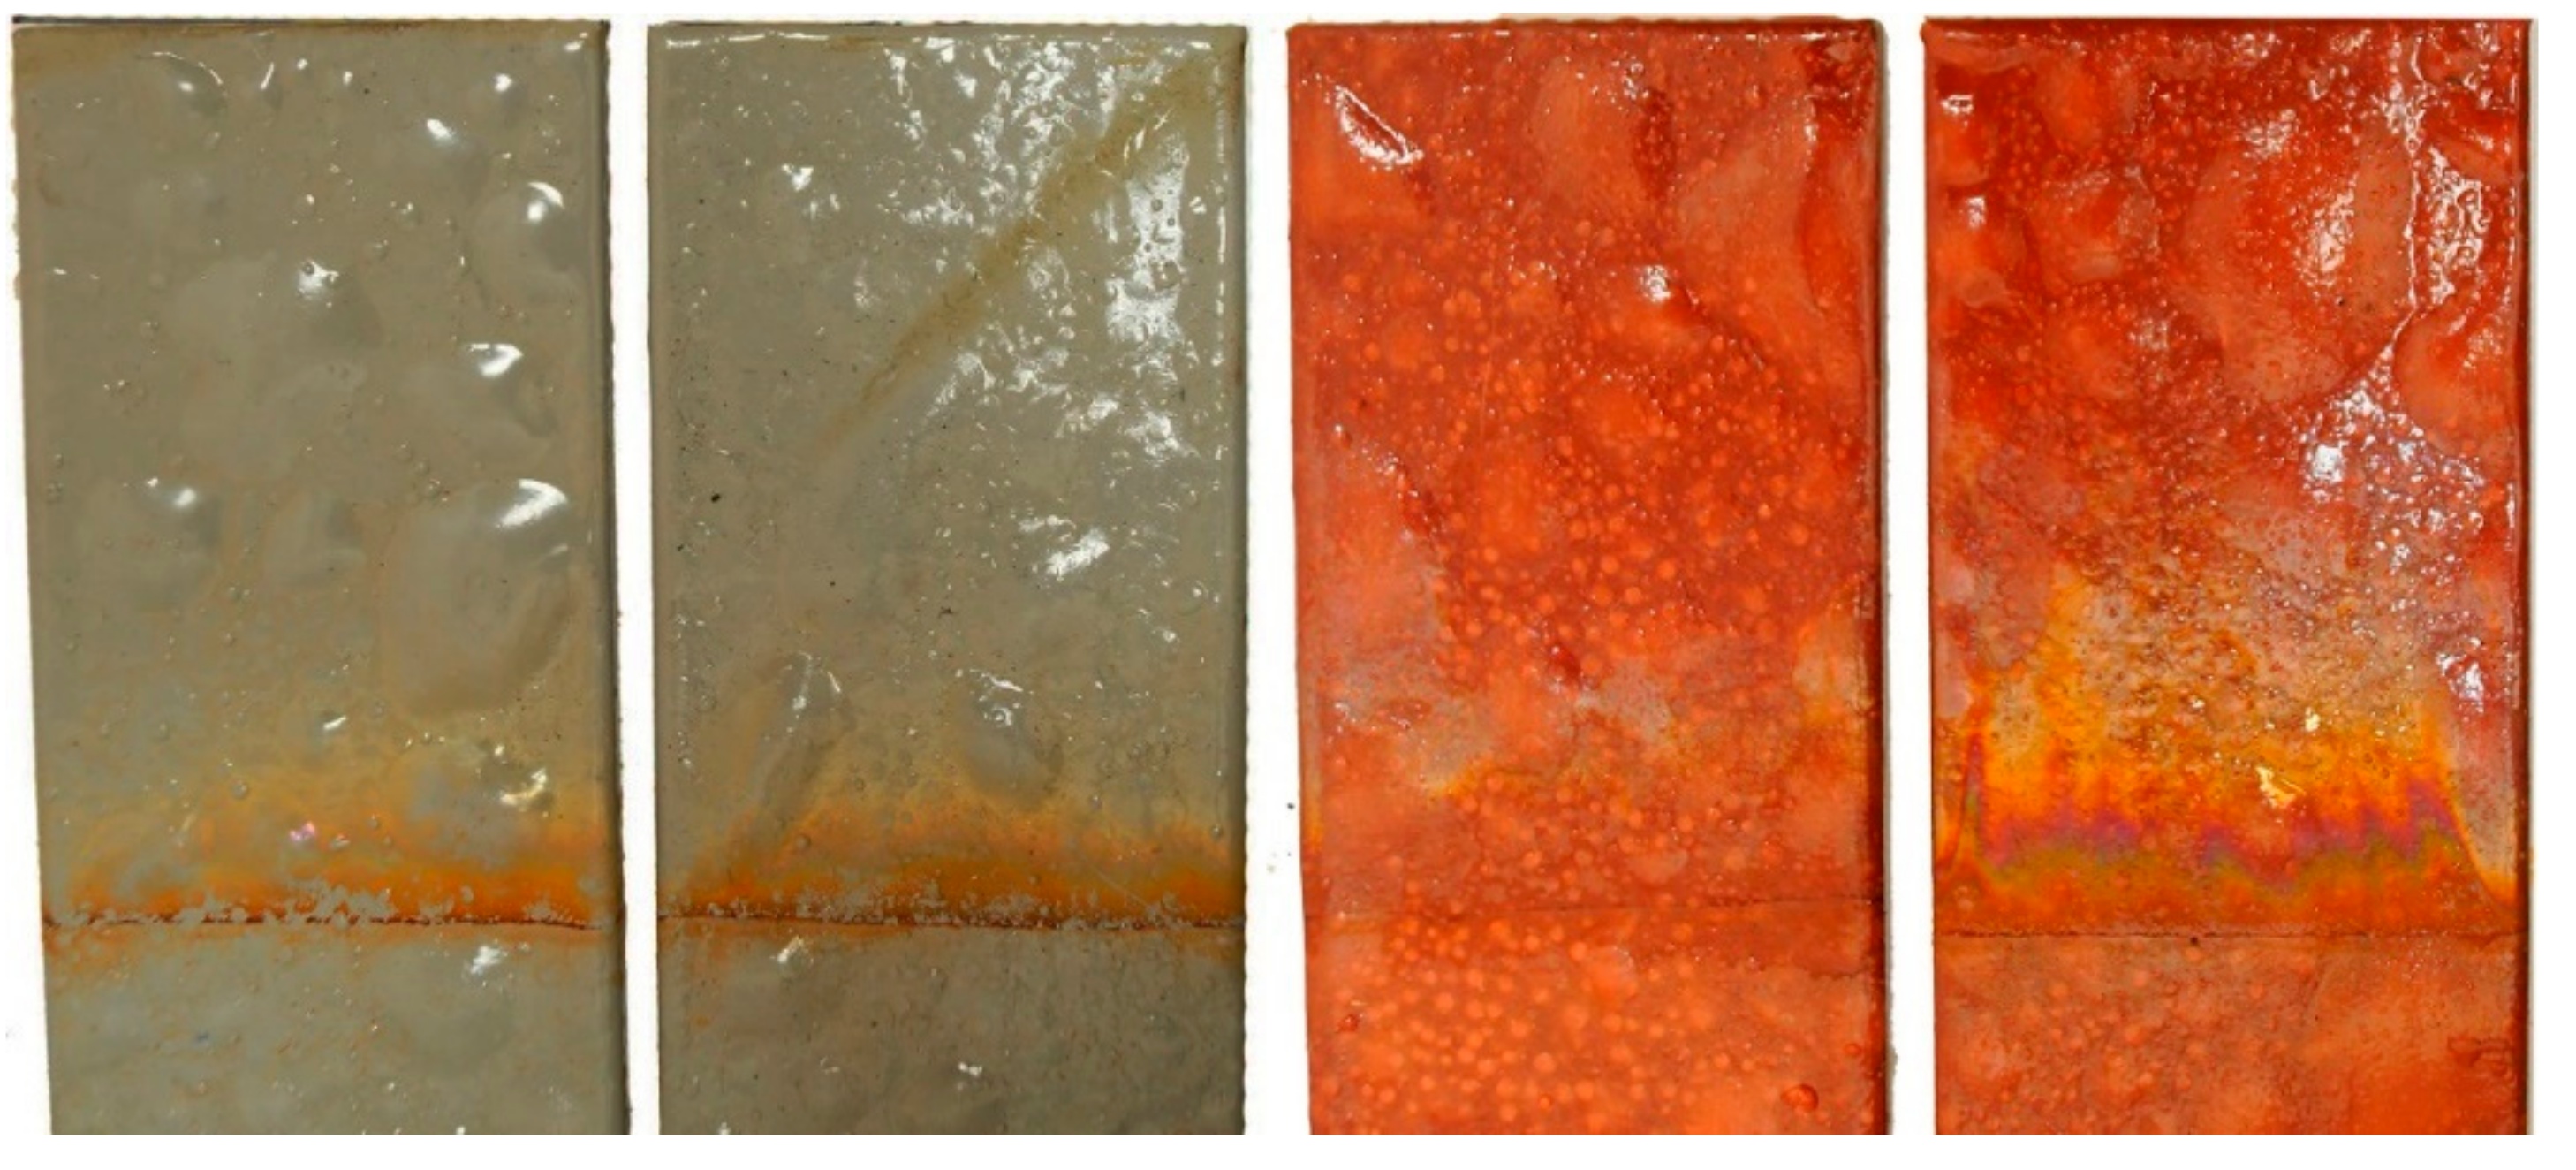
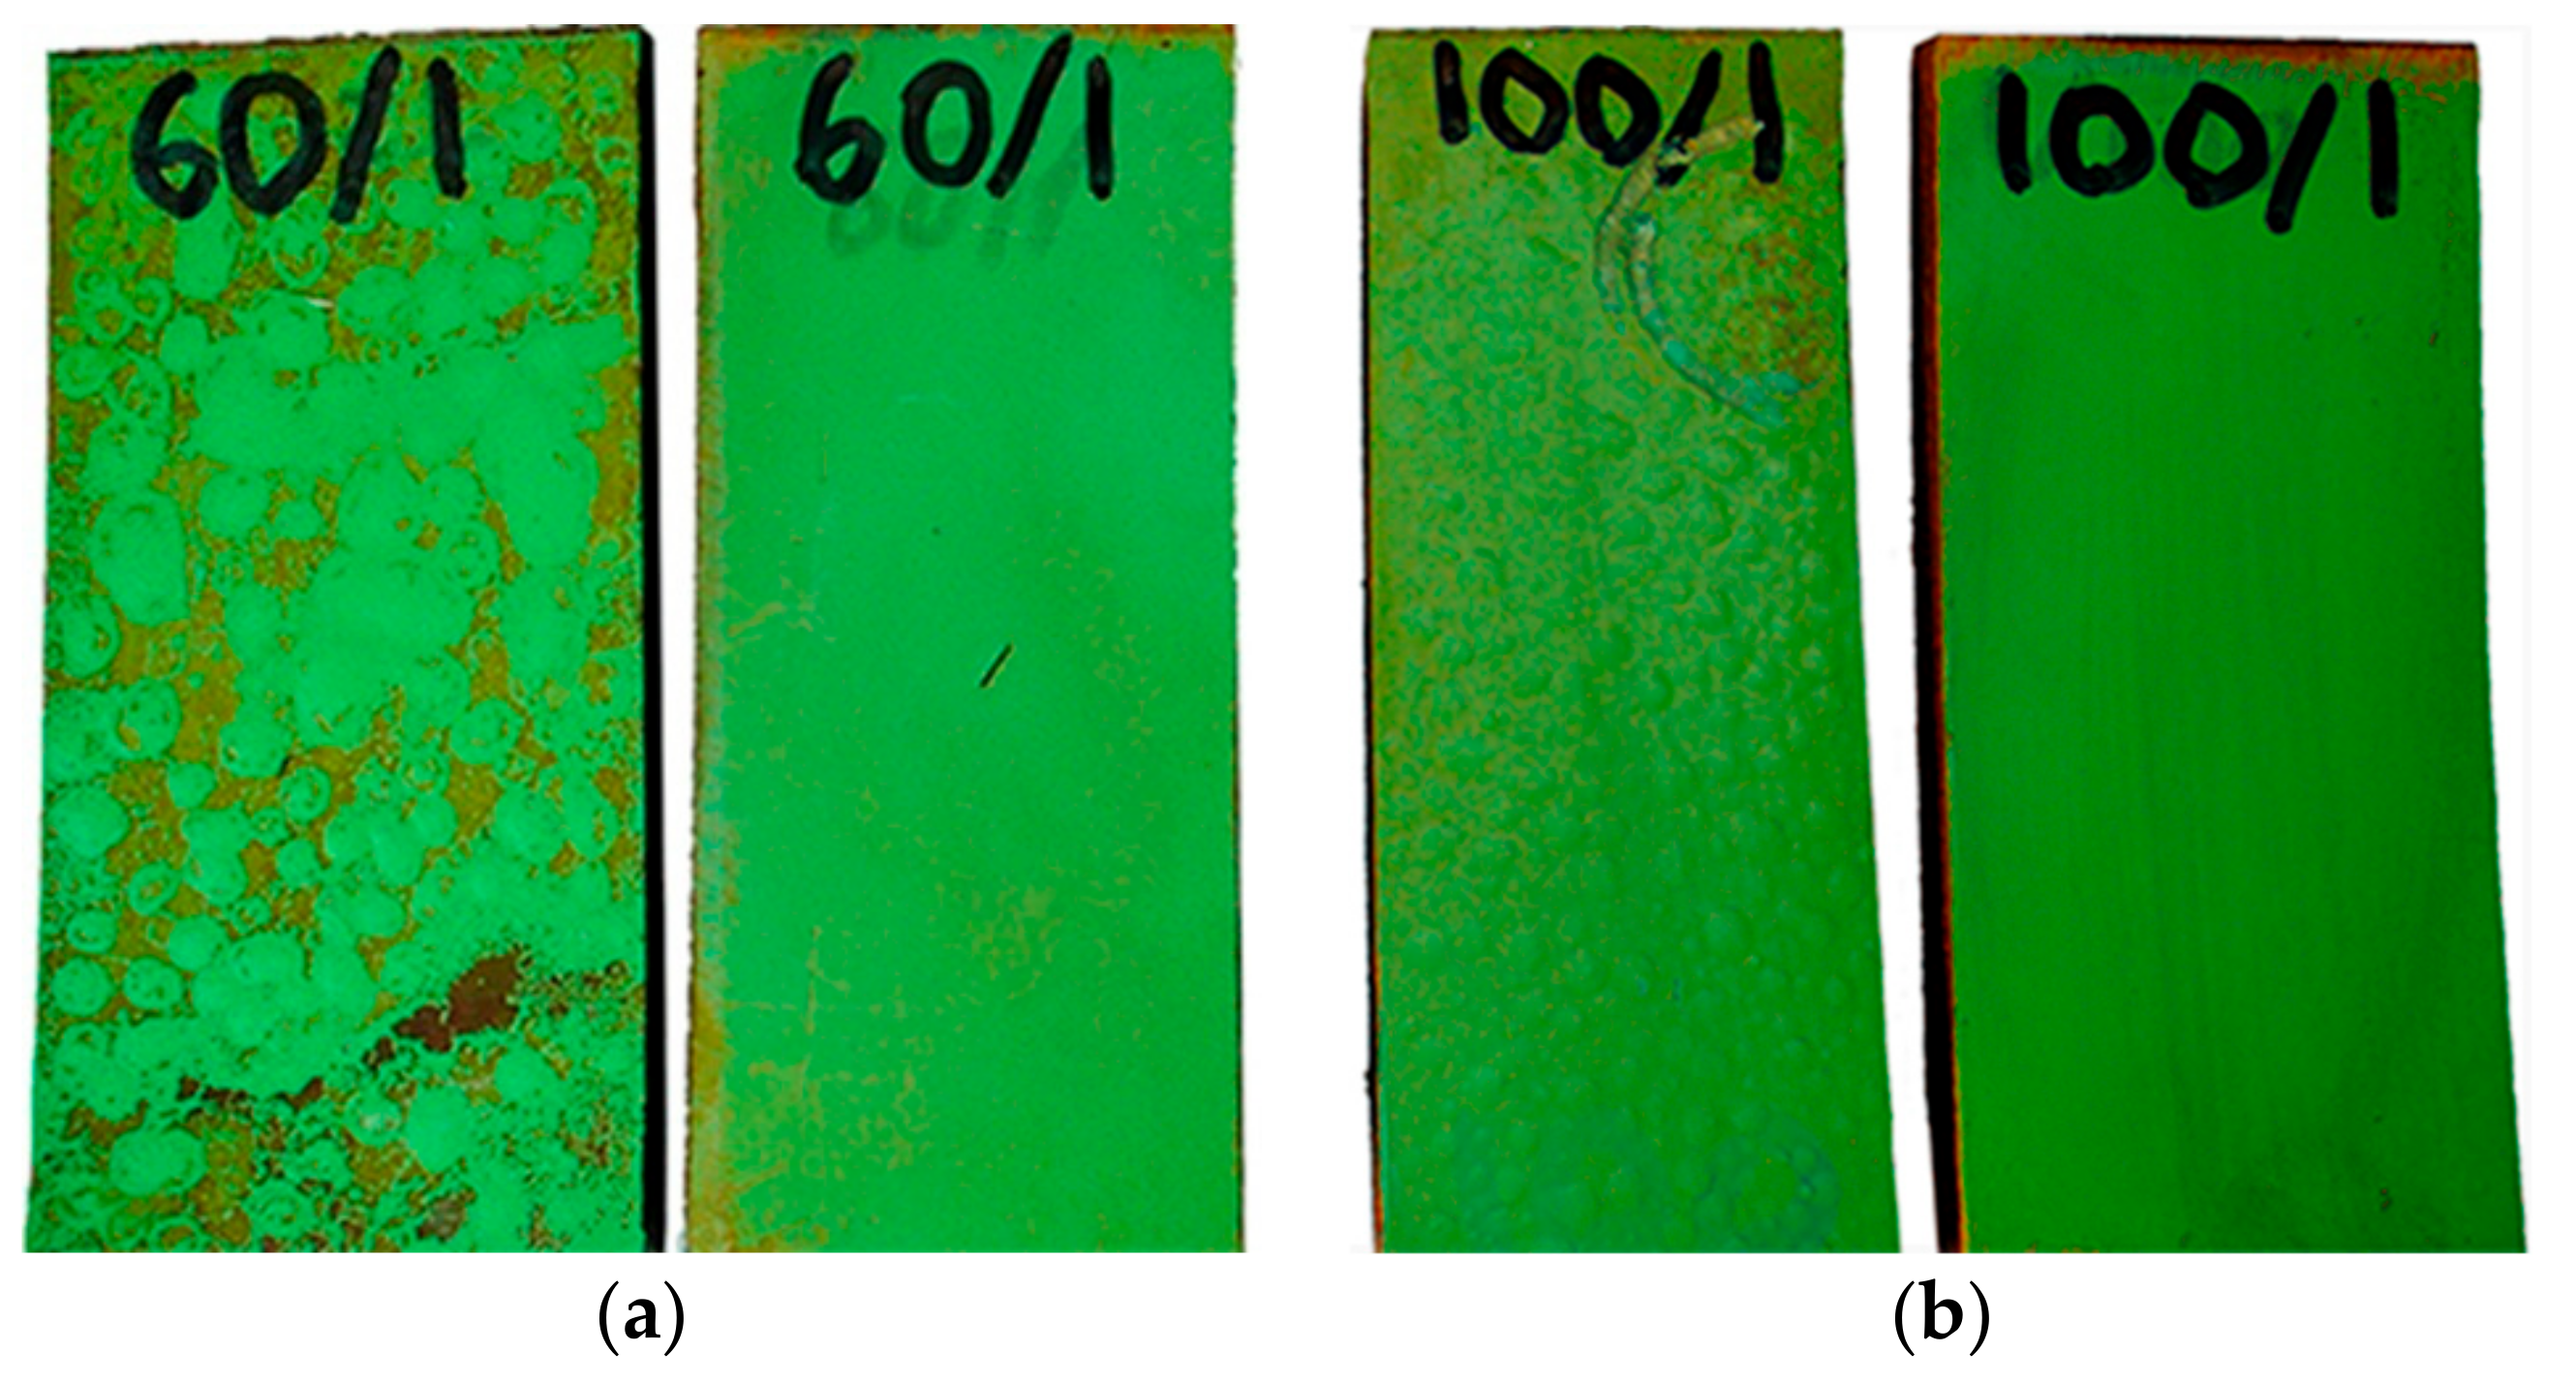
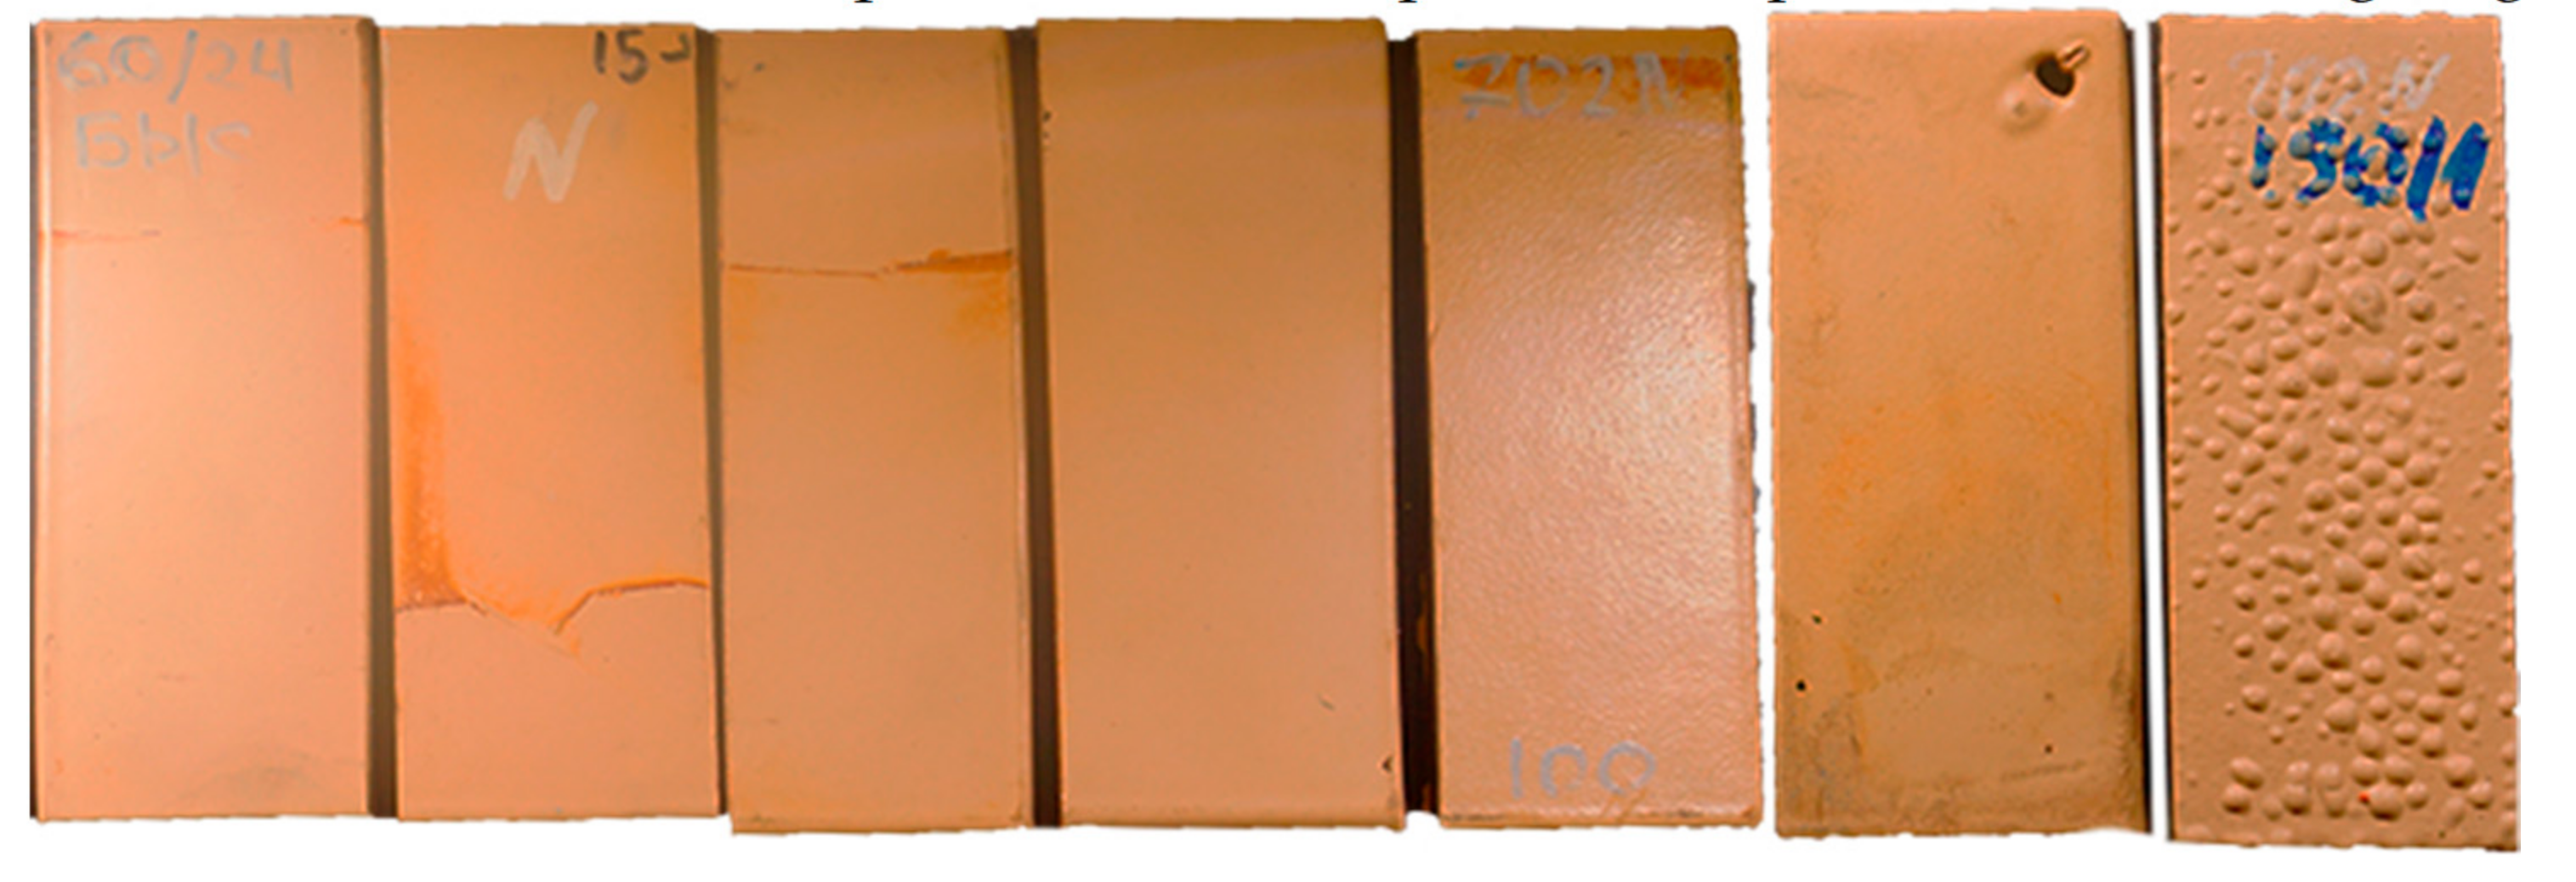
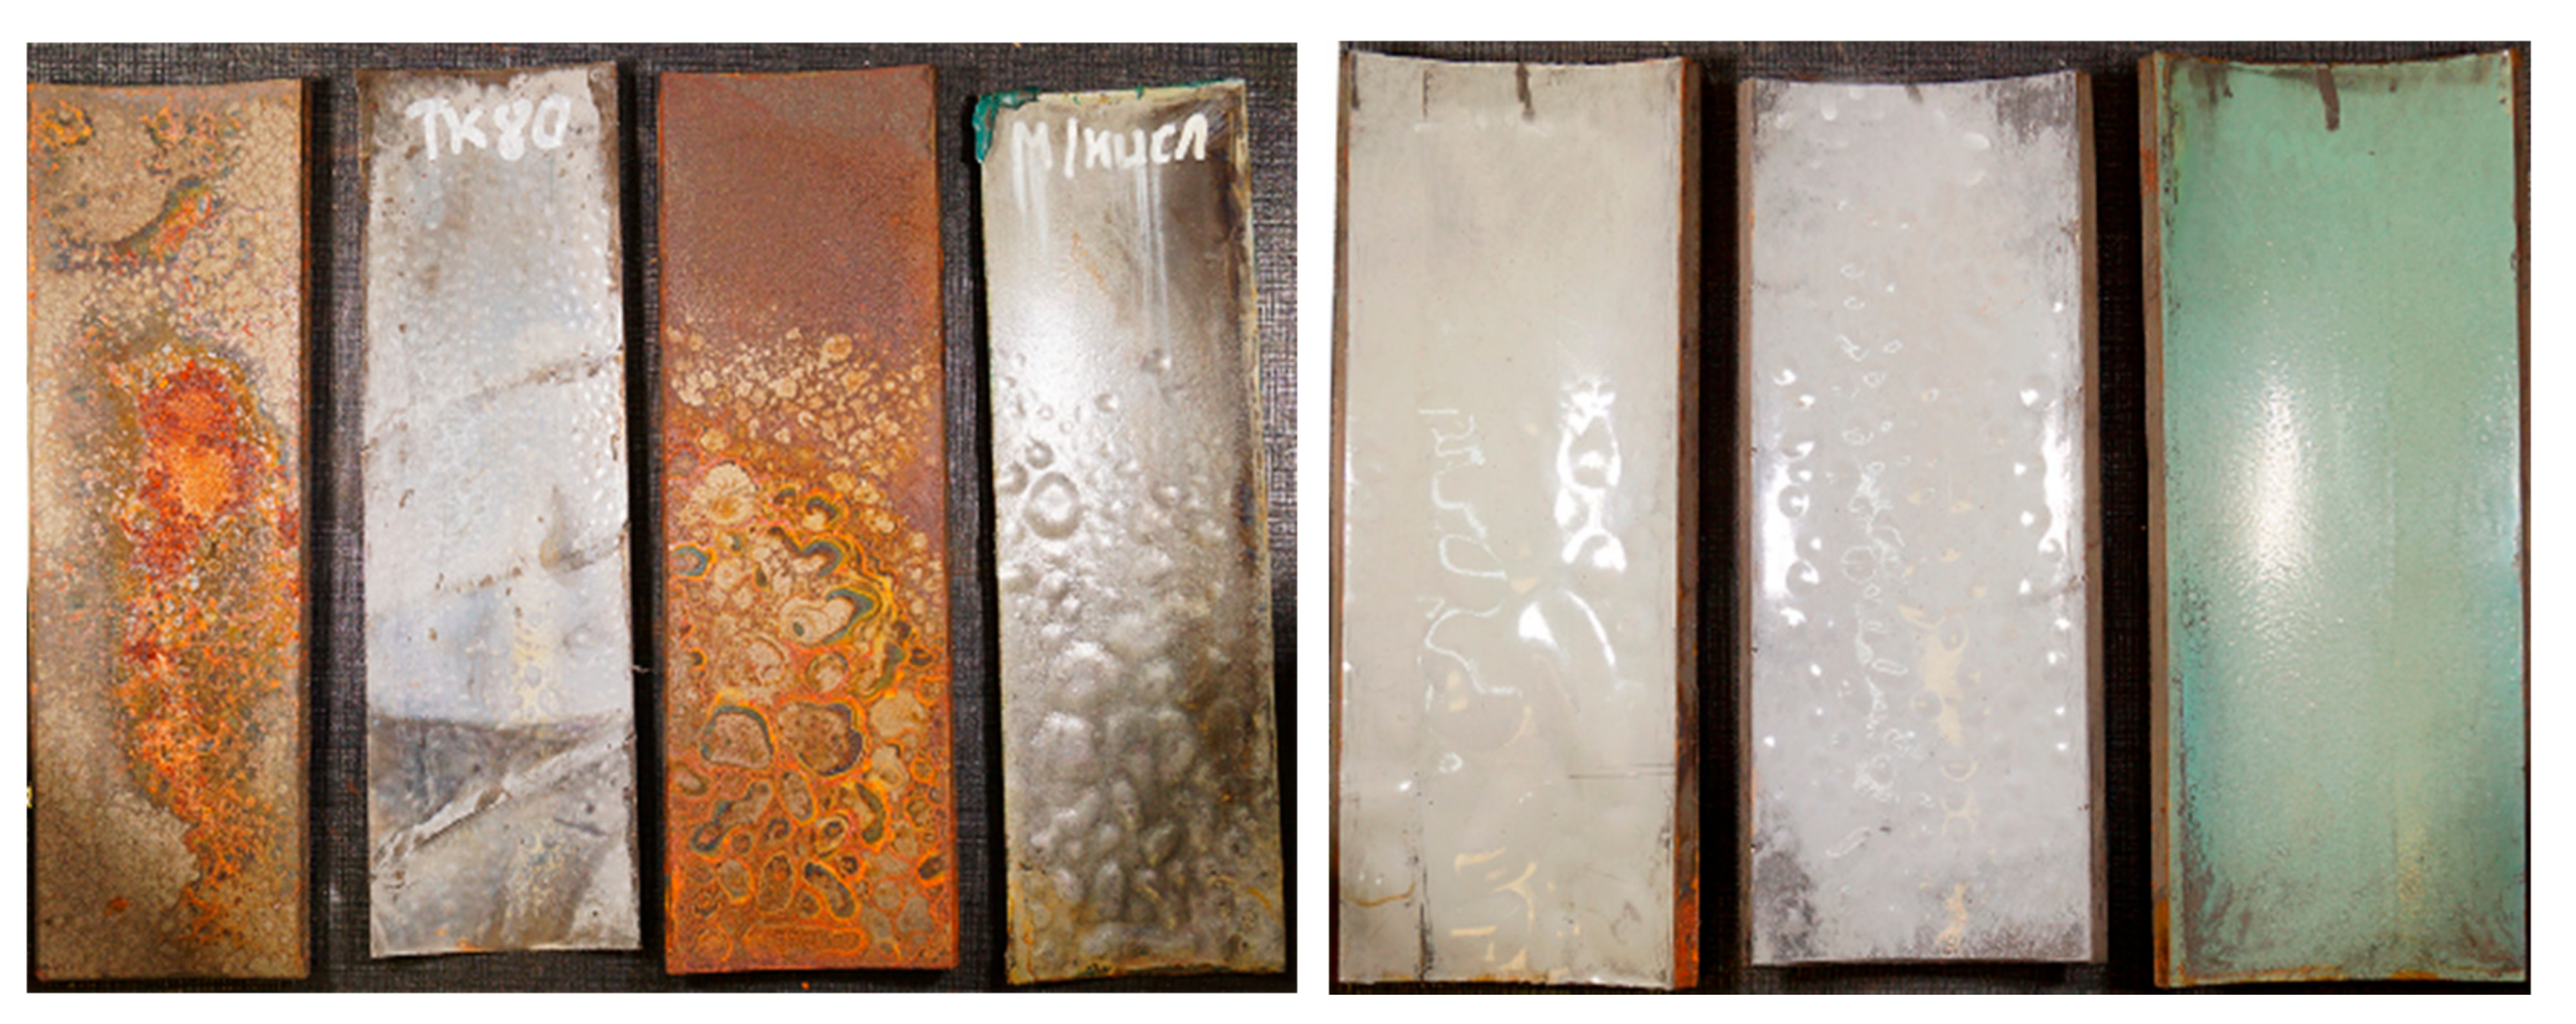
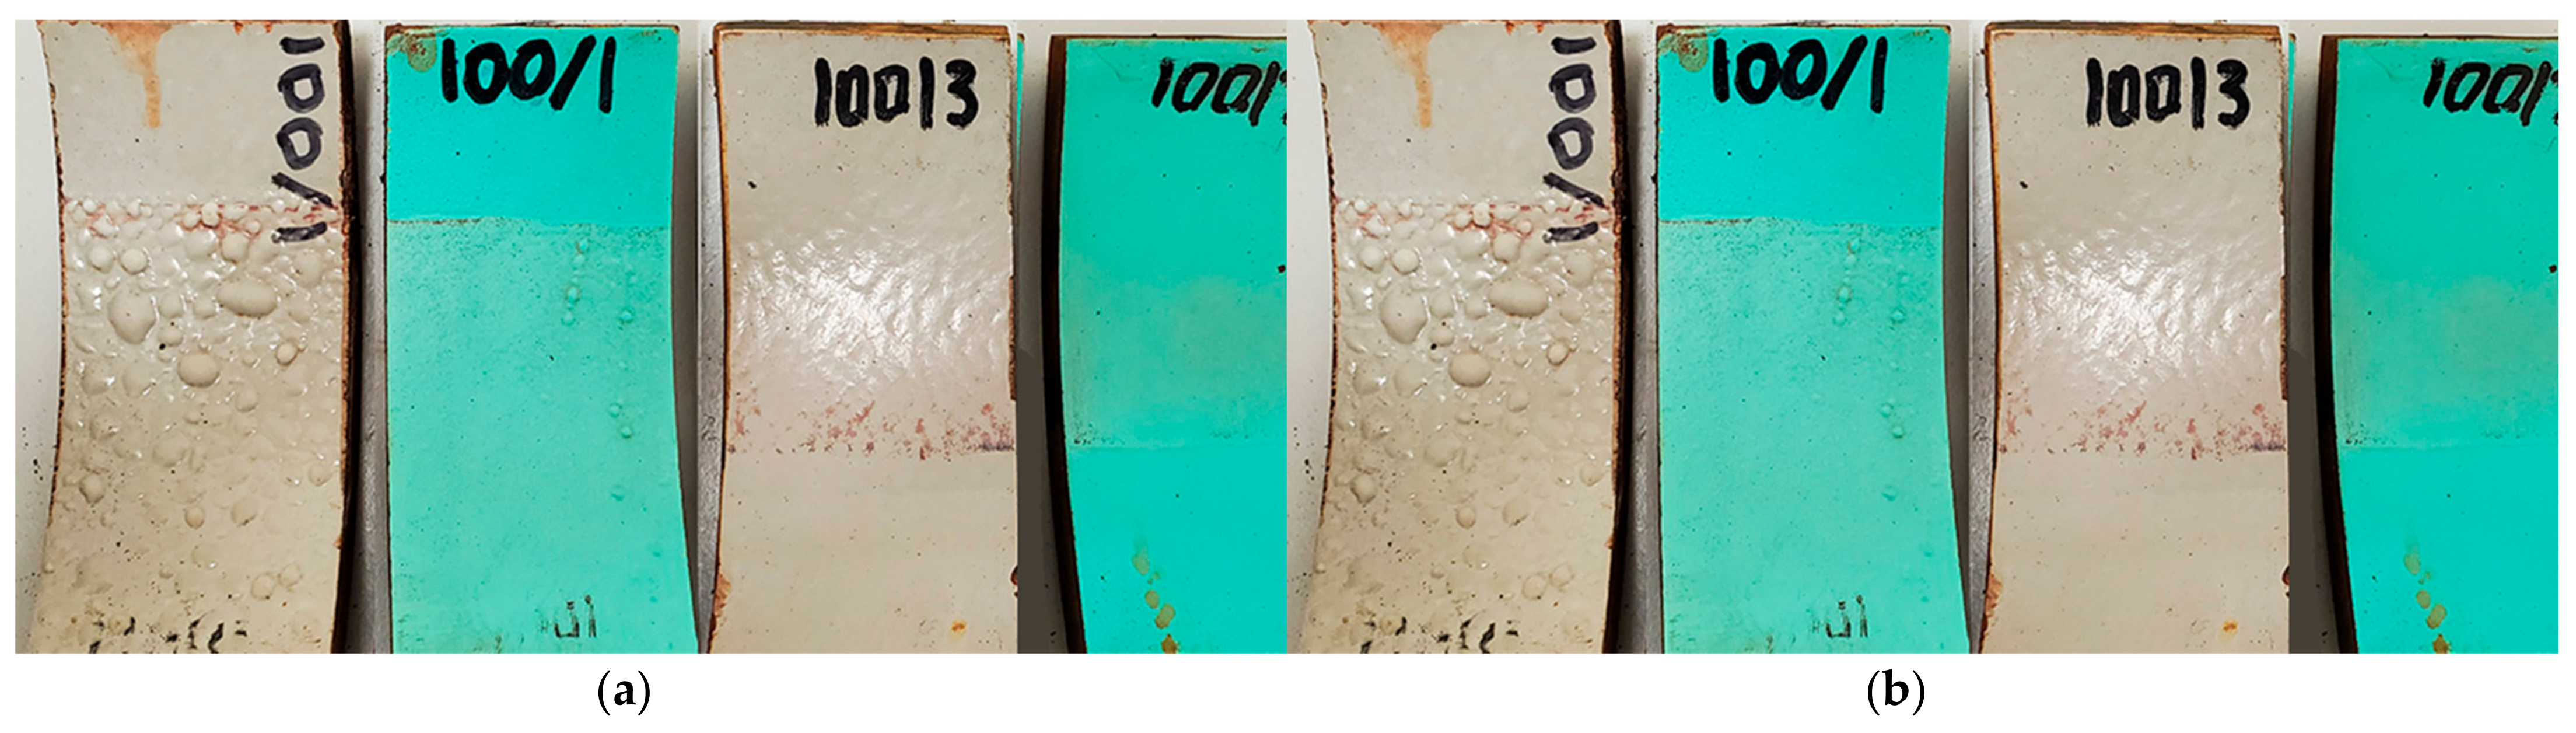
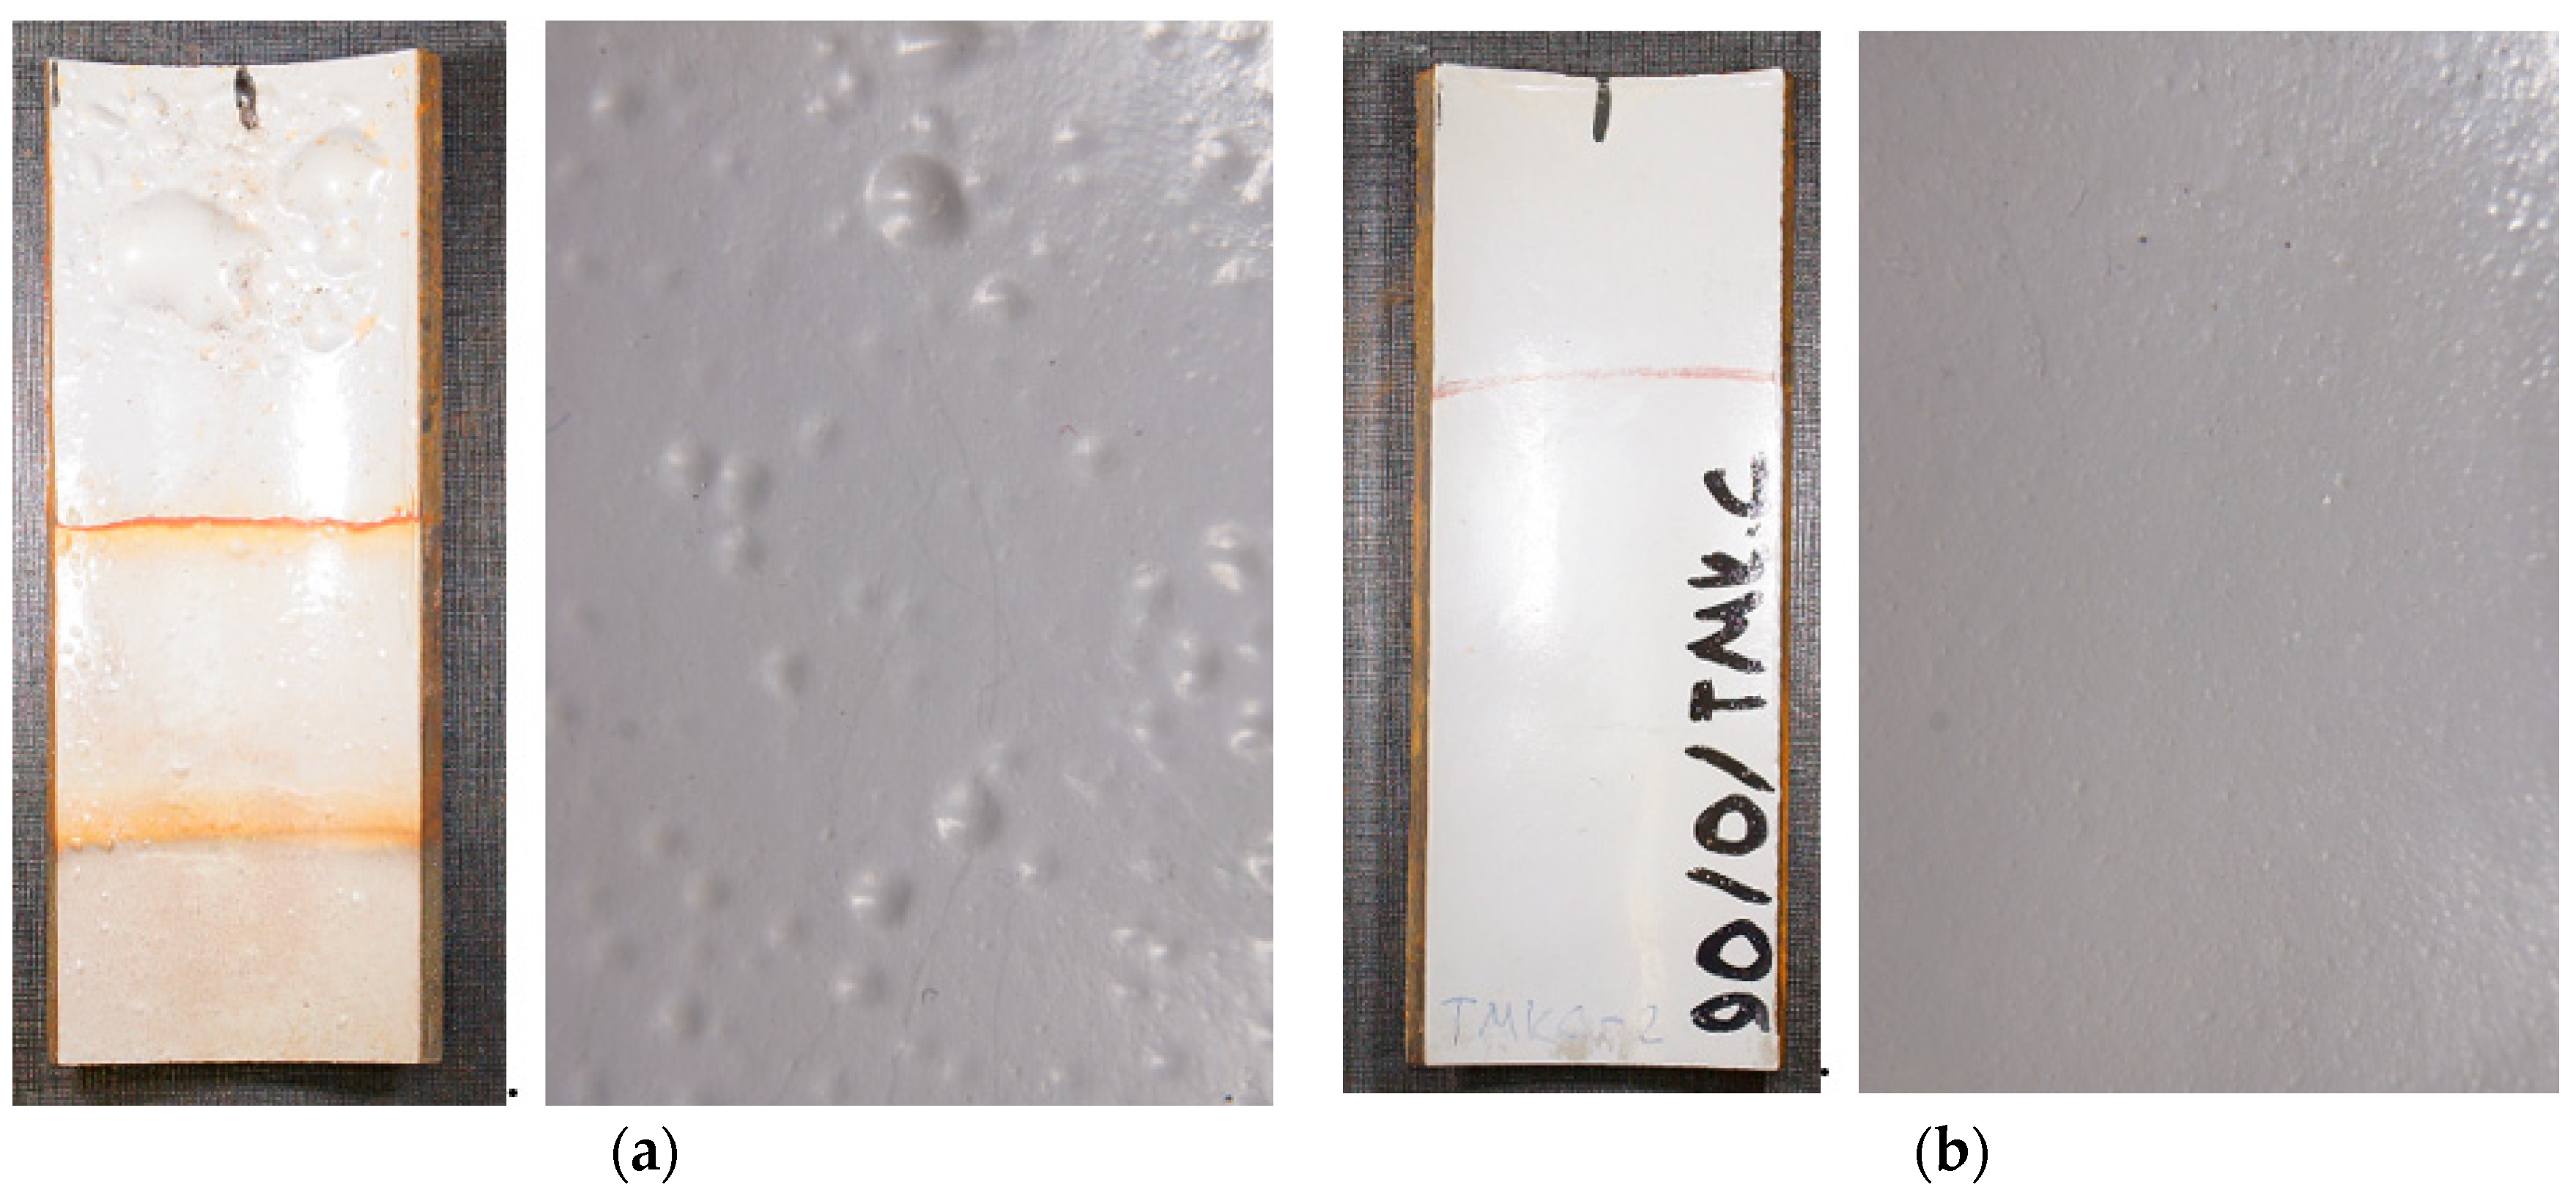
3.2. Results of the Visual Control after Autoclave Tests

In addition the effect of the reset rate, the effect of multiple decompression was also studied. In this case, samples resistant to decompression discharge were selected to evaluate the surface change visually and using an optical microscope. The tests were carried out at a temperature of +90 °C, the working pressure was 10 MPa, the duration of one exposure was 24 h, gas-phase was CO2. In total, two consecutive decompression tests were performed, with samples extracted after each test to assess the appearance. Figure 9 shows the witness sample and samples after the first series of autoclave tests. The tested coatings belong to the same system with minor changes in composition.
Figure 9 shows that after the first series of autoclave tests, only the color of the coating changed. Similar results were obtained after the second series of decompression tests. Changes in the coating’s structure were detected only when examined with an optical microscope. Figure 10 shows the structure of the coating at magnification ×25. When studying the structure, the longitudinal part of the coating was evaluated; the surface was not additionally prepared.
In Figure 10, it is possible to note an increase in the number and size of pores after the second pressure relief. Figure 11 shows the state of the structure after testing for a coating system that differs in its composition.
In the case shown in Figure 11, there were no changes in the structure, the number of pores did not increase. Based on these examples, it can be concluded that structural changes in the coating can occur without visible visual defects. This should be considered when evaluating the results since the formation of pores in the coating during operation can lead to premature failure of the product.
In addition to changes in the coating’s structure that are in direct contact with the medium, changes could also be recorded by the thickness of the coating. Figure 12 shows the longitudinal sections of coated samples before and after autoclave decompression tests. The studies were carried out at ×100.
Figure 12 shows that an increase in the number and size of pores can also occur along the thickness of the coating, which is probably a consequence of gas diffusion during the tests.

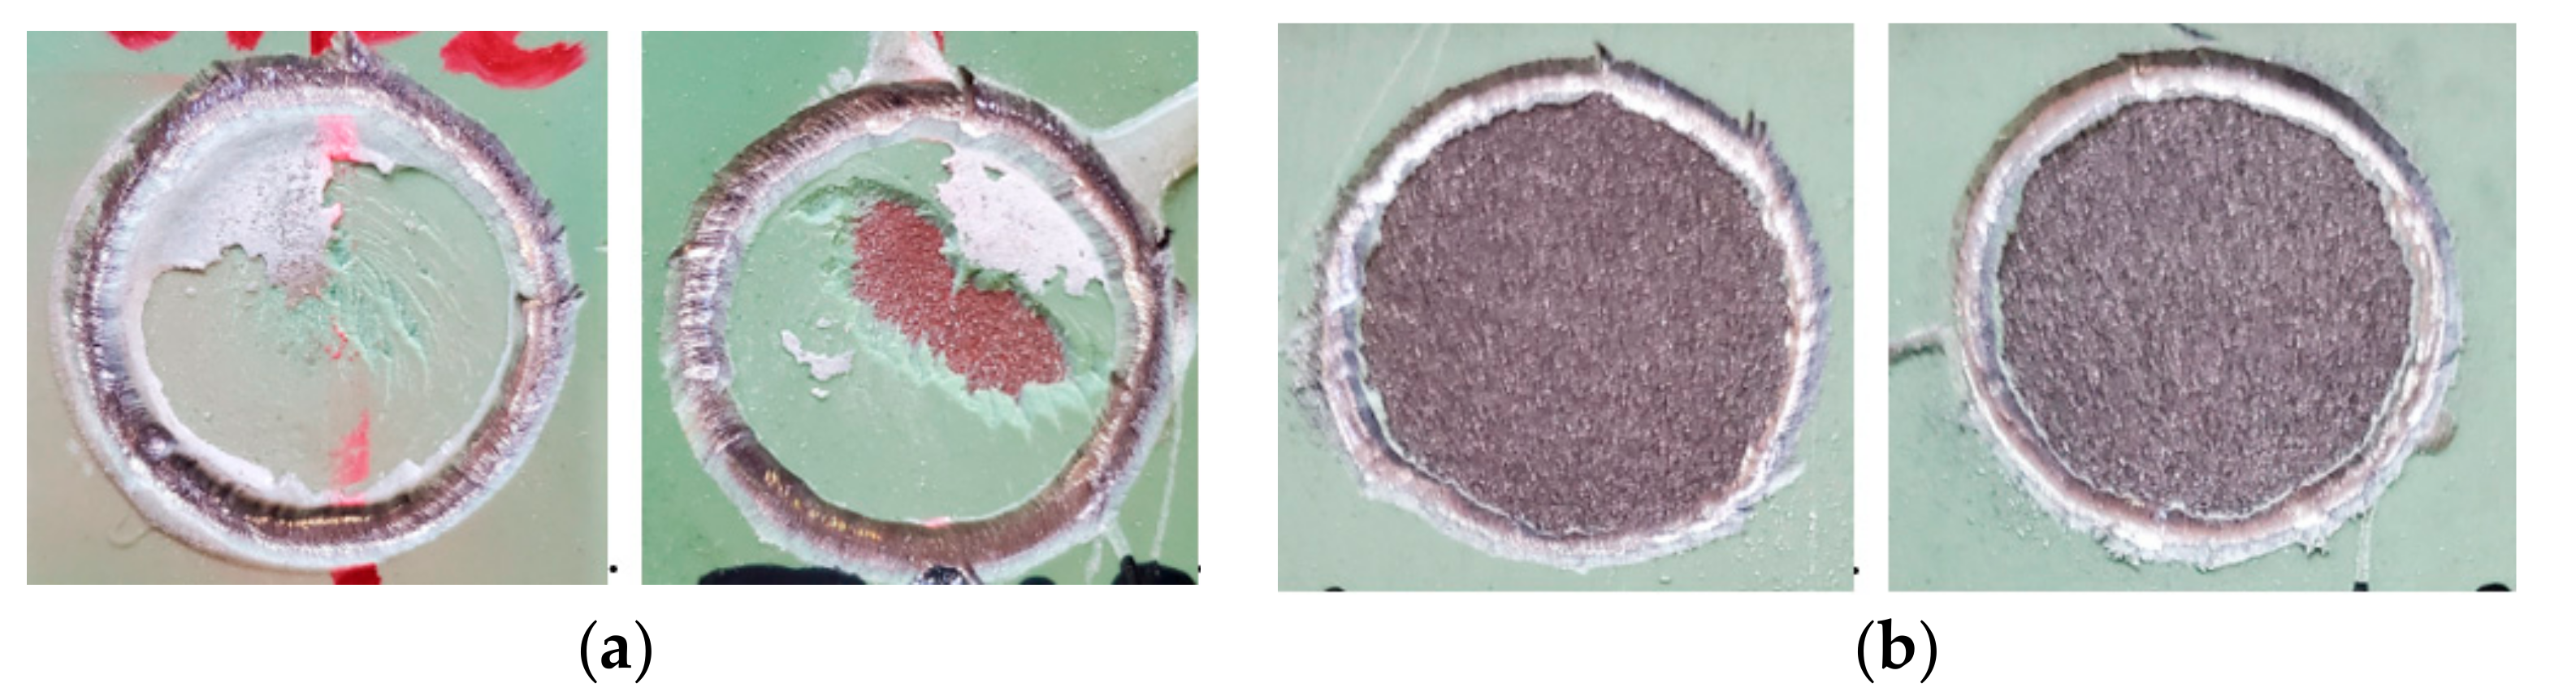
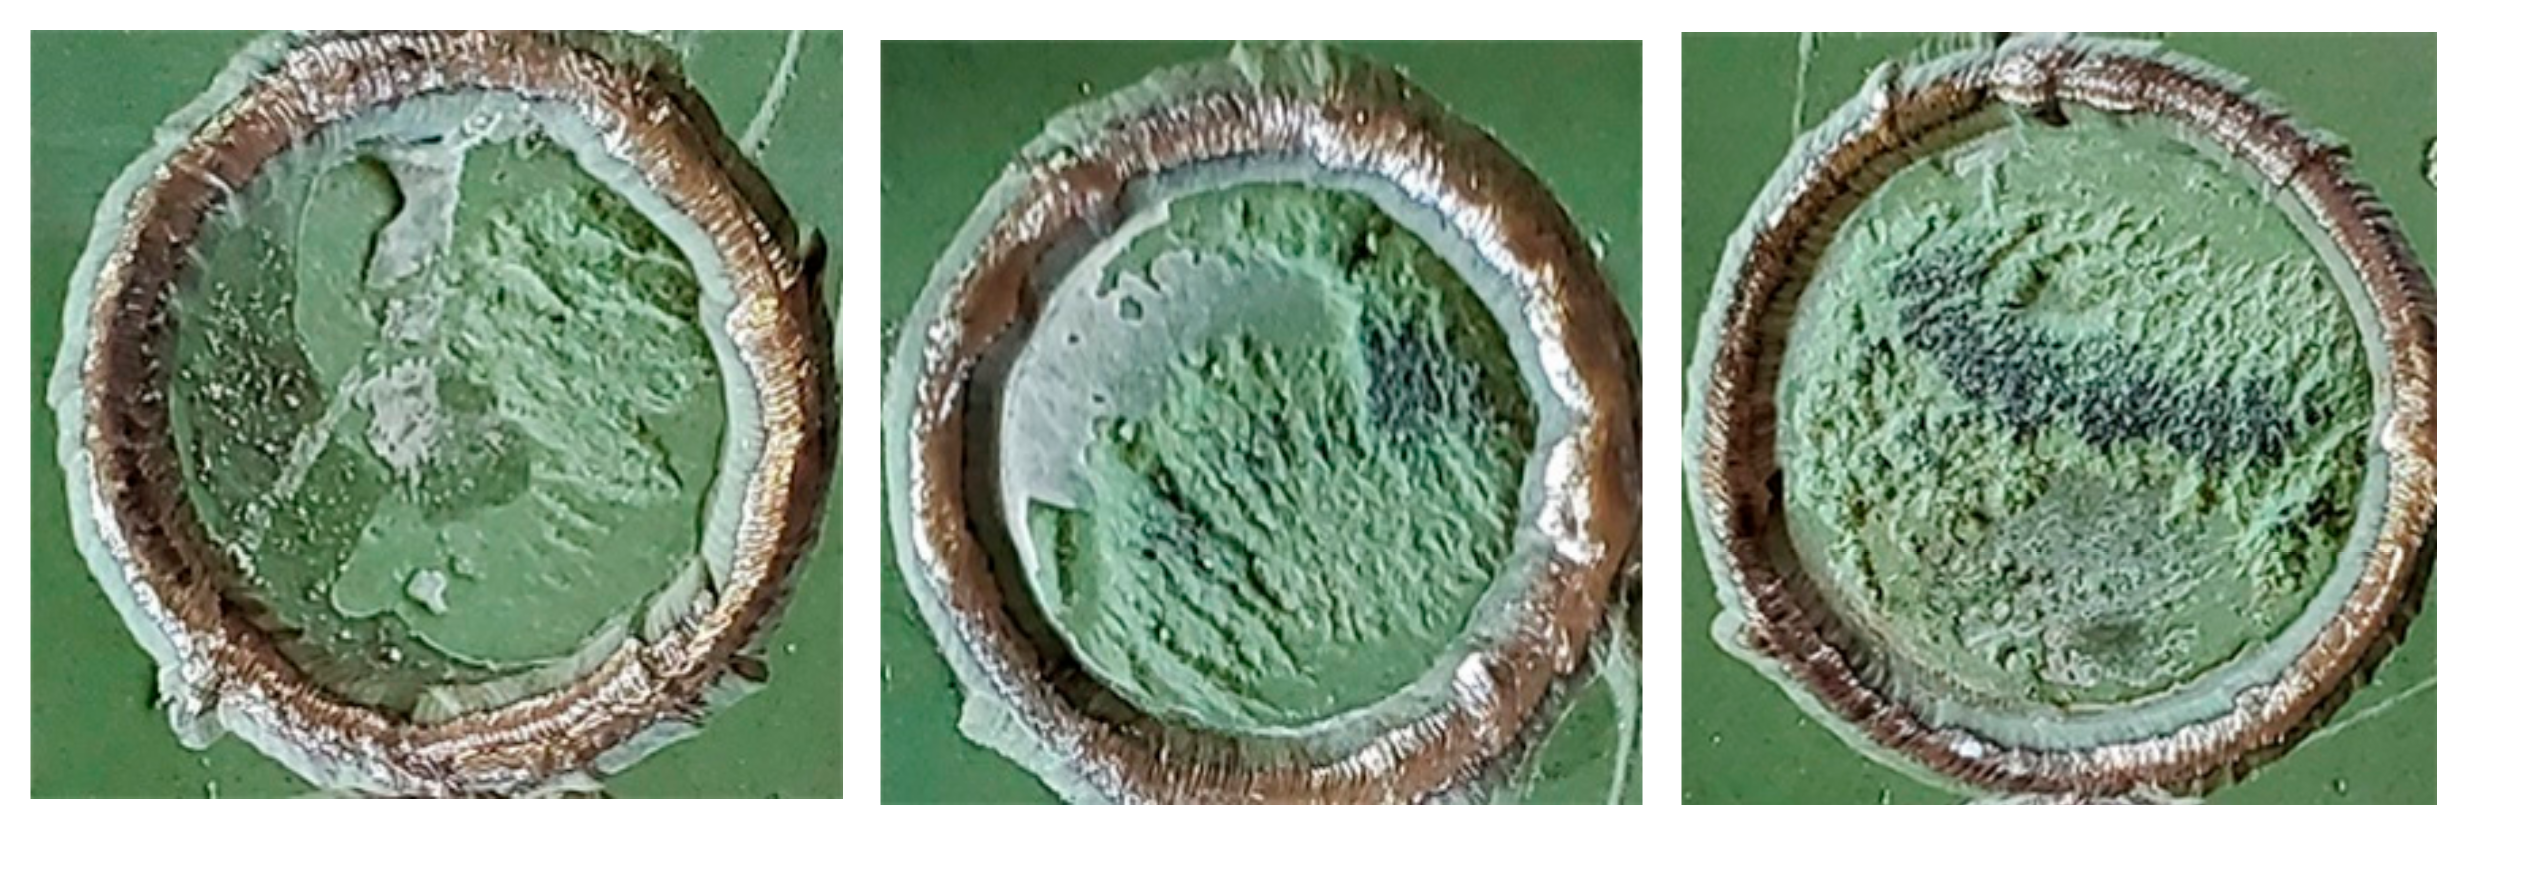
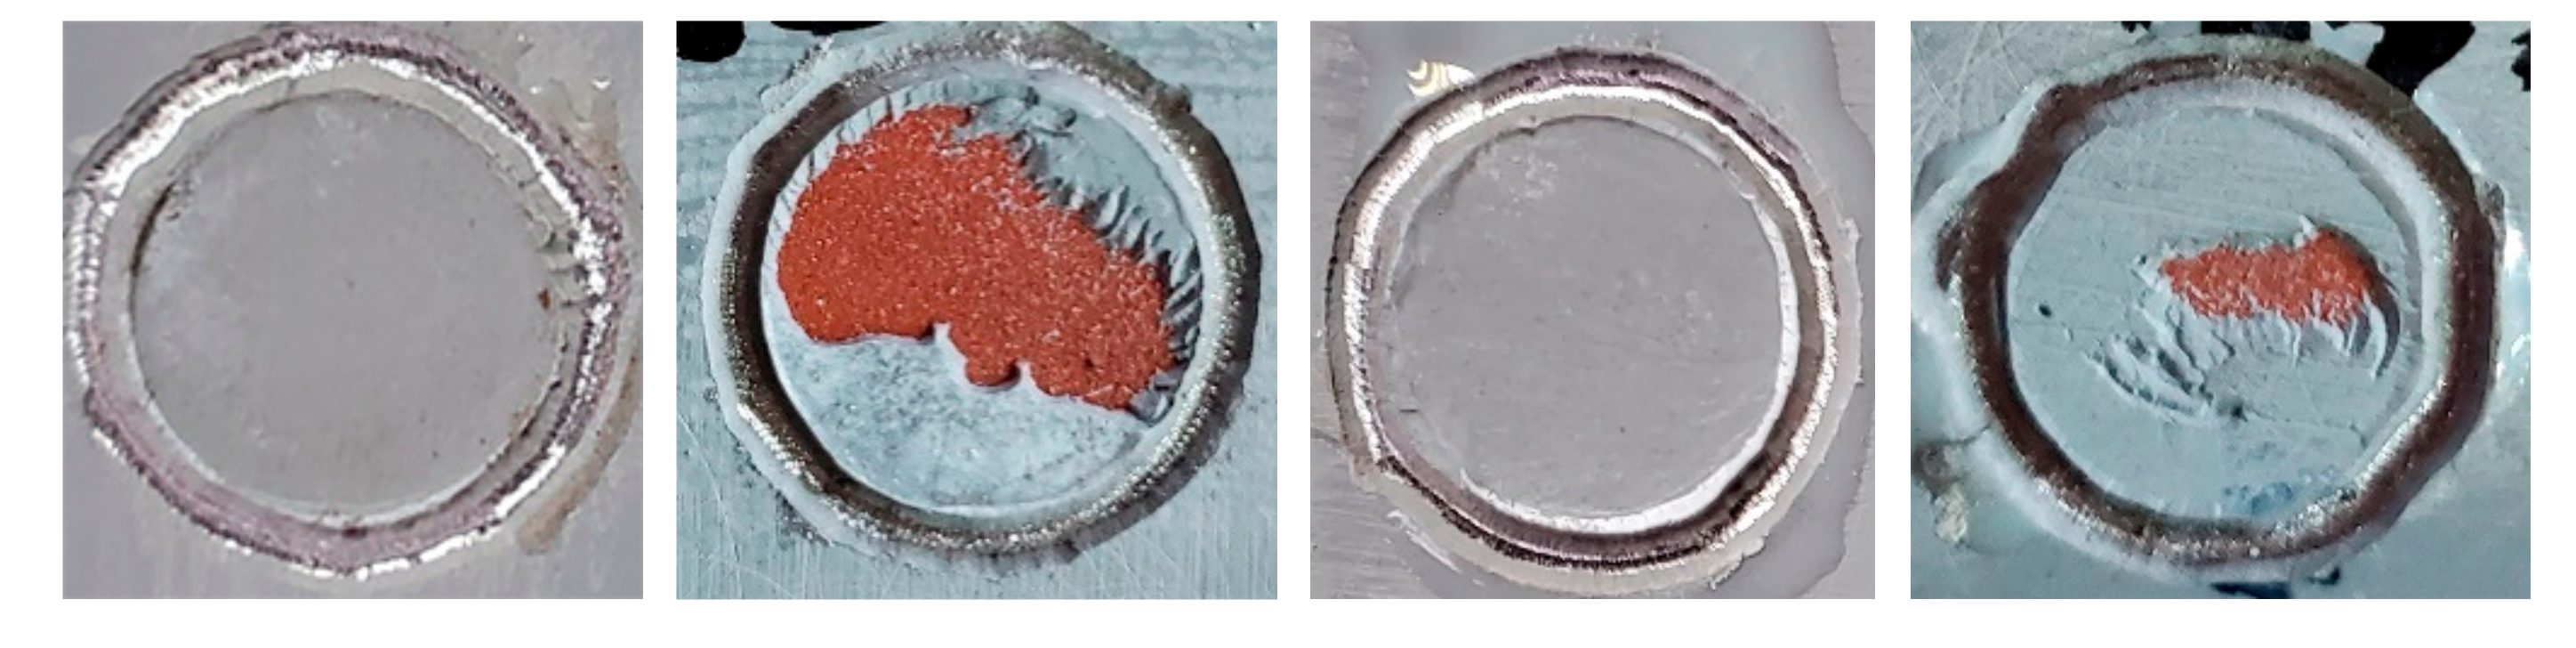
3.3. Adhesion Pull-Off Test Results after Autoclave Decompression

Moving from a visual assessment to a quantitative assessment, it is worth considering a method for determining the amount of adhesion using tensile dollies. A clear advantage of this method is to get a numerical value by which it is possible to explicitly show a decrease or immutability of the coating characteristics after testing. During the tests, many values were obtained for different coatings. From this volume of data, we can distinguish several scenarios that arise when estimating the amount of adhesion. As with the results of autoclave decompression tests, interpreting the results of determining the amount of adhesion may be obvious. Figure 13 shows an example of such a case.
Figure 13 shows that the resolution during the separation of tensile dollies on the witness samples occurred according to the cohesive and adhesive type. On the samples after decompression tests, the coating completely detached from the substrate, which shows a clear degradation and instability of the coating under the selected conditions.
The optimal scenario for determining can be considered the one in which the adhesion value is in the range from 10 to 25 MPa and there are no breaks in the glue or a large spread of values during the tests. Table 2 shows an example of the adhesion values obtained before and after autoclave decompression tests.
The obtained values in Table 2 can be optimal since the spread of values is relatively small, all the separations have a cohesive-adhesive character, and the adhesion values of the witness samples and the samples after the tests do not differ by over 30%. Figure 14 shows the dollies separation zones got in the studies described above.
According to the zones shown in Figure 14, it is possible to determine both the type of destruction during the separation of the tensile dollies and the area of separation.
However, sometimes, results may be ambiguously encountered. Table 3 shows the values of the adhesion value got for another polymer powder coating. The studies were carried out on samples after autoclave decompression tests. During visual inspection, there were no defects on the surface of the samples.
If attention is paid only to the average values shown in Table 3, then the spread can be called acceptable based on the absence of any requirements in the standards, except for the inadmissibility of reducing the values by over 30% compared to the samples of witnesses. The single values of the adhesion value in Table 3 have a spread exceeding 30%, which can indirectly show either heterogeneity of the coating quality or differences in the preparation for separation tests. Figure 15 shows photos of the separation zones obtained when determining the values from Table 3.

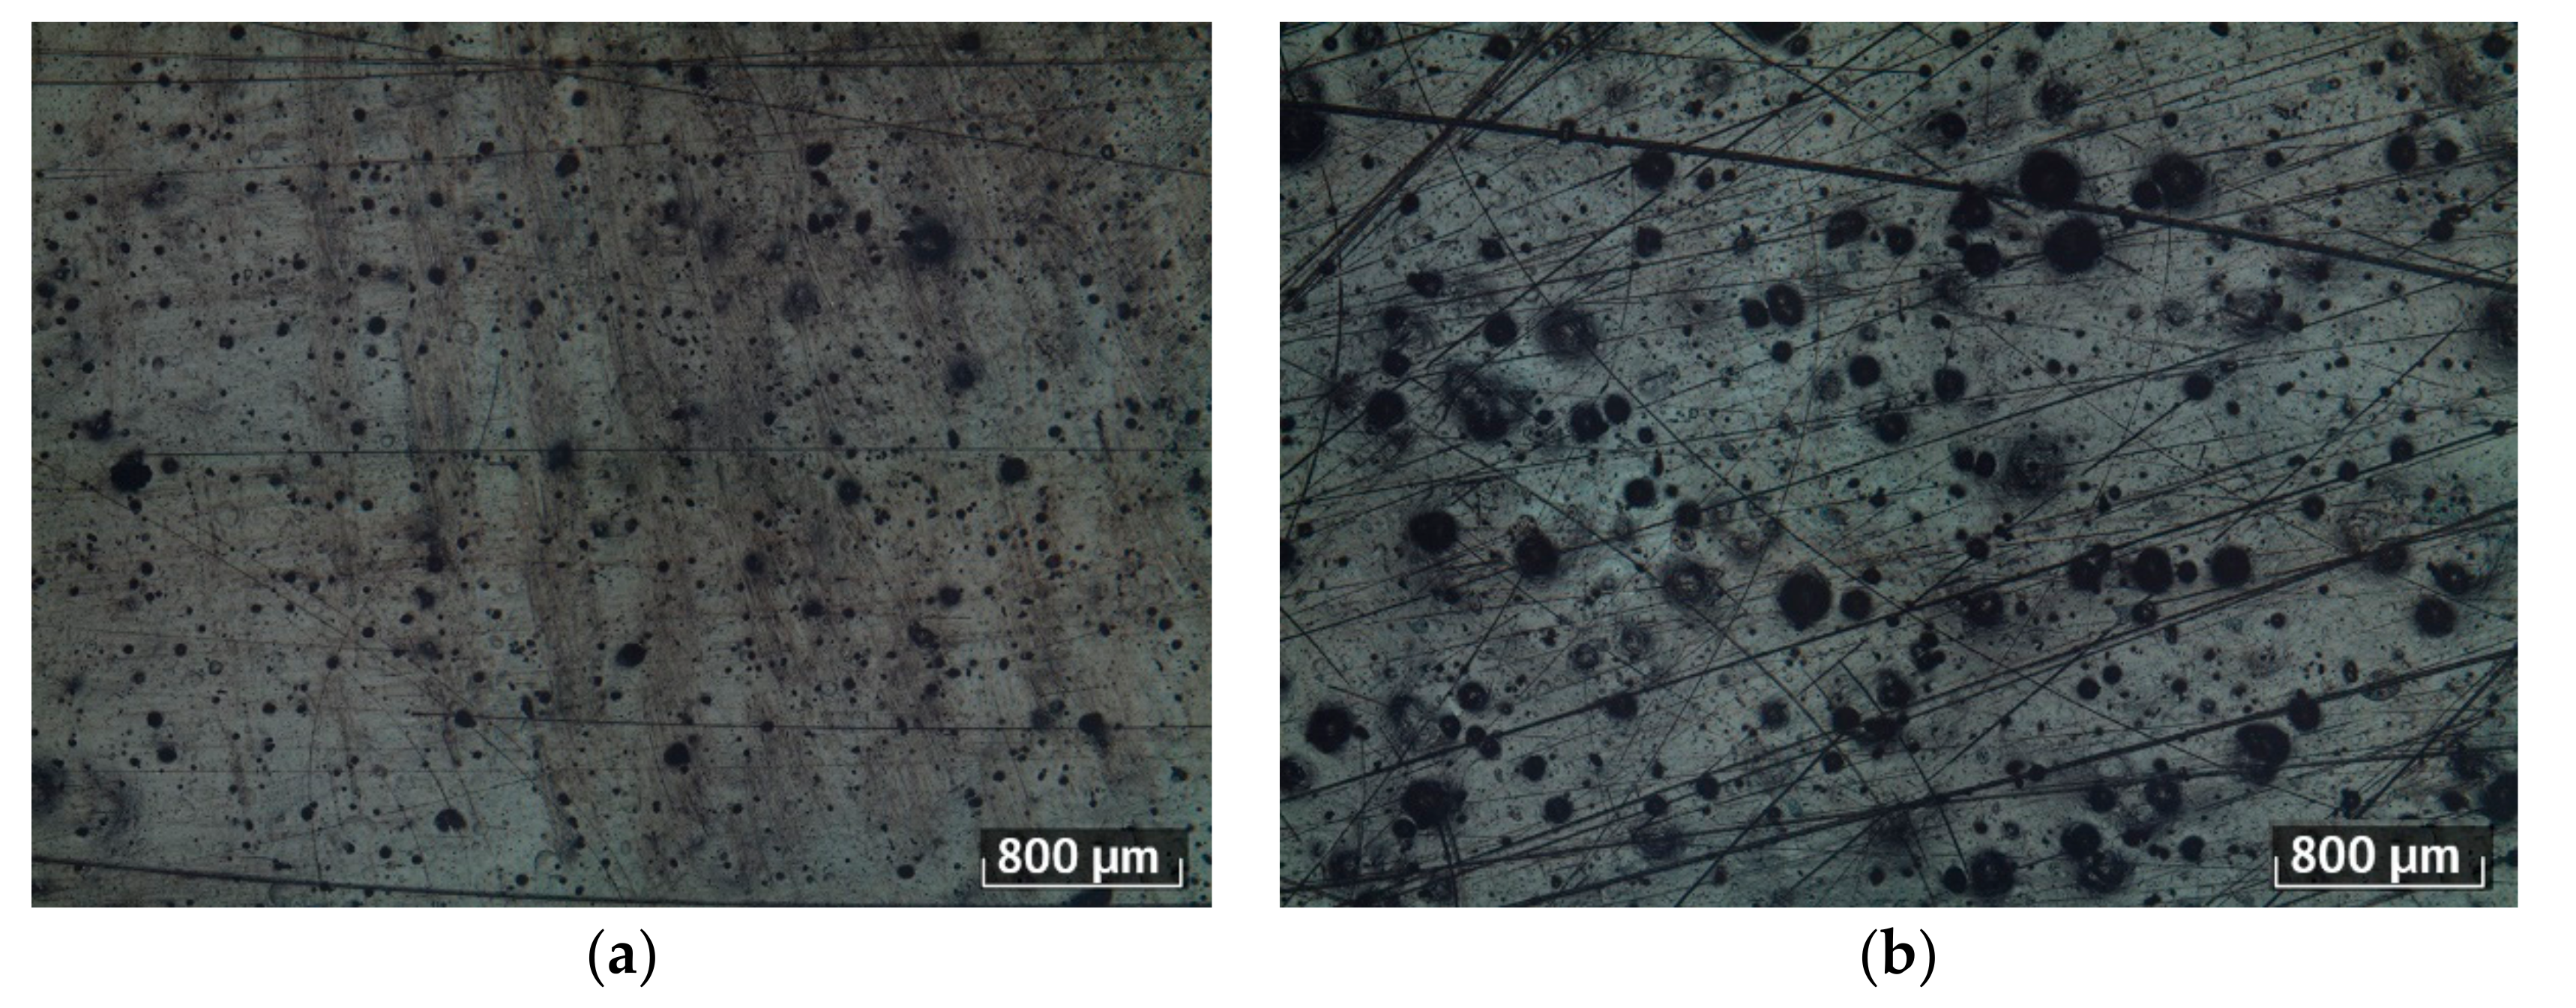
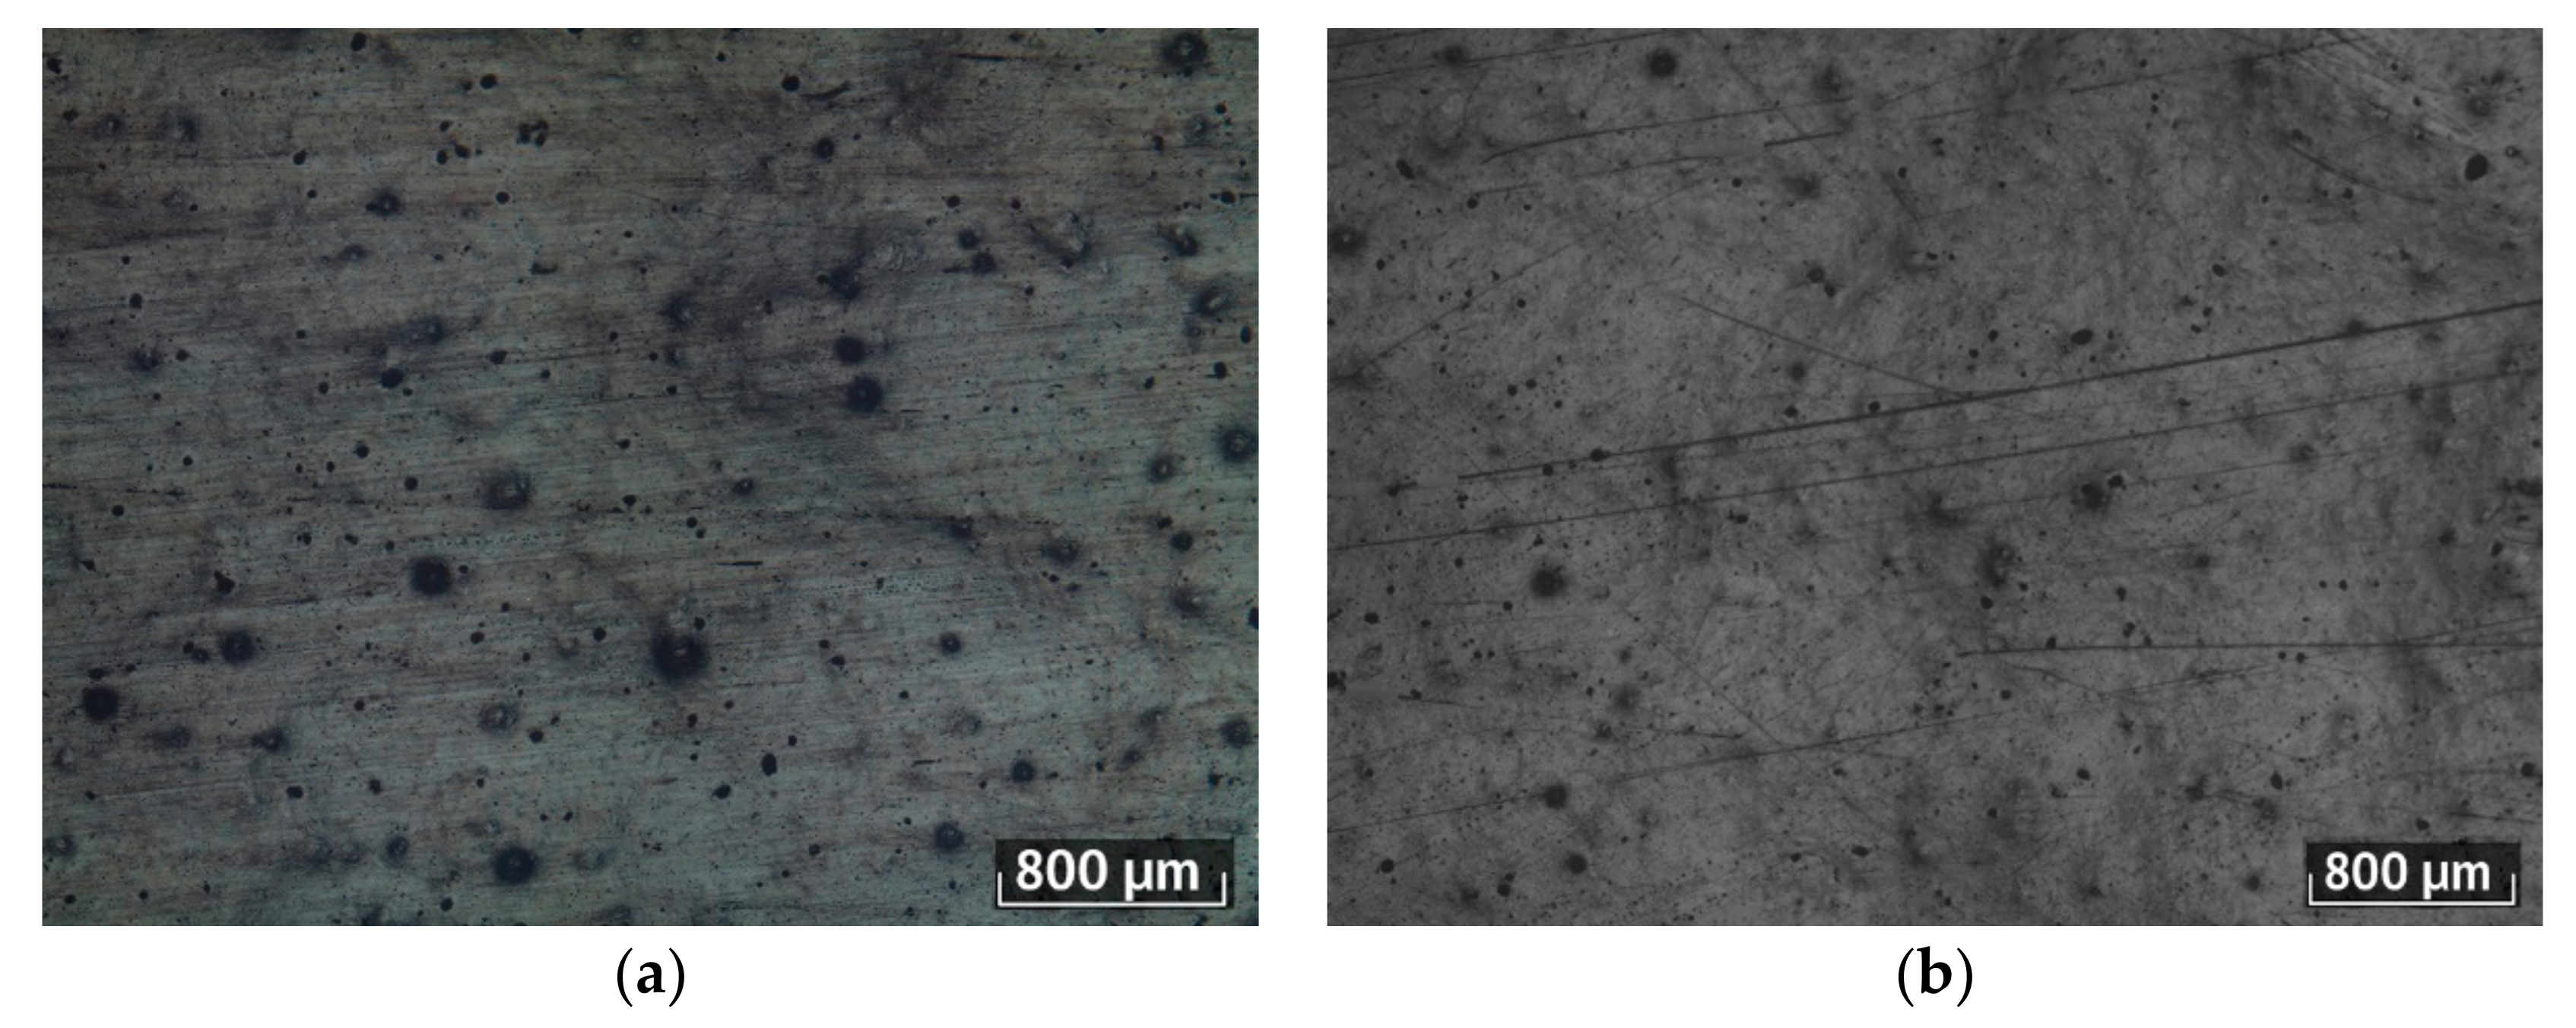
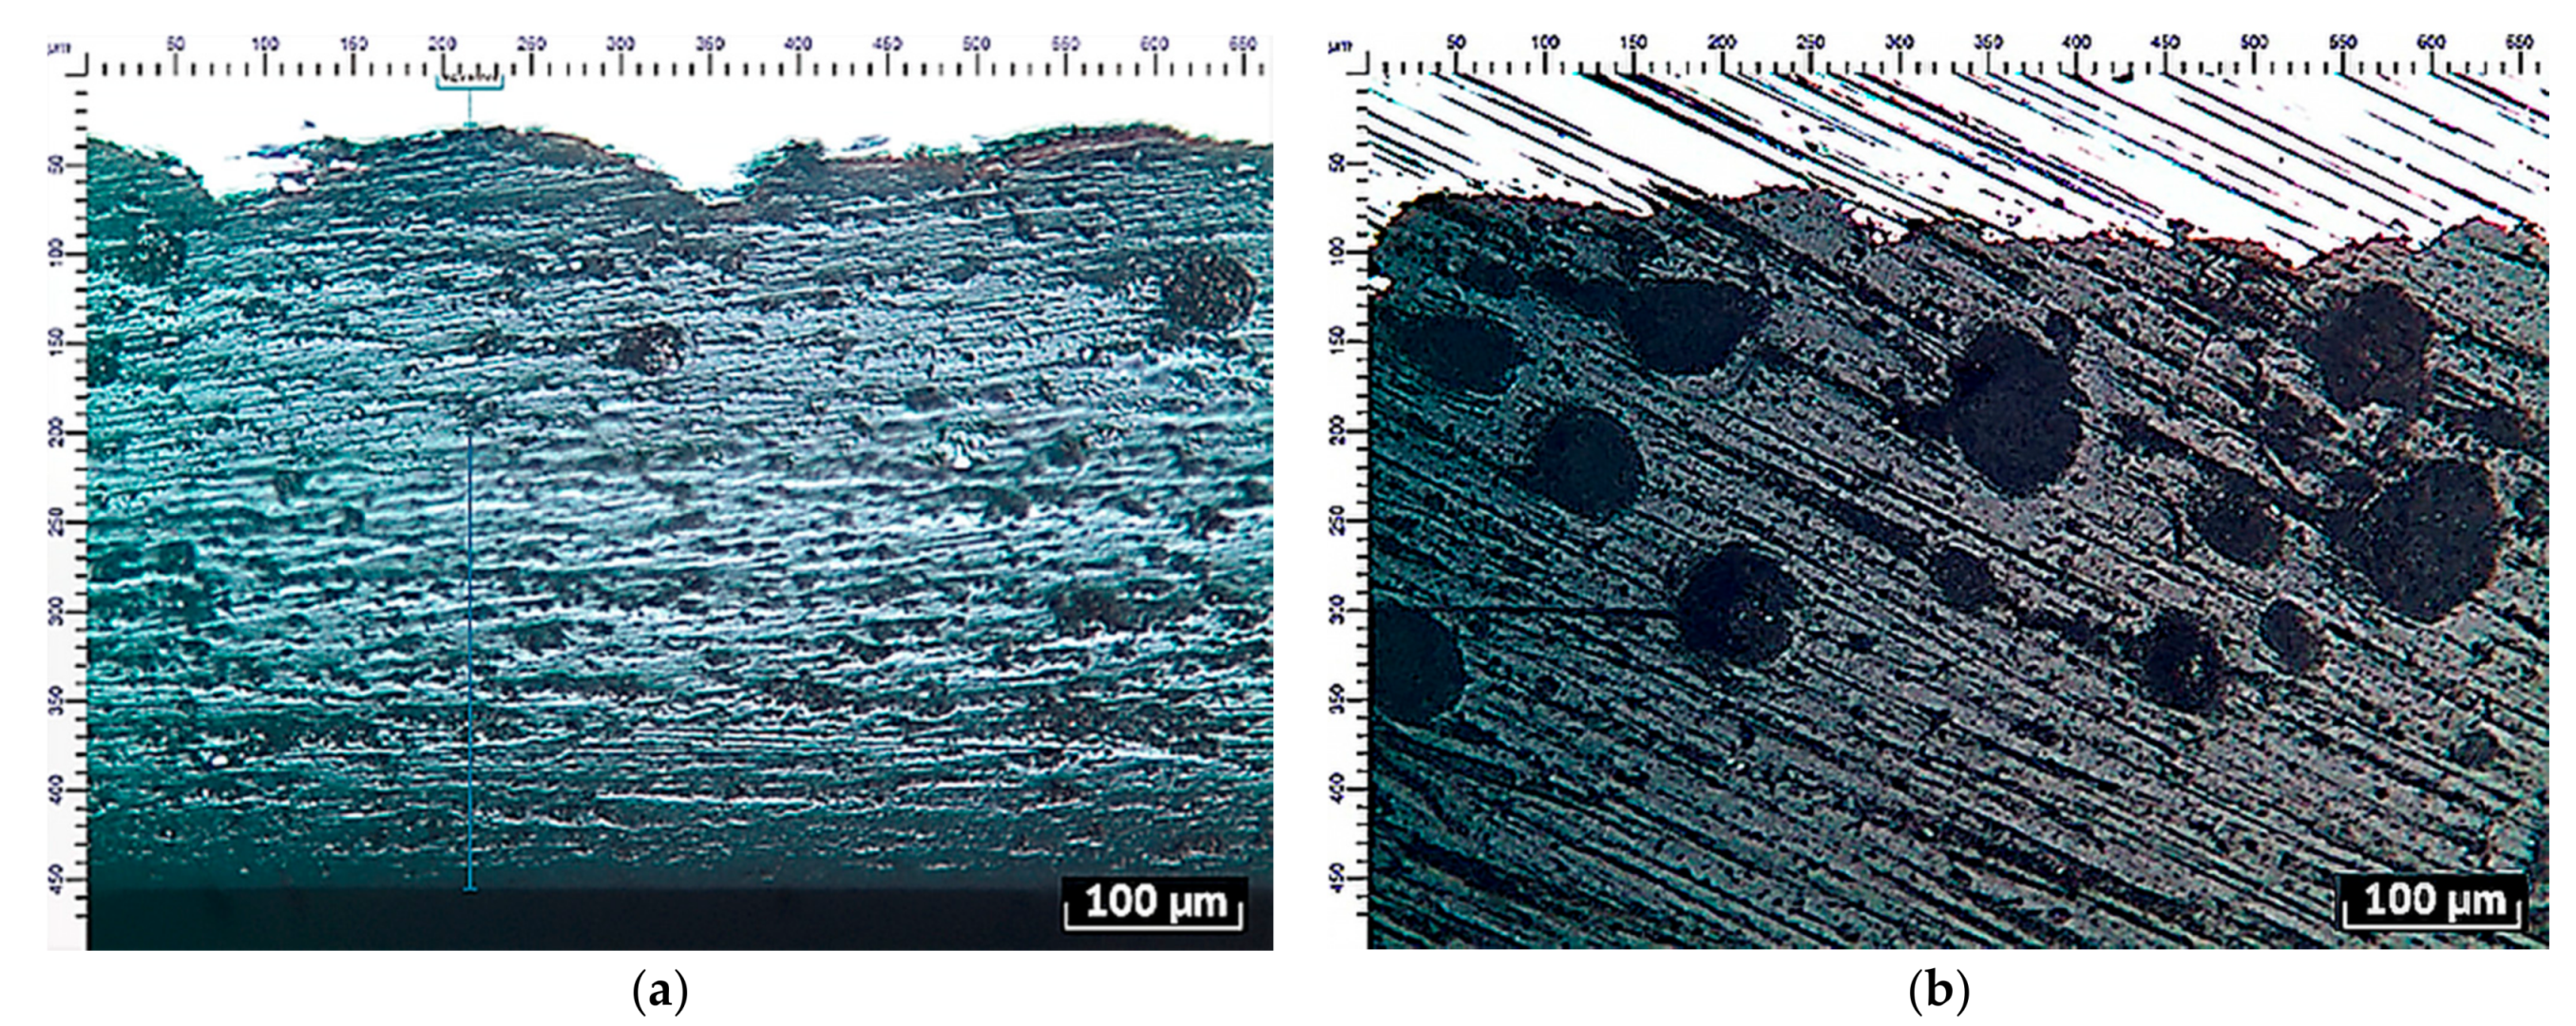
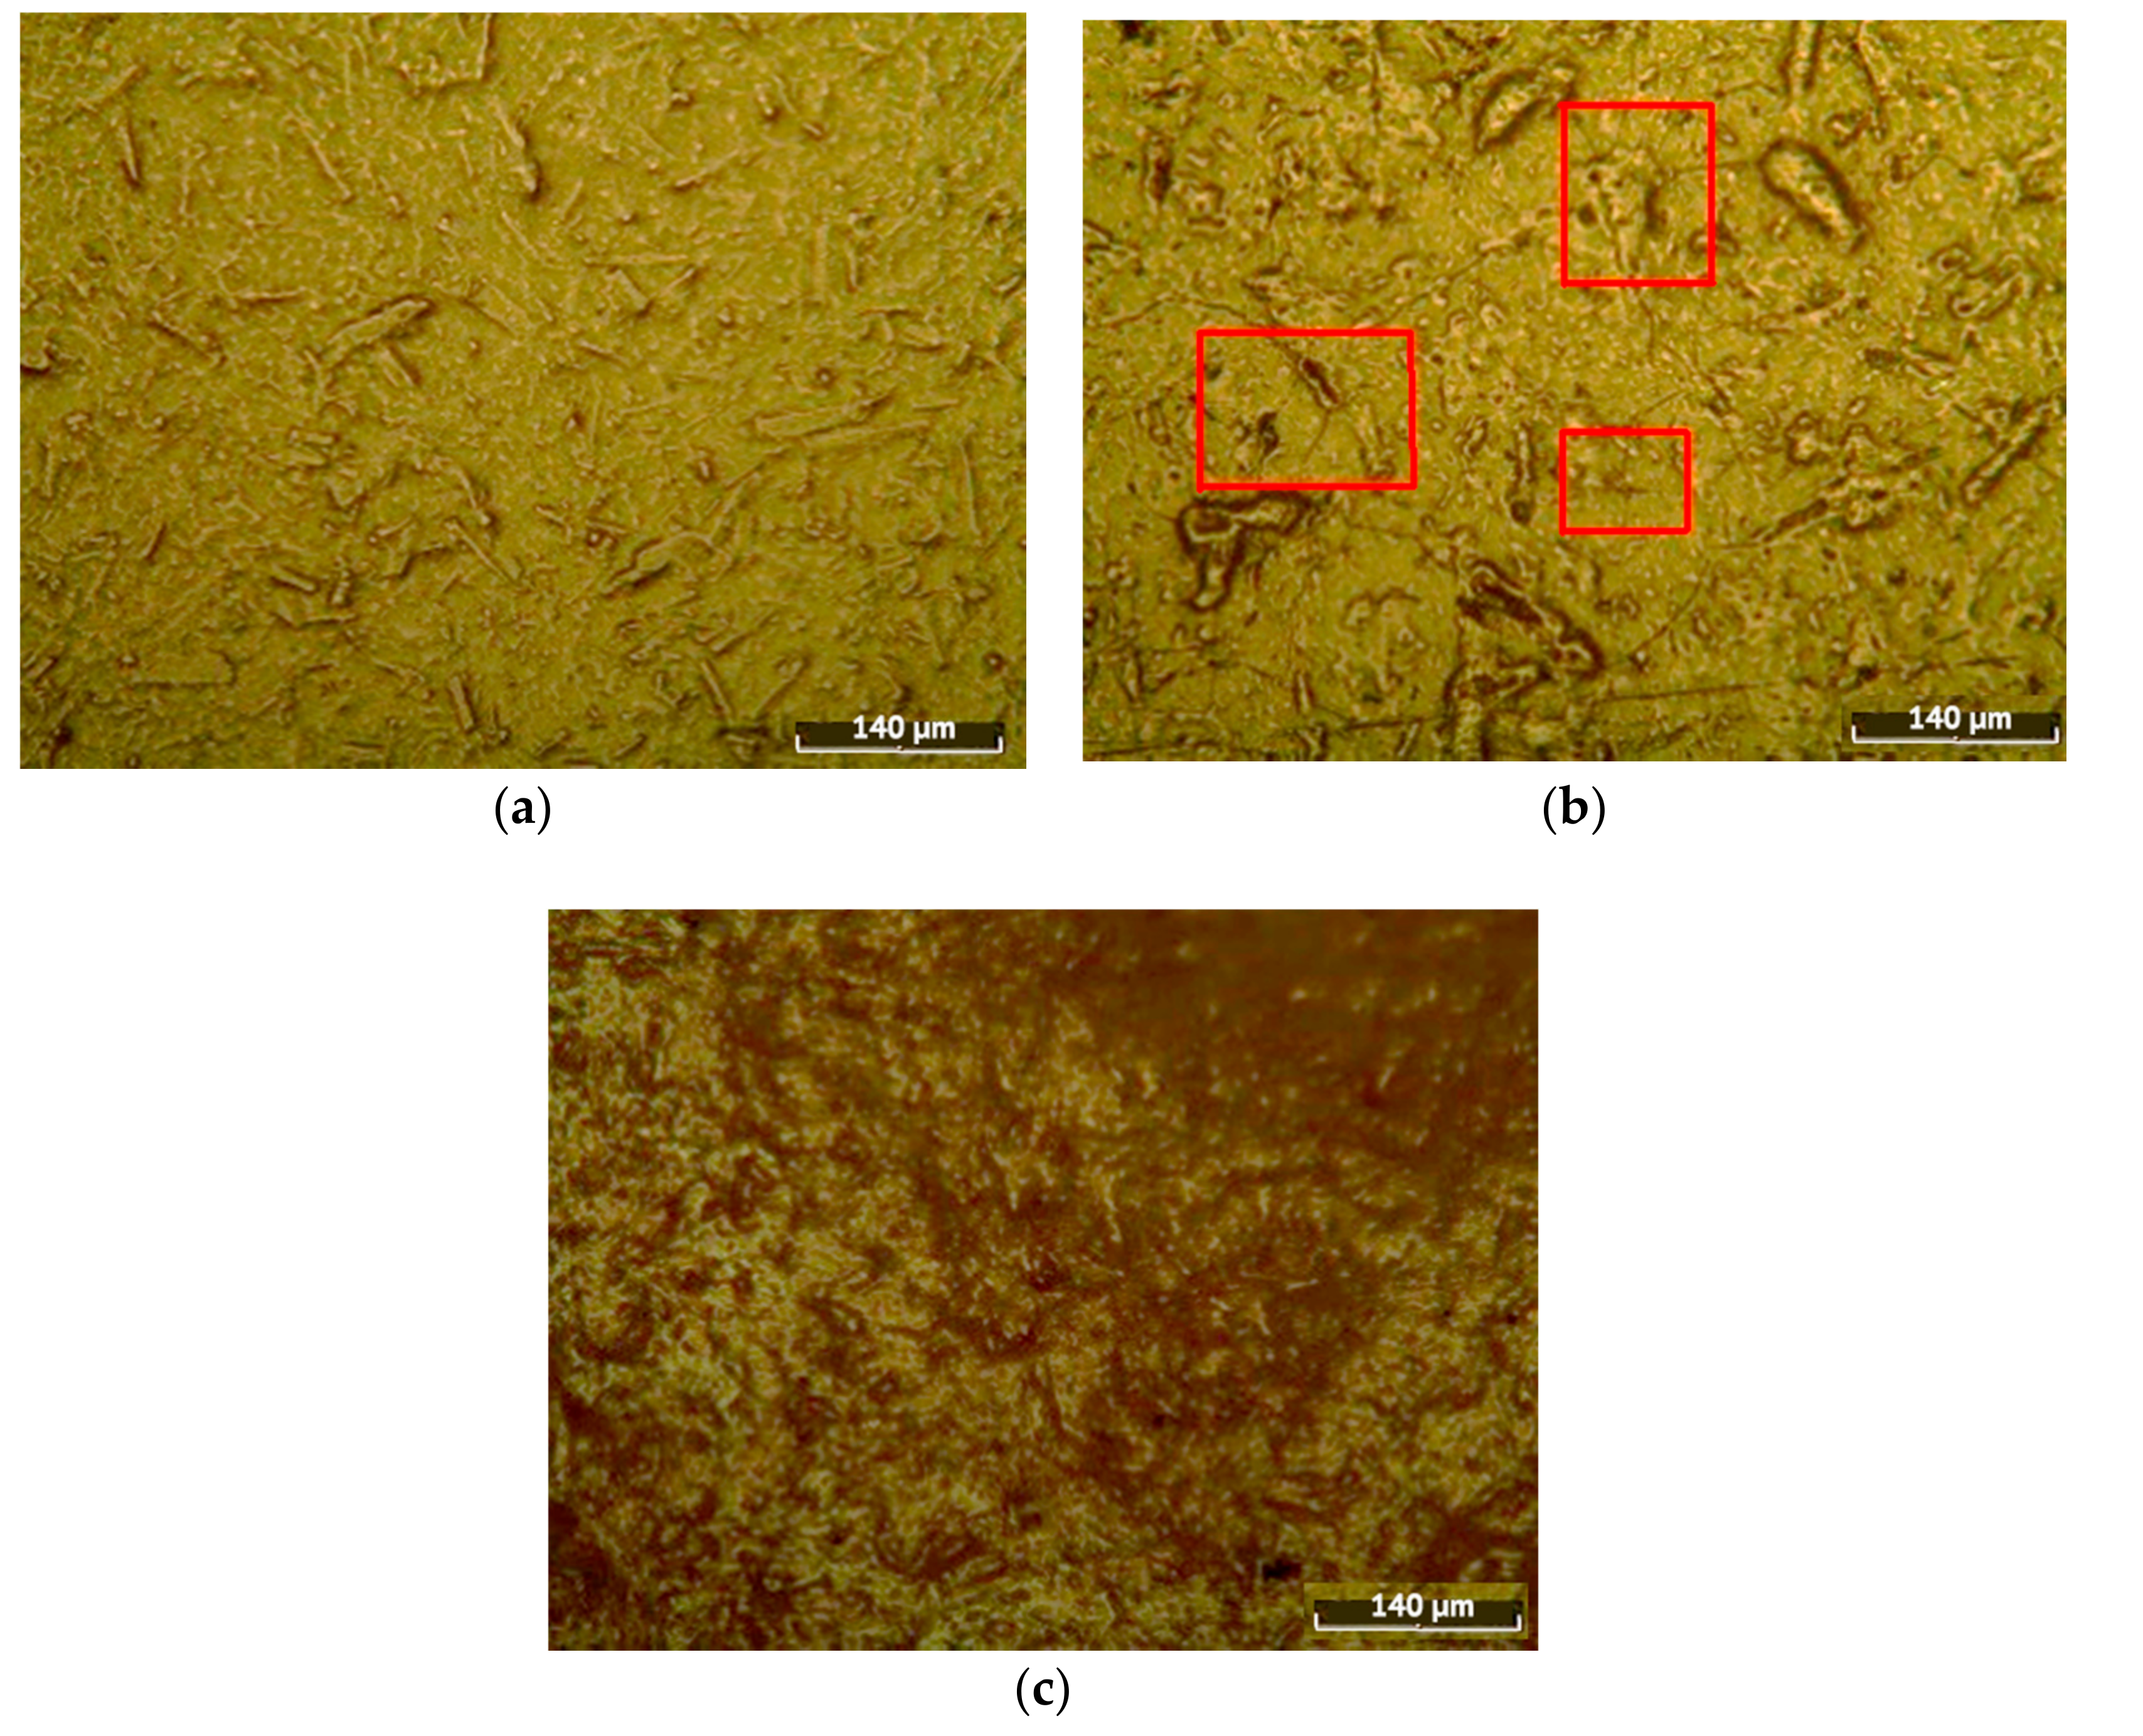
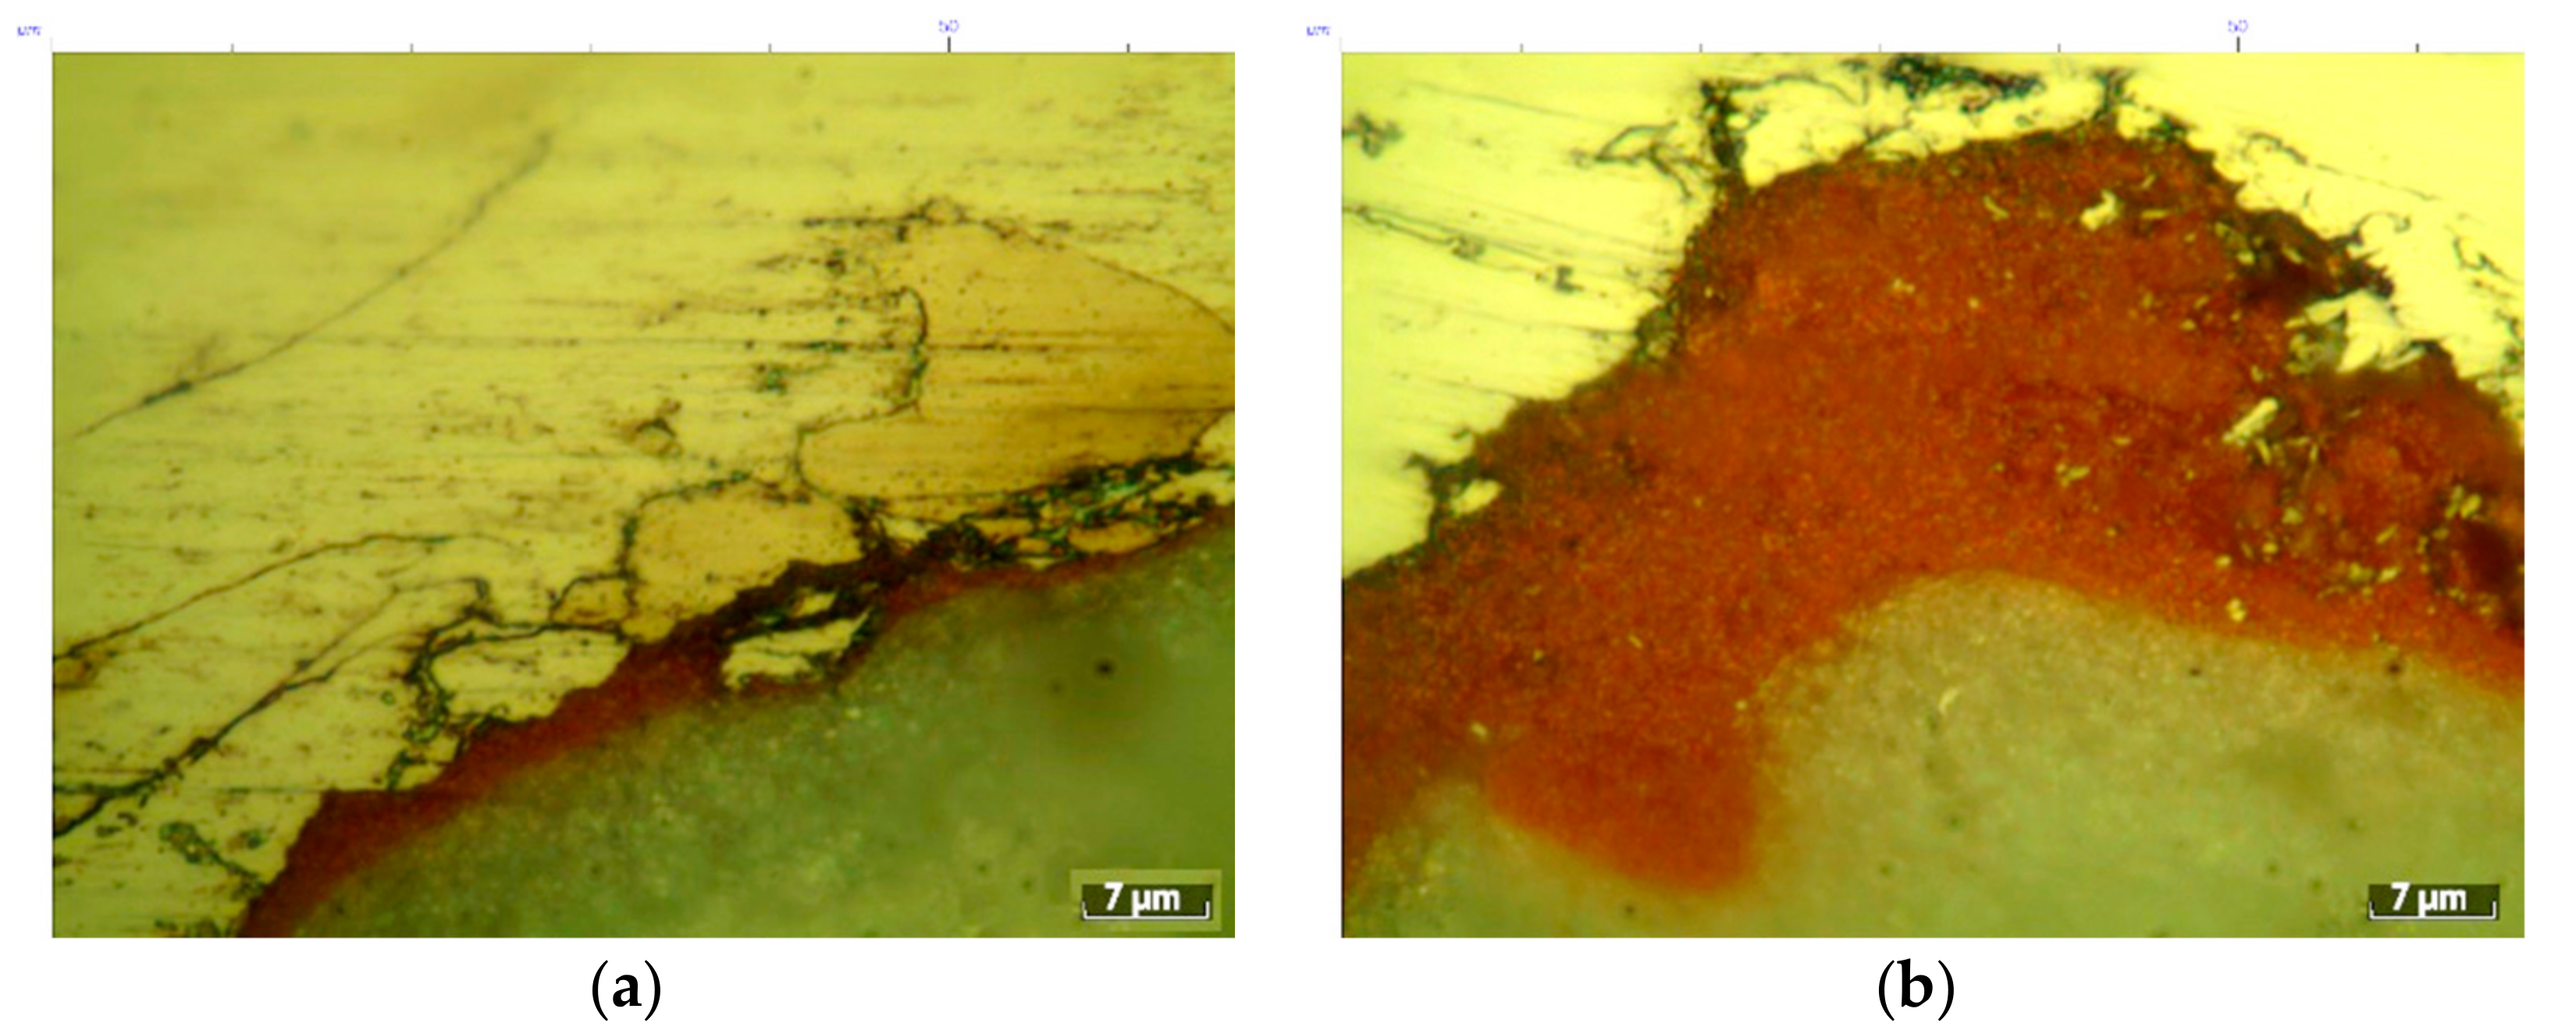
3.4. Changing the Surface Condition after Testing

During the research, the change in the coating’s state surface was also studied as the test temperature increased with the achievement and slight excess of the permissible operating temperature. The tests were carried out on a polymer powder coating with a maximum operating temperature of +120 °C and a thickness of ≈500 µm.
Figure 16 shows the changes in the coating’s condition after autoclave-decompression tests at various temperatures. Samples were tested in the temperature range from 60 °C to 150 °C in 10 °C steps to define the precise temperature of coating degradation.
Visually evaluating the samples shown in Figure 16. Degradation can be assessed visually only on samples tested at temperature +150 °C (the last sample in the picture 16). At a macro increase, changes can be seen starting from the test temperature at +70 °C. As the test temperature increased, the roughness of the coating increased, and swellings formed at a temperature of +150 °C. When studying the coatings presented in Figure 16 using an optical microscope, a change in the structure and appearance of the coating with an increase in temperature is also noted. Figure 17 shows the structure of the coating at magnification ×100.
As can be seen from Figure 17, at the temperature of +70 °C, the coating surface changed and microcracks formed. At +90 °C, the degradation of the coating became more pronounced, but if the test results were assessed by visual inspection, visible changes were only noticeable at temperatures of +150 °C as shown in Figure 16. Therefore, the degradation temperature can be defined precisely using optical microscopy. An additional effect of the coating study on an optical microscope may be the detection of poor-quality surface preparation or defects in the metal-coating zone. Figure 18 shows images of the transverse section of the coating after decompression tests.
The defects shown in Figure 17 may affect the test results and the duration of operation of the coated product.

3.5. Assessment Coatings Degradation Using Microhardness

Another method used in the work to assess the degradation of coatings after autoclave decompression tests were the measurement of microhardness on the cross-section of samples. Table 4 shows the measurement results. The studies were carried out on samples with a polymer powder coating applied to the plates. The coatings differed in composition among themselves. The coating thickness was ≈500 µm. The samples after the test were coatings that were decompressed at the recommended operating temperature and pressure of 5 MPa. The duration of exposure was 24 h, pressure relief was ≈4.8 s. There were no visible defects in the samples after the tests.
From Table 4, it can be noted that there was a clear decrease in the coating’s microhardness after autoclave tests. This can be explained by the formation of many pores and an increase in their size due to gas diffusion during the test process. To correlate the obtained data on the microhardness of the coating with standardized methods for assessing the degradation of coatings, adhesion was measured for samples marked 3 and 4 by the pull-off adhesion test. Table 5 provides comparative data on these two assessment methods.
Table 5 shows that the trend in microhardness and the amount of adhesion is maintained for witness samples and samples after tests. In both cases, the values reflect degradation in the coating after autoclave tests.

3.6. Decompression Test Results with H2S Gas Phase

It is also worth noting separately the results obtained during autoclave decompression tests in the presence of hydrogen sulfide. The studies were carried out in a gas medium comprising 1 MPa H2S and 4 MPa N2. As a liquid medium, 5% NaCl was used; pressure relief was performed in 4.8 s. The studies were carried out on polymer powder coatings with a thickness of ≈ 500 µm. Both flat samples and samples taken from products were tested. Figure 19 shows the samples after the tests.
According to the results of studies, most coatings either formed blisters or there was a complete detachment of the coating from the substrate. Figure 19 shows both cases. The practical value of these tests is debatable, since there is no such type of test in the standards and studies on the resistance of coatings in environments containing H2S are carried out without a sharp pressure relief.

4. Discussion

Autoclave tests are often perceived to reduce research time and possibly abandon pilot field tests by simulating operating conditions in the laboratory. The results obtained in this work allow us to identify practical aspects related to decompression tests and show possible ways of developing this autoclave test.
The discussion of the results can be based on the experimental plan shown in Figure 3. Decompression autoclave testing of polymer coatings allows you to evaluate the properties of paint and varnish systems, for example, durability in the expected operating temperature or the quality of the application. It is necessary to pay attention to the convergence of the results. The tests carried out showed an example of a situation in which the same coating had different results. This may be because of several factors: differences in the quality of the application on the body of the product, an excessive number of samples per test, or a test temperature that is close to the maximum permissible by the coating manufacturer. Differences in the quality of application occur during factory application and, for example, may be associated with poor-quality surface preparation. To identify this, it is necessary to take samples from different zones of the product. The influence of the number of samples was also tested during the studies and it was found that no more than 5 samples of 100 mm × 50 mm in size should be tested on an autoclave with a volume of 1.5 liters. The free access to the test solution to the surface of the sample must be maintained.
The pressure relief rate may also impact the test results. It has been shown that the degradation of the same coating after testing with a discharge rate of 4.8 s and 1.5 s is different. The high rate of discharge led to the appearance of blisters and rejection of the coating. This feature of the tests can be considered as a method of rigorous assessment of the coating and the basis for predicting a longer operating time of the coating. However, this may also be considered an excessive level of aggressiveness in the test conditions. If there is a standard that limits the minimum discharge rate, it is recommended that tests be carried out at the lower permitted limit.
An important point for the transition to predicting the life of coatings is the assessment of the dynamics of degradation of coatings after testing. The existing method for assessing adhesion allows us to get numerical values but has several shortcomings. For example, frequent glue breaks do not allow us to estimate the actual value of adhesion, and discrepancies in values on the same coating can exceed 30% or more. It is also necessary to select an adhesive for dollies for each coating, which can lead to an increase in the duration of tests with the relative simplicity of the method itself. The need to wait for the glue to dry does not allow us to assess the condition of the coating immediately after testing, which can also be considered an oversight. The paper provides examples of coating evaluation using optical microscopy and microhardness evaluation. It is shown that after testing, it is possible to detect an increase in the diameter of pores or the appearance of microcracks, although visually there is only a slight change in roughness on the coating. The growth of the pore diameter and the increase in their number continue after cyclic tests. For example, after two decompression cycles, a change in the pore diameter is noticeable compared to one cycle on the same coating sample. By measuring the microhardness of coatings after autoclave tests, a change in values is also recorded in comparison with the samples of witnesses. The values of microhardness are determined by the cross-section of the sample after testing, so we can also talk about gas penetration during testing. Moreover, a positive aspect is the correlation of microhardness data with the values obtained when assessing adhesion. All this makes it possible to talk about the possibility of using these methods to assess the degradation of the coating, and the assessment can be carried out by the cross-section of the sample immediately after the tests. With enough data on these assessment methods, it is possible to proceed to forecasting the dynamics of degradation and the duration of operation of coated products.
The work also touched upon decompression tests in the presence of H2S. Most of the coatings tested by this method showed a negative result while showing positive dynamics for the rest of the tests. According to this method, research is continuing to understand whether such a test is redundant.

5. Conclusions

The conducted studies make it possible to speak about the method of decompression autoclave tests as an effective and operational method for assessing the quality of the application and the declared operational properties of polymer coatings. However, like any autoclave test, it has its peculiarities when conducting and evaluating the results obtained. Considering the methodological features of conducting tests, the following conclusions can be identified based on the results of the conducted studies:
  • The quality of the polymer coating application may differ on flat surfaces, and especially on the final product. It is justified to conduct a series of tests on at least five samples taken from different zones. In the work, opposite results were obtained on one type of polymer coating; an increase in the number of samples will allow us to assess the convergence of the results and the reason for the discrepancy: the quality of application or differences in the method of conducting;
  • The ratio of the solution volume to the area of the coating surface under study, as well as the method of placing samples, affects the test results. The studied surfaces should not be in contact, and the recommended number of samples based on the tests performed is five samples with a size of 100 × 50 mm per 1500 mL of the working volume of the autoclave;
  • The results of studies of one coating system on flat samples and samples taken from products may differ, and therefore it is recommended to follow both types. Autoclave decompression tests are an effective method of assessing the quality of application, which was shown by the results of tests of the same type of coating applied by different manufacturers as the final product;
  • The effect of the pressure relief rate within the recommended interval of 5 s was also shown. The results after pressure relief in 1.5 s and in 4.8 s differed in the formation of blisters in the first variant;
  • Existing methods for assessing the degradation of coatings can sometimes give contradictory data; therefore, methods related to the study of the structure and microhardness of coatings before and after testing were proposed in the work. The methods allow us to register changes in the size and number of pores, and the microhardness values were correlated with the data obtained by the adhesion values by the separation method.

Author Contributions

Conceptualization, N.S. and E.A.; methodology, M.K.; M.K. and E.A.; writing—original draft preparation, M.K.; writing—review and editing, M.K.; project administration, D.L. and V.T. All authors have read and agreed to the published version of the manuscript.

Funding

The research is partially funded by the Ministry of Science and Higher Education of the Russian Federation as part of World-class Research Center program: Advanced Digital Technologies (contract No. 075-15-2020-934 dated from 17 November 2020).

Conflicts of Interest

The authors declare no conflict of interest.

References

  1. Popoola, L.T.; Grema, A.S.; Latinwo, G.K.; Gutti, B.; Balogun, A.S. Corrosion problems during oil and gas production and its mitigation. Int. J. Ind. Chem. 2013, 4, 1–15. [Google Scholar] [CrossRef] [Green Version]
  2. Ermakov, B.S.; Alkhimenko, A.A.; Shaposhnikov, N.O.; Ermakov, S.B.; Shatsky, T.E.; Igolkin, A.F. The use of sprayed powders to create coatings in the welds of oilfield pipelines. In Proceedings of the IOP Conference Series: Materials Science and Engineering, 9th International Conference “Refrigeration and Food Technologies in the 21st Century”, St Petersburg, Russia, 13–15 November 2019; IOP Publishing: Bristol, UK, 2000; Volume 826, p. 012008. [Google Scholar]
  3. Papavinasam, S. Corrosion Control in the Oil and Gas Industry; Elsevier: Amsterdam, The Netherlands, 2013. [Google Scholar]
  4. Yudin, P.; Petrov, S.; Maximuk, A.; Knyazeva, Z. Destruction mechanisms and methods of laboratory autoclave tests of internal coatings of oil pipes. In E3S Web of Conferences; EDP Sciences: Les Ulis, France, 2019; Volume 121, p. 01009. [Google Scholar] [CrossRef]
  5. Khar’Kov, A.A.; Shakhmatov, A.V.; Gyulikhandanov, E.L.; Alekseeva, E.L. Comparative analysis of corrosion-resistant alloys inconel 718 and ÉP718. Chem. Pet. Eng. 2019, 54, 771–778. [Google Scholar] [CrossRef]
  6. Crolet, J.L.; Bonis, M.R. How to pressurize autoclaves for corrosion testing under carbon dioxide and hydrogen sulfide pressure. Corrosion 2000, 56, 167–182. [Google Scholar] [CrossRef]
  7. TM0185. In Evaluation of Internal Plastic Coatings for Corrosion Control of Tubular Goods by Autoclave Testing; NACE: Houston, TX, USA, 2000.
  8. API RP 5L2, Recommended Practice for Internal Coating of Line Pipe for Non-Corrosive Gas Transmission Service; American Petroleum Institute: Washington, DC, USA, 2002.
  9. GOST R 58346-2019. Steel Pipes and Fittings for Oil Industry. Inner Surface Protective Paint Coatings. General Technical Requirements. 2019.
  10. ISO 4624:2016. In Paints and Varnishes—Pull-Off Test for Adhesion; ISO: Geneva, Switzerland, 2016.
Figure 1. Testing samples.
Metals 11 01713 g001
Figure 2. Autoclaves used for tests.
Metals 11 01713 g002
Figure 3. Research plan flowchart.
Metals 11 01713 g003
Figure 4. Samples with blisters after autoclave decompression tests.
Metals 11 01713 g004
Figure 5. Samples after autoclave decompression tests: (a) samples tested at a temperature +60 °C; (b) samples tested at a temperature + 100 °C.
Metals 11 01713 g005
Figure 6. Samples of the same coating from different manufacturers of products after autoclave decompression tests: (a) samples from manufacturer 1; (b) samples from the manufacturer 2.
Metals 11 01713 g006
Figure 7. Samples after autoclave decompression tests with different duration of exposure under the same conditions: (a) exposure for 24 h; (b) exposure for 72 h.
Metals 11 01713 g007
Figure 8. Influence of pressure release time during autoclave tests on decompression within 5 s: (a) pressure release within 1.5 s; (b) pressure relief in 4.9 s.
Metals 11 01713 g008
Figure 9. Samples after cyclic decompression test.
Metals 11 01713 g009
Figure 10. Microstructure of coating after test: (a) one decompression cycle; (b) two decompression cycle.
Metals 11 01713 g010
Figure 11. Microstructure of coating after test: (a) one decompression cycle; (b) two decompression cycle.
Metals 11 01713 g011
Figure 12. Coating structure after autoclave tests: (a) sample before testing, 100×; (b) sample after testing, 100×.
Metals 11 01713 g012
Figure 13. The nature of destruction in the zone after pull-off test: (a) witness samples, (b) samples after testing.
Metals 11 01713 g013
Figure 14. The nature of destruction in the zone after pull-off test.
Metals 11 01713 g014
Figure 15. The nature of destruction in the zone after pull-off test.
Metals 11 01713 g015
Figure 16. Change in the surface state of coated specimens after autoclave decompression tests as the test temperature increased.
Metals 11 01713 g016
Figure 17. The microstructure of the coating got on the longitudinal strip selected from the coatings after decompression tests, ×100: (a) witness sample; (b) a sample tested at + 70 °C; (c) a sample tested at +90 °C.
Metals 11 01713 g017
Figure 18. Defects at the metal-coating boundary: (a) cracks in the zone bordering the soil; (b) excessive thickness of the soil.
Metals 11 01713 g018
Figure 19. Samples after decompression tests with H2S.
Metals 11 01713 g019
Table 1. Testing conditions of autoclave decompression test.
Liquid PhaseGas PhaseOperating Pressure, MPaOperating Temperature, °CPressure Relief Time, SecTotal Test Time, HourNumber of Pressure Relief Cycles, Times
15% NaCl5 MPa CO25depending on the type of coating4.8241
25 MPa CO21.5241
31 MPa H2S + 4 MPa N24.8241
45 MPa CO24.8721
510 MPa CO2104.8482
Table 2. Results of pull of test after autoclave decompression test.
Samples before testing
Sample №Value 1, MPaValue 2, MPaValue 3, MPaValue 4, MPaValue 5, MPaAverage Value
1101817161816
2182119201819
3191419182018
Samples after testing
Sample №Value 1, MPaValue 2, MPaValue 3, MPaValue 4, MPaValue 5, MPaAverage Value
1151519171817
2151916161717
3122311192017
Table 3. Results of pull-off test after autoclave decompression test.
Samples after Testing
Sample №Value 1, MPaValue 2, MPaValue 3, MPaValue 4, MPaValue5, MPaAverage Value
117825121415
210178141813
3201215181316
Table 4. Microhardness of testing samples.
Sample №Samples before TestSamples after TestAverage before TestAverage after TestMicrohardness Change, %
11617.317.412.112.910.416.911.830
217.415.814.813.912.512.5161319
3202119.51813.411.520.214.329
42724201512.812.723.713.543
Table 5. Results of pull-off test after autoclave decompression test.
Samples before Test
Sample №.Adhesion test results, MPaAverage
325202222
418192320
Microhardness, HV
3202119.520.2
427242023.7
Samples after test
Sample №.Adhesion test results, MPa
35666
46666
Microhardness, HV
31813.411.514.3
41512.812.713.5
Publisher’s Note: MDPI stays neutral with regard to jurisdictional claims in published maps and institutional affiliations.

