Article

Microstructure and Failure Processes of Reactor Pressure Vessel Austenitic Cladding

1
Department of Impact and Waves in Solids, Institute of Thermomechanics of the Czech Academy of Sciences, Dolejškova 1402/5, 182 00 Praha, Czech Republic
2
Department of Materials, Faculty of Nuclear Sciences and Physical Engineering, Czech Technical University in Prague, Trojanova 13, 120 00 Praha, Czech Republic
3
Department of Mechanical Properties, ÚJV Řež, a. s., Hlavní 130, Řež, 250 68 Husinec, Czech Republic
*
Author to whom correspondence should be addressed.
Metals 2021, 11(11), 1676; https://doi.org/10.3390/met11111676
Submission received: 24 September 2021 / Revised: 14 October 2021 / Accepted: 18 October 2021 / Published: 20 October 2021
(This article belongs to the Special Issue Failure Analysis in Metallic Materials)

Abstract

:
This paper is dedicated to an experimental program focused on the evaluation of microstructure and failure mechanisms of WWER 440 type nuclear reactor pressure vessel cladding made from Sv 08Kh19N10G2B stainless steel. Static fracture toughness tests performed on standard precracked single edge bend specimens revealed extreme variations in fracture toughness values, J0.2. Fractured halves of test specimens were subject to detailed fractographic and metallographic analyses in order to identify the causes of this behavior and to determine the relationship between local microstructure, failure mode and fracture toughness. Results indicated that fracture toughness of the cladding was adversely affected by the brittle cracking of sigma particles which caused a considerable decrease in local ductile tearing resistance. Extreme variations in relative amounts of sigma phase, as well as the extreme overall structural heterogeneity of the cladding determined in individual specimens, provided a reasonable explanation for variations in fracture toughness values.

1. Introduction

Austenitic cladding is an integral component of the WWER 440 nuclear reactor pressure vessel (RPV) designed to ensure anticorrosive protection. Approximately 10 mm thick, it is a stainless weld-overlay deposited on the RPV’s inner surface and shields the RPV base metal (BM) from the corrosive environment created by primary light water coolant [1].
For many years, only limited attention has been paid to the impact of cladding on RPV integrity. Gradually, however, it has become evident that the impact could potentially be of great significance. On one hand, elevated fracture toughness and plasticity of the cladding provide additional strength to an RPV which could possibly justify an extended RPV lifetime [2]. On the other hand, significant differences in thermal expansion coefficients with respect to RPV base metals [3] could lead to a stress peak during a severe emergency transient associated with abrupt overcooling of the RPV. This event is referred to as pressurized thermal shock (PTS) and presents the potential risk of interfacial crack initiation and propagation [4]. PTS safety analyses have recently become a subject of particular interest to nuclear power plant operators [5,6,7].
Rigorous evaluation of a PTS scenario requires extensive and reliable data on the fracture toughness and strength of relevant RPV structural materials. The special need for data relating to cladding materials is owed to the fact that cladding samples were not commonly included in nuclear power plant surveillance programs in the past. It follows that mechanical testing programs provide essential information for safety analyses. In practice, however, mechanical tests occasionally yield results which are difficult to interpret. Static fracture toughness test results for cladding made from Sv 07Kh25N13 steel, investigated in the previous study [8], could be an example. In that study, fracture toughness values of the cladding exhibited an extreme scatter. Detailed fractographic analysis of fracture surfaces, as well as a thorough and systematic metallographic examination of samples extracted from fractured specimens, provided vital information that provided better understanding of the nature of cladding microstructure and failure behavior. Motivated by successful clarification of an apparently stochastic behavior of the first cladding [8], an identical approach was applied in the present research on non-irradiated cladding made from Sv 08Kh19N10G2B that exhibited similarly extreme scatter values of J0.2 (Figure 1)

2. Materials and Methods

WWER 440 cladding is produced by submerged arc welding technology using strip electrodes. Firstly, a single welding pass is performed directly on the RPV wall using strip electrodes from an over-alloyed Sv 07Kh25N13 steel to produce the “first cladding” (CL1). The process of welding to low-alloyed RPV base metals inevitably leads to partial depletion of the excessive amounts of alloying elements, so that the resulting real composition of the first cladding is consistent with that of Sv 08Kh19N10G2B steel, i.e., an 18 chromium/10 nickel-type stainless steel [1,2]. Subsequently, several layers of this steel are deposited on CL1 to produce the second cladding (CL2). The total thickness of the cladding (CL1 + CL2) is approximately 10 mm. Differences in the contents of alloying elements of the two cladding materials are motivated by technological requirements: some sources [9] mention that the thermal expansion coefficient of non-stabilized Sv 07Kh25N13 is much closer to RPV base metal than that of stabilized Sv 08Kh19N10G2B. Others suggest that the former is less prone to hot cracking during welding to the BM [2]. An overview of alloying elements contents is given by Table 1.
The current research was dedicated to the second cladding made from Sv 08Kh19N10G2B stainless steel. Samples were provided in the form of standard single edge bend specimens fractured in static fracture toughness tests. The specimens were 55 mm long, 10 mm wide, 10 mm thick, had front notches of 2 mm in depth, fatigue precracks approximately 5 mm in length, and side grooves of 1 mm in depth. The specimens shared the same origin with those investigated in [8], and mechanical testing was conducted at the same laboratory—the Department of Mechanical Properties of ÚJV Řež, a. s. Therefore, the results obtained for both cladding materials were comparable with each other.
Static fracture toughness tests were conducted and evaluated in compliance with the ASTM 1820 standard [11] using a universal testing machine Instron 1342 (Instron Corp, Norwood, MA, USA). A compliance method based on periodic partial unloading sequences was employed for continuous evaluation of crack extensions throughout the tests. The obtained data were subsequently used for the construction of J-R curves and the evaluation of fracture toughness in the form of a critical J-integral, J0.2. As a rule, stable crack propagation took place throughout each test, so that individual J0.2 values could be considered as a measure of ductile tearing resistance. After certain levels of crack extensions, the tests were terminated, and specimens were fractured at the temperature of liquid nitrogen.
Five representative specimens characterized by extreme variations of fracture toughness values J0.2 (marked as T1–T5 in Figure 1) were selected for detailed fractographic analysis. Additionally, metallographic samples were prepared from fractured halves of specimens denoted as T4 and T5. Each sample was prepared on a surface beneath the fracture surface, i.e., on a plane parallel to the crack plane. Microstructures were investigated using a light optical microscope Neophot 32 (Carl Zeiss AG, Oberkochen, Germany) and a scanning electron microscope JSM-IT500HR (JEOL, Tokyo, Japan) equipped with an energy dispersive X-ray spectrometer (EDX). Metallographic image documentation was collected using the backscattered electron detection COMPO mode of SEM, whereas the fractographic documentation was collected using the secondary electron detection mode.

3. Results

In Figure 1, the fracture toughness values of the second cladding plotted as a function of test temperature are shown. By analogy to the first cladding made from Sv 07Kh25N13 steel [8], the data exhibited an extreme scatter reaching one order of magnitude.
In Figure 2, one can see the force-displacement curves plotted for specimens characterized by different levels of fracture toughness. Crack length data were evaluated from the slopes of individual unloading sequences depicted in the figure using standardized formulas [11] and subsequently used to calculate corresponding J integral values constituting a J-R curve.
Compliance method is known to be prone to errors that can crucially affect J-R curve shapes and result in incorrect J0.2 data evaluation. Therefore, the first objective was to assess the reliability of J0.2 values. For this purpose, a well-established fractographic procedure was adopted from [8]: a standard 9-point optical (fractographic) measurement procedure [11] was adopted for the evaluation of the original crack length (a0) and the final physical crack length (ap) using SEM. The obtained values were compared with those evaluated from compliance. Thanks to heat tinting of fracture surfaces performed immediately after the termination of the fracture toughness tests, the crack length values could be validated further using a light optical microscope.
Fractographic measurements revealed errors in crack length data evaluated from compliance. Therefore, the compliance-based crack length data sets were corrected using a simple scaling procedure: the first data point was replaced by the true initial crack length value determined by the fractographic method. By analogy, the last data point was replaced by the true (fractographic) crack length value. A linear function defined by the two points was used to recalculate the intermediate data points as evaluated by compliance. This way of data scaling preserved relative proportionality between individual crack increments, as evaluated by the compliance method, so that information on the crack growth kinetics, i.e., possible transient crack growth accelerations or inhibitions, was preserved. Finally, J0.2 values were calculated from the corrected J-R curves (see Figure 3 for specimens T2, T3, T5) and plotted together with the original values in Figure 1.
Figure 1 demonstrates some discrepancies between the original data and the data after fractographic correction. At the same time, however, J0.2 values of all three specimens remained identical on a relative scale: the fracture toughness level of the T5 specimen remained extremely low. The T2 specimen could be characterized by an intermediate level of fracture toughness, about double the T5 level. Specimen T3 possessed the highest J0.2 value by far, reaching almost 2.5× higher than that of T2. It could be concluded that fracture toughness test results constituted a rigorous groundwork for current research.
Metallographic analysis indicated that the second cladding made from Sv 08Kh19N10G2B steel had a duplex austenitic-ferritic structure with a major portion of austenite, >90%. The structure was composed of solidification aggregates—solidification cells and dendrites. Consistently with previously investigated first cladding [8], significant variations in the morphology of cells and dendrites (shape, dimensions, level of continuity) were indicated at different distances from the welding substrate (see Figure 4): the cellular zone (CELZ) was identified in the vicinity of the cladded substrate, i.e., the first cladding made from Sv 07Kh25N13 steel. CELZ was followed by a transition zone (TRZ, Figure 4c,d) and a dendritic zone (DENZ) at a greater distance from the substrate (see Figure 4a,b).
More importantly, crucial variations in phase compositions of solidification aggregates were determined in individual structural zones. In general, solidification cells and dendrites were composed of residual delta ferrite and particles of secondary phases, mainly sigma phase particles. Individual phases were identified on the basis of typical amounts of alloying elements determined by EDX analysis:
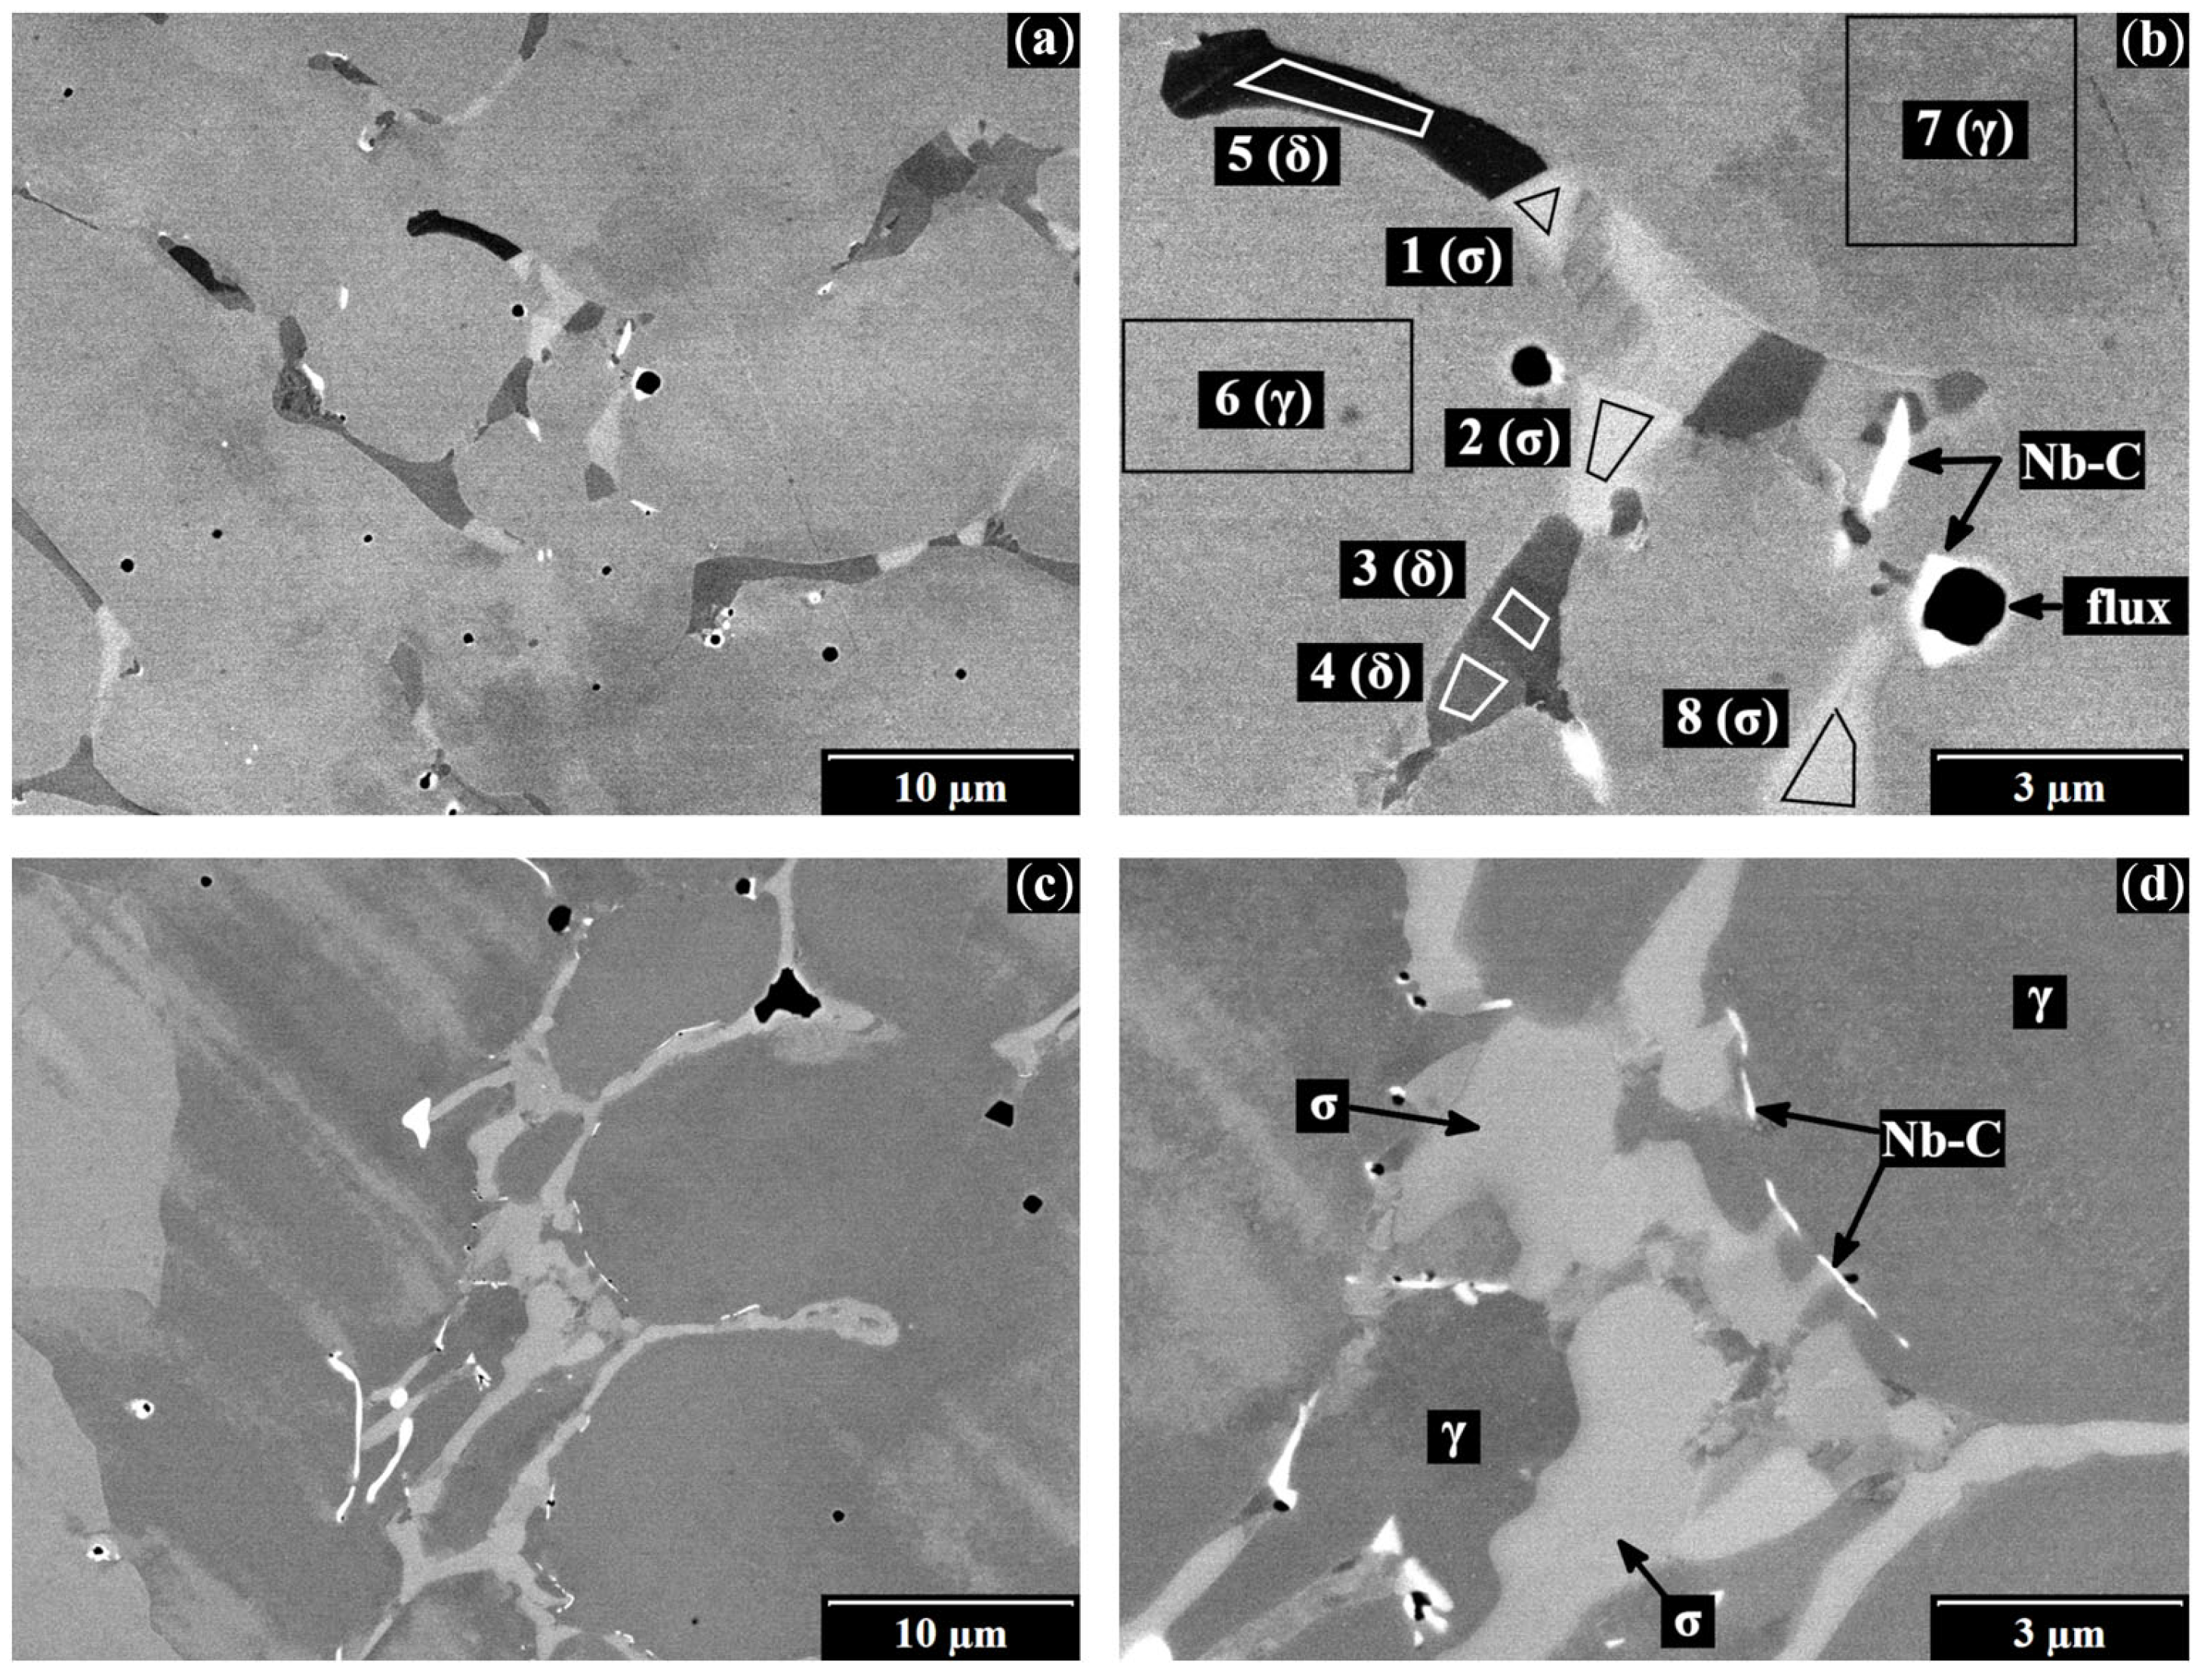
  • Delta ferrite was characterized by slightly elevated amounts of chromium (26 ÷ 28 wt. %, as opposed to the ca 20 wt.% typical of austenite) and local depletion of nickel (less than 2 wt.% in comparison with bulk content of 10 wt.% in austenite). Ferritic areas could be identified by dark contrast in SEM backscattered electron COMPO micrographs (Figure 4).
  • The sigma phase was highly enriched with chromium (36 ÷ 38 wt. %), as well as with silicon (up to 1.9 wt. %). The composition was consistent with CL1 and typical of this type of stainless steels [12].
  • Niobium carbides could be easily recognized by the brightest contrast caused by the high relative atomic number of niobium (Figure 4b,d). The carbides were found to decorate solidification aggregates and flux particles. Practically no niobium content was detected within ferritic areas and sigma particles.
Figure 4. Typical solidification aggregates in the area of crack propagation in the T4 specimen (a,b), a dendritic zone, DENZ, and in the T5 specimen (c,d), transition zone, TRZ. The former was characterized by sparsely distributed aggregates having relatively small dimensions, while the latter was characterized by large thick continuous aggregates, and the complete transformation of delta-ferrite into the sigma phase. The images were collected using the backscattered electron COMPO detection mode of SEM. EDX analysis was performed in sites 1–8 of the area in figure (b); corresponding data are listed in Table 2.
Metals 11 01676 g004
Fracture surfaces were subject to detailed fractographic analysis. Consistently with previously investigated first cladding [8], cracks always propagated by the mechanism of transgranular ductile fracture. The morphology of all parts of fracture surfaces was characterized by ductile dimples. However, crucial variations were found in micromorphologies of fractographic features in individual specimens:
  • Fracture surfaces of specimens with high ductile tearing resistance (T3, T4) were characterized by small ductile dimples (Figure 5) formed predominantly on some particles of submicronic dimensions, presumably chromium-enriched carbides typical of this type of steel [2].
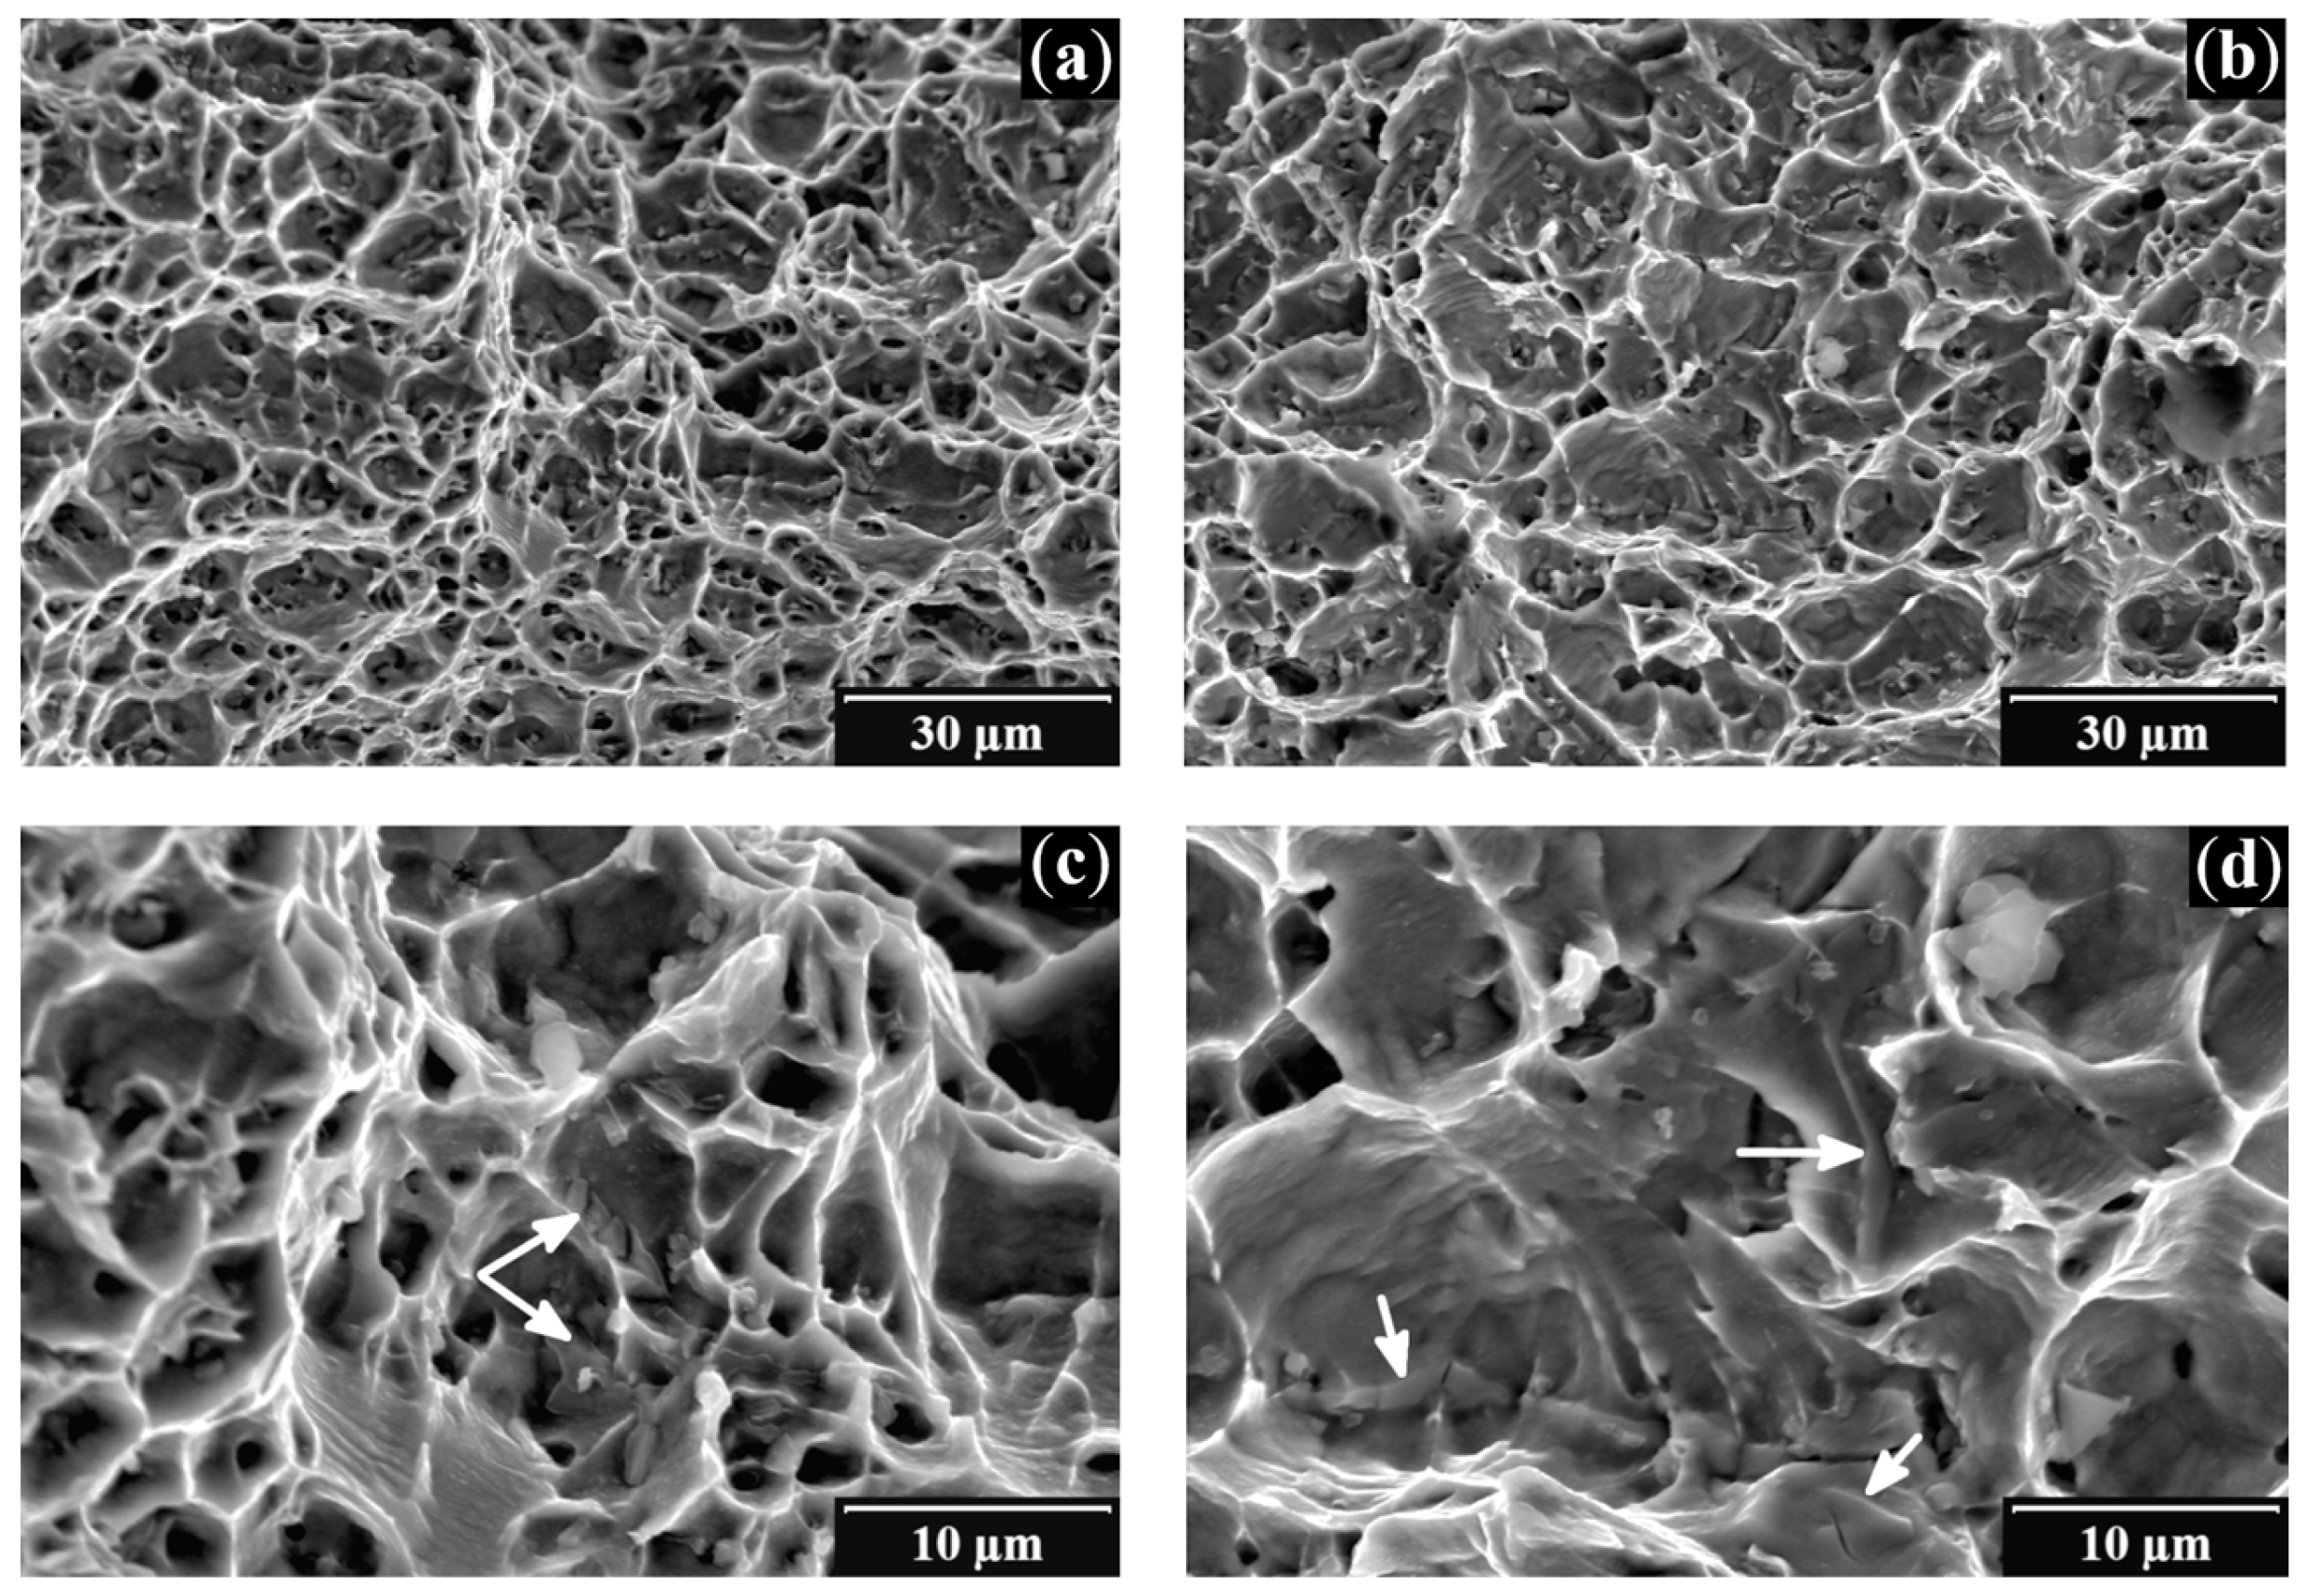
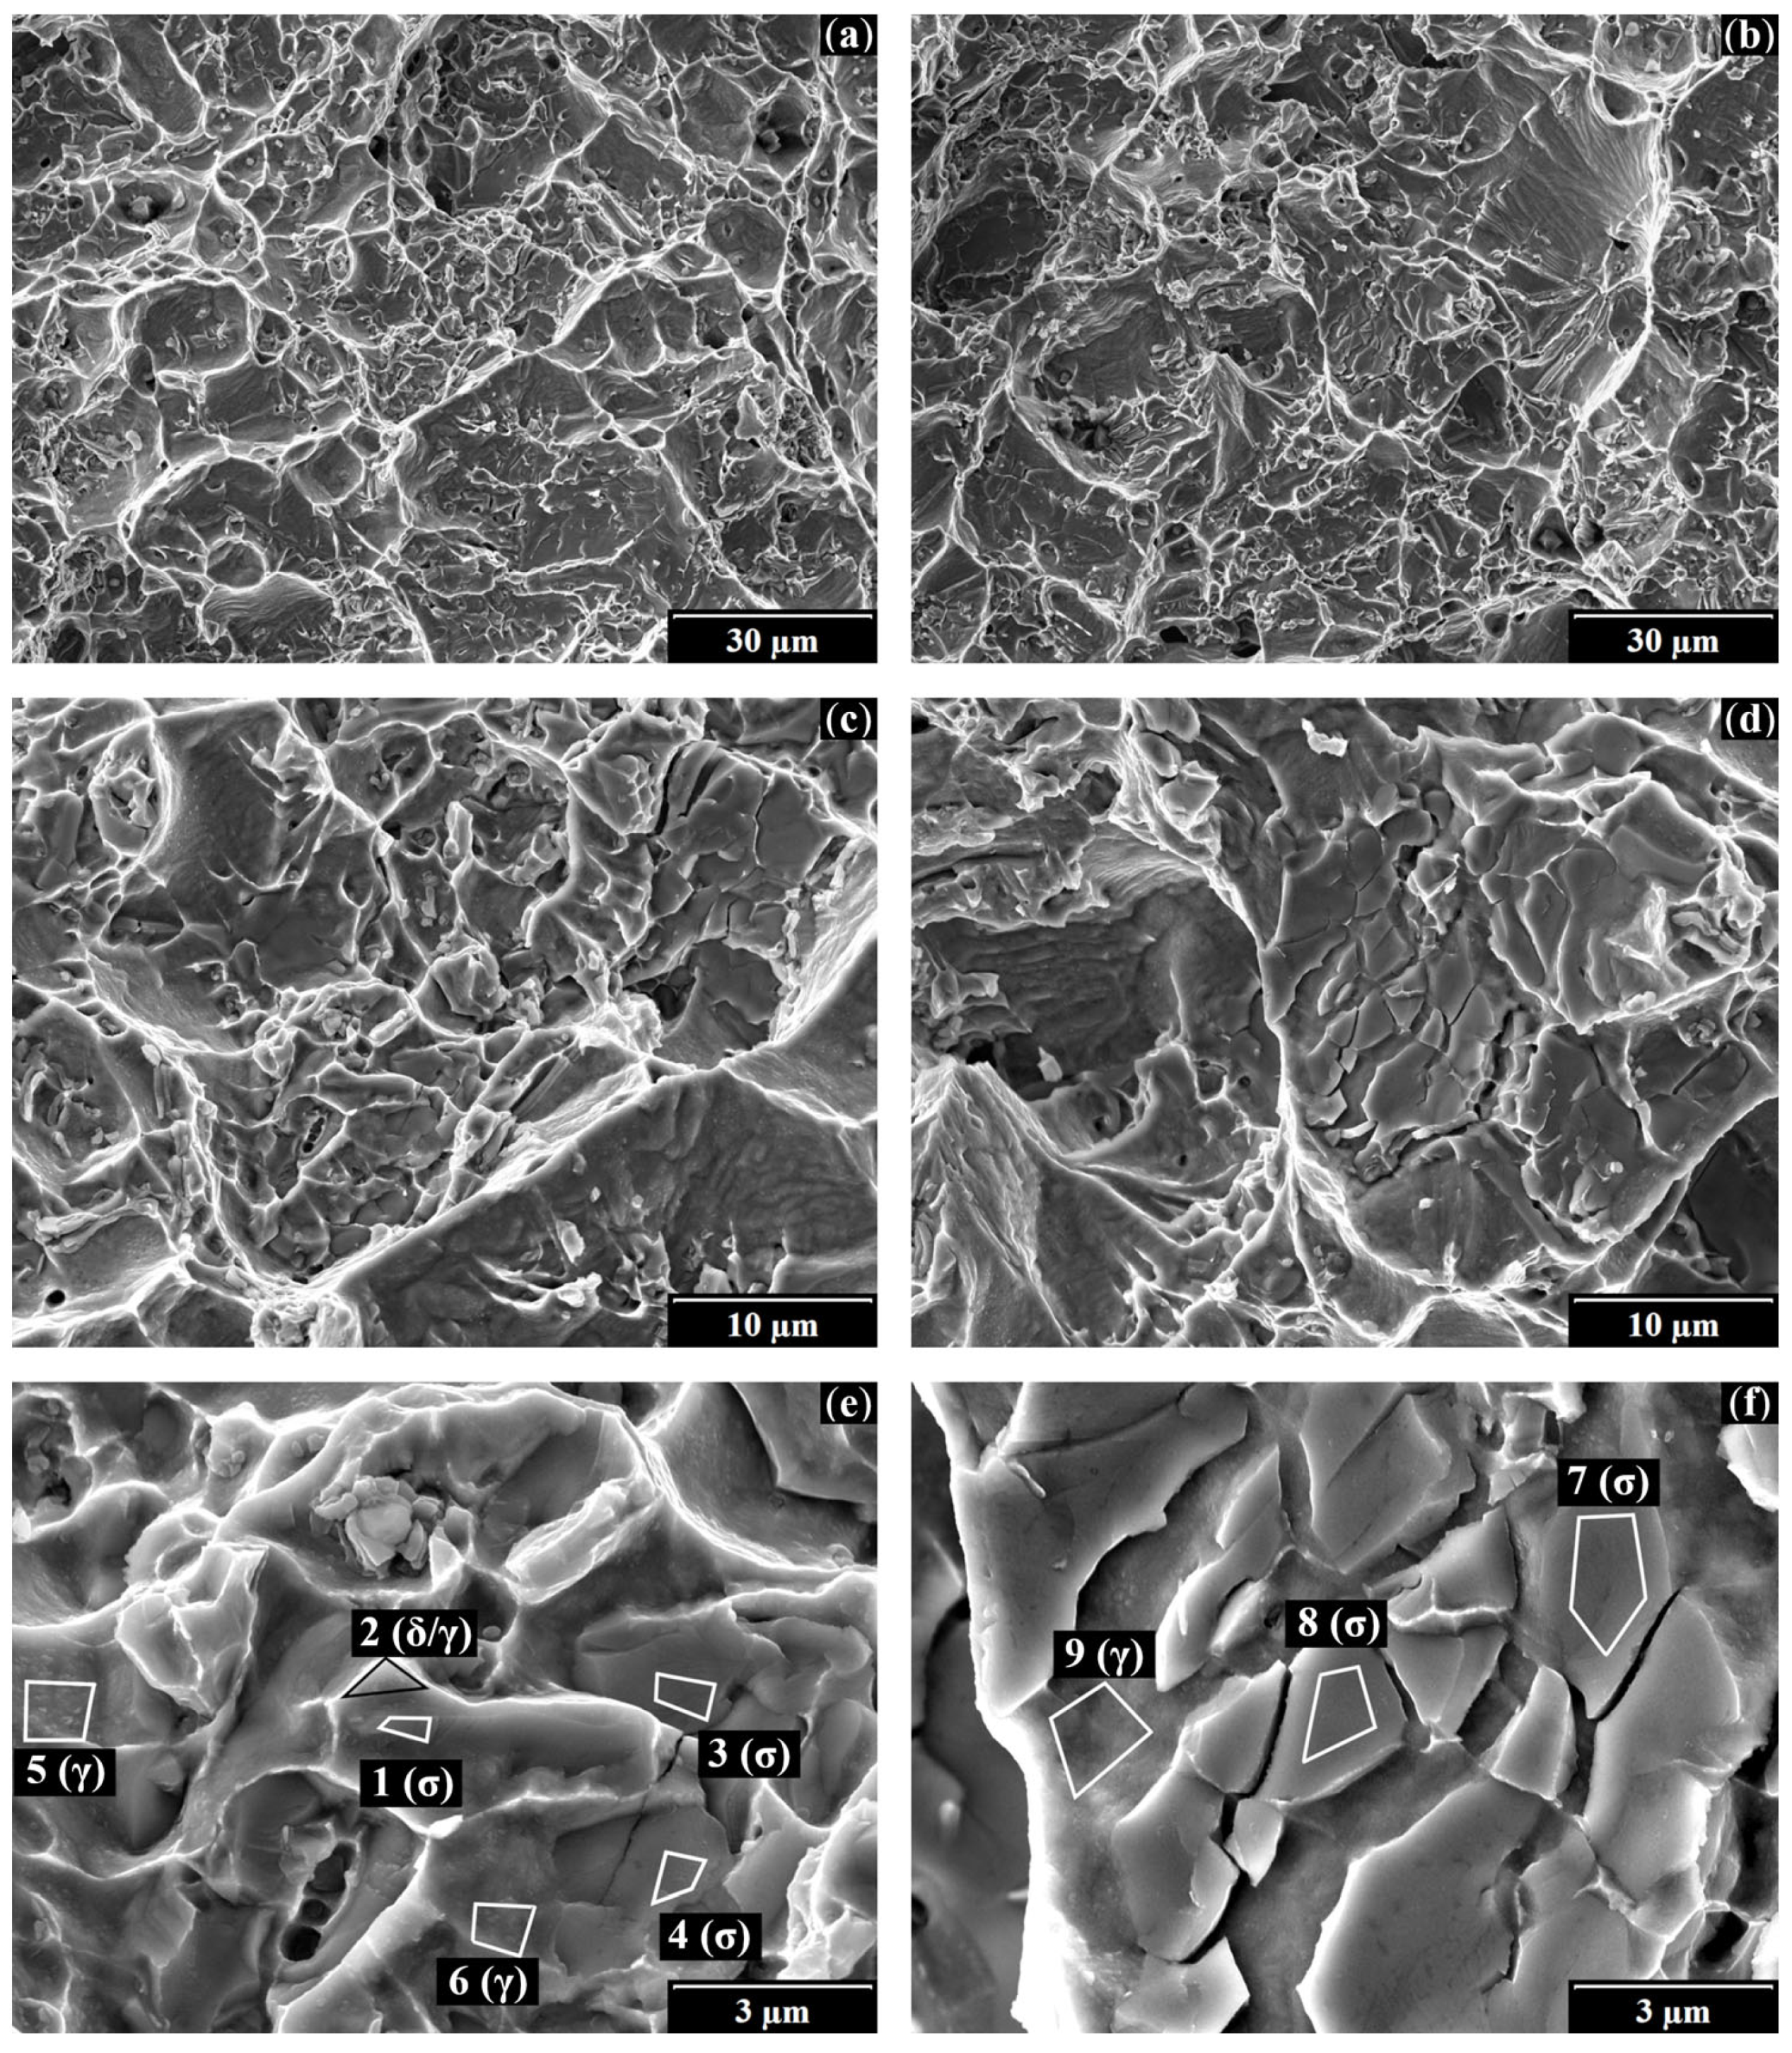
  • Fracture surfaces of specimens with low ductile tearing resistance (T1, T2, T5) were characterized by much larger ductile dimples and cavities. Detailed fractographic analysis identified large secondary particles cracked in an evidently non-ductile (brittle) manner (see Figure 6). Contents of alloying elements within the particles were evaluated by means of EDX analysis. Table 3 shows that the particles were always particularly enriched with chromium, as well as with silicon in some cases. Hence, the particles were identified as sigma phase forming segments of solidification aggregates.
The above stated fractographic observations were consistent with observations made on metallographic samples: on metallographic sample T5, large and thick segments of solidification cells and dendrites composed of brittle sigma phase were identified (see Figure 4c,d). As a result of high straining of the austenitic matrix, the segments easily cracked and decohered from the austenitic matrix, thereby contributing to the enhanced formation of ductile dimples and resulting in the remarkable decrease of ductile tearing resistance (J0.2). By contrast, a completely different local cladding structure was identified on T4 (see Figure 4a,b). Sparsely distributed fine solidification aggregates characterized by significantly lower sigma phase contents exhibited a substantially lower tendency for cracking (Figure 5c,d), and evidently made only limited impact on the ductile tearing resistance.

4. Discussion

This research provided important information on microstructure and failure mechanisms of WWER 440 RPV second cladding made from Sv 08Kh19N10G2B steel. The most important finding is consistent with that obtained previously for the first cladding made from Sv 07Kh25N13 steel [8]. It consists in the fact that the local ductile tearing resistance of cladding was fully determined by local parameters of solidification cells and dendrites in the area of crack propagation: whenever a crack propagated through an area characterized by an elevated portion of brittle sigma phase, the sigma-enriched segments of cells and dendrites were given to premature brittle cracking, thereby facilitating the formation of ductile dimples, manifesting in a considerable promotion of the crack propagation rate. In other words, crucial variations in the course of individual fracture toughness tests were determined by random placements of precrack tips. As an example, the transition zone (TRZ) in specimen T5 exhibited a very high tendency for the unfavorable behavior described above. The dendritic zone (DENZ) typical of the T4 specimen showed the opposite. These observations were consistent with those stated in CL1 [8], where TRZ also exhibited substantially less favorable characteristics in comparison with DENZ.
Clear interpretation of specimens T1–T3 is difficult due to missing metallographic analysis. Nevertheless, fractographic analysis confirmed the excellent consistency of the fracture surface appearance of specimen T1 with that of specimen T5, and the consistency of T3 with T4. This finding provides a satisfactory explanation for the relatively low and relatively high fracture toughness values determined for the specimens, respectively. A general conclusion could be drawn that the extreme scatter of fracture toughness values, J0.2, could be attributed to a combination of extreme structural heterogeneity and to the fortuity of precrack positions and orientations within individual test specimens.
Detailed selective EDX analysis indicated that the contents of alloying elements in sigma particles were highly consistent with those in CL1 [8]. Sigma particles were characterized by particular enrichment with chromium (ca 35 ÷ 40%) and silicon (up to 1.9%, in comparison to the bulk content of about 1%). This result is reasonable, because despite an excessive initial alloying of CL1 raw material (Sv 07Kh25N13), the final bulk composition of CL1 is practically identical to CL2 due to partial mixing with the RPV low-alloyed base metal [1,2]. The only substantial difference consists in 1% Nb content in CL2. Niobium could be easily recognized on micrographs obtained for metallographic samples with the backscattered electron mode of SEM: due to the very high atomic weight of niobium, Nb carbides were indicated as the brightest spots, and were found to decorate solidification aggregates and residual flux inclusions (Figure 4b,d). At the same time, however, EDX analysis confirmed the complete absence of niobium within the sigma phase and delta ferrite areas. Fractographic analysis provided no evidence of any direct impact of Nb on ductile tearing resistance.
Regardless of the above-mentioned similarities between the second and the first cladding, a remarkable difference consisted in the highest detected fracture toughness levels: the maximum J0.2 value reached only 211 kJm−2 for CL2, whereas several exceeded 300 kJm−2 for CL1 [8]. A plausible explanation of this fact may be the higher overall enrichment of solidification aggregates with sigma phase determined for metallographic samples of CL2. This presumption is also strengthened by the fact that even on the fracture surface of a highly tough specimen such as T4, isolated but distinct features of cracked sigma particles could be found (see Figure 5c,d). Rigorous verification of this hypothesis would require extremely detailed analysis of dimensions of ductile dimples—analysis which exceeds the scope of current research.
In order to improve fracture toughness of cladding, a question could arise whether the sigma phase formation might be mitigated by an appropriate selection of technological parameters. This task requires an understanding of sigma phase formation processes in duplex austenitic–ferritic stainless steels. The fast cooling of cladding layers after welding inevitably leads to the solidification aggregates formed being primarily constituted of delta-ferrite. Sigma phase is essentially formed by the decomposition of delta ferrite [13] during welding, as well as during post-weld heat treatment. Some studies indicate that sigma phase transformation can be effectively mitigated by a decreased heat input rate during welding [14,15,16], while others provide recommendations for the application of special welding atmospheres [17].
It should be noted, however, that the WWER cladding process itself is rather complicated, as it is performed simultaneously with the assembly of the whole RPV. A detailed description of the RPV manufacturing process, as well as the technological parameters, can be found in [18,19] and [20,21] for WWER 440 and WWER 1000, respectively. The manufacturing process can result in extreme variations of actual heat treatment intensities (specified by aging temperatures and aging times) within individual areas of RPV cladding. As the intensity of sigma phase formation depends heavily on local aging temperature and time, large variations of actual sigma phase contents at different regions need to be contended with. Consequently, variations in the local mechanical properties of cladding seem inevitable.

5. Conclusions

In this paper, the results of experimental research focused on the evaluation of fracture toughness tests of WWER 440 reactor pressure vessel austenitic cladding made from Sv 08Kh19N10G2B stainless steel were presented. The fractographic and metallographic approach successfully applied previously on the first cladding made from Sv 07Kh25N13 grade [8] was adopted. The following conclusions on the relationship between the local microstructure, the failure mode and the fracture toughness of the cladding were drawn:
  • The second cladding was characterized as a duplex austenitic-ferritic stainless steel with a dominant portion of austenite and a specific solidification structure constituted by cells and dendrites. Individual segments of solidification aggregates were composed of residual delta-ferrite, sigma phase and other secondary phases.
  • Extreme variations were indicated in the dimensions, distribution and phase composition of solidification aggregates at different distances from the welded substrate. Some areas were characterized by sparsely distributed aggregates having small dimensions and approximately balanced portions of ferrite and sigma phase, while others were characterized by large thick aggregates constituted almost exclusively by sigma phase.
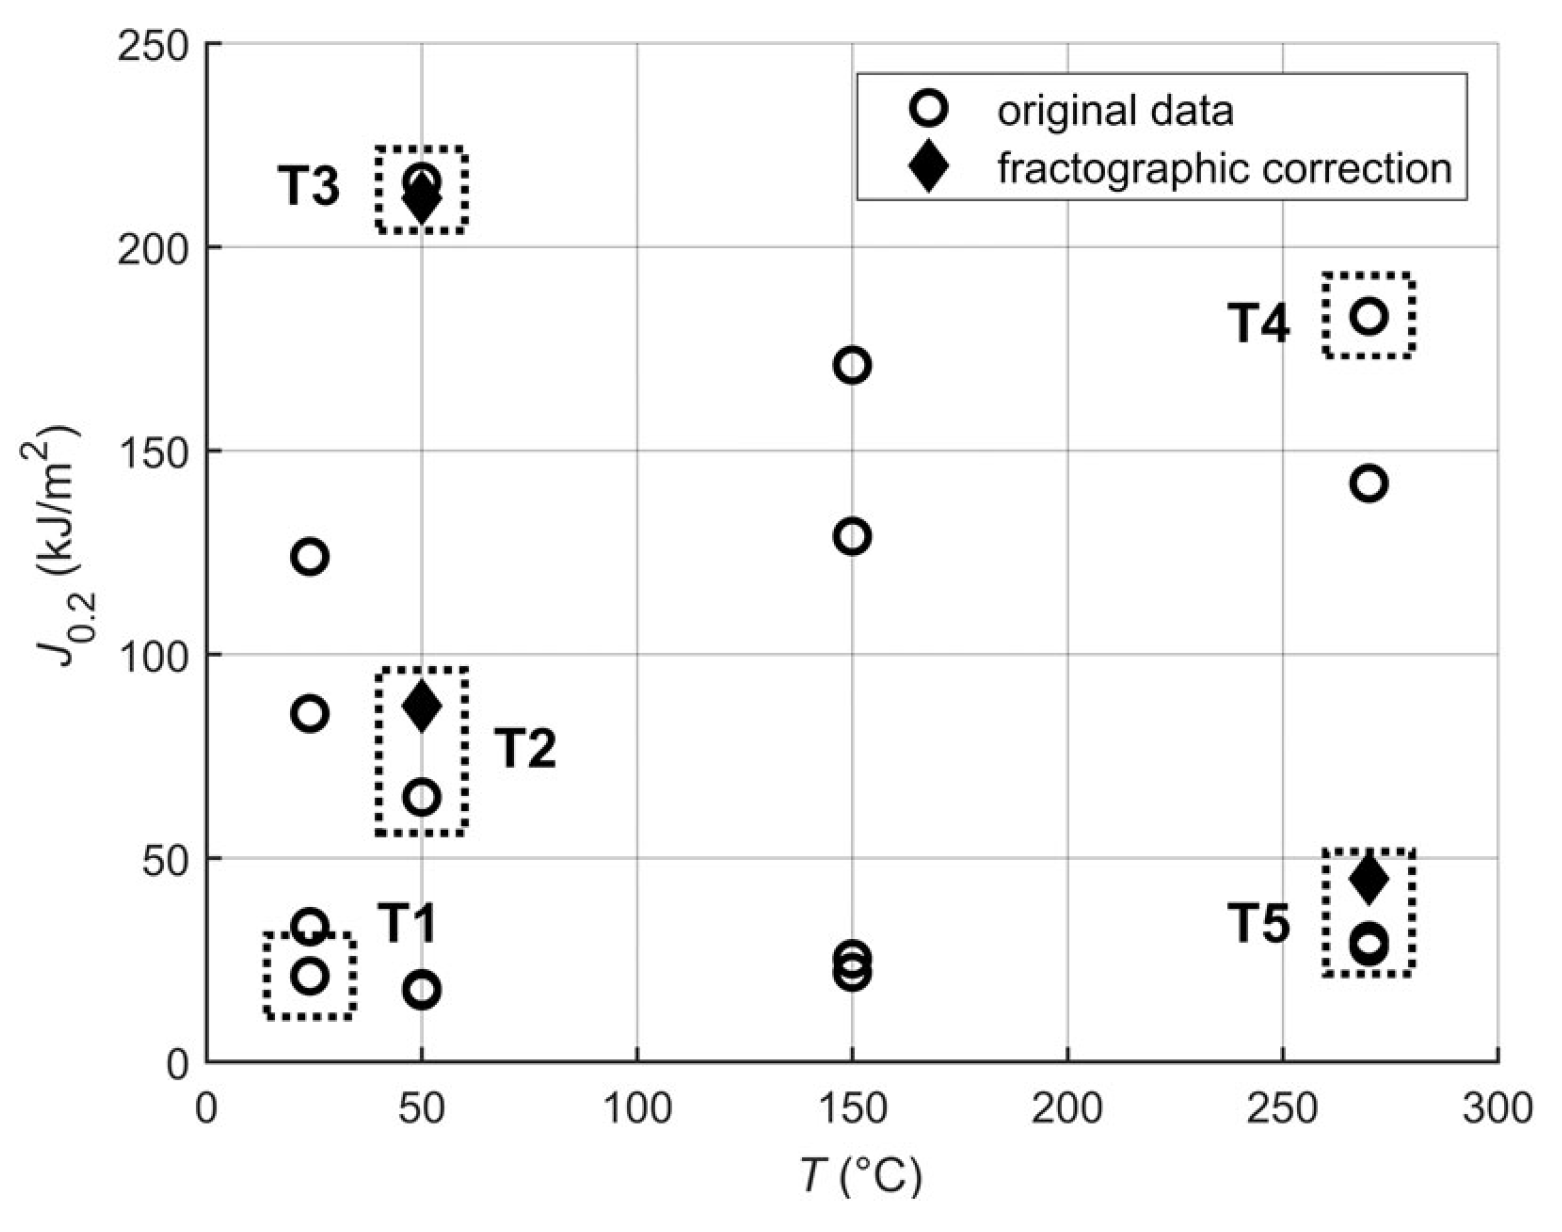
  • Local ductile tearing resistance of cladding was always fully determined by local parameters of solidification cells and dendrites in the area of crack propagation: whenever a crack propagated through an area characterized by an elevated portion of brittle sigma phase, the sigma-enriched segment of cells and dendrites were given to premature brittle cracking, and thereby facilitated the formation of ductile dimples, which manifested itself in a considerable promotion of crack growth rate. A general conclusion could be drawn that the extreme scatter of fracture toughness values, J0.2, might be attributed to a combination of the extreme heterogeneity of the cladding and the fortuity of precrack positions and orientations within individual test specimens.

Author Contributions

Formal analysis, M.F.; investigation, J.Š., R.K. and J.A.; methodology, J.S.; visualization, J.Š.; writing—original draft, J.Š.; writing—review and editing, J.S. and R.K. All authors have read and agreed to the published version of the manuscript.

Funding

This project was partially supported by the European Regional Development Fund under Grant No. CZ.02.1.01/0.0/0.0/15_003/0000493—Centre of Excellence for Nonlinear Dynamic Behaviour of Advanced Materials in Engineering (CeNDYNMAT) with institutional support RVO: 61388998.

Data Availability Statement

Data made available from Mendeley repository: doi:10.17632/rxcb6zpswj.2.

Conflicts of Interest

The authors declare no conflict of interest.

Abbreviations

BMBase metal
CL1First cladding
CL2Second cladding
CELZCellular zone
DENZDendritic zone
RPVReactor pressure vessel
SEMScanning electron microscope
TRZTransition zone between CELZ and DENZ

References

  1. Gillemot, F. Overview of Reactor Pressure Vessel Cladding. Int. J. Nucl. Knowl. Manag. 2010, 4, 265–278. [Google Scholar] [CrossRef]
  2. Gillemot, F.; Horváth, M.; Úri, G.; Fekete, T.; Houndeffo, E.; Acosta, B.; Debarberis, L.; Viehrig, H.W. Radiation Stability of WWER RPV Cladding Materials. Int. J. Press. Vessel. Pip. 2007, 84, 469–474. [Google Scholar] [CrossRef]
  3. Guidelines on Pressurized Thermal Shock Analysis for WWER Nuclear Power Plants; IAEA-EBP-WWER-08; IAEA: Vienna, Austria, 2006.
  4. Viehrig, H.W.; Altstadt, E.; Houska, M. Radiation Response of the Overlay Cladding from the Decommissioned WWER-440 Greifswald Unit 4 Reactor Pressure Vessel. Nucl. Eng. Des. 2015, 286, 227–236. [Google Scholar] [CrossRef]
  5. Zarazovskii, M.; Dubyk, Y. Open Issues in PTS Assessment of WWER RPVs. Procedia Struct. Integr. 2019, 22, 305–312. [Google Scholar] [CrossRef]
  6. Trampus, P. Pressurized Thermal Shock Analysis of the Reactor Pressure Vessel. Procedia Struct. Integr. 2018, 13, 2083–2088. [Google Scholar] [CrossRef]
  7. Chen, M.; Yu, W.; Qian, G.; Shi, J.; Cao, Y.; Yu, Y. Crack Initiation, Arrest and Tearing Assessments of a RPV Subjected to PTS Events. Ann. Nucl. Energy 2018, 116, 143–151. [Google Scholar] [CrossRef]
  8. Štefan, J.; Siegl, J.; Adámek, J.; Kopřiva, R.; Kytka, M. Failure Behaviour of Cladding Made from Sv 07Kh25N13 Austenitic Stainless Steel. Int. J. Press. Vessel. Pip. 2021, 189, 104275. [Google Scholar] [CrossRef]
  9. Guidelines for Prediction of Irradiation Embrittlement of Operating WWER-440 Reactor Pressure Vessels; IAEA: Vienna, Austria, 2005.
  10. Gosatomnadzor of Russia. Equipment and Piping of Nuclear Power Installations. Weld Joints and Weld Overlays. Rules of Inspection; PNAE G-7-010-89; Gosatomnadzor of Russia: Moscow, Russia, 2000.
  11. ASTM International. Standard Test Method for Measurement of Fracture Toughness; ASTM E 1820-99; ASTM: West Conshohocken, PA, USA, 1999. [Google Scholar]
  12. Vitek, J.M.; David, S.A. The Sigma Phase Transformation in Austenitic Stainless Steels. Weld. J. 1986, 65, 106–111. [Google Scholar]
  13. Hsieh, C.-C.; Wu, W. Overview of Intermetallic Sigma (σ) Phase Precipitation in Stainless Steels. ISRN Metall. 2012, 2012, 16. [Google Scholar] [CrossRef]
  14. Lee, J.S.; Kim, I.S.; Jang, C.H.; Kimura, A. Irradiation Embrittlement of Cladding and HAZ of RPV Steel. Nucl. Eng. Technol. 2005, 38, 405–410. [Google Scholar]
  15. Kim, I.S.; Lee, J.S.; Kimura, A. Embrittlement of ER309L Stainless Steel Clad by σ-Phase and Neutron Irradiation. J. Nucl. Mater. 2004, 329–333, 607–611. [Google Scholar] [CrossRef]
  16. Lee, J.S.; Kim, I.S.; Kasada, R.; Kimura, A. Microstructural Characteristics and Embrittlement Phenomena in Neutron Irradiated 309L Stainless Steel RPV Clad. J. Nucl. Mater. 2004, 326, 38–46. [Google Scholar] [CrossRef]
  17. Hsieh, C.C.; Lin, D.Y.; Chang, T.C. Microstructural Evolution during the δ/σ/γ Phase Transformation of the SUS 309LSi Stainless Steel after Aging under Various Nitrogen Atmospheric Ratios. Mater. Sci. Eng. A 2008, 475, 128–135. [Google Scholar] [CrossRef]
  18. Timofeev, B.T.; Karzov, G.P. Assessment of the WWER-440/V-213 Reactor Condition. Int. J. Press. Vessel. Pip. 2006, 83, 216–226. [Google Scholar] [CrossRef]
  19. Timofeev, B.T.; Karzov, G.P.; Blumin, A.A.; Anikovsky, V.V. Fracture Toughness of 15X2MFA Steel and Its Weldments. Int. J. Press. Vessel. Pip. 2000, 77, 41–52. [Google Scholar] [CrossRef]
  20. Timofeev, B.T.; Karzov, G.P. Assessment of the WWER-1000 Reactor Condition. Int. J. Press. Vessel. Pip. 2006, 83, 464–473. [Google Scholar] [CrossRef]
  21. Timofeev, B.T.; Blumin, A.A.; Anikovsky, V.V. Fracture Toughness of 15X2HMFA Steel and Its Welds. Int. J. Press. Vessel. Pip. 1997, 74, 165–172. [Google Scholar] [CrossRef]
Figure 1. Results of static fracture toughness tests. Specimens T1–T5 selected for detailed metallographic and fractographic analysis are enveloped.
Metals 11 01676 g001
Figure 2. Force-displacement test records for selected specimens.
Metals 11 01676 g002
Figure 3. J-R curves of selected specimens after fractographic correction of crack growth data. Parameters of J-R curves reflect the force-displacement records in Figure 2.
Metals 11 01676 g003
Figure 5. Fractographic features identified in two sites ((a,c) and (b,d)) of the fracture surface of the T4 specimen characterized by relatively high ductile tearing resistance, J0.2: Micromorphology of classical ductile dimple fracture. Features of sparsely distributed cracked secondary particles could be identified on the fracture surface (marked by arrows in figures (c,d)).
Metals 11 01676 g005
Figure 6. Fractographic features identified in two sites ((a,c,e), and (b,d,f)) of specimen T5 characterized by a very low ductile tearing resistance, J0.2. At low magnifications (a,b), the overall fracture surface appearance resembled that of specimen T4 (Figure 6). At elevated magnifications (c,d), numerous particles cracked in an evidently brittle manner were recognized. The contents of elements within particles were found to be consistent with areas identified as sigma phase on metallographic samples. The results of EDX analysis are listed in Table 3.
Metals 11 01676 g006
Table 1. Contents of alloying elements in individual cladding layers of WWER 440 RPV (wt. %) [10].
MaterialCSiMnCrNiNbSP
Sv 07Kh25N13
(first cladding)
max.
0.09
0.3
1.2
0.8
2.0
22.0
26.5
11.0
14.0
-max.
0.020
max.
0.030
Sv 08Kh19N10G2B
(second cladding)
max.
0.10
max.
1.0
1.3
2.2
17.5
20.5
8.0
11.0
0.7
1.2
max.
0.020
max.
0.030
Table 2. Results of EDX analysis performed in sites 1–8 depicted in Figure 4b: Amounts of relevant elements in wt.%, and identification of phases.
NoFeCrNiMnSiIdentification
156.138.32.51.61.6Sigma phase
255.736.54.81.21.8Sigma phase
370.027.61.30.30.9Delta ferrite
468.127.31.71.81.1Delta ferrite
569.726.11.21.71.2Delta ferrite
667.619.010.12.50.9Austenite
768.520.28.61.90.9Austenite
857.838.10.22.01.9Sigma phase
Table 3. Results of EDX analysis performed in sites 1–9 depicted in Figure 6: Amounts of relevant elements in wt. %, and identification of phases.
NoFeCrNiMnSiIdentification
161.832.73.41.11.1Sigma phase
269.921.95.61.61.1Ferrite/austenite (unclear)
359.733.93.41.41.7Sigma phase
459.734.42.51.61.8Sigma phase
565.821.410.11.81.0Austenite
664.525.08.31.21.0Austenite
759.633.24.81.31.1Sigma phase
860.132.84.41.41.4Sigma phase
967.420.29.61.81.0Austenite
Publisher’s Note: MDPI stays neutral with regard to jurisdictional claims in published maps and institutional affiliations.

