Article

Influence of Cross-Wind on CO2 Arc Welding of Carbon Steel

1
Joining and Welding Research Institute, Osaka University, Osaka 567-0047, Japan
2
DAIHEN Corporation, Hyogo 658-0033, Japan
3
OTC DAIHEN Asia Co., Ltd., Pathumthani 12120, Thailand
4
Department of Welding Engineering and Metal’s Technology, Hanoi University of Science and Technology, Hanoi 100-000, Vietnam
*
Author to whom correspondence should be addressed.
Metals 2021, 11(11), 1677; https://doi.org/10.3390/met11111677
Submission received: 16 September 2021 / Revised: 13 October 2021 / Accepted: 16 October 2021 / Published: 21 October 2021

Abstract

:
The purpose of this study is to develop a novel welding torch with high wind resistance, which can be used for welding outside a building under strong cross-wind. In this paper, a parametric study was carried out using different torch nozzle designs and shield gas flow rates for their optimization. The gas flow around the torch nozzle exit was visualized through the shadowgraph method to evaluate the interaction between the shielding gas flow and the cross-wind. Nitrogen fraction in a weld bead was measured for confirming the shielding effect. Furthermore, CFD simulation was also carried out for obtaining shielding gas flow velocity at the torch nozzle exit. From the result of the above experiments and simulation, effective parameters for improving the shielding effect against the cross-wind were comprehensively discussed. As a result, the nitrogen fraction was found to be decreased by increasing the averaged vertical gas velocity at the torch nozzle exit. For achieving this, it is especially effective to decrease the nozzle diameter or increase the gas flow rate.

1. Introduction

Gas Tungsten Arc Welding (GTAW) and Gas Metal Arc Welding (GMAW) are called gas-shielded arc welding [1,2] and can be applied to advanced materials joining [3,4]. In this welding process, a shielding gas such as argon gas or CO2 gas is introduced to the arc discharge region to prevent inclusion of the surrounding air into the molten metal produced by the arc heat input [5]. In order to maintain the toughness of the weld metal, it is indispensable to prevent the inclusion of nitrogen gas caused by shielding failure [6]. The most important factor to reduce this shielding ability is the wind occurring in the welding environment [7], which is a particular problem when welding is carried out outside of a building. Accordingly, improvement of the shielding ability is one of the most important issues in gas-shielded arc welding.
Regarding the improvement of shielding ability in the gas-shielded arc welding, research is conducted mainly using visualization of gas flow and computational fluid dynamics (CFD) simulation as tools. Dreher et al. proposed a method for visualizing the shield gas flow and analyzing the amount of oxygen brought to the molten pool from the surrounding air through the arc with the aim of improving the shielding ability of GMAW of aluminum [8]. The gas flow pattern was analyzed in detail by CFD simulation, and the validity of the simulation results was verified through visualization of gas flow by Particle Image Velocimetry and the Schlieren-technique. The shielding ability was evaluated by the oxygen concentration on the surface of the base metal measured by the lambda sensor principle. Through the study using this advanced visualization system, a torch design with high shielding ability was proposed. Suzuki et al. examined the effect of cross-wind on wind-toughness in GMAW by Schlieren observation [9]. In this study, cross-wind with a wind speed of 2 m/s or less was used. By the Schlieren observation, it was achieved to visualize the behavior of the crosswind in the vicinity of the arc. It has been shown that the cross-wind bends the laminar gas flow region, creating a path for the atmosphere to enter the arc. Cai et al. proposed a novel gas nozzle shape that can improve the shielding ability of narrow-gap laser-metal inert gas (MIG) hybrid welding by CFD simulation [10]. It was shown that by using the square-outlet nozzle with boss or circle-outlet nozzle with boss, a sound weld without porosity can be formed. In recent years, Pie et al. designed three spiral-diffusion nozzles with different structures through CFD simulations with the aim of reducing the amount of shield gas used in GMAW in a cross-wind environment and improving welding quality [11]. These nozzles were prototyped by 3D printing with 304 stainless steel and used in welding experiments. As a result of evaluation by strength test and impact test, the optimum nozzle design was proposed. In most previous studies, the cross-wind velocity was assumed to be approximately 2~3 m/s at the maximum, supposing welding inside a building.
The purpose of this study is to develop a novel welding torch with high wind resistance, which can be used for welding outside a building under a strong cross-wind environment exceeding 5 m/s. In this paper, a parametric study is carried out using different torch nozzle designs and shield gas flow rates for their optimization. The gas flow around the torch nozzle exit is visualized through the shadowgraph method to evaluate the interaction between the shielding gas flow and the cross-wind. After welding, nitrogen fraction in a weld bead is measured for confirming the shielding effect. Furthermore, CFD simulation is also carried out for obtaining shielding gas flow velocity at the torch nozzle exit. From the result of the above experiments and simulation, effective parameters for improving the shielding effect against the cross-wind are comprehensively discussed.

2. Experimental Method

2.1. Common Experimental Condition

In this subsection, common experimental condition for shadowgraph observation and nitrogen fraction measurement is described. In the shadowgraph observation, the observation is carried out without igniting the arc as explained in the subsequent subsection.
A commercial welding torch with high wind resistance (WTCT-5073, DAIHEN Corporation, Hyogo, Japan) is used for the experiment. This torch is used for the strong wind (5–10 m/s) like outdoors. The appropriate shielding gas flow rate for the torch is very high (above 80 L/min). In standard indoor usage, the gas flow rate is generally set around 20–30 L/min for avoiding turbulent flow to enhance the diffusion of the surrounding gas into the shielding gas region. However, in outdoor usage, it is necessary to increase the gas flow rate even if the generation of turbulent flow is allowed. This is because it is primarily important for the shielding gas to cover the molten pool surface to ensure the shielding ability. Figure 1 shows a schematic of the welding torch design. In this study, three levels of the nozzle length, the nozzle diameter and the orifice number, orifice diameter are used for a parametric study. The design parameters of the welding torch are summarized in Table 1. The nozzle length is 36, 47 or 58 mm with 47 mm as the standard condition. The nozzle diameter is 13, 16 or 19 mm with 16 mm as the standard condition. The orifice number is 1 × 8, 2 × 8 or 3 × 8 with 2 × 8 as the standard condition. Here, “2 × 8” indicates that 8 orifices in each row and there are 2 rows (in total, 16 orifices). The orifice diameter is 1.5, 2.0 or 2.5 mm with 2.0 mm as the standard condition.
The contact tip-to-work distance (CTWD) is fixed at 20 mm. The shielding gas composition is CO2 and is introduced at a flow rate of 50, 70 or 90 L/min with 70 L/min as the standard condition. The cross-wind is produced using a wind blower (YF-457A(K), YUASA PRIMUS CO.,LTD., Tokyo, Japan) and its velocity is 5 m/s. Actually, in the applicable range (5–10 m/s) of the wind resistance torch, we selected 5 m/s for the test. This is because the wind velocity produced by the wind blower is stable at 5 m/s, and the variation of nitrogen fraction in the wind resistance test is little as a result. The appropriate range of gas flow rate at 5 m/s is 80–100 L/min, but the gas flow rate is changed 50, 70 or 90 L/min in this experiment for aiming a strict condition for wind resistance. This is for making the influence of the torch specification noticeable.

2.2. Shadowgraph Observation

Figure 2 shows a schematic of the shadowgraph experiment to visualize the gas flow pattern around the torch nozzle exit. The cross-wind, whose direction is perpendicular to the welding direction, is produced using the wind blower. The experiment is carried out without igniting the arc.
In the shadowgraph experiment, a laser-assisted high-speed camera system consisting of a pulsed laser unit with a wavelength of 640 nm (Cavilux HF system, Cavitar, Tampere, Finland) and a high-speed camera (Memrecam Q1v, Nac Image Technology, Tokyo, Japan) equipped with a bandpass filter for a wavelength of 640 nm is used [12]. An object lens (Micro-NIKKOR, Nikon, Tokyo, Japan) with a focal length of 200 mm and a 1/4 focus ratio is also used. The aperture value is f/22. The observation is carried out at a frame rate of 4000 fps and an exposure time of 20 μs. The pulsed laser is irradiated to the gas flow from the welding direction to produce the shadowgraph image on the screen installed behind the torch. The shadowgraph image on the screen is recorded with the high-speed video camera. Table 2 presents the observation condition.

2.3. Nitrogen Fraction Measurement

The nitrogen fraction in the weld bead after welding is measured for evaluating the shielding effect. A welding power source (DP-350, DAIHEN Corporation, Hyogo, Japan) equipped with a wire feeder is operated in the Direct Current Electrode Positive (DCEP) mode. The bead-on-plate welding is conducted on mild steel (SS400–JIS G 3101) plates with dimensions of 300 mm × 100 mm × 9 mm. The welding torch is fixed. The base metal is moved at a constant speed of 5 mm/s using an actuator. The welding current is 280 A and the welding voltage is 30 V. Table 3 presents the welding condition.
Figure 3 shows a schematic of sampling points for nitrogen fraction measurement. The yellow parts in the figure are the sampling points. First, the weld bead above a height of 2 mm is removed. Next, the samplings are performed at the center of the weld bead, 50 mm in front, and 50 mm in back. From three samples, a standard deviation and an averaged value of the nitrogen fraction are calculated for each condition. The measurement method of nitrogen fraction was based on the “Thermal conductimetric method after fusion in a current of inert gas” [13].

3. Simulation Model

The numerical simulation is also carried out for theoretical investigation. The simulation is conducted using ANSYS Fluent 18.1 (Ansys, Inc., Canonsburg, PA, USA).
Figure 4 shows a schematic of a 3D simulation region with a width X of 50 mm, a length Y of 100 mm, and a height Z of 79 mm. A plane symmetrical region is assumed and only one side of the region is calculated for decreasing the computational load. The mesh size is non-uniform and approximately 0.1 mm at a minimum. The CTWD is 20 mm. The welding torch region is defined according to that used in the experiment. As shown in Table 1, three levels of the nozzle length, the nozzle diameter, the orifice number, and the orifice diameter are used.
The shielding gas is CO2 at 300 K and introduced at the flow rate of 50, 70 or 90 L/min from a mass-flow-inlet defined on the top boundary inside the torch. The cross-wind of 5 m/s is given at a velocity-inlet defined on the positive Y side boundary. The negative Y and positive X side boundaries are a pressure-outlet. The negative X-side boundary is the symmetrical plane. The bottom boundary corresponds to the base metal surface, so is defined as a wall boundary.
The gas flow velocity distribution is calculated by solving time-dependent conservation equations of mass, momentum, and energy presented below. The shear stress transport (SST) κ-ω turbulence model [14] is used for the calculation. The mass density is calculated as an ideal gas. The thermodynamic and transport properties of CO2 gas are calculated [15,16,17] under the local thermodynamic equilibrium assumption [18].
Mass conservation:
ρ   u = 0
Momentum conservation:
ρ   u u = p + τ + ρ g
Energy conservation:
ρ h p ρ + u 2 2 + p u = k T
where ρ is the mass density, u is the velocity, p is the pressure, τ is the viscosity, g is the gravity, h is the enthalpy, k is the thermal conductivity, T is the temperature. Second order upwind method is selected for spatial discretization. For the pressure-velocity coupling, the SIMPLE scheme is used.

4. Results and Discussion

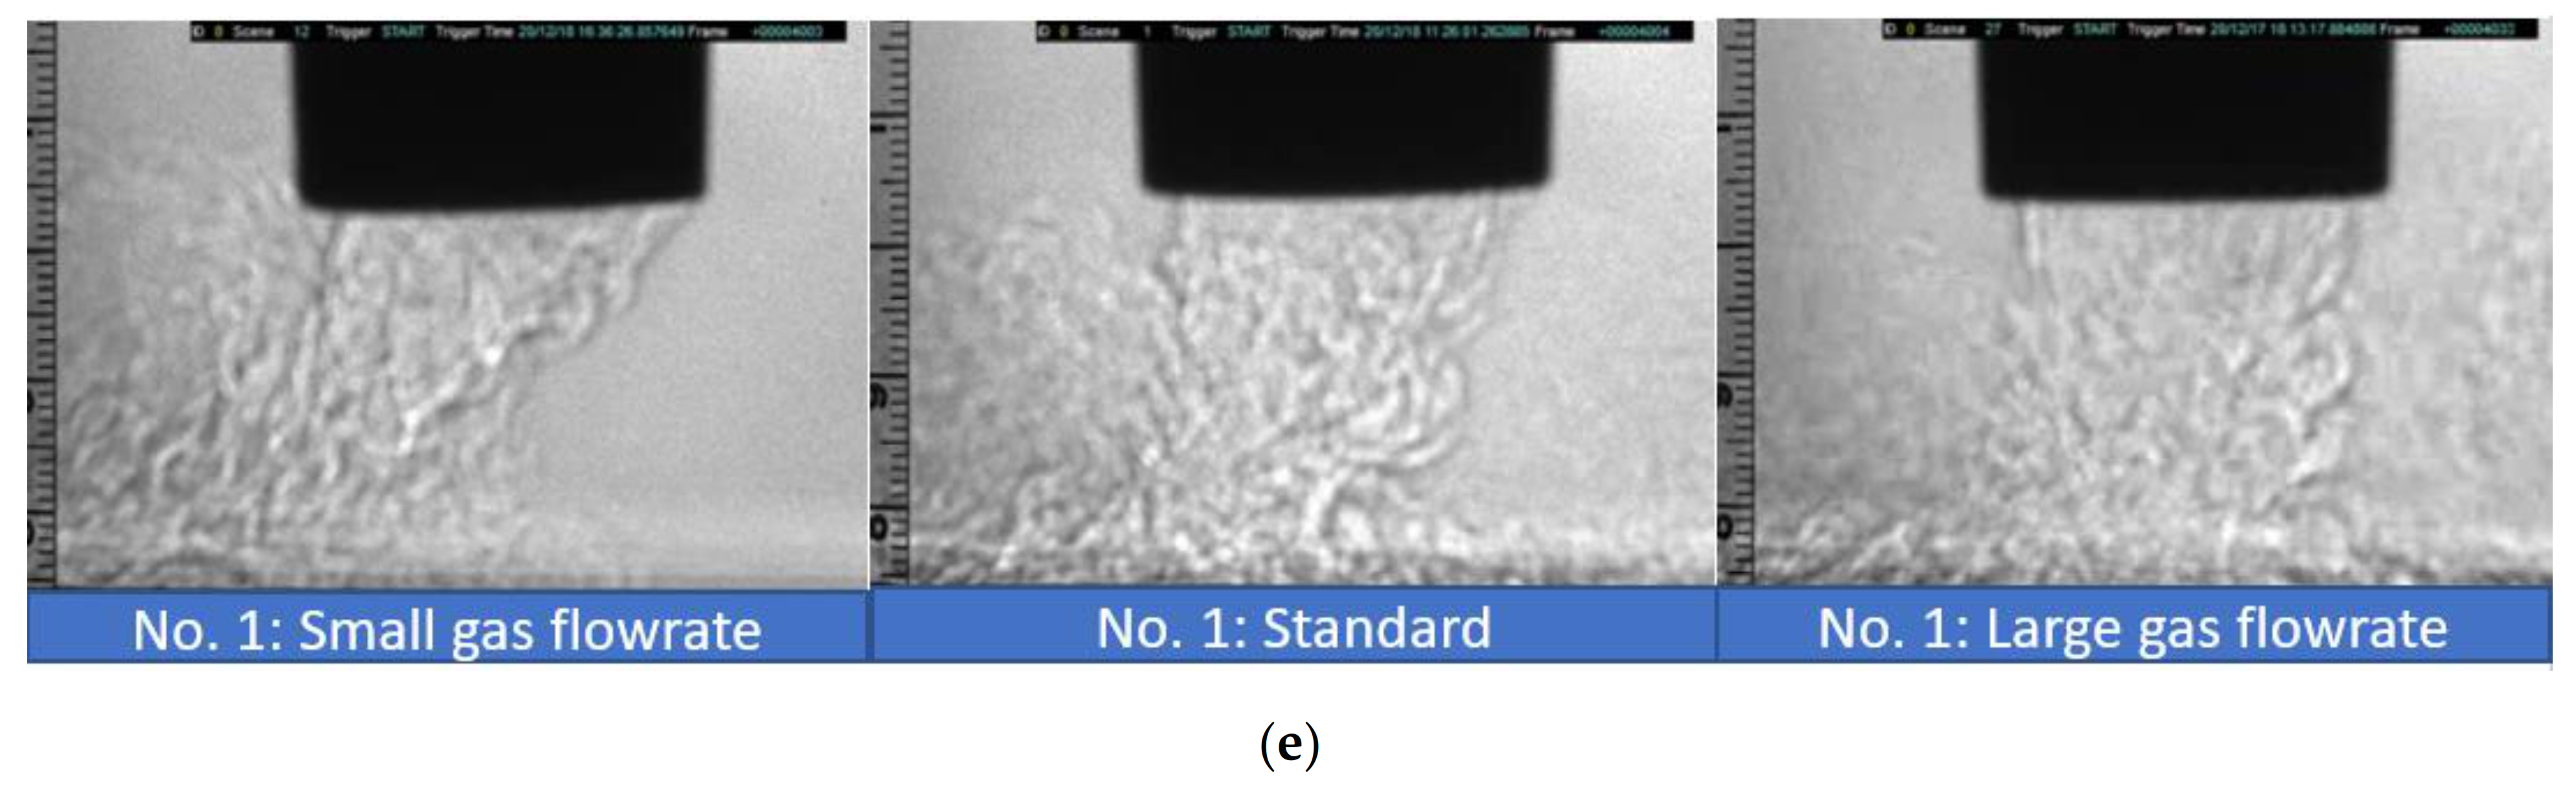
4.1. Shadowgraph Observation

Figure 5 shows the results of the shadowgraph observation. Figure 5a compared design numbers 1, 2, and 3 in Table 1 to present the influence of nozzle length. The gas flow was seen to be slightly bent by the cross-wind when the nozzle length was long. Figure 5b similarly presents the influence of nozzle diameter. The gas flow was swept away in a larger nozzle diameter. Figure 5c,d present the influence of orifice number and orifice diameter, respectively. The gas flow was found to be very slightly bent for smaller orifice number and diameter. Figure 5e presents the influence of gas flow rate. The gas flow was swept away for a smaller gas flow rate. From the above result, the smaller nozzle diameter and the larger gas flow rate are predicted to improve the shielding effect.

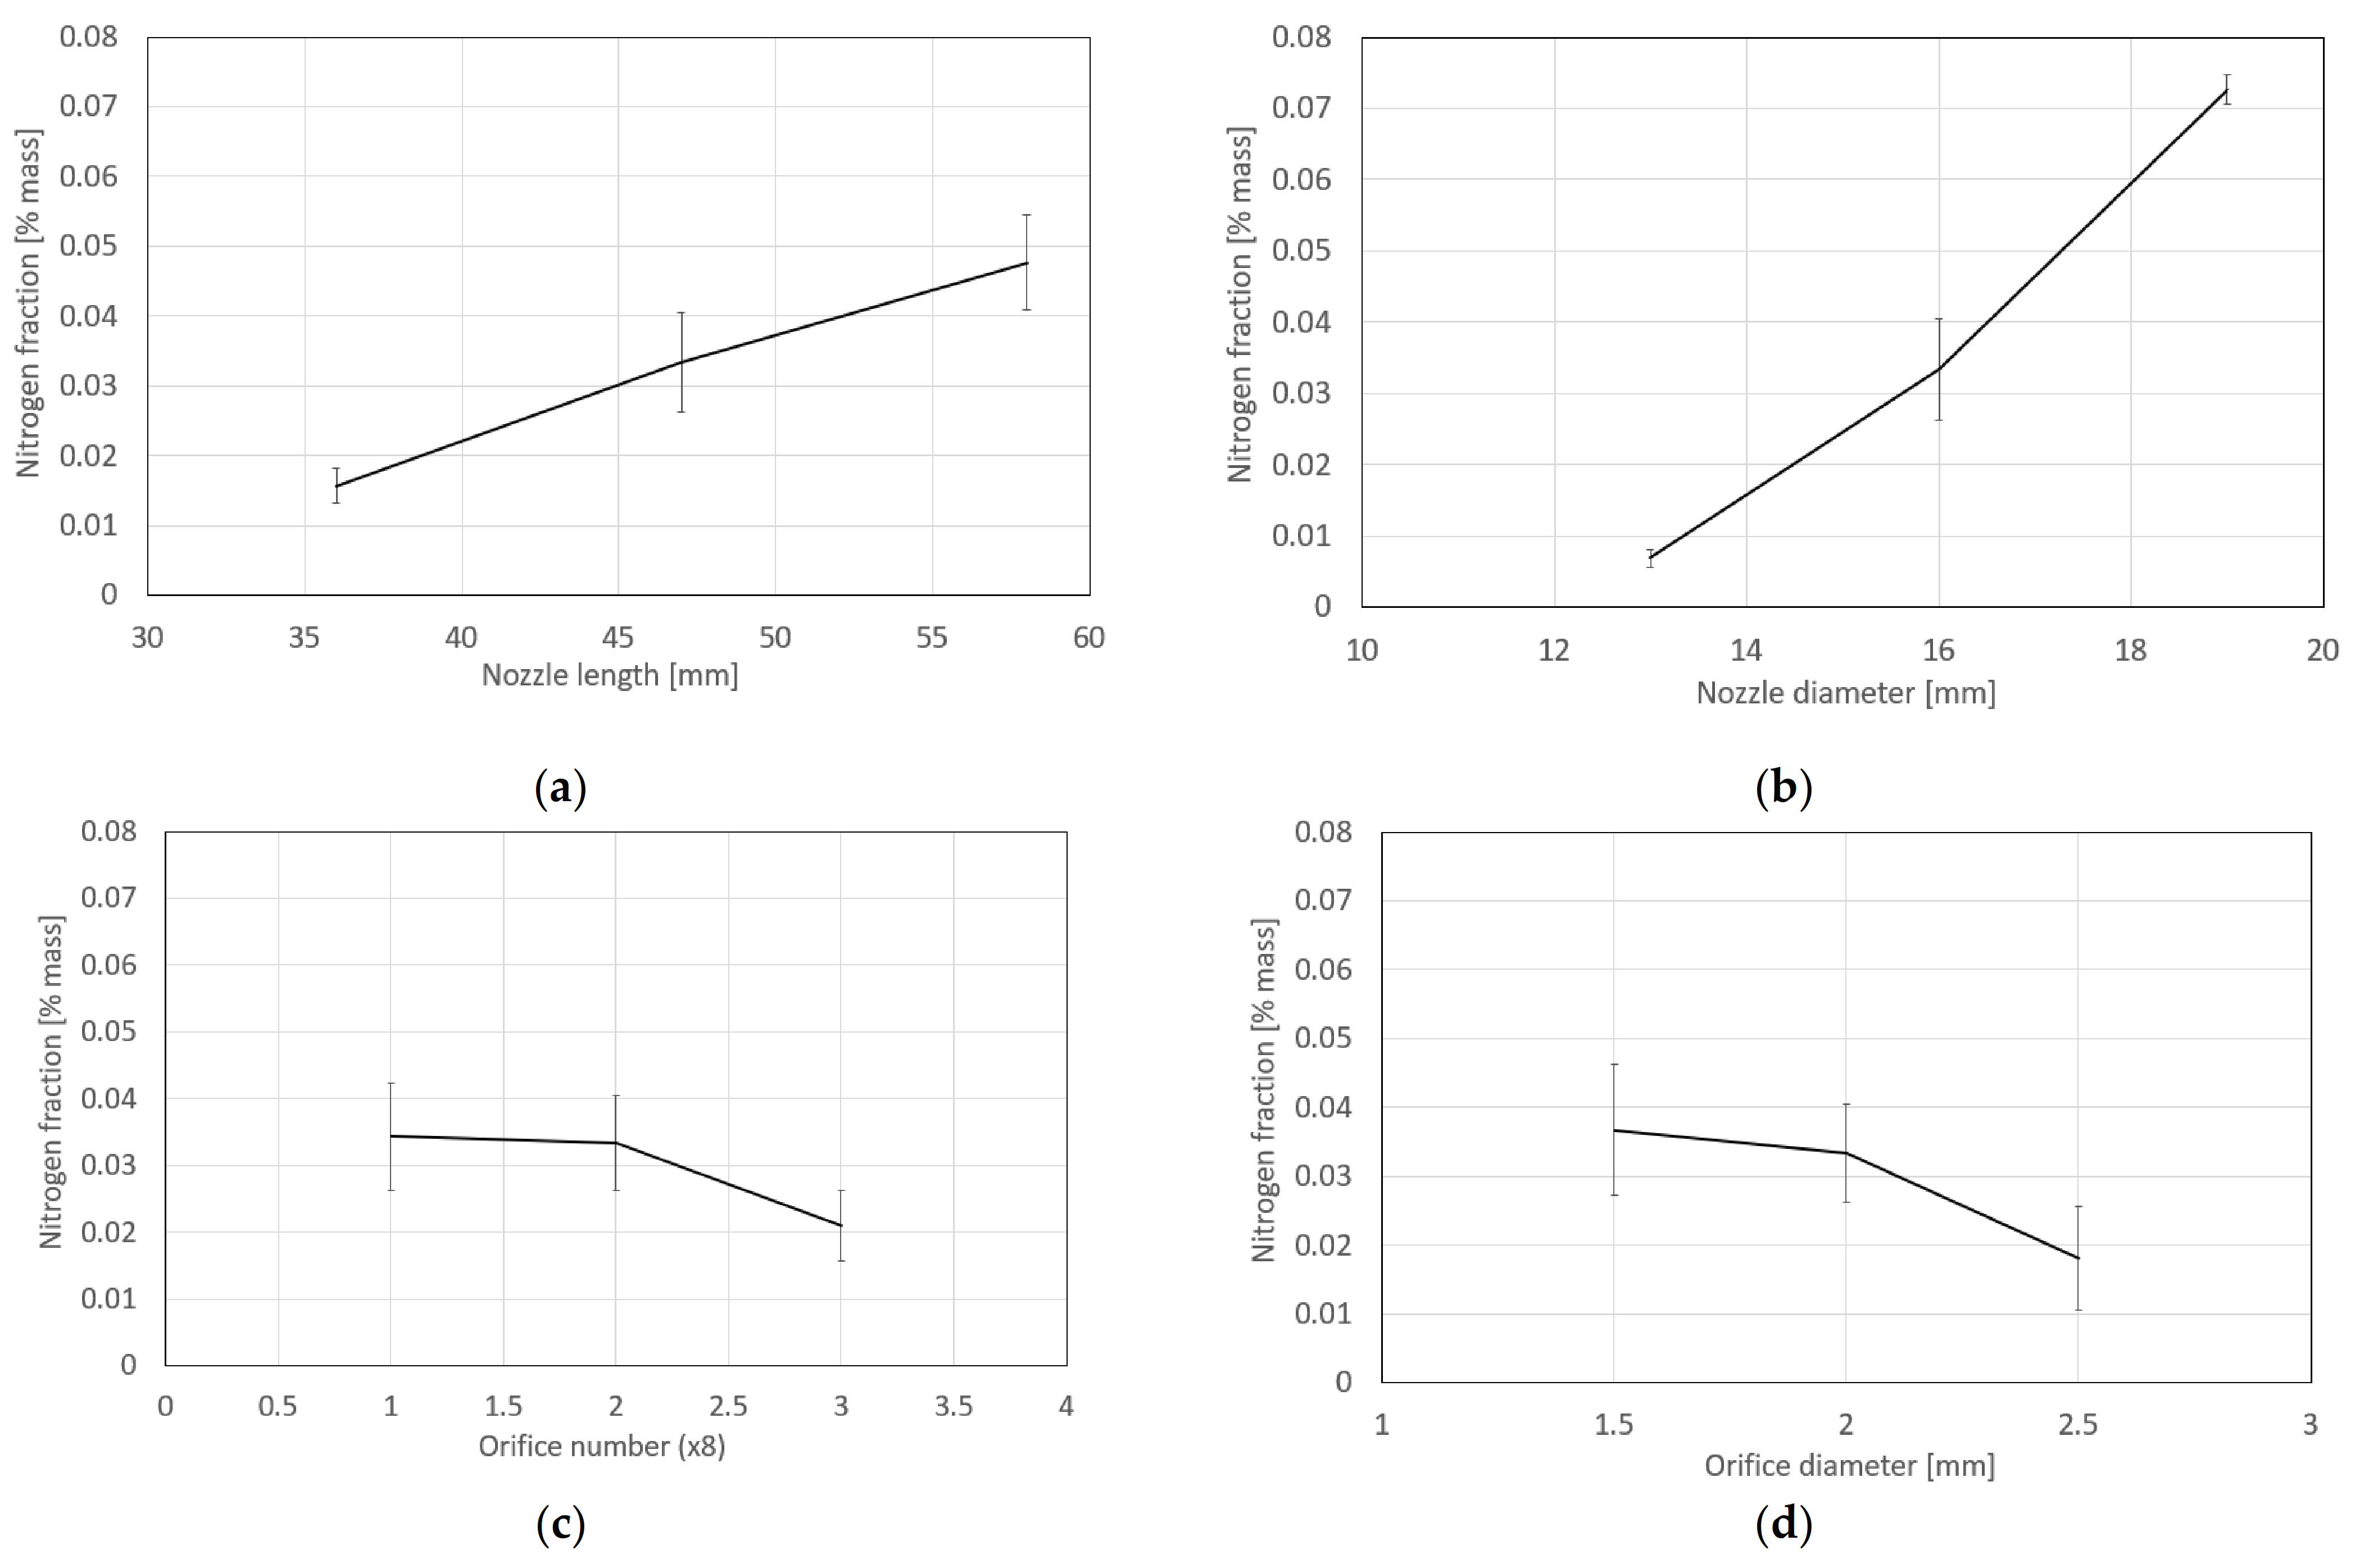
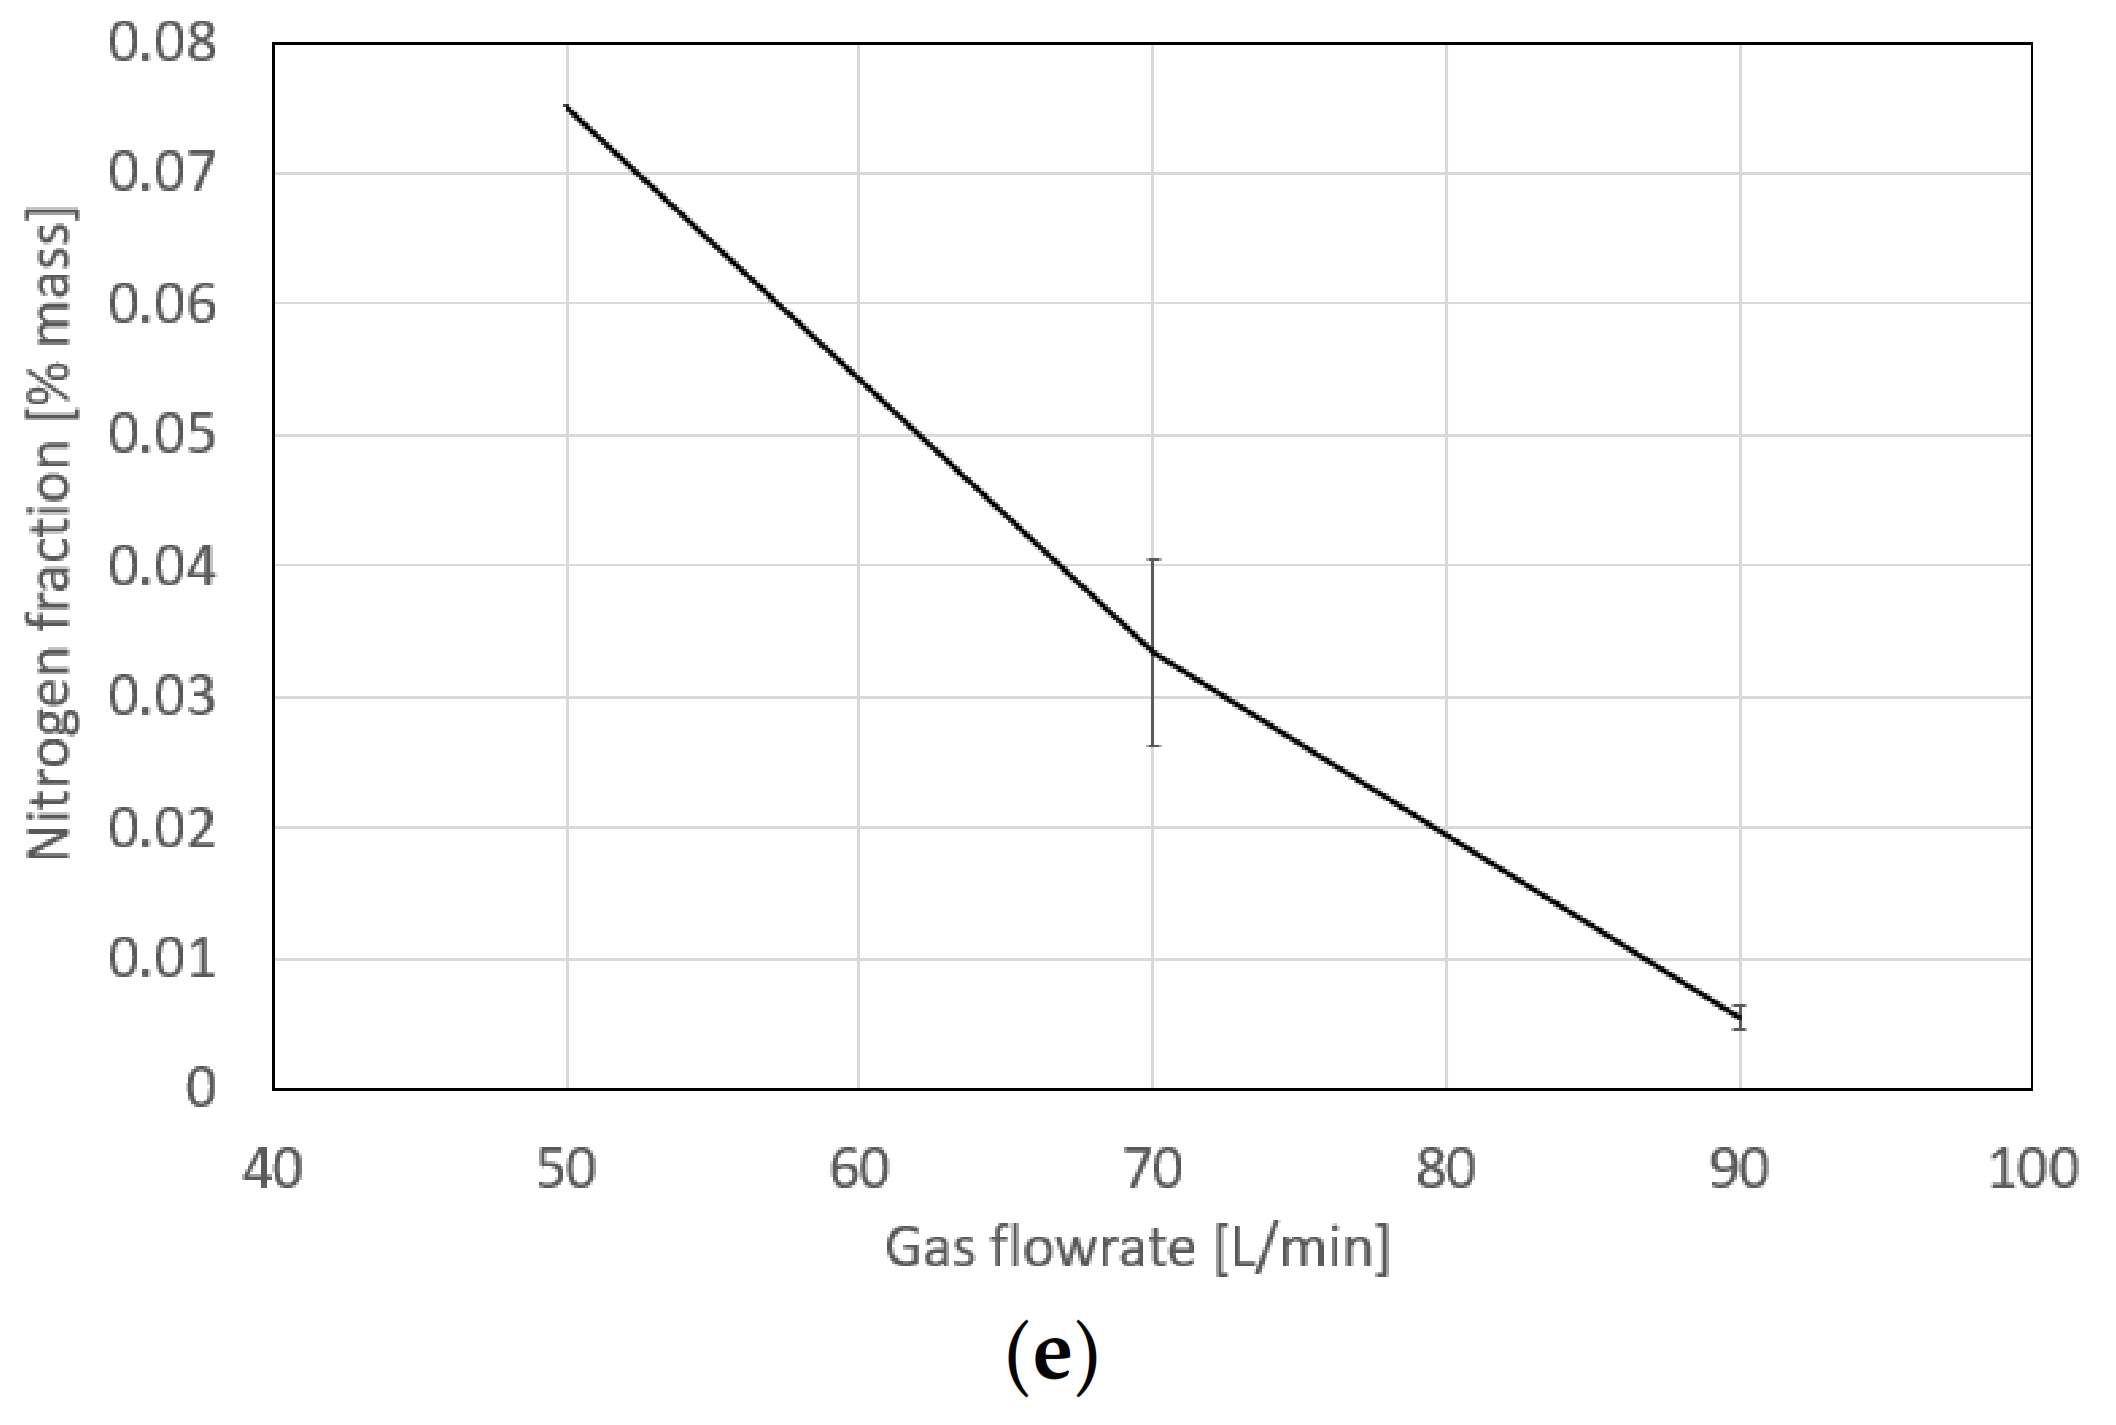
4.2. Nitrogen Fraction Measurement

Figure 6 shows the results of nitrogen fraction measurement. Figure 6a shows the influence of nozzle length. The nitrogen fraction increased from 0.016 to 0.048%mass with the nozzle length. Figure 6b shows the influence of nozzle diameter. The nitrogen fraction more largely increased from 0.008 to 0.072%mass with the nozzle diameter. Figure 6c presents the influence of the orifice number. The nitrogen fraction slightly decreased from 0.034 to 0.021%mass with the orifice number. Figure 6d presents the influence of orifice diameter. The nitrogen fraction slightly decreased from 0.037 to 0.019%mass with the orifice diameter. Figure 6e presents the influence of gas flow rate. The nitrogen fraction steeply decreased from 0.074 to 0.005%mass with the gas flow rate. In summary, the nozzle diameter and the gas flow rate especially affect the nitrogen fraction. This result agrees with the tendency seen in the shadowgraph observation.

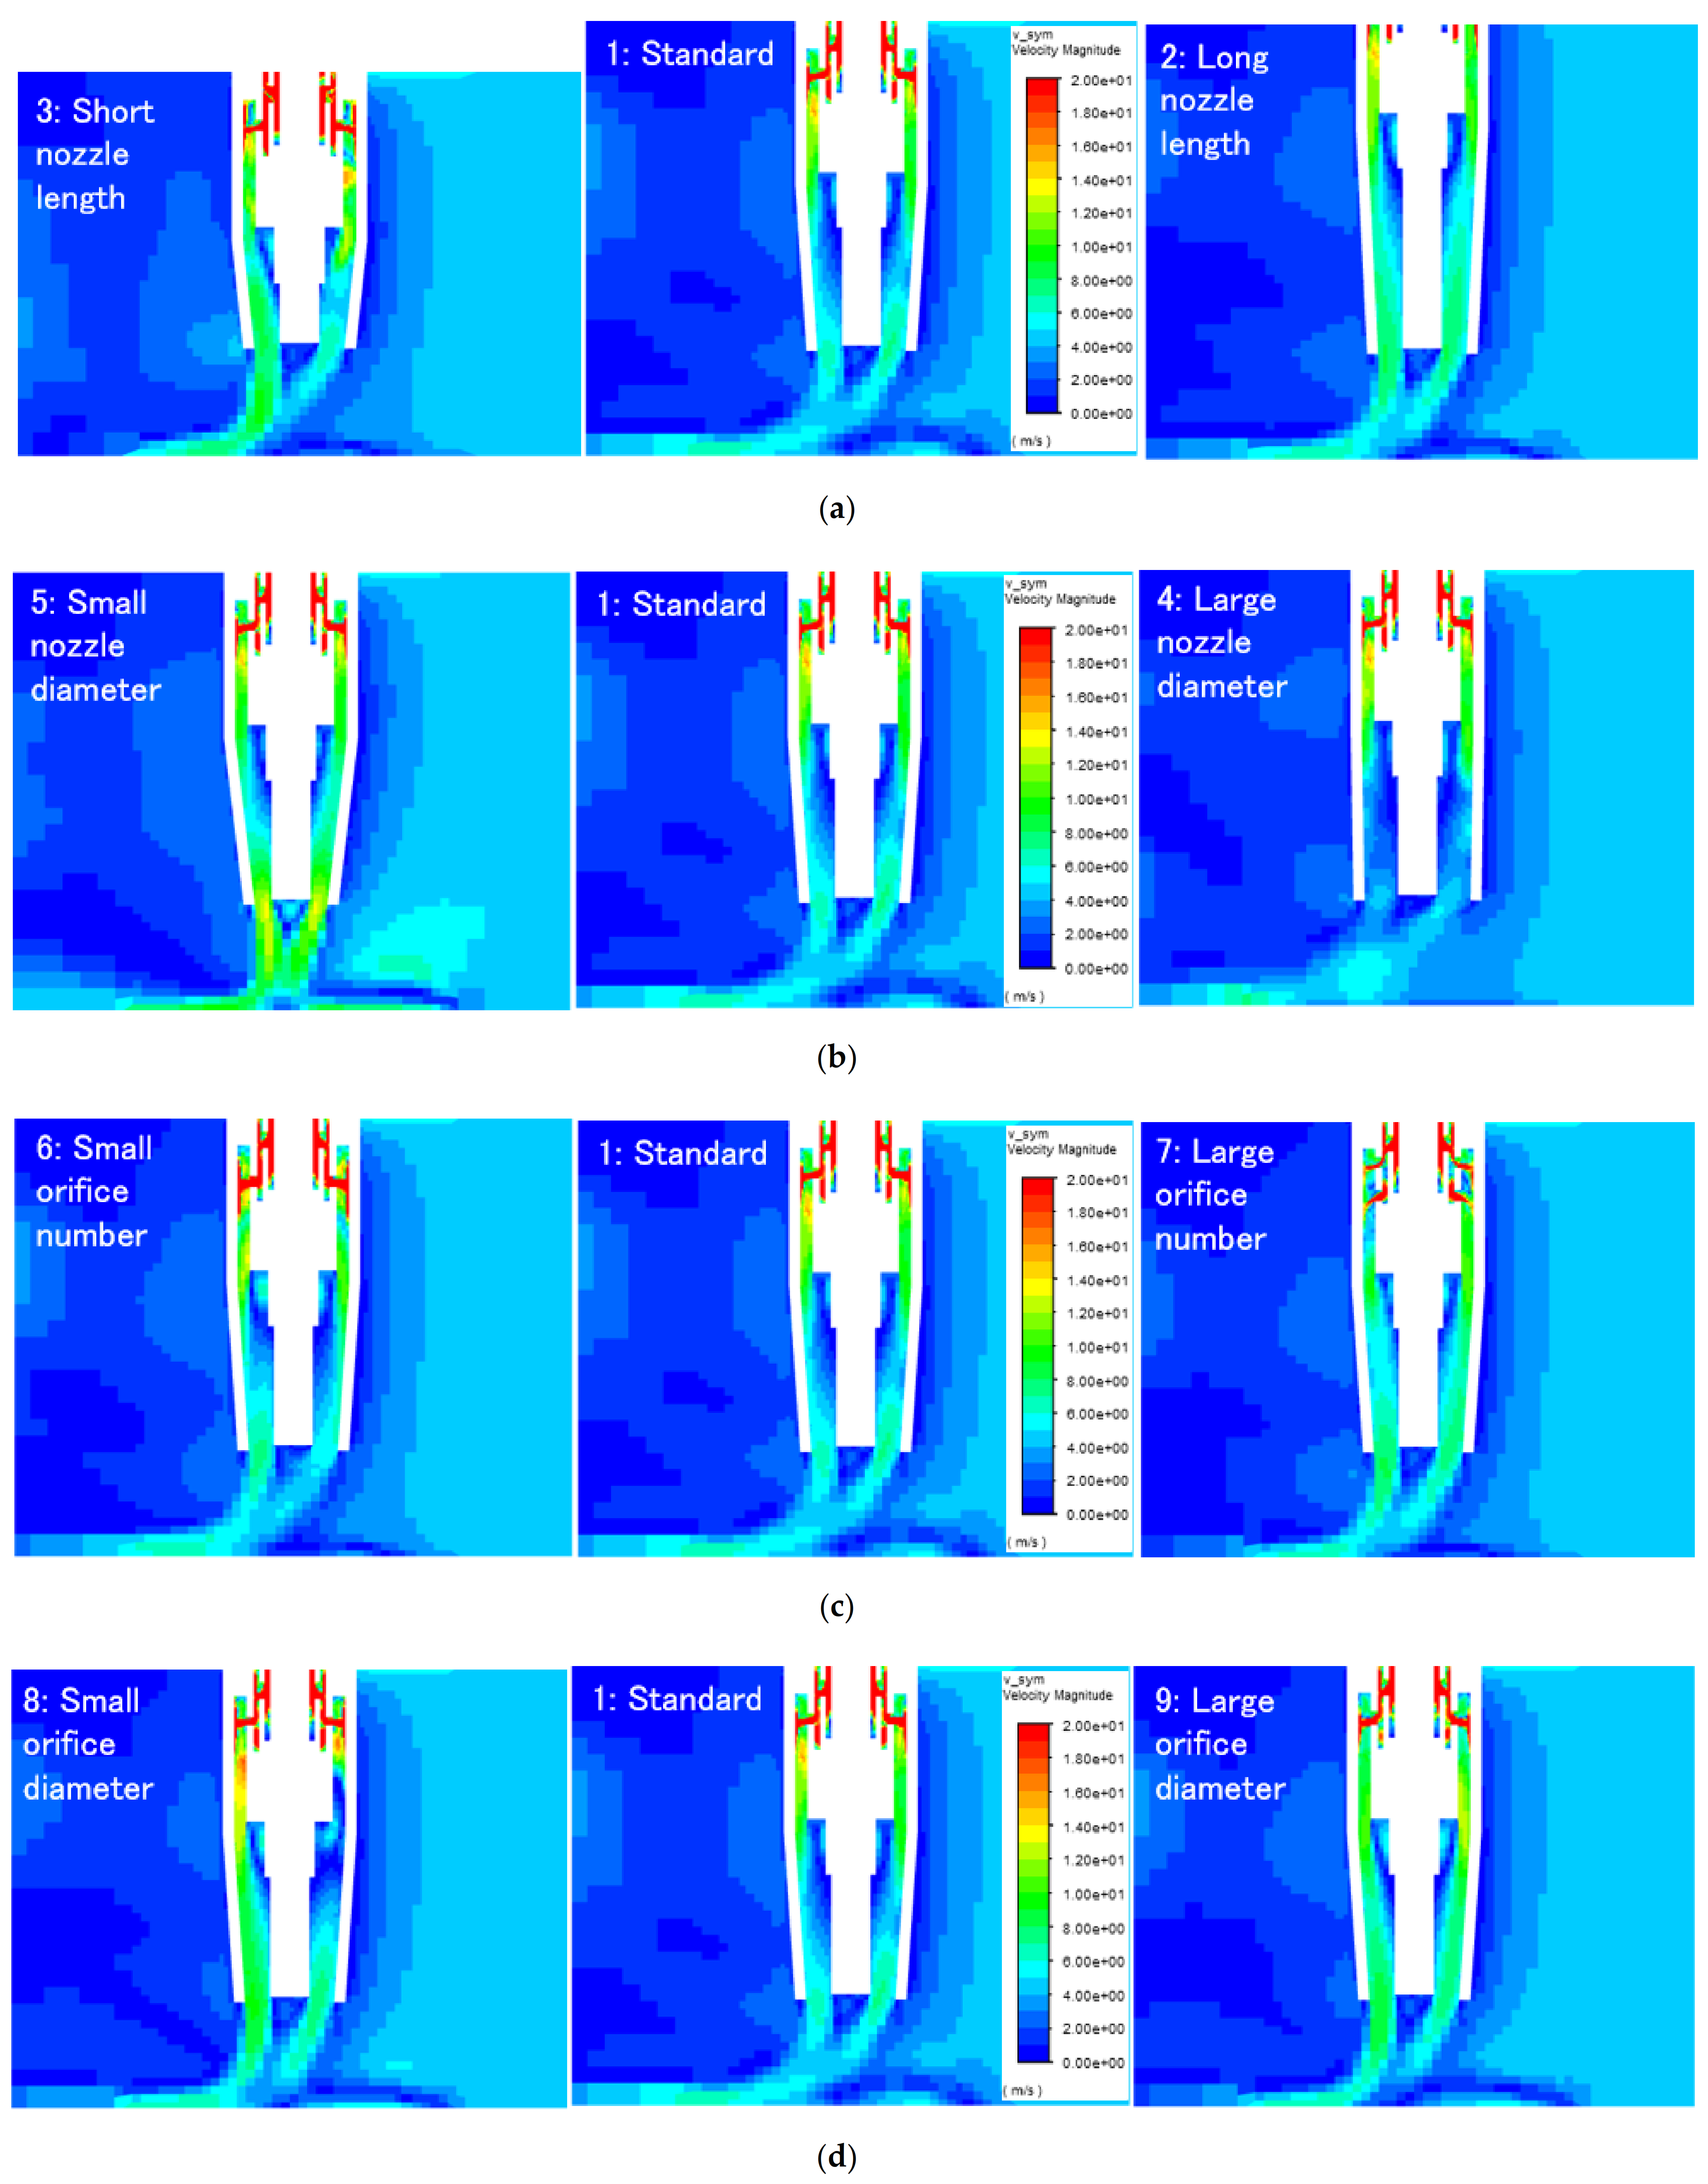
4.3. Numerical Simulation

Figure 7 shows the calculated gas flow velocity distribution on the symmetrical plane. The maximum value in the contour is set to 20 m/s even though the real maximum value exceeds this value, in order to clearly present the small velocity region around the nozzle exit. The gas flow velocity was seen to largely exceed 20 m/s around the orifices and suddenly decrease to about 10 m/s after passing through the orifice due to horizontal expansion of the gas flow and also diffusion of the momentum caused by high turbulent viscosity. Around the nozzle exit, the gas flow velocity became 5~10 m/s.
Figure 8 shows averaged vertical gas flow velocity at the nozzle exit calculated from the velocity distribution shown in Figure 7. Here, the vertical gas flow velocity is evaluated because this is considered to be related to the wind resistance. From the result, it was found that when the nozzle diameter decreased or the gas flow rate increased, the vertical gas flow velocity at the nozzle exit clearly increased. The nozzle length, the orifice number, and the orifice diameter were found to hardly affect the vertical gas flow velocity.
Finally, the relationship between the nitrogen fraction and the averaged vertical gas flow velocity at the nozzle exit is summarized in Figure 9. The nitrogen fraction is found to be decreased by increasing the averaged vertical gas flow velocity. The nitrogen fraction was largely decreased when the averaged vertical gas flow velocity exceeded the cross-wind velocity of 5 m/s. A sufficient decrease in nitrogen fraction was obtained if the averaged vertical gas flow velocity became more than 150% of the cross-wind velocity. For achieving this, it is especially effective to decrease the nozzle diameter or increase the gas flow rate.

5. Conclusions

This study aims to develop a novel welding torch with high wind resistance. In this paper, a parametric study was carried out using different torch nozzle designs and shield gas flow rates for their optimization at the high wind velocity (5–10 m/s) like outdoor conditions. The main conclusions are drawn as follows:
  • The result of the shadowgraph observation presented that the smaller nozzle diameter and the larger gas flow rate prevented the bending of the shielding gas flow.
  • The result of nitrogen fraction measurement showed that the smaller nozzle diameter and the larger gas flow rate decreased the nitrogen fraction. Not noticeable, the amount of nitrogen tended to decrease slightly, with the decrease in nozzle length the increase of orifice number and orifice diameter. Then, the result of the nozzle diameter and the gas flow rate agreed with the bending tendency of the shielding gas flow seen in the shadowgraph observation.
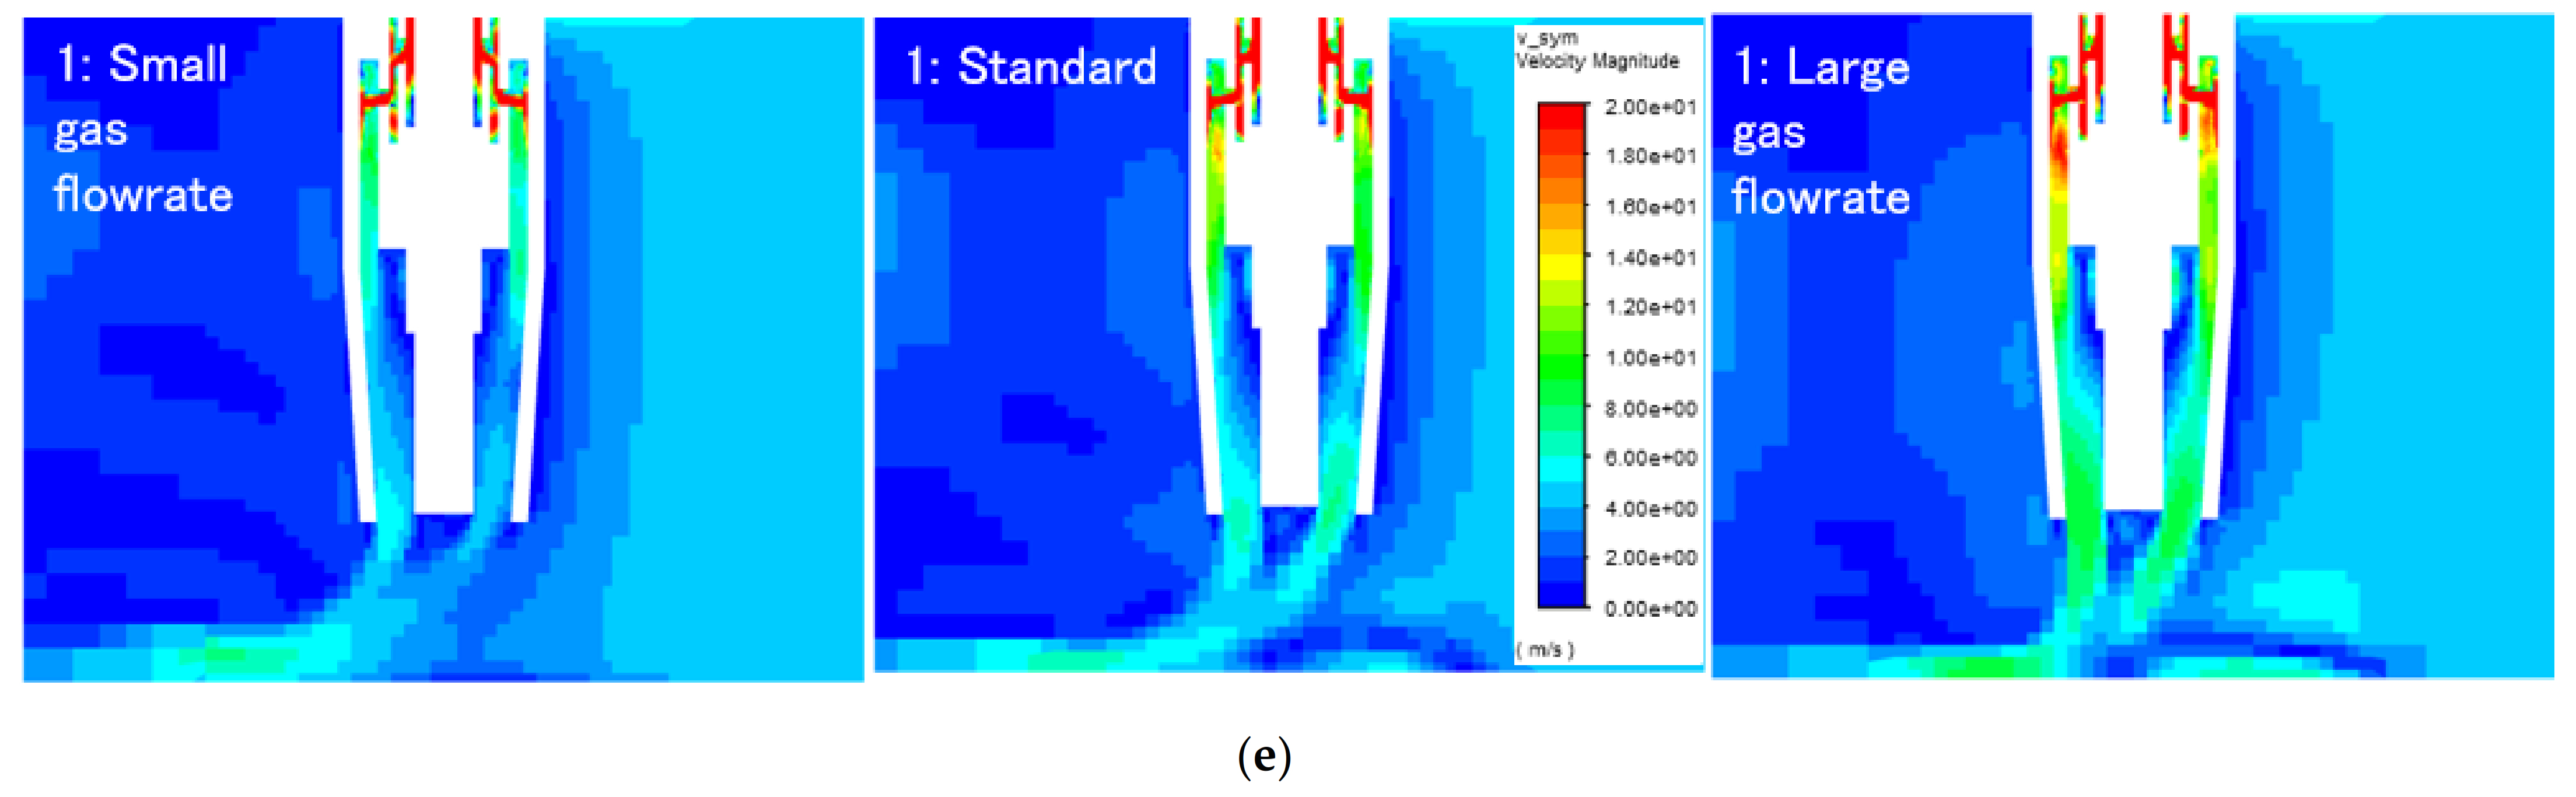
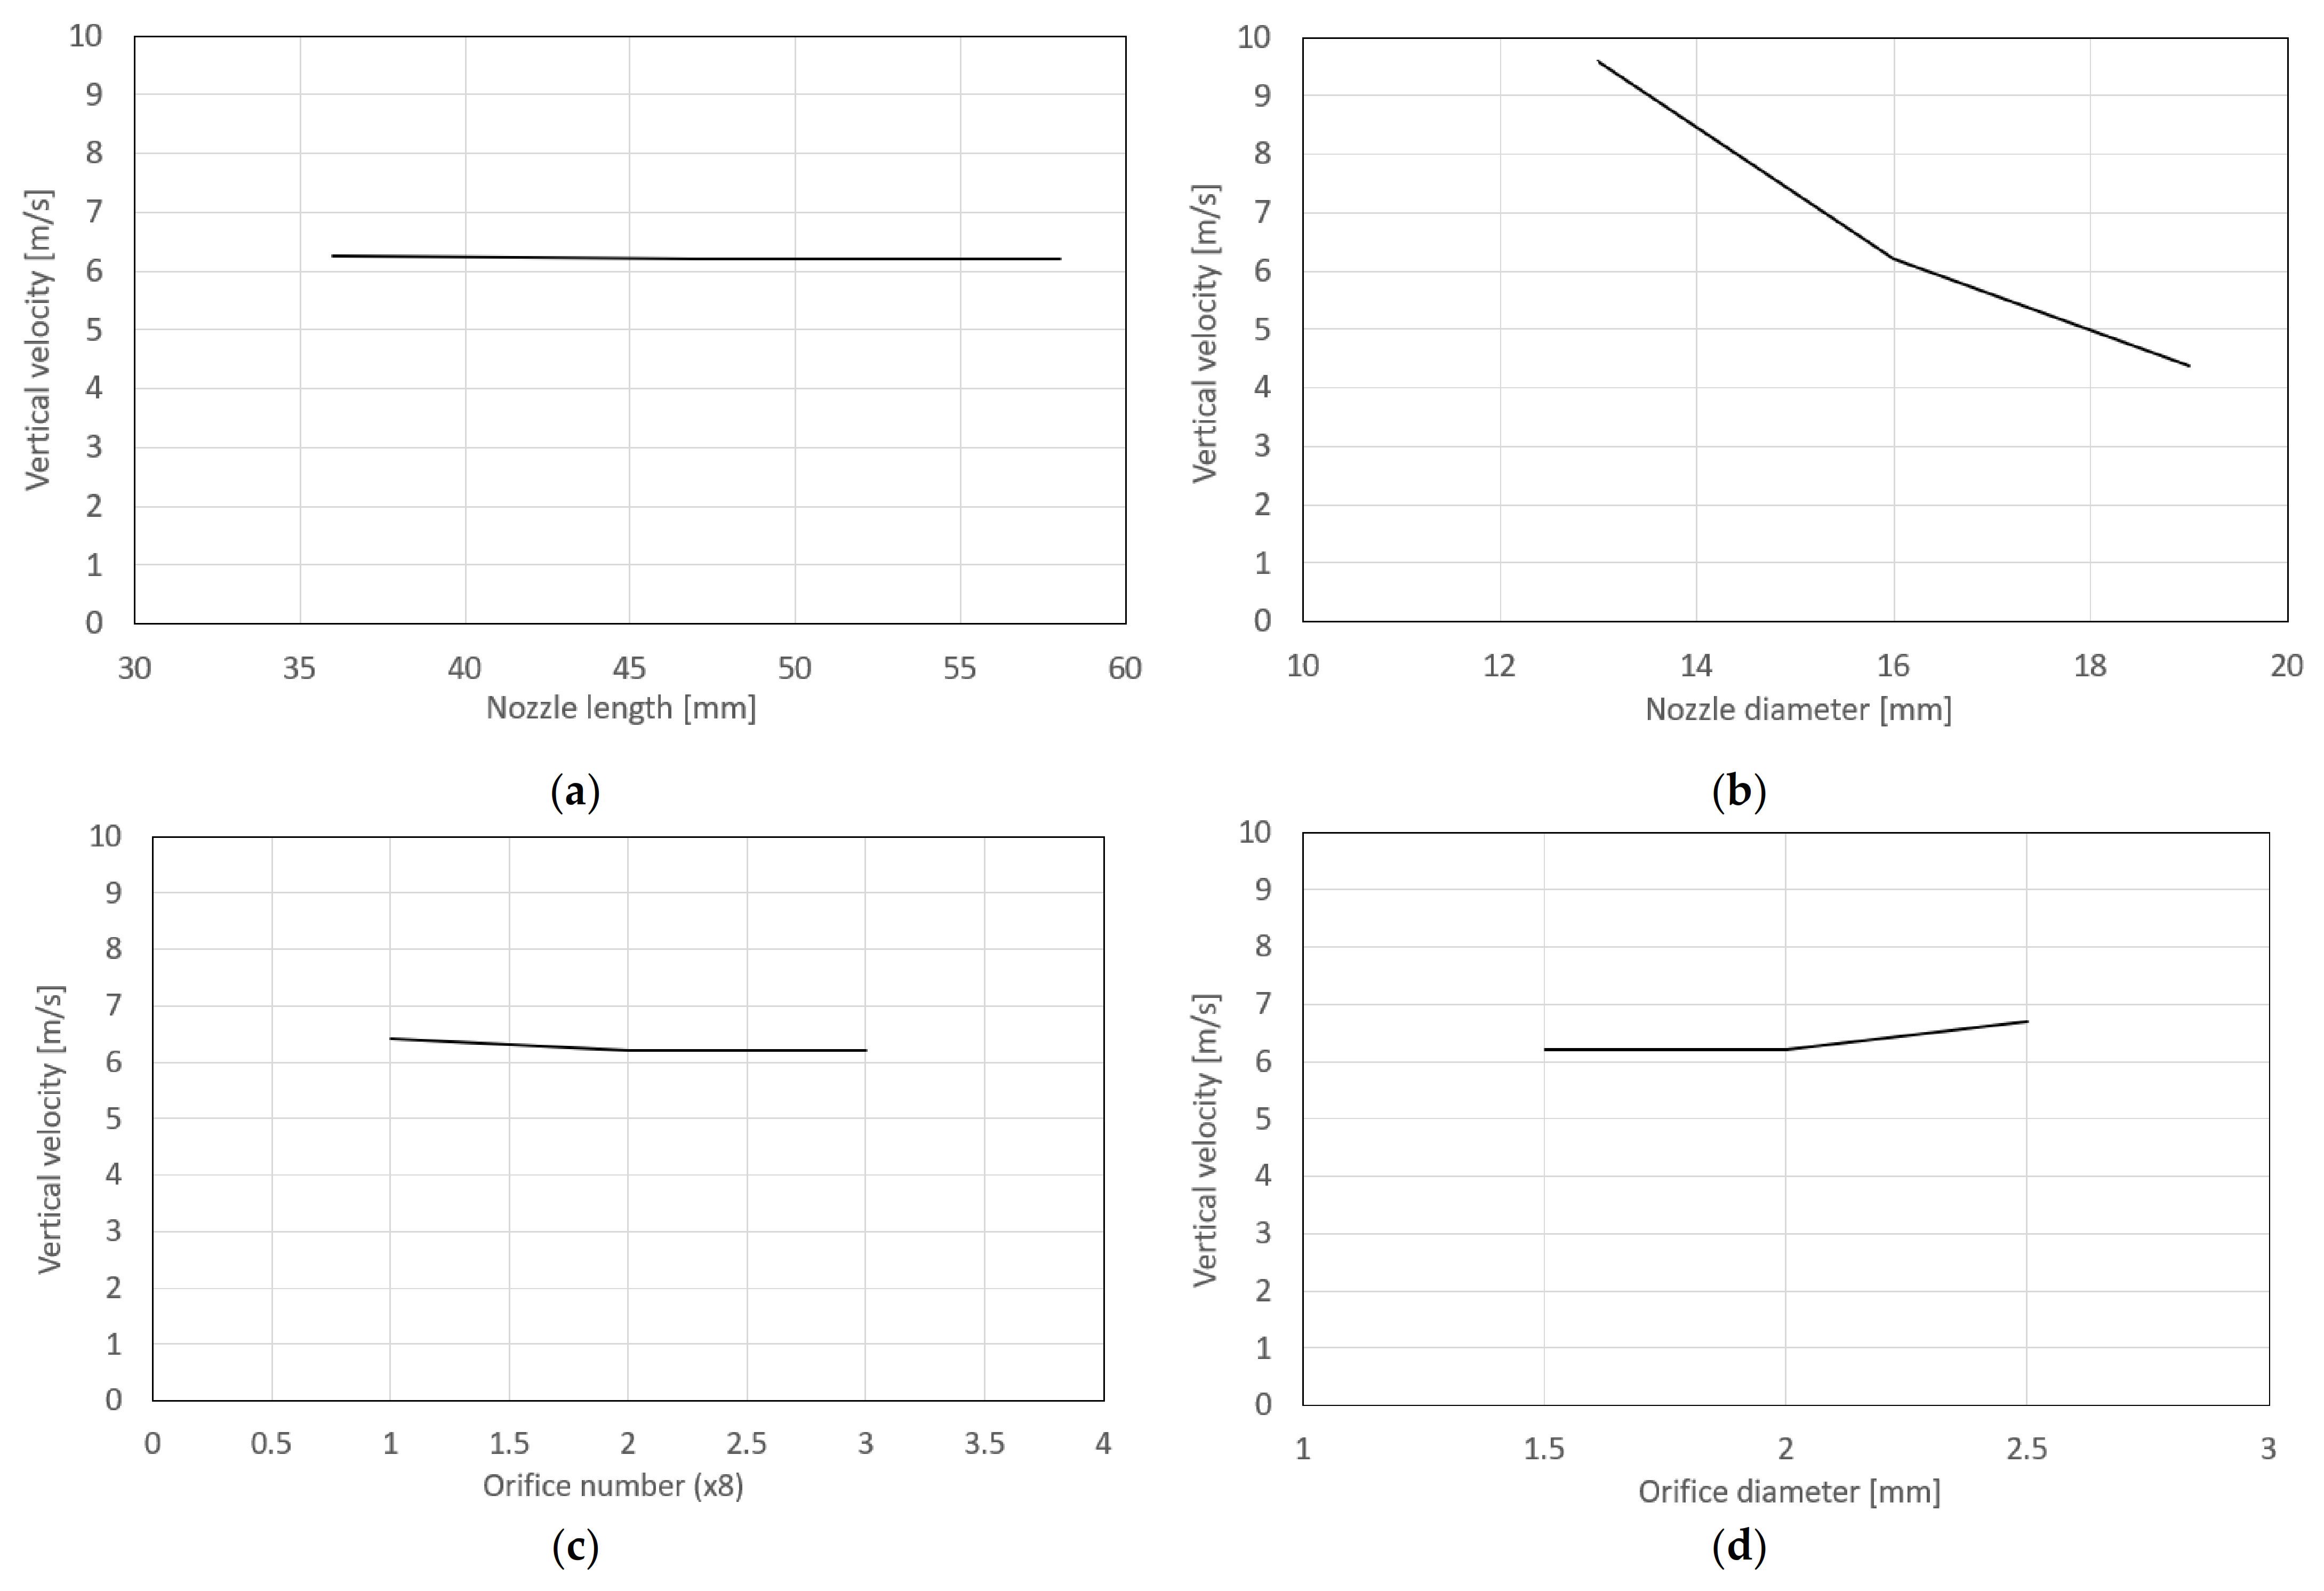
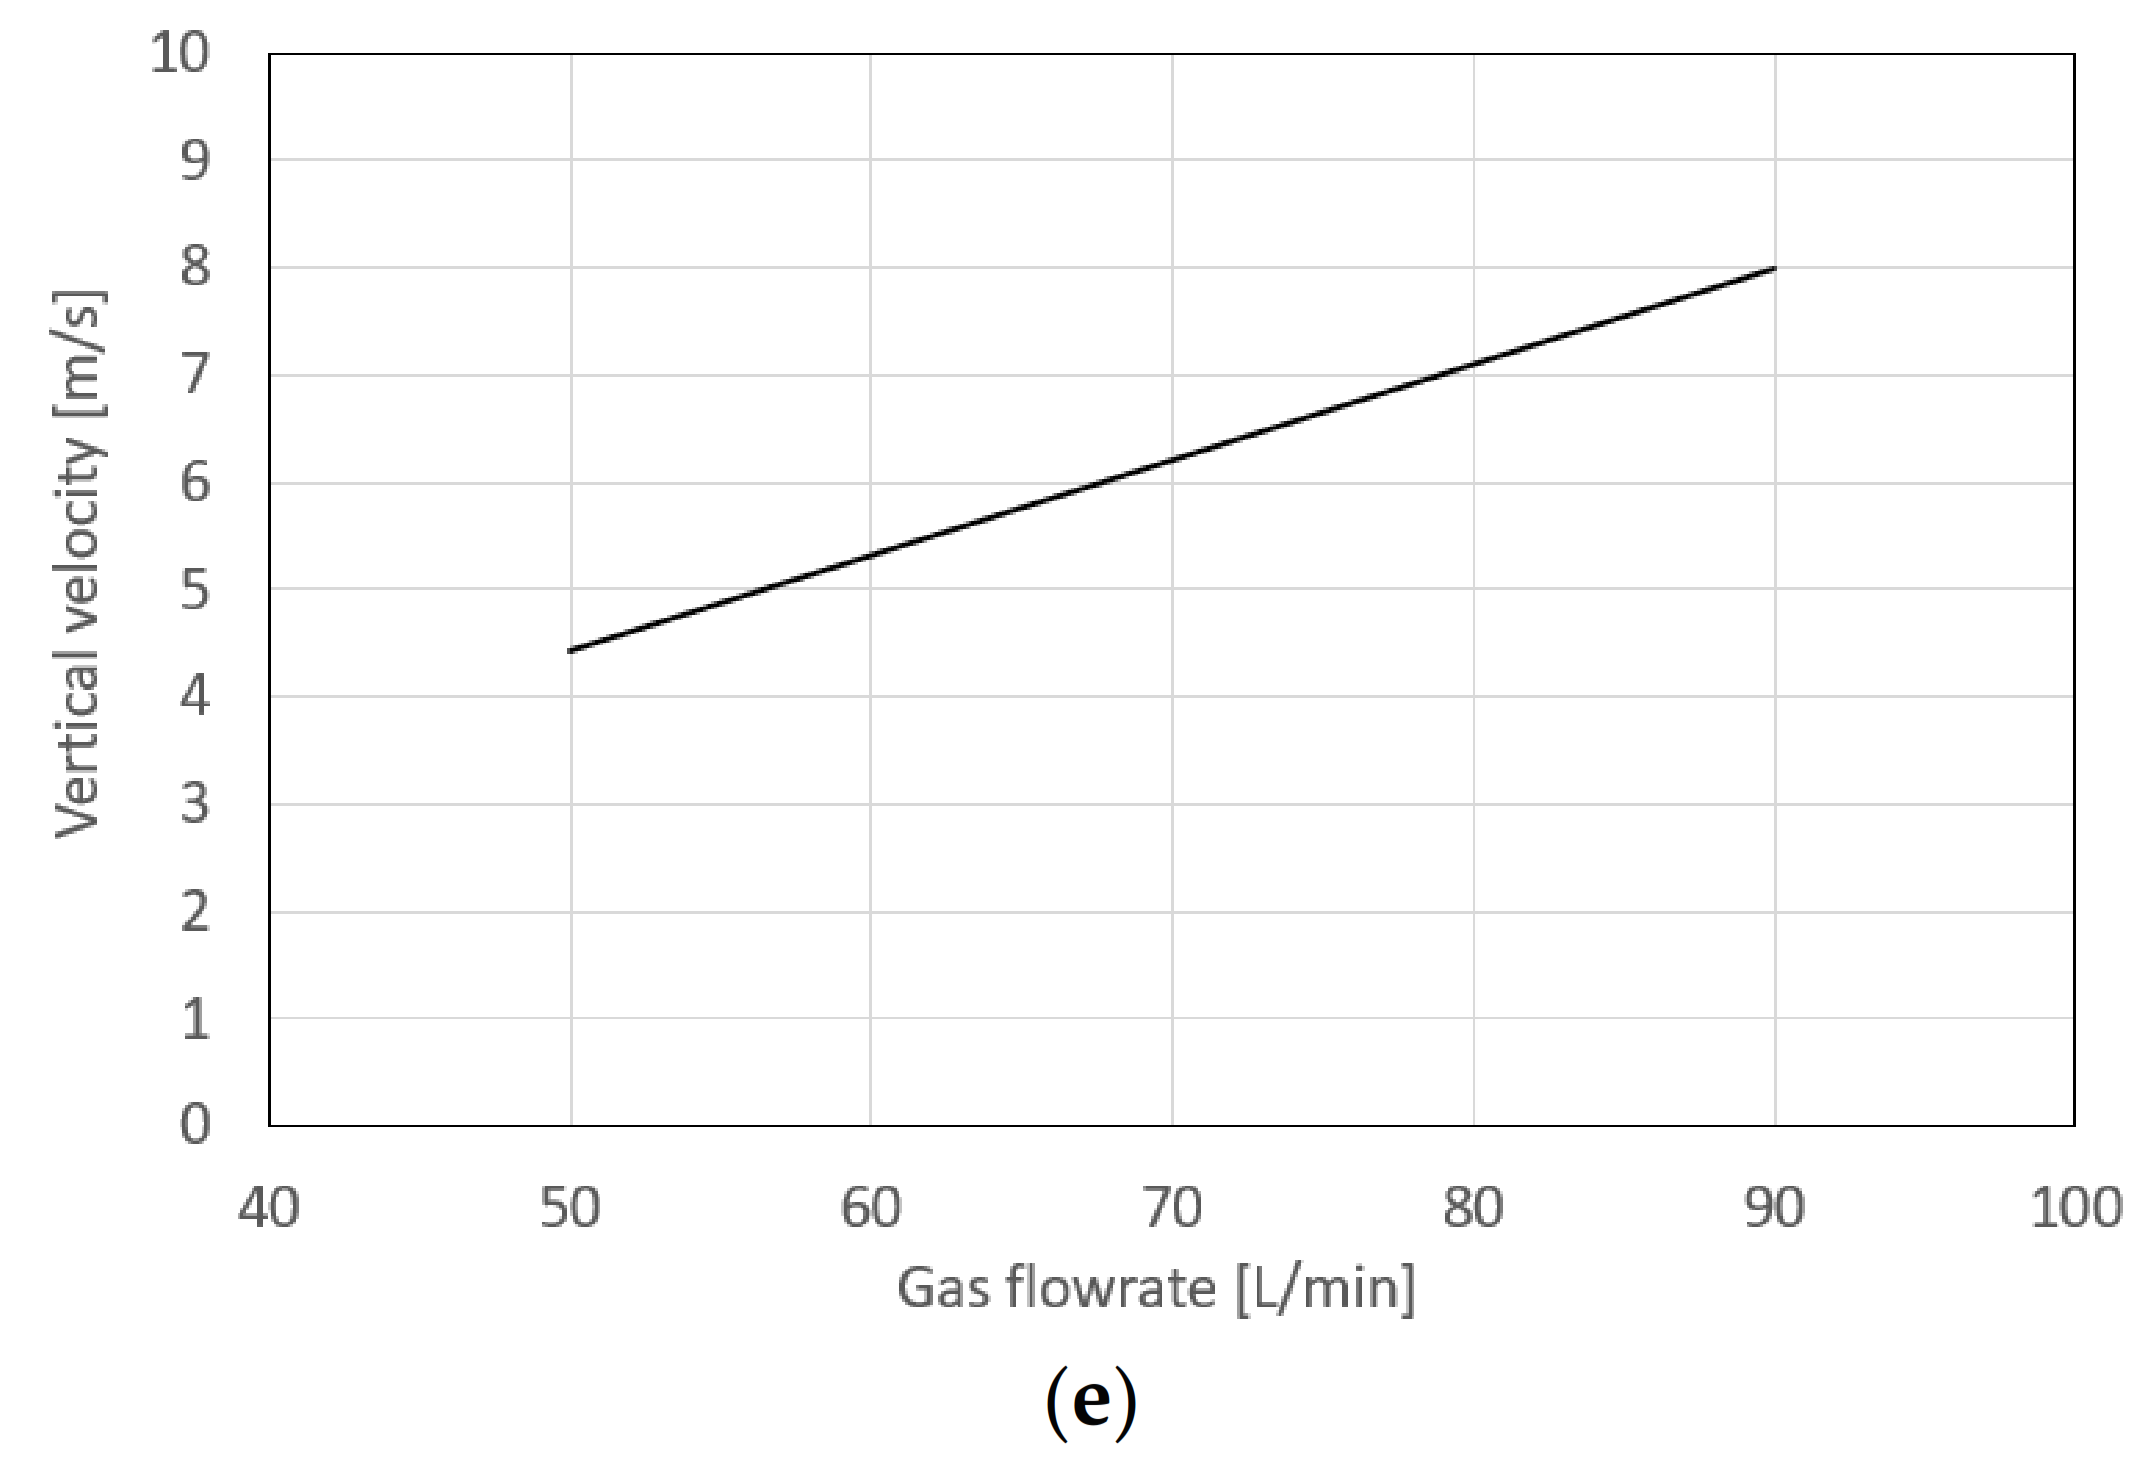
  • The result of the CFD simulation showed that when the nozzle diameter decreased or the gas flow rate increased, the vertical gas flow velocity at the nozzle exit clearly increased. The nozzle length, the orifice number, and the orifice diameter were found to hardly affect the vertical gas flow velocity.
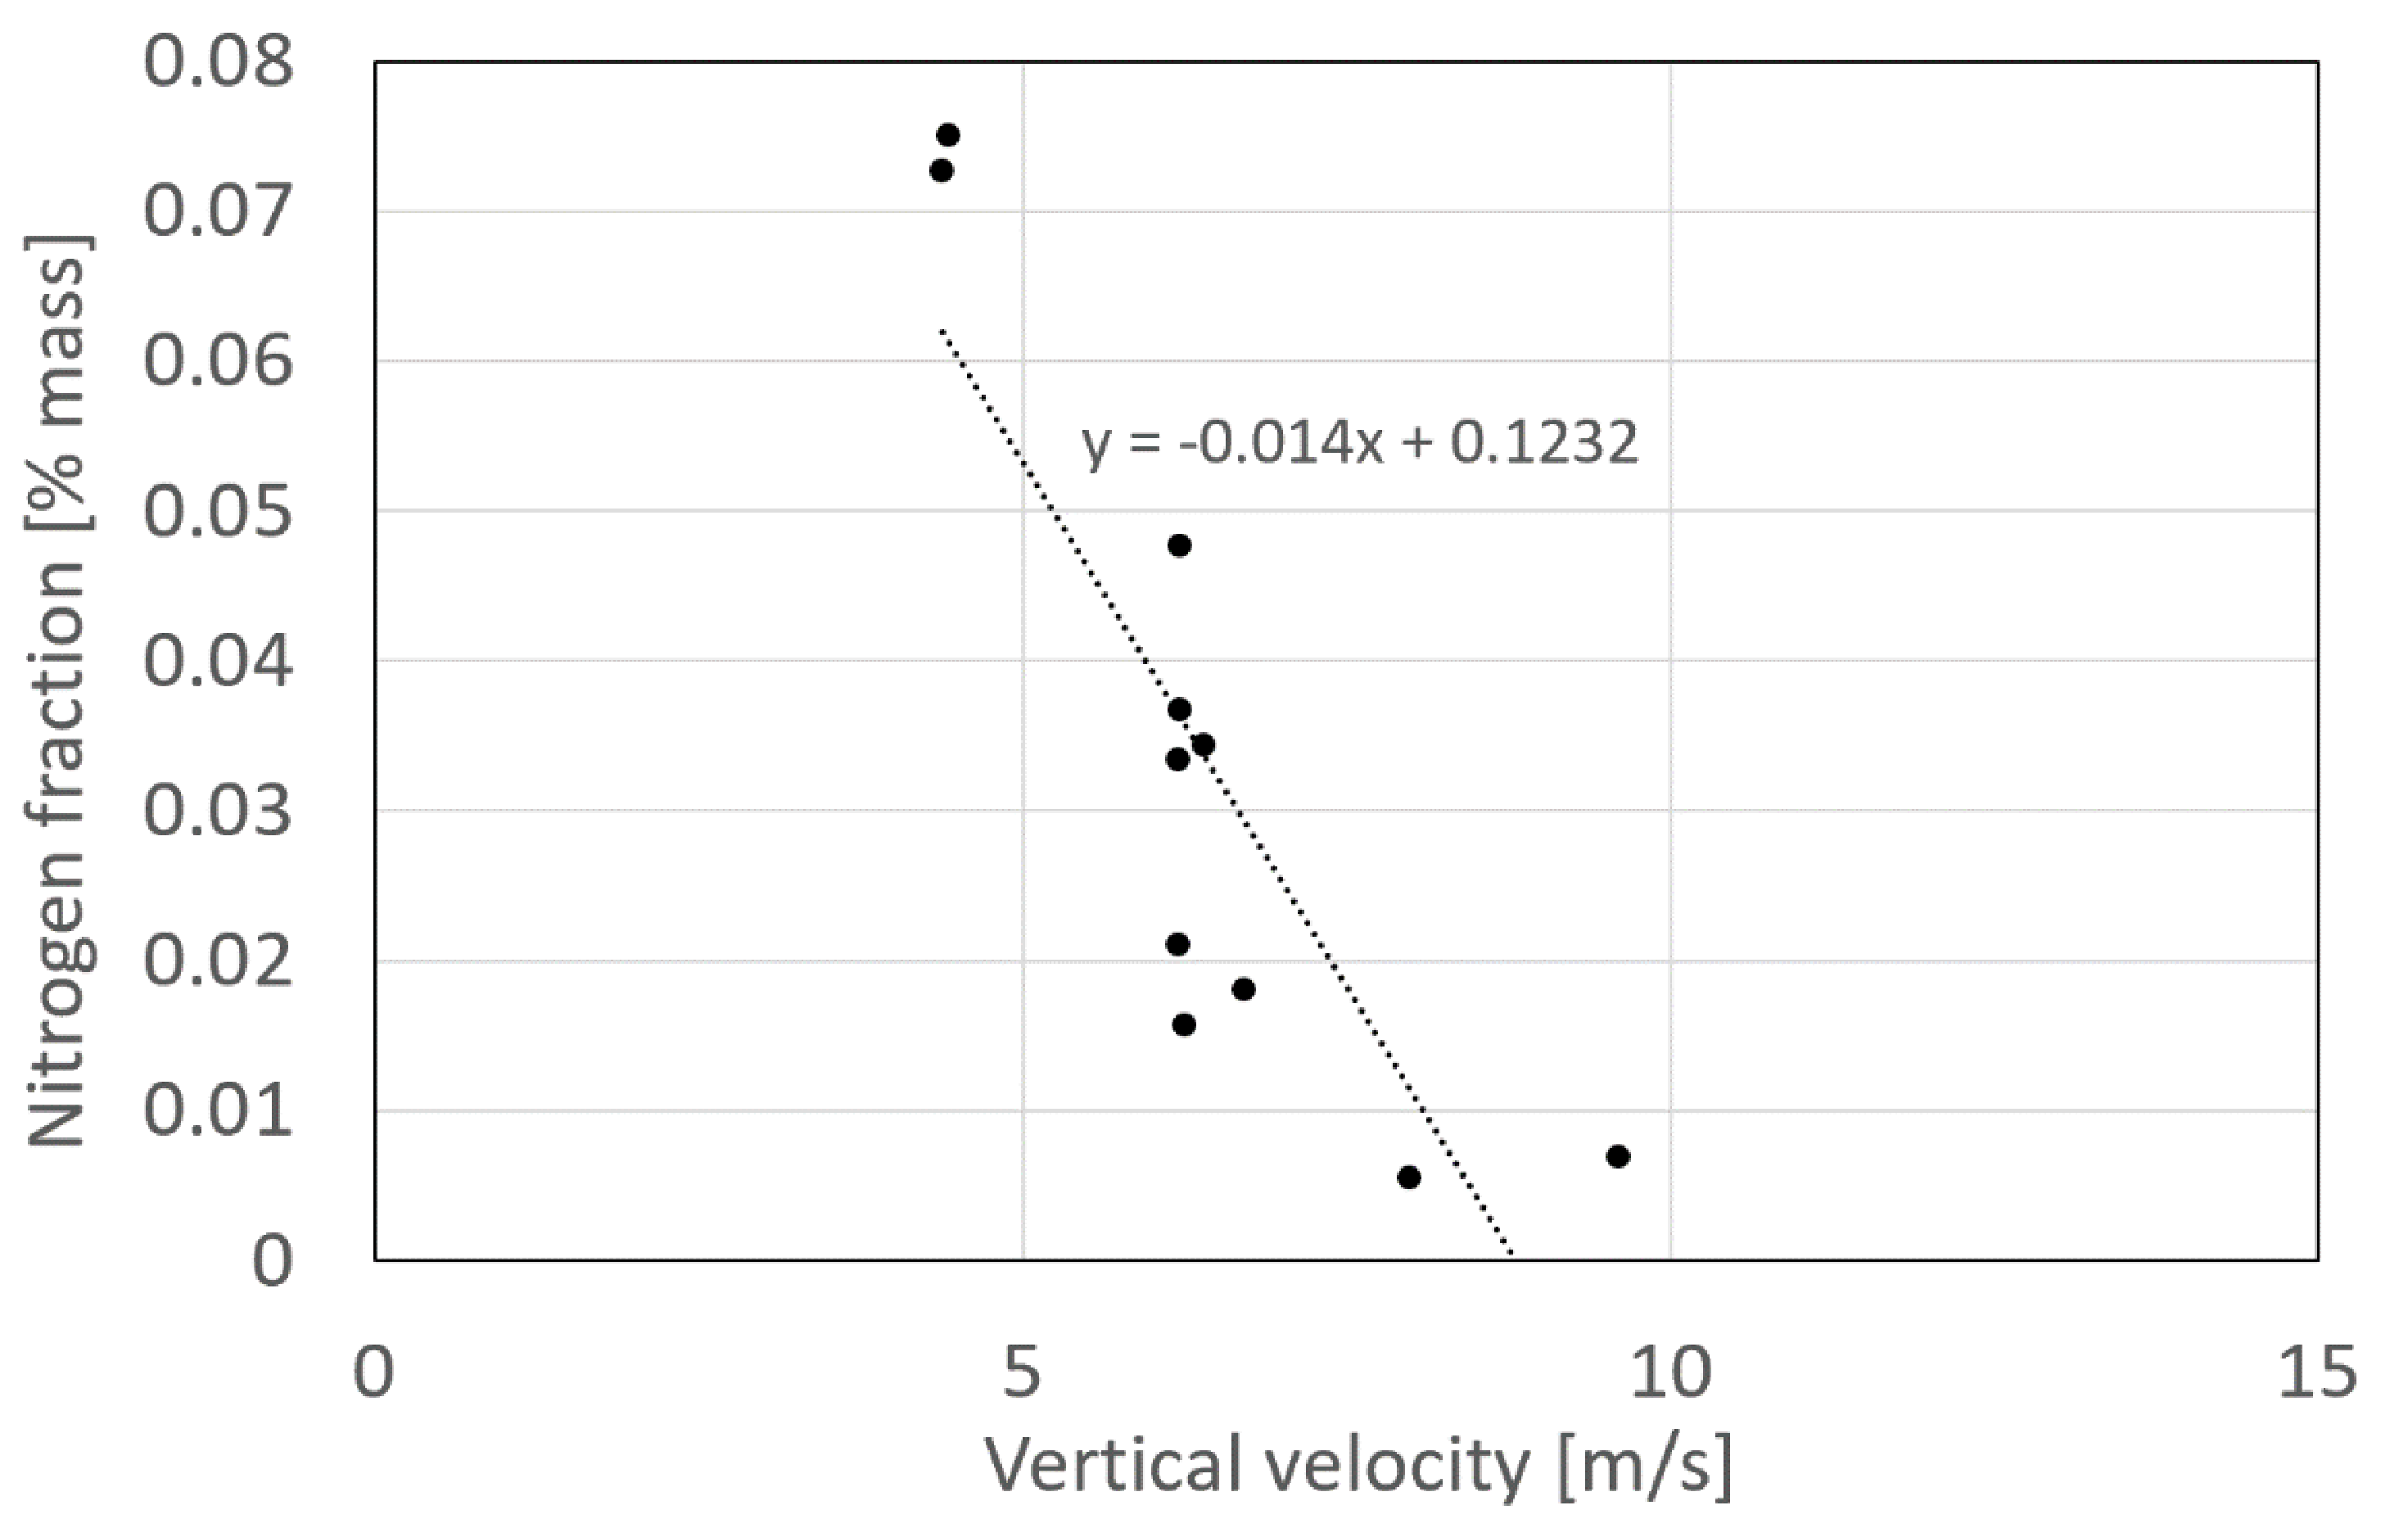
  • The main factor that governs wind resistance is the gas flow velocity in the vertical direction at the nozzle exit. The nitrogen fraction is found to be decreased by increasing the averaged vertical gas velocity. The nitrogen fraction was largely decreased when the averaged vertical gas flow velocity exceeded the cross-wind velocity of 5 m/s. A sufficient decrease in nitrogen fraction was obtained if the averaged vertical gas flow velocity became more than 150% of the cross-wind velocity. For achieving this, it is especially effective to decrease the nozzle diameter or increase the gas flow rate.

Author Contributions

Conceptualization, methodology, simulation, writing, supervision, S.T.; experiment, N.Q.T.; discussion, T.S., N.M., N.T., T.M., R.T., S.N., G.T., H.V.B. and M.T. All authors have read and agreed to the published version of the manuscript.

Funding

This research received no external funding.

Institutional Review Board Statement

Not applicable.

Informed Consent Statement

Not applicable.

Data Availability Statement

Data can be available based on the requirements to verify this work.

Conflicts of Interest

The authors declare no conflict of interest.

References

  1. Jeffus, L. Welding: Principles and Application, 7th ed.; Delmar Publications: Clifton Park, NY, USA, 2012; pp. 55–157. [Google Scholar]
  2. Murphy, A.B. A Perspective on Arc Welding Research: The Importance of the Arc, Unresolved Questions and Future Directions. Plasma Chem. Plasma Process. 2015, 35, 471–489. [Google Scholar] [CrossRef]
  3. Oliveira, J.P.; Crispim, B.; Zeng, Z.; Omori, T.; Fernandes, F.M.B.; Miranda, R.M. Microstructure and mechanical properties of gas tungsten arc welded Cu-Al-Mn shape memory alloy rods. J. Mater. Process. Technol. 2019, 271, 93–100. [Google Scholar] [CrossRef]
  4. Oliveira, J.P.; Curado, T.M.; Zeng, Z.; Lopes, J.G.; Rossinyol, E.; Park, J.M.; Schell, N.; Fernandes, F.M.B.; Kime, H.S. Gas tungsten arc welding of as-rolled CrMnFeCoNi high entropy alloy. Mater. Des. 2020, 189, 108505. [Google Scholar] [CrossRef]
  5. Tanaka, M.; Lowke, J.J. Predictions of weld pool profiles using plasma physics. J. Phys. D Appl. Phys. 2007, 40, R1–R23. [Google Scholar] [CrossRef]
  6. Sugiura, K.; Kodama, S.; Tsujimura, Y.; Murphy, A.B.; Tanaka, M. Numerical modeling of nitrogen absorption during gas tungsten arc welding. Q. J. Jpn. Weld. Soc. 2013, 31, 14s–17s. [Google Scholar] [CrossRef] [Green Version]
  7. Tamaki, K.; Masumoto, I.; Takahashi, Y. Some observation of the gas shielding conditions of CO2 arc welding by the application of a television system. J. Jpn. Weld. Soc. 1978, 47, 37–42. [Google Scholar] [CrossRef]
  8. Dreher, M.; Füssel, U.; Rose, S.; Häßler, M.; Hertel, M.; Schnick, M. Methods and results concerning the shielding gas flow in GMAW. Weld. World 2013, 57, 391–410. [Google Scholar] [CrossRef]
  9. Suzuki, R.; Sasakura, S.; Yokota, Y.; Sato, T.; Shigemori, Y.; Uenaka, A.; Nishimura, H.; Kiso, H. Study of wind-toughness of metal arc welding with reference to multi-pass weld metal quality. Weld. Int. 2017, 31, 17–27. [Google Scholar] [CrossRef]
  10. Cai, C.; Li, L.; Tai, L. Narrow-gap laser-MIG hybrid welding of thick-section steel with different shielding gas nozzles. Int. J. Adv. Manuf. Technol. 2017, 92, 909–916. [Google Scholar] [CrossRef]
  11. Pei, H.; Liu, C.; Chen, Y.; Wang, G. Influence of nozzle structure on the consumption of shielding gas in the gas metal arc welding process. Int. J. Adv. Manuf. Technol. 2020, 106, 2843–2859. [Google Scholar] [CrossRef]
  12. Mamat, S.B.; Tashiro, S.; Tanaka, M.; Yusoff, M. Study on factors affecting the droplet temperature in plasma MIG welding process. J. Phys. D Appl. Phys. 2018, 51, 135206. [Google Scholar] [CrossRef]
  13. JIS G 1228-1997: Iron and steel-Methods for Determination of Nitrogen Content, Thermal Conductimetric Method after Fusion in a Current of Inert Gas (1). (In Japanese)
  14. Menter, F.R. Two-equation eddy-viscosity turbulence models for engineering applications. AIAA J. 2012, 32, 1598–1605. [Google Scholar] [CrossRef] [Green Version]
  15. Murphy, A.B.; Arundell, C.J. Transport coefficients of argon, nitrogen, oxygen, argon-nitrogen and argon-oxygen plasmas. Plasma Chem. Plasma Process. 1994, 14, 451–490. [Google Scholar] [CrossRef]
  16. Murphy, A.B. Transport coefficients of air, argon-air, nitrogen-air and oxygen-air plasmas. Plasma Chem. Plasma Process. 1995, 15, 279–307. [Google Scholar] [CrossRef]
  17. Murphy, A.B. The effect of metal vapour in arc welding. J. Phys. D Appl. Phys. 2010, 43, 434001. [Google Scholar] [CrossRef]
  18. Boulos, M.I.; Fauchais, P.; Pfender, E. Therm. Plasmas: Fundamentals and Applications; Springer: New York, NY, USA, 1994; pp. 4–5. [Google Scholar]
Figure 1. Schematic of welding torch design.
Metals 11 01677 g001
Figure 2. Schematic and photograph of shadowgraph experiment, (a) Schematic, (b) Photograph.
Metals 11 01677 g002
Figure 3. Schematic of sampling points for nitrogen fraction measurement.
Metals 11 01677 g003
Figure 4. Schematic of simulation region.
Metals 11 01677 g004
Figure 5. Results of shadowgraph observation. (a) Influence of nozzle length; (b) Influence of nozzle diameter; (c) Influence of orifice number; (d) Influence of orifice diameter; (e) Influence of gas flowrate.
Metals 11 01677 g005aMetals 11 01677 g005b
Figure 6. Results of nitrogen fraction measurement. (a) Influence of nozzle length; (b) Influence of nozzle diameter; (c) Influence of orifice number; (d) Influence of orifice diameter; (e) Influence of gas flowrate.
Metals 11 01677 g006aMetals 11 01677 g006b
Figure 7. Calculated gas flow velocity distribution. (a) Influence of nozzle length; (b) Influence of nozzle diameter; (c) Influence of orifice number; (d) Influence of orifice diameter; (e) Influence of gas flowrate.
Metals 11 01677 g007aMetals 11 01677 g007b
Figure 8. Averaged vertical gas flow velocity at the nozzle exit. (a) Influence of nozzle length; (b) Influence of nozzle diameter; (c) Influence of orifice number; (d) Influence of orifice diameter; (e) Influence of gas flowrate.
Metals 11 01677 g008aMetals 11 01677 g008b
Figure 9. Relationship between nitrogen fraction and averaged vertical gas flow velocity at the nozzle exit.
Metals 11 01677 g009
Table 1. Design parameters of welding torch.
Design NumberNozzle Length (mm)Nozzle Diameter (mm)Orifice NumberOrifice Diameter (mm)Remark
147162 × 82.0Standard
258162 × 82.0Influence of nozzle length
336162 × 82.0
447192 × 82.0Influence of nozzle diameter
547132 × 82.0
647161 × 82.0Influence of orifice number
747163 × 82.0
847162 × 81.5Influence of orifice diameter
947162 × 82.5
Table 2. Observation condition.
Welding ParametersValue
CameraMemrecam Q1-V
Close-up lensMicro-Nikkor 105mm 1:2.8
Frame rate4000 fps
Aperturef/5.6
Exposure time51 μs
FilterND 4 + 640 nm
Table 3. Welding condition.
Welding ParametersValue
Welding current280 A
Welding voltage30 V
Welding travel speed5 mm/s
Publisher’s Note: MDPI stays neutral with regard to jurisdictional claims in published maps and institutional affiliations.

