Abstract
Carbon-containing Fe-Mn alloys have been developed for the materials for stent application. The alloys fabricated by the powder metallurgy route retain a significant amount of porosity and require a longer sintering time. In this study, the corrosion behavior and cytotoxicity of FeMnC alloy fabricated by powder metallurgy were investigated. The ball-milling process was applied to increase the sample density. Mn content was set to 25 or 35 wt.%, while 1 wt.% carbon was added to all samples. The austenite stability was independent of porosity and the ball-milling process, whereas hardness had a strong dependence on porosity and the ball-milling process. The corrosion resistance of FeMnC alloy depends mainly on the porosity rather than Mn content. The concentration of Fe ions was higher than that of Mn ions in all immersion times in the Ringer’s lactate solution. The released metallic ion concentration rate is also dependent on the porosity of the sample rather than Mn content. However, the ion concentration was lower than the upper intake limit. The extract of FeMnC alloy in Ringer’s lactate solution reduced cell viability. The ball-milled (BM) FeMnC alloys showed higher cell viability than the non-BM sample. However, the FeMnC alloy shows the same level of biocompatibility as SS316L. This result indicates that the FeMnC alloy has a suitable corrosion behavior and proven biocompatibility for biodegradable materials.
1. Introduction
Metallic biomaterials have attracted extensive attention for biodegradable material owing to their excellent mechanical properties compared with polymer-based materials [1,2]. Therefore, metallic biodegradable materials have been utilized for load-bearing devices in orthopedic, cardiovascular, and pediatric applications. Magnesium, zinc, iron, and their alloys are three major materials applied as biodegradable materials. Magnesium and its alloys show the highest degradation rate, followed by zinc and its alloys [3,4,5,6]. Besides having a high degradation rate, magnesium and its alloys produce a large amount of hydrogen gas that retards the healing process and can deteriorate the materials. Generally, zinc alloy exhibits a high degradation rate and has biocompatibility concerns [5,6,7,8,9]. For instance, high doses of zinc ingested over extended periods will result in a cytotoxic influence on cell culture, whereas lower doses are associated with increased viability of osteoblasts and mesenchymal stem cells [5,10,11,12].
Moreover, iron and ferrous alloys have been developed as biodegradable implant materials. The pure iron stent inserted into the aorta would not cause any toxicity because of the slow degradation rate of pure iron [13]. Considering that pure iron has a low degradation rate and ferromagnetic property, ferromanganese-based austenitic steels have been developed. For example, Fe-35% Mn [14] and Fe-35%Mn–Pd alloys [15] have been proposed as the materials for stent application with comparable mechanical properties along with a 316L grade stainless steel even, but these materials have a lower degradation rate than Mg alloy. A new Fe–Mn alloy has been introduced for biodegradable steels by adding carbon as the third element [16,17,18]. Mouzou et al. [16] and Conti et al. [17] proposed to reduce Mn concentration while adding carbon. Both researchers fabricated the alloy through a casting and metalworking process. The authors have proposed carbon-bearing austenitic Fe-35Mn and Fe-25Mn alloys via a blended element powder metallurgy (PM) method [18]. Results show that carbon addition and the basic elements PM (BEPM) method is an effective method for the fabrication of a stable austenitic FeMnC alloy. Moreover, the alloys have prospective properties to be applied as degradable materials for coronary stents, but the addition of Mn at a high concentration might alter the degradation rate of the materials. However, the FeMnC alloys fabricated by BEPM retain a significant porosity and require a longer sintering time. The mechanical properties of the materials can be deteriorated by the porosity, even though the porosity may accelerate the degradation rate [19]. The diffusion of Mn atoms in the austenitic matrix is two orders of magnitude slower than that of C atoms because the atomic size of Mn is much larger than that of the C atom [18]. The mechanical milling process can be applied to the sample and has the advantages of reducing the porosity, increasing density, and distributing the elements homogenously. The process can improve the fabrication of the sample to be more uniform and denser. Hence, the corrosion behavior, biocompatibility, and mechanical properties of the ball-milled (BM) samples will differ from the non-BM samples. The relationships among Mn content, fabrication method with the corrosion behavior, and cell viability behavior of FeMnC alloys should be evaluated.
The present study evaluated the effects of Mn content and porosity on metallic ions’ corrosion behavior and detachment rate in FeMnC alloys fabricated via BEPM with the ball-milling process. Then, the cell viability of the samples was investigated to clarify the biocompatibility of the materials.
2. Materials and Methods
In the present study, Fe-25wt.%Mn-1wt.%C and Fe-35wt.%Mn-1wt.%C alloys were used as samples. Then, the alloys were designated as Fe25Mn1C and Fe35Mn1C samples. Industrial-grade iron, manganese, and graphite powders were used as raw materials. Table 1 shows the purity and particle size of the powders used.

Table 1.
Particle size and purity of powders in this experiment.
The samples were prepared separately by blending the powders by hand-mixing in a mortar or mechanical ball milling. The hand-mixed sample and the mechanically milled powders are defined as non-BM and BM samples, respectively. Then, ball-milling was performed using a planetary ball mill with 8:1 as the ball-to-powder ratio at 500 rpm for 10 h. The BM and non-BM powders were filled to a die cavity with a diameter of 10 mm. The samples were then compacted under a pressure of 3.5 MPa for 0.9 ks by using a universal testing machine in the cylinder at ambient temperature. The vacuum furnace was utilized for the sintering process. Argon gas was injected at room temperature into the sintering chamber for the inert gas environment. The injection of argon gas was stopped when the chamber’s pressure reached around 1 atm. Then, the samples were subjected to sintering at 1100 °C for 3 h and furnace cooling. For repeatability, three to four samples were fabricated for each type of alloy. Moreover, three to four times successive measurements under the same conditions have been performed for each investigation and measurement.
Microstructures were observed by optical microscopy (Olympus BX41-LED, Tokyo Japan) and scanning electron microscopy-energy dispersive spectrometer (Zeiss Leo 420i, Jena, Germany). The samples for optical microscopy (OM) were sectioned, mechanically polished, and etched by an aqua regia. Phase identification for mixed powder and sintered material were performed using XRD with copper Kα radiation at a scanning rate of 2°/min. Ferrite scope used a low-frequency (168 Hz) alternating current, which induces a magnetic field on the specimens. If a ferrite grain is detected, it will increase the strength of the alternating magnetic field, and the probe will record the increase as voltage. The area was scanned in several positions within the area of measurement around 2–3 mm. The hardness and apparent density of the sintered samples were tested using the Rockwell B and Archimedes’ method, respectively. The apparent density was evaluated by Archimedes’ method, which applies the principle of mass ratio sample in air and water. The porosity of the sample was calculated by dividing the apparent density by the theoretical density.
Electrochemical impedance spectroscopy and potentiodynamic polarization were conducted using Autolab PGstat (Metro ohm, Herisau, Switzerland). The corrosion test was carried out using potentiodynamic polarization based on the ASTM G5 method in Ringer’s lactate (Ringer’s) solution. The Ringer’s solution was composed of 1.55 g/L of sodium lactate, 3 g/L of sodium chloride, 0.15 g/L of potassium chloride, and 0.1 g/L of calcium chloride. It was selected as the potentiodynamic polarization, immersion test, and cytotoxicity solution because it is a simple simulated body fluid. The simulated body fluid minimizes the undesirable effect during the cytotoxicity test owing to the cell sensitivity. A three-electrode system was used as the setup for potentiodynamic polarization with Ag/AgCl as reference and graphite as counter electrode. The scanning was conducted from −200 mV to 200 mV versus open circuit potential (OCP). Specimens with an exposed area of 0.8 cm2 were prepared by mechanical grinding for surface preparation. The potentiodynamic polarization was conducted with 1 mV/s with delay time for stabilization of 30 min. For measuring ion detachment, samples were immersed into the Ringer’s solution for 1, 3, and 5 days, and the extract was measured using atomic adsorption spectroscopy.
Electrochemical impedance spectroscopy (EIS) was applied to investigate the impedance on the surface of the samples in the Hanks’ solution as an environmental medium. The Hank’s solution was composed of 8 g/L of NaCl, 0.4 g/L of KCl, 0.72 g/L of CaCl2, 0.35 g/L of NaHCO3, 0.25 g/L of KH2PO4, 0.12 g/L of Na2HPO4.H2O, 1 g/L of MgCl2, 0.06 g/L of MgSO4.7H2O, and 1 g/L of D-glucose. The Hanks solution has more complex ions than the Ringer’s solution. Hence, it will be a suitable solution for investigating the formation of the corrosion product layer on the sample. The EIS spectra were collected by using the following paramenters: a frequency range of 0.01 to 100,000 Hz, an amplitude of 5 mV relative to the OCP, and a sampling rate of 10 points per decade. The corrosion resistance of the sample’s surface was obtained from the plot of the real impedance (Z Real) versus imaginary impedance (Z Imaginary).
Cell viability test was conducted by using an indirect contact method with Osteoblast MG-63 cell line. The sample was cultured in Dulbecco’s modified Eagle’s medium with 10% fetal bovine serum, 100 U/mL of penicillin, and 100 mg/mL of streptomycin at 37 °C in a humidified atmosphere with 5% of CO2 for 24 h. The cell line was incubated for 24 h at 96 wells of tissue culture at a density of 3 × 10³ cells/100 μL to allow attachment. The sample was extracted in the Ringer’s solution for 1–5 days. Each of the extract solutions was added to the tissue culture medium. At least six replicates were studied for each condition and incubated for 72 h. Approximately 20 μL of MTT solution was added into each well to measure cell viability and then acidified isopropanol was added into the well to stop the reaction of MTT after 3 h. The solution absorbance was measured using a microplate reader (Bio Rad 680, Hercules, CA, USA) at 490 nm with a reference wavelength of 630 nm.
3. Results and Discussion
3.1. Phase and Hardness of FeMnC Samples
Figure 1 shows the micrographs of non-BM Fe25Mn1C sample (a) and BM Fe25Mn1C sample (b), micro-morphology of the surface of BM Fe25Mn1C sample after immersion (c), and elemental analysis of the surface of BM Fe25Mn1C sample after immersion (d). The samples were immersed in Ringer’s solution for 7 days. Both samples show an equiaxed structure with pores. The figure also illustrates the surface condition after immersion for 7 days. Although the Fe25MnC sample is shown, a similar condition occurred in Fe35MnC. The elemental analysis indicates some reaction products deposits on the surface. The peaks can be identified for the elements of iron, manganese, carbon, chlorine, and phosphorus, indicating that the reactions of metal alloys and solution occurred, producing solid products on the surface.
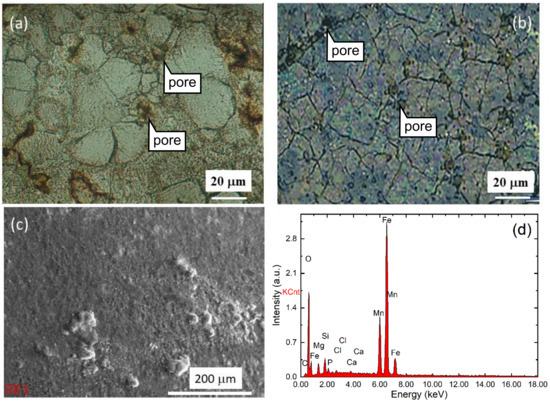
Figure 1.
Micrographs of non-BM Fe25Mn1C sample (a) and BM Fe25Mn1C sample (b), micro-morphology of BM Fe25Mn1C sample’s surface after 7 days immersion (c), and elemental analysis of BM Fe25Mn1 sample’s surface after 7 days immersion (d).
Table 2 shows the porosity of samples, as well as that of Fe-35wt.%. The BM samples have lower porosity than the non-BM and Fe-35wt.%Mn sample. This finding supports that BM can reduce the porosity of the sample [18]. For the non-BM sample, the porosity of the Fe35Mn1C sample was higher than that of the Fe25Mn1C sample. Note that the ball-milling process with the selected milling parameters was suitable for suppressing the formation of pores and obtaining a high density of samples. The BM samples show a contrary result in the porosity, although the porosity difference between the BM sample is small.

Table 2.
Mixing method of the sample powders and their porosity.
Figure 2 shows the XRD diffractograms of the FeMnC samples. Only the face center cubic phase was observed in all samples while carbides were not found. Moreover, the ferritic (α) phase was measured using a ferrite scope, and the results show that the α phase exists less than 1 vol.% in all samples (Figure 3). This finding indicates that all samples exhibit a single austenitic (γ) structure, while Mn and C exist as solute atoms within the austenitic phase. Ferrite contents declined significantly after mechanical milling. Through mechanical milling, manganese and iron powders were mechanically mixed and formed an alloy. Furthermore, alloying was more enhanced owing to diffusion upon sintering.
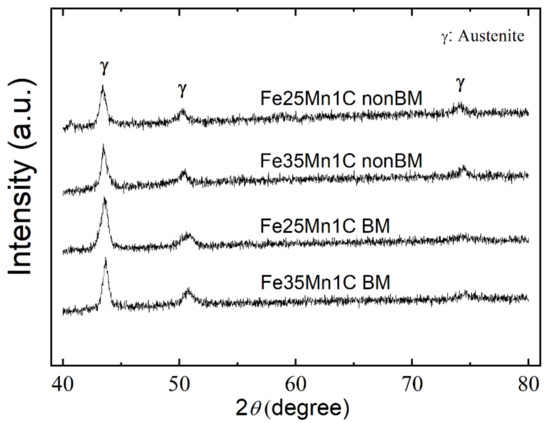
Figure 2.
XRD diffractogram of FeMnC samples.
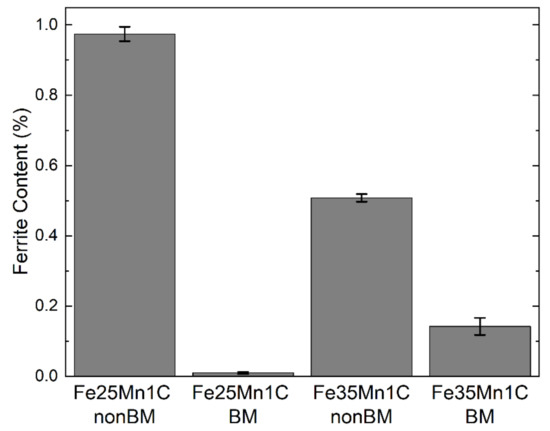
Figure 3.
Relative phase content measured by Ferritescope.
Figure 4 shows the hardness of all samples. The hardness of BM samples is higher than that of the non-BM samples. Considering that the BM process enhances grain refinement [21], it will lead to an increase in the hardness of the BM samples. For the non-BM samples, the Fe25Mn1C sample has a higher hardness than the Fe35Mn1C sample, because the Fe25Mn1C sample is much denser than the Fe35Mn1C sample. Moreover, the BM sample shows that the Fe35Mn1C sample has higher hardness owing to its lower porosity.
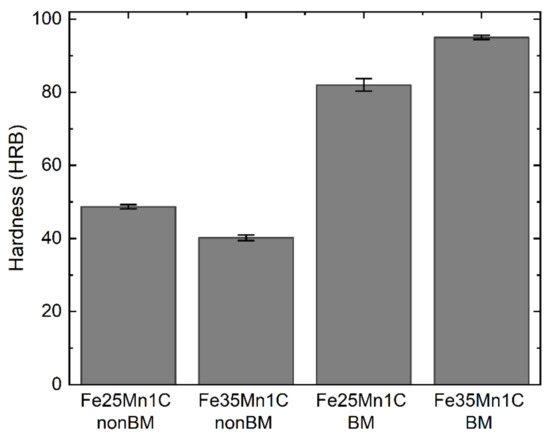
Figure 4.
Hardness of FeMnC samples.
This study showed that carbon addition (1wt.%) might improve the stability of the austenite phase in FeMnC alloys. By comparison, as-fabricated Fe-35wt.%Mn alloy and 20% cold-rolled Fe-35wt.%Mn alloy contain a single γ phase and (γ + ε-martensite) dual-phase, respectively [20]. The stability of the austenitic phase can be improved by increasing Ni equivalent (Nieq) owing to the addition of austenite former [22]. The value of Nieq based on Mn and C content can be expressed as follows:
where y and x are the C and Mn contents in wt.%, respectively. The addition of 1 wt.% C increases the Nieq of Fe35Mn1C sample by 30 compared with Fe-35wt.%Mn alloy. For the Fe25Mn1C sample, the Nieq increases by 25 owing to the deduction of 10wt.%Mn and the addition of 1wt.%C. Hence, the stability of γ phase in Fe35Mn1C and Fe25Mn1C samples is higher than that in Fe-35wt.%Mn alloy.
Nieq = 30y + 0.5x
Empirical equations were applied to calculate the temperature of martensitic-start (Ms) [23] and a stacking fault energy of austenite (γSFE) [24] for the samples. The Ms and γSFE of the Fe25Mn1C sample are −360 °C and 114 MJ/m2, respectively. Moreover, Fe35Mn1C has Ms and γSFE values of −314 °C and 160 MJ/m2, respectively. Considering that the Ms of samples exist in the subzero region, an austenite-to-martensitic transformation will not occur upon furnace cooling. Moreover, an austenite-to-epsilon martensitic transformation will be retarded during plastic deformation, because the γSFE values of both samples are much higher than the occurrence limit of γSFE, that is 20 MJ/m2. Notably, the XRD results show that the samples consist of a single austenite phase, and this result is consistent with the theoretical calculations. Therefore, Fe35Mn1C and Fe25Mn1C samples exhibit a single austenite phase, although Mn content decreased by 10wt.% in the Fe25Mn1C sample.
3.2. Corrosion Behavior of FeMnC Alloys
Figure 5 and Table 3 show the potentiodynamic polarization curves and electrochemical properties of FeMnC samples, respectively, in the Ringer’s solution. The potentiodynamic polarization curves show a typical behavior of uniform corrosion. The corrosion potential Ecorr of all samples is relatively the same. Considering that all samples contain the same amount of C, the effect of carbon on corrosion is insignificant, although the C content could enhance the corrosivity of steel [25]. The samples contain various porosity and Mn content (Table 2). The porosity would affect the corrosion of the FeMnC sample, as reported by Chandramouli et al. [26]. A significant difference in corrosion current–density Icorr and corrosion rate in millimeters per year (mmpy) was observed in the samples. The non-BM samples have higher Icorr and mmpy than the BM samples, indicating that the non-BM samples are more susceptible to corrosion than the BM sample.
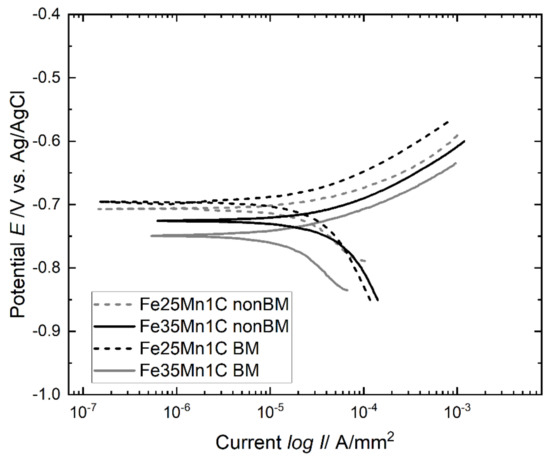
Figure 5.
Representative potentiodynamic polarization curves of FeMnC samples.

Table 3.
Electrochemical properties of FeMnC samples. Values in parentheses show standard deviation.
The behavior of electrochemical impedance of the FeMnC sample in Hank’s solution was investigated. The BM samples were subjected to EIS. Thus, the effect of Mn content on corrosion behavior can be investigated, because the porosities of the BM sample are small and almost the same. Figure 6 shows the Nyquist plots of Fe35Mn1C and Fe25Mn1C samples in the Hank’s solution. Both samples show two semicircles, indicating a high-frequency capacitive and a low-frequency inductive semicircle [27,28]. The capacitive semicircle at high frequency shows the occurrence of a charge transfer during corrosion and the development of protective oxide film on the sample surface [29]. Meanwhile, the inductive semicircle at low frequency exhibits the adsorption of an intermediate corrosion product. In this case, Ringer lactate contained a significant amount of lactic acid (C3H6O3) that could adsorb into the metal surface during the film formation [30].
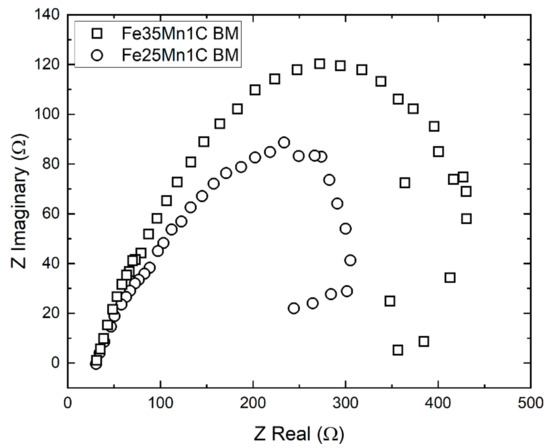
Figure 6.
The Nyquist plots of BM samples in the Hank’s solution.
The capacitive semicircle at the high frequency of the Fe35Mn1C sample has a larger diameter than the Fe25Mn1C sample. The larger diameter of the capacitive semicircle indicates the higher corrosion resistance [29,31]; thus, the Fe25Mn1C sample has higher corrosivity than the Fe35Mn1C sample. The results are consistent with the result of the potentiodynamic polarization of the BM FeMnC sample (Table 3).
Previous studies also showed a similar phenomenon, in which corrosion potentials shift to higher potential values because of increasing porosity content in Fe–Mn and Ni–Ti alloys produced by powder metallurgy [20,32]. The presence of porosity enhances oxygen reduction, which may occur because of the enlargement in the contact area between materials and the environment [33,34]. The micro-galvanic reaction may also occur between the iron-rich area as anode and manganese-rich area as a cathode, in the vicinity of porosity. It can be predicted that the Fe or Mn-rich area in the vicinity of porosity may form because of incomplete diffusion during sintering. The reaction mechanisms as shown by reactions (2) and (3) are as follows:
Based on the precipitation data, Mn may tend to precipitate as hydroxides compared with Fe ion [35]. However, at this stage of the study, the data is not sufficient to elucidate the material balance of metallic ions in simulated body fluids. Most Fe ions dissolve in the solutions. By contrast, Mn ion mainly precipitates as hydroxide on the surface of the alloy.
In Fe–Mn alloys, Icorr and mmpy have a positive correlation with porosity and a negative correlation with Mn content [36]. The increments of Icorr and mmpy owing to 1%-porosity increase are 3.7 μA/cm−2 and 0.045 mm/year, but the increment of Icorr and mmpy owing to 1%Mn-addition are −5.3 μA/cm−2 and −0.062 mm/year, respectively. For the non-BM samples, the Icorr and mmpy of Fe35Mn1C samples are higher than those of the Fe25Mn1C sample. The BM Fe35Mn1C sample shows a lower Icorr and mmpy than the BM Fe25Mn1C sample and the Fe-35wt.%Mn alloy. The differences between Icorr and mmpy between the Fe35Mn1C and Fe25Mn1C samples for the non-BM and BM samples can be explained by the influence of Mn content and porosity and are consistent with Hermawan’s results. Potentiodynamic polarization curves show that uniform corrosion occurs in all samples. Thus, corrosion is influenced by oxygen diffusion, because the pH of the Ringer’s solution is 7.2. The difference between aeration and deaeration between the pores and the surrounding area will promote the porosity to be an ideal site for corrosion.
Based on the EIS result, the decrease in Mn content can deteriorate the corrosion reScheme 3. Based on the potentiodynamic polarization and electrochemical impedance examinations results, the corrosivity of the FeMnC sample is increased owing to the increase of porosity and decrease of Mn content.
3.3. Detachment Rate of Metallic Ions
The detachment rate of metallic ions into their environment strongly influences the toxicity of metallic implants. The Fe and Mn ions concentrations, which were dissolved upon immersion in Ringer’s solution, are shown in Figure 7a,b, respectively. The numbers in the legend indicate a rate of ion release in the unit of mg/L·day. Moreover, the numbers in curly brackets within the figures show the standard deviations. All samples exhibit the same behaviors in which the concentrations of the released ions increased with prolonged immersion time. Among all samples, Fe ions’ detachment rate is higher than that of Mn ions. This result is in good agreement with the fact reported by Hermawan et al. [14]. For the non-BM sample, the detachment of metallic ions (or the concentrations of dissolved ions) of the Fe35Mn1C sample are higher than that of the Fe25Mn1C sample owing to the higher porosity in Fe35Mn1C. The BM Fe25Mn1C sample has a higher detachment of metallic ions compared to the BM Fe35Mn1C sample. It is indicative that the porosity shows a more significant influence in the detachment of metallic ions than the effect of Mn content in the alloys even though the Fe25Mn1C sample shows a negative relationship between the porosity and the rate of ion detachment. This behavior is also consistent with the corrosion rate from Icorr data.
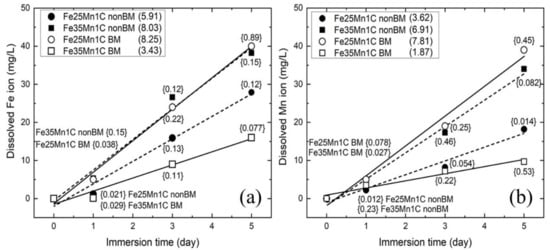
Figure 7.
The concentration of released Fe ion (a) and Mn ion (b) upon immersion in the Ringer’s lactate solution. Numbers in the legend indicate a rate of ion release in the unit of mg/L/day. The numbers in curly brackets show the standard deviation of the released ion concentrations.
Moreover, the toxicity of an element is represented by the upper intake level (UL), which is the maximum daily intake of elements into the human body without posing the risk of adverse health effects [37]. Notably, the concentrations of Fe and Mn ions are lower than the uptake limits for Fe and Mn ions with values of 45 and 11 mg/day, respectively [38]. For instance, the BM Fe25Mn1C sample releases 8.25 mg/L of Fe ion and 7.81 mg/L of Mn ion for each day. Hence, FeMnC samples release Mn and Fe ions upon immersion in the Ringer’s solution, but the concentrations of the released ions show that the FeMnC sample has a small potential risk of adverse health effects to the human body.
In addition, Hermawan et al. [14] found that a fixed metallic ion concentration of 103 mg/L from Fe–Mn alloy with various Mn content does not show a significant effect on cell viability results. The result of the cell viability test by using a fixed concentration of metallic ion could not exhibit the real effect of the detached metallic ion upon the application of the implant. Liu et al. [39] have investigated the effect of released ions of Fe30Mn6Si shape memory alloy on cell viability. Fe and Mn ions released from Fe30Mn6Si are higher compared with those from Fe–Mn alloy. Therefore, the cell viability of Fe30Mn6Si is lower than that of Fe–Mn alloy.
3.4. Cell Viability
The interaction between material and biological cells was determined using the MTT assay. All FeMnC samples were extracted in the Ringer’s solution for three immersion times of 1, 3, and 5 days. Figure 8 shows the result of the cell viability test upon incubation for 72 h. The results of cell viability tests for 316L stainless steel are also shown in Figure 8. The SS316L shows that cell viability decreases with increasing extraction time to 3 days and slightly increased after a 5-day extraction. The non-BM Fe35Mn1C sample shows that cell viability decreases as extraction time increases while the cell viability of the BM Fe35Mn1C sample decreases with increasing extraction time to 3 days but increases upon a 5-day extraction. On the other side, the non-BM Fe25Mn1C and BM 25Mn1C samples show almost constant cell viability results. Note that the cell viabilities of the FeMnC samples are relatively stable in the range of 45–60% for all extraction times except the non-BM 35Mn1C sample.
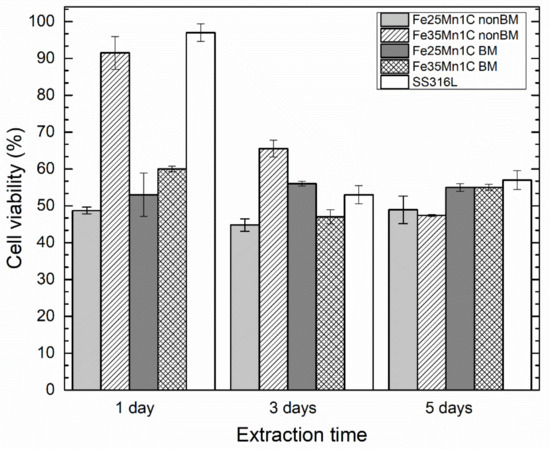
Figure 8.
Results of cell viability test upon incubation for 72 h. All samples were extracted upon immersion from 1 day to 5 days before the cell viability test.
The released Mn ion has a stronger influence on metabolic inhibition to cells than the released Fe ion at the same concentration [14]. Thus, the decrease in cell viability of the FeMnC sample is mainly caused by the inhibitory effect of released Mn ions. Oxidized manganese ions, such as Mn2+ and Mn3+, might be toxic for the cell. These ions damage the cell by attacking the mitochondria of the cells [40].
The difference in cell viability between all samples and SS316L decreases with increasing extraction time. Although the BM samples have higher cell viability compared to the non-BM samples and SS316L shows the highest, all samples and SS316L have almost the same level of cell viability upon extraction for 5 days. Considering that SS316L is a standard gold material for stent application, all samples show low cytotoxicity and good stent application. In the previous subsection, the porosity and Mn concentration affected the Icorr and mmpy. Based on the cell viability test results upon 72 h of incubation, the porosity also influences the cell viability. For instance, the non-BM samples, which have more porosity, show lower viability than the BM samples, which are denser. Based on the aforementioned results, the corrosion and cell viability tests show a good sign for Fe25Mn1C and Fe35Mn1C samples fabricated by non-BM and BM (mechanical milling) methods to be applied as biodegradable material for stent application.
4. Conclusions
The addition of carbon in FeMnC samples (Fe25Mn1C and Fe35Mn1C alloys) fabricated by the combination of the ball-milling process and basic elements powder metallurgy (BEPM) is an effective method to improve the stability of the austenite phase. The corrosion resistance of FeMnC alloys in simulated body fluids decreased with increasing porosity. The porosity likely plays a significant role in corrosion resistance and detachment of metallic ions of the FeMnC alloys rather than the effect of Mn content. Ball-milling of FeMnC powders before sintering can provide high cell viability. Thus, FeMnC alloys have low cytotoxicity and show a good sign for biodegradable materials such as stent material application.
Author Contributions
Conceptualization, J.S. and S.H.; methodology, Y.P. (Yudha Pratesa), Y.P. (Yudi Prasetyo) and S.H.; validation, S.H. and J.S.; formal analysis, Y.P. (Yudha Pratesa) and Y.P. (Yudi Prasetyo); investigation, Y.P. (Yudha Pratesa) and Y.P. (Yudi Prasetyo); resources, S.H.; data curation, J.S. and S.H.; writing—original draft preparation, J.S.; writing—review and editing, Y.P. (Yudha Pratesa) and S.H.; visualization, Y.P. (Yudha Pratesa), Y.P. (Yudi Prasetyo), J.S. and S.H.; supervision, S.H. and J.S.; project administration, S.H.; funding acquisition, S.H. All authors have read and agreed to the published version of the manuscript.
Funding
The authors gratefully acknowledge the financial support of the Research Grant PITTA from Universitas Indonesia 2018–2019. YA would like to thank the scholarship from Lembaga Pengelola Dana Beasiswa (LPDP) 2018–2022.
Institutional Review Board Statement
Not available.
Informed Consent Statement
Osteoblast MG 63 used in the study was a cell line. It was obtained from Boy M. Bachtiar of Faculty of Dentistry, Universitas Indonesia, as a donation from Sutatip Kamolmatyakul, from Prince of Songkla University, Thailand. The authors gratefully acknowledge the supports from Boy M. Bachtiar of Universitas Indonesia and Sutatip Kamolmatyakul of Prince Songkla University, Thailand.
Data Availability Statement
Not available.
Conflicts of Interest
The authors declare no conflict of interest.
References
- Navarro, M.; Michiardi, A.; Castaño, O.; Planell, J.A. Biomaterials in orthopaedics. J. R. Soc. 2008, 5, 1137–1158. [Google Scholar] [CrossRef] [Green Version]
- Bose, S.; Roy, M.; Bandyopadhyay, A. Recent advances in bone tissue engineering scaffolds. Trends Biotech. 2012, 30, 546–554. [Google Scholar] [CrossRef] [Green Version]
- Witte, F.; Kaese, V.; Haferkamp, H.; Switzer, E.; Meyer-Lindenberg, A.; Wirth, C.J.; Windhagen, H. In vivo corrosion of four magnesium alloys and the associated bone response. Biomaterials 2005, 26, 3557–3563. [Google Scholar] [CrossRef]
- Zander, D.; Schnatterer, C. The influence of manufacturing processes on the microstructure and corrosion of the AZ91D magnesium alloy evaluated using a computational image analysis. Corros. Sci. 2015, 98, 291–303. [Google Scholar] [CrossRef]
- Törne, K.; Örnberg, A.; Weissenrieder, J. Influence of strain on the corrosion of magnesium alloys and zinc in physiological environments. Acta Biomater. 2017, 48, 541–550. [Google Scholar] [CrossRef] [PubMed]
- Törne, K.; Örnberg, A.; Weissenrieder, J. The influence of buffer system and biological fluids on the degradation of magnesium. J. Biomed. Mater. Res. B Appl. Biomater. 2017, 105, 1490–1502. [Google Scholar] [CrossRef] [PubMed]
- Shearier, E.R.; Bowen, P.K.; He, W.; Drelich, A.; Drelich, J.; Goldman, J.; Zhao, F. In Vitro Cytotoxicity, Adhesion, and Proliferation of Human Vascular Cells Exposed to Zinc. ACS Biomater. Sci. Eng. 2016, 2, 634–642. [Google Scholar] [CrossRef] [Green Version]
- Katarivas Levy, G.; Goldman, J.; Aghion, E. The Prospects of Zinc as a Structural Material for Biodegradable Implants—A Review Paper. Metals 2017, 7, 402. [Google Scholar] [CrossRef] [Green Version]
- Kafri, A.; Ovadia, S.; Goldman, V.; Drelich, J.; Aghion, E. The Suitability of Zn–1.3%Fe Alloy as a Biodegradable Implant Material. Metals 2018, 8, 153. [Google Scholar] [CrossRef] [Green Version]
- Oh, S.-A.; Kim, S.-H.; Won, J.-E.; Kim, J.-J.; Shin, U.S.; Kim, H.-W. Effects on Growth and Osteogenic Differentiation of Mesenchymal Stem Cells by the Zinc-Added Sol-Gel Bioactive Glass Granules. J. Tissue Eng. 2010, 1, 475260. [Google Scholar] [CrossRef]
- Yusa, K.; Yamamoto, O.; Fukuda, M.; Koyota, S.; Koizumi, Y.; Sugiyama, T. In vitro prominent bone regeneration by release zinc ion from Zn-modified implant. Biochem. Biophys. Res. Commun. 2011, 412, 273–278. [Google Scholar] [CrossRef]
- Murni, N.S.; Dambatta, M.S.; Yeap, S.K.; Froemming, G.R.A.; Hermawan, H. Cytotoxicity evaluation of biodegradable Zn–3Mg alloy toward normal human osteoblast cells. Mater. Sci. Eng. C Mater. Biol. Appl. 2015, 49, 560–566. [Google Scholar] [CrossRef]
- Peuster, M.; Hesse, C.; Schloo, T.; Fink, C.; Beerbaum, P.; von Schnakenburg, C. Long-term biocompatibility of a corrodible peripheral iron stent in the porcine descending aorta. Biomaterials 2006, 27, 4955–4962. [Google Scholar] [CrossRef] [PubMed]
- Hermawan, H.; Purnama, A.; Dubé, D.; Couet, J.; Mantovani, D. Fe–Mn alloys for metallic biodegradable stents: Degradation and cell viability studies. Acta Biomater. 2010, 6, 1852–1860. [Google Scholar] [CrossRef]
- Moszner, F.; Gerstl, S.S.A.; Uggowitzer, P.J.; Löffler, J.F. Structural and chemical characterization of the hardening phase in biodegradable Fe–Mn–Pd maraging steels. J. Mater. Res. 2014, 29, 1069–1076. [Google Scholar] [CrossRef] [Green Version]
- Mouzou, E.; Paternoster, C.; Tolouei, R.; Purnama, A.; Chevallier, P.; Dubé, D.; Prima, F.; Mantovani, D. Tin vitro degradation behavior of Fe-20Mn-1.2C alloy in three different pseudo-physiological solutions. Mater. Sci. Eng. C Mater. Biol. Appl. 2016, 61, 564–573. [Google Scholar] [CrossRef]
- Conti, M.C.; Aquilina, D.; Paternoster, C.; Vella, D.; Sinagra, E.; Mantovani, D.; Cassar, G.; Wismayer, P.S.; Buhagiar, J. Influence of cold rolling on in vitro cytotoxity and electrochemical behaviour of an Fe-Mn-C biodegradable alloy in physiological solutions. Heliyon 2018, 4, e00926. [Google Scholar] [CrossRef] [Green Version]
- Harjanto, S.; Pratesa, Y.; Prasetyo, Y.; Suharno, B.; Syarif, J.; Hakim, F. Properties of Fe-Mn-C alloy as degradable biomaterials candidate for coronary stent. Adv. Mater. Res. 2013, 783, 210–214. [Google Scholar] [CrossRef]
- Harjanto, S.; Pratesa, Y.; Suharno, B.; Syarif, J. Corrosion Behavior of Fe-Mn-C Alloy as Degradable Materials Candidate Fabricated via Powder Metallurgy Process. Adv. Mater. Res. 2012, 576, 386–389. [Google Scholar] [CrossRef]
- Hermawan, H.; Alamdari, H.; Mantovani, D.; Dubé, D. Iron–manganese: New class of metallic degradable biomaterials prepared by powder metallurgy. Powder Metall. 2008, 51, 38–45. [Google Scholar] [CrossRef]
- Abdollahi, A.; Alizadeh, A.; Baharvandi, H.R. Dry sliding tribological behavior and mechanical properties of Al2024–5wt.%B4C nanocomposite produced by mechanical milling and hot extrusion. Mater. Des. 2014, 55, 471–481. [Google Scholar] [CrossRef]
- Wendler, M.; Weiß, A.; Krüger, L.; Mola, J.; Franke, A.; Kovalev, A.; Wolf, S. Effect of Manganese on Microstructure and Mechanical Properties of Cast High Alloyed CrMnNi-N Steels. Adv. Eng. Mater. 2013, 15, 558–565. [Google Scholar] [CrossRef]
- Ishida, K. Calculation of the effect of alloying elements on the Ms temperature in steels. J. Alloys Compd. 1995, 220, 126–131. [Google Scholar] [CrossRef]
- Dai, Q.X.; Wang, A.D.; Cheng, X.N.; Luo, X.M. Stacking fault energy of cryogenic austenitic steels. Chin. Phys. 2002, 11, 596–600. [Google Scholar]
- Guo, J.; Yang, S.; Shang, C.; Wang, Y.; He, X. Influence of carbon content and microstructure on corrosion behaviour of low alloy steels in a Cl− containing environment. Corros. Sci. 2009, 51, 242–251. [Google Scholar] [CrossRef]
- Chandramouli, R.; Kandavel, T.K.; Shanmugasundaram, D.; Ashok Kumar, T. Deformation, densification, and corrosion studies of sintered powder metallurgy plain carbon steel preforms. Mater. Des. 2007, 28, 2260–2264. [Google Scholar] [CrossRef]
- Lv, W.; Pan, C.; Su, W.; Wang, Z.; Liu, S.; Wang, C. A Study on Atmospheric Corrosion of 304 Stainless Steel in a Simulated Marine Atmosphere. J. Mater. Eng. Perform. 2015, 24, 2597–2604. [Google Scholar] [CrossRef]
- Zhao, Q.-H.; Liu, W.; Zhu, Y.-C.; Zhang, B.-L.; Li, S.-Z.; Lu, M.-X. Effect of Small Content of Chromium on Wet–Dry Acid Corrosion Behavior of Low Alloy Steel. Acta Metall. Sin-Engl. 2017, 30, 164–175. [Google Scholar] [CrossRef]
- Barranco, V.; Feliu, S., Jr.; Feliu, S. EIS study of the corrosion behaviour of zinc-based coatings on steel in quiescent 3% NaCl solution. Part 1: Directly exposed coatings. Corros. Sci. 2004, 46, 2203–2220. [Google Scholar] [CrossRef]
- Farelas, F.; Galicia, M.; Brown, B.; Nesic, S.; Castaneda, H. Evolution of dissolution processes at the interface of carbon steel corroding in a CO2 environment studied by EIS. Corros. Sci. 2010, 52, 509–517. [Google Scholar] [CrossRef]
- Zheng, Z.J.; Gao, Y.; Gui, Y.; Zhu, M. Corrosion behaviour of nanocrystalline 304 stainless steel prepared by equal channel angular pressing. Corros. Sci. 2012, 54, 60–67. [Google Scholar] [CrossRef]
- Sun, X.T.; Kang, Z.X.; Zhang, X.L.; Jiang, H.J.; Guan, R.F.; Zhang, X.P. A comparative study on the corrosion behavior of porous and dense NiTi shape memory alloys in NaCl solution. Electrochim. Acta 2011, 56, 6389–6396. [Google Scholar] [CrossRef]
- Čapek, J.; Vojtěch, D. Properties of porous magnesium prepared by powder metallurgy. Mater. Sci. Eng. C Mater. Biol. Appl. 2013, 33, 564–569. [Google Scholar] [CrossRef]
- Fojt, J.; Joska, L.; Málek, J. Corrosion behaviour of porous Ti–39Nb alloy for biomedical applications. Corros. Sci. 2013, 71, 78–83. [Google Scholar] [CrossRef]
- Monhemius, A.J. Precipitation diagrams for metals hydroxides, sulphides, arsenates and phospates. Trans. Inst. Min. Metall. Sect. C 1977, 86, C202–C206. [Google Scholar]
- Hermawan, H.; Dubé, D.; Mantovani, D. Degradable metallic biomaterials: Design and development of Fe–Mn alloys for stents. J. Biomed. Mater. Res. A 2010, 93, 1–11. [Google Scholar] [CrossRef]
- Barr, S.I.; Murphy, S.P.; Poos, M.I. Interpreting and using the dietary references intakes in dietary assessment of individuals and groups. J. Am. Diet. Assoc. 2002, 102, 780–788. [Google Scholar] [CrossRef]
- Trumbo, P.; Yates, A.A.; Schlicker, S.; Poos, M. Dietary Reference Intakes—Vitamin A, Vitamin K, Arsenic, Boron, Chromium, Copper, Iodine, Iron, Manganese, Molybdenum, Nickel, Silicon, Vanadium, and Zinc. J. Am. Diet. Assoc. 2001, 101, 294–301. [Google Scholar] [CrossRef]
- Liu, B.; Zheng, Y.F.; Ruan, L. In vitro investigation of Fe30Mn6Si shape memory alloy as potential biodegradable metallic material. Mater. Lett. 2011, 65, 540–543. [Google Scholar] [CrossRef]
- Chen, J.Y.; Tsao, G.C.; Zhao, Q.; Zheng, W. Differential cytotoxicity of Mn(II) and Mn(III): Special reference to mitochondrial [Fe-S] containing enzymes. Toxicol. Appl. Pharmacol. 2001, 175, 160–168. [Google Scholar] [CrossRef] [Green Version]
Publisher’s Note: MDPI stays neutral with regard to jurisdictional claims in published maps and institutional affiliations. |
© 2021 by the authors. Licensee MDPI, Basel, Switzerland. This article is an open access article distributed under the terms and conditions of the Creative Commons Attribution (CC BY) license (https://creativecommons.org/licenses/by/4.0/).