Abstract
Multi principal element alloys have attracted interests as a promising way to balance the bottleneck of the “inverse relationship” between high hardness and high fracture toughness. In the present study, the authors demonstrate the effects of Ti addition on the microstructures and mechanical properties of the CoCrFeNiTix alloys (x values in molar ratio, x = 0.7, 1.0, and 1.2), which exhibits a multi-phase structure containing face-centered cubic phase and various secondary phases, such as sigma, Laves, and (Cr,Fe)-rich phase. Throughout the combined experimental examination and modeling, we show that superb hardness (~9.3 GPa) and excellent compressive strength (~2.4 GPa) in our alloy system are attributed to solid-solution strengthening of the matrix and the formation of hard secondary phases. In addition, high indentation fracture toughness is also derived from the toughening mechanism interplay within the multiple-phase microstructure. At the fundamental level, the results suggest that multi-principal element alloys containing dual or multi-phase structures may provide a solution for developing structural alloys with enhanced strength-toughness synergy.
1. Introduction
Since their discovery half a century ago, topologically closed packed (TCP) atomic structures [1,2] have been attracting the interest of academia and industries because of their corrosion resistance [3], superior hydrogen absorption [4], and excellent high-temperature creep resistance [5]. Because of their exceptional mechanical properties at high temperature, TCP phase materials have been considered competent candidates for the industrial/structural application at the elevated temperature condition, such as nuclear reactor components and spaceship engines. However, the inherent brittleness of TCP phase-based materials prevents them from having wider applications in industries. In principle, the brittleness of TCP phases originates from their close-packed complex atomic structure [6], which makes dislocation nucleation/movement very difficult [7]. For example, the Laves phase, which is one kind of the most well-known TCP phases, is famous not only for high strength and hardness (~9 GPa), but also for its low fracture toughness (~1 ), which significantly limits their use as a structural material. To circumvent the “inherent” brittleness of TCP phases, there have been attempts to toughen them by combining a ductile phase to form a dual or multi-phase metallic composite. For instance, Davidson et al. [8] showed that, although the pure Laves phase Cr2Nb possessed a rather poor fracture toughness of 1.5 at room temperature, the Nb-Cr2Nb dual phase composite showed a fracture toughness of 6 when the volume fraction of the ductile phase Nb reached 50%.
On the other hand, the recent research regarding the development of multi-principal element alloys provides a new route to make TCP phase-based composites even tougher and more appealing to structural application. These multi-principal element alloys were considered to possess a high configurational entropy and therefore were known as high entropy alloys [9,10,11,12]. Unlike conventional alloys with one or two base elements, owing to the effects of high entropy, including stabilizing random solid solutions [9], sluggish diffusion [13], lattice distortion [14,15] and the “cocktail” effect [16], these multi-principal element alloys are believed to be endowed with special properties, often a combination of attractive mechanical properties, such as high strength, good plasticity, and excellent toughness [17,18]. The discovery of these new paradigm alloys is intriguing and promising, which indicates that the TCP phase formed in multi-principal element alloys may remain hard, but not as brittle as conventional TCP phase alloys. For example, in 2013, Hsu et al. [19] fabricated a series of AlxCoCrFeMo0.5Ni dual-phase HEAs consisting of body centered cubic (BCC) and sigma phases, which exhibited excellent hardness of 720 HV and maintained reasonably good indentation toughness at room temperature. Recently, in 2019, Chung et al. [20] designed the CoCrFeNiNb0.5 HEA, which contains ~50% C14 Laves phase and ~50% FCC. As a result, this dual phase eutectic composite exhibited superb hardness with superior fracture toughness of ~14 .
Inspired by these past studies, for this study, we developed CoCrFeNiTix (x values in molar ratio, x = 0.7, 1.0, and 1.2) multi principal element alloys containing multiple phases, such as face centered cubic (FCC) and various TCP (Laves, sigma and new (Cr,Fe)-rich) phases. Subsequently, we performed a comprehensive study of the strength and fracture behavior of these newly developed HEAs through hardness, compression and indentation fracture toughness tests at room temperature. By the experiments and modeling, in this work, we show that these enhanced strength and fracture resistance properties are attributed to the heterogeneous multiple phase microstructures.
2. Materials and Methods
A series of CoCrFeNiTix alloy ingots (x values in molar ratio, x = 0.2, 0.3, 0.4, 0.7, 1.0, and 1.2) were fabricated in a vacuum induction melting furnace in an Ar atmosphere. All of the elements used in the fabrication had a purity higher than 99.9%. A total of 50 g of the master alloy was molten and cast into rectangular Cu molds (60 mm × 12 mm × 6 mm), and cooled by circulating cooling water. The possible crystal structures in our alloy samples were identified using X-ray diffractometry (XRD, D/Max 2500, Rigaku, Japan), with the scanning angles ranging from 20 to 100° at a scanning rate of 4° per minute. Subsequently, the alloy samples were taken out for mechanical grinding and polishing, and the microstructure and composition of these alloys were analyzed using a scanning electron microscope (SEM, JEOL JSM-6610, Japan) with an attached X-ray energy dispersive spectrometer (SEM-EDS, JEOL, Japan), where EDS was operated at an accelerating voltage of 15 kV for point analyses.
For the CoCrFeNiTix alloys with x = 0.7, 1.0, and 1.2, macro-hardness and modulus were measured with an indentation tester (HM-211, Mitutoyo, Japan) using a Vickers tip. During each indentation, the load was increased up to 2 N, which is sufficient to measure the average properties of the multi-phase microstructure. Furthermore, to evaluate the properties of the individual phases, micro-indentation tests were carried out on the nanoindentation system (NHT3, Anton Paar, Germany) using a Berkvich diamond tip. During each indentation, the load was linearly increased up to 20 mN with the indent depth around 400 nm. This led to an average indentation size of 1.5 μm. The properties of these samples were averaged over multiple indentation tests in order to ensure the data reproductivity. Compression tests were also carried out at room temperature with a constant strain rate of 10−3 s−1. The dimensions of the compressive specimens were D = 3 mm (diameter) and H = 6 mm (height).
For the measurement of indentation fracture toughness, indentations with a Vickers diamond pyramid indenter (HV-112, Mitutoyo, Japan) at a test load of 98 N were conducted on polished sample surfaces, which were free from any pre-cracks and defects. The indentation fracture toughness K values were calculated using an equation proposed by Niihara et al. [21], expressed as:
where H is the macro-hardness of the alloys, E is Young’s modulus, P is the applied indentation load, and is the length of cracks emanating from the edges of Vickers indents. At least five indentation SEM images were used to obtain averaged crack lengths. Afterwards, the indentation impressions and cracks were examined with SEM technique to investigate the possible toughening mechanisms.
3. Results and Discussion
3.1. Structure Characterization
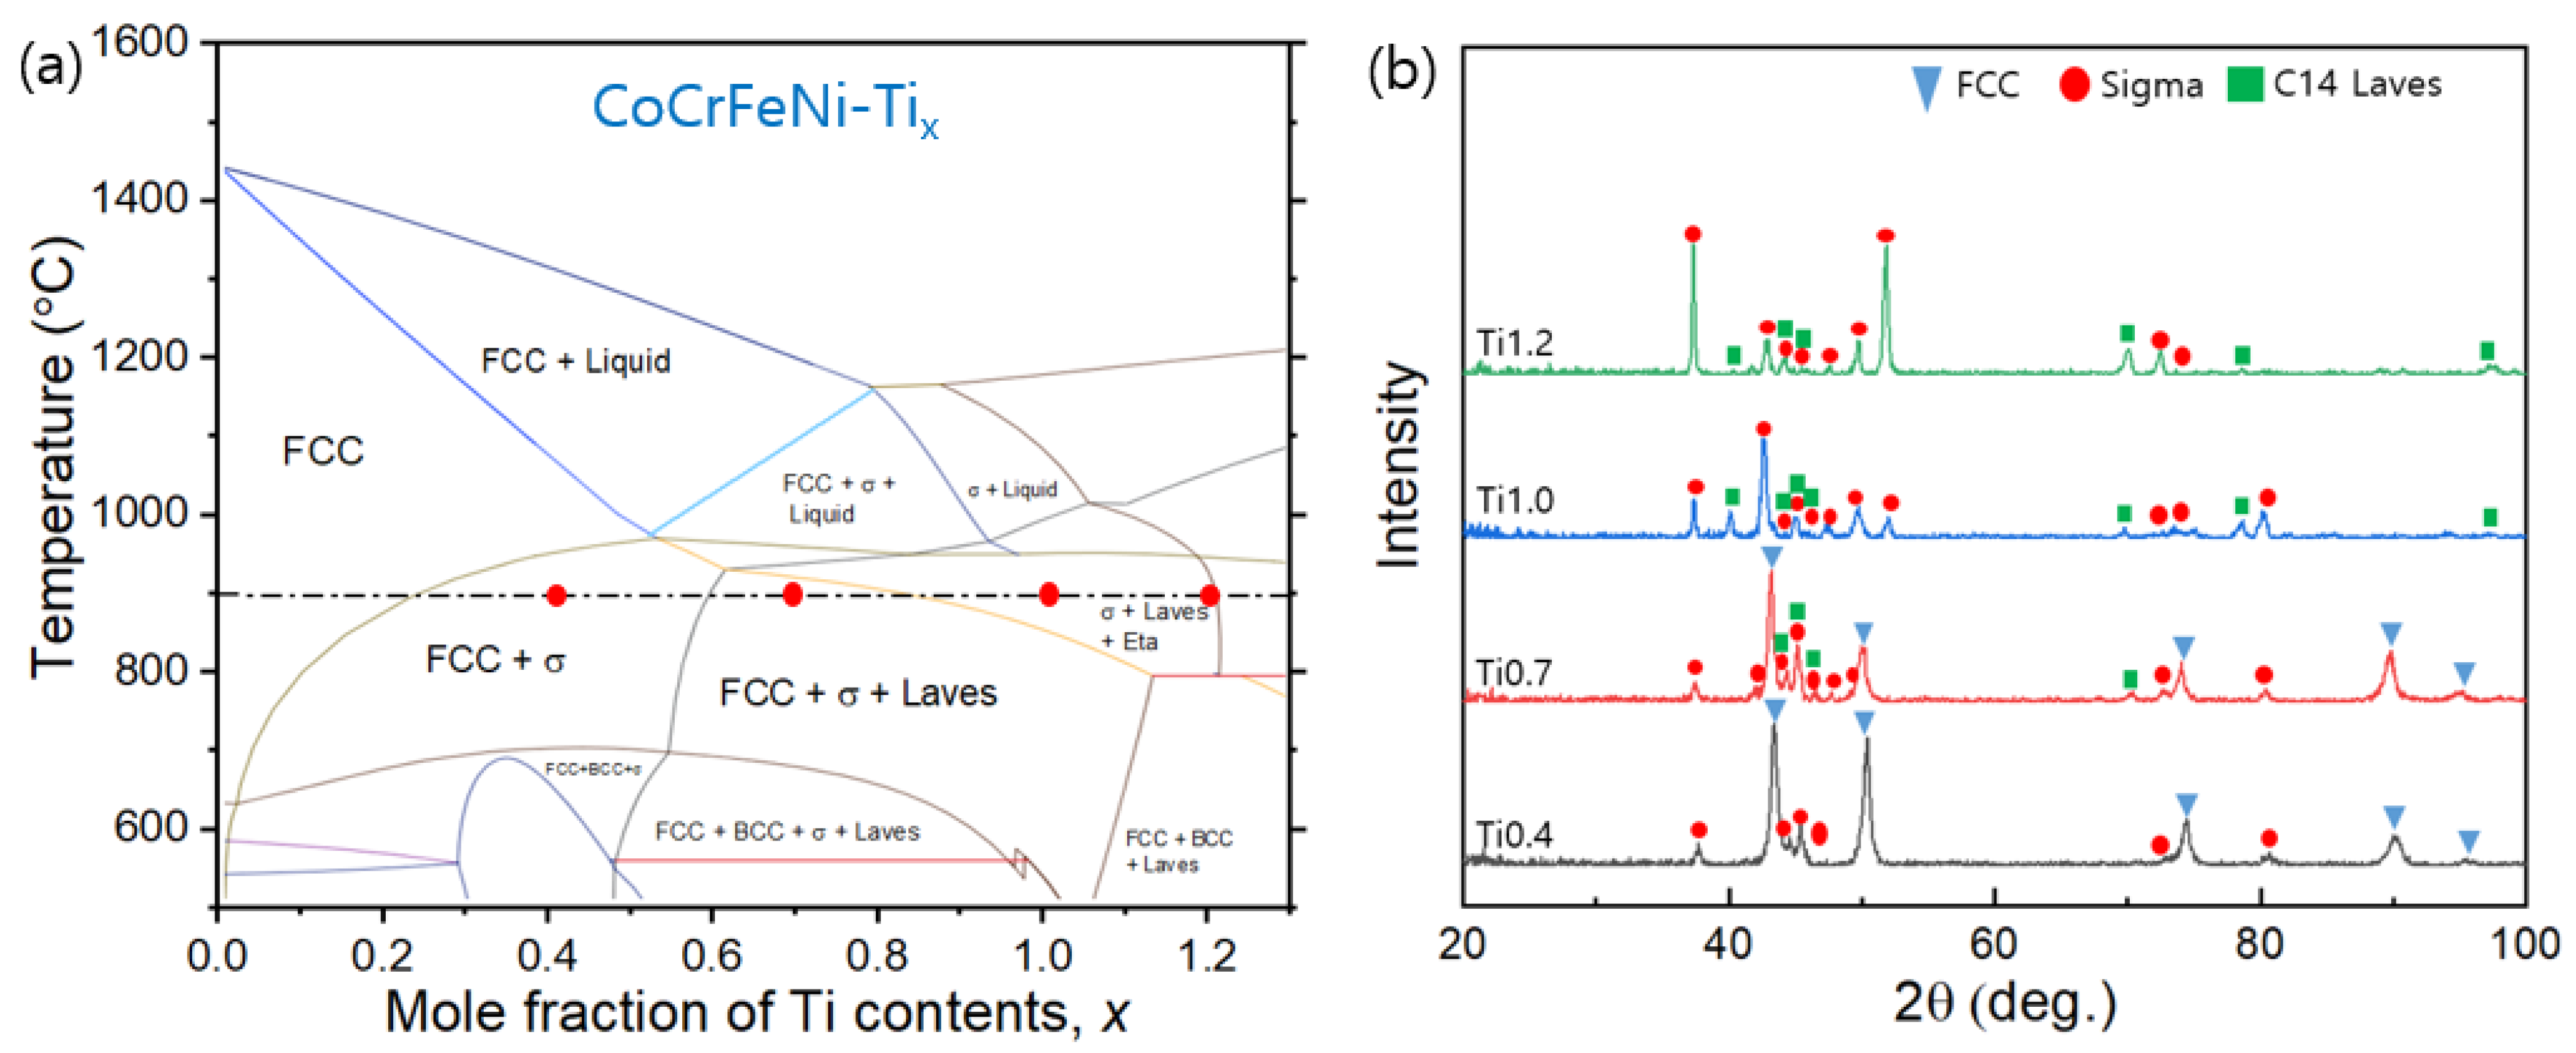
T 1a shows an equilibrium phase diagram of CoCrFeNiTix, where a mole fraction of Ti ranges from 0 to 1.2. According to our prediction based on the CALPHAD method and literature [22], the Co-Cr-Fe-Ni quaternary alloy forms a single phase FCC crystal structure at above 600 °C, while the addition of Ti to Co-Cr-Fe-Ni leads to the formation of a sigma (σ) phase, a Laves phase and an Eta phase. In this system, 55 at.% or higher of Ti is required for Laves phase to appear at 900 °C. XRD profiles of the CoCrFeNiTix alloys (hereafter denoted as Ti-x) presented in Figure 1b show the same results achieved with our CALPHAD prediction. According to Refs. [23,24,25,26], apart from the FCC diffraction peaks, several other diffraction peaks were identified as the σ-phase with a tetragonal crystalline structure and C14 Laves phase with a hexagonal close packed structure, which agrees with the prior works [27]. It is worth mentioning that the peak intensity of the sigma phase increases with the increase in Ti content, indicating the higher volume fraction of the sigma phase in the alloys with higher Ti.
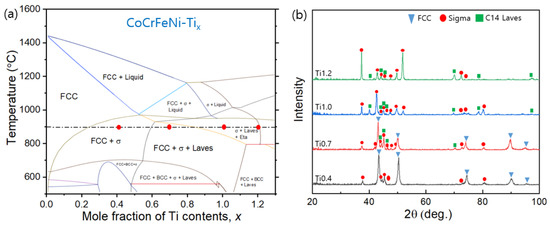
Figure 1.
(a) The pseudo-binary CoCrFeNi-Ti phase diagram obtained by using the Thermo-Calc software with the thermodynamic database TCFE9; (b) XRD patterns of the CoCrFeNiTix alloys with various Ti contents.
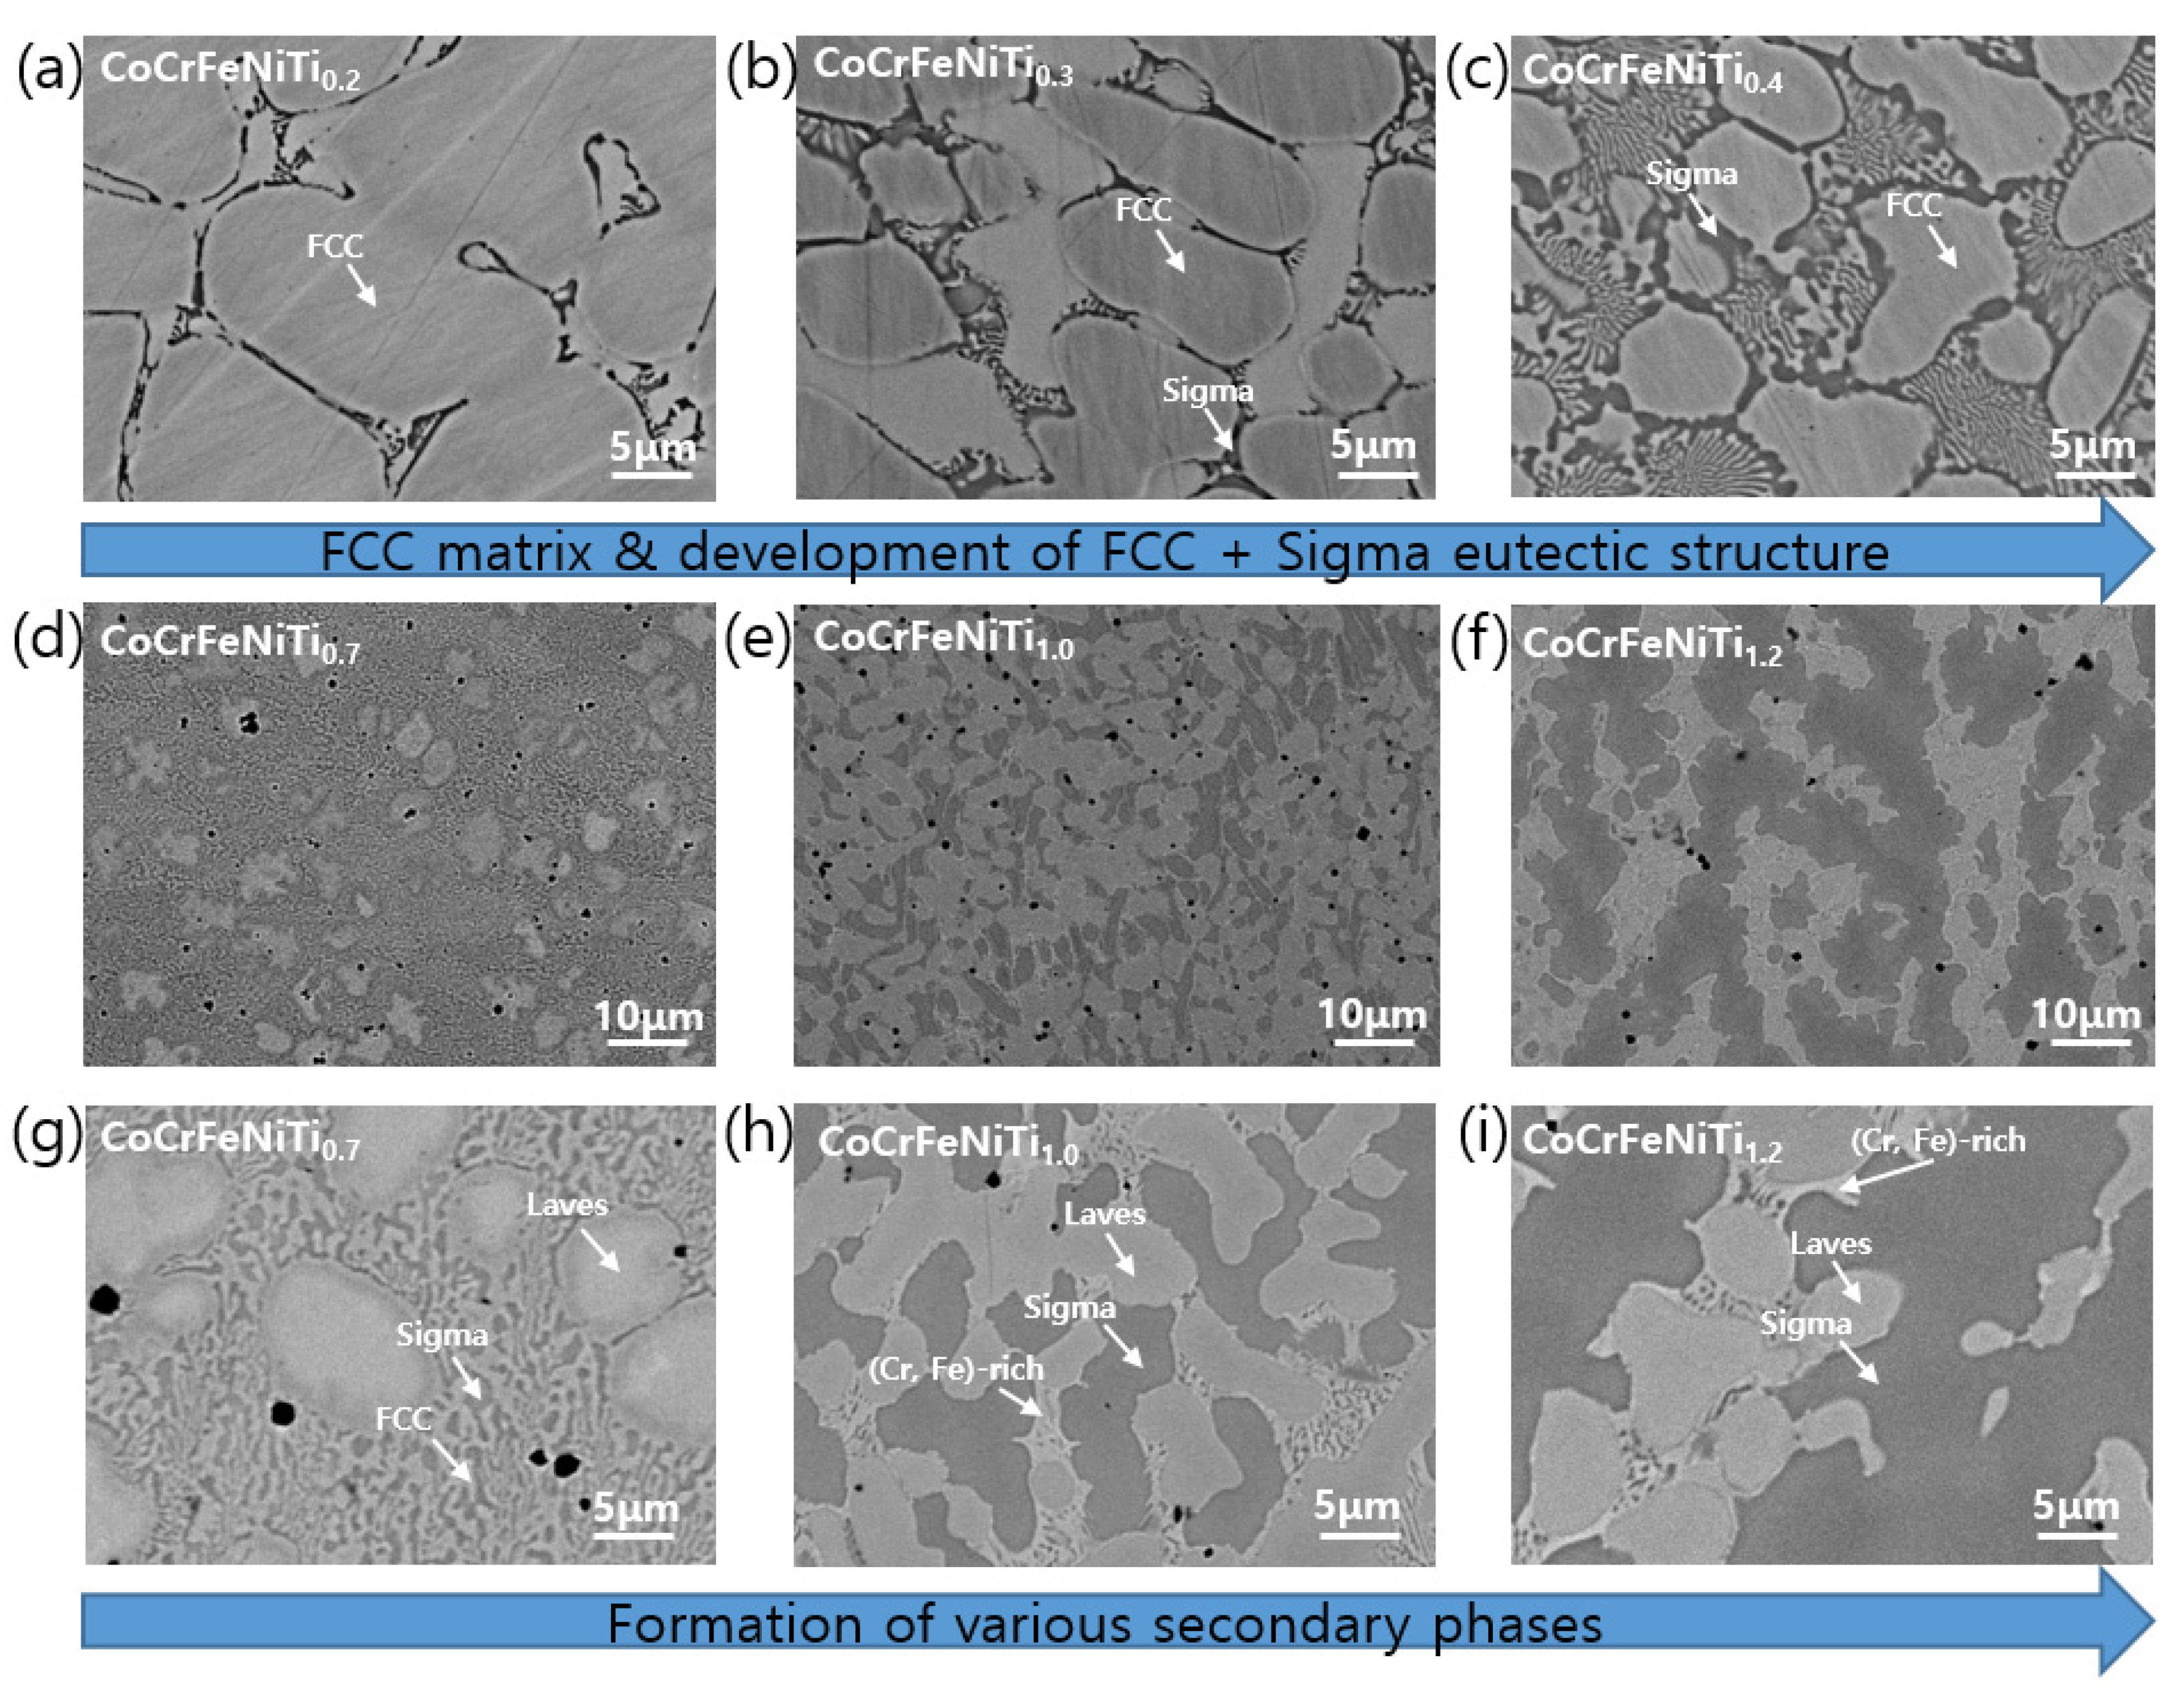
Figure 2 shows the as-cast microstructure of the CoCrFeNiTix alloys. With the addition of the Ti content, a secondary sigma phase started to appear in the FCC phase of Ti0.2 (Figure 2a). When the Ti content increased and reached 0.4, the microstructure of the CoCrFeNiTix alloy was seemingly transformed into a hypo-eutectic microstructure, which was made up of a mixture of a FCC solid solution and an eutectic lamella structure. This eutectic structure was composed of FCC and a sigma phase, as seen in Figure 2b,c. When the Ti content was increased to 0.7, the Laves phase appeared and displayed block shapes with an average size of 5–10 μm, as shown in Figure 2d,g. In Ti0.7, multiple phases co-existed within the microstructures, i.e., a Laves phase and an eutectic structure consisting of FCC and a sigma phase. When the Ti content reached 1.0, a new phase with the chemical composition Co19Cr27Fe23Ni15Ti16 (atom%) evolved and became interconnected, mainly surrounding the Laves phase, as shown in Figure 2e,h. This newly-appeared (Cr,Fe)-rich phase could be the Eta phase based on the CALHAD prediction in Figure 1a. However, due to the small amount of its volume fraction, XRD was not able to detect this (Cr,Fe)-rich phase (hereafter referred to as the (Cr,Fe)-rich phase for convenience). In Ti1.0, the morphology was transformed from the lamella eutectic to a complex heterogeneous multi-phase microstructure, consisting of Laves, sigma, and (Cr,Fe)-rich phases. With the Ti content reaching 1.2, the fraction of the sigma phase substantially increased up to 56% and formed the sigma matrix. Table 1 summarizes the chemical compositions of the phases and their volume fractions. Note that the volume fractions of each phase were obtained by the area fraction of the SEM images in Figure 2, analyzed by the “Image J” software. By comparison, the sigma phase in our alloys became more enriched with increasing Ti contents.

Figure 2.
SEM images of the as-cast CoCrFeNiTix alloys (a) x = 0.2, (b) x = 0.3, (c) x = 0.4, (d,g) x = 0.7, (e,h) x = 1.0., and (f,i) x = 1.2. The black dots in (d–i) were identified as TiO2 by EDS analysis.

Table 1.
Elemental analysis of different regions in as-cast CoCrFeNiTix composites.
3.2. Mechanical Properties
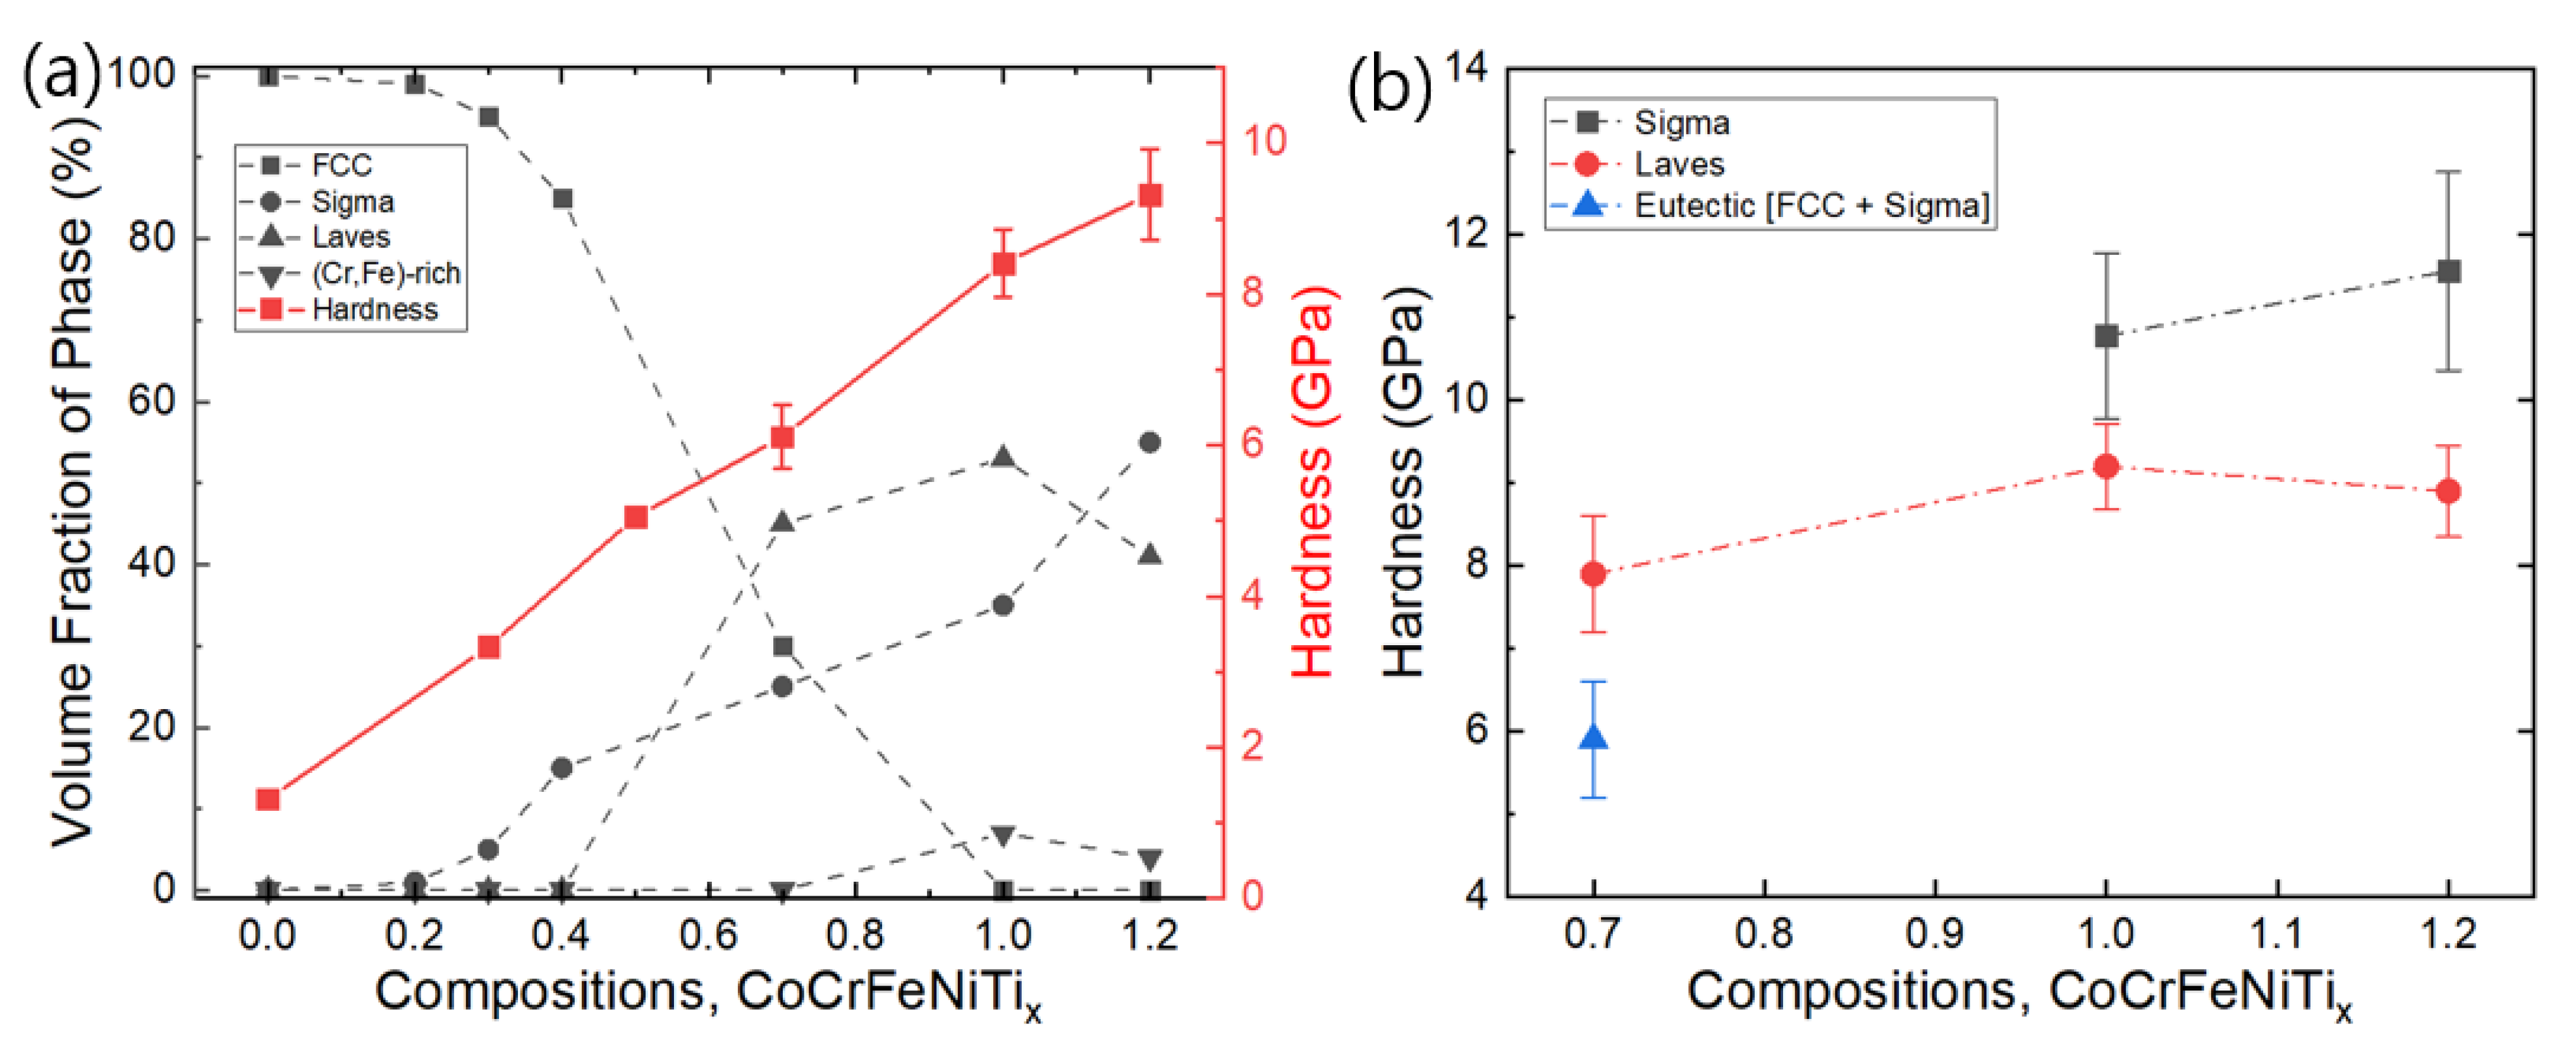
To measure the mechanical properties of the CoCrFeNiTix alloys, we first performed hardness tests. Figure 3a shows the relation between the phase fractions and macro-hardness changes in our alloys. Macro-hardness gradually increases from 1.3 GPa in Ti0 to 9.3 GPa in Ti1.2, mainly due to the formation of sigma and Laves phases. These phases, known as topologically close-packed (TCP) structures [1], generally possess exceptional hardness. Subsequently, the hardness of the individual phase level was evaluated as seen in Figure 3b. The results show that the hardness of the eutectic region (~5.9 GPa) is relatively lower than Laves phase hardness (~7.9 GPa) in Ti0.7. Interestingly, even within the same TCP group of structures, the sigma phase retains substantially higher hardness than the Laves phase in Ti1.0 and Ti1.2, which indicates that the increase in the sigma phase fraction plays the most important role in enhancing the alloy hardness.
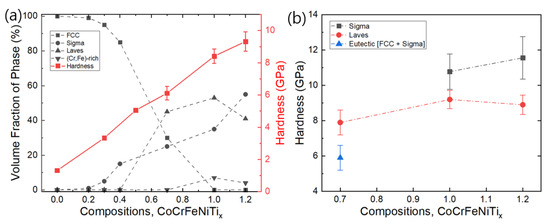
Figure 3.
(a) Variations in alloy macro-hardness in accordance with the volume fraction of various phases. (b) Micro-hardness for individual phase for the CoCrFeNiTix alloys. Note that the hardness data for Ti0, Ti0.3 and Ti0.5 in (a) was obtained from the literature [27].
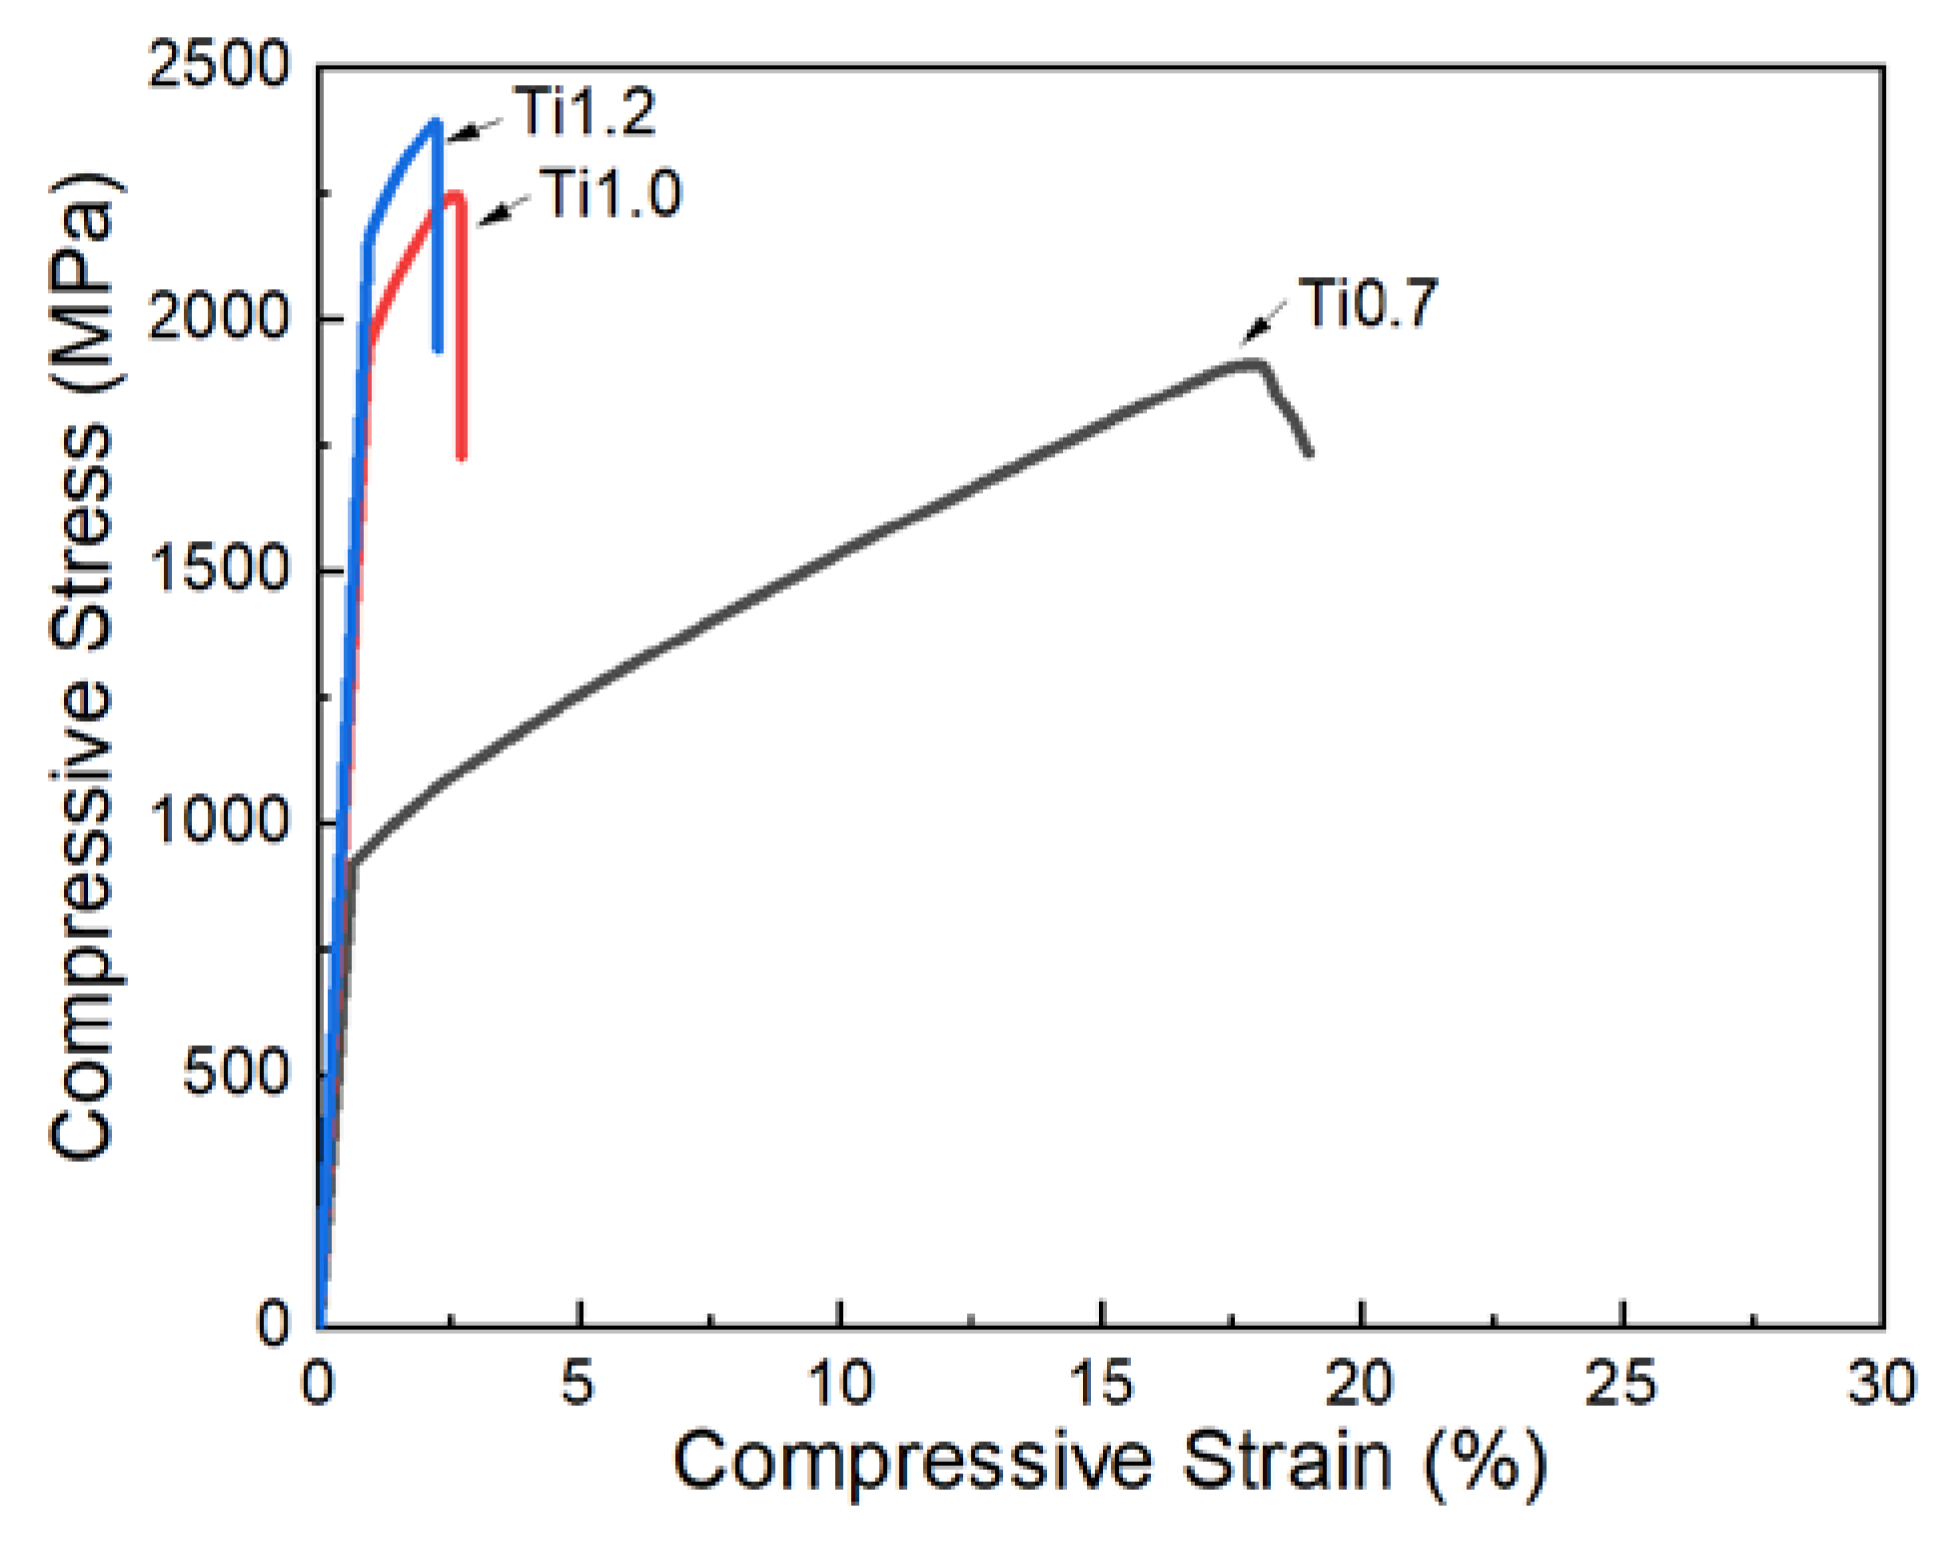
Compression tests were carried out for Ti0.7, Ti1.0, and Ti1.2, as presented in Figure 4, and the corresponding mechanical properties are listed in Table 2, along with other CoCrFeNiTix mechanical test data from the literature [27,28]. With the increase in Ti content from 0.7 to 1.2, the yield stress and compressive stress increased from 919 and 1872 MPa to 2161 and 2383 MPa, respectively. Evidently, the Ti0.7 sample exhibits remarkable ductility and excellent working hardening compared to Ti1.0 and Ti1.2. The sudden strain reduction and significant increase of yield strength in Ti1.0 and Ti1.2 are attributed to the extinction of the ductile FCC phase, which is replaced by various hard TCP phases. It is interesting to note that even without the FCC phase, the Ti1.0 and Ti1.2 alloys exhibited fair ductility with compressive elongation, reaching 2.4 and 1.7%, respectively. This good ductility can be attributed to the interaction within the multiple-phase microstructure, where the (Cr.Fe)-rich phase shows more ductile/tough behavior, as will be discussed in detail in Section 3.4.

Figure 4.
Compressive engineering stress–strain curves for the CoCrFeNiTix alloys. The curves are presented after removing the machine compliance effect.
Table 2.
Mechanical properties of CoCrFeNiTix alloys.
3.3. Effect of Lattice Distortion on Solid Solution Strengthening
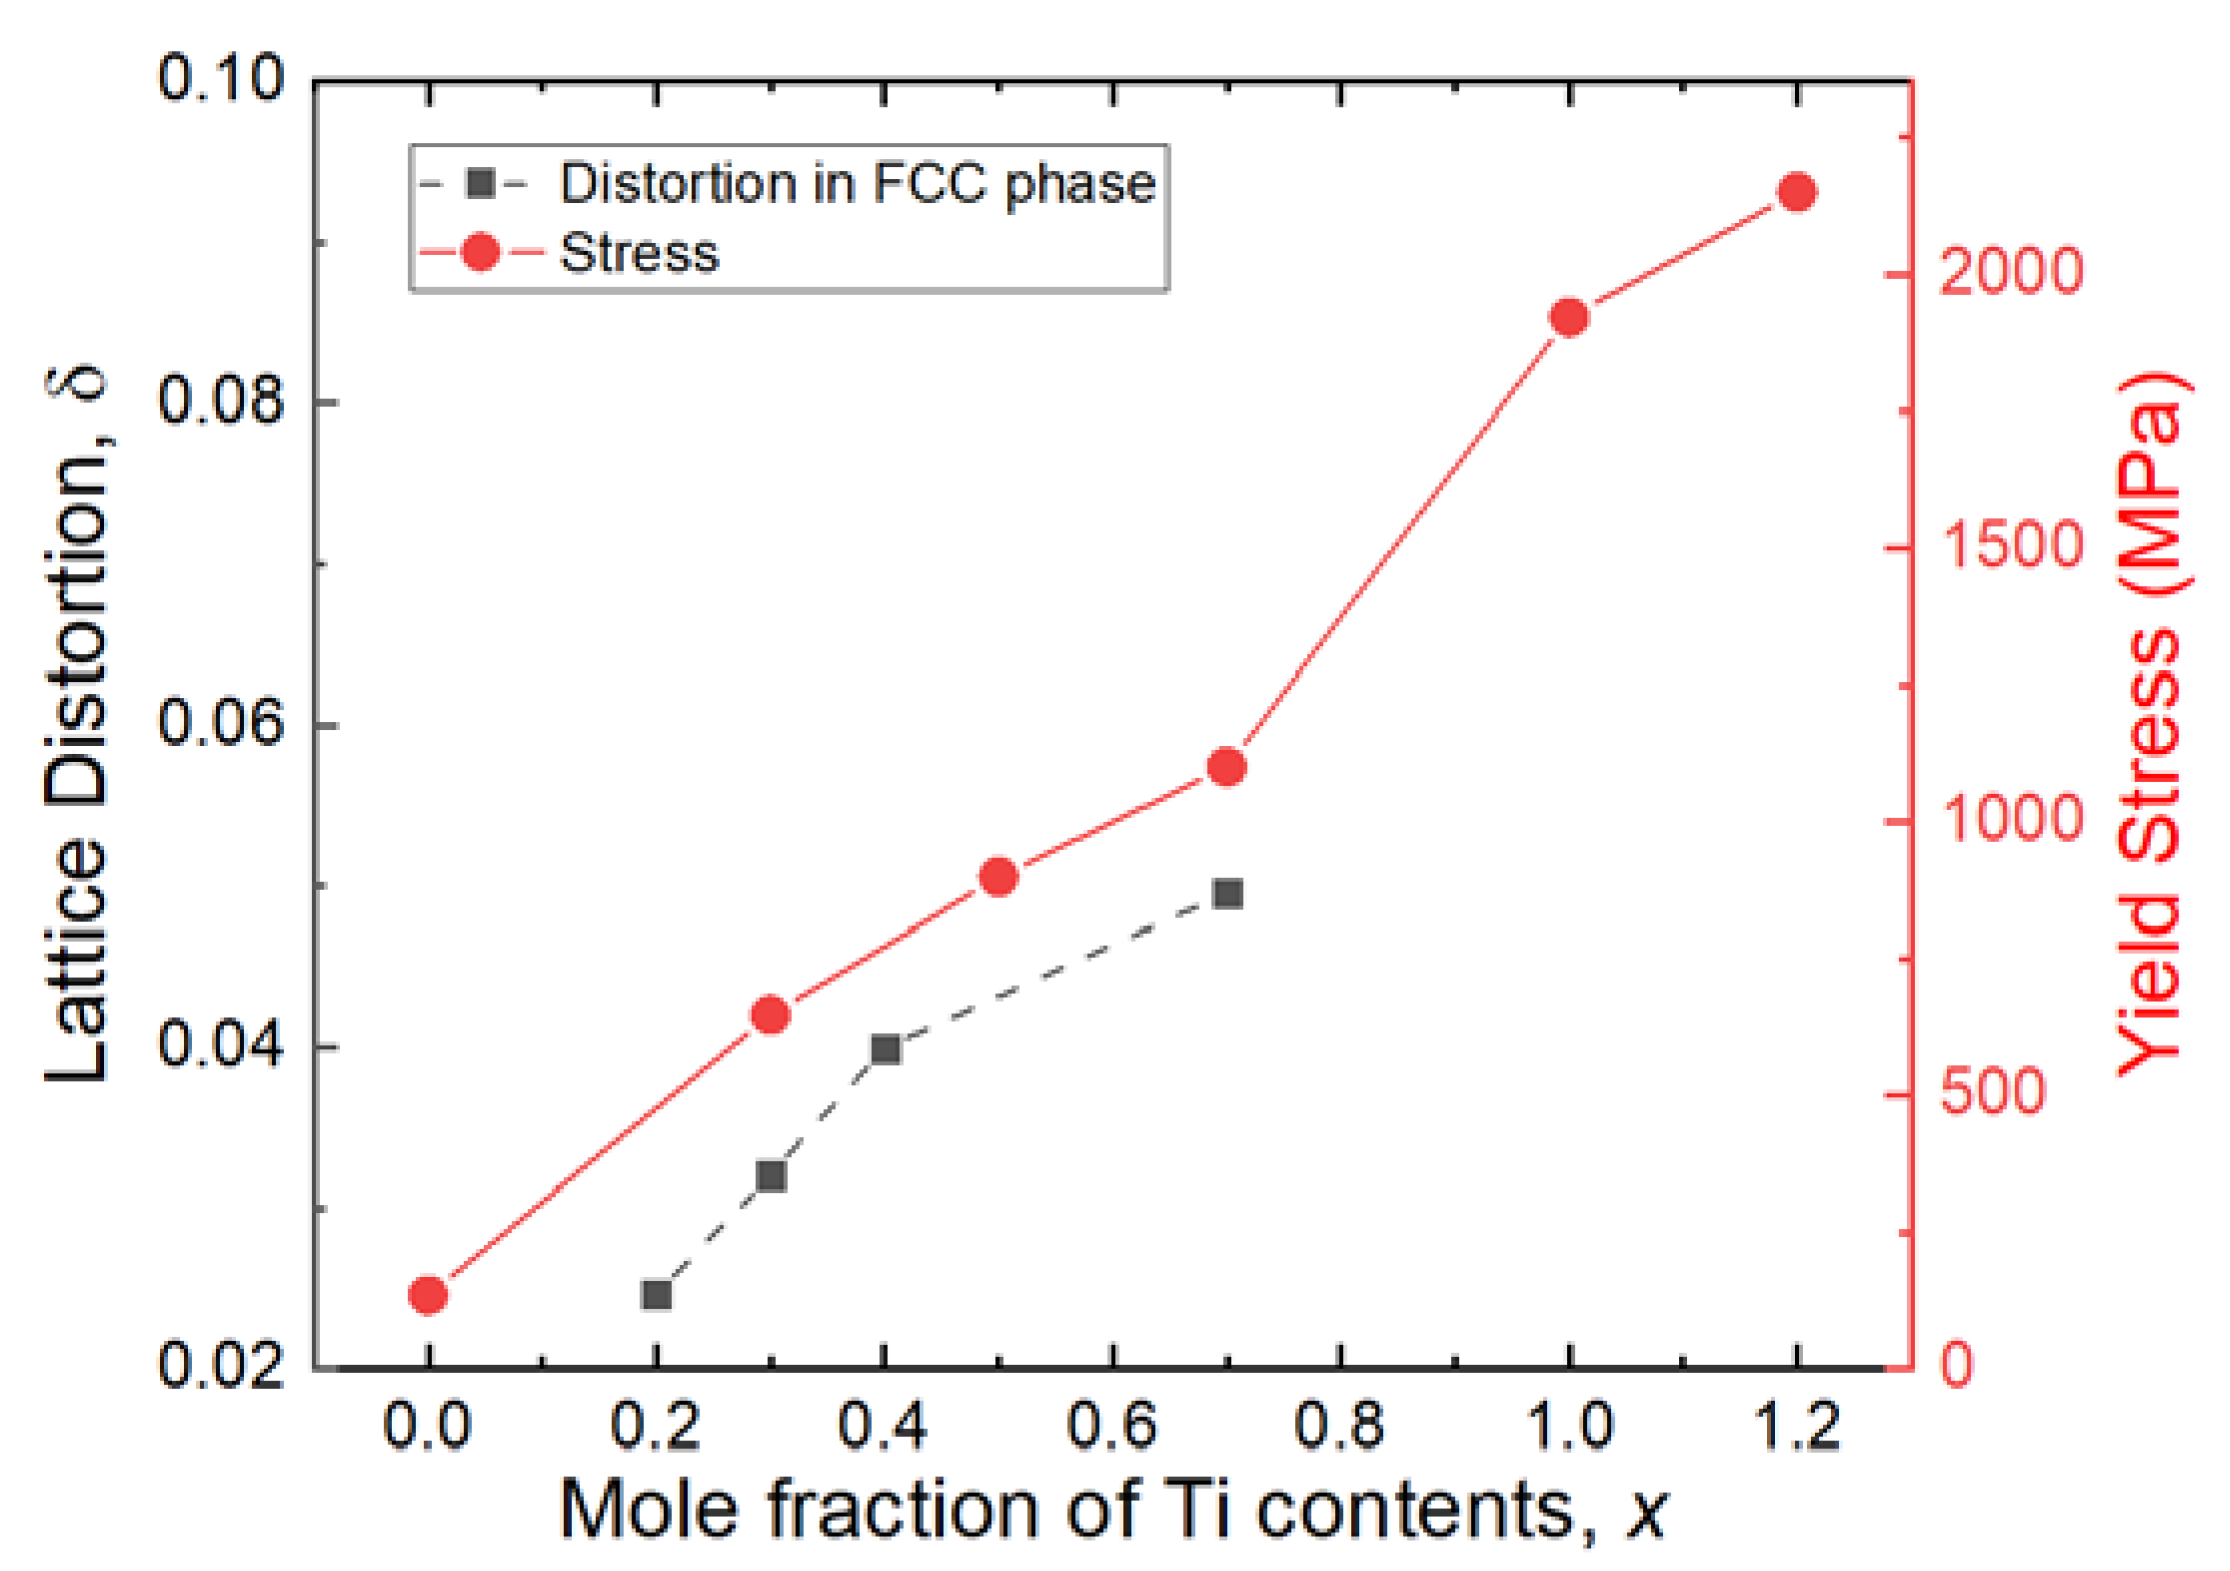
In multi principal element alloys, a severely distorted lattice possibly occurs if a large atom size difference is present among the constituent elements [29,30], which may be the case for the CoCrFeNiTix alloys. In our alloy system, the atomic radius of Ti (1.47 Å) is larger than the atomic radius of the other constitutional elements, i.e., Co (1.25 Å), Cr (1.28 Å), Fe (1.26 Å), and Ni (1.24 Å). Therefore, the increase in Ti content may further distort the lattice, resulting in an enhancement of the solid-solution strengthening of our alloys. To confirm this theory, in this section, we calculate the lattice distortion δ by the following equation proposed by Zhang et al. [30]:
in which is the atomic fraction of element , is the atomic radius of element , and n is the total number of constituent elements. Although this δ parameter is limited in the accurate calculation of local lattice distortion, it has been widely accepted for estimating the general distortion of the phases formed in multi-principal element alloys [30,31]. If we approximately take the atomic fraction of element obtained from our EDS analysis (Table 1), we can then obtain the lattice distortion for the individual phase in our alloys. For example, in Ti0.2, the chemical composition for the FCC phase is (Co:Cr:Fe:Ni:Ti = 24.1:26.0:24.2:24.0:1.7), which yields the lattice distortion δ = 0.0247. Following this method, we computed the level of lattice distortion for the FCC phase formed in our alloys, as presented in Figure 5. The lattice distortion of the FCC phase substantially increased from 0.0247 in Ti0.2 to 0.0496 in Ti0.7, which resulted from the addition of the larger Ti atoms into the FCC phase in the alloys (See Table 1). Note that Equation (2) is not applicable to the lattice distortion calculation for the ordered compounds, i.e., sigma and Laves phases, as in those phases the specific atoms will tend to occupy specific sites in their lattice. For Ti1.0 and Ti1.2, the formation of hard various secondary phases, such as Laves and (Cr,Fe)-rich phases, led to the increase in hardness. Based on the above analysis, we believe that strengthening of the CoCrFeNiTix alloys can be mainly attributed to the solid-solution strengthening of the FCC matrix when Ti content is below 0.7. After the Ti content of the alloys increases beyond x = 0.7, the newly-formed hard phases (that is, the Laves and (Cr,Fe)-rich phase) becomes a more critical factor to strengthen the alloys.
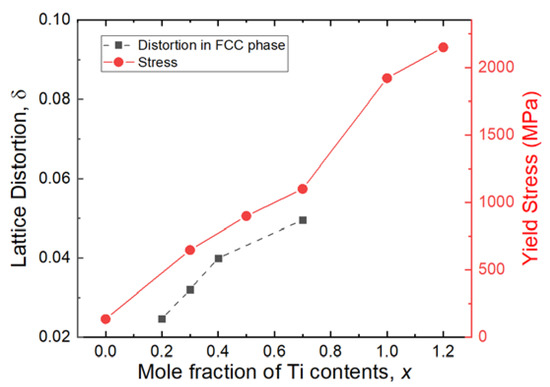
Figure 5.
The correlation between the lattice distortion of FCC phase and yield stress as a function of Ti composition.
To further understand the correlation between lattice distortion and strengthening effect, we compared the yield strength of the alloys with the lattice distortion as presented in Figure 5. Figure 5 clearly shows that the lattice distortion is in a proportional relation with the yield stress of the alloys, which confirms that the solid solution strengthening induced by lattice distortion has a major effect on the total yield strength of the CoCrFeNiTix HEAs where x < 0.7 [29]. Overall, the present analytical method can be applied to investigate the lattice distortion effect on multi-principal element alloys with random solid solutions from the experimental perspective.
3.4. Indentation Fracture Toughness
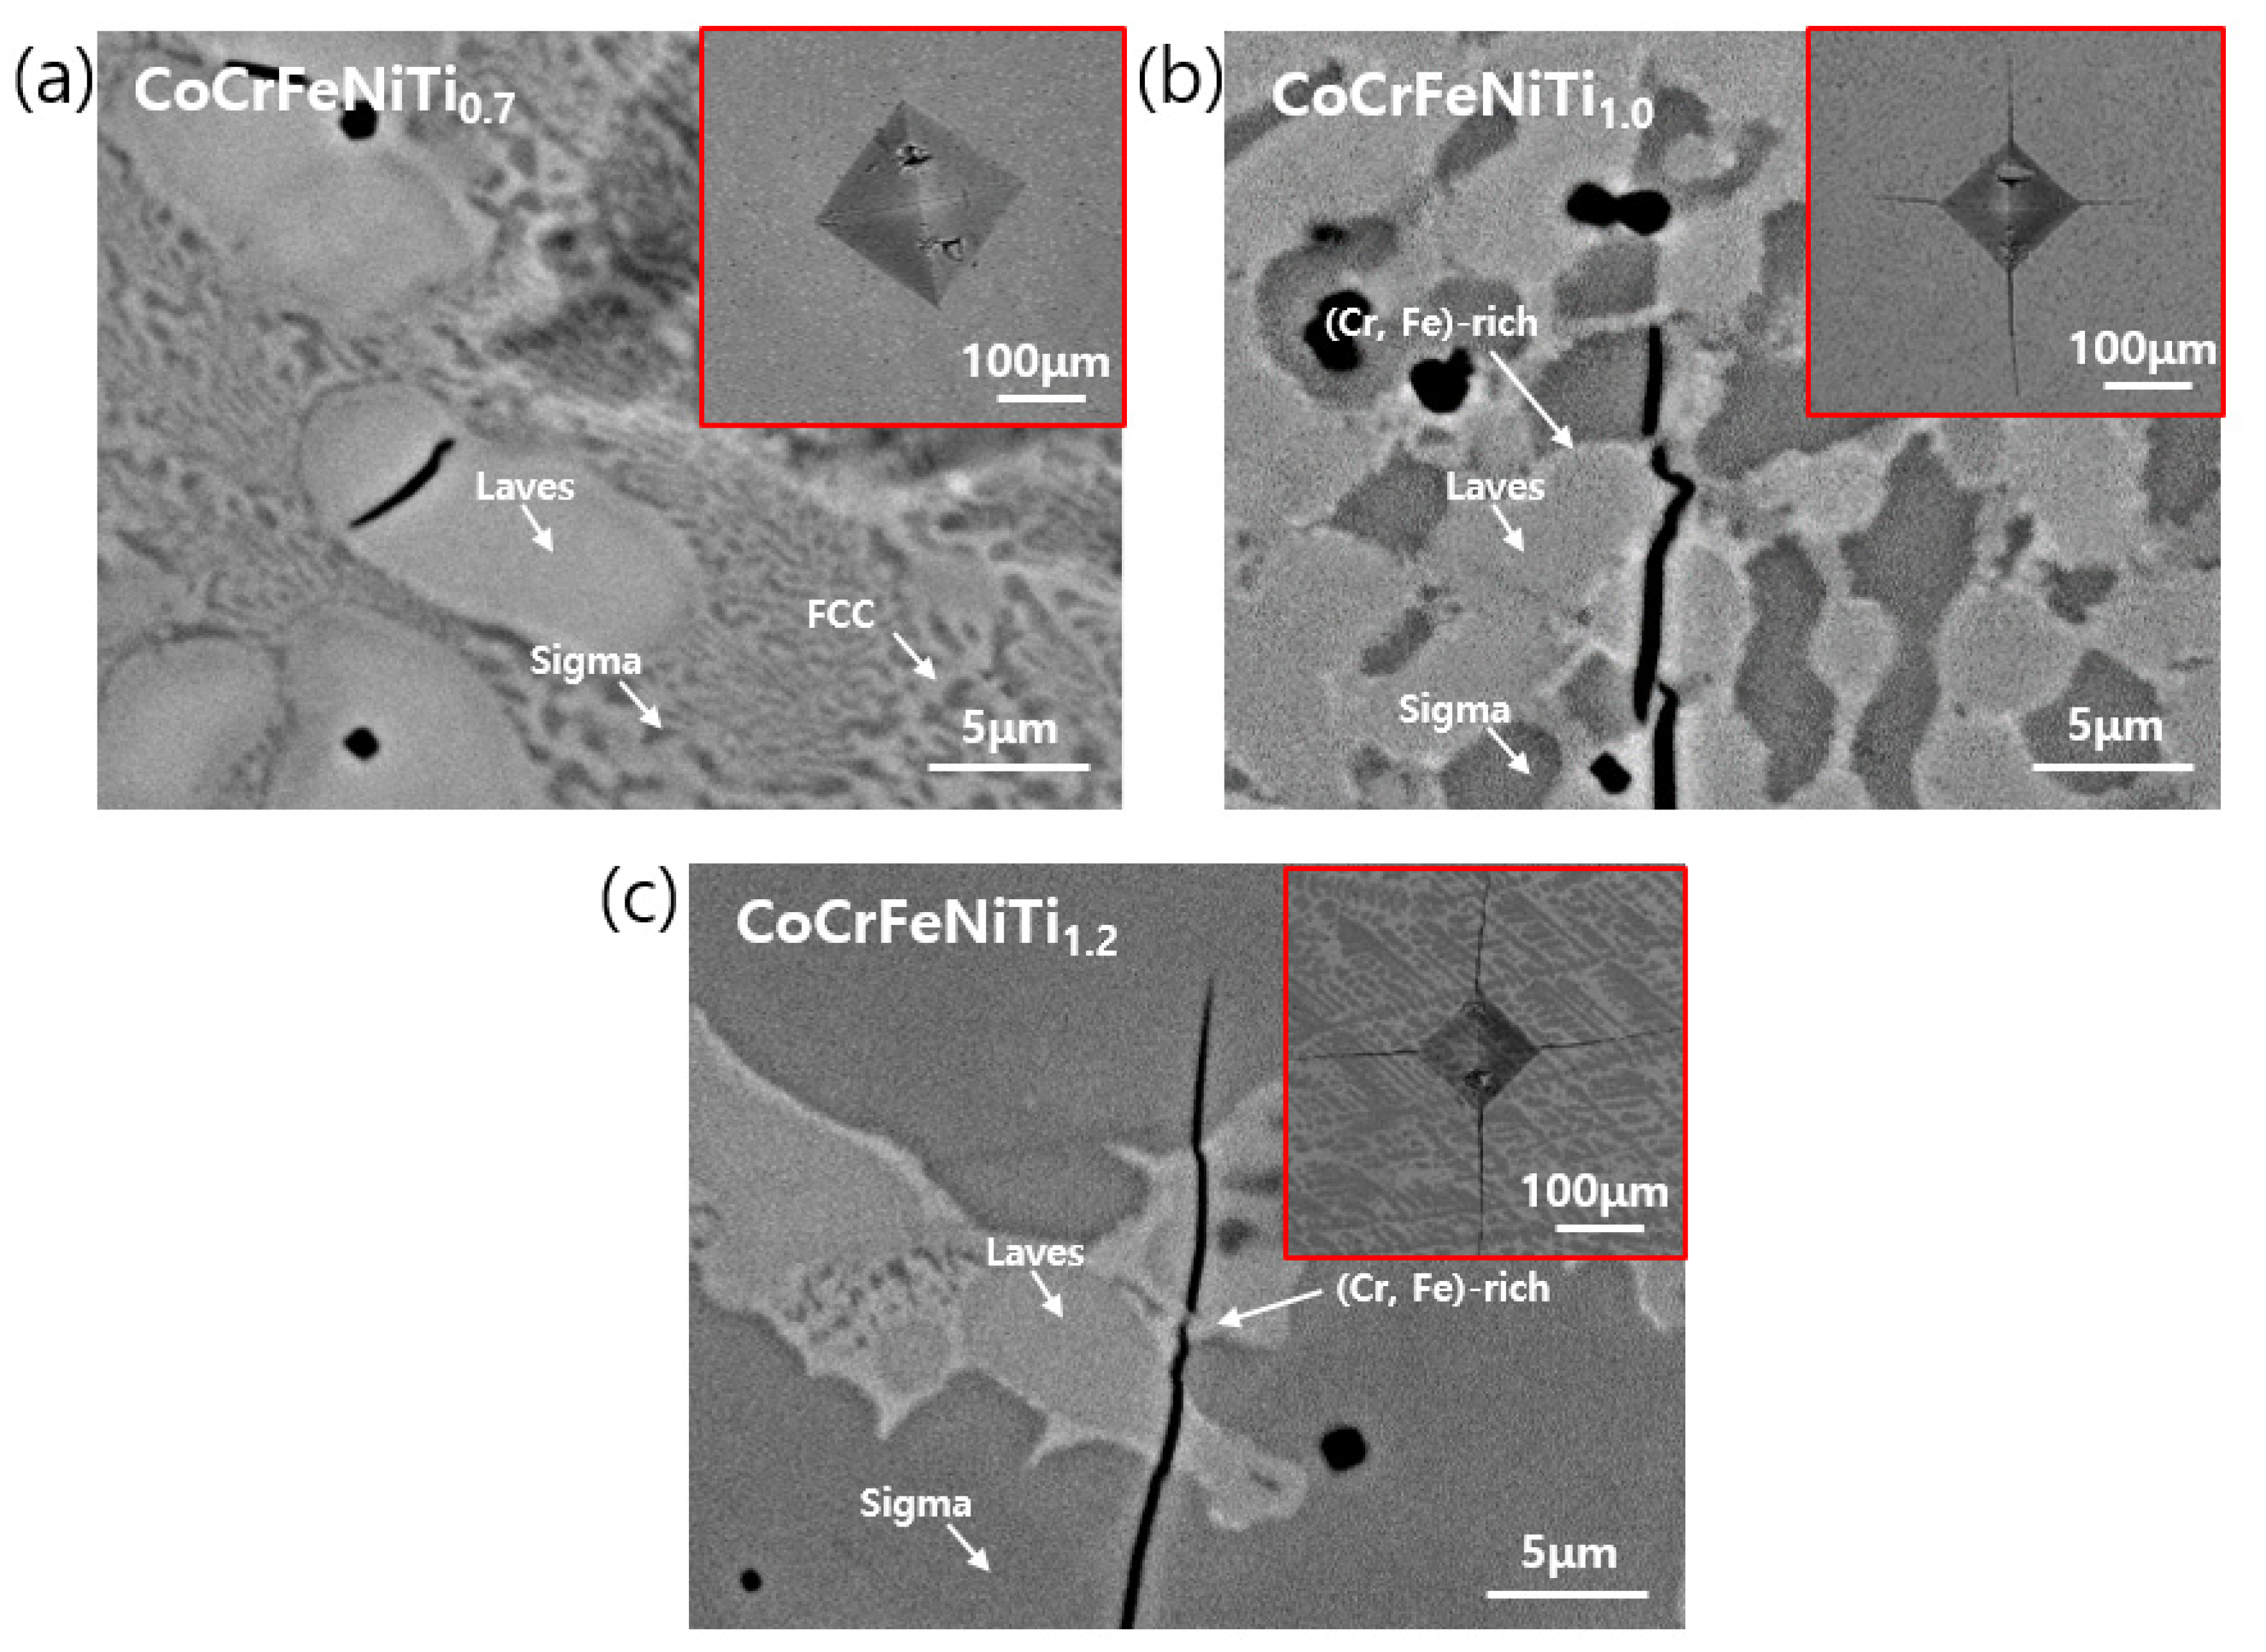
To characterize the fracture behavior of our alloys, we carried out indentation fracture tests on the CoCrFeNiTix (x = 0.7, 1.0, and 1.2) alloy specimens. Figure 6 shows SEM images of the cracks that emerged from the edge of the indentation with a load of 98 N. From the indentation fracture toughness Equation (1) and the inset images of Figure 6a–c, we can obtain the indentation fracture toughness K = 4.14 ± 0.58 for Ti1.0 with H ~8.4 GPa, E ~215 GPa, l ~97 ± 35 μm, and K = 2.79 ± 0.37 for Ti1.2 with H ~9.3 GPa, E ~232 GPa, l ~232 ± 75 μm. For the case of the Ti0.7 alloy (See Figure 6a), after indentation, the cracks nucleated in the Laves phase; however, they were instantly arrested by the surrounding eutectic regions, which were already proven to be softer regions than the Laves phase according to the micro-hardness experiment result in Figure 3b. Therefore, since the crack propagation is suppressed, indentation fracture toughness for Ti0.7 was not determined in this study. Here, it is worth noting that measuring indentation fracture toughness is generally unsuitable for ductile or semi-ductile materials such as Ti0.7, and such a method should be limited to hard/brittle materials.
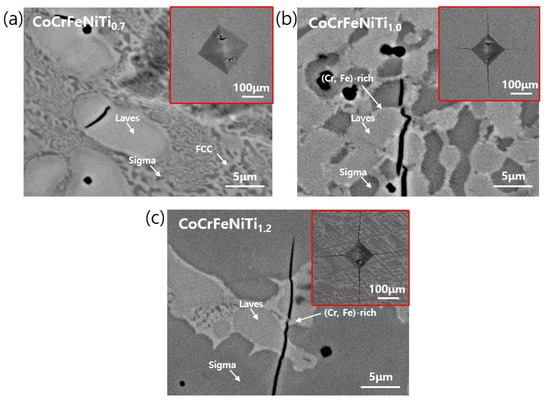
Figure 6.
SEM images of toughening mechanisms of CoCrFeNiTix alloys: (a) x = 0.7; (b) x = 1.0; and (c) x = 1.2. The inset images of (a–c) show the indentation impression with Palmqvist cracks [21] that emerged from the edge of the indentation diagonals.
To understand the possible toughening mechanisms of Ti1.0 and Ti1.2, we performed further SEM examinations near the crack tip and along the crack wake, as shown in Figure 6b,c. As seen in Figure 6b, crack-tip deflection can be observed along the crack path in Ti1.0, and the crack tip was stopped by the (Cr,Fe)-rich phase. In addition, we also observed crack bridging as another toughening mechanism for Ti1.0, where a bridged crack formed with this (Cr,Fe)-rich phase as the bridging element. When the fraction of the sigma phase further increased to ~56%, as in Ti1.2 (Figure 6c), the level of crack deflection reduced and the crack was seemingly able to propagate directly through the sigma phase matrix. The crack bridging by the (Cr,Fe)-rich phase still provides the source of toughening in Ti1.2. Meanwhile, the sharp and narrow crack tip in the sigma phase matrix in Ti1.2 alloy implies very limited crack tip plasticity, which may be caused by the difficulty of dislocation movement in the topologically close-packed complex atomic structure of the sigma phase [32]. This suppressed crack-tip plasticity can be linked to relatively low intrinsic toughness. Note that fracture toughness in materials is perceived to be the mutual interaction of intrinsic toughening (crack tip plasticity) and extrinsic toughening mechanisms (crack deflection and crack bridging). Hence, based on our observation, the fracture resistance of our Ti1.0 and Ti1.2 alloys can be mainly attributed to extrinsic toughening mechanisms, such as crack deflection and crack bridging induced by the formation of the relatively soft/ductile (Cr,Fe)-rich phase, which indicates that this newly-formed phase is key in enhancing fracture toughness in our alloys.
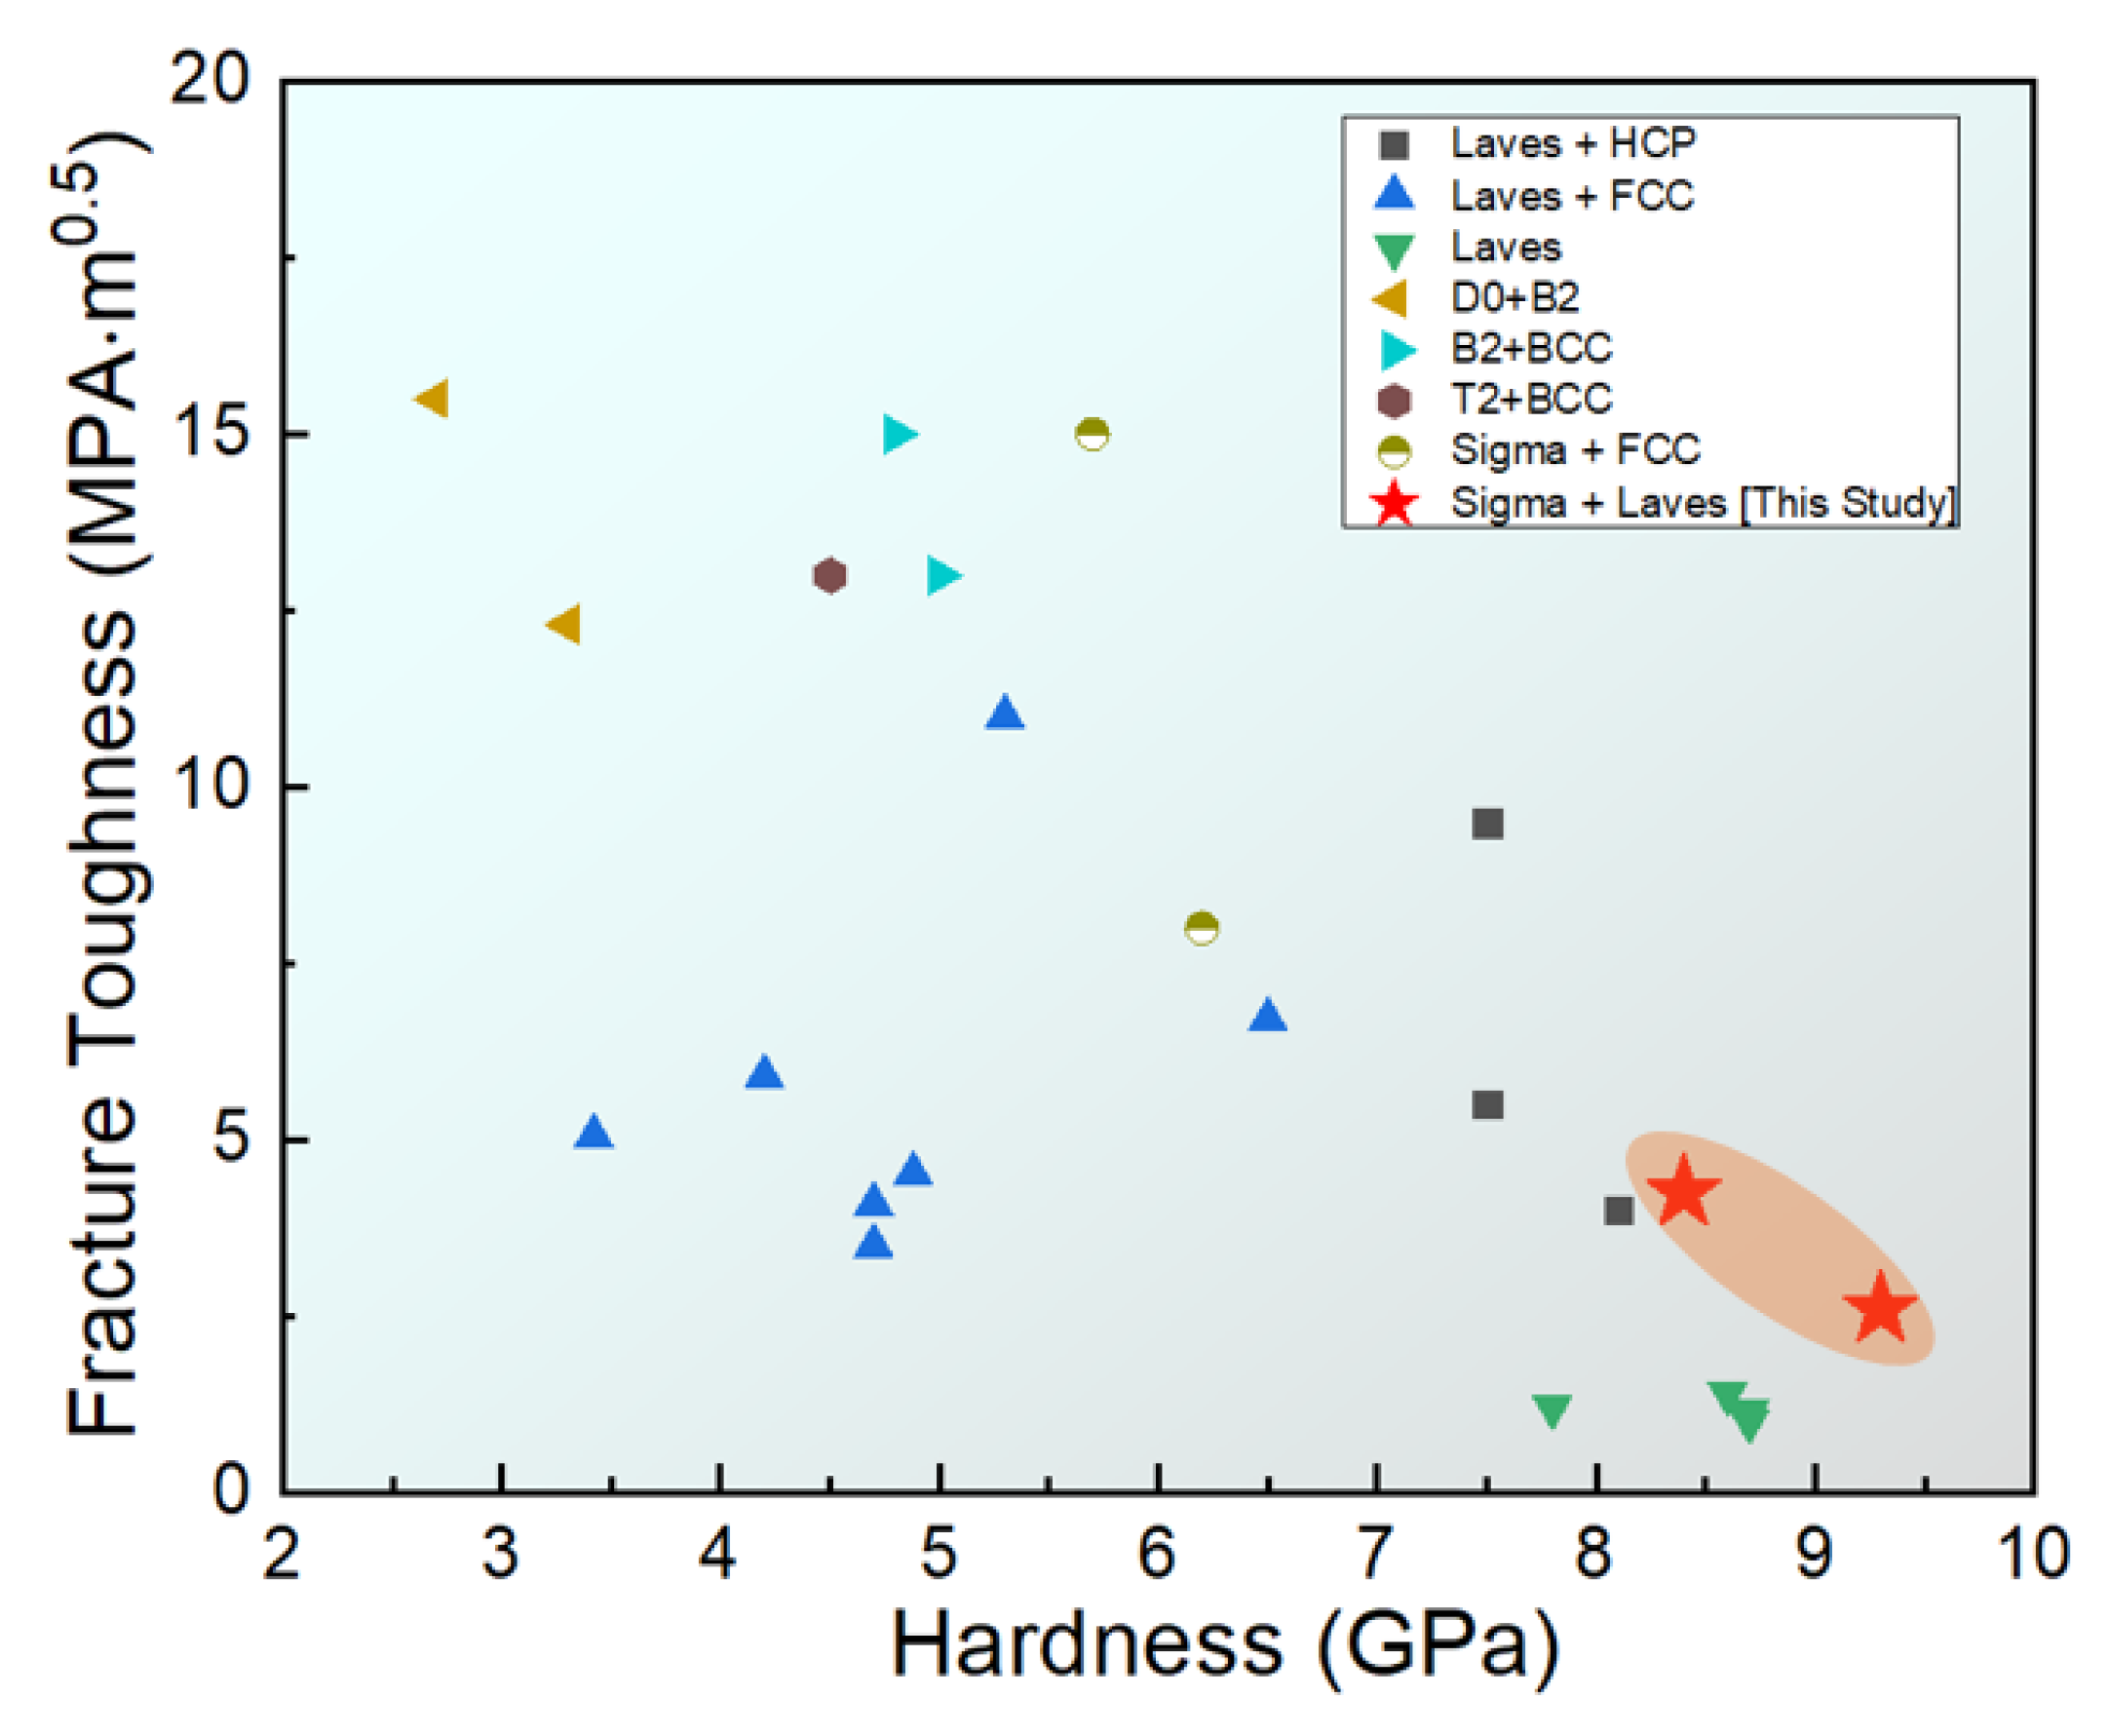
Finally, it is worthy to compare the hardness and fracture toughness of our multi principal element Ti1.0 and Ti1.2 alloys with other intermetallic-phase containing alloys, as shown in Figure 7. Notably, our alloys outperform various metallic composites that contain both intermetallics and solid solutions, due to a balanced combination of superb hardness and good toughness, where hard sigma and Laves phases generally enhance strength while the relatively soft (Cr,Fe)-rich phase improves crack resistance. Indeed, this fracture toughness value of our alloys is impressive, at about two or three times the fracture toughness (~1.5) of conventional close-packed intermetallic single phases [33]. This result suggests that the alloys formed by the combination of hard and soft multi phases could lead to a strength–toughness synergy.
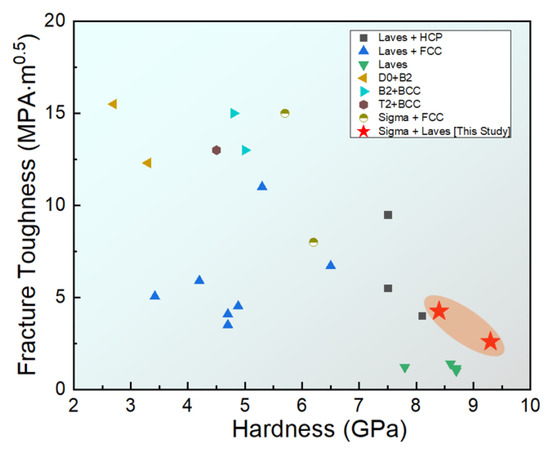
Figure 7.
Comparison of the room temperature fracture toughness K versus hardness H between our alloys and other intermetallic-phase containing alloys. Note that the prior data come from Refs. [20,34,35,36,37,38,39,40,41].
4. Conclusions
In conclusion, in this work, we investigated the effects of the addition of Ti on the microstructures and mechanical properties of CoCrFeNiTix (x = 0.7, 1.0, and 1.2) alloys. Based on our results, salient conclusions can be drawn as follows:
- Based on the CALPHAD method, XRD, and SEM-EDX analysis, the microstructure of CoCrFeNiTix alloys was determined to be FCC + σ + Laves phase for Ti0.7, and σ + Laves + (Cr,Fe)-rich phase for Ti1.0 and Ti1.2.
- As the Ti concentration increased from x = 0.7 to 1.2, the hardness H (or compressive yield strength σy) of the alloy increased from 6.1 to 9.3 GPa (or from 920 to 2160 MPa), whereas its fracture strain decreased from ~18% to ~1.7%.
- Based on our systematic analysis, we believe that in the CoCrFeNiTix HEAs where x = below 0.7, the increase in hardness and yield stress was mainly caused by the solid-solution strengthening of the FCC matrix that resulted from the lattice distortion. With the CoCrFeNiTix HEAs whose x > 0.7, the formation of hard secondary phases (σ, Laves and (Cr,Fe)-rich phases) was the main factor contributing to the strengthening of the alloys.
- The fracture resistance of the CoCrFeNiTix alloys decreased with the increase in Ti contents (from 4.14 for Ti1.0 to 2.79 for Ti1.2). The crack observation revealed that the (Cr,Fe)-rich phase played an important role in enhancing fracture toughness, facilitating toughening mechanisms such as crack deflection and crack bridging.
- Overall, our CoCrFeNiTix (x = 1.0 and 1.2) alloys outperform similar alloy systems due to a combination of superb hardness and good toughness. The present work demonstrates that multi principal element alloys containing dual or multi-phase structures could provide a solution for developing structural alloys with enhanced strength–toughness synergy.
Author Contributions
Conceptualization, D.C. and Y.N.; methodology, D.C. and H.K.; validation, D.C., W.K. and Y.N.; formal analysis, D.C.; investigation, D.C.; resources, Y.N.; data curation, Y.N.; writing—original draft preparation D.C.; writing—review and editing, C.E.; visualization, D.C.; supervision, Y.N.; project administration, Y.N.; funding acquisition, Y.N. All authors have read and agreed to the published version of the manuscript.
Funding
This work was supported by the Future Material Discovery Project of the National Research Foundation of Korea (NRF) funded by the Ministry of Science, ICT and Future Planning (MSIP) of Korea (NRF-2016M3D1A1023534) and by the Technology Innovation Program (20009793) funded by the Ministry of Trade, Industry and Energy (MOTIE) of Korea.
Institutional Review Board Statement
Not Applicable.
Informed Consent Statement
Not Applicable.
Data Availability Statement
Not applicable.
Conflicts of Interest
The authors declare no conflict of interest.
References
- Sinha, A.K. Topologically close-packed structures of transition metal alloys. Prog. Mater. Sci. 1972, 15, 81–185. [Google Scholar] [CrossRef]
- Yurchenko, N.; Stepanov, N.; Salishchev, G. Laves-phase formation criterion for high-entropy alloys. Mater. Sci. Technol. 2017, 33, 17–22. [Google Scholar] [CrossRef]
- Yao, M.X.; Wu, J.B.C.; Yick, S.; Xie, Y.; Liu, R. High temperature wear and corrosion resistance of a Laves phase strengthened Co–Mo–Cr–Si alloy. Mater. Sci. Eng. A 2006, 435–436, 78–83. [Google Scholar] [CrossRef]
- Akiba, E.; Iba, H. Hydrogen absorption by Laves phase related BCC solid solution. Intermetallics 1998, 6, 461–470. [Google Scholar] [CrossRef]
- Livingston, J. Laves-phase superalloys? Phys. Status Solidi (a) 1992, 131, 415–423. [Google Scholar] [CrossRef]
- Hall, E.O.; Algie, S.H. The Sigma Phase. Metall. Rev. 1966, 11, 61–88. [Google Scholar] [CrossRef]
- Hsieh, C.-C.; Wu, W. Overview of intermetallic sigma (σ) phase precipitation in stainless steels. ISRN Metall. 2012, 2012, 732471. [Google Scholar] [CrossRef]
- Marcinkowski, M.; Miller, D. A study of defect sub-structures in the Fe–Cr sigma phase by means of transmission electron microscopy. Philos. Mag. 1962, 7, 1025–1059. [Google Scholar] [CrossRef]
- Davidson, D.; Chan, K. Investigation of Fracture Resistance in Microstructures of Intermetallic Materials for High Temperature Service; Southwest Research Institute: San Antonio, TX, USA, 1995; p. 118. [Google Scholar]
- Yeh, J.W.; Chen, S.K.; Lin, S.J.; Gan, J.Y.; Chin, T.S.; Shun, T.T.; Tsau, C.H.; Chang, S.Y. Nanostructured high-entropy alloys with multiple principal elements: Novel alloy design concepts and outcomes. Adv. Eng. Mater. 2004, 6, 299–303. [Google Scholar] [CrossRef]
- Na, Y.S.; Lim, K.R.; Chang, H.J.; Kim, J. Effect of Trace Additions of Ti on the Microstructure of AlCoCrFeNi-Based High Entropy Alloy. Sci. Adv. Mater. 2016, 8, 1984–1988. [Google Scholar] [CrossRef]
- Yurchenko, N.; Panina, E.; Zherebtsov, S.; Stepanov, N. Design and characterization of eutectic refractory high entropy alloys. Materialia 2021, 16, 101057. [Google Scholar] [CrossRef]
- Panina, E.S.; Yurchenko, N.Y.; Zherebtsov, S.V.; Tikhonovsky, M.A.; Mishunin, M.V.; Stepanov, N.D. Structures and mechanical properties of Ti-Nb-Cr-V-Ni-Al refractory high entropy alloys. Mater. Sci. Eng. A 2020, 786, 139409. [Google Scholar] [CrossRef]
- Tsai, K.-Y.; Tsai, M.-H.; Yeh, J.-W. Sluggish diffusion in Co–Cr–Fe–Mn–Ni high-entropy alloys. Acta Mater. 2013, 61, 4887–4897. [Google Scholar] [CrossRef]
- He, Q.; Yang, Y. On Lattice Distortion in High Entropy Alloys. Front. Mater. 2018, 5, 42. [Google Scholar] [CrossRef]
- Ye, Y.F.; Zhang, Y.H.; He, Q.F.; Zhuang, Y.; Wang, S.; Shi, S.Q.; Hu, A.; Fan, J.; Yang, Y. Atomic-scale distorted lattice in chemically disordered equimolar complex alloys. Acta Mater. 2018, 150, 182–194. [Google Scholar] [CrossRef]
- Yeh, J.-W. Alloy design strategies and future trends in high-entropy alloys. JOM 2013, 65, 1759–1771. [Google Scholar] [CrossRef]
- Ye, Y.; Wang, Q.; Lu, J.; Liu, C.; Yang, Y. High-entropy alloy: Challenges and prospects. Mater. Today 2016, 19, 349–362. [Google Scholar] [CrossRef]
- Gludovatz, B.; Hohenwarter, A.; Thurston, K.V.; Bei, H.; Wu, Z.; George, E.P.; Ritchie, R.O. Exceptional damage-tolerance of a medium-entropy alloy CrCoNi at cryogenic temperatures. Nat. Commun. 2016, 7, 10602. [Google Scholar] [CrossRef] [PubMed]
- Hsu, C.-Y.; Juan, C.-C.; Sheu, T.-S.; Chen, S.-K.; Yeh, J.-W. Effect of aluminum content on microstructure and mechanical properties of Al x CoCrFeMo 0.5 Ni high-entropy alloys. JOM 2013, 65, 1840–1847. [Google Scholar] [CrossRef]
- Chung, D.; Ding, Z.; Yang, Y. Hierarchical Eutectic Structure Enabling Superior Fracture Toughness and Superb Strength in CoCrFeNiNb0. 5 Eutectic High Entropy Alloy at Room Temperature. Adv. Eng. Mater. 2019, 21, 1801060. [Google Scholar] [CrossRef]
- Niihara, K. A fracture mechanics analysis of indentation-induced Palmqvist crack in ceramics. J. Mater. Sci. Lett. 1983, 2, 221–223. [Google Scholar] [CrossRef]
- He, F.; Wang, Z.; Wu, Q.; Niu, S.; Li, J.; Wang, J.; Liu, C.T. Solid solution island of the Co-Cr-Fe-Ni high entropy alloy system. Scr. Mater. 2017, 131, 42–46. [Google Scholar] [CrossRef]
- Chen, S.-T.; Tang, W.-Y.; Kuo, Y.-F.; Chen, S.-Y.; Tsau, C.-H.; Shun, T.-T.; Yeh, J.-W. Microstructure and properties of age-hardenable AlxCrFe1.5MnNi0.5 alloys. Mater. Sci. Eng. A 2010, 527, 5818–5825. [Google Scholar] [CrossRef]
- Tsai, M.-H.; Chang, K.-C.; Li, J.-H.; Tsai, R.-C.; Cheng, A.-H. A second criterion for sigma phase formation in high-entropy alloys. Mater. Res. Lett. 2016, 4, 90–95. [Google Scholar] [CrossRef]
- Jo, Y.H.; Choi, W.M.; Kim, D.G.; Zargaran, A.; Sohn, S.S.; Kim, H.S.; Lee, B.J.; Kim, N.J.; Lee, S. FCC to BCC transformation-induced plasticity based on thermodynamic phase stability in novel V10Cr10Fe45CoxNi35−x medium-entropy alloys. Sci. Rep. 2019, 9, 2948. [Google Scholar] [CrossRef] [Green Version]
- Ding, Z.; He, Q.; Wang, Q.; Yang, Y. Superb strength and high plasticity in laves phase rich eutectic medium-entropy-alloy nanocomposites. Int. J. Plast. 2018, 106, 57–72. [Google Scholar] [CrossRef]
- Shun, T.-T.; Chang, L.-Y.; Shiu, M.-H. Microstructures and mechanical properties of multiprincipal component CoCrFeNiTix alloys. Mater. Sci. Eng. A 2012, 556, 170–174. [Google Scholar] [CrossRef]
- Zhang, K.B.; Fu, Z.Y.; Zhang, J.Y.; Wang, W.M.; Wang, H.; Wang, Y.C.; Zhang, Q.J.; Shi, J. Microstructure and mechanical properties of CoCrFeNiTiAlx high-entropy alloys. Mater. Sci. Eng. A 2009, 508, 214–219. [Google Scholar] [CrossRef]
- Li, L.; Fang, Q.; Li, J.; Liu, B.; Liu, Y.; Liaw, P.K. Lattice-distortion dependent yield strength in high entropy alloys. Mater. Sci. Eng. A 2020, 784. [Google Scholar] [CrossRef]
- Zhang, Y.; Zhou, Y.J.; Lin, J.P.; Chen, G.L.; Liaw, P.K. Solid-solution phase formation rules for multi-component alloys. Adv. Eng. Mater. 2008, 10, 534–538. [Google Scholar] [CrossRef]
- Guo, S.; Liu, C.T. Phase stability in high entropy alloys: Formation of solid-solution phase or amorphous phase. Prog. Nat. Sci. Mater. Int. 2011, 21, 433–446. [Google Scholar] [CrossRef] [Green Version]
- Thoma, D.; Chu, F.; Peralta, P.; Kotula, P.; Chen, K.; Mitchell, T. Elastic and mechanical properties of Nb (Cr, V)2 C15 Laves phases. Mater. Sci. Eng. A 1997, 239, 251–259. [Google Scholar] [CrossRef]
- Xue, Y.; Li, S.; Zhong, H.; Fu, H. Characterization of fracture toughness and toughening mechanisms in Laves phase Cr2Nb based alloys. Mater. Sci. Eng. A 2015, 638, 340–347. [Google Scholar] [CrossRef]
- Varin, R.A.; Li, G.H. Microstructure and mechanical properties of Mg33−xSixNi67 intermetallic composite alloys. Mater. Sci. Eng. A 1995, 192–193, 59–68. [Google Scholar] [CrossRef]
- Dogan, B.; Schwalbe, K.H. Fracture toughness testing of TiAl base intermetallic alloys. Eng. Fract. Mech. 1997, 56, 155–165. [Google Scholar] [CrossRef]
- Campbell, J.P.; Ritchie, R.O.; Venkateswara Rao, K.T. The effect of microstructure on fracture toughness and fatigue crack growth behavior in γ-titanium aluminide based intermetallics. Metall. Mater. Trans. A 1999, 30, 563–577. [Google Scholar] [CrossRef]
- Wu, X.; Bowen, P. Effects of microstructure on the fracture toughness of Ti 3 Al-based titanium aluminides. Metall. Mater. Trans. A 1997, 28, 1357–1365. [Google Scholar] [CrossRef]
- Johnson, D.; Chen, X.; Oliver, B.; Noebe, R.; Whittenberger, J. Processing and mechanical properties of in-situ composites from the NiAlCr and the NiAl (Cr, Mo) eutectic systems. Intermetallics 1995, 3, 99–113. [Google Scholar] [CrossRef]
- Byun, J.M.; Bang, S.-R.; Park, C.W.; Suk, M.-J.; Do Kim, Y. Structural size effects of intermetallic compounds on the mechanical properties of Mo-Si-B alloy: An experimental investigation. Met. Mater. Int. 2016, 22, 81–86. [Google Scholar] [CrossRef]
- Chung, D.; Liu, X.; Yang, Y. Fracture of sigma phase containing Co–Cr–Ni–Mo medium entropy alloys. J. Alloys Compd. 2020, 846, 156189. [Google Scholar] [CrossRef]
Publisher’s Note: MDPI stays neutral with regard to jurisdictional claims in published maps and institutional affiliations. |
© 2021 by the authors. Licensee MDPI, Basel, Switzerland. This article is an open access article distributed under the terms and conditions of the Creative Commons Attribution (CC BY) license (https://creativecommons.org/licenses/by/4.0/).