Assessing Microstructure-Local Mechanical Properties in Friction Stir Welded 6082-T6 Aluminum Alloy


Abstract
1. Introduction
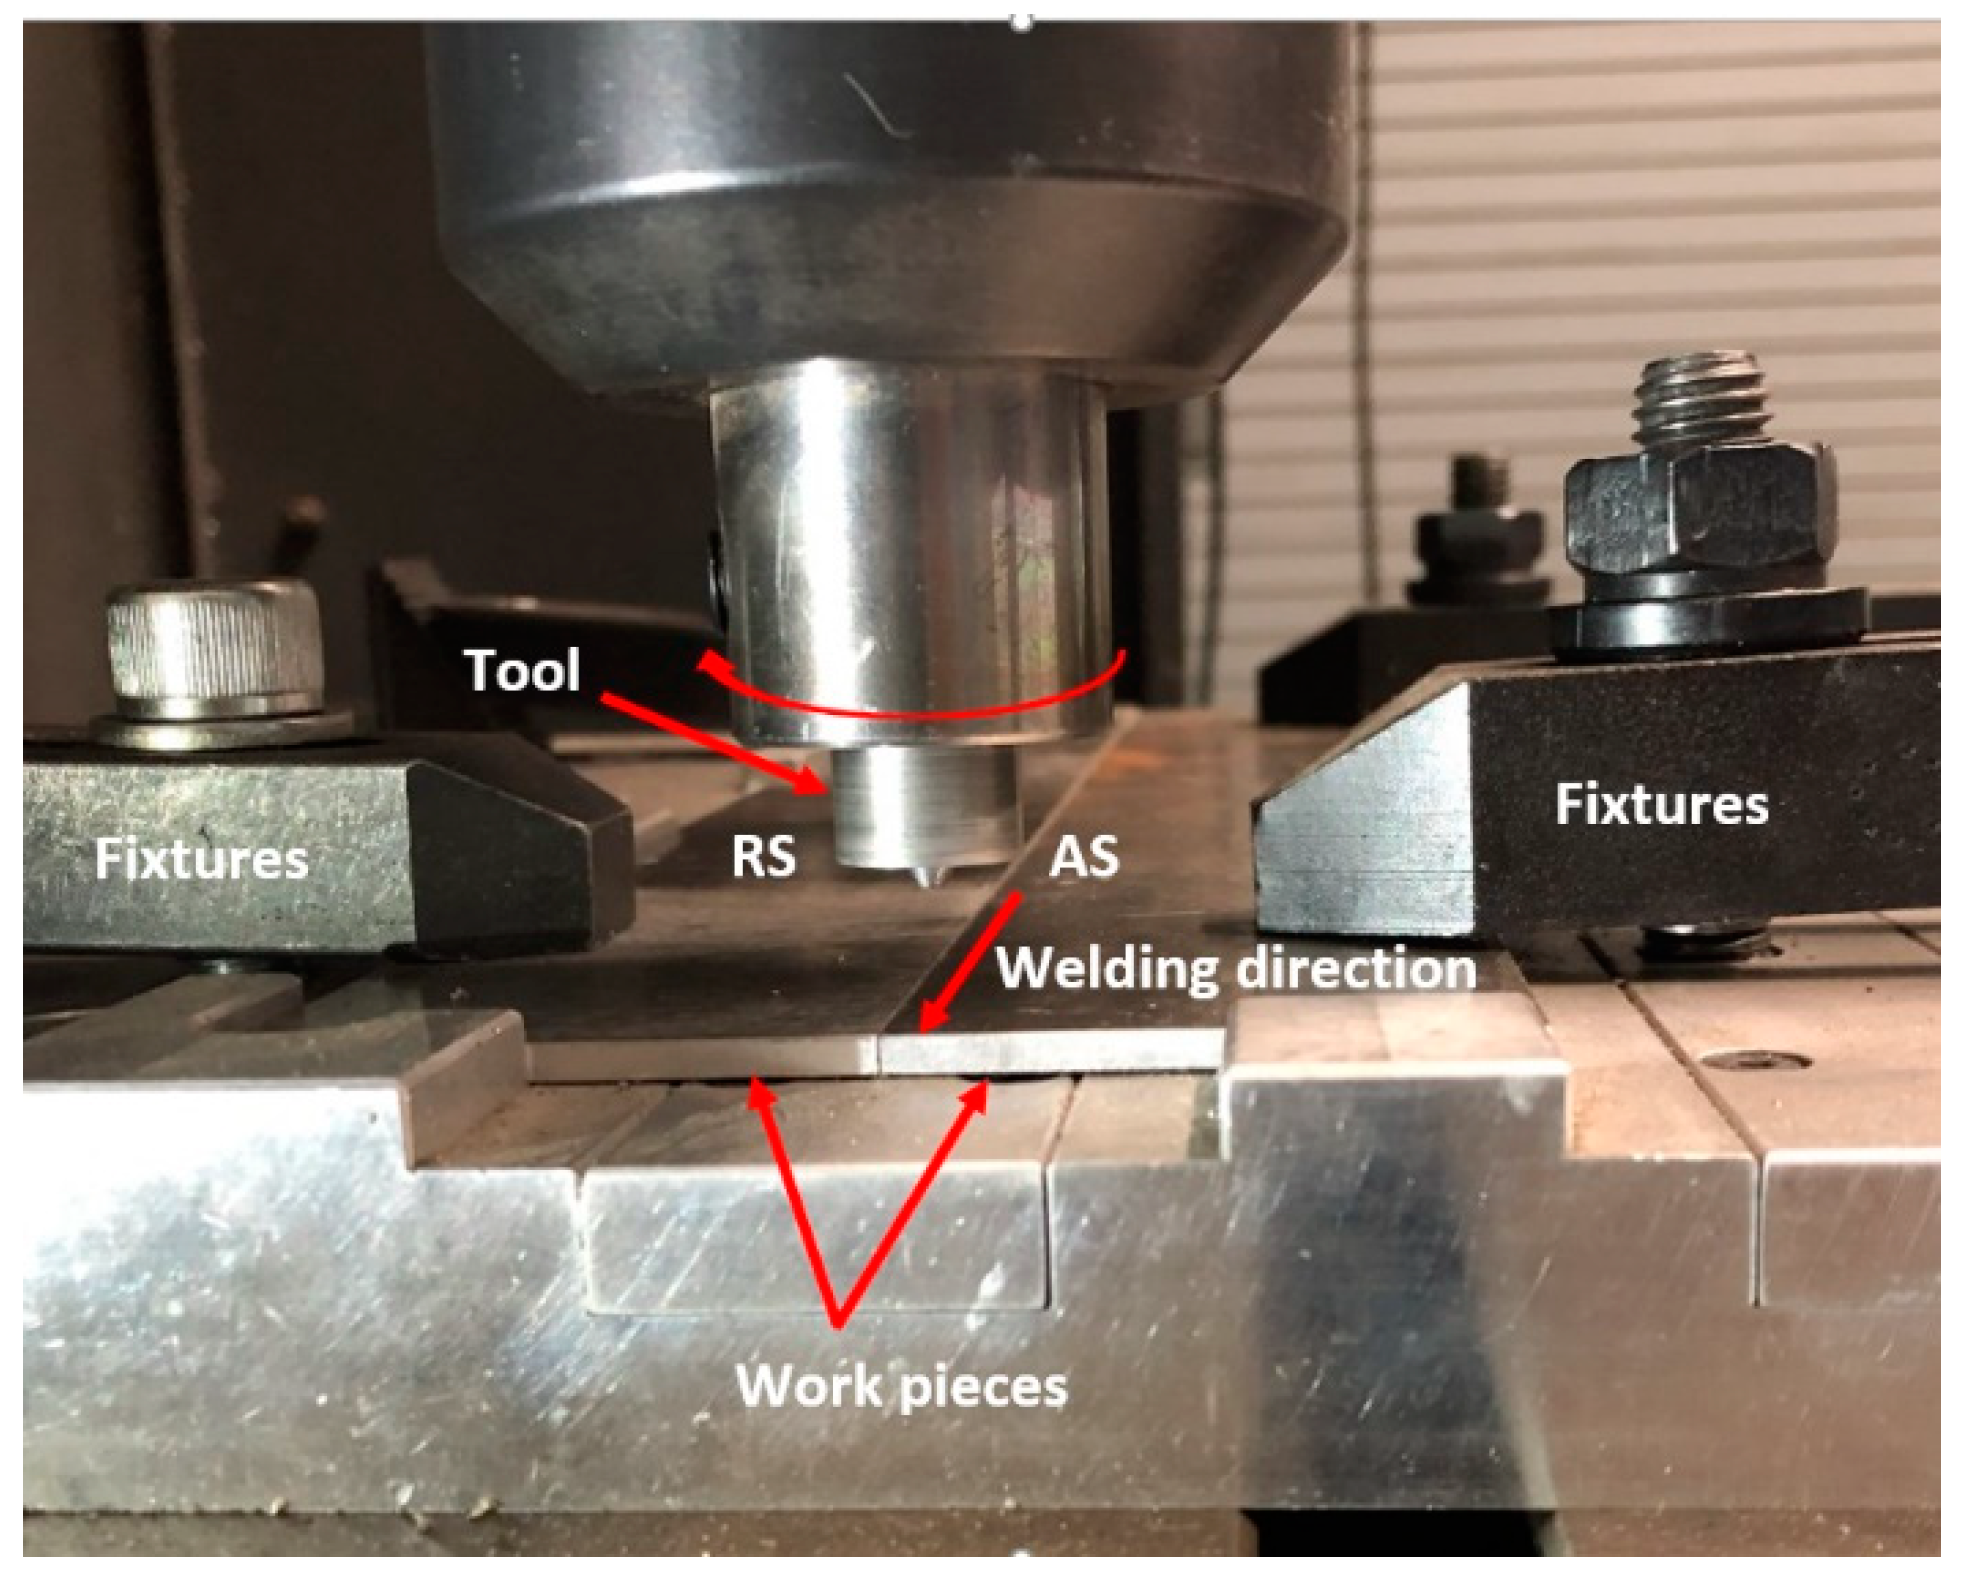
2. Experimental Procedure
3. Results and Discussion
3.1. Microstructure
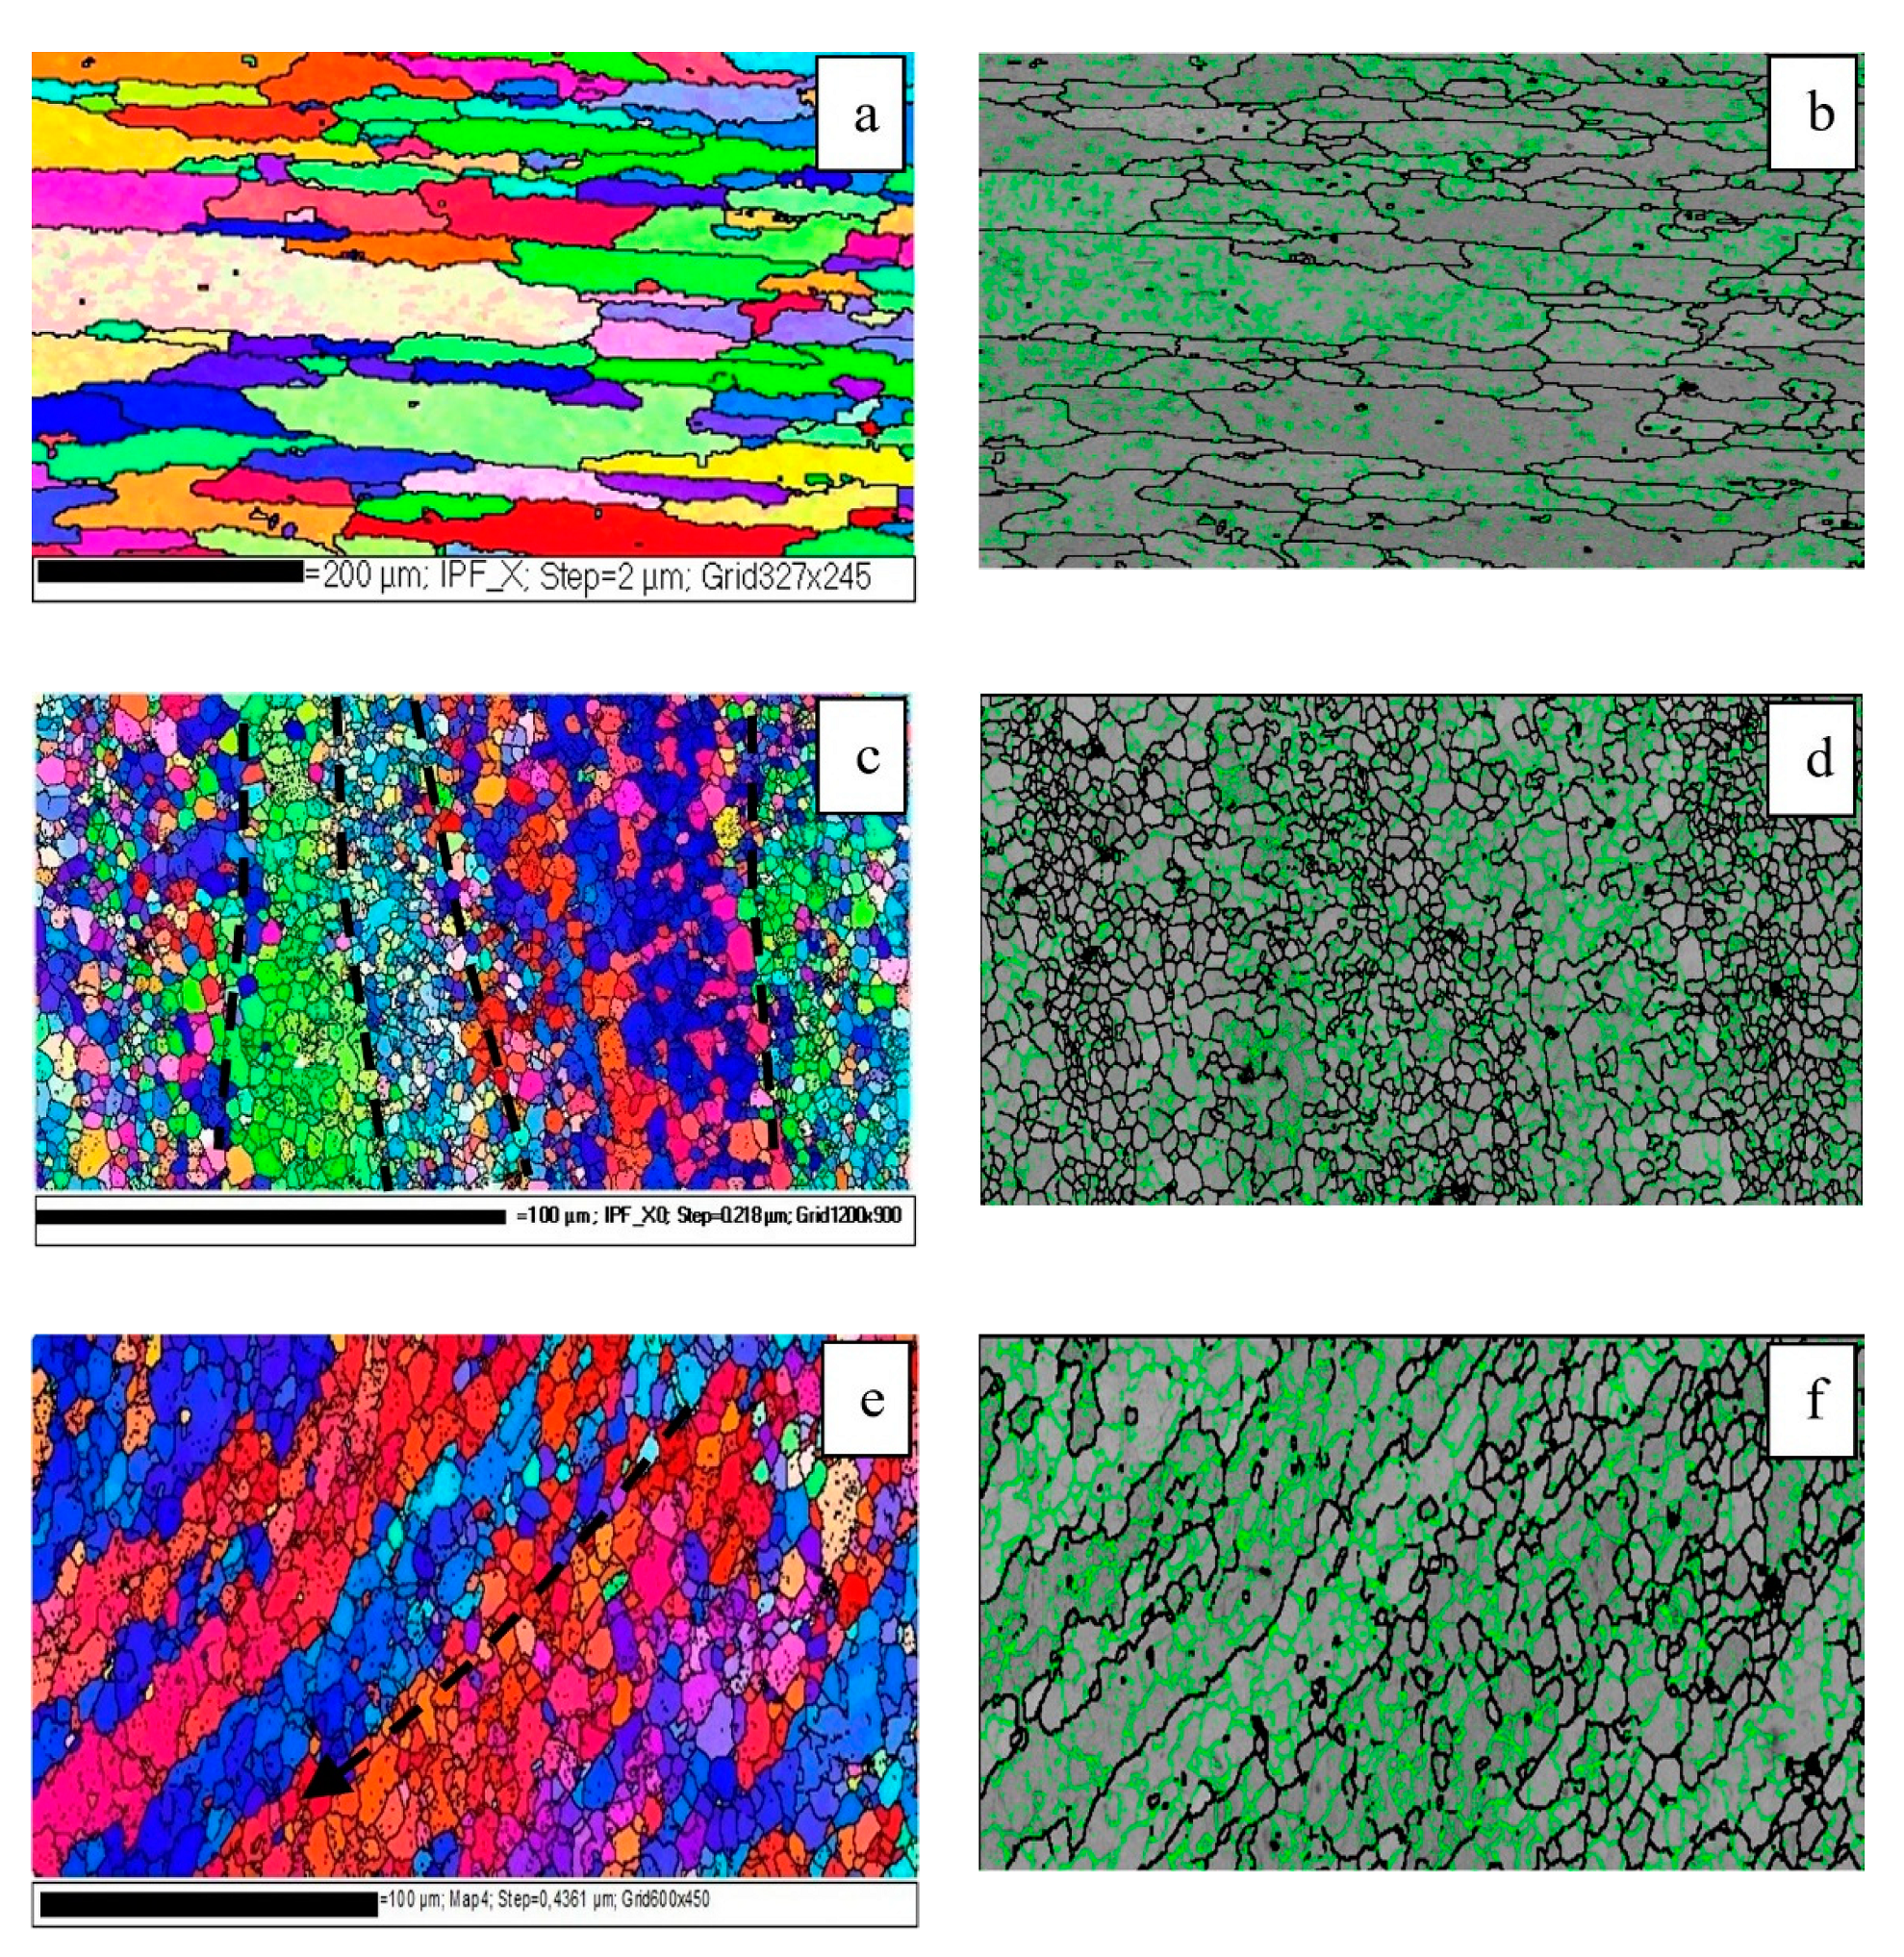
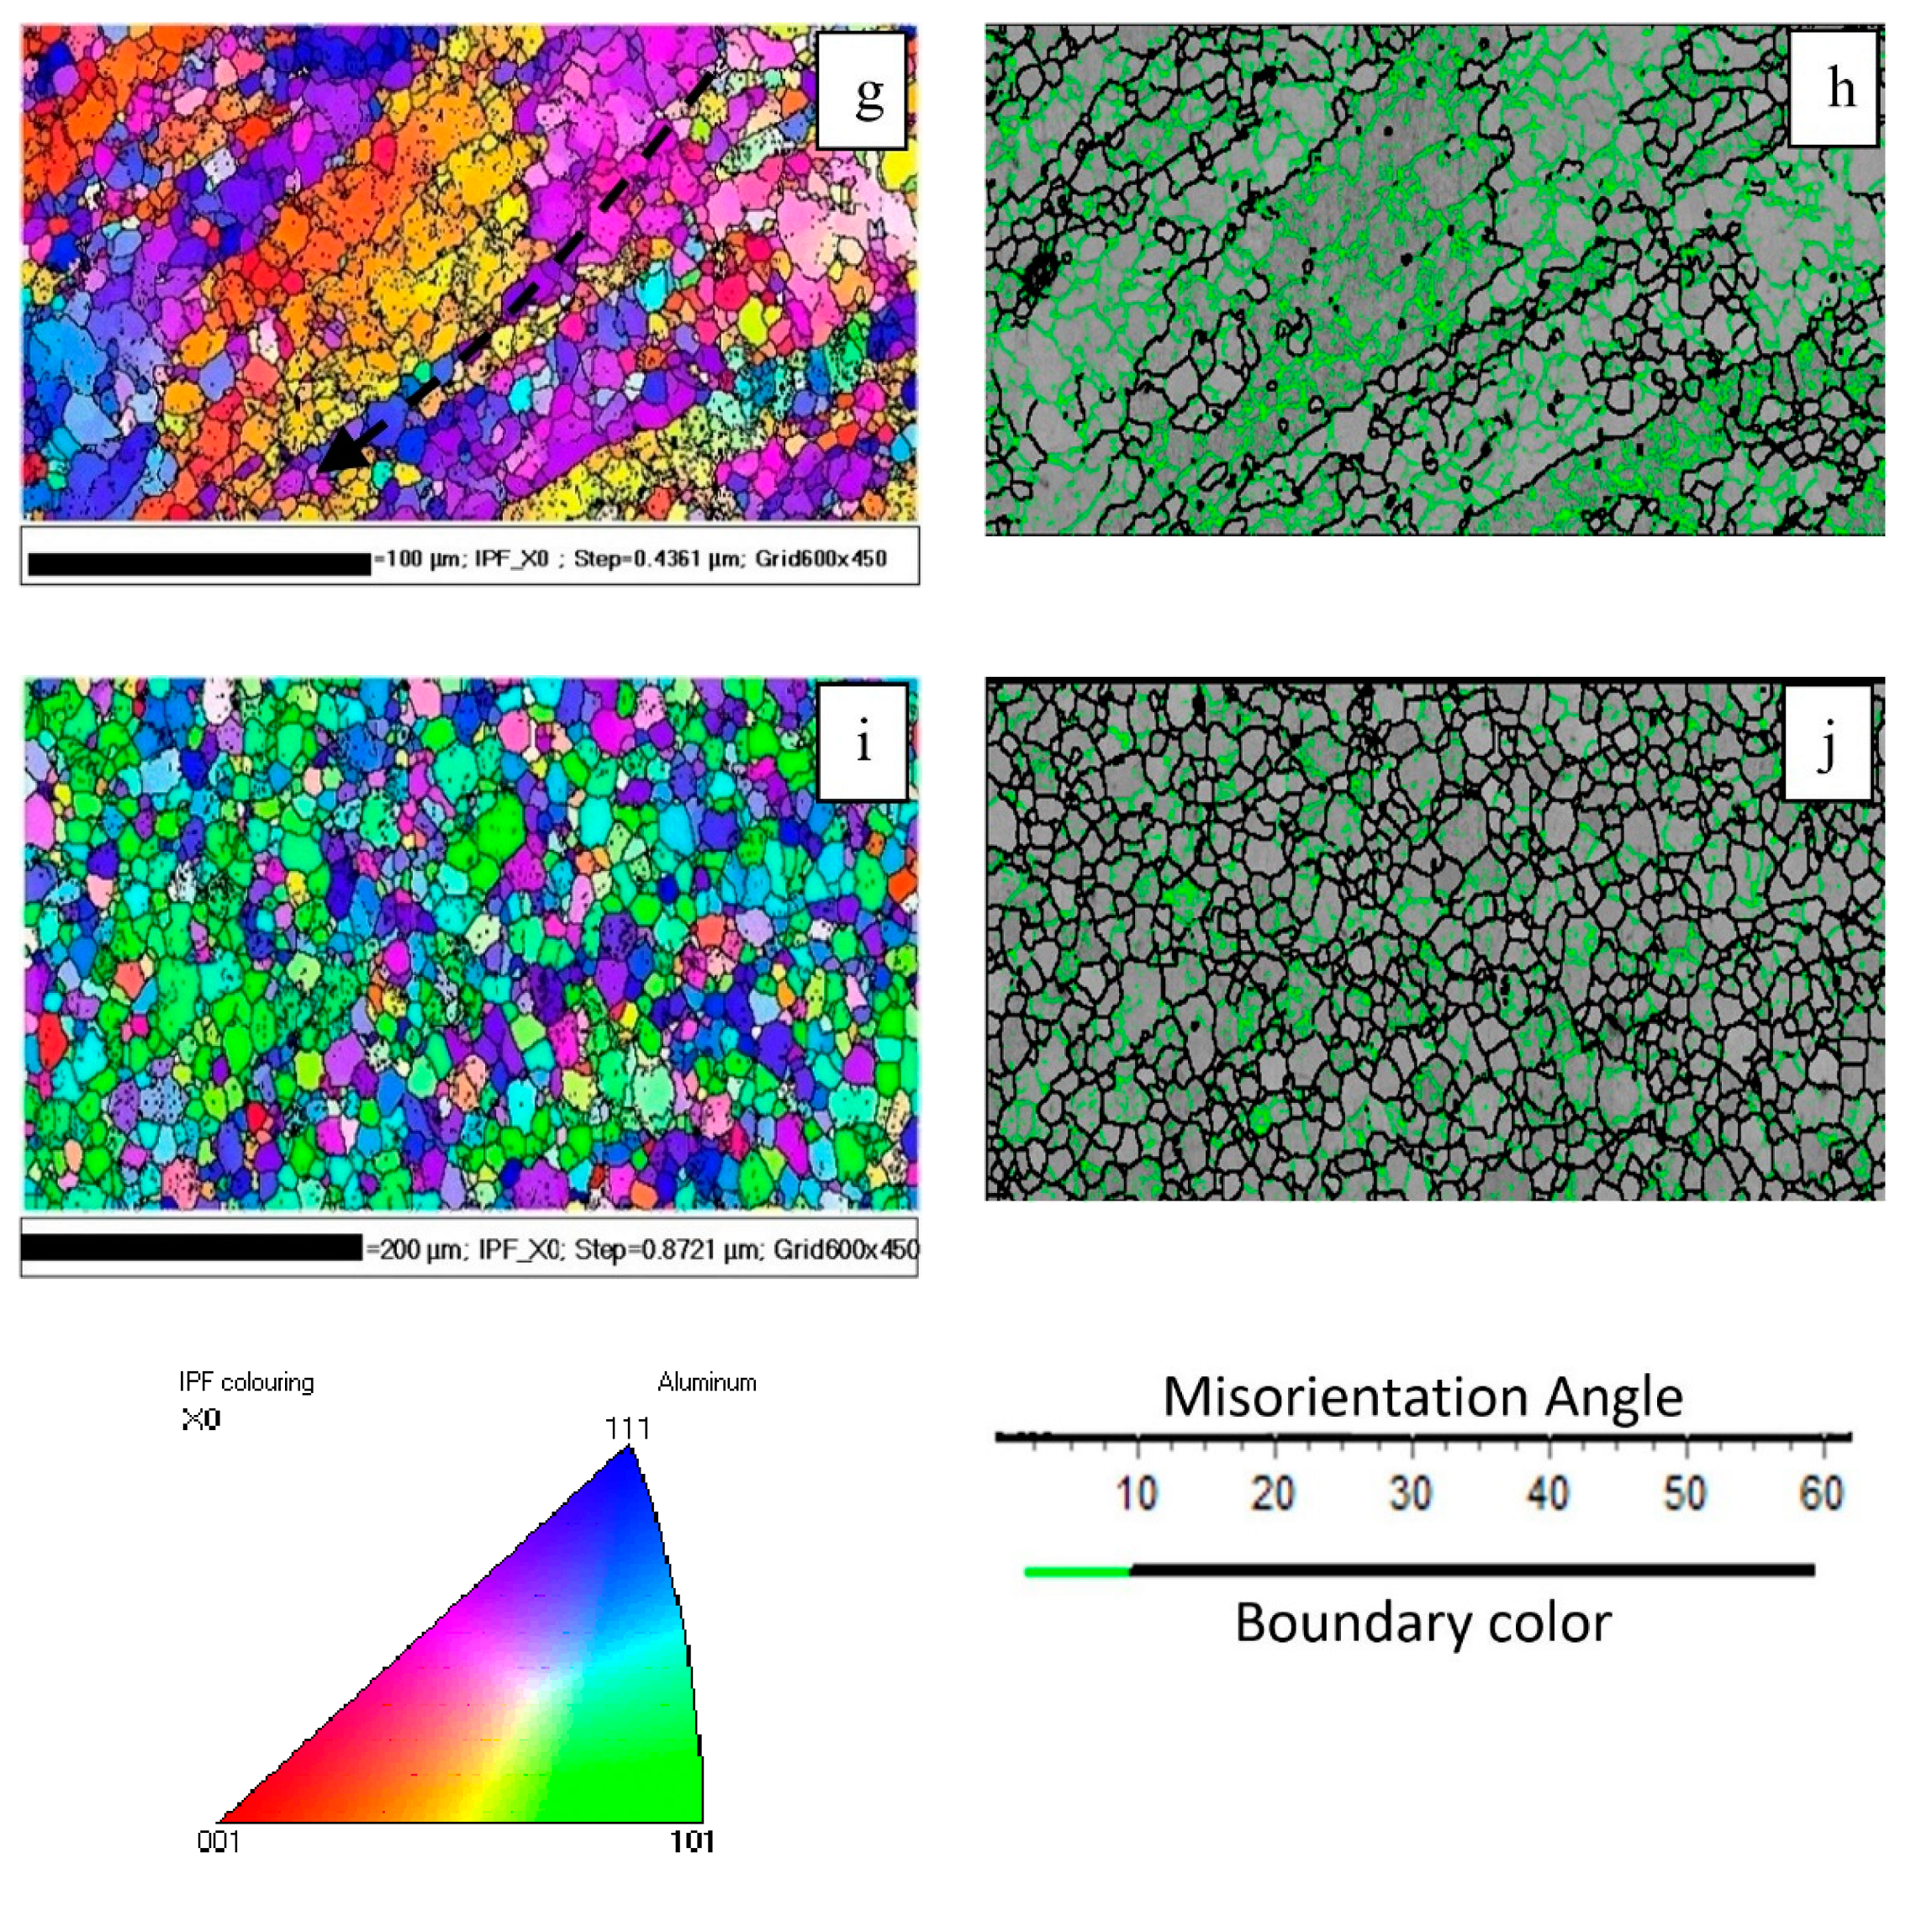
3.2. EBSD Analysis
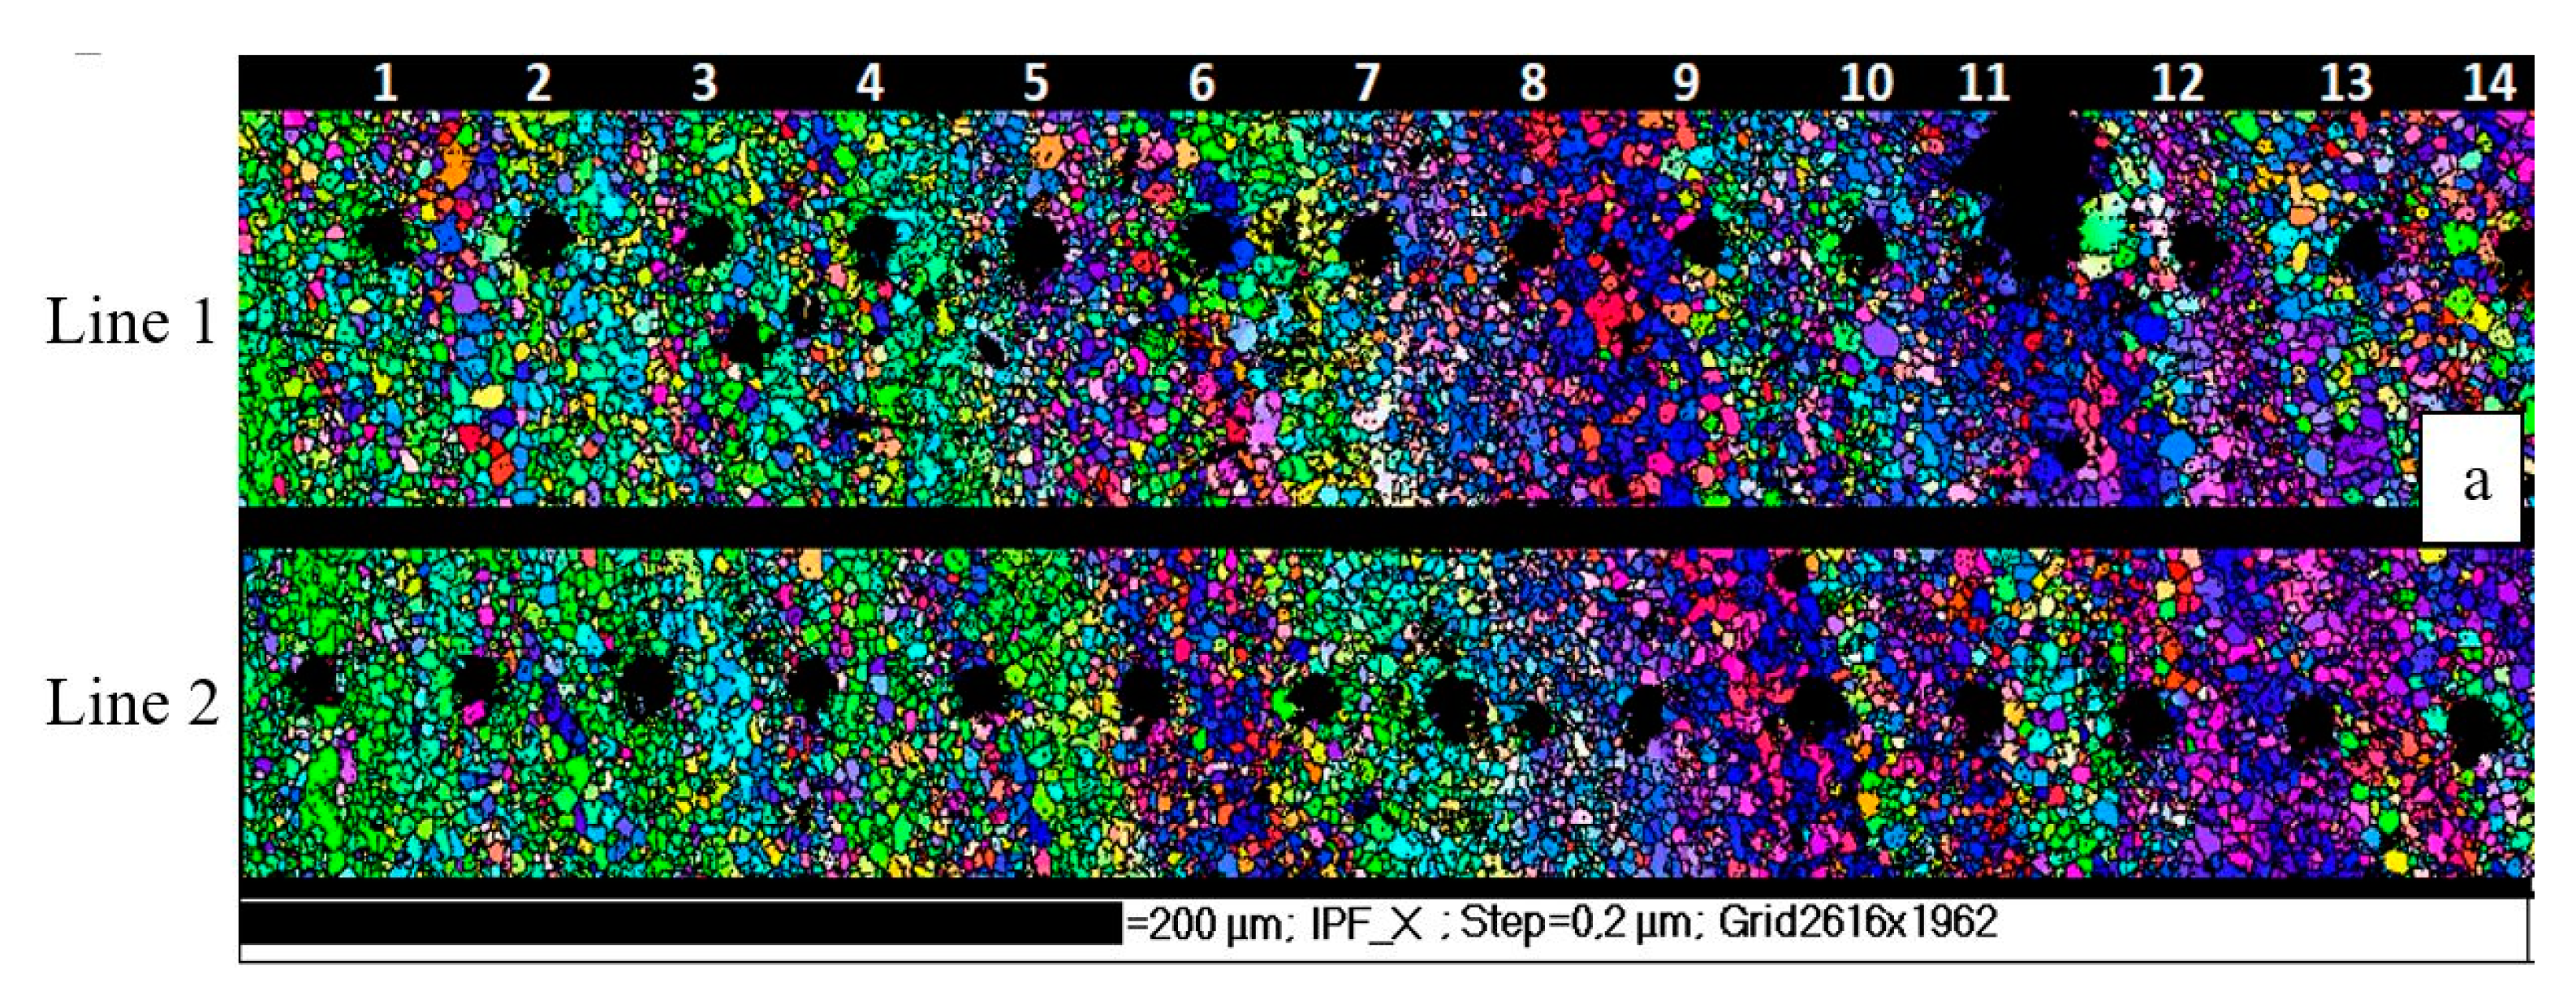
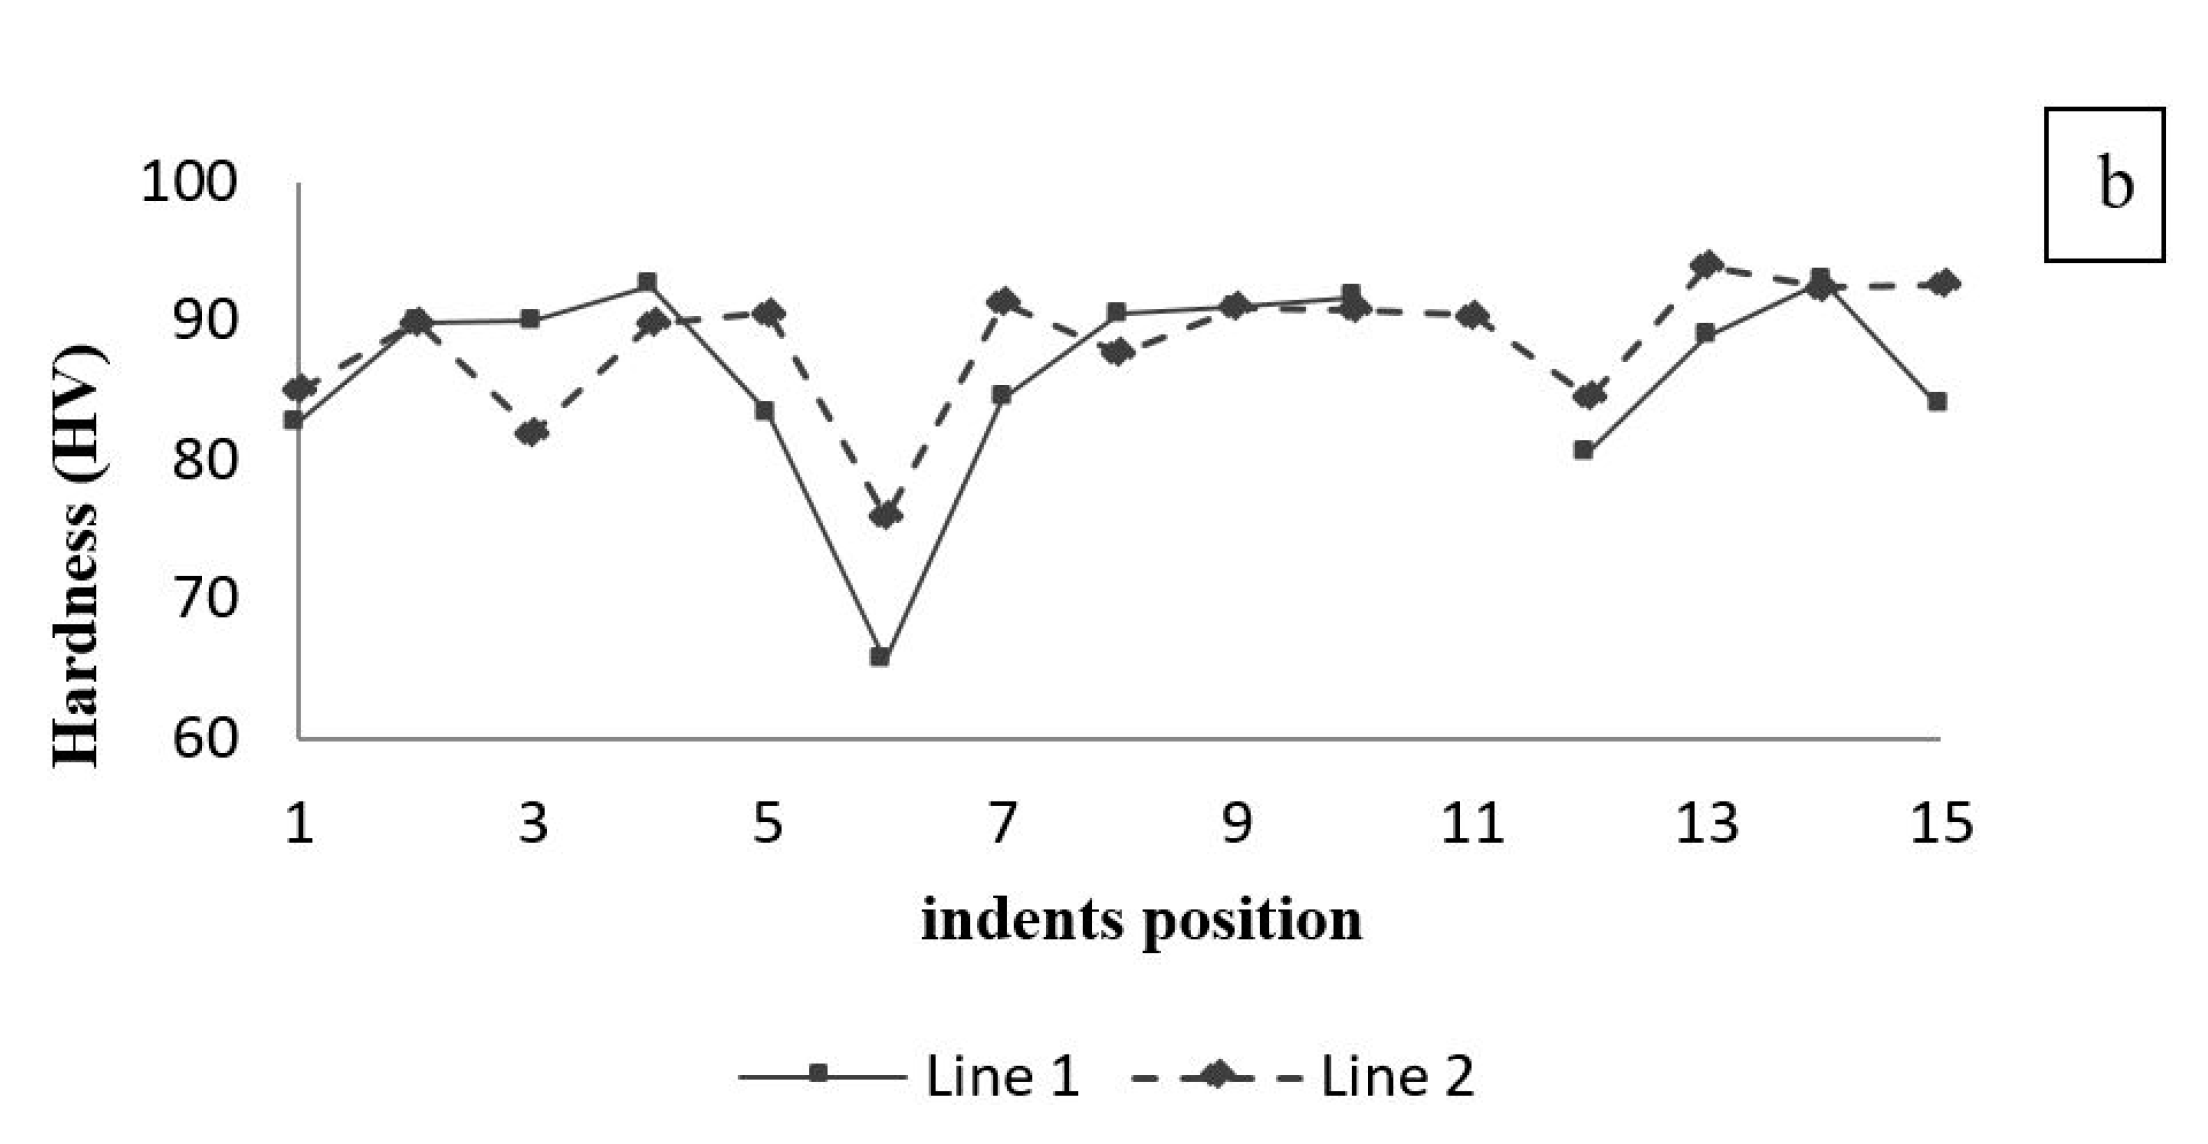
3.3. In-Situ Nanoindentation in the Banded Structure
3.4. EDS Analysis
3.5. Influence of Banded Structure on Local Tensile Properties
Evaluation of Local Mechanical Properties
4. Summary and Conclusions
- (1)
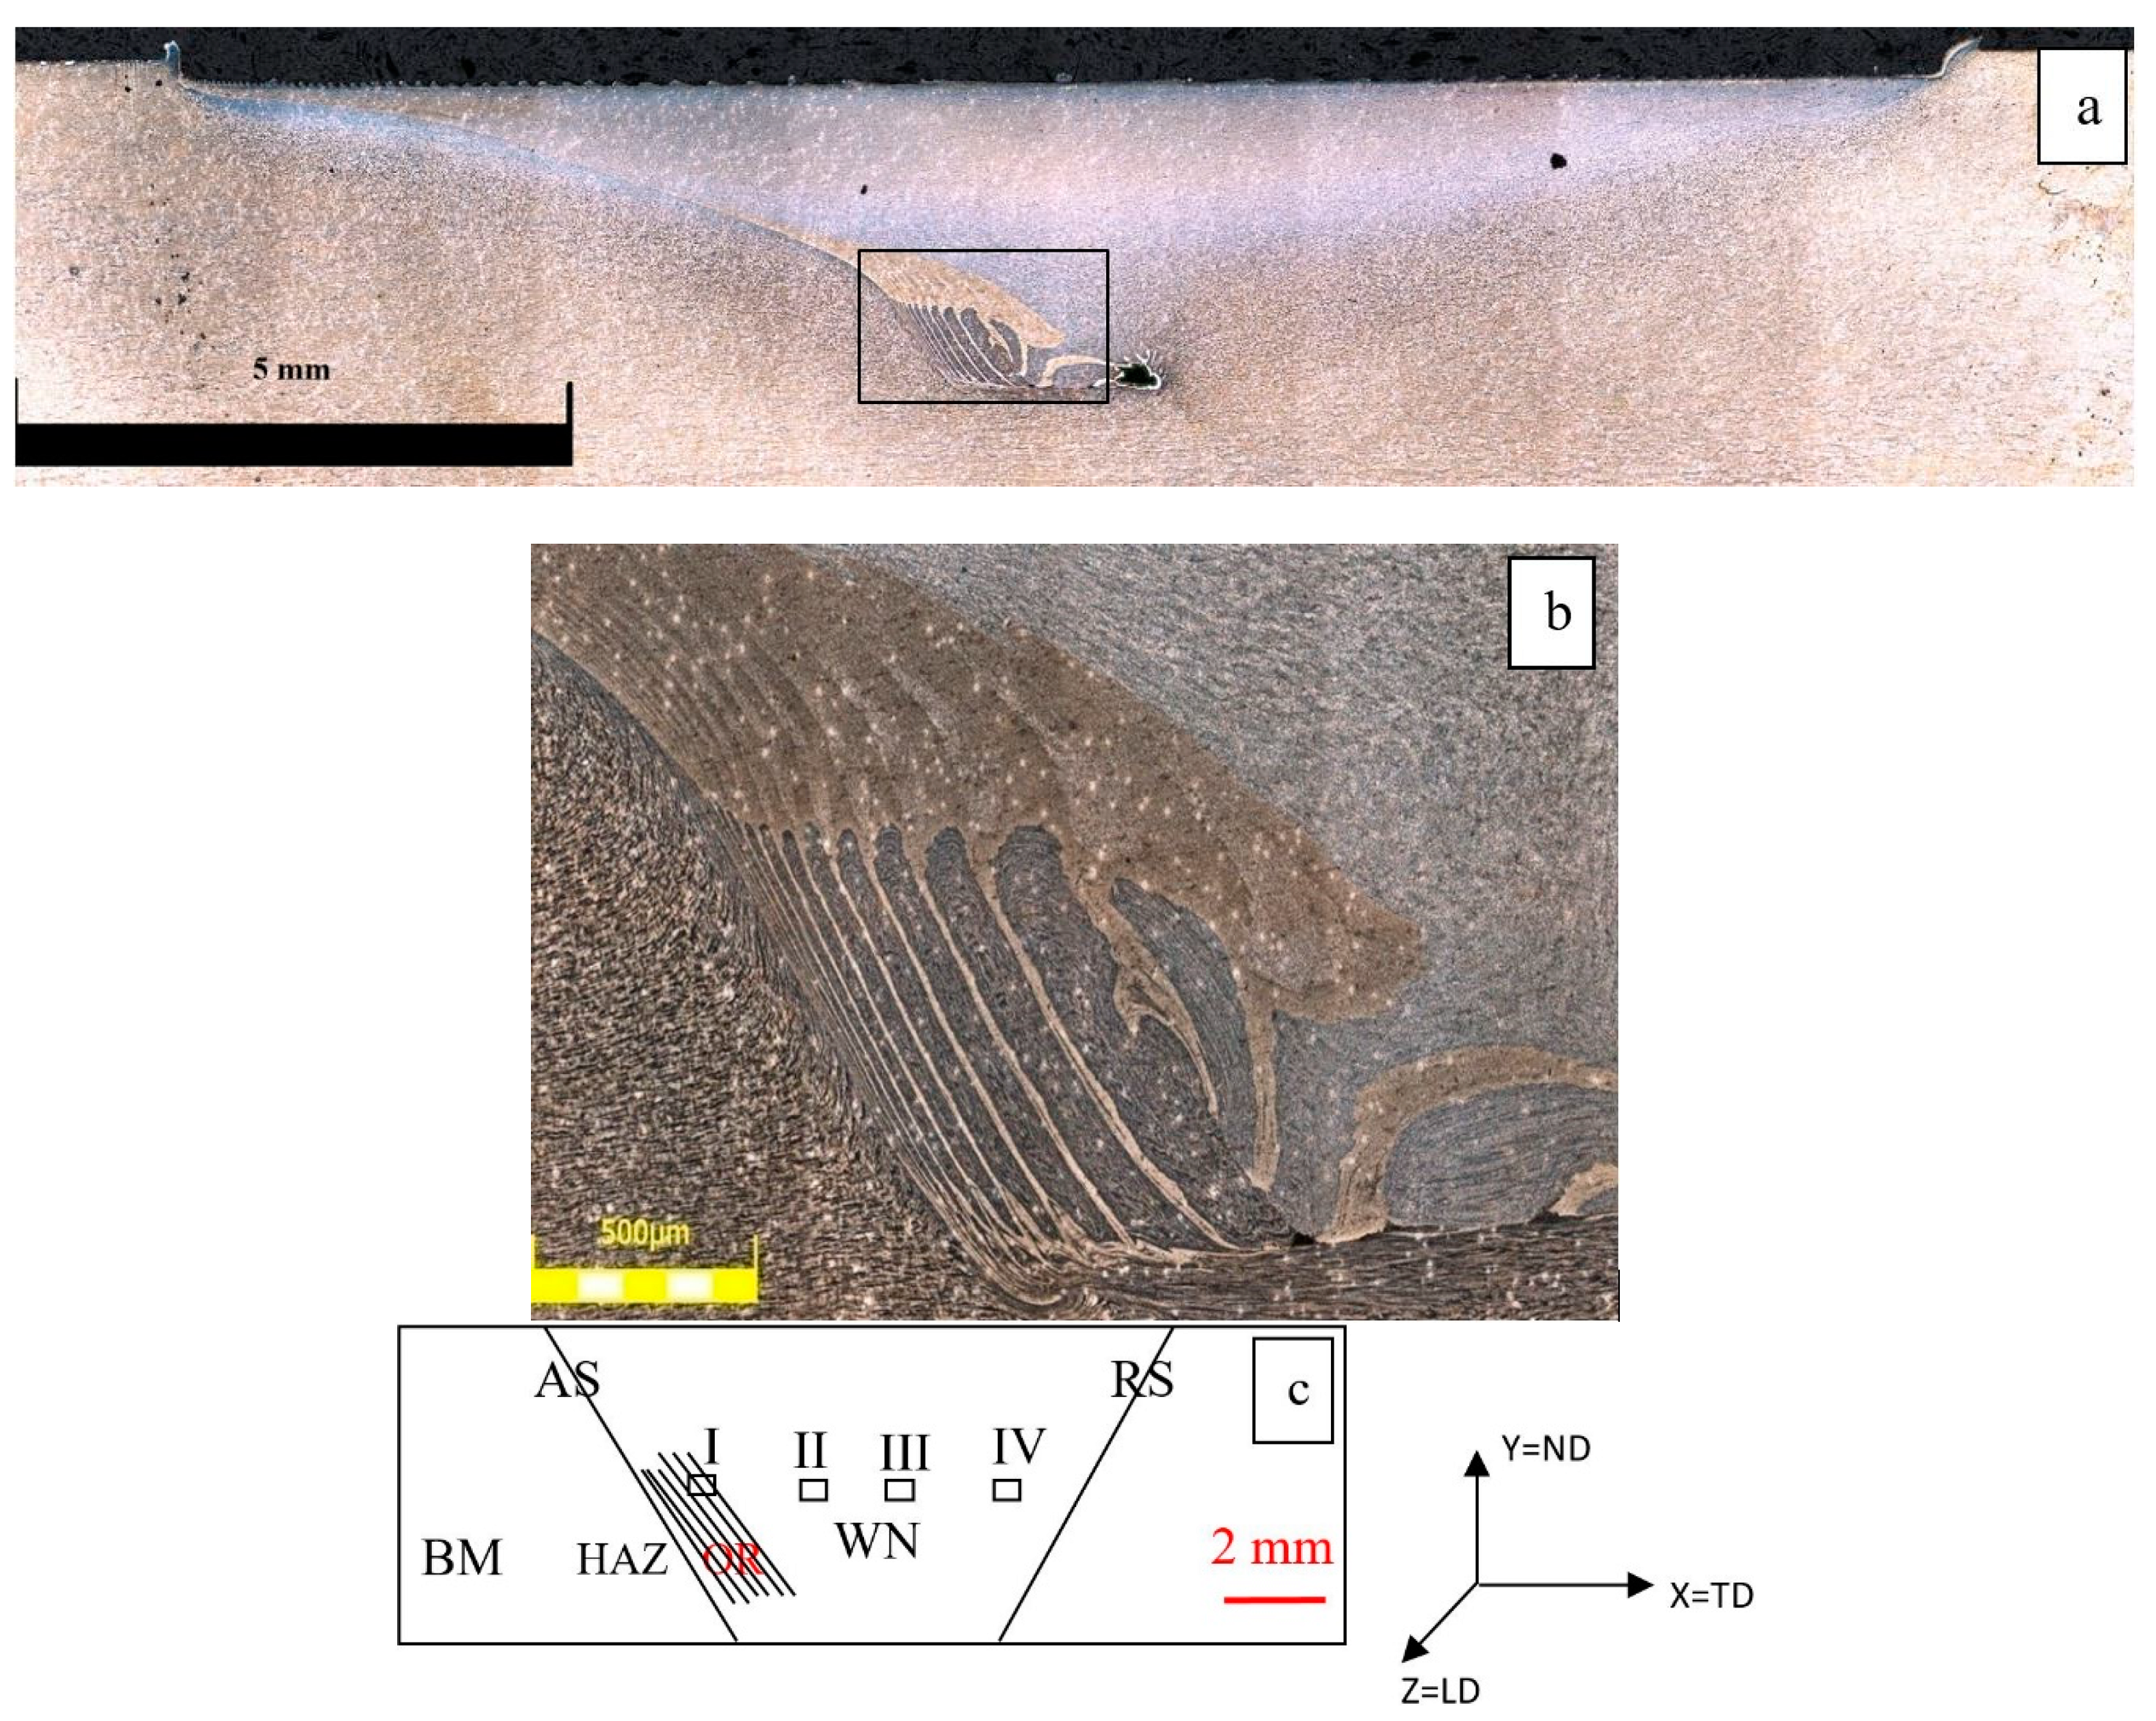
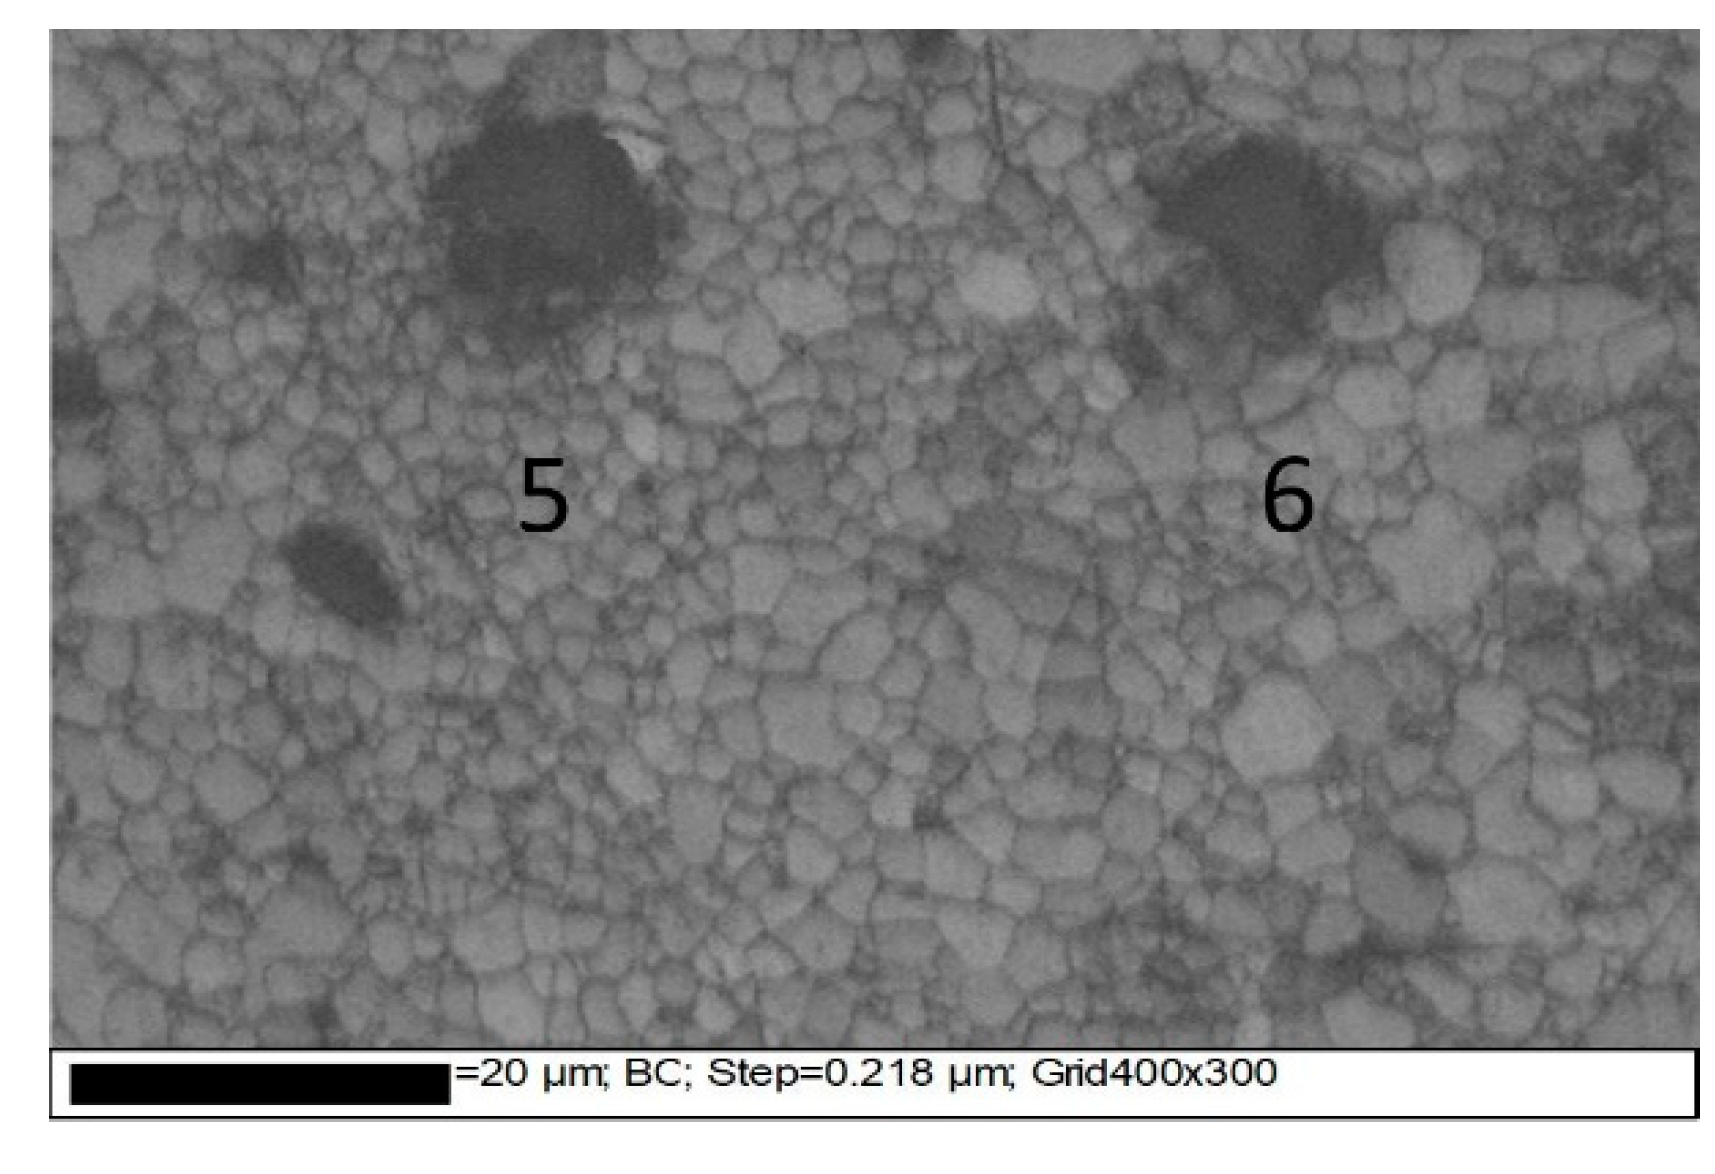
- Both optical microscopy and EBSD analysis revealed ORs as alternating bands spreading over large distances in the weld nugget. However, no correlation exists between the patterns observed by optical microscopy and those obtained by EBSD. It was shown that despite their similarity, the observed bandings had different origins.
- (2)
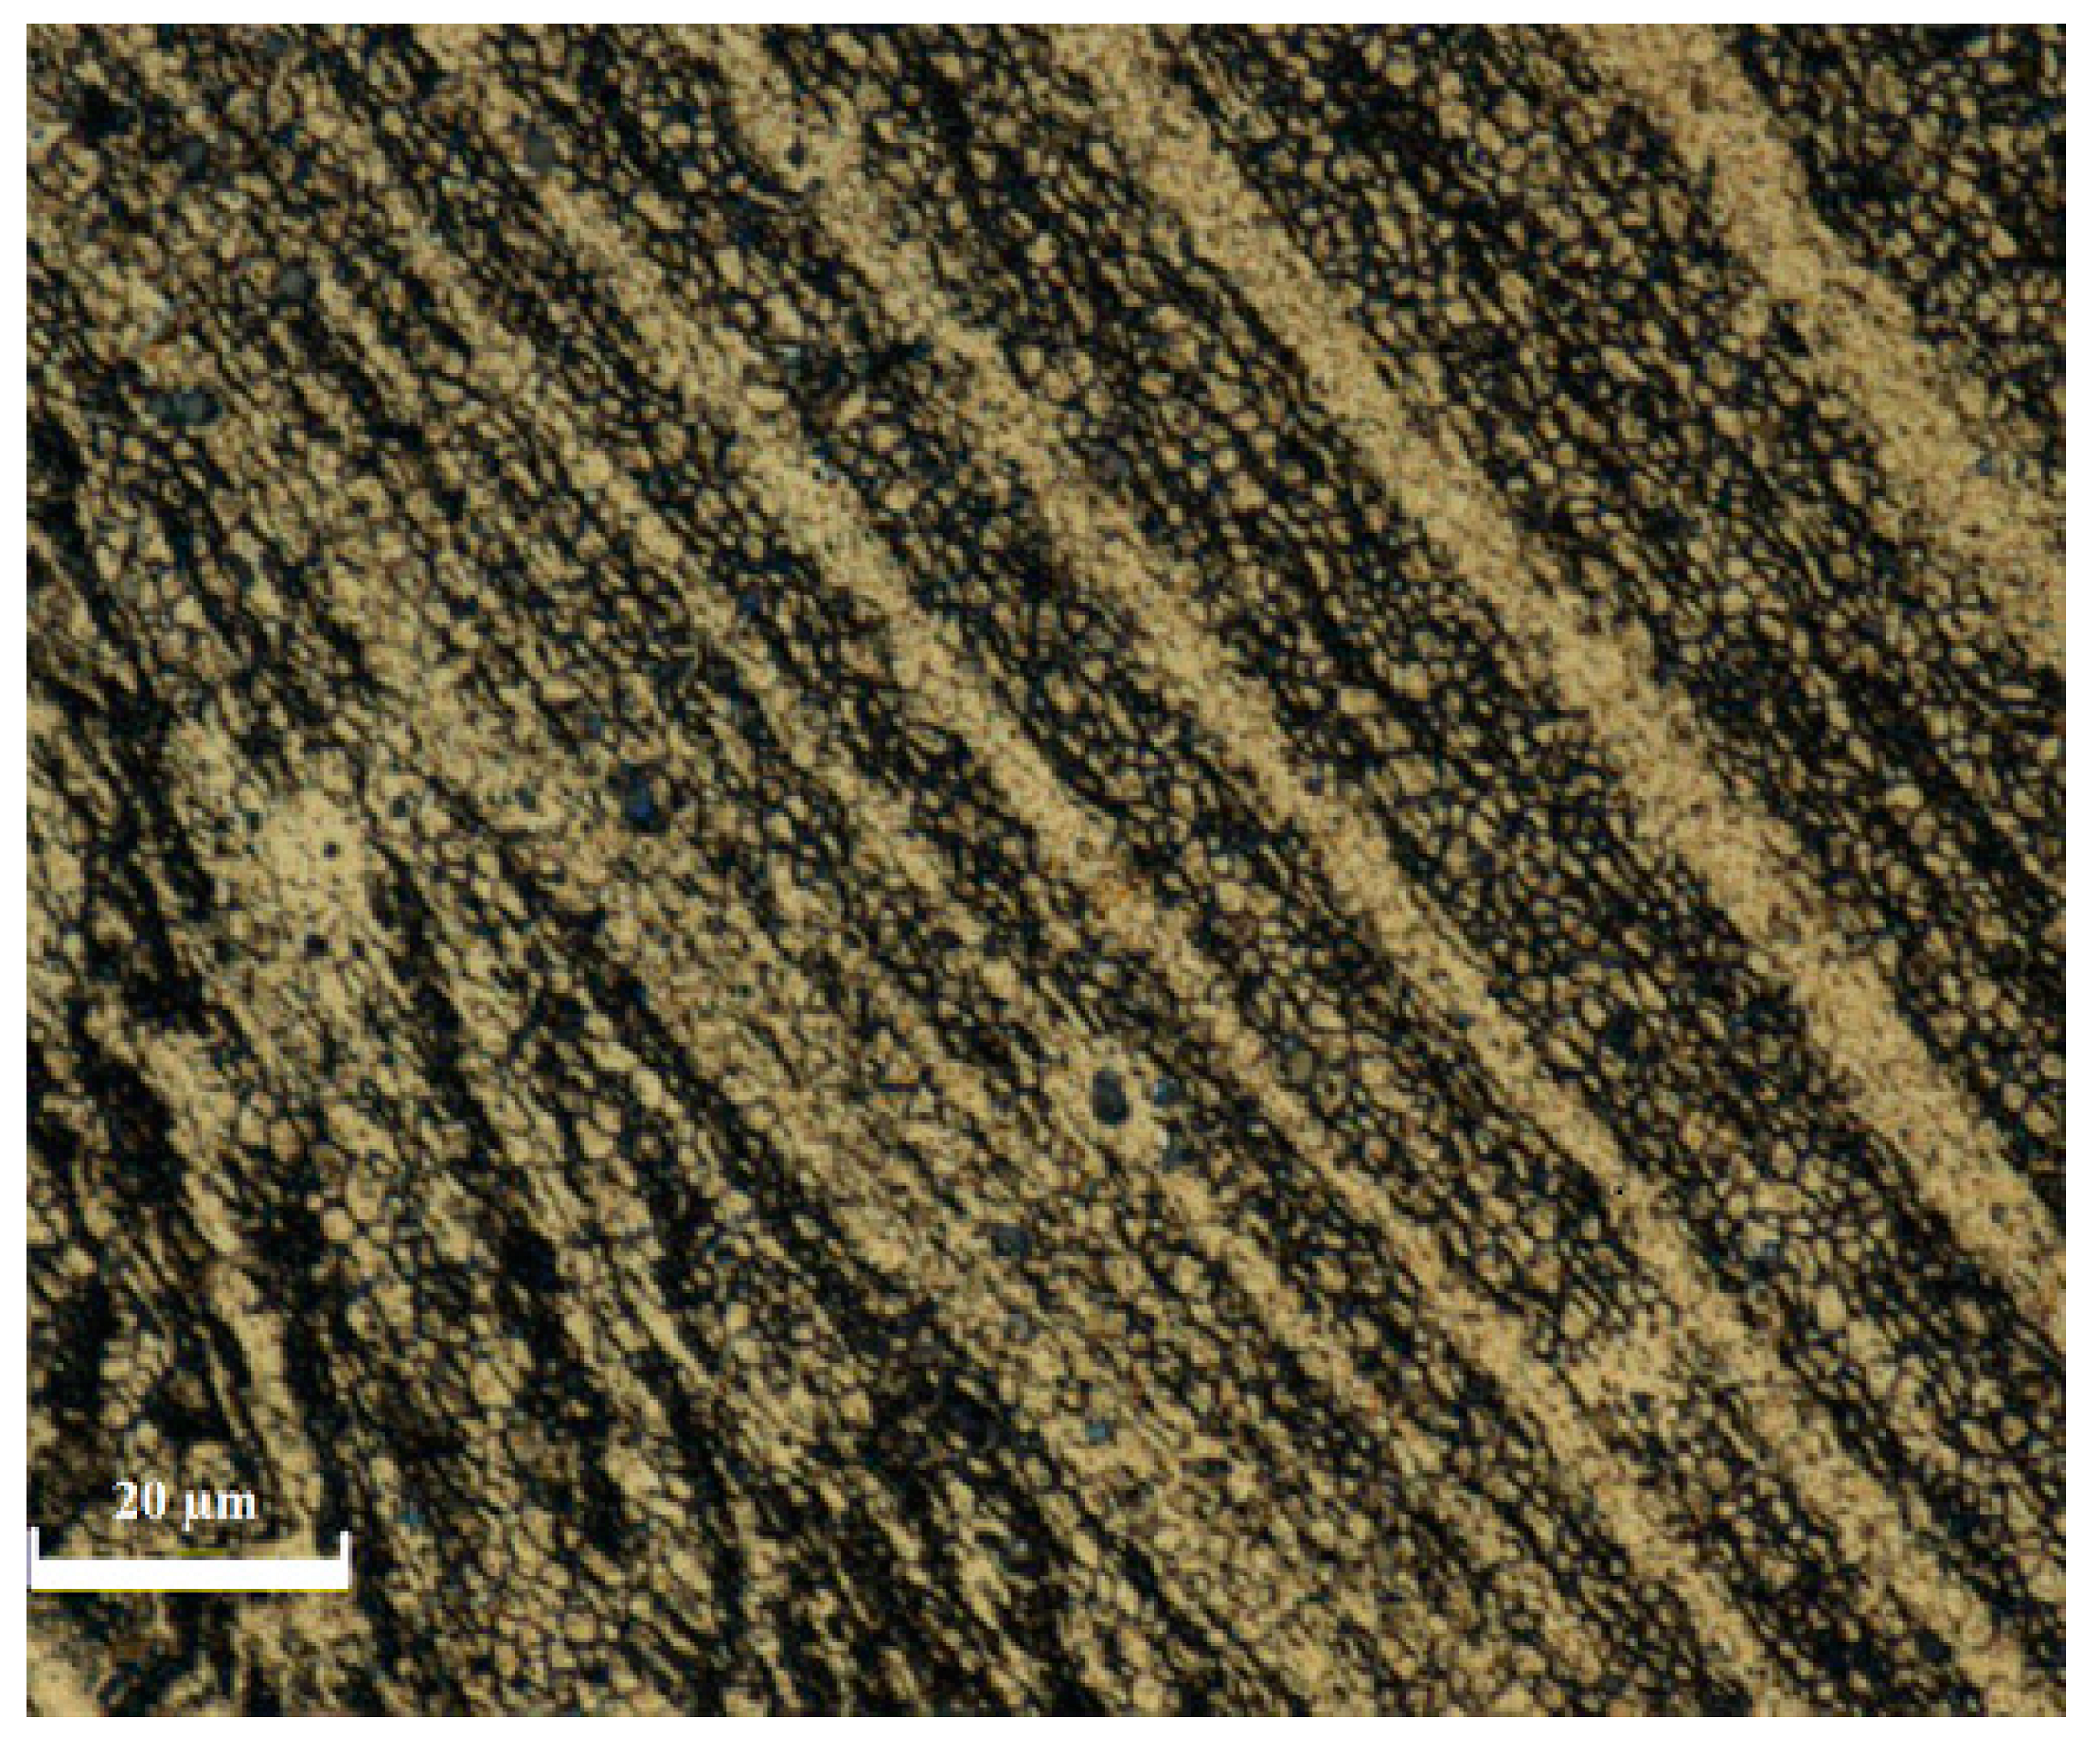
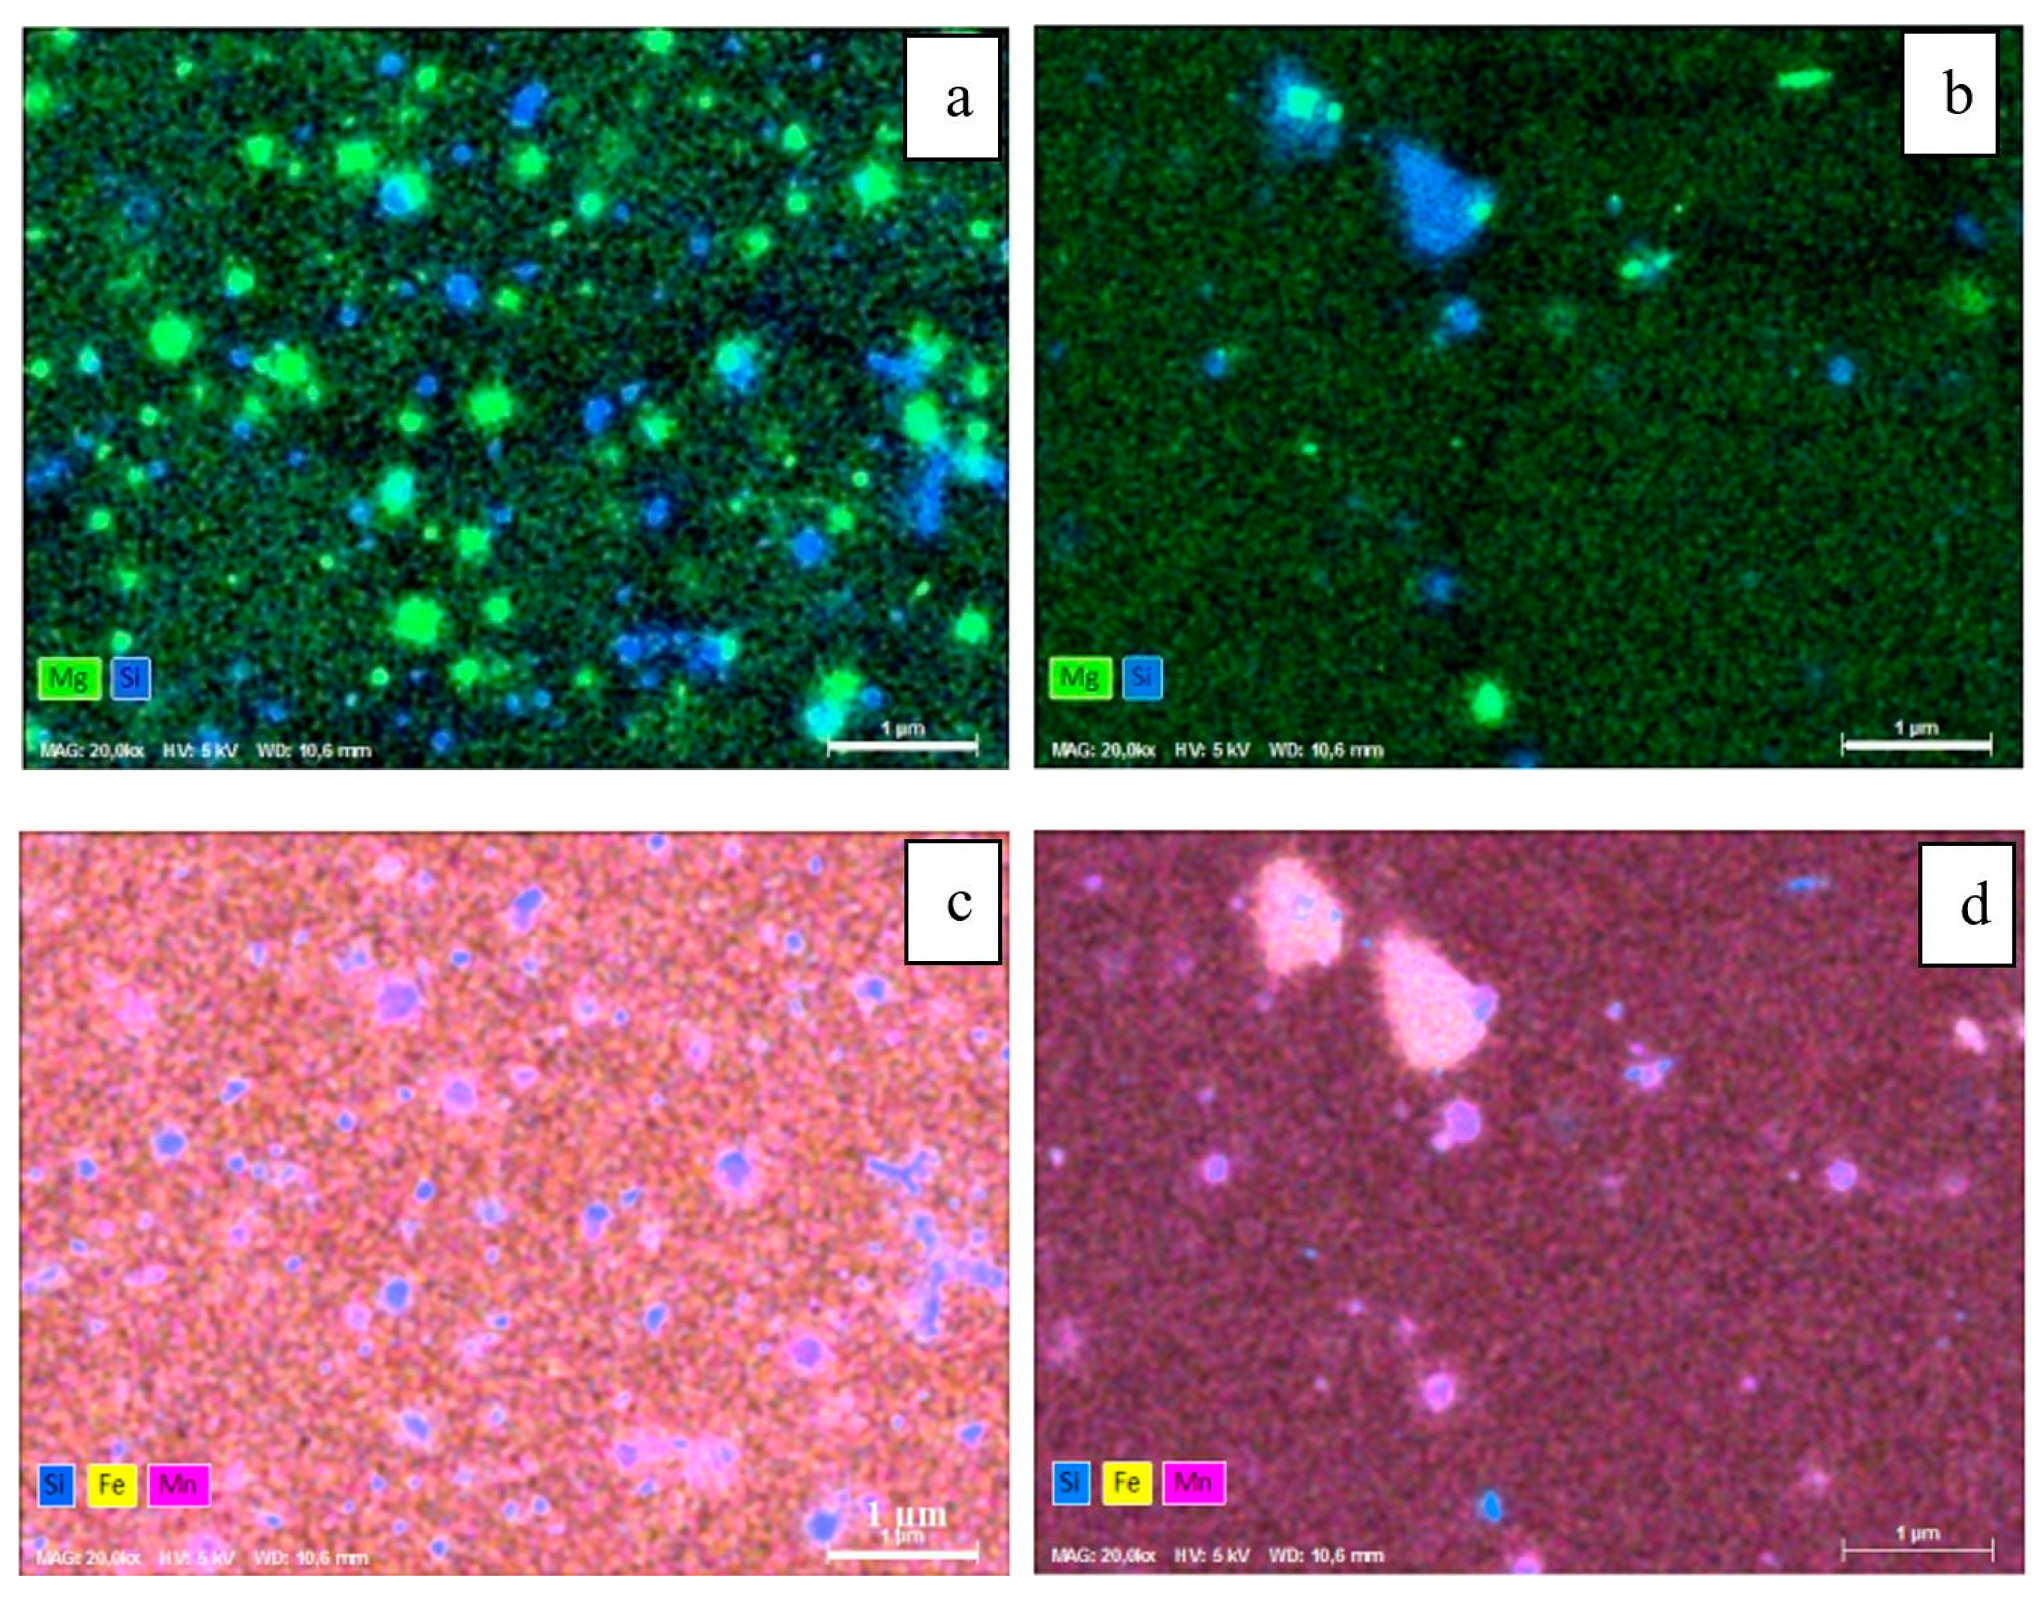
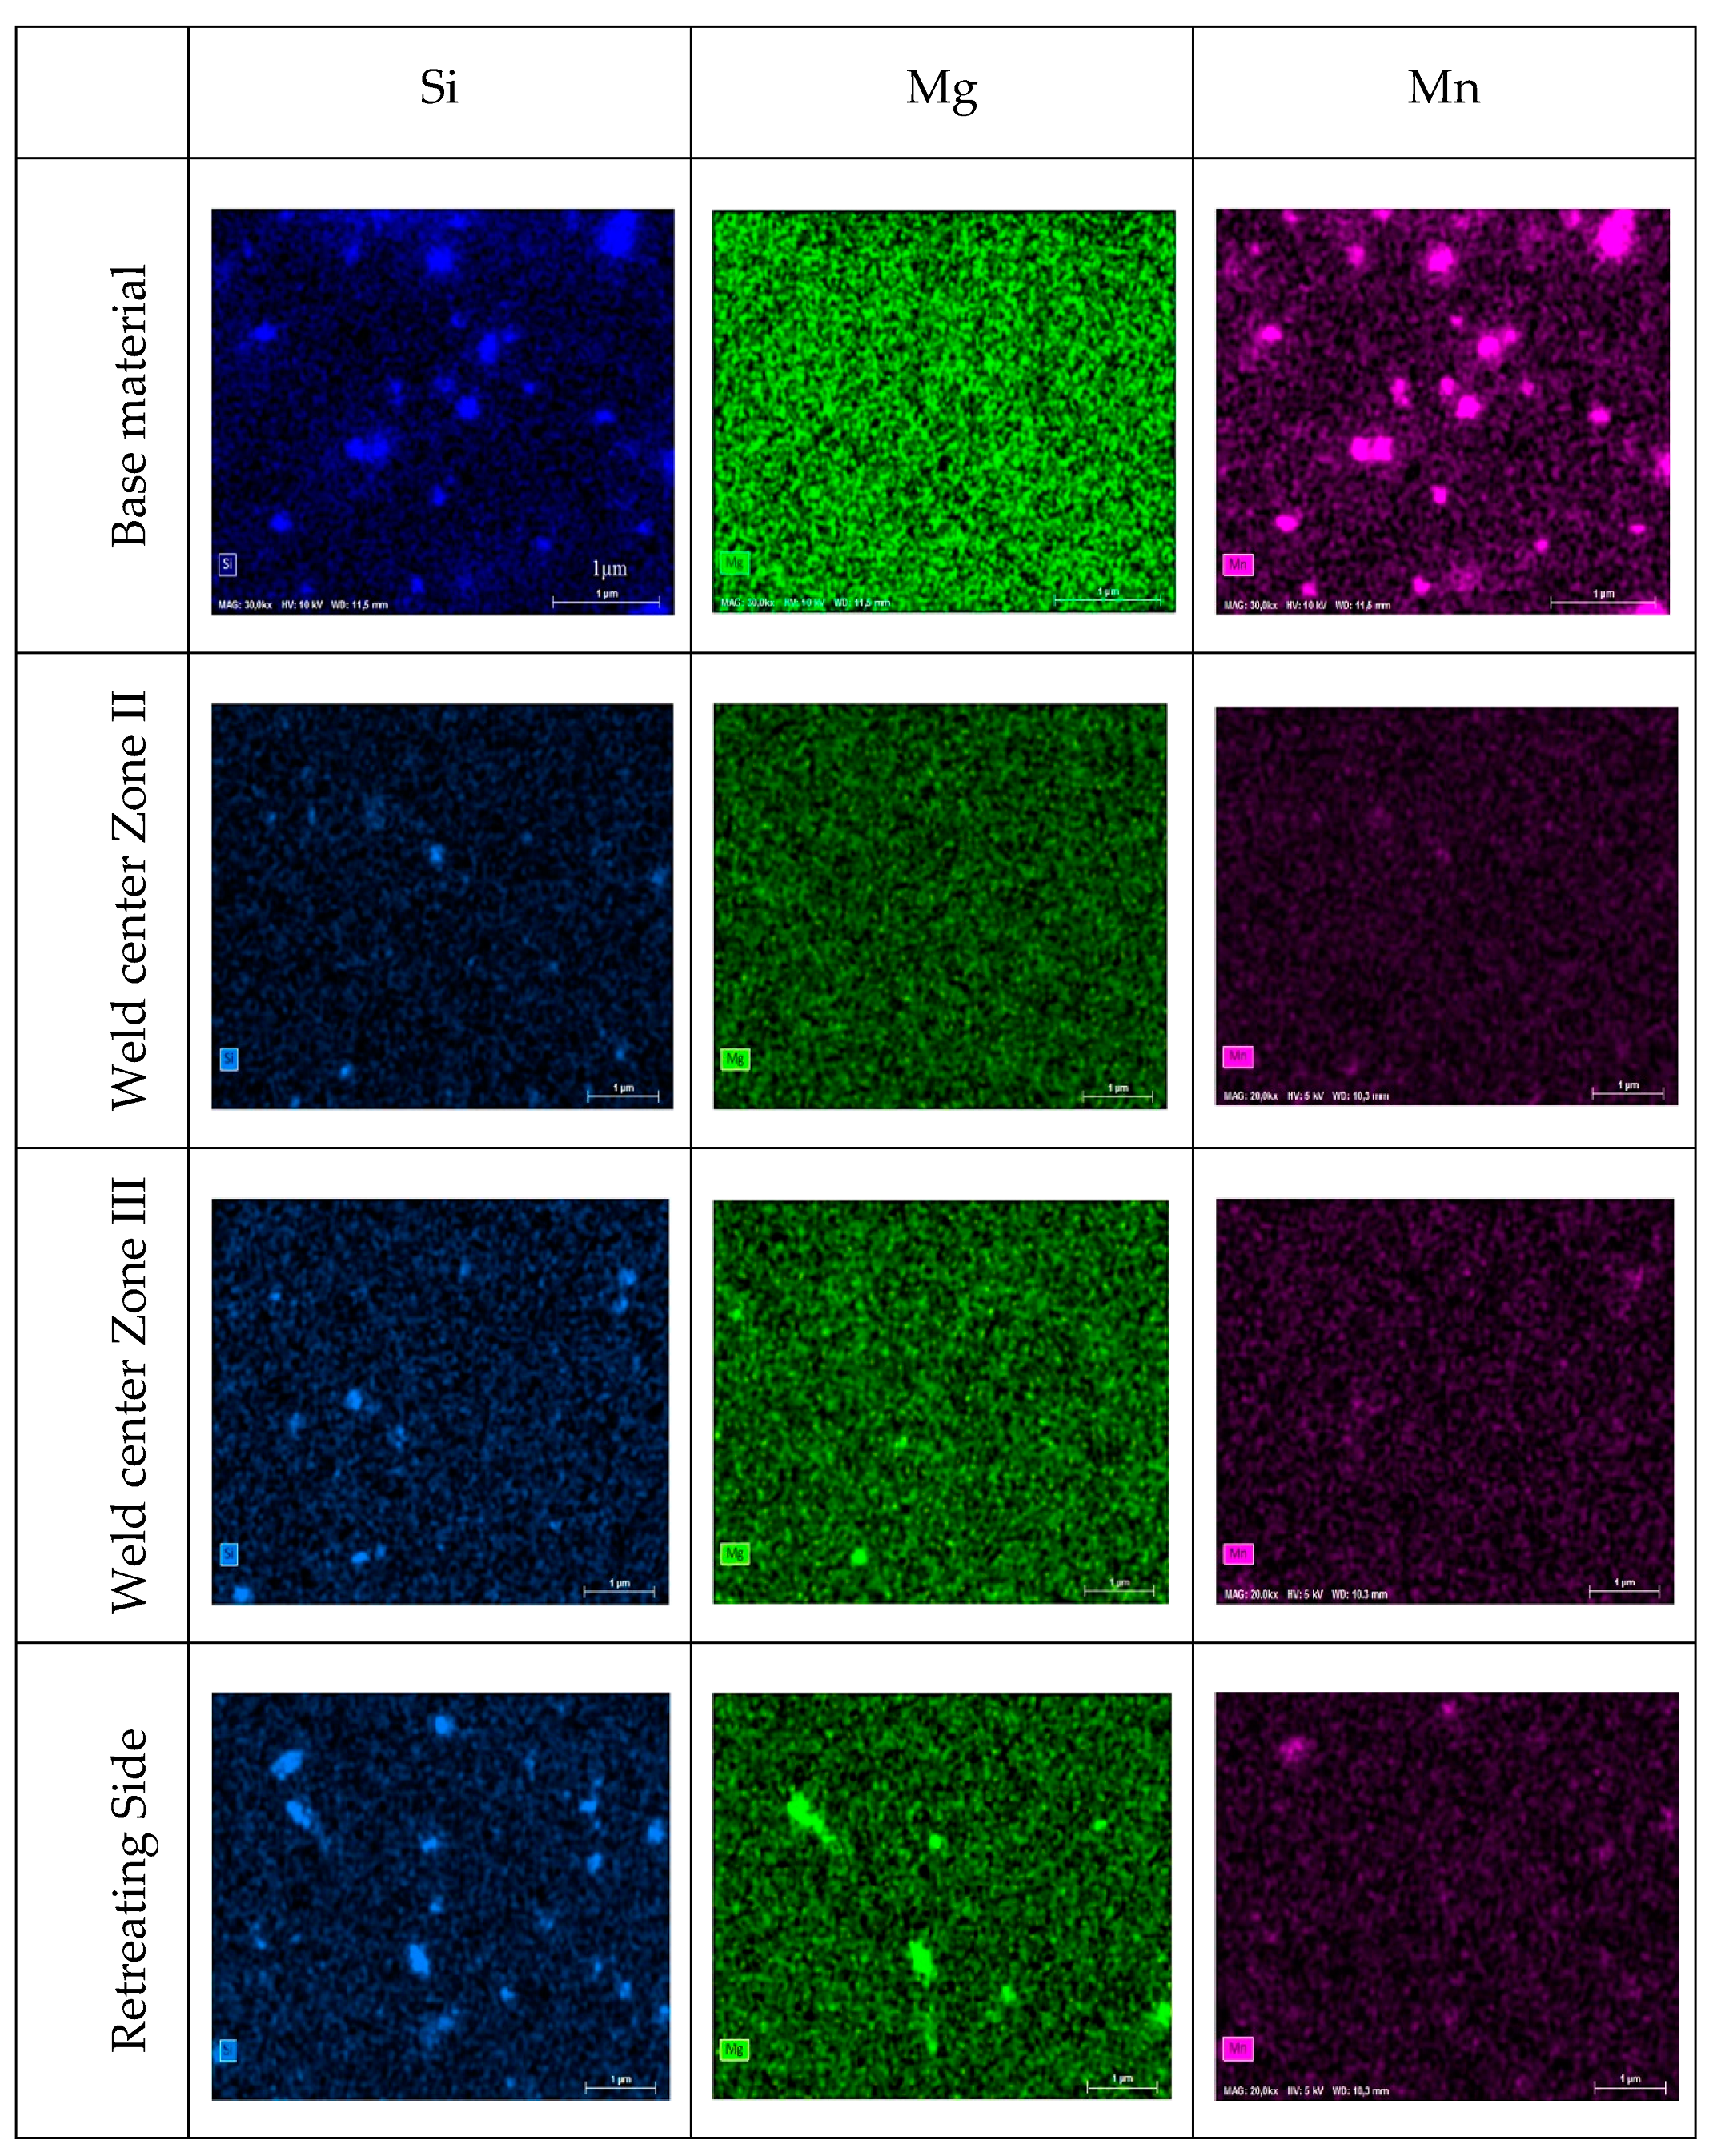
- Areas containing grains with high angle boundaries (retreating side and dark bands) were more particle-rich than those formed from grains with low angle boundaries (center of the weld nugget and light bands).
- (3)
- In-situ SEM nano-indentation did not reveal a clear difference in hardness of the bands with different orientations, whereas a distinct difference in hardness of bands with different grain size and precipitate content was observed.
- (4)
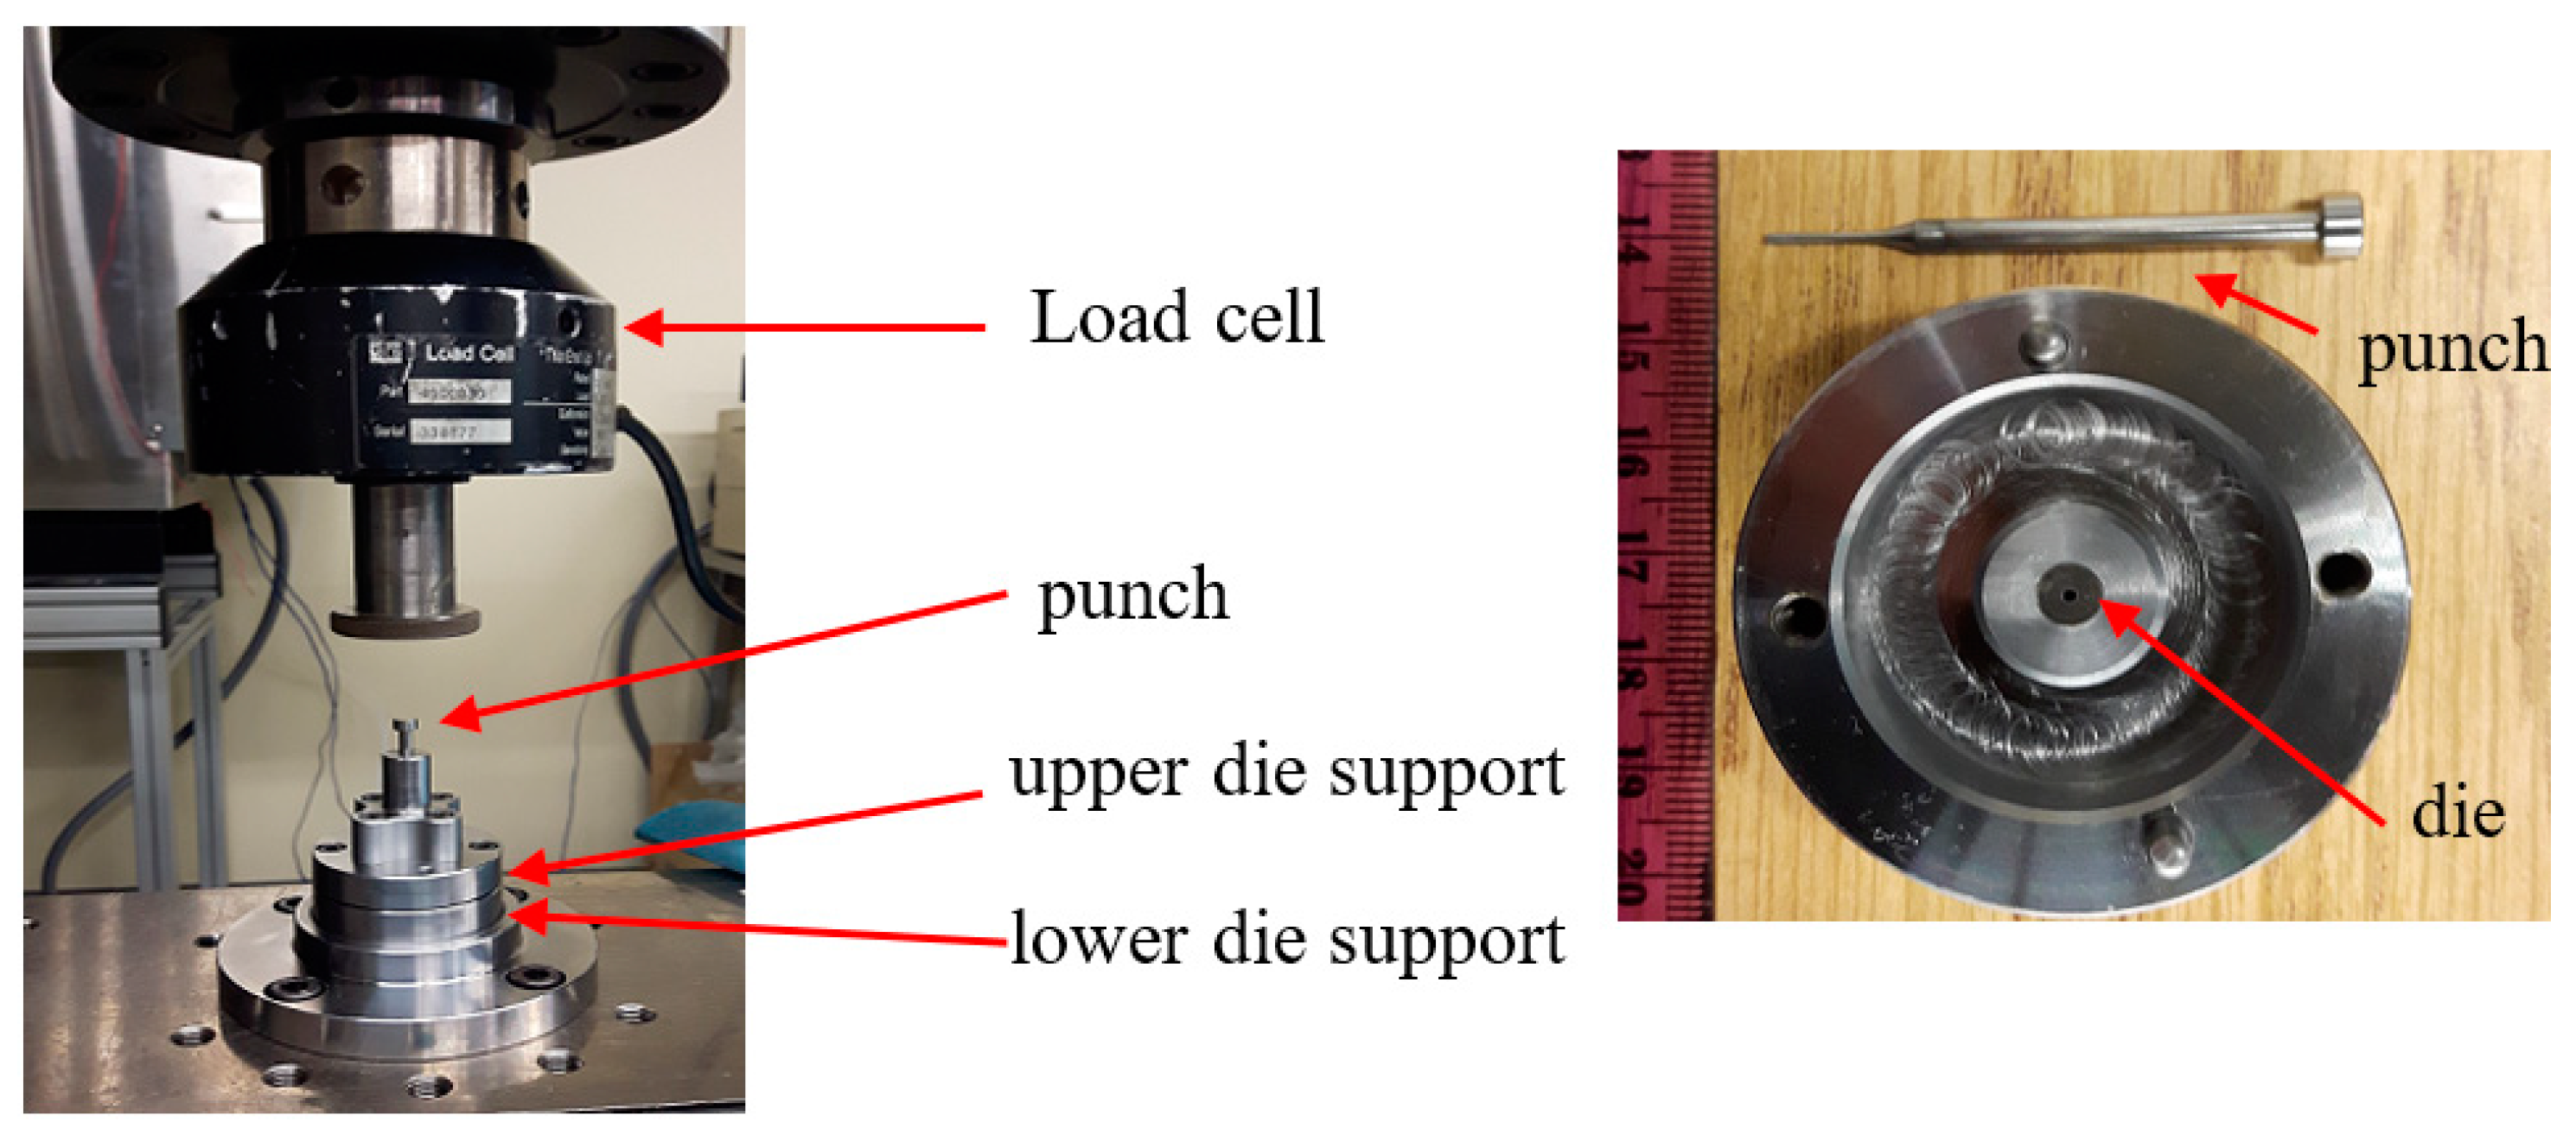
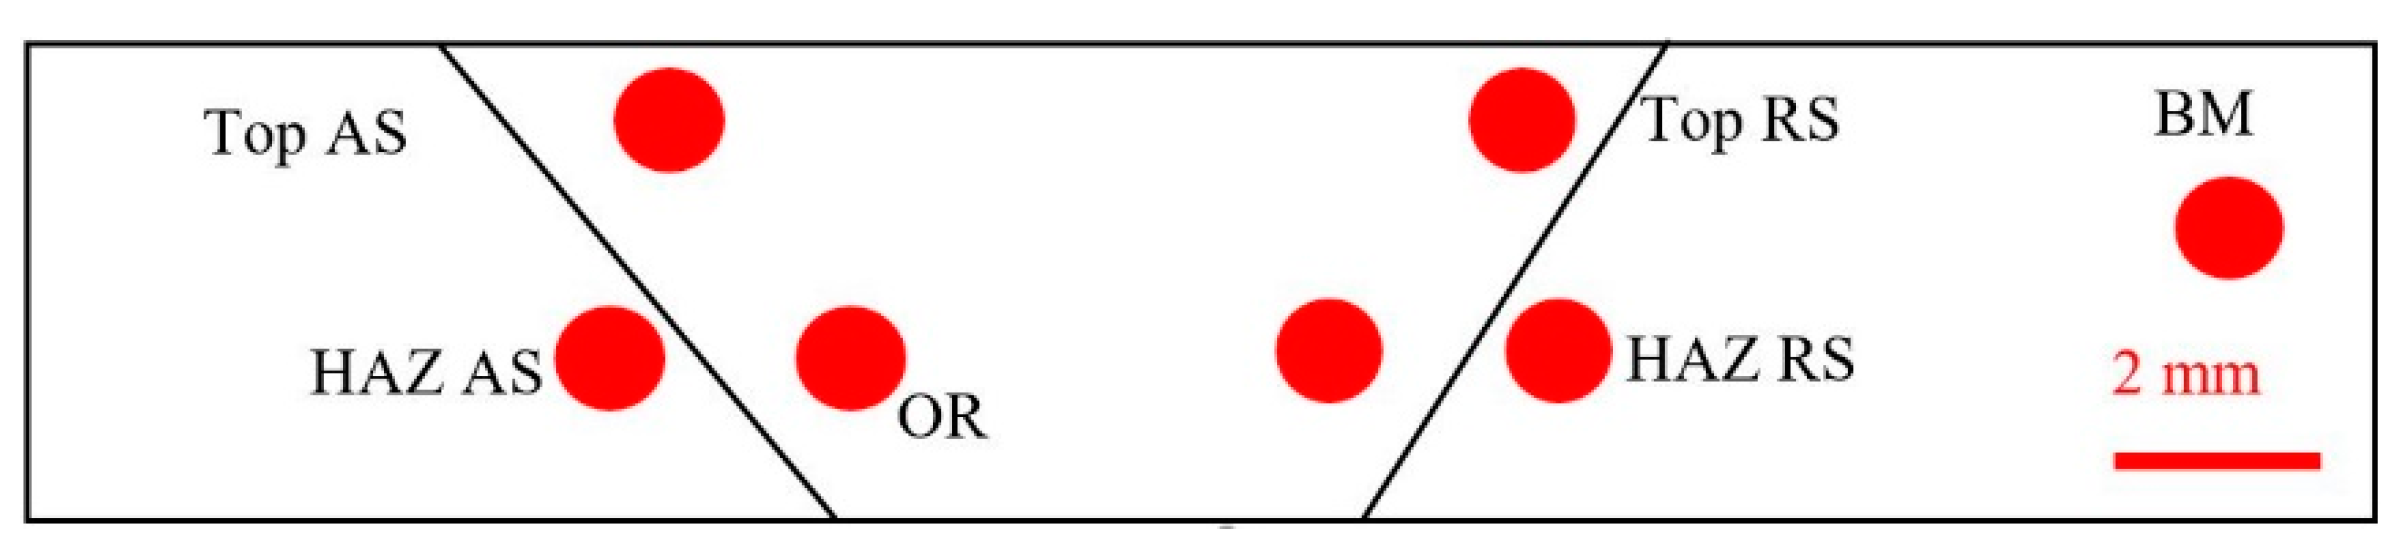
- Shear punch testing was used to compare the local mechanical properties of the weld nugget in the regions with or without ORs and it was determined that the presence of ORs does not seem to modify the mechanical properties of the weld nugget.
Author Contributions
Funding
Acknowledgments
Conflicts of Interest
References
- Lim, S.; Kim, S.; Lee, C.-G.; Kim, S. Tensile behavior of friction-stri-welded Al 6061-T651. Metall. Mater. Trans. A 2004, 35, 2829–2835. [Google Scholar] [CrossRef]
- Dubourg, L.; Merati, A.; Jahazi, M. Process Optimisation and Mechanical Properties of Friction Stir Lap Welds of 7075-T6 Stringers on 2024-T3 Skin. Mater. Des. 2010, 31, 3324–3330. [Google Scholar] [CrossRef]
- Song, K.H.; Nakata, K. Effect of precipitation on post-heat-treated Inconel 625 alloy after friction stir welding. Mater. Des. 2010, 31, 2942–2947. [Google Scholar] [CrossRef]
- Gangwar, K.; Ramulu, M. Friction stir welding of titanium alloys: A review. Mater. Des. 2018, 141, 230–255. [Google Scholar] [CrossRef]
- Magudeeswaran, G.; Balasubramanian, V.; Reddy, G.M.; Balasubrarnanian, T.S. Effect of Welding Processes and Consumables on Tensile and Impact Properties of High Strength Quenched and Tempered Steel Joints. J. Iron Steel Res. Int. 2008, 15, 87–94. [Google Scholar] [CrossRef]
- Ramnath, B.V.; Elanchezhian, C.; Rajesh, S.; Prakash, S.J.; Kumaar, B.M.; Rajeshkannan, K. Design and Development of Milling Fixture for Friction Stir Welding. Mater. Today Proc. 2018, 5, 1832–1838. [Google Scholar] [CrossRef]
- Salari, E.; Jahazi, M.; Khodabandeh, A.; Ghasemi-Nanesa, H. Influence of tool geometry and rotational speed on mechanical properties and defect formation in friction stir lap welded 5456 aluminum alloy sheets. Mater. Des. 2014, 58, 381–386. [Google Scholar] [CrossRef]
- Padmanaban, G.; Balasubramanian, V. Selection of FSW tool pin profile, shoulder diameter and material for joining AZ31B magnesium alloy—An experimental approach. Mater. Des. 2009, 30, 2647–2656. [Google Scholar] [CrossRef]
- Huang, O.; Wan, L.; Huang, T.; Lv, Z.; Zhou, L.; Feng, J. The weld formation of self-support friction stir welds for aluminum hollow extrusion. Int. J. Adv. Manuf. Technol. 2016, 87, 1067–1075. [Google Scholar] [CrossRef]
- Węglowski, M.S.; Pietras, A. Friction stir processing-analysis of the process. Arch. Metall. Mater. 2011, 56, 779–788. [Google Scholar] [CrossRef]
- Morisada, Y.; Imaizumi, T.; Fujii, H. Clarification of material flow and defect formation during friction stir welding. Sci. Technol. Weld. Join. 2015, 20, 130–137. [Google Scholar] [CrossRef]
- Kim, Y.G.; Fujii, H.; Tsumura, T.; Komazaki, T.; Nakata, K. Three defect types in friction stir welding of aluminum die casting alloy. Mater. Sci. Eng. A 2006, 415, 250–254. [Google Scholar] [CrossRef]
- Liu, F.C.; Hovanski, Y.; Miles, M.P.; Sorensen, C.D.; Nelson, T.W. A review of friction stir welding of steels: Tool, material flow, microstructure, and properties. J. Mater. Sci. Technol. 2018, 34, 39–57. [Google Scholar] [CrossRef]
- Kumar, R.; Pancholi, V.; Bharti, R.P. Material flow visualization and determination of strain rate during friction stir welding. J. Mater. Process. Technol. 2018, 255, 470–476. [Google Scholar] [CrossRef]
- He, X.; Gu, F.; Ball, A. A review of numerical analysis of friction stir welding. Prog. Mater. Sci. 2014, 65, 1–66. [Google Scholar] [CrossRef]
- Tongne, A.; Desrayaud, C.; Jahazi, M.; Feulvarch, E. On material flow in Friction Stir Welded Al alloys. J. Mater. Process. Technol. 2017, 239, 284–296. [Google Scholar] [CrossRef]
- Yoshikawa, G.; Miyasaka, F.; Hirata, Y.; Katayama, Y.; Fuse, T. Development of numerical simulation model for FSW employing particle method. Sci. Technol. Weld. Join. 2012, 17, 255–263. [Google Scholar] [CrossRef]
- Chen, G.; Li, H.; Wang, G.; Guo, Z.; Zhang, S.; Dai, Q.; Wang, X.; Zhang, G.; Shi, Q. Effects of pin thread on the in-process material flow behavior during friction stir welding: A computational fluid dynamics study. Int. J. Mach. Tools Manuf. 2018, 124, 12–21. [Google Scholar] [CrossRef]
- Zhu, Y.; Chen, G.; Chen, Q.; Zhang, G.; Shi, Q. Simulation of material plastic flow driven by non-uniform friction force during friction stir welding and related defect prediction. Mater. Des. 2016, 108, 400–410. [Google Scholar] [CrossRef]
- Hoyos, E.; López, D.; Alvarez, H. A phenomenologically based material flow model for friction stir welding. Mater. Des. 2016, 111, 321–330. [Google Scholar] [CrossRef]
- Meng, X.; Huang, Y.; Cao, J.; Shen, J.; dos Santos, J.F. Recent progress on control strategies for inherent issues in friction stir welding. Prog. Mater. Sci. 2020, 115, 100706. [Google Scholar] [CrossRef]
- Mishra, R.S.; Ma, Z.Y. Friction stir welding and processing. Mater. Sci. Eng. R Rep. 2005, 50, 1–78. [Google Scholar] [CrossRef]
- Threadgill, P.L.; Leonard, A.J.; Shercliff, H.R.; Withers, P.J. Friction stir welding of aluminium alloys. Int. Mater. Rev. 2009, 54, 49–93. [Google Scholar] [CrossRef]
- Jandaghi, M.R.; Badini, C.; Pavese, M. Dissimilar friction stir welding of AA2198 and AA7475: Effect of solution treatment and aging on the microstructure and mechanical strength. J. Manuf. Proc. 2020, 57, 712–724. [Google Scholar] [CrossRef]
- Dos Santos, J.F.; Staron, P.; Fischer, T.; Robson, J.D.; Kostka, A.; Colegrove, P.; Wang, H.; Hilgert, J.; Bergmann, L.; Hütsch, L.L.; et al. Understanding precipitate evolution during friction stir welding of Al-Zn-Mg-Cu alloy through in-situ measurement coupled with simulation. Acta Mater. 2018, 148, 163–172. [Google Scholar] [CrossRef]
- Asadi, P.; Besharati Givi, M.K.; Akbari, M. Simulation of dynamic recrystallization process during friction stir welding of AZ91 magnesium alloy. Int. J. Adv. Manuf. Technol. 2015, 83, 301–311. [Google Scholar] [CrossRef]
- Yang, C.; Wu, C.S.; Shi, L. Phase-field modelling of dynamic recrystallization process during friction stir welding of aluminium alloys. Sci. Technol. Weld. Join. 2020, 25, 345–358. [Google Scholar] [CrossRef]
- Zenga, X.H.; Xue, P.; Wu, L.H.; Ni, D.R.; Xiao, B.L.; Wang, K.S.; Ma, Z.Y. Microstructural evolution of aluminum alloy during friction stir welding under different tool rotation rates and cooling conditions. J. Mater. Sci. Technol. 2019, 35, 972–981. [Google Scholar] [CrossRef]
- Liu, F.C.; Nelson, T.W. In-Situ grain structure and texture evolution during friction stir welding of austenite stainless steel. Mater. Des. 2017, 117, 467–478. [Google Scholar] [CrossRef]
- Qin, H.; Zhang, H.; Wu, H. The evolution of precipitation and microstructure in friction stir welded 2195-T8 Al–Li alloy. Mater. Sci. Eng. A 2015, 625, 322–329. [Google Scholar] [CrossRef]
- Malopheyev, S.; Vysotskiy, I.; Kulitskiy, V.; Mironov, S.; Kaibyshev, R. Optimization of processing-microstructure-properties relationship in friction-stir welded 6061-T6 aluminum alloy. Mater. Sci. Eng. A 2016, 662, 136–143. [Google Scholar] [CrossRef]
- Gopkalo, O.; Liu, X.; Long, F.; Booth, M.; Gerlich, A.P.; Diak, B.J. Non-isothermal thermal cycle process model for predicting post-weld hardness in friction stir welding of dissimilar age-hardenable aluminum alloys. Mater. Sci. Eng. A 2019, 754, 205–215. [Google Scholar] [CrossRef]
- Fall, A.M.; Monajati, H.; Khodabandeh, A.R.; Fesharaki, M.H.; Champliaud, H.; Jahazi, M. Local mechanical properties, microstructure, and microtexture in friction stir welded Ti-6Al-4V alloy. Mater. Sci. Eng. A 2019, 749, 166–175. [Google Scholar] [CrossRef]
- Huang, Y.; Xie, Y.; Meng, X.; Li, J. Atypical grain coarsening of friction stir welded AA6082-T6: Characterization and modeling. Mater. Sci. Eng. A 2019, 740–741, 211–217. [Google Scholar] [CrossRef]
- Huang, Y.; Xie, Y.; Meng, X.; Li, J.; Zhou, L. Joint formation mechanism of high depth-to-width ratio friction stir welding. J. Mater. Sci. Technol. 2019, 35, 1261–1269. [Google Scholar] [CrossRef]
- Larsson, H.; Karlsson, L.; Stoltz, S.; Bergqvist, E.L. Joining of dissimilar Al-alloys by Friction Stir Welding. In Proceedings of the Second International Conference on Friction Stir Welds, Gothenburg, Sweden, 27–28 June 2000; pp. 1–10. [Google Scholar]
- Heurtier, P.; Desrayaud, C.; Montheillet, F. A thermomechanical analysis of the friction stir welding process. Mater. Sci. Forum 2002, 396–402, 1537–1542. [Google Scholar] [CrossRef]
- Krishnan, K. On the formation of onion rings in friction stir welds. Mater. Sci. Eng. A 2002, 327, 246–251. [Google Scholar] [CrossRef]
- Colligan, K. Material flow behaviour during friction welding of aluminum. Weld. J. 1999, 75, 229–237. [Google Scholar]
- Mahoney, M.; Rhodes, C.G.; Flintoff, J.G.; Bingel, W.H.; Spurling, R.A. Properties of friction-stir-welded 7075 T651 aluminum. Metall. Mater. Trans. A 1998, 29, 1955–1964. [Google Scholar] [CrossRef]
- Hamilton, C.; Dymek, S.; Blicharski, M. A model of material flow during friction stir welding. Mater. Charat. 2008, 59, 1206–1214. [Google Scholar] [CrossRef]
- Sutton, M.A.; Yang, B.; Reynolds, A.P.; Taylor, R. Microstructural studies of friction stir welds in 2024-T3 aluminum. Mater. Sci. Eng. A 2002, 323, 160–166. [Google Scholar] [CrossRef]
- Sutton, M.A.; Yang, B.; Reynolds, A.P.; Yan, J. Banded microstructure in 2024-T351 and 2524-T351 aluminum friction stir welds. Part II. Mechanical characterization. Mater. Sci. Eng. A 2004, 364, 66–74. [Google Scholar] [CrossRef]
- Fonda, R.; Reynolds, A.; Feng, C.; Knipling, K.; Rowenhorst, D. Material flow in friction stir welds. Metall. Mater. Trans. A 2013, 44, 337–344. [Google Scholar] [CrossRef]
- Prangnell, P.B.; Heason, C.P. Grain structure formation during friction stir welding observed by the stop action technique. Acta Mater. 2005, 53, 3179–3192. [Google Scholar] [CrossRef]
- Schneider, J.A.; Nunes, A.C. Characterization of plastic flow and resulting microtextures in a friction stir weld. Metall. Mater. Trans. B 2004, 35, 777–783. [Google Scholar] [CrossRef]
- Elangovan, K.; Balasubramanian, V.; Valliappan, M. Effect of Tool Pin Profile and Tool Rotational Speed on Mechanical Properties of Friction Stir Welded AA6061 Aluminium Alloy. Mater. Manuf. Proc. 2008, 23, 251–260. [Google Scholar] [CrossRef]
- Sharma, C.; Dwivedi, D.K.; Kumar, P. Effect of welding parameters on microstructure and mechanical properties of friction stir welded joints of AA7039 aluminum alloy. Mater. Des. 2012, 36, 379–390. [Google Scholar] [CrossRef]
- Guo, H.C.; Chen, C.N.; Sun, G.; Bi, Z.; Sun, J. Friction stir welding of dissimilar materials between AA6061 and AA7075 Al alloys effects of process parameters. Mater. Des. 2014, 56, 185–192. [Google Scholar] [CrossRef]
- Guduru, R.K.; Darling, K.A.; Kishore, R.; Scattergood, R.O.; Koch, C.C.; Murty, K.L. Evaluation of mechanical properties using shear–punch testing. Mater. Sci. Eng. A 2005, 395, 307–314. [Google Scholar] [CrossRef]
- Lucas, G. The development of small specimen mechanical test techniques. J. Nucl. Mater. 1983, 117, 327–339. [Google Scholar] [CrossRef]
- Zoghlami, M. Influence des Paramètres du Procédé FSW sur les Caractéristiques des Bandes Alternées (Onion Rings) dans les Alliages D’aluminium. Master’s Thesis, École de Technologie Supérieure, Montreal, QC, Canada, 2017. [Google Scholar]
- Genevois, C.; Deschamps, A.; Denquin, A.; Cottignies, B.D. Quantitative investigation of precipitation and mechanical behaviour for AA2024 friction stir welds. Acta Mater. 2005, 53, 2447–2458. [Google Scholar] [CrossRef]
- Svensson, L.E.; Karlsson, L.; Larsson, H.; Karlsson, B.; Fazzini, M.; Karlsson, J. Microstructure and mechanical properties of friction stir welded aluminium alloys with special reference to AA 5083 and AA 6082. Sci. Technol. Weld. Join. 2000, 5, 285–296. [Google Scholar] [CrossRef]
- Liu, C. Microstructure Evolution during Homogenization and Its Effect on the High Temperature Deformation Behaviour in AA6082 Based Alloys. Ph.D. Thesis, University of British Columbia, Vancouver, BC, Canada, 2017. [Google Scholar]
- De Filippis, L.; Serio, L.; Palumbo, D.; De Finis, R.; Galietti, U. Optimization and characterization of the Friction Stir Welded Sheets of AA 5754-H111: Monitoring of the quality of joints with thermographic techniques. Materials 2017, 10, 1165. [Google Scholar] [CrossRef]
- Tang, W.; Guo, X.; McClure, J.C.; Murr, L.E.; Nunes, A. Heat Input and Temperature Distribution in Friction Stir Welding. J. Mater. Proc. Manuf. Sci. 1998, 7, 163–172. [Google Scholar] [CrossRef]
- Liu, F.C.; Ma, Z.Y. Influence of tool dimension and welding parameters on microstructure and mechanical properties of friction-stir-welded 6061-T651 aluminum alloy. Metall. Mater. Trans. A 2008, 39, 2378–2388. [Google Scholar] [CrossRef]
- Woo, W.; Choo, H.; Brown, D.W.; Feng, Z. Influence of the Tool Pin and Shoulder on Microstructure and Natural Aging Kinetics in a Friction-Stir-Processed 6061–T6 Aluminum Alloy. Metall. Mater. Trans. A 2007, 38, 69–76. [Google Scholar] [CrossRef]
- Sato, Y.S.; Kokawa, H.; Ikeda, K.; Enomoto, M.; Hashimoto, T.; Jogan, S. Microtexture in the friction-stir weld of an aluminum alloy. Metall. Mater. Trans. A 2001, 32, 941–948. [Google Scholar] [CrossRef]
- Frigaard, Ø.; Grong, Ø.; Midling, O.T. A process model for friction stir welding of age hardening aluminum alloys. Metall. Mater. Trans. A 2001, 32, 1189–1200. [Google Scholar] [CrossRef]
- Nakamura, T.; Obikawa, T.; Nishizaki, I.; Enomoto, M.; Fang, Z. Friction Stir Welding of Non-Heat-Treatable High-Strength Alloy 5083-O. Metals 2018, 8, 208. [Google Scholar] [CrossRef]
- Hornbuckle, B.C.; Murdoch, H.A.; Roberts, A.J.; Kecskes, L.J.; Tschopp, M.A.; Doherty, K.J.; Yu, J.H.; Darling, K.A. Property mapping of friction stir welded Al-2139 T8 plate using site specific shear punch testing. Mater. Sci. Eng. A 2017, 682, 192–201. [Google Scholar] [CrossRef]


| Alloy | Al | Si | Fe | Cu | Mn | Mg | Cr | Zn | Ti |
|---|---|---|---|---|---|---|---|---|---|
| Al 6082 | Balance | 0.7 | 0.5 | 0.1 | 0.4 | 0.6 | 0.25 | 0.2 | 0.1 |
| Sample Code | Tool | Rotational Speed (RS) (rpm) | Travel Speed (TS) (mm/min) | RS/TS Ratio |
|---|---|---|---|---|
| T1 | trigonal | 1500 | 400 | 3.75 |
| T2 | 1500 | 300 | 5 | |
| T3 | 2000 | 600 | 3.33 | |
| T4 | 1750 | 200 | 8.75 | |
| C1 | conical | 1750 | 200 | 8.75 |
| Test Location | Shear Stress (MPa) | Calculated UTS (MPa) |
|---|---|---|
| Top AS | 179 | 323 |
| Top RS | 134 | 241 |
| HAZ AS | 124 | 224 |
| HAZ RS | 135 | 242 |
| OR | 125 | 225 |
| Bottom RS | 156 | 281 |
| BM | 220 | 396 |
© 2020 by the authors. Licensee MDPI, Basel, Switzerland. This article is an open access article distributed under the terms and conditions of the Creative Commons Attribution (CC BY) license (http://creativecommons.org/licenses/by/4.0/).
Share and Cite
Monajati, H.; Zoghlami, M.; Tongne, A.; Jahazi, M. Assessing Microstructure-Local Mechanical Properties in Friction Stir Welded 6082-T6 Aluminum Alloy. Metals 2020, 10, 1244. https://doi.org/10.3390/met10091244
Monajati H, Zoghlami M, Tongne A, Jahazi M. Assessing Microstructure-Local Mechanical Properties in Friction Stir Welded 6082-T6 Aluminum Alloy. Metals. 2020; 10(9):1244. https://doi.org/10.3390/met10091244
Chicago/Turabian StyleMonajati, Hossein, Mariem Zoghlami, Amevi Tongne, and Mohammad Jahazi. 2020. "Assessing Microstructure-Local Mechanical Properties in Friction Stir Welded 6082-T6 Aluminum Alloy" Metals 10, no. 9: 1244. https://doi.org/10.3390/met10091244
APA StyleMonajati, H., Zoghlami, M., Tongne, A., & Jahazi, M. (2020). Assessing Microstructure-Local Mechanical Properties in Friction Stir Welded 6082-T6 Aluminum Alloy. Metals, 10(9), 1244. https://doi.org/10.3390/met10091244