Article

Scale Formation on HSLA Steel during Continuous Casting Part I: The Effect of Temperature–Time on Oxidation Kinetics

by
Rosa Maria Pineda Huitron
1,*,
Pavel Ernesto Ramírez López
2,3,
Esa Vuorinen
1,
Pooria Nazen Jalali
2,
Leonardo Pelcastre
1 and
Maija Kärkkäinen
4
1
Department of Engineering Science and Mathematics, Materials Science, Luleå University of Technology, SE-97 187 Luleå, Sweden
2
Casting and Flow Simulation Group, Process Metallurgy Department, SWERIM AB, Aronstorpsvägen 1, SE-97 437 Luleå, Sweden
3
Materials Science and Engineering, Royal Institute of Technology (KTH), Brinellvägen 23, SE-100 44 Stockholm, Sweden
4
SSAB Europe Oy Raahe works, Rautaruukintie 155, PL 93, 92101 Raahe, Finland
*
Author to whom correspondence should be addressed.
Metals 2020, 10(9), 1243; https://doi.org/10.3390/met10091243
Submission received: 8 August 2020 / Revised: 7 September 2020 / Accepted: 10 September 2020 / Published: 15 September 2020

Abstract

:
The findings in this work enhance the understanding of oxidation mechanisms and scale growth at high temperatures of a high strength low alloy (HSLA) steel for improving surface quality during continuous casting. The oxidation phenomenon was investigated under dry air and water vapor atmospheres by heating specimens at 1000, 1100, and 1200 °C at different holding times. Temperature and time had great effects on the kinetics, where faster (i.e., parabolic) oxidation rates were present under water vapor when compared with the dry air condition. Temperature strongly influenced the number of defects, such as pores, voids, gaps and micro-cracks, formed in the oxide scale. A phase analysis confirmed the presence of FeO as the first phase formed at the steel surface, Fe3O4 as the middle and thicker phase, and Fe2O3 as the last phase formed in the oxide/air interface. The micromechanics of the oxides demonstrated that a combination of phases with high (wüstite) and low plasticity (magnetite and hematite) could also have been the reason for the uneven cooling during Continuous Casting (CC) that resulted in the undesired surface quality of the steel slabs. This work gives a good look at the oxide scale effect on the surface quality of steel slabs through an understanding the kinetics during oxidation.

Graphical Abstract

1. Introduction

The present work was focused on the analysis of oxidation kinetics occurring at temperatures relevant to continuous casting process (e.g., secondary cooling below the mold). This investigation sought to address the gaps of knowledge regarding the effect of oxide scale formed under dry and water vapor conditions, as well as its impact on the surface quality of a high strength low alloy (HSLA) steel slab.
Accordingly, the experimental setup was designed to simulate the thermal gradients and environment experienced by a surface throughout the casting process, with special focus on the oxidation behavior after the mold exit where the strand is in direct contact with the environment including the water flow from the submerged entry nozzles (SENs). At SENs, the heat flux from the steel surface is sufficiently high to create film boiling, whereby a layer of steam is formed between the hot surface and the liquid water above (Leidenfrost effect). Thus, this work attempted to replicate the same environment by oxidizing the steel under water vapor at temperatures occurring in a vertical cooling rack, bender (S1), and straightener (S6–S8). Figure 1 shows the layout of the caster machine and the model of the experimental set-up.
The insights gained in this work allow for one to understand the fundamentals of oxidation for this particular steel occurring under dry air and possibly to predict this steel’s behavior in a real situation during processing under the water vapor condition. These insights make it possible to reduce the impact of oxide scales during processing, as well as to improve surface quality, thereby enhancing the yield of the overall casting process.

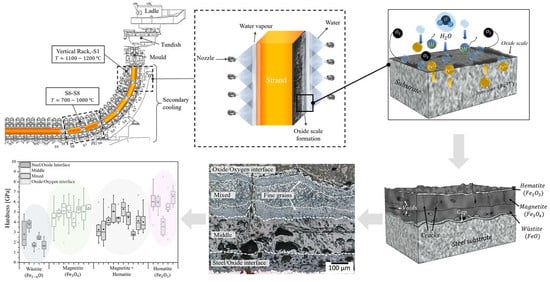
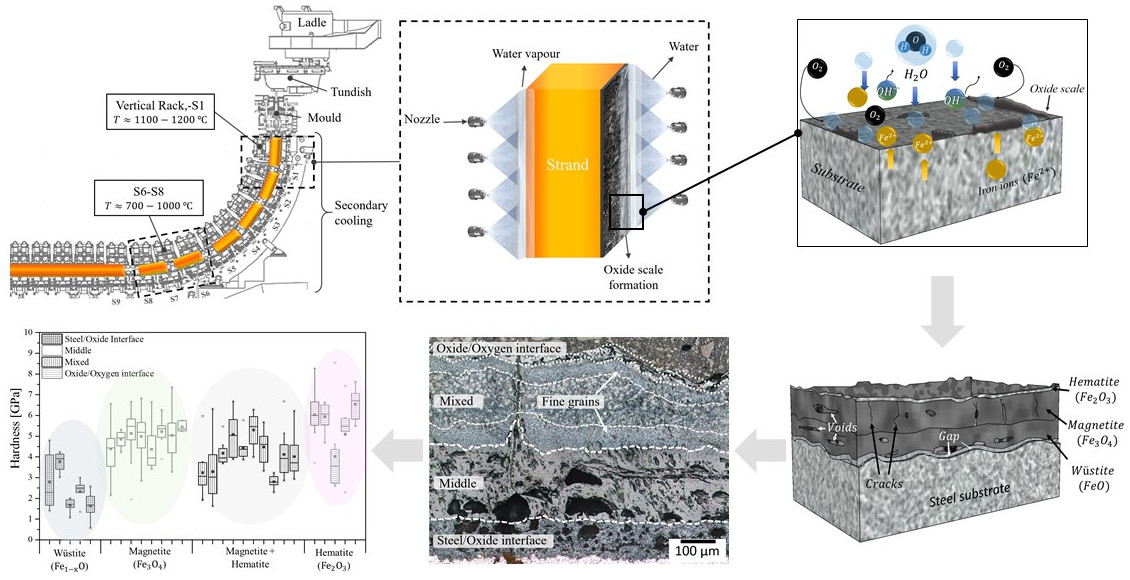
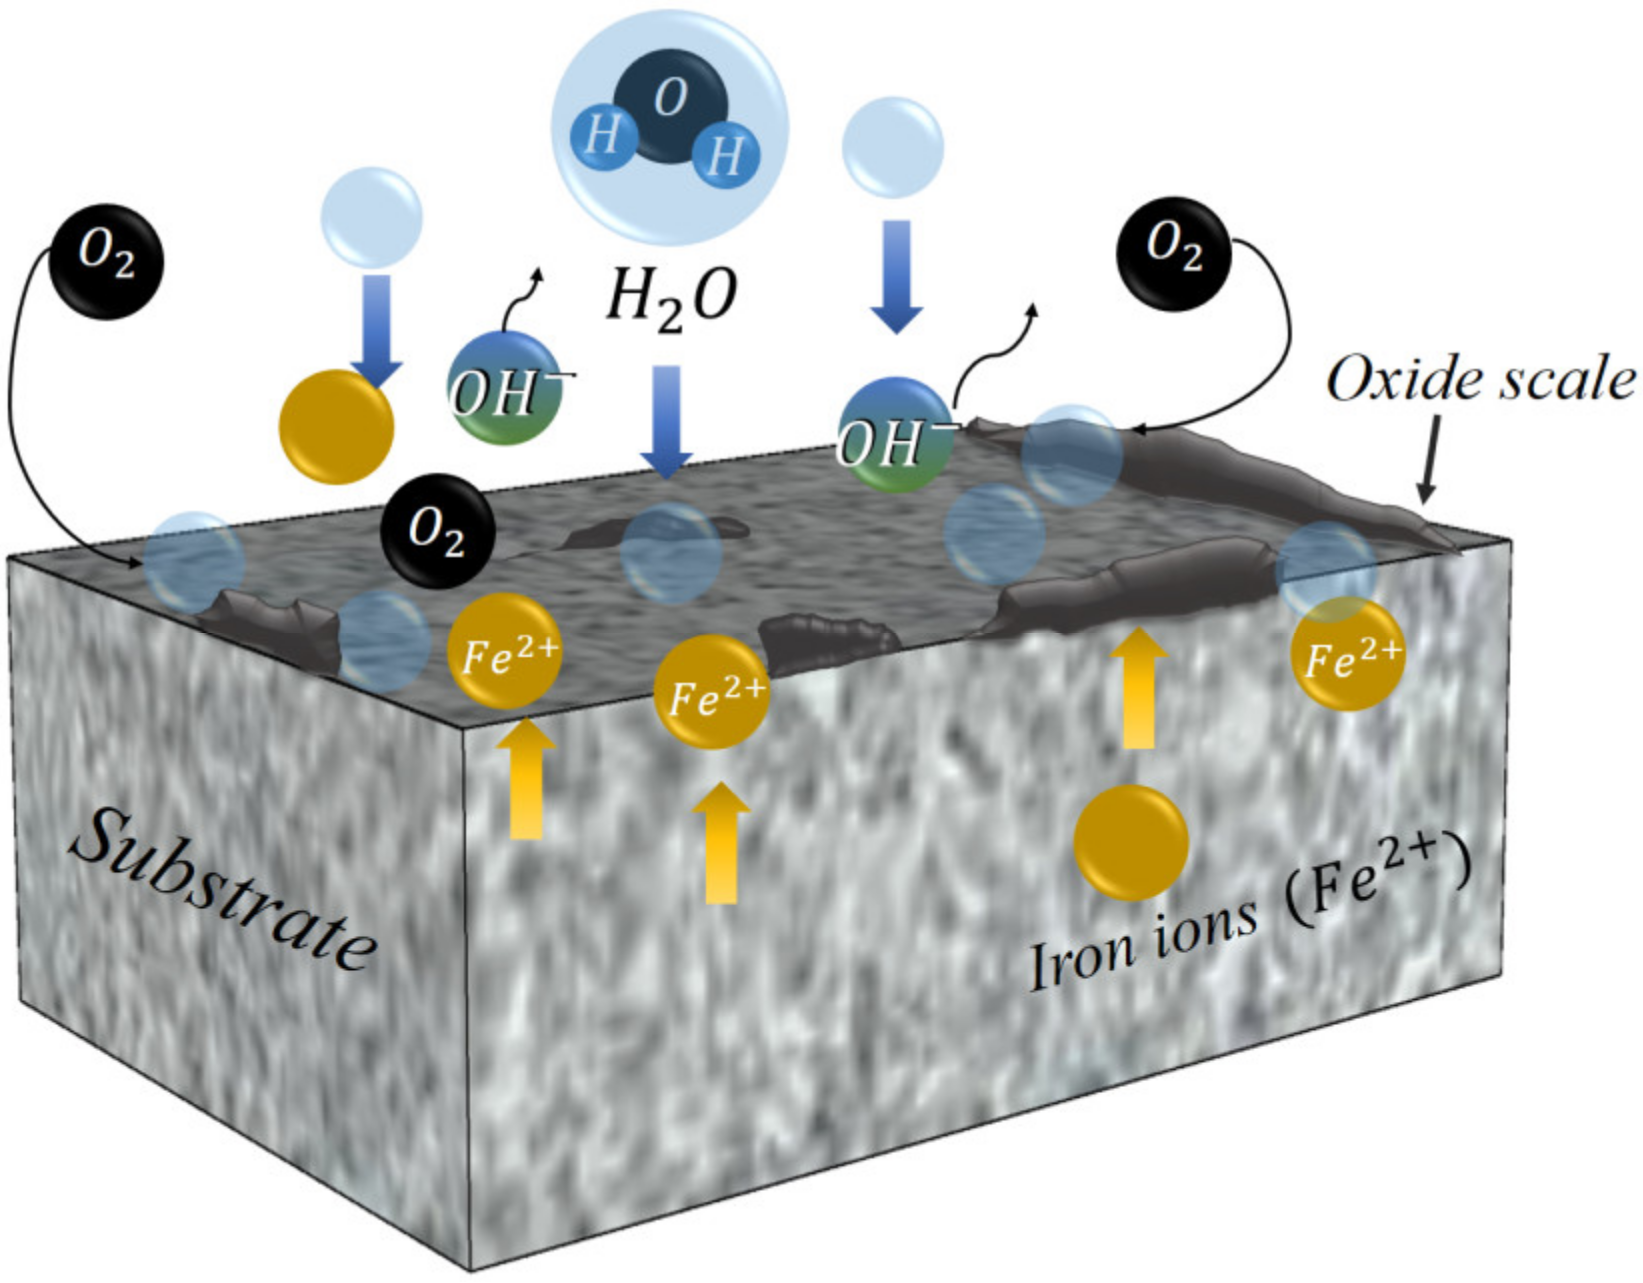
1.1. Oxidation During Casting

Oxidation is relevant for high-temperature processing because it plays a vital role in the formation of defects when casting micro-alloyed steels. This includes changes on heat transfer during solidification and subsequent cooling, carburization/decarburization processes, and oxide adherence to the surface. Thus, the control of oxidation is a critical subject for carbon steel producers. Nonetheless, most oxidation studies have been limited to scales formed in dry air and vapor-saturated environments for hot rolling and stamping processes [1,2,3,4,5,6,7,8,9,10,11]. For instance, it has been demonstrated that the oxide scale formed during hot rolling has a significant effect on heat transfer when voids and gaps form in the oxide, both of which significantly decrease the heat transfer coefficient [12,13,14]. Only a few studies have focused on oxidation during the continuous casting process [12,15,16,17]. For instance, incipient research regarding the influence of scales on heat transfer during secondary cooling in different cooling environments (e.g., air and steam) has been performed by Chabičovský et al. [12], Slowik et al. [16] and Köhler et al. [18]. However, the influence of oxide scales on the formation of defects during continuous casting has not been addressed in detail because defects are often caused by a combination of factors that makes them notoriously difficult to eliminate.
In principle, the oxidation of metals may occur among different chemical reactions (e.g., the reaction of a metal and oxygen gas) to form an oxide. For instance, for pure iron, the oxidation process is governed by the reaction of iron ions (Fe2+) with oxygen in the atmosphere (O2); this is given by xFe + (y/2) O2 = FexOy. The reaction of iron with oxygen in the atmosphere results in different type of oxides identified as wüstite, magnetite, and hematite (FeO, Fe3O4, and Fe3O2, respectively). This reaction involves a variety of stages for an oxide scale to form as either a film or as separate oxide nuclei. The process begins with the adsorption of oxygen on the iron surface at the iron/oxygen interface. The reaction continues with the dissolution of oxygen in the iron substrate, which act as a nucleation site for the oxide scale nuclei to form and grow [19,20]. Therefore, both the adsorption and diffusion depend on the metal surface conditions (e.g., rugose and clean) and defects (e.g., crystal defects, cracks, inclusions, and porosity). The oxidation rate is controlled by the solid-state diffusion of ions through the scale, which occurs when the oxygen concentration is sufficiently high at the oxide surface [21]. Finally, the nucleated oxide scale on the surface grows with time by increasing thickness, and the rate of growth of the developed oxide decreases with time [19]. During oxide scale growth, some defects may form inside the oxide scale such as micro-cracks, cavities, and porosity. A schematic illustration of the oxidation phenomena on pure iron is shown in Figure 2.
Oxide scale formation in steels can be modified by alloying elements at certain temperatures. However, it is more complex to identify the growth mechanisms of the scales formed in steels than in iron. This difference is related to the amount of carbon, which can make the diffusion and transport of ions easier or more difficult during the oxidation process. The diffusion of carbon starts in the metal/oxide scale interface, and this reacts with the iron oxide to create CO gas and form gaps in the oxide scale. In high-carbon steels, cracks can form in the oxide scale due to the trapped gas in the gaps that is because of the air in the core, which leads to increasing increments in the oxidation rate. If no cracks are formed in the scale, then gaps can stop the diffusion of iron ions and decrease the oxidation rate. The presence of elements such as aluminum, silicon, and chromium form a protective layer at the metal/oxide scale interface. In general, oxide scale formation in steels is slower than in iron, and the oxidation kinetics and structure of the scale have important deviations from the classical oxidation kinetics and scale structure of pure iron [22,23,24].
During continuous casting, oxide scale formation initiates below the primary cooling zone (mold) where the steel is in complete contact with oxygen from the environment and water from the cooling. Thus, the principles of oxidation under water vapor differ significantly to that which occur in the dry air condition because the presence of water molecules accelerates the oxidation process. At high temperatures, the susceptibility of oxidation increases, thus leading to oxide scale growth at a relatively high rate. Thus, under a water-saturated atmosphere, the oxygen from the air and the water from the cooling change the oxidation process, resulting in thicker oxide scales. Oxide scale growth under water vapor follows similar mechanisms to that under dry conditions, though it has higher diffusion rates. In the presence of water, the oxidation state of iron ions increases due to the oxygen coming from the water molecules. The reaction between the electrons from the iron atoms and the water molecules forms hydroxides (OH) [22,23]. The OH interact with the iron ions, which results in iron hydroxides (Fe(OH)2) formed on the steel substrate (also known as rust); see Figure 3. The formation of OH that diffuse through the metal oxide speeds up the oxidation process, resulting in thicker scales [19,21,22,24].

1.2. Phases in Oxides

Oxide scales usually reveal phases such as wüstite, magnetite, and hematite [5,6,9,25]. Wüstite (FeO) forms as a first layer closest to the substrate with the highest Fe concentration, while magnetite (Fe3O4) forms as the second phase with a higher oxygen concentration than wüstite. Finally, hematite (Fe2O3) forms at the oxide/air interface controlled by the inward diffusion of oxygen, where the self-diffusion of iron and oxygen is slow [19,20,21,22,23,24,25,26]. The microstructure of oxides is also dependent on the alloying elements containing the steel. For instance, aluminum can increase the temperature of wüstite formation and contribute to oxidation resistance, while silicon and chromium form stronger and weaker protective layers, respectively. Furthermore, silicon influences the formation of a thick hematite layer, while carbon and other alloying elements may be concentrated in the interface. Previous studies have found a combination of magnetite and hematite formed at coiling temperatures between 610 and 720 °C during hot rolling [6]. Similar studies on low-carbon steels oxidized between 570 and 760 °C have shown uneven oxide layers compared to those formed in pure iron [7]. For instance, hematite and magnetite are the main phases formed on steels with more than 0.1% C and oxidized above 700 °C, which results in poor adhesive properties. Accordingly, it has been demonstrated that a combination of hematite, magnetite, and wüstite shows a thickness ratio of 1:9:90, respectively, between 800 and 1200 °C during hot rolling [9]. Hematite is mainly formed at higher temperatures (900–1050 °C). Figure 4a illustrates the order of phases formed on a metal with the formation of defects usually found on scales, and Figure 4b shows the morphology of an oxide scale formed on a micro-alloyed steel.

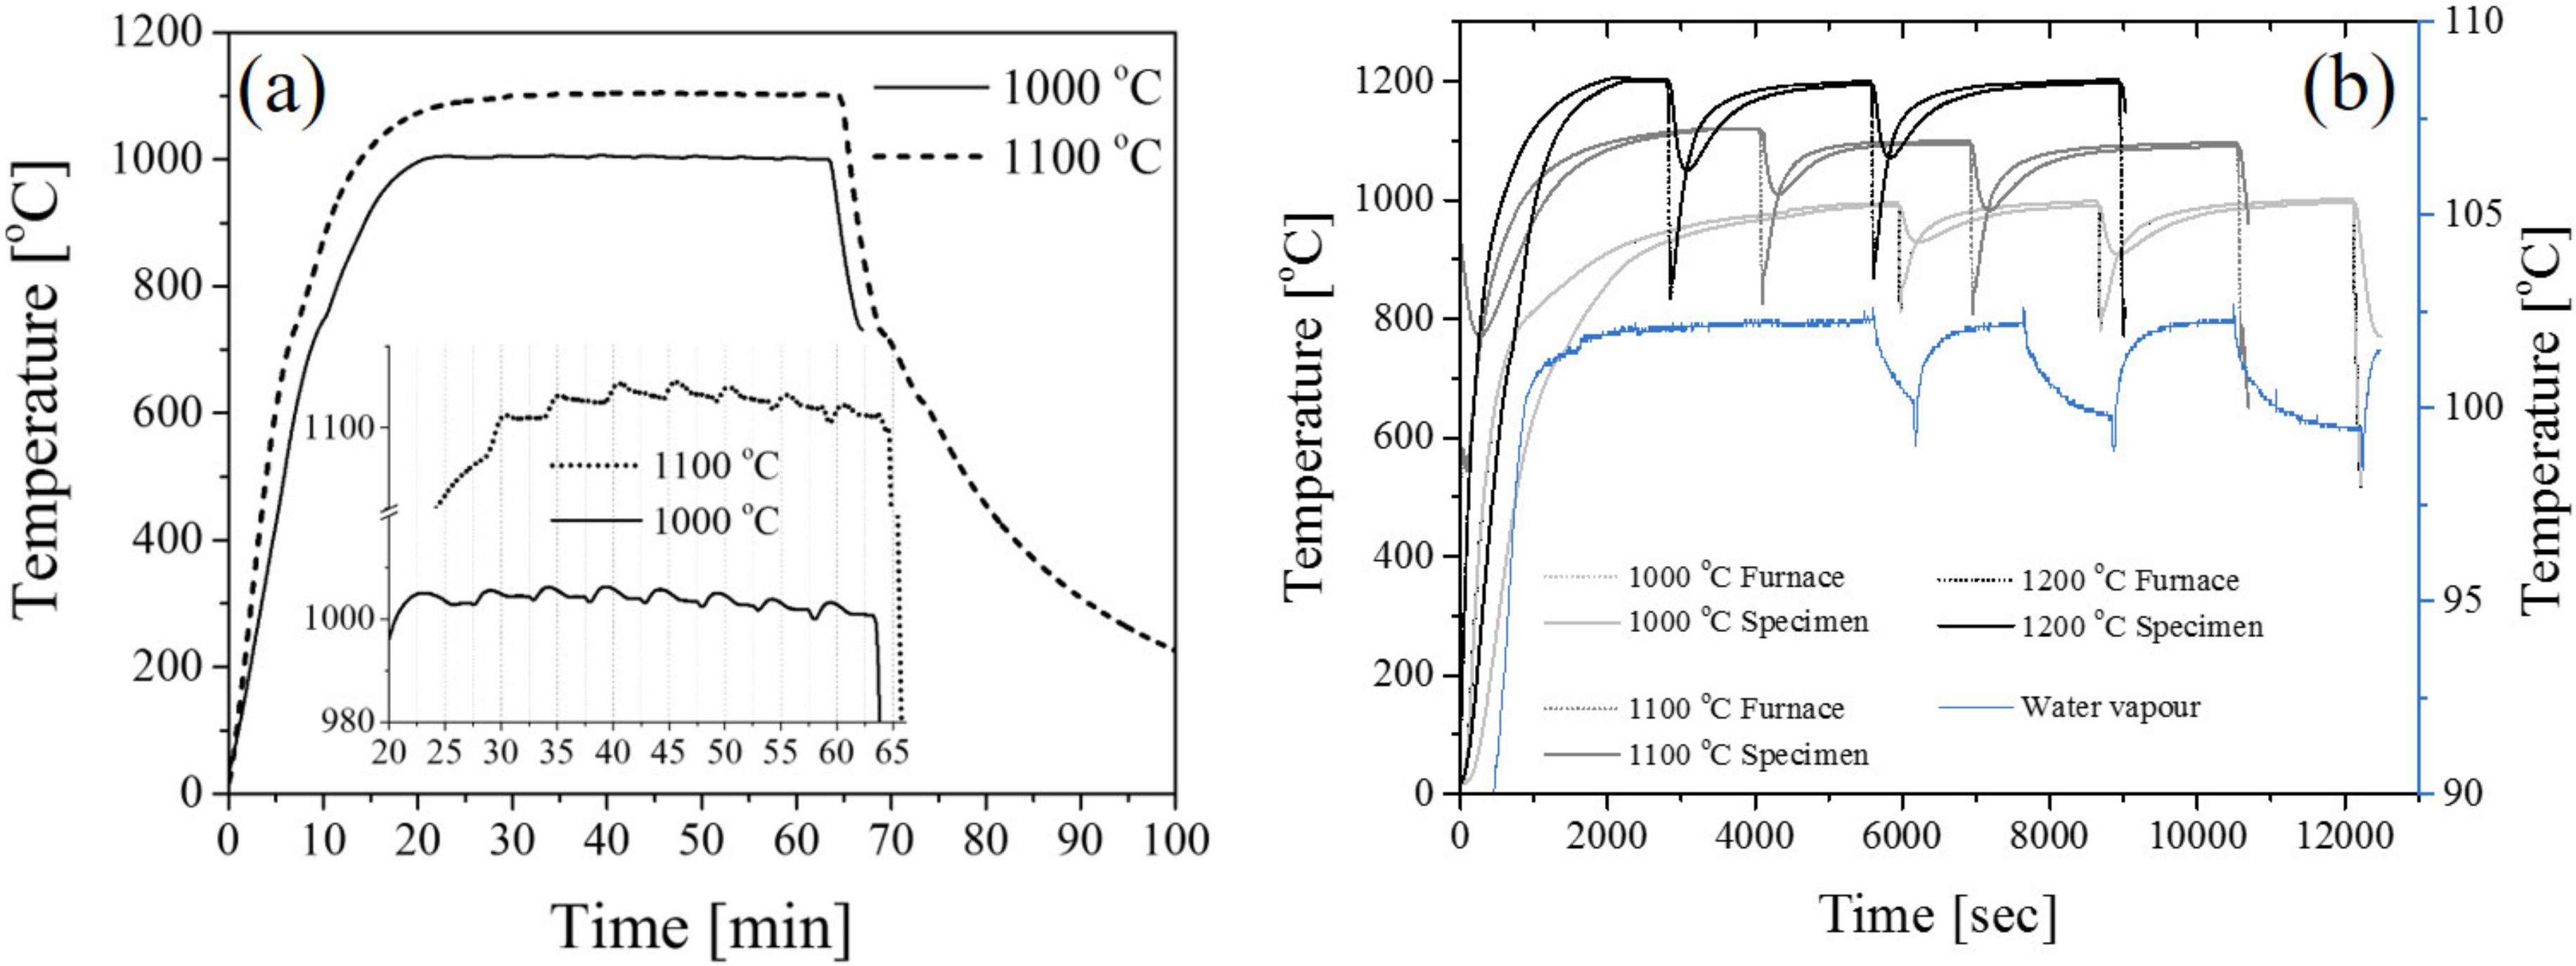
1.3. Temperature–Time Effect on the Kinetics

Though the kinetics of oxidation depend on different factors (e.g., metal surface, atmosphere, and alloying elements), temperature and time have the most significant effect on oxide growth at high temperatures.
The kinetics of oxidation have been demonstrated to follow different rate laws that are usually applied under isothermal conditions [27,28,29]. These rate laws can be divided in linear, parabolic, and logarithmic. For instance, most iron alloys follows the linear and the parabolic laws. Linear growth is constant with time, and it occurs when using short oxidation times (Equation (1)), while the parabolic rate law decreases with time and occurs at longer oxidation times (Equation (2)) [21].
Linear oxidation:
x = k l t + C
Parabolic oxidation:
x 2 = 2 k ´ p t + C = k p t + C
where x represents the thickness of the oxide film, k l is the oxidation rate constant, k p is the parabolic oxidation rate, and C is an integration constant [19,20,21].

2. Experiment Setup

The experimental part included the characterization of oxide scales formed under dry air and water vapor conditions conducted at varying temperatures and holding times. Subsequently, the oxide scale thicknesses were used to determine the oxidation kinetics. The microstructural and phase analysis was performed by using different techniques that are explained in the following sections.

2.1. Sample Identification

As the initial step, specimens were sectioned from an HSLA steel slab with 0.15 wt.% C containing Nb and V as the main alloying elements with dimensions of 1850 and 210 mm for width and thickness, respectively (S0 Figure 5a). In addition, the center piece from S0 was sectioned to ensure a material without corner cracks and other defects; this is identified as S1 in Figure 5b. Finally, S1 was sectioned to obtain specimens with dimensions of 50 × 70 mm for the oxidation experiments; see Figure 5c.

2.2. Oxidation Tests

Oxidation tests under dry air and water vapor conditions were performed in an industrial chamber furnace in a pilot plant. A GPC type furnace was used for the oxidation under air, while an N 87/H furnace with dimensions of 340 × 1040 × 300 mm was used for the oxidation under water vapor; see Figure 6. Before oxidation tests, all specimens were cleaned with ethanol, and a thermocouple was installed in the middle of one of the specimens for temperature monitoring. Experiments were conducted at the pilot scale to replicate the conditions during secondary cooling during the continuous casting process, with a special focus on oxidation under water vapor.
Oxidation tests under dry air were conducted by heating the specimens at 1000 and 1100 °C and then subsequently removing a specimen every 5 min, with the last one removed after 40 min. Once removed, the specimens were cooled in air. The thermal cycle for this experiment is shown in Figure 7a. Each sample represented a snapshot into scale formation at a specific holding time. The parameters used during tests were selected as an initial step to understand the fundamentals of oxidation for this particular steel. We thereafter used them for comparison with the oxidation tests under water vapor.
The experiment set-up for oxidation under water vapor was more complex to perform. Initially, all specimens were introduced in an isolating box inside the chamber. Additionally, the furnace was connected to a steam generator, where the water vapor was injected into the isolating box. Argon gas was supplied during heating of specimens until the target temperature (i.e., 1000, 1100, and 1200 °C) was reached for protecting the atmosphere. Then, the saturated humid atmosphere (100% steam) was supplied only during holding time (i.e., 10, 30, and 60 min, respectively); thus, the oxygen from the air and the water interacted during the experiments. In addition, nitrogen was injected into the furnace for corrosion protection. Finally, specimens were taken out from the box and cooled in air. The set-up of the experiments is shown in Figure 6. The selected temperatures for this experiment corresponded to those existing in different sections in the secondary cooling, as shown previously in Figure 1. The thermal cycles for this experiment are shown in Figure 7b.

2.3. Characterization of Oxides

The microstructural analysis of the oxide scales was performed by applying a standard metallographic method. Samples were sectioned and ground with SiC abrasive papers with 600, 1200, and 4000 mesh sizes. Polishing was performed by diamond abrasive solutions down to a 1 µm size and a master colloidal silica solution as the last step. After polishing, specimens were etched with a 5% Nital solution for 7–10 s. To reveal different phases present in the oxide scales, two different etching solutions were applied—one for revealing wüstite and magnetite [30] and the other for hematite [31]. The first etchant consisted of a combination of citric acid and sodium thiocyanate (for wüstite and magnetite) applied on the oxide surface for 30 s. Subsequently, chloral (1% HCl and ethanol) was applied onto the previously etched surface, which revealed hematite after submerging the specimens for 30 s.
The characterization and measurements of the oxide scale thickness were performed by using a Scanning Electron Microscopy (SEM), JEOL JSM-IT300 LV (JEOL, Peabody, MA, USA) and Light Optical Microscopy (LOM, Nikon MA200, Nikon Metrology, Novi, MI, USA) respectively. Measurements were performed every 1 mm of the total length of the specimen. Furthermore, phase analysis was carried out with the X-ray diffraction technique (XRD, Malvern Intruments, UK) using a monochromatic Cu-Kα radiation with 40 kV and 45 mA. In addition, we used an angular 2θ range between 20 and 120 degrees with a 1 h scanning time per specimen. Diffraction patterns were analyzed by the Rietveld refinement technique.

2.4. Nanoindentation

The micromechanical properties of the oxides were assessed with nanoindentation tests. This test allowed for the calculation of the local elastic–plastic properties of phases. Measurements were performed using a NanoTest Vantage system from Micro Materials Ltd. (Camarillo, CA, USA) using a diamond Berkovich indenter-tip. The measurements were performed in the load control mode using 50 mN with a loading time of 25 s, an unloading time of 20 s, and a dwell time at the maximum load of 15 s. Hardness was calculated within the system’s software according to the method of Oliver and Parr [32].

3. Results

3.1. Oxide Scale Growth

The thickness of the scale significantly increased under the water vapor condition compared to the dry air condition, as shown in Figure 8. Even though the oxidation process under dry and water vapor conditions occurred via the same mechanisms, the interaction between the number of oxygen atoms from the environment and the steel substrate significantly differed from one case to another. For instance, the oxygen concentration under water saturation reacted faster with the iron ions, thus forming OH from the dissociation of water molecules. Thus, the formation of OH increased the diffusion process, resulting in a faster oxidation than the one occurring under the dry air condition [22]. Similarly, the instability of oxide scales increased with temperature and time. The oxide scale grew more unstable under the dry air condition than under water vapor condition. Furthermore, defects such as voids, gaps, and micro-cracks were formed under both conditions. The formation of gaps close to the steel/oxide interface appeared on specimens oxidized under dry air. Voids and micro-cracks were present in both conditions, especially at higher temperatures and holding times. The presence of defects promoted the detachment (spallation) of the scale from the substrate. The size and amount of defects were observed to increase with temperature, and these increases were more significant under the water vapor condition.
Graphically, it can be seen in Figure 9 that oxide scales grew faster in the presence of water vapor than in the dry air condition. As the temperature increased, thicker scales formed, which clearly occurred for specimens oxidized under dry air. However, the scales formed under water vapor showed some differences between 1000 and 1100 °C. For instance, thicker oxides were observed for the lowest temperature (1000 °C), while thinner oxides formed when the temperature increased to 1100 °C. These changes were observed after 10 min of holding. Furthermore, oxides formed after 30 min did not show significant thickness changes at the same temperatures (i.e., 1000 and 1100 °C). These unexpected changes could have been related to defects formed during oxidation (e.g., voids and cracks) that were more significant at 1000 than at 1100 °C.
It is known that oxide scale growth is highly dependent on time, temperature, thickness, and atmosphere, and it less dependent on scale morphology and defect formation. However, defects also have a great influence on delaying the interaction between the iron ions and oxygen atoms during the oxidation process. Such defects may isolate the interaction by entrapping gases and stopping the oxidation process, resulting in thinner oxide scales.
Specimens oxidized at 1200 °C under water vapor revealed the thickest oxide scales with constant growth. These oxides reached a maximum thickness of 2000 µm (i.e., after 60 min)—almost three times higher than the one formed under dry air with a 500 µm thickness present at the highest temperature and the longest time (1100 °C after 35–40 min). A comparison of oxide scale thicknesses obtained under dry and water vapor conditions can be seen in Table 1.

3.2. Microstructure and Phase Analysis

The phase analysis of specimens oxidized under dry air and water vapor conditions was done via the XRD technique. For comparison purposes, measurements were performed on two of the specimens oxidized under dry air formed at 1000 and 1100 °C at the maximum holding time (i.e., 40 min). In contrast, XRD measurements were performed for all specimens oxidized under the water vapor (all temperatures and times) condition.
XRD analysis was performed on top of the oxide layer for specimens oxidized under dry air. In contrast, powder samples were prepared from the oxides formed under the water vapor condition. This method was used because the roughness observed on the oxides formed under water vapor was more significant than those formed under dry air. Powder samples were obtained by detaching the scales from the steel substrate by using liquid nitrogen. The released oxides were crushed by using an agate mortar to obtain fine powders.
The results in Figure 10 show a comparison of X-ray diffraction patterns obtained from oxides formed under dry air and water vapor treated at different temperatures and holding times. The different peaks correspond to different phases such as wüstite, magnetite, and hematite, which are marked with different symbols.
A comparison of the volume fraction of the phases in the oxides is shown in Table 2. It is interesting to observe that magnetite and hematite were the dominating phases in the steel oxidized under dry air. Wüstite was present on the specimen oxidized at 1000 °C with a 13 volume% but not present at all at 1100 °C. A possible explanation for this is related to the temperature changes during the opening/closing of the chamber when taking the specimens out after reaching the target time for oxidation. These changes could have modified the kinetics of oxide scale formation by means of two main factors. One was related to the detachment of the oxide scale due to the air flowing during the opening/closing of the chamber because the oxide scale formed under dry air was considerably weaker than those formed under water vapor. The second factor was related to a so-called edge effect that led to a reduction of oxidation rate near the substrate and the increment of oxidation at the surface [33]. This may have occurred because the temperature decreased when opening the chamber, which may have slowed/accelerated the kinetics during the formation of oxides (i.e., wüstite, magnetite, and hematite). Finally, the roughness of the scales may also have had an effect on the measurements during XRD experiments, and this may have led to a large dispersion of the X-rays diffracted from the oxide scale surface that resulted in a low intensity and lesser accuracy of the volume fraction values.
In contrast, wüstite was present for all specimens oxidized under water vapor, and it was combined with magnetite and hematite. Thus, magnetite and hematite were the dominating phases under the dry air condition.

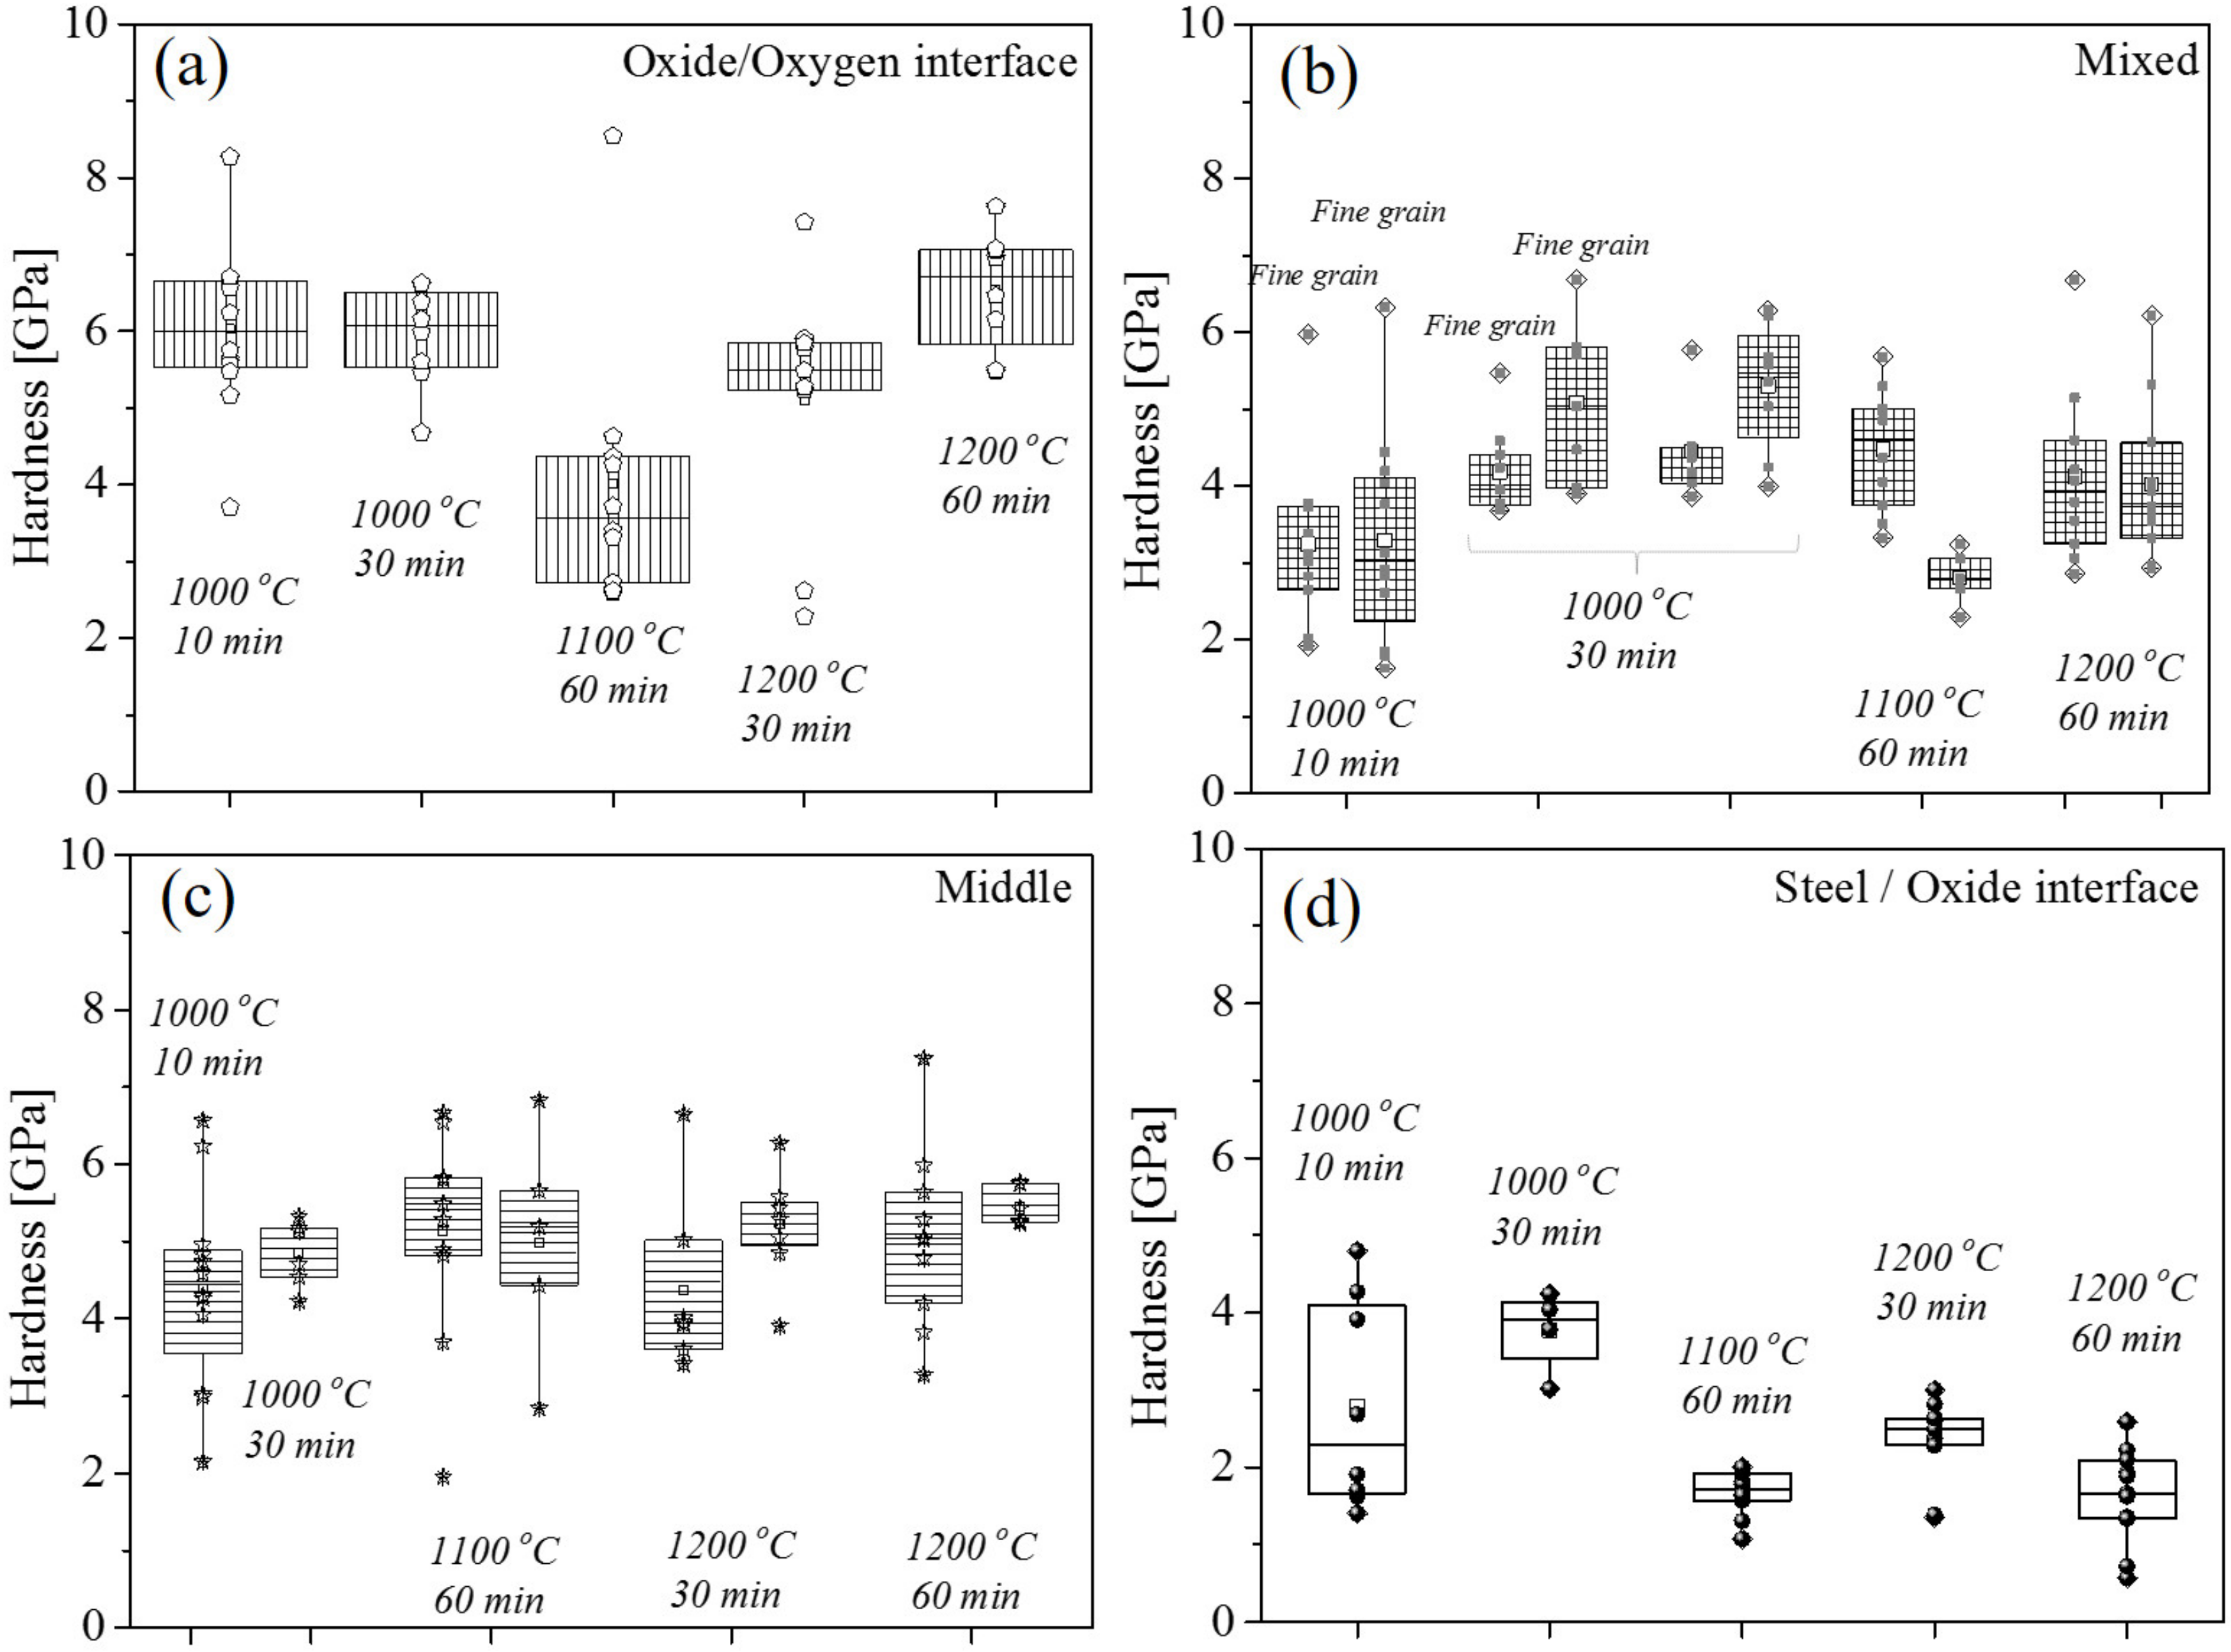
3.3. Micromechanics of Oxides

Accordingly, specimens were selected based on the volume fraction of phases with different concentrations of wüstite, magnetite, and hematite (i.e., 1000 °C after 10 and 30 min, 1100 °C after 60 min, and 1200 °C after 30 and 60 min) formed under water vapor. Nanoindentation tests were conducted on a cross-section of specimens at the steel/oxide interface, the middle phase, the mixed-phase (with a fine grain zone), and the oxide/oxygen interface, as shown in Figure 11.
The local properties of the oxide scale revealed that hardness (HN) decreased from the surface to the steel/oxide interface; see Figure 12.
For instance, the hematite formed at the oxide/oxygen interface showed the highest hardness range between 3 and 8 GPa; see Figure 12a. Additionally, the hardness decreased between 2 and 7 GPa when hematite was mixed with magnetite; see Figure 12b. Similarly, the hardness of magnetite ranged between 2 and 7 GPa, which means that magnetite was the predominating phase in the mixed zone; see Figure 12c. Furthermore, wüstite formed at the steel/oxide interface revealed the lowest hardness range between 0.5 and 5 GPa; see Figure 12d. Additionally, it was observed that hardness values were not directly influenced by the temperature and time or by the grain size structure but only by the phase itself. In the same way, the elastic modulus (E) decreased for the inner layer (i.e., wüstite) and increased for the middle and the outer oxide layers (i.e., magnetite and hematite, respectively). The values of E and HN were in good agreement with those reported in previous studies [34]. A comparison of the micromechanics found for phases in the oxide scales is shown in Table 3.

3.4. Numerical Modelling

Numerical models were used to comprehend the effect of temperature–time on the oxidation kinetics.

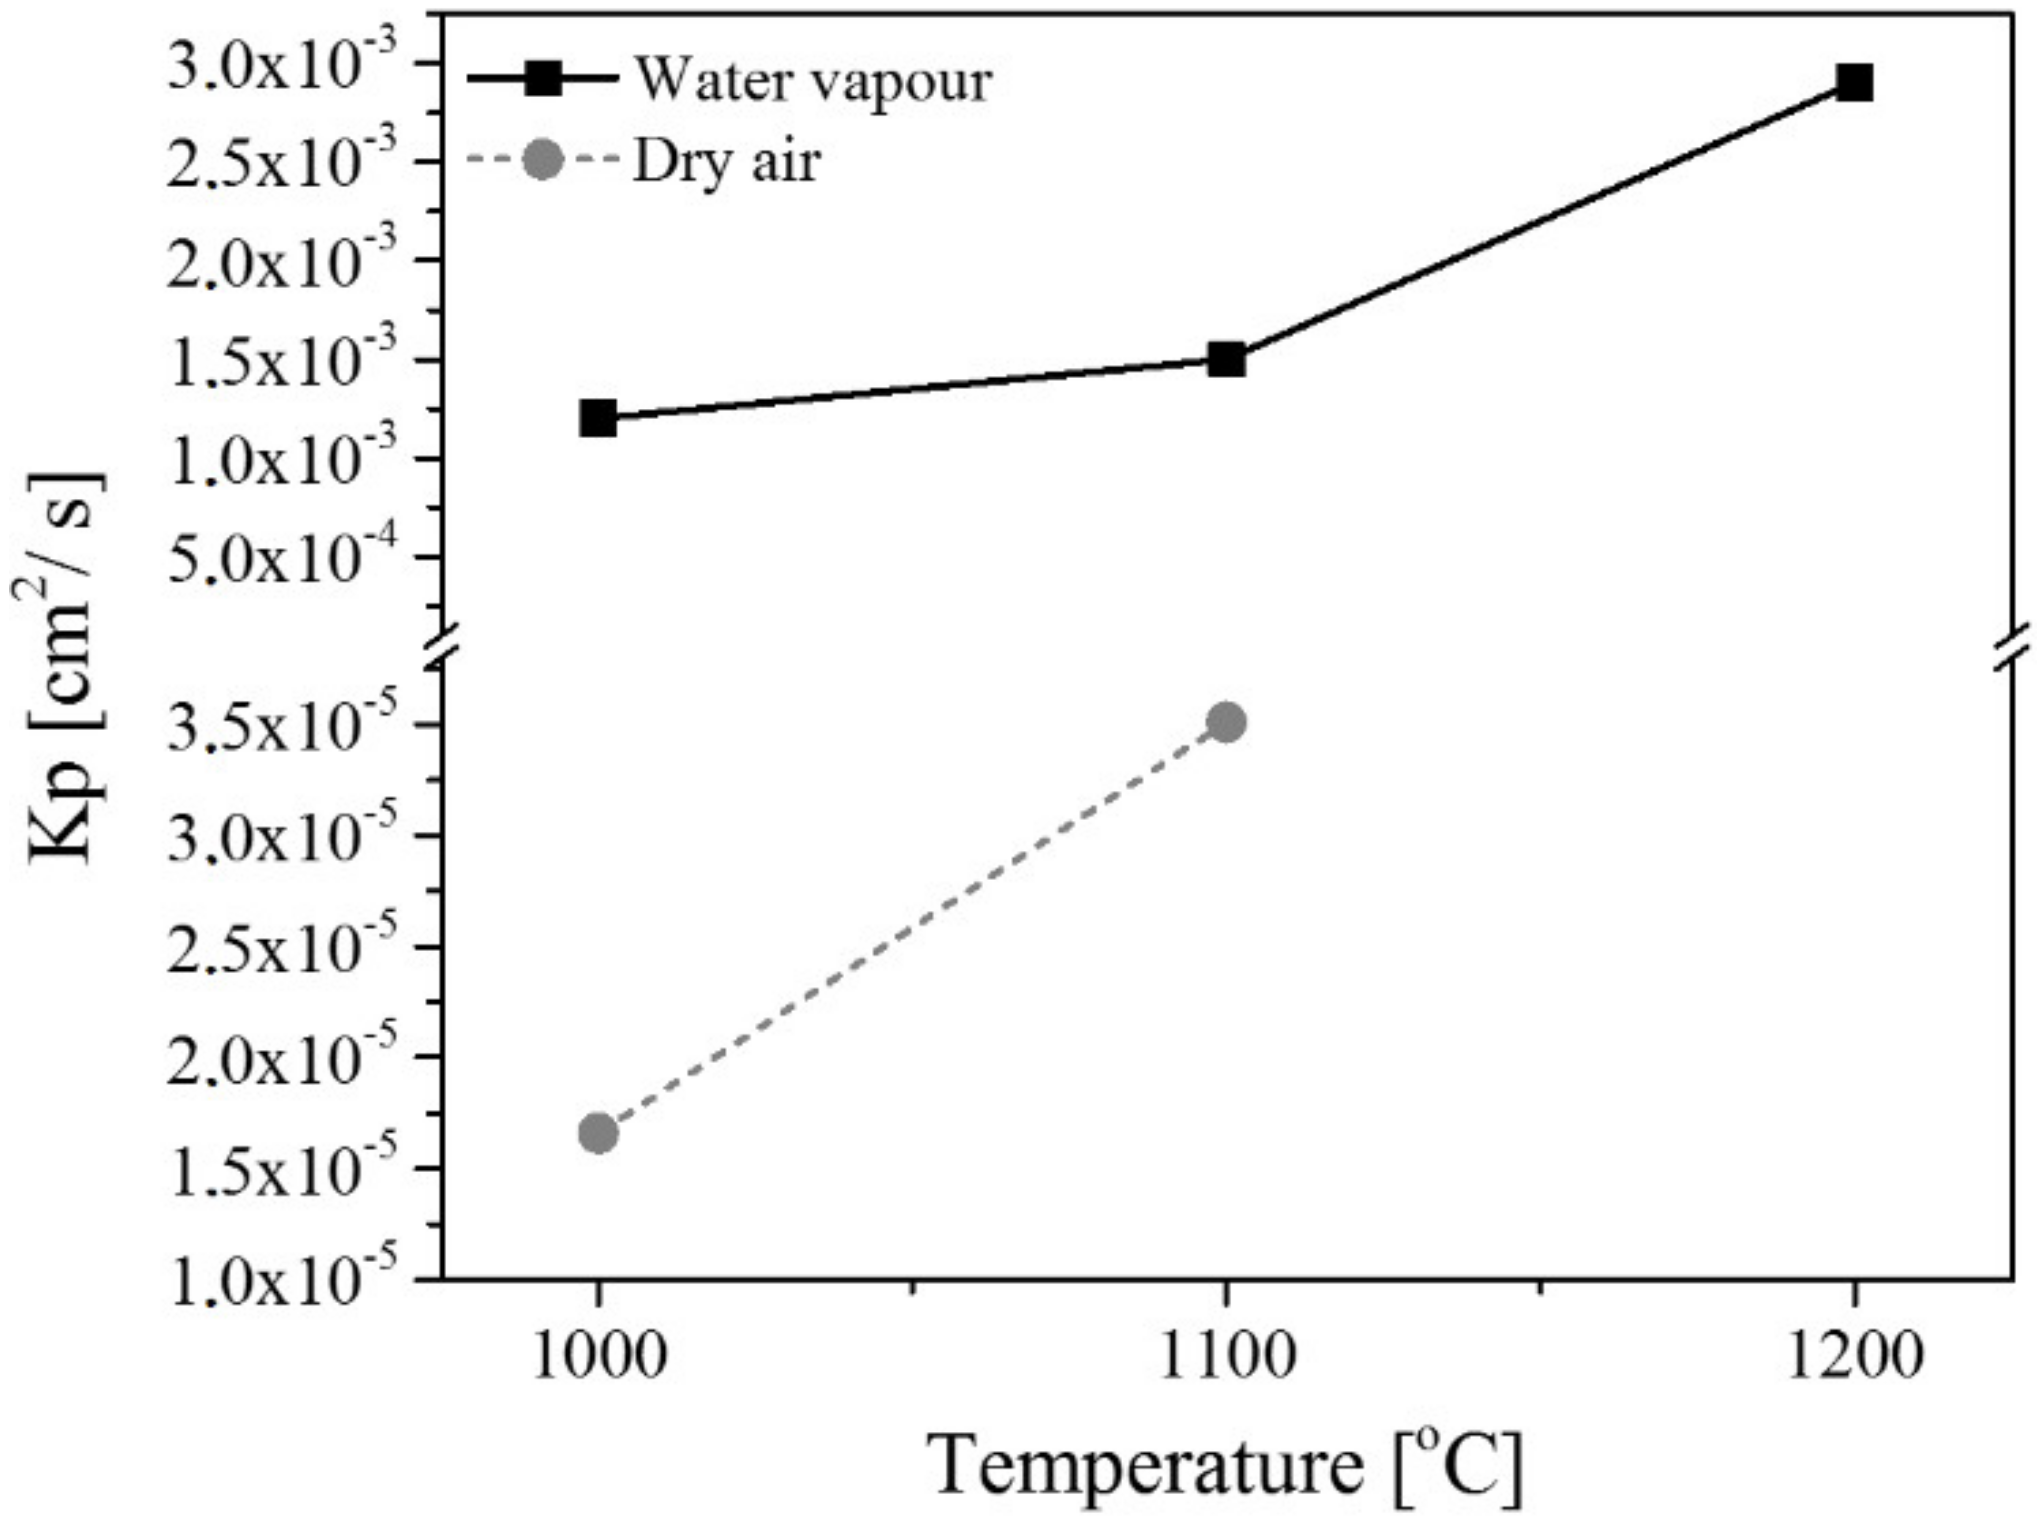
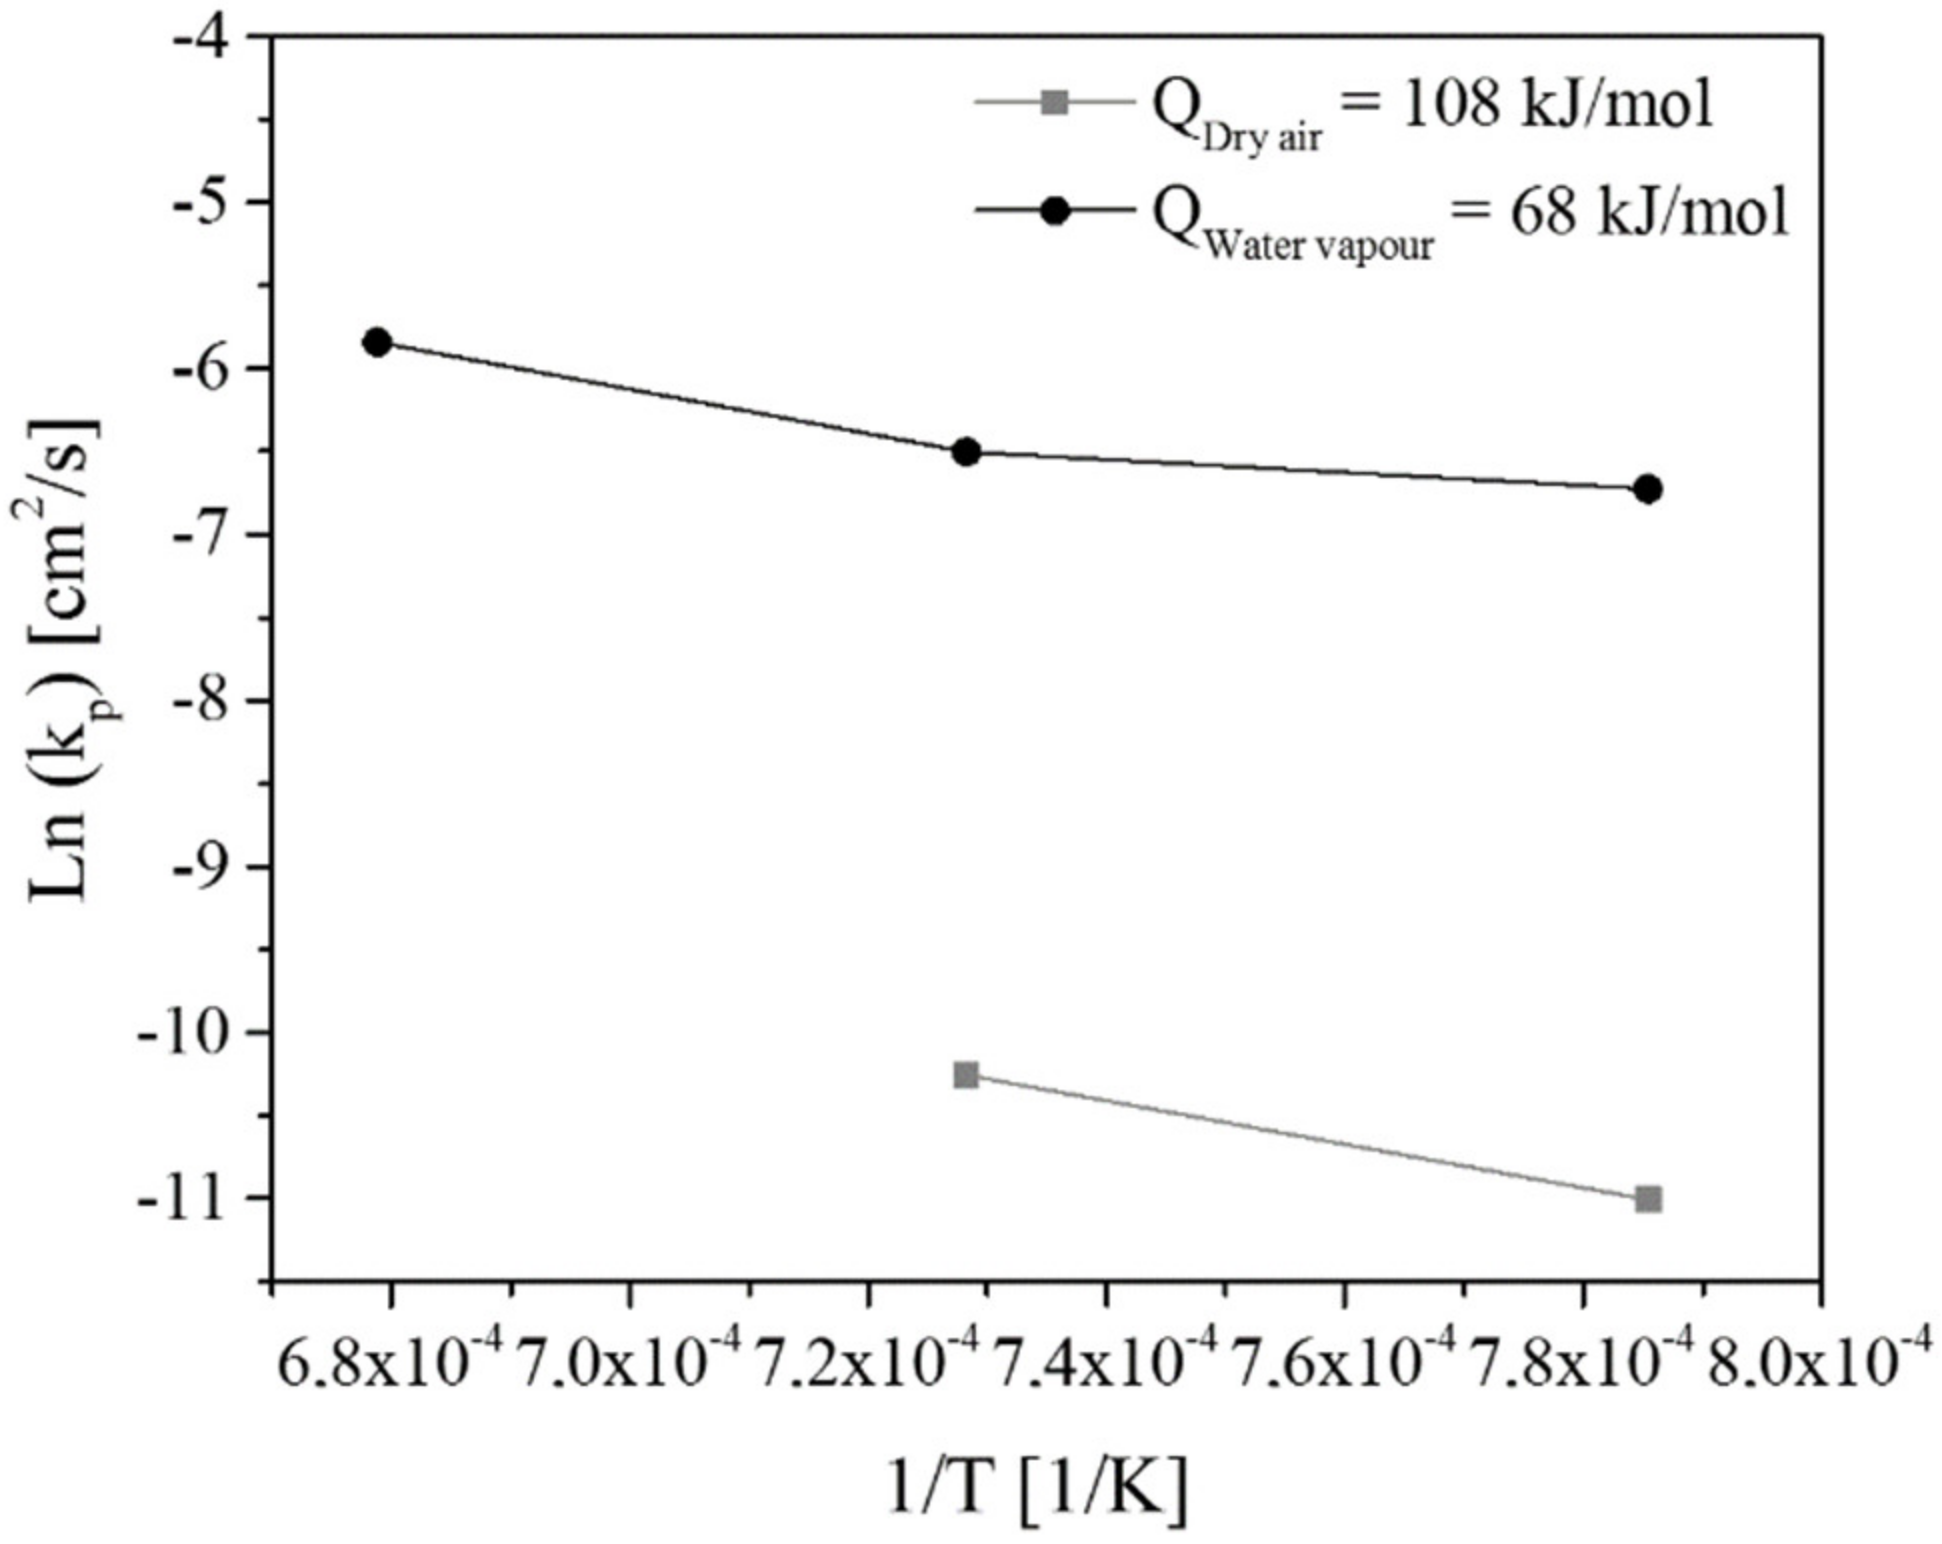
3.4.1. Oxidation-Rate Determination

The first step to determine a rate law suitable to describe the oxidation rate was to calculate a reaction index value (n); if n = 1, the oxidation rate was linear, while n = 2 implied parabolic growth and n = 3 represented cubic growth. The reaction index, at a constant temperature, was calculated through Equation (3):
( x ) n = k n t + c
where x is the scale thickness, k n is the oxidation rate, t is time, and C is the integration constant.
In this particular case, the thickness was assumed to change with temperature at the beginning of the experiments, considered as non-isothermal oxidation. Thus, the variation of time ( d x / d t ) could be directly obtained from experimental data (e.g., x vs. t ), while the variation of temperature was given by ( d x / d T ). Both cases were related to the heating rate. The oxidation rate ( d x / d t ) was assumed to be governed by the temperature and time on the following form:
d x d t = k ( T ) f ( x )
where f x depends on the reaction index written as a power law model in Equations (5) and (6):
f x = 1 n x n 1
n x n 1 d x d t = k n
The integration of Equation (6) gives:
x i x f n x n 1 d x = t i t f k n d t
where x i is the initial thickness after zero time ( t i = 0 ), while x f is the final thickness. Thus, Equation (7) takes the form:
x n ( t ) = k n ( t f t i ) + c
In this case, the integration constant was a function of the reaction index. To include the effect of temperature, the oxidation rate constant, k T , could be expressed as the Arrhenius form:
k ( T ) = k 0 exp Q R T
where Q is the activation energy for oxidation, R is the ideal gas constant (8.314 J/(mol·K)), k 0 is the pre-exponential factor, and T is the temperature in Kelvin.
Reaction index values of 1.9 and 1.7 for oxidation under dry air and 1.6 for oxidation under water vapor were obtained by fitting Equation (8) to the experimental data. Thus, the n value was considered quadratic for determining the oxidation rate constant assumed as parabolic with time. Such a parabolic law was used to calculate the oxidation rate constant ( k p ) for both temperatures by following the Equation (8), where the integration constant was neglected due to its irrelevant changes during calculations.
The parabolic rate constant (kp) showed higher values for oxidation occurring under the water vapor condition than the dry air condition, for which the oxidation rate increased with the temperature, as shown in Figure 13. Generally, it was clear that the interaction of the steel with the water vapor particles in the environment led to a faster oxidation process in comparison with oxidation under the dry air condition. However, the apparent lower oxidation rate at 1100 °C could have been more related to the experimental procedure and less significant to the oxide scale behavior.
The activation energy for parabolic growth was determined by using the Arrhenius expression based on Equation (9). The results revealed that the activation energy needed for oxidation under dry air was larger than that for oxidation under water vapor at 108 and 68 kJ/mol, respectively; see Figure 14. The value obtained for the dry air condition was only considered an approximation due to the poor data points from the temperatures used during the experiments.

3.4.2. Diffusion Coefficient

The diffusion coefficient of oxygen through the oxide scale was determined by considering a non-steady-state diffusion in one dimension. For this purpose, Fick’s second law was applied with the assumption of a constant surface concentration at a certain distance [35]. Figure 15 shows a schematic illustration of the prototype used for calculations.
Fick’s second law expressed in Equation (10) is considered to be independent of composition:
C t = D 2 C x 2
Thus, by following the Gaussian solution with respect to the diffusion length [35], Equation (11) could be approximated as:
x 2 D × t
where x is the thickness of the oxide scale (distance) expressed in centimeters, t is the oxidation time expressed in seconds, and D is the diffusion coefficient of oxygen through the oxide scale expressed in (cm2/s). In this case, D could be obtained through the direct linear regression of the data from the experiments (i.e., thickness vs. time). The results showed that the diffusion coefficient increased with temperature for both air and water vapor conditions, as shown in Figure 16. This means that the oxygen atoms travelled through the oxide scale faster at higher temperatures because the steel was more susceptible to oxidation and even more so under the water vapor condition.
A summary of results obtained from the oxidation rate equations and diffusion coefficients with their corresponding values of activation energy is shown in Table 4.
The influence of temperature during the diffusion process was determined by the following Arrhenius-type equation:
D = D 0 exp Q R T
where D0 is the pre-exponent factor, Q is the activation energy for diffusion in the oxide scale, R is the universal gas constant (8.3143 J/mol·K), and T is the absolute temperature used for oxidation. The energy needed for activation of the oxidation process could be determined by plotting the double logarithm of k as a function of 1/T.
The results revealed that the activation energy needed for diffusion under the dry air condition was slightly different from the one under water vapor conditions (i.e., 202 and 209 kJ/mol, respectively). Furthermore, the water vapor condition provided more possible diffusion steps because the number of oxygen molecules and atoms increased at the surface.

4. Discussion

The temperature and time on oxidation behavior was found to have a significant impact on the kinetics and thickness of the scale, especially during oxidation under the water vapor condition. Special attention is given to the oxidation under water vapor in this section due to its closer relationship with the environmental situation during the CC process (e.g., secondary cooling).

4.1. Microstructure and Phase Analysis

The fraction distribution of phases (e.g., wüstite, magnetite, and hematite) as a function of temperature and time was accomplished only for oxides formed under the water vapor condition. Figure 17 shows a significant fraction of wüstite in all specimens, especially at higher temperatures for the medium and longer holding times (i.e., 30 and 60 min, respectively) where the maximum value ranged between 64.2% and 76.3% (red and yellow zones, respectively). Wüstite formed at higher temperatures is associated with a so-called reversible reaction, which implies that it forms from the reduction of hematite that also forms at high temperatures [36]. The reduction of hematite occurs while passing through magnetite and ending as wüstite, which might occur when phases react with gases such as CO (formed during decarburization) or H2 (in contact with the water vapor) [22]. A combination of magnetite and hematite was found where the volume fraction increased with time at the medium temperature (i.e., 1100 °C). Additionally, lower values (in blue) were present at 1200 °C after 30 min of holding time. Finally, the volume fraction of hematite was more significant at 1200 °C for the lowest and the highest holding times (i.e., 10 and 60 min, respectively). Lower values of hematite were randomly distributed at all oxidation temperatures, especially for oxides formed after 10 min.
The morphology of phases in oxide scales formed under water vapor are identified in Figure 18. It can be observed that wüstite ( Fe 1 x O ), magnetite ( Fe 3 O 4 ), and hematite ( Fe 2 O 3 ) appeared with different colors due to the reaction from the different etchants applied to the oxide scale surface. For instance, wüstite appeared as the darkest phase at the steel/oxide interface. This phase predominated at 1200 °C after 30 and 60 min of holding time; see an example in Figure 18d. Furthermore, magnetite formed at the top of the wüstite phase and appeared in either the light blue or brown color (Figure 18b,c). Magnetite appeared as the thickest oxide, being the predominant phase at 1100 °C after 60 min of holding time. A mixture of magnetite and hematite was commonly observed for all specimens with presence of small and big hematite grains (white/beige color) formed in a magnetite matrix (blue or dark brown color); see Figure 18a–c. Finally, hematite clearly appeared as the thinnest and lightest layer (white color) at the oxide/oxygen interface. Hematite is considered as a phase with a low metal content that mostly interacts with oxygen [19]; see Figure 18a.

4.2. Micromechanical Analysis

The micromechanical properties of the oxide scales were important in this work since they had an indirect effect during cooling in the CC process, and they comprised one of the reasons for the surface quality issues on the steel slabs. For instance, the plastic properties in wüstite increased significantly to 20 GPa in comparison with magnetite and hematite, where values remained almost the same (10 GPa), as shown in Figure 19.
The plasticity index was determined by computing the relationship between the elastic and the plastic work (Table 3) for each phase (i.e., wüstite, magnetite, and hematite). This value determines the tendency of a surface to deform plastically. Outer phases such as magnetite and hematite showed lower plasticity indexes than the inner phase (wüstite), meaning that the outer phases may not have deformed as much as the inner phase. Accordingly, magnetite and hematite had the highest tendency to detach when being in contact with the steel rolls in the secondary cooling (during CC), which may have resulted in the cracking and spallation of the oxide scale. Moreover, phases with the higher plasticity index such as wüstite may have been able to stick on the steel substrate, thus making it more difficult to detach. This behavior could have directly affected heat transfer coefficient (HTC) during cooling in the CC process, thus being detrimental for temperature changes on surface of the strand and resulting in defects of the final product [37]. Previous investigations regarding this topic have demonstrated that the HTC significantly increases with temperature when oxide scales are formed on steels (e.g., 15 µm thickness) [12], ultimately having a significant impact on crack formation during processing. In fact, one of the strategies to avoid the formation of wüstite is to control/reduce the cooling rate during straightening where the temperatures oscillate between 700 and 1000 °C. The use of different cooling strategies is considered a good approach for decreasing oxide scale growth and improving surface quality on steel slabs, but only few studies have been published regarding this topic [38,39].

4.3. Numerical Analysis

The kinetics of oxidation under dry and water vapor conditions revealed a parabolic growth. The oxidation rate (kp) was shown to be higher under the water vapor condition than under the dry air condition. In addition, the faster interaction with oxygen atoms with iron ions from the metal substrate was more significant for the oxidation under the water vapor condition than in the air condition. The values of the parabolic oxidation rate (kp) were compared with previous studies in which experiments were performed under isothermal conditions, as can be seen in Table 5.
A significant difference was found between dry air and water vapor conditions. Different factors were responsible for such differences, including the steel grade used for the experiments, the surface condition of specimens, and the experimental set-up design. In this work, experiments were performed at a larger scale (i.e., a pilot plant) with poor atmosphere control during oxidation, leading to a non-isothermal oxidation during the heating of specimens, and this could be considered to approximate an industrial environment. However, isothermal oxidation with full atmosphere control is usually performed at the lab-scale (i.e., previous studies), and this makes the analysis easier to perform but less optimal when compared to a larger scale process (e.g., continuous casting, hot rolling, and stamping,). Moreover, the kp values for oxidation under dry air were closer to those presented by Abuluwefa et al. [1]. Similarly, values obtained under water vapor were closer to the values found by H. Yin et al. [40], which were obtained for a low carbon steel.
Furthermore, the values of the activation energy needed for oxidation in dry and water vapor conditions were compared with previous studies. It was observed that the activation energy for oxidation in dry air (108 kJ/mol) was similar to some values obtained by Jacek et al. [16] (108.6 kJ/mol) for the linear oxidation of a steel containing 0.14–0.19 wt.% C. In contrast, the values obtained under water vapor in this work (68 kJ/mol) significantly differed to those obtain by Jacek et al. [16] for parabolic oxidation but were similar for linear oxidation. This behavior could be related to the amount of oxygen present in the environment because the oxygen from the air during experiments was not intended to be removed during the oxidation under water vapor. Thus, the oxygen in the air and the water vapor interacted during the oxidation process and had important effects on the oxidation rate. Moreover, this effect is very important to consider when comparing with real situations during secondary cooling in the CC process.

5. Conclusions

The importance of oxidation phenomena occurring at high temperatures under dry air and water vapor conditions was investigated for temperatures relevant to the secondary cooling zone (i.e., close to the mold, bender, and straightener at around 1200, 1000, and 1100 °C, respectively). After the two experiments were performed, the following conclusions were drawn:
  • Higher temperatures and longer holding times promoted thicker oxide scale formation.
  • Defects such as pores, voids, and micro-cracks formed during oxide scale growth. The number and size of defects increased with temperature, and these were related to the transport of water molecules and gas formation.
  • The micromechanics of the oxide scales showed the highest plasticity with lowest hardness and elastic modulus for the wüstite phase in comparison with magnetite and hematite.
  • A study of kinetics revealed that the diffusion of oxygen through the scale was faster during oxidation under water vapor in comparison with the dry air atmosphere.
  • Finally, this work demonstrated that a lower amount of wüstite can be achieved under the dry air condition in comparison with the water vapor condition.
The findings in this work suggest that the oxide scale thickness formed at high temperatures and different holding times under a water vapor condition can be considered detrimental during the continuous casting process. Thick oxide scales can delay effective cooling, thus affecting the heat transfer coefficient. Furthermore, the micromechanics of phases formed in the oxide scales demonstrated that a combination of phases with high (wüstite) and low plasticity (magnetite and hematite) could also be the reason for the uneven cooling during CC, thus resulting in an undesired surface quality of the steel slabs. This confirmed the positive approach that using different cooling strategies by reducing the amount of water during continuous casting (dry casting) will lead to a significant reduction of the oxide scale and, more importantly, the amount of wüstite, which is considered to provide a detrimental effect by promoting defect formation.

Author Contributions

Conceptualization, R.M.P.H., P.E.R.L. and E.V.; methodology, R.M.P.H., P.N.J. and L.P.; validation, R.M.P.H., P.E.R.L. and E.V.; formal analysis, R.M.P.H., L.P.; investigation, R.M.P.H., P.N.J. and L.P.; resources, M.K.; data curation, R.M.P.H.; writing—original draft preparation, R.M.P.H.; writing—review and editing, R.M.P.H., P.E.R.L. and E.V.; visualization, R.M.P.H., P.E.R.L. and E.V.; supervision, P.E.R.L. and E.V.; project administration, R.M.P.H, P.E.R.L. and E.V.; funding acquisition, R.M.P.H., P.E.R.L., E.V., M.K. All authors have read and agreed to the published version of the manuscript.

Funding

This research received no external funding.

Acknowledgments

The authors are grateful for the economic and scientific support provided by the following organizations and colleagues. R.M.P.H thanks the National Council on Science and Technology (CONACYT) for economical support for her PhD studies, SWERIM for support during PhD studies and plant trials, Ragnar T. for valuable discussions, Joar Draxler for the valuable contribution in the modelling part, and, finally, Pushkar D. and Celia M. for their contributions during their MSc. studies.

Conflicts of Interest

The authors declare no conflict of interest.

References

  1. Abuluwefa, H.; Guthrie, R.; Ajersch, F. The effect of oxygen concentration on the oxidation of low-carbon steel in the temperature range 1000 to 1250 °C. Oxid. Metals 1996, 46, 5–6. [Google Scholar] [CrossRef]
  2. Li, Y.; Sellars, C. Comparative investigations of interfacial heat transfer behaviour during hot forging and rolling of steel with oxide scale formation. J. Mater. Process. Technol. 1998, 282–286. [Google Scholar] [CrossRef]
  3. Marston, H.; Bolt, P.; Leprince, G.; Röder, M.; Klima, R.; Niska, J.; Jarl, M. Challenges in the modelling of scale formation and decarburisation of high carbon, special and general steels. Ironmak. Steelmak. 2004, 31, 57–65. [Google Scholar] [CrossRef]
  4. Sun, W.; Tieu, A.; Jiang, Z.; Lu, C. High temperature oxide scale characteristics of low carbon steel in hot rolling. J. Mater. Process. Technol. 2004, 155, 1307–1312. [Google Scholar] [CrossRef]
  5. Cao, G.-M.; Liu, X.-J.; Sun, B.; Liu, Z. Morphology of Oxide Scale and Oxidation Kinetics of Low Carbon Steel. J. Iron Steel Res. Int. 2014, 21, 335–341. [Google Scholar] [CrossRef]
  6. Chen, R.Y.; Yuen, W.Y.D. Oxide-Scale Structures Formed on Commercial Hot-Rolled Steel Strip and Their Formation Mechanisms. Oxid. Met. 2001, 56, 89–118. [Google Scholar] [CrossRef]
  7. Chen, R.; Yeun, W. Review of the High-Temperature Oxidation of Iron and Carbon Steels in Air or Oxygen. Oxid. Met. 2003, 59, 433–468. [Google Scholar] [CrossRef]
  8. Hu, X.-J.; Zhang, B.-M.; Chen, S.-H.; Fang, F.; Jiang, J. Oxide Scale Growth on High Carbon Steel at High Temperatures. J. Iron Steel Res. Int. 2013, 20, 47–52. [Google Scholar] [CrossRef]
  9. Liu, S.; Tang, D.; Wu, H.; Wang, L. Oxide scales characterization of micro-alloyed steel at high temperature. J. Mater. Process. Technol. 2013, 213, 1068–1075. [Google Scholar] [CrossRef]
  10. Suarez, L.; Houbaert, Y.; Eynde, X.V.; Colás, R. High temperature deformation of oxide scale. Corros. Sci. 2009, 51, 309–315. [Google Scholar] [CrossRef]
  11. Takada, J.; Adachi, M. Determination of diffusion coefficient of oxygen in α-iron from internal oxidation measurements in Fe-Si alloys. J. Mater. Sci. 1986, 21, 2133–2137. [Google Scholar] [CrossRef]
  12. Chabičovský, M.; Hnízdil, M.; Tseng, A.; Raudenský, M. Effects of oxide layer on Leidenfrost temperature during spray cooling of steel at high temperatures. Int. J. Heat Mass Transf. 2015, 88, 236–246. [Google Scholar] [CrossRef]
  13. Hu, P.; Ying, L.; Li, Y.; Liao, Z. Effect of oxide scale on temperature-dependent interfacial heat transfer in hot stamping process. J. Mater. Process. Technol. 2013, 213, 1475–1483. [Google Scholar] [CrossRef]
  14. Wendelstorf, R.; Spitzer, K.-H.; Wendelstorf, J. Effect of oxide layers on spray water cooling heat transfer at high surface temperatures. Int. J. Heat Mass Transf. 2008, 51, 4892–4901. [Google Scholar] [CrossRef]
  15. Shin, H.-J.; Kim, S.-H.; Thomas, B.G.; Lee, G.-G.; Park, J.-M.; Sengupta, J. Measurement and Prediction of Lubrication, Powder Consumption, and Oscillation Mark Profiles in Ultra-low Carbon Steel Slabs. ISIJ Int. 2006, 46, 1635–1644. [Google Scholar] [CrossRef] [Green Version]
  16. Slowik, J.; Borchardt, G.; Köhler, C.; Jeschar, R.; Scholz, R. Influence of oxide scales on heat transfer in secondary cooling zones in the continuous casting process, part 2: Determination of material properties of oxide scales on steel under spray-water cooling conditions. Steel Res. 1990, 61, 302–311. [Google Scholar] [CrossRef]
  17. Wang, N.; Dong, J.-H.; Huang, W.-J.; Li, B.; Chen, M. Growth Rate, Microstructure and Phase Composition of Oxide Scales for Three Typical Steels in Simulated Continuous Casting Process. J. Iron Steel Res. Int. 2014, 21, 1065–1072. [Google Scholar] [CrossRef]
  18. Köhler, C.; Jeschar, R.; Scholz, R.; Slowik, J.; Borchardt, G. Influence of oxide scales on heat transfer in secondary cooling zones in the continuous casting process, part 1: Heat transfer through hot-oxidized steel surfaces cooled by spray-water. Steel Res. 1990, 61, 295–301. [Google Scholar] [CrossRef]
  19. Kofstad, P. High temperature corrosion. In Elsevier Applied Science; Crown House: Barking, UK, 1988. [Google Scholar]
  20. Landolt, D. Corrosion and Surface Chemistry of Metals, 1st ed.; Taylor and Francis Group, LLC: New York, NY, USA, 2007; ISBN 978-2-940222-11-7. [Google Scholar]
  21. Young, D.J. High Temperature Oxidation and Corrosion of Metals; Elsevier: Amsterdam, The Netherlands, 2016. [Google Scholar]
  22. Baud, J.; Ferrier, A.; Manenc, J. The oxidation and decarburizing of Fe-C alloys in air and the influence of relative humidity. Oxid. Met. 1975, 9, 69–97. [Google Scholar] [CrossRef]
  23. Gesmundo, F.; Gleeson, B. Oxidation of multicomponent two-phase alloys. Oxid. Met. 1995, 44, 211–237. [Google Scholar] [CrossRef]
  24. Anusha, A.; Parameswaran, C.; Revathi, P.; Velmurugan, V. Numerical simulation of dry and wet oxidation of Silicon by TCAD Sprocess. In Proceedings of the International Conference on Advanced Nanomaterials & Emerging Engineering Technologies, Chennai, India, 24–26 July 2013; pp. 513–516. [Google Scholar]
  25. Wang, N.; Wen, H.; Huang, W.; Dou, N.; Chen, M. Effect of Steel Composition on the Scale Layer Composition in Continuous Casting. In Proceedings of the 8th Pacific Rim International Congress on Advanced Materials and Processing, Waikoloa, HI, USA, 4–9 August 2013. [Google Scholar]
  26. Darken, L.S.; Gurry, R.W. The System Iron-Oxygen. I. The Wüstite Field and Related Equilibria. J. Am. Chem. Soc. 1945, 67, 1398–1412. [Google Scholar] [CrossRef]
  27. Janković, B.Ž.; Adnađević, B.; Mentus, S. The kinetic analysis of non-isothermal nickel oxide reduction in hydrogen atmosphere using the invariant kinetic parameters method. Thermochim. Acta 2007, 456, 48–55. [Google Scholar] [CrossRef]
  28. Ríos, L.M.M.; Muñoz, P.V.C.; Giraldo, J.M.C.; Gaviria, G.H.; González, A.F.R.; Mantilla, J.I.C. Modelos cinéticos de degradación térmica de polímeros: Una revisión. Rev. Ing. Univ. Medellín 2013, 12, 113–129. [Google Scholar] [CrossRef] [Green Version]
  29. Aboulkas, A.; El Harfi, K.; El Bouadili, A. Thermal degradation behaviors of polyethylene and polypropylene. Part I: Pyrolysis kinetics and mechanisms. Energy Convers. Manag. 2010, 51, 1363–1369. [Google Scholar] [CrossRef]
  30. Petzow, G.; Carle, V.; Harnisch, U. Techniques for Metallography, Ceramography, Plastography. In Metallographic Etching; ASM International: Geauga County, OH, USA, 1999. [Google Scholar]
  31. Walker, P.; Tarn, W.H. CRC Handbook of Metal Etchants; CRC Press LLC: Boca Raton, FL, USA, 1991. [Google Scholar]
  32. Oliver, W.; Pharr, G. An improved technique for determining hardness and elastic modulus using load and displacement sensing indentation experiments. J. Mater. Res. 1992, 7, 1564–1583. [Google Scholar] [CrossRef]
  33. Ye, S.; Endoh, T. Edge effect in the oxidation of three-dimensional nano-structured silicon. Mater. Sci. Semicond. Process. 2019, 93, 266–273. [Google Scholar] [CrossRef]
  34. Zambrano, O.; Coronado, J.; Rodriguez, S. Mechanical properties and phases determination of low carbon steel oxide scales formed at 1200 °C in air. Surf. Coat. Technol. 2015, 282, 155–162. [Google Scholar] [CrossRef]
  35. Mehrer, H. Diffusion in Solid Metals and Alloys. In Landolt-Börnstein Numerical Data and Functional Relationships in Science and Technology; Group III; Springer: Berlin Heidelberg; New York, NY, USA, 1990; p. 26. [Google Scholar]
  36. Monazam, E.R.; Breault, R.W.; Siriwardane, R.V. Kinetics of Hematite to Wüstite by Hydrogen for Chemical Looping Combustion. Energy Fuels 2014, 28, 5406–5414. [Google Scholar] [CrossRef]
  37. Hidaka, Y.; Anraku, T.; Otsuka, N. Deformation of iron oxides upon tensile tests at 600–1250 °C. Oxid. Metals 2003, 59, 97–113. [Google Scholar] [CrossRef]
  38. Javurek, M.; Ladner, P.; Watzinger, J.; Wimmer, P.; Shan, G. Secondary cooling: Roll heat transfer during dry casting. In Proceedings of the METEC ESTAD, Düsseldorf, Germany, 19 June 2015. [Google Scholar]
  39. Raudensky, M.; Hnizdil, M.; Hwang, J.Y.; Lee, S.H.; Kim, S.Y. Influence of the water temperature on the cooling intensity of mist nozzles in continuous casting. Mater. Tehnol. 2012, 46, 3. [Google Scholar]
  40. Yin, H.; Yuen, W.Y.D.; Young, D.J. Effects of water vapour and oxygen partial pressures on low carbon steel oxidation in N2-H2-H2O mixtures. Mater. Corros. 2012, 63, 869–877. [Google Scholar] [CrossRef]
  41. Issartel, C.; Buscail, H.; Wang, Y.; Rolland, R.; Vilasi, M.; Aranda, L. Water Vapour Effect on Ferritic 4509 Steel Oxidation Between 800 and 1000 °C. Oxid. Met. 2011, 76, 127–147. [Google Scholar] [CrossRef]
  42. Buscail, H.; Rolland, R.; Perrier, S. Influence of water vapour on 316L oxidation at high temperature—In situ X-Ray diffraction. Ann. Chim. Sci. Matér. 2015, 39, 107–114. [Google Scholar] [CrossRef]
Figure 1. Layout of a continuous casting machine indicating zones and temperatures used for the experimental set-up to simulate oxidation in the water vapor condition for a high strength low alloy (HSLA) steel.
Metals 10 01243 g001
Figure 2. Schematic representation of oxidation phenomena occurring on a metal substrate by (a) the adsorption of oxygen resulting in oxide scales formed by (b) nucleation and (c) growth with the presence of (d) defects.
Metals 10 01243 g002
Figure 3. Schematic representation of oxidation reaction with air and water droplet.
Metals 10 01243 g003
Figure 4. Schematic representation of phases formed in oxides on steel: (a) hematite, magnetite, and wüstite phases; (b) oxide formed on a micro-alloyed steel.
Metals 10 01243 g004
Figure 5. Sample lay-out from (a) continuously cast steel slab sectioned in (b) S1-center to take (c) smaller samples for oxidation tests under dry and water vapour conditions.
Metals 10 01243 g005
Figure 6. Experimental setup for oxidation under the water vapor atmosphere.
Metals 10 01243 g006
Figure 7. Thermal cycles applied for (a) oxidation under dry air and (b) water vapor.
Metals 10 01243 g007
Figure 8. SEM micrographs of oxide scales formed under dry air and water vapor conditions on an HSLA steel oxidized at 1000 and 1100 °C at different holding times.
Metals 10 01243 g008
Figure 9. Comparison of the oxide scale thickness as a function of temperature for specimens oxidized under dry and water vapor conditions.
Metals 10 01243 g009
Figure 10. X-ray diffraction patterns of oxide scales formed under dry air and water vapor conditions.
Metals 10 01243 g010
Figure 11. Optical micrograph used during nanoindentation tests.
Metals 10 01243 g011
Figure 12. Hardness values of phases formed at the (a) oxide/oxygen, (b) mixed, (c) middle, and (d) steel/oxide interfaces.
Metals 10 01243 g012
Figure 13. Parabolic oxidation rate ( k p ) as a function of temperature.
Metals 10 01243 g013
Figure 14. Arrhenius plot for the activation energy determination of parabolic oxidation ( k p ) under dry air and water vapor conditions as a function of temperature.
Metals 10 01243 g014
Figure 15. Prototype used for the diffusion coefficient calculation.
Metals 10 01243 g015
Figure 16. Diffusion coefficient as a function of temperature.
Metals 10 01243 g016
Figure 17. Color map plots showing the volume fraction of wüstite, magnetite, and hematite.
Metals 10 01243 g017
Figure 18. Morphology of oxides formed at (a) 1000 °C after 10 min, (b) 1100 °C after 60 min, (c) 1200 °C after 10 min, and (d) 1200 °C after 60 min.
Metals 10 01243 g018
Figure 19. Plastic work of the wüstite, magnetite, and hematite phases.
Metals 10 01243 g019
Table 1. Thickness of oxide scales formed under dry air and water vapor conditions.
T (°C)Holding Time (min)Average Thickness (µm)
Dry AirWater Vapor
100010128400
30217566
40269-
60-627
110010204236
30393618
40526-
60-992
120010-587
30-1337
40--
60-1945
Table 2. Comparison of volume (%) of phases in oxides formed under dry air and water vapor conditions.
T (°C)Time (min) Wüstite   ( F e 1 x O ) Magnetite   ( F e 3 O 4 ) Hematite   ( F e 2 O 3 )
Dry AirWater VaporDry AirWater VaporDry AirWater Vapor
100010-54.5-43.0-2.5
30-23.1-34.6-42.3
4013-38-48-
60-64.2-34.7-1
110010-63.3-36.5-0.2
30-54.2-41.1-4.7
400-45-55-
60-2.3-55.7-42.0
120010-0.7-34.4-64.9
30-76.2-22.4-1.4
60-76.3-22.8-0.9
Table 3. Comparison of micromechanical properties of wüstite, magnetite, and hematite.
PhaseMicromechanics of Oxides Formed Under Water Vapour
HN (GPa)E (GPa)Plasticity IndexPlastic Work (GPa)Elastic Work (GPa)
Wüstite2.71380.8612.22.0
Magnetite5.01440.7810.02.8
Hematite5.51510.759.63.1
Table 4. Values of oxidation rate and diffusion coefficient in oxides formed at high temperatures. Q: the activation energy for diffusion in the oxide scale.
T (°C)Oxidation Rate, k p   ( c m 2 / s ) Q (Oxidation) k J . m o l   Diffusion Coefficient, D ( c m 2 / s )   Q (Diffusion) k J . m o l  
Dry AirWater Vapour Dry AirWater VapourDry AirWater VapourDry AirWater Vapour
10001.66 × 10−51.20 × 10−3108683.20 × 10−77.43 × 10−7202209
11003.51 × 10−51.50 × 10−31.28 × 10−63.09 × 10⁻⁶
1200-2.90 × 10⁻³--1.09 × 10⁻⁵-
Table 5. Comparison of parabolic oxidation rate ( k p ) under dry air and water vapour conditions
Comparison of Parabolic Oxidation Rate Constants, kp (cm2/s)
Oxidation Under Dry Air
T (°C)This WorkLiu et al. (I)Chen et al. (II)Abuluwefa et al. (III)Jacek et al. (IV)Reference
900-2.44 × 10−83.51 × 10−8-4.71 × 10⁻⁸(I) [9]
10001.66 × 10−53.78 × 10−71.11 × 10−74.90 × 10⁻⁷-(II) [7]
11003.51 × 10−57.21 × 10−72.98 × 10−71.25 × 10⁻⁶-(III) [1]
1200-1.39 × 10−66.98 × 10−72.60 × 10−61.09 × 10−8(IV) [16]
Oxidation Under Water Vapour
T (°C)This WorkIssartel C. et al. (V)Buscail et al. (VI)Yin H. et al. (VII)Jacek et al. (VIII)Reference
900-1.70 × 1065.80 × 10−71.70 × 10−41.03 × 10−8(V) [41]
10001.20 × 10−35.50 × 10−61.90 × 10−62.80 × 10−44.56 × 10−8(VI) [42]
11001.50 × 10−3----(VII) [40]
12002.90 × 10−3----(VIII) [16]

