Experimental Investigation of Friction Stir Welding on 6061-T6 Aluminum Alloy using Taguchi-Based GRA


Abstract

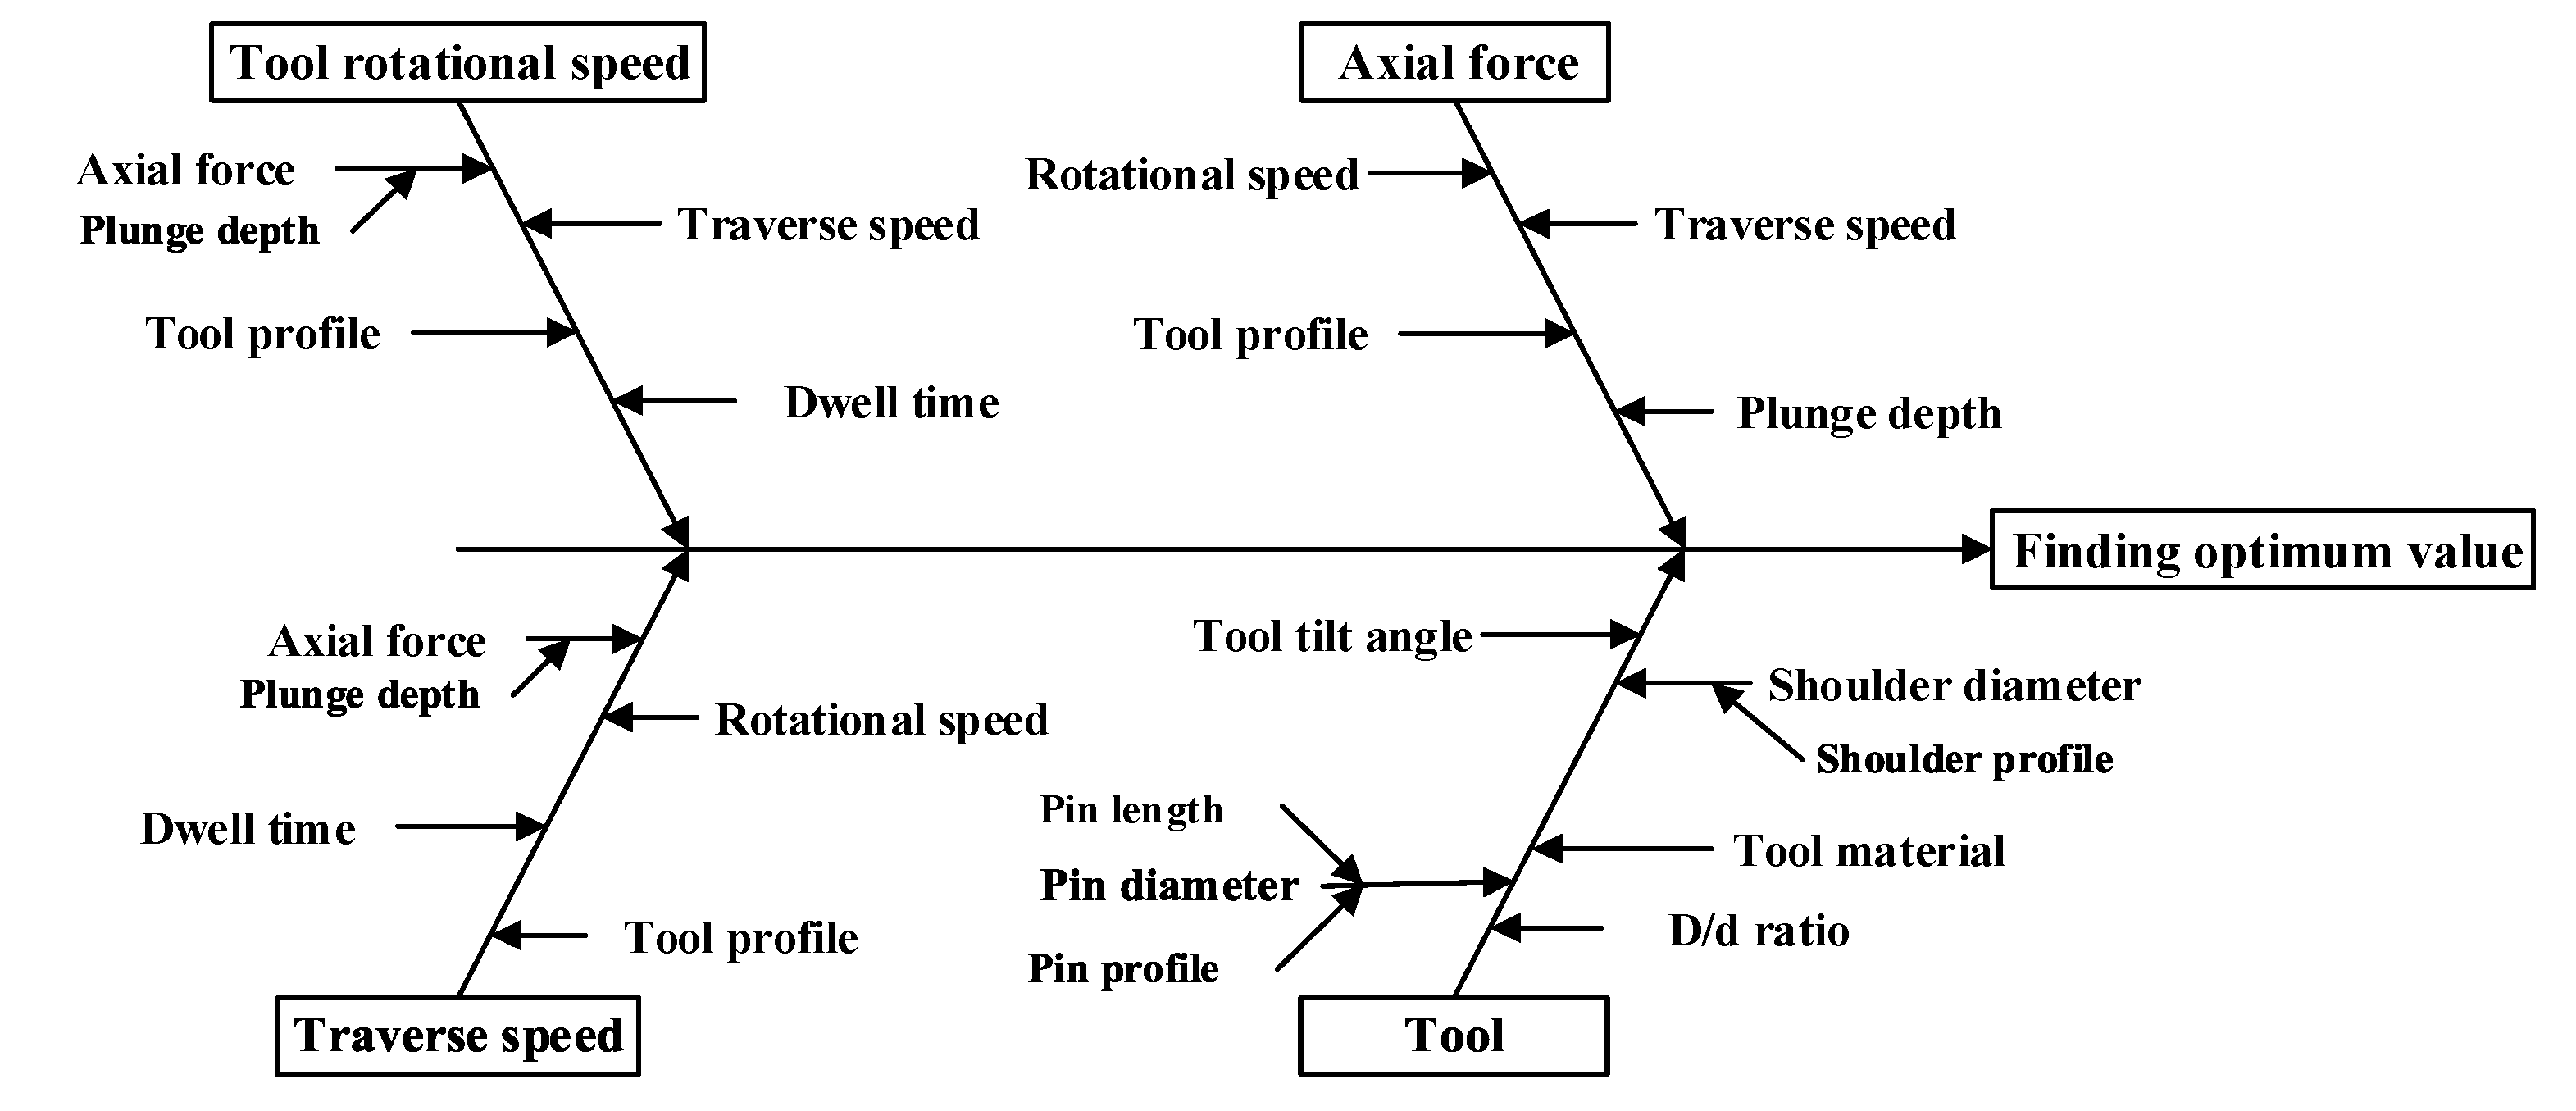
1. Introduction
2. Materials and Methods
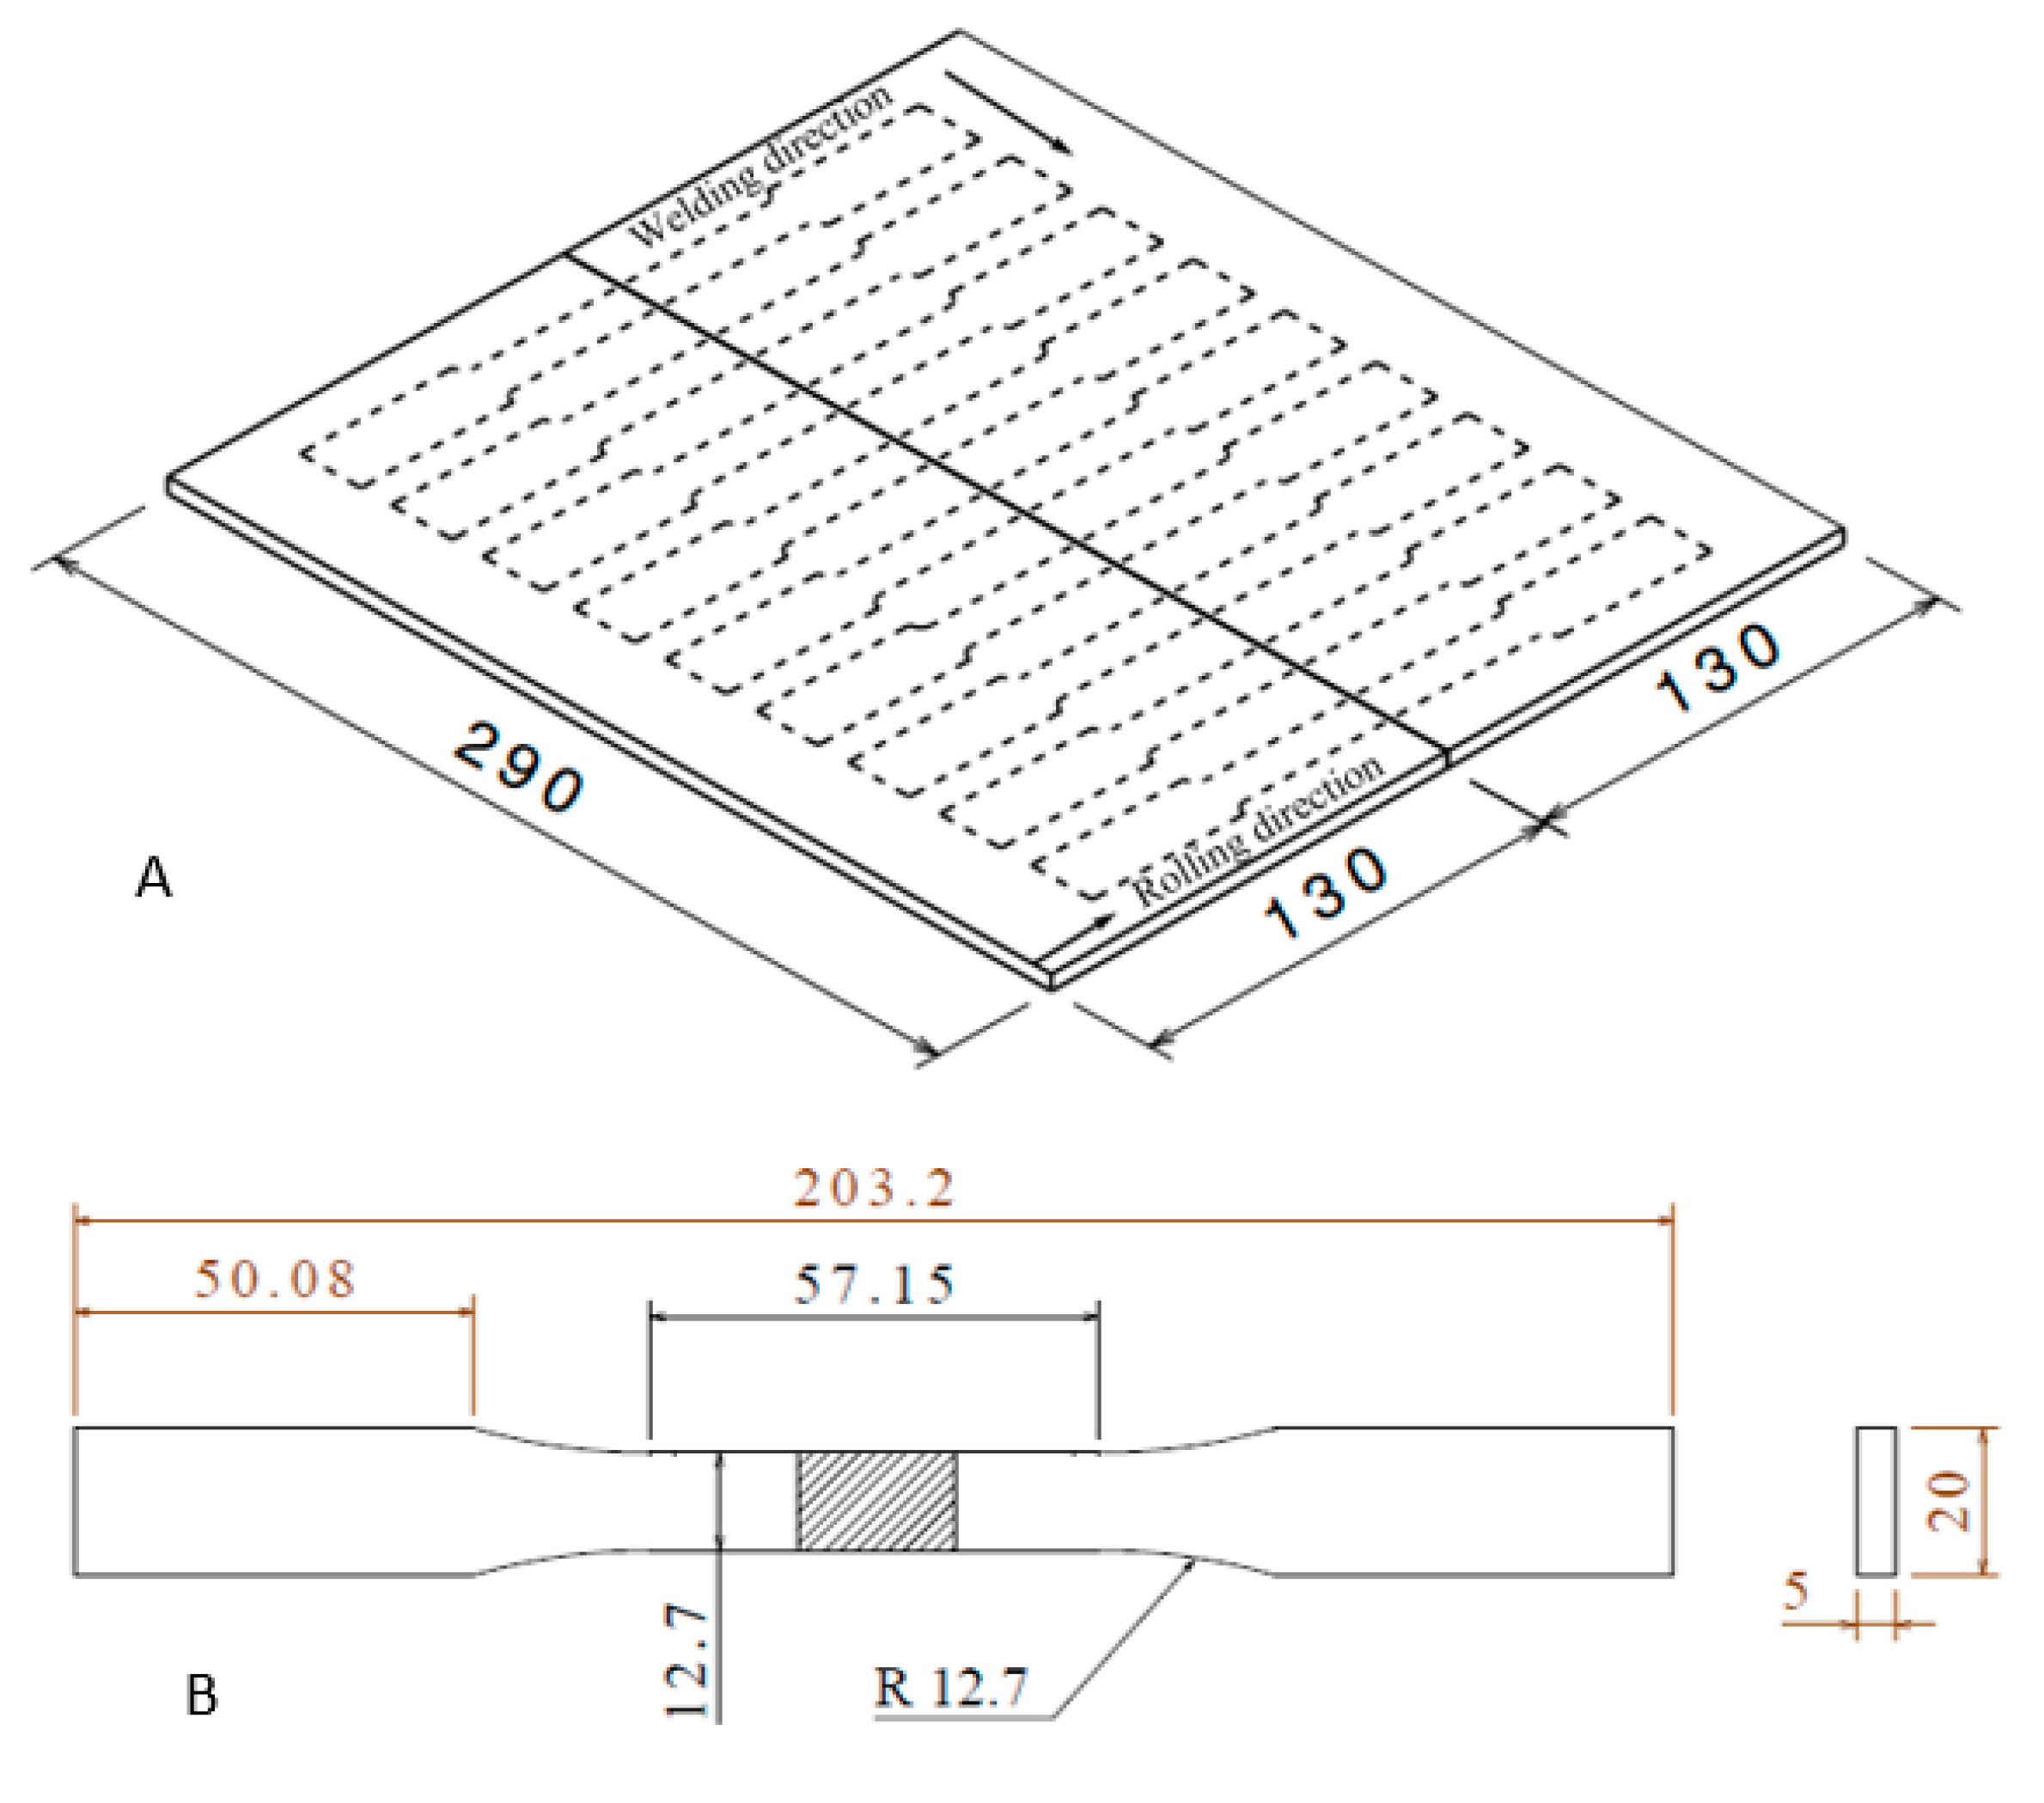
2.1. Sample Preparation
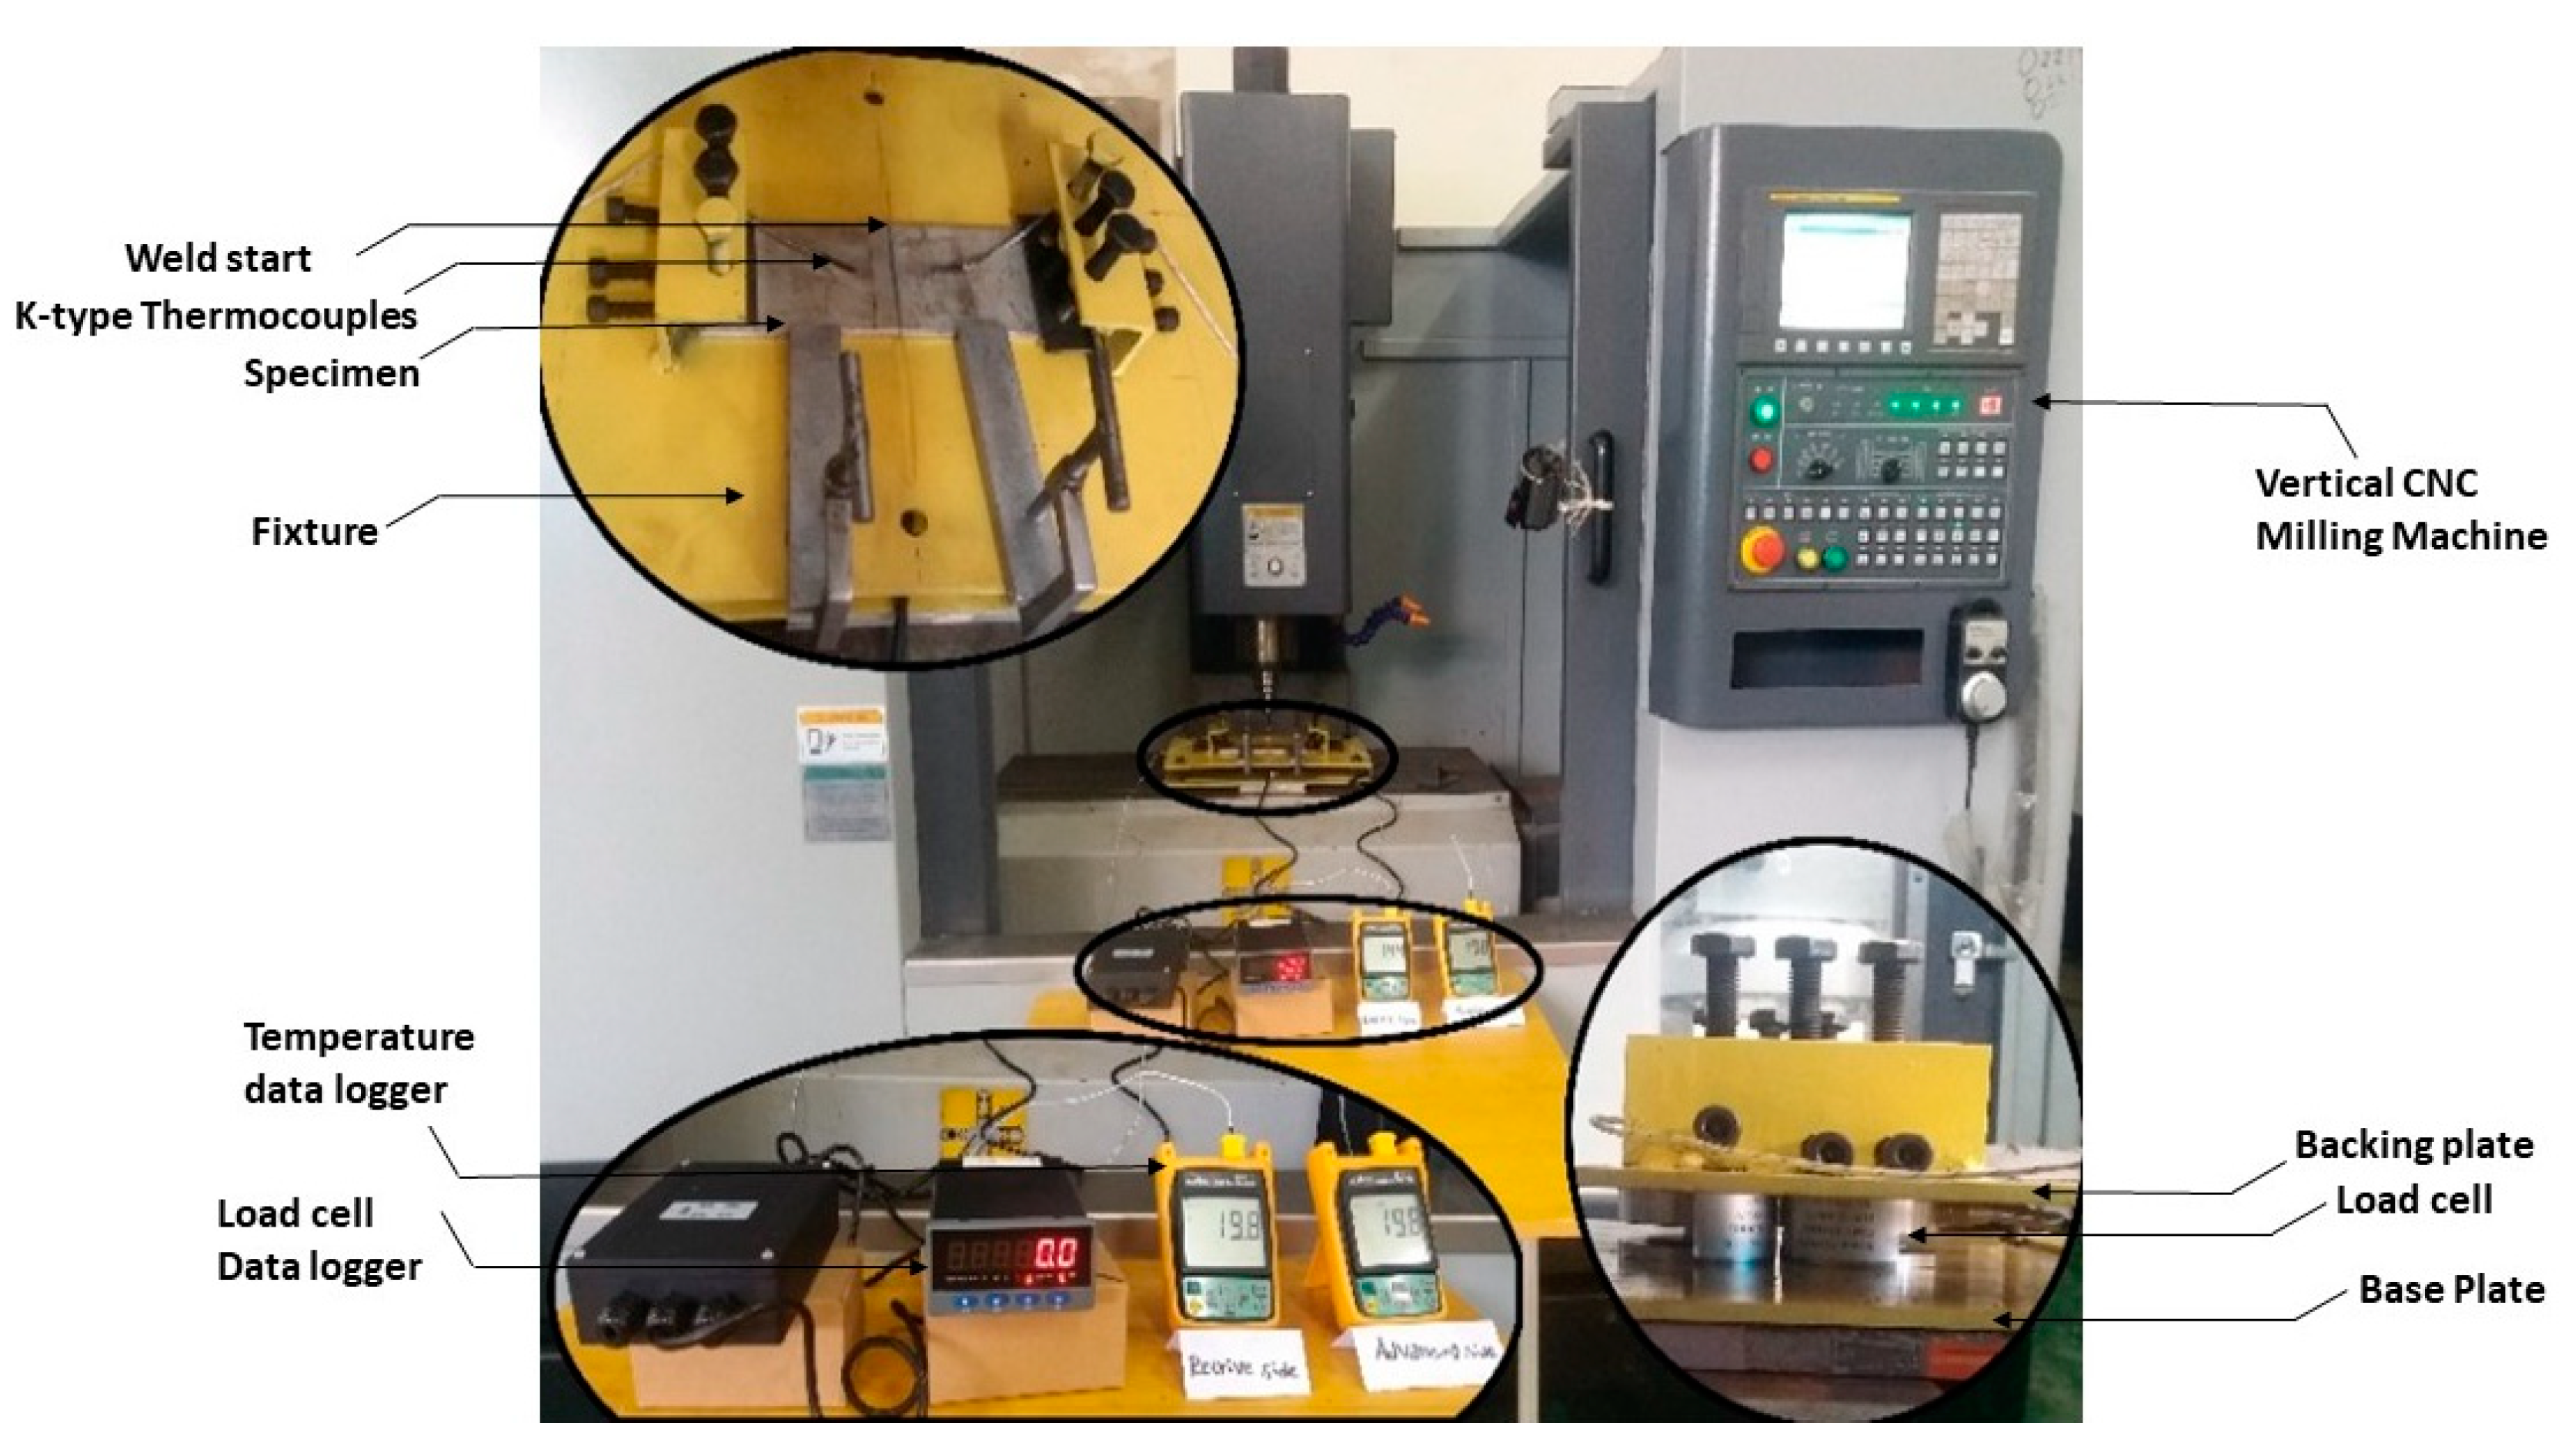
2.2. Experimental Setup
3. Results and Discussions
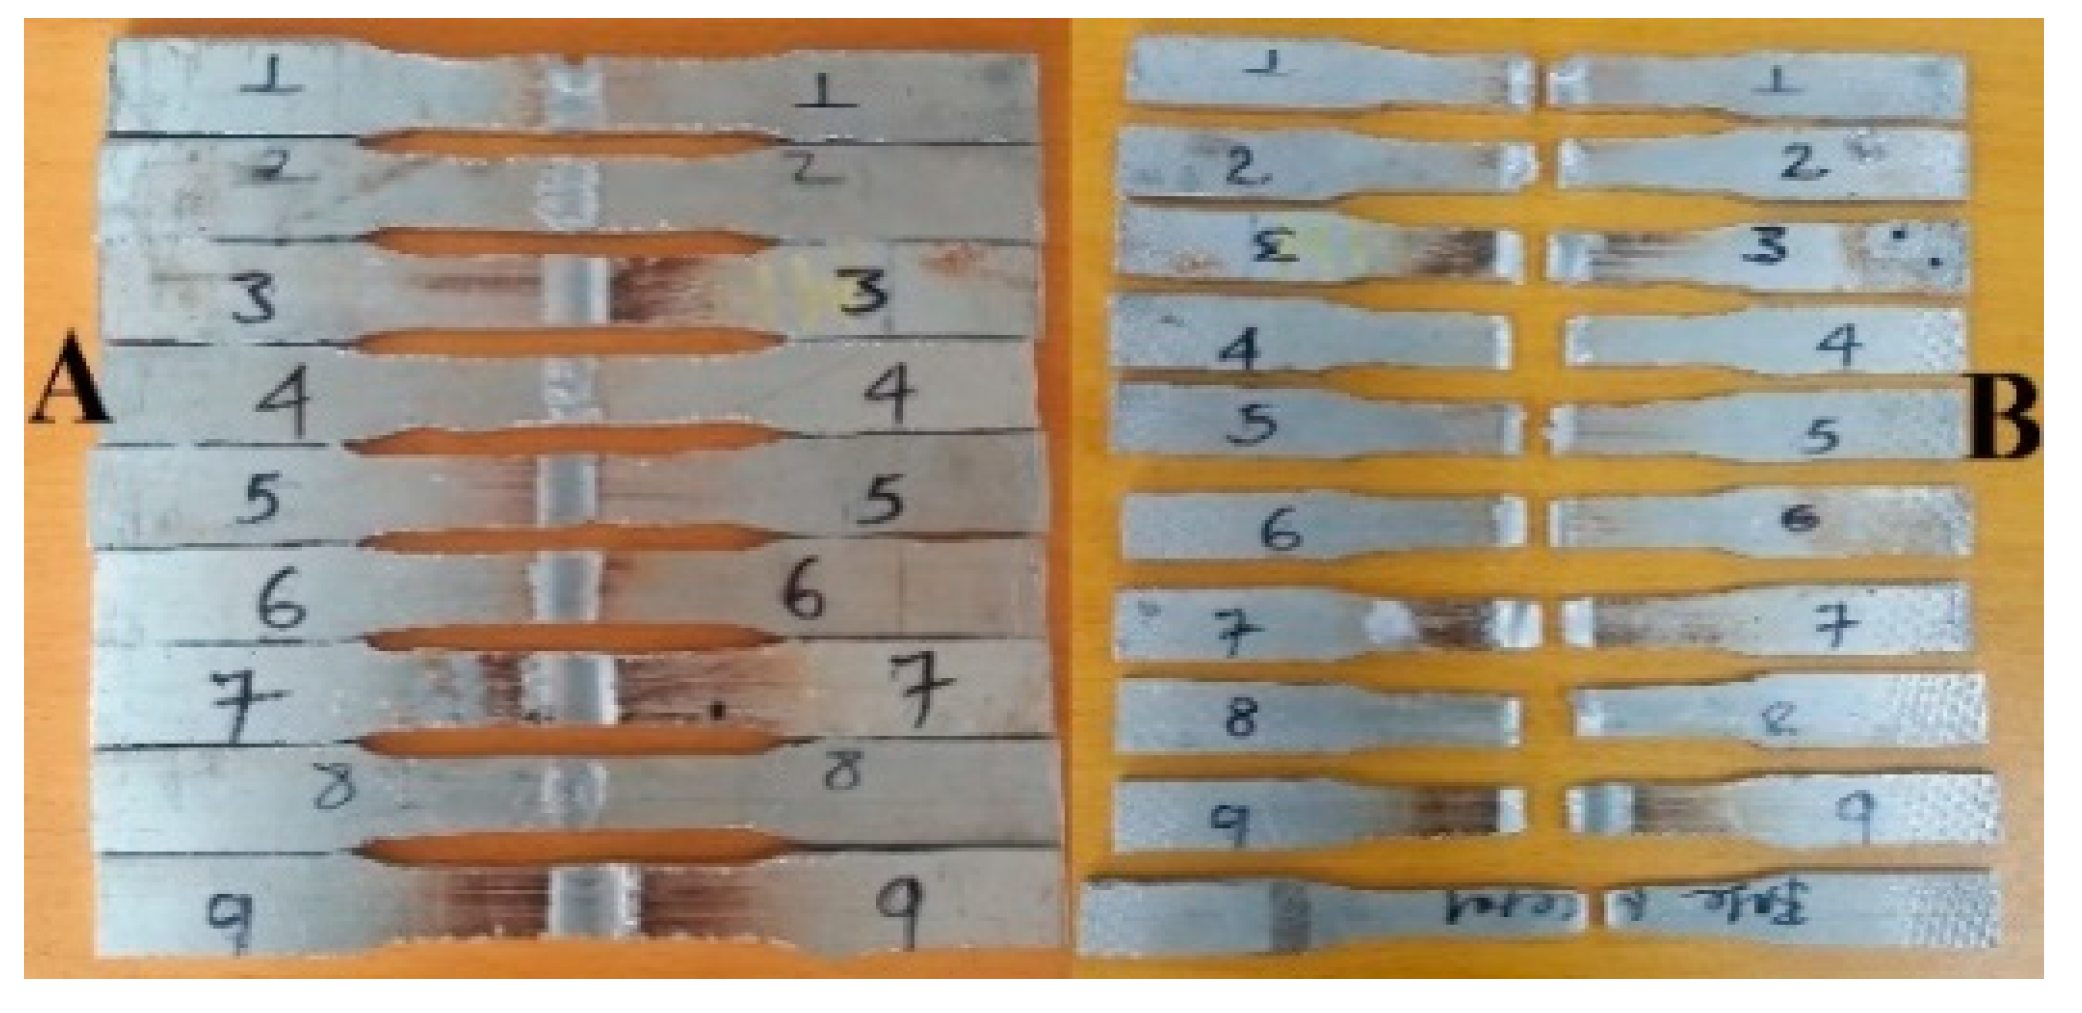
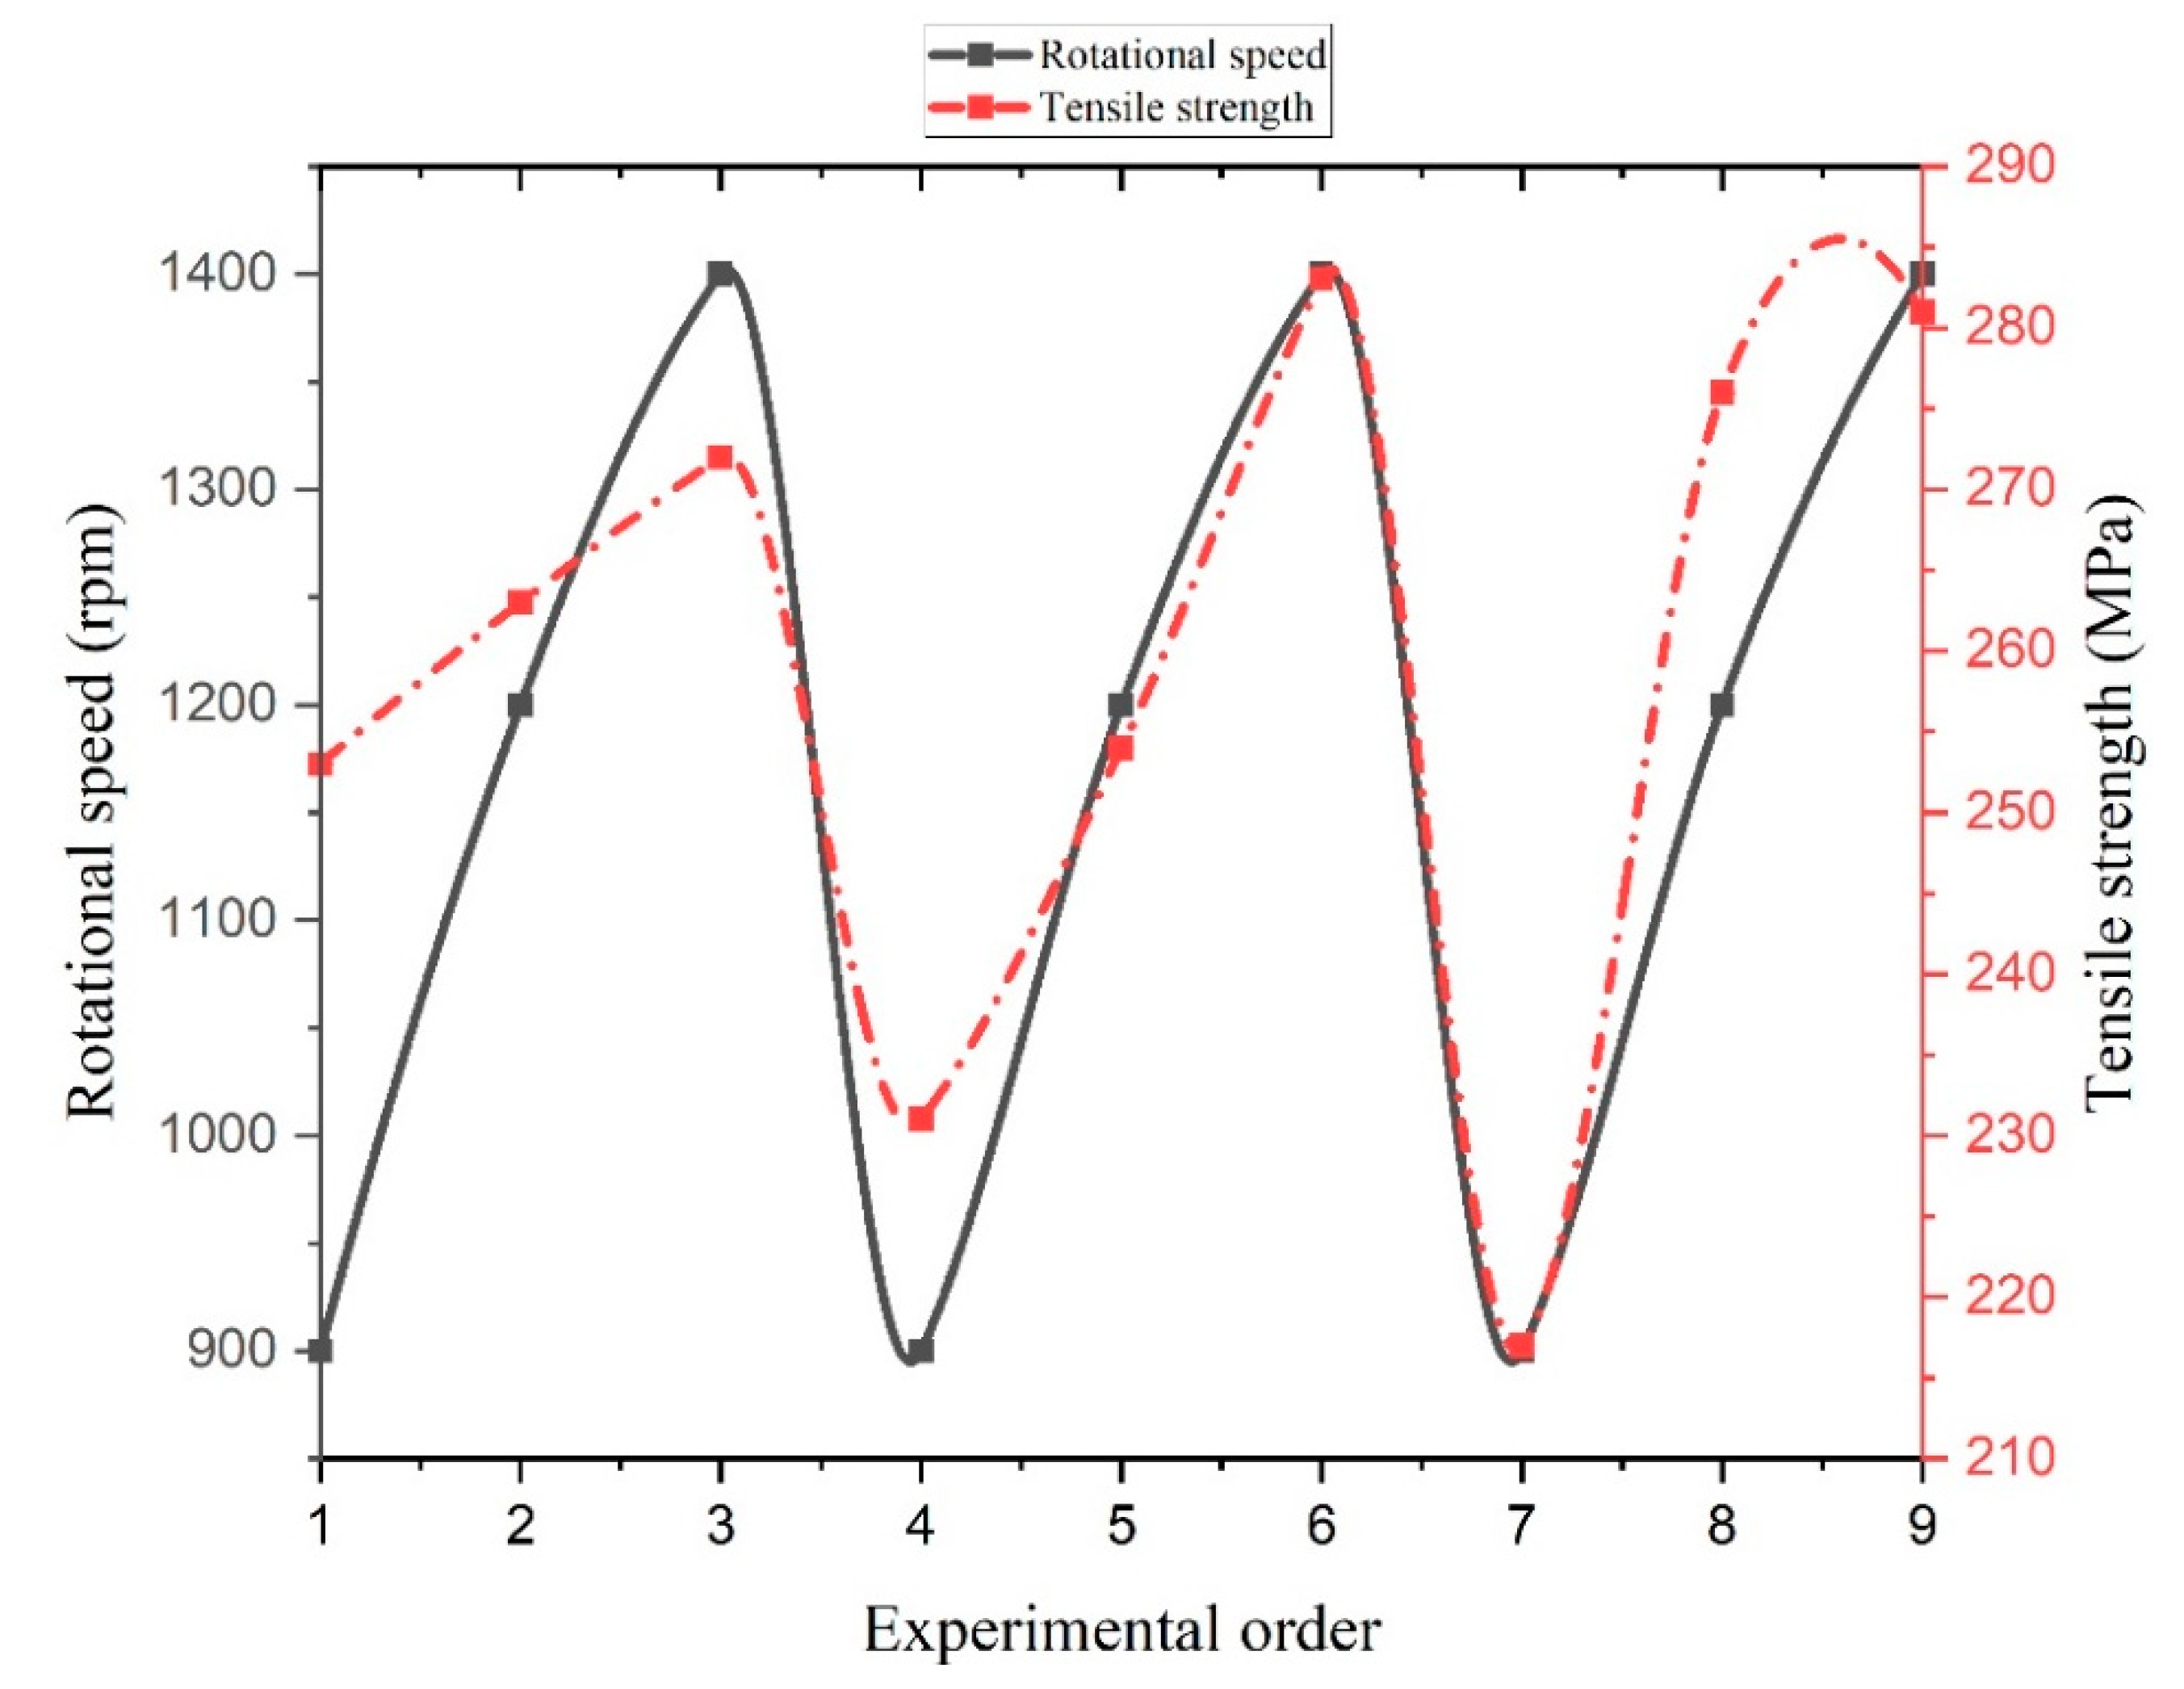
3.1. Tensile Strength
3.2. Hardness
3.3. Liquid Penetrant Test
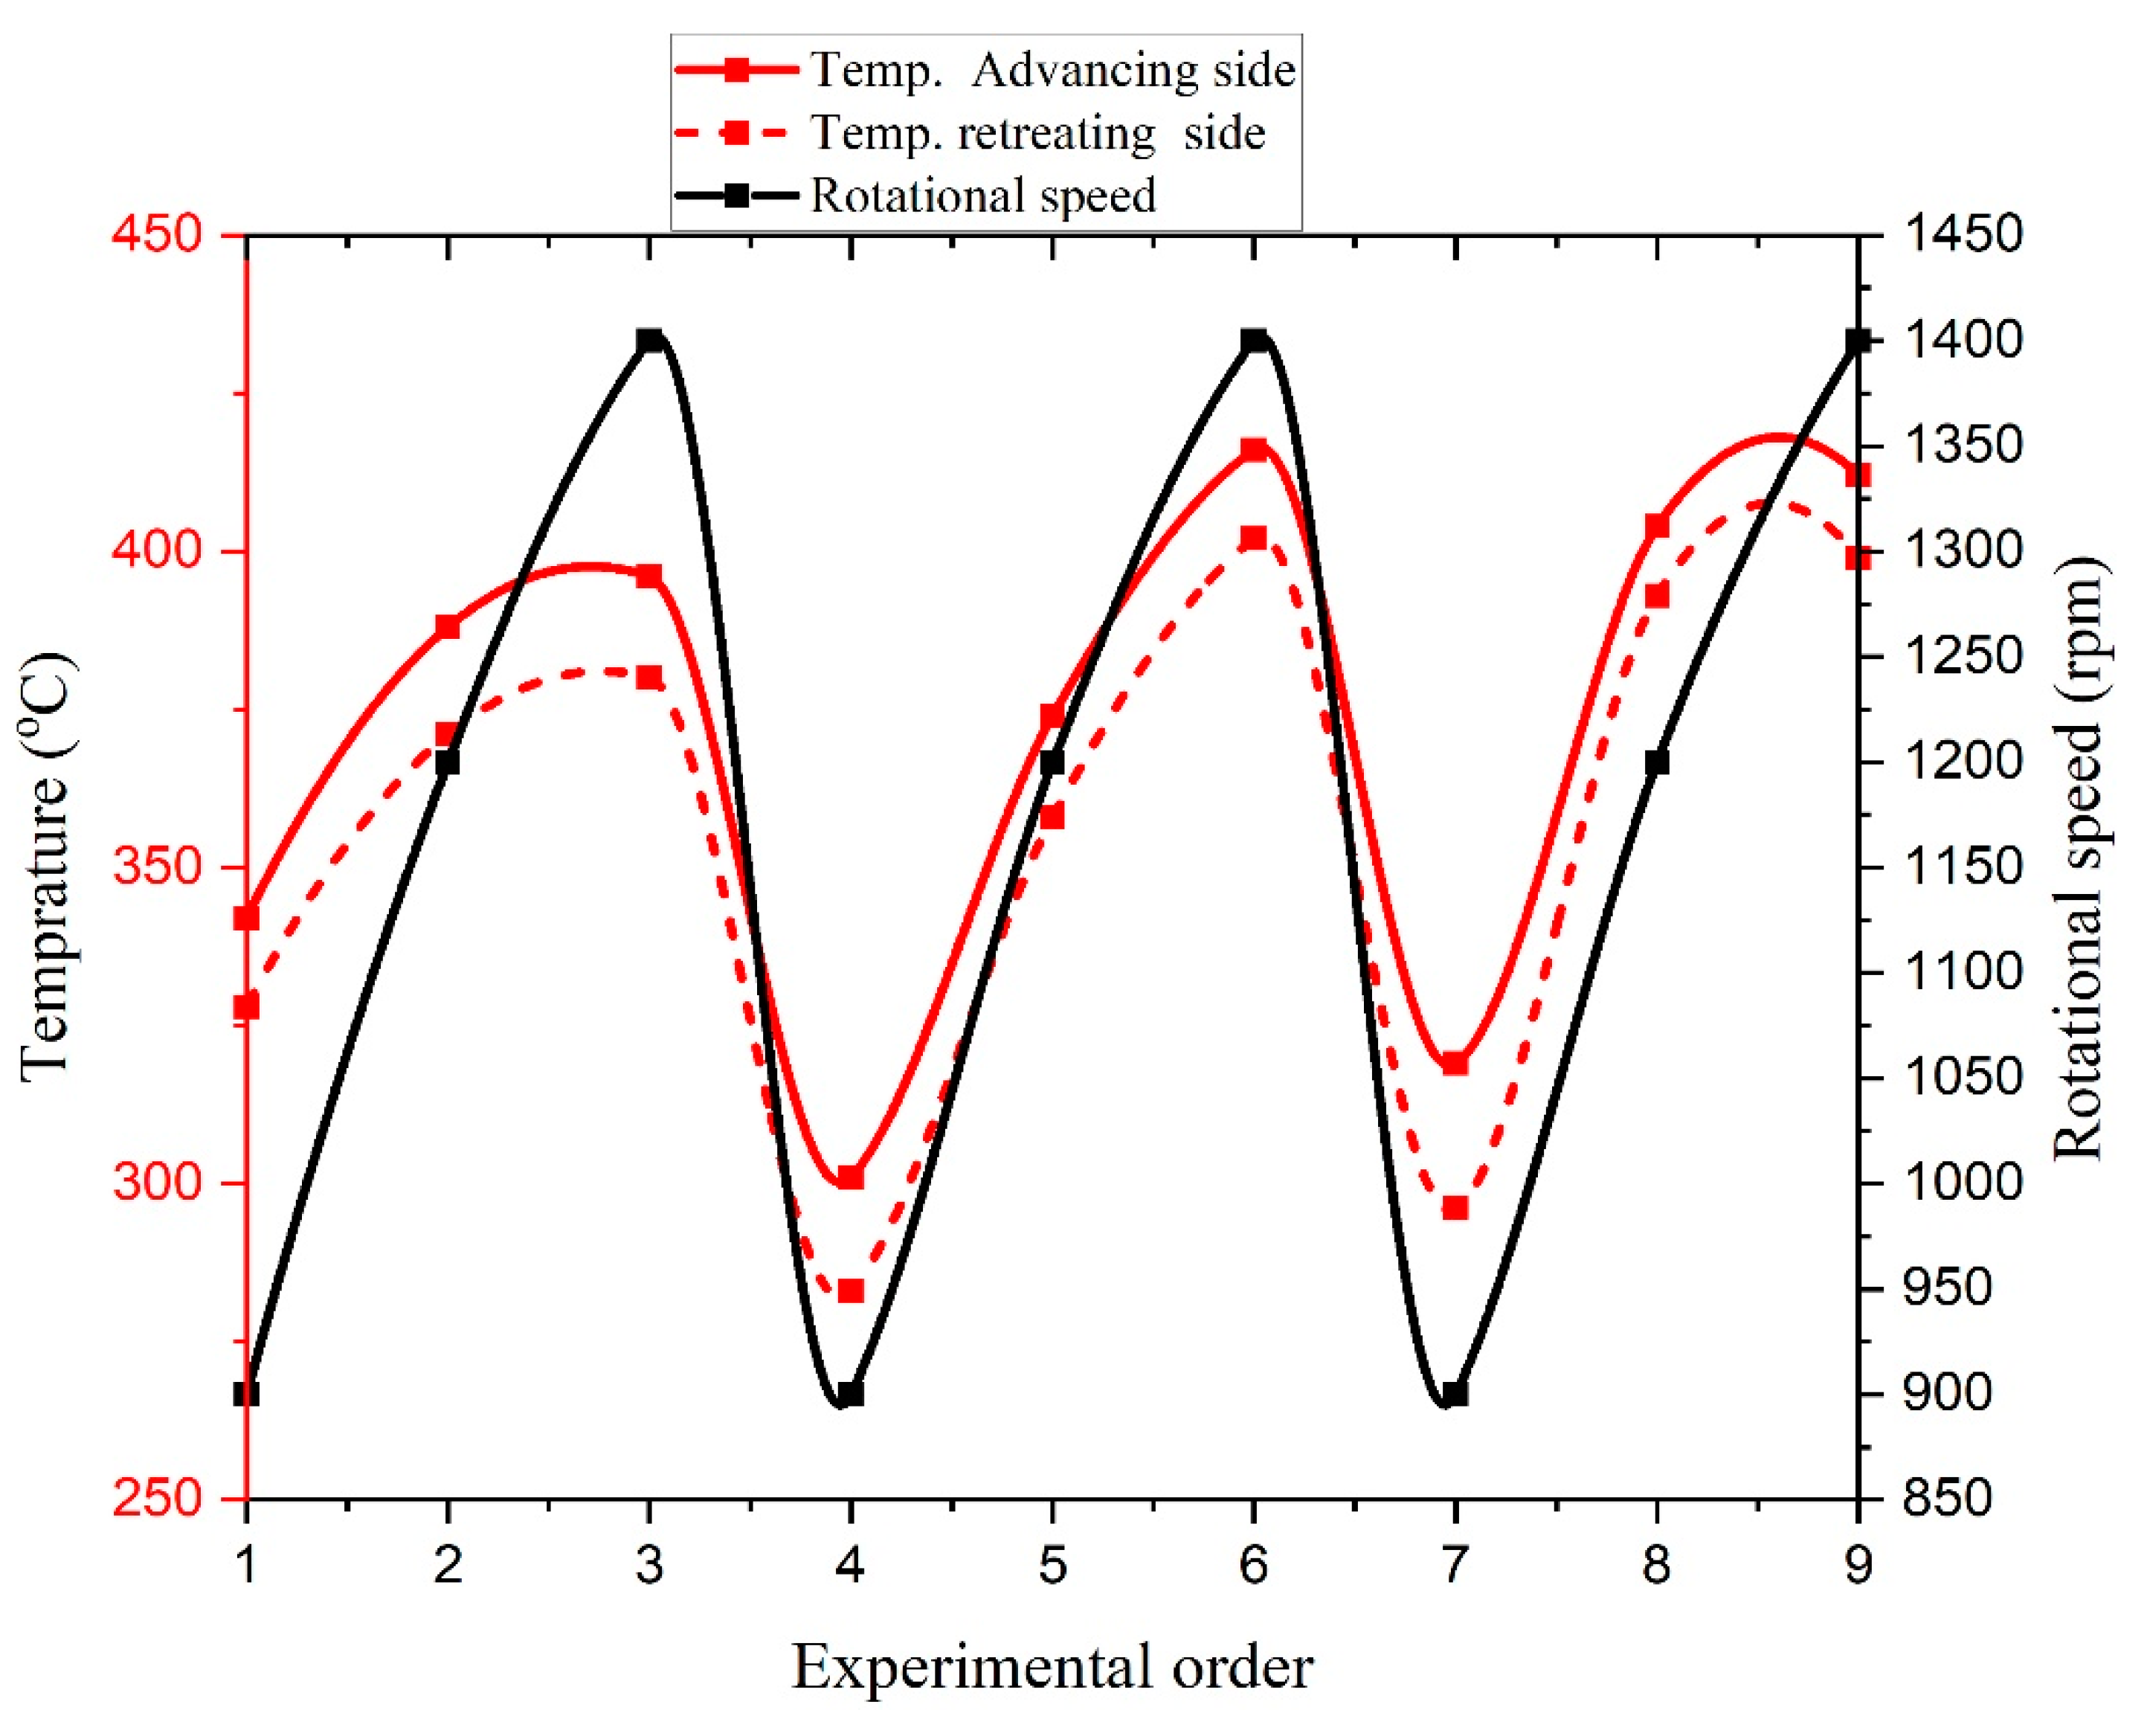
3.4. Effect of Welding Parameters on the Temperature Profiles
3.5. Welding Parameter Effects on the Joint Quality
3.6. Statistical Analysis
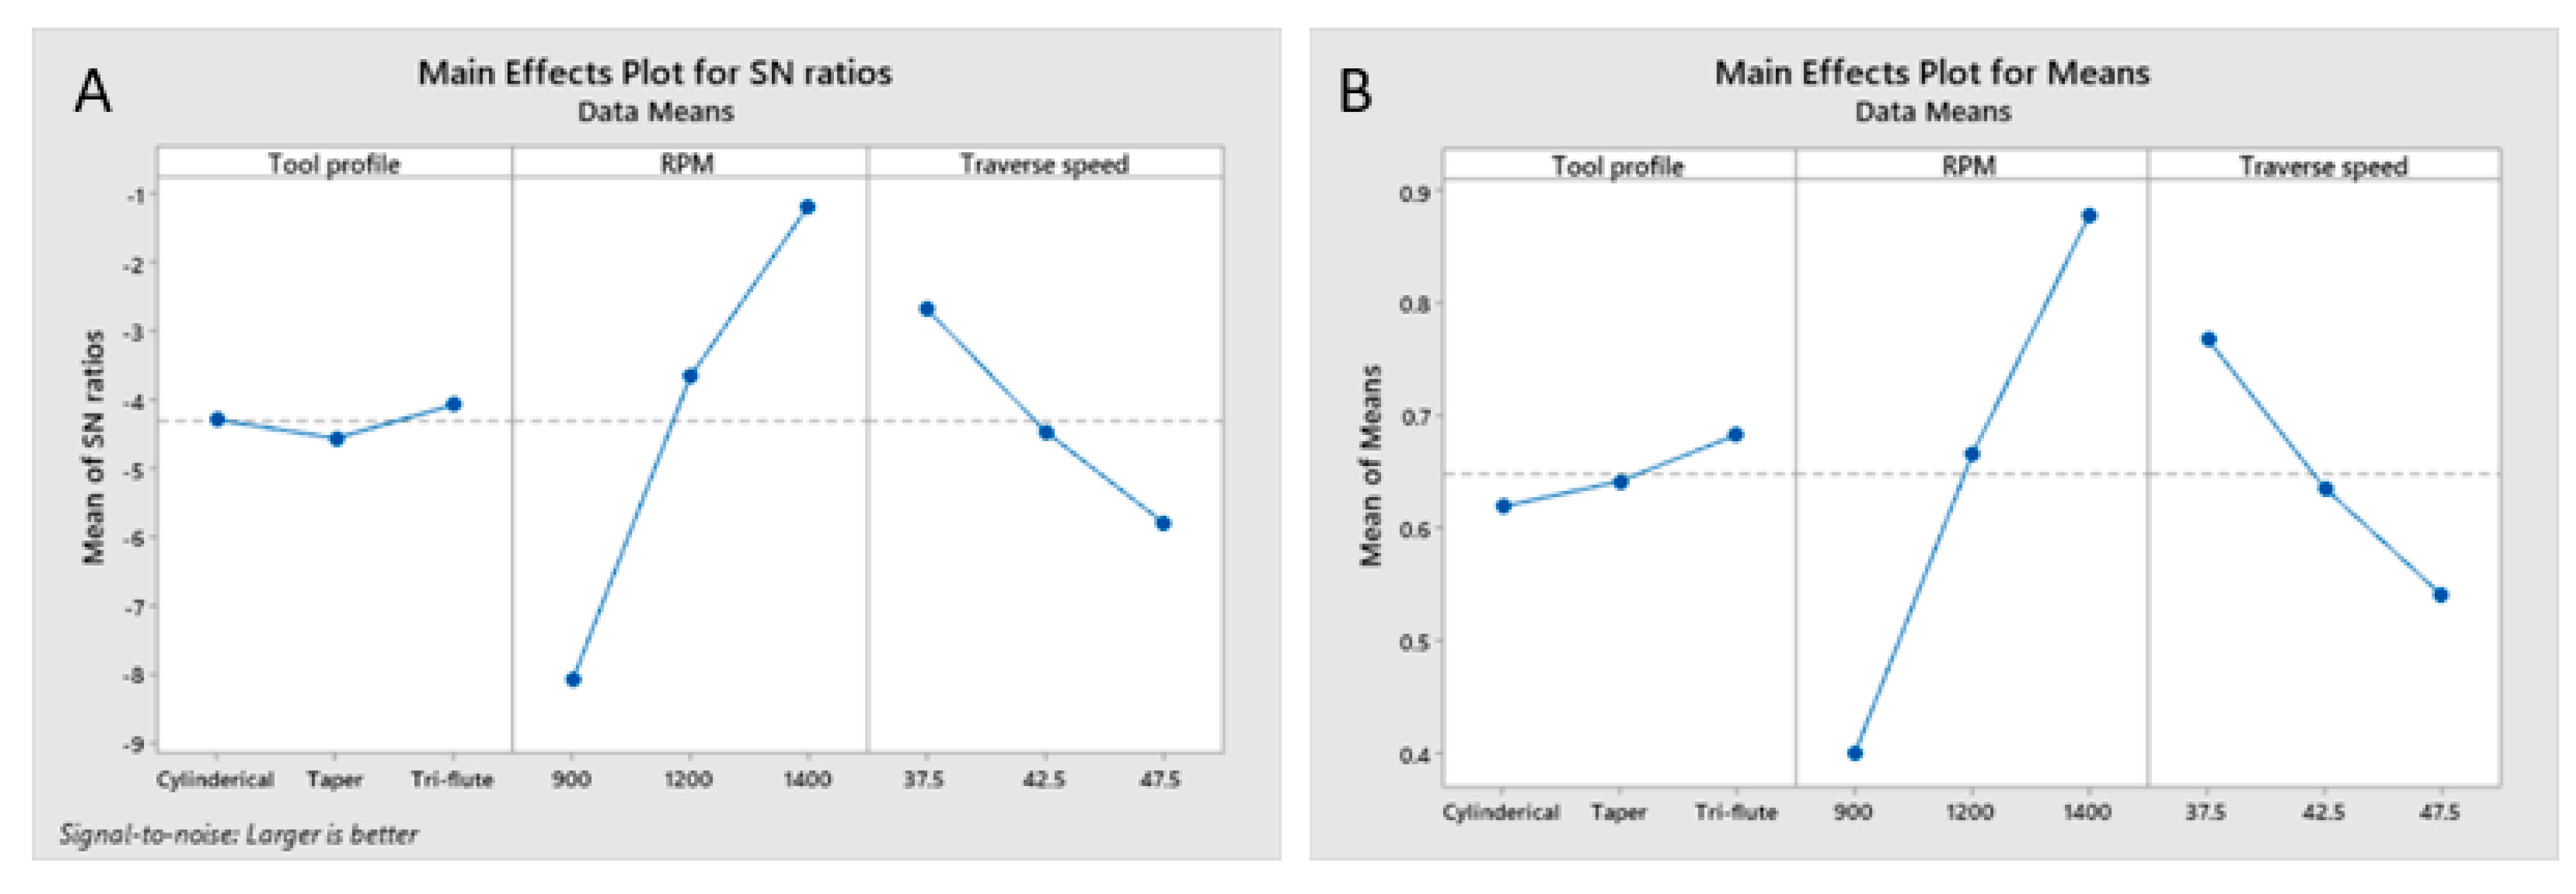
3.6.1. Taguchi Method
3.6.2. Grey Relation Analysis (GRA)
3.6.3. Data Normalization
3.6.4. Deviation Sequences and Grey Relational Coefficients
3.6.5. Principal Component Analysis
3.6.6. Calculation of Grey Relational Grades
3.7. Analysis of Experimental Data
3.8. Optimal Combination of Each Factor Level
3.9. Confirmation Experiment
- α = Risk = 0.01.
- fe = Error degree of freedom = 2.
- Ve = Error adjusted mean square = 0.000114.
- neff = Effective number of replications.
- R = Number of replications for confirmation experiment = 10.
- Tn = Total number of experiments = 9.
- Ts = the sum of the total degree of freedom of significant factors.
4. Influences of Significant Factors on Tensile and Hardness Strengths
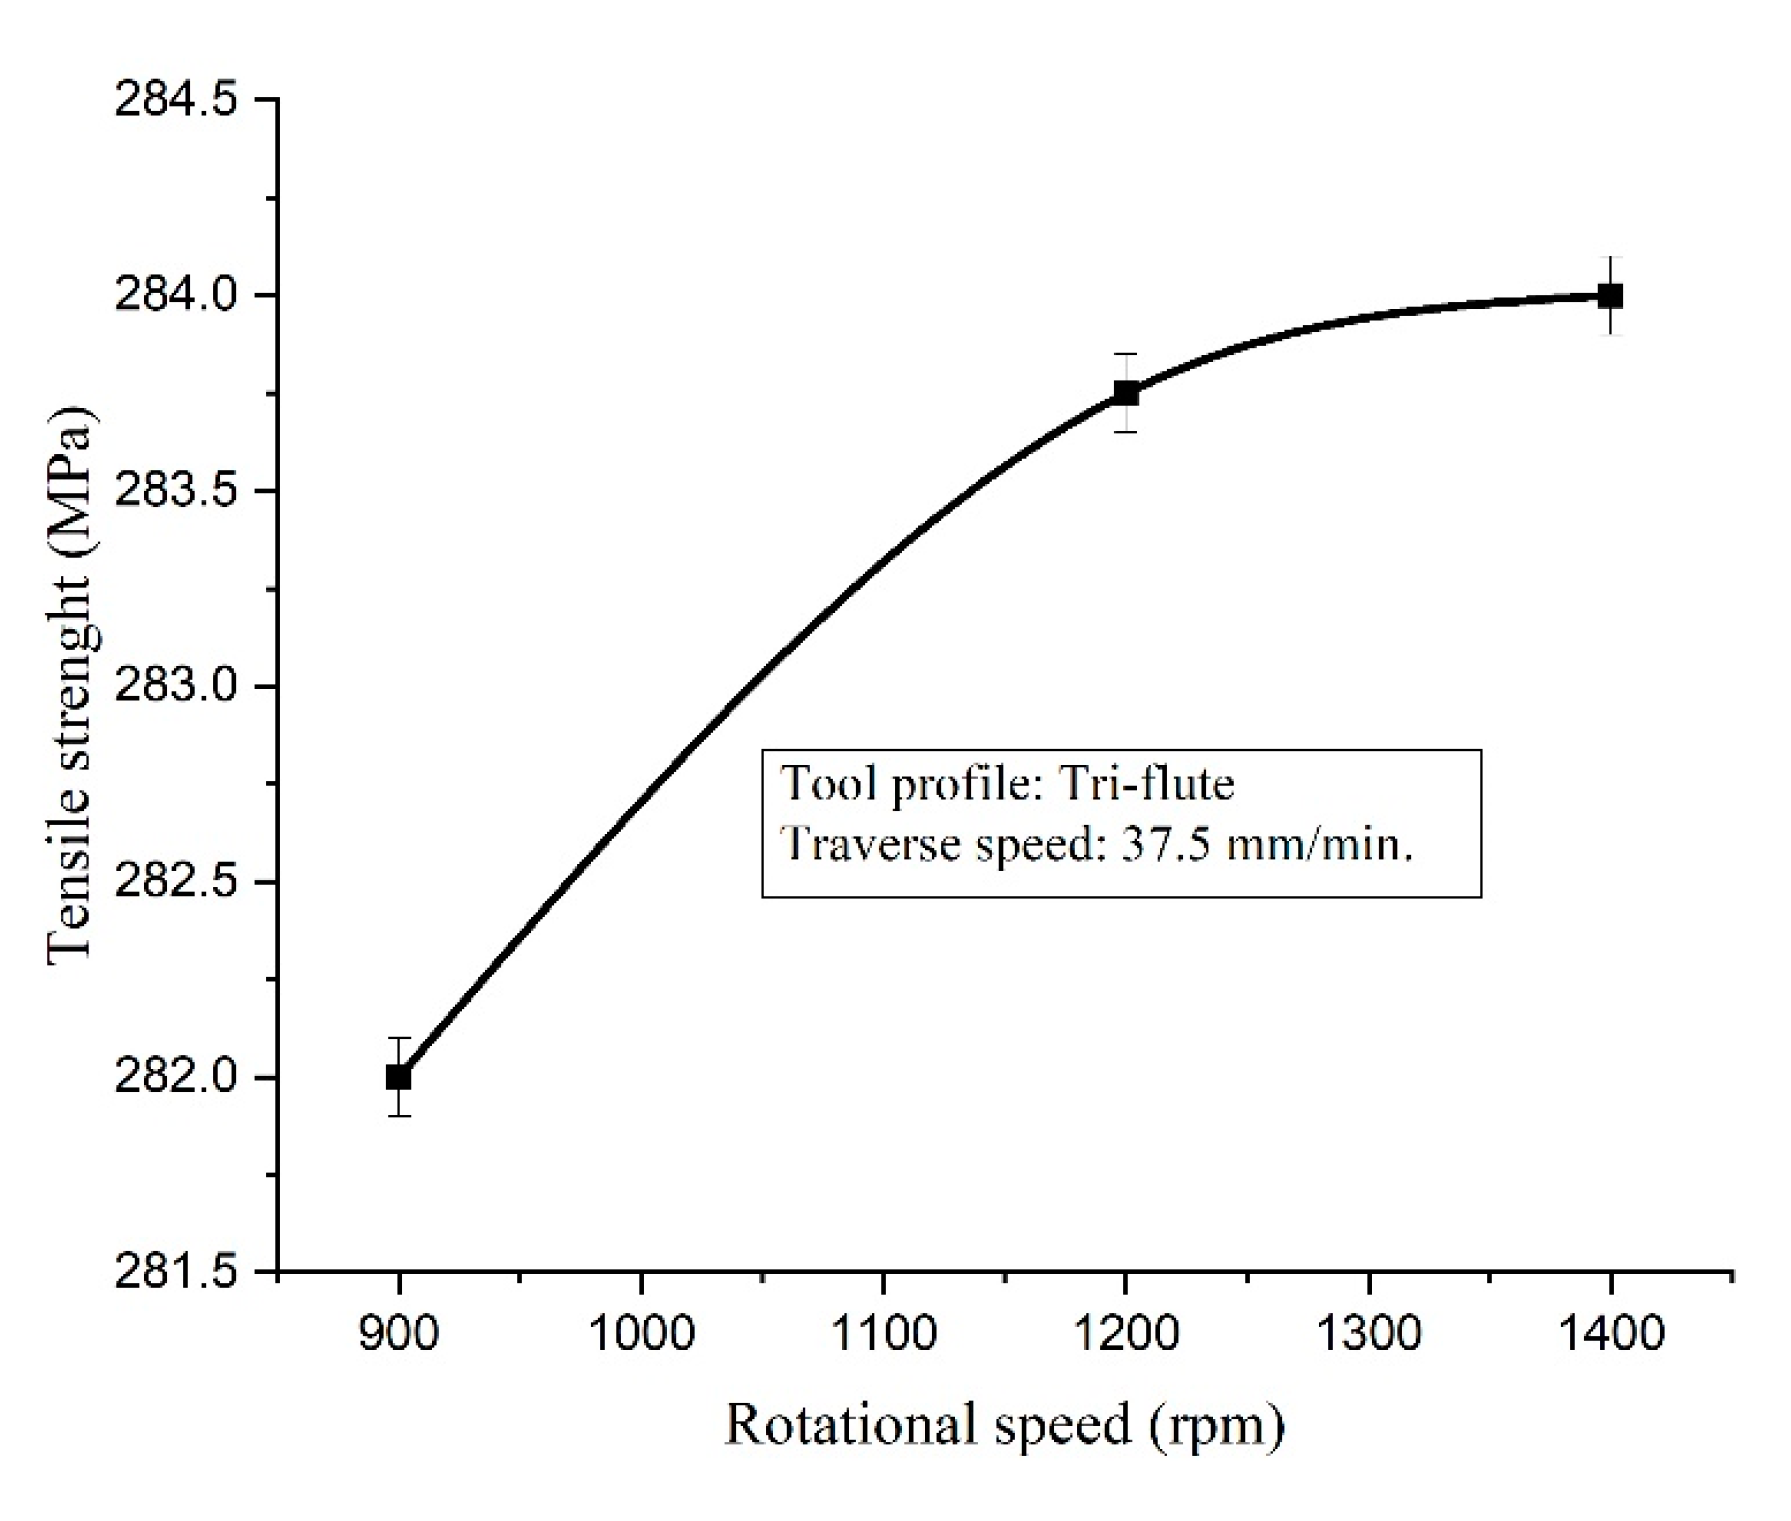
4.1. Influence of Rotational Speed of on Tensile and Hardness Strengths
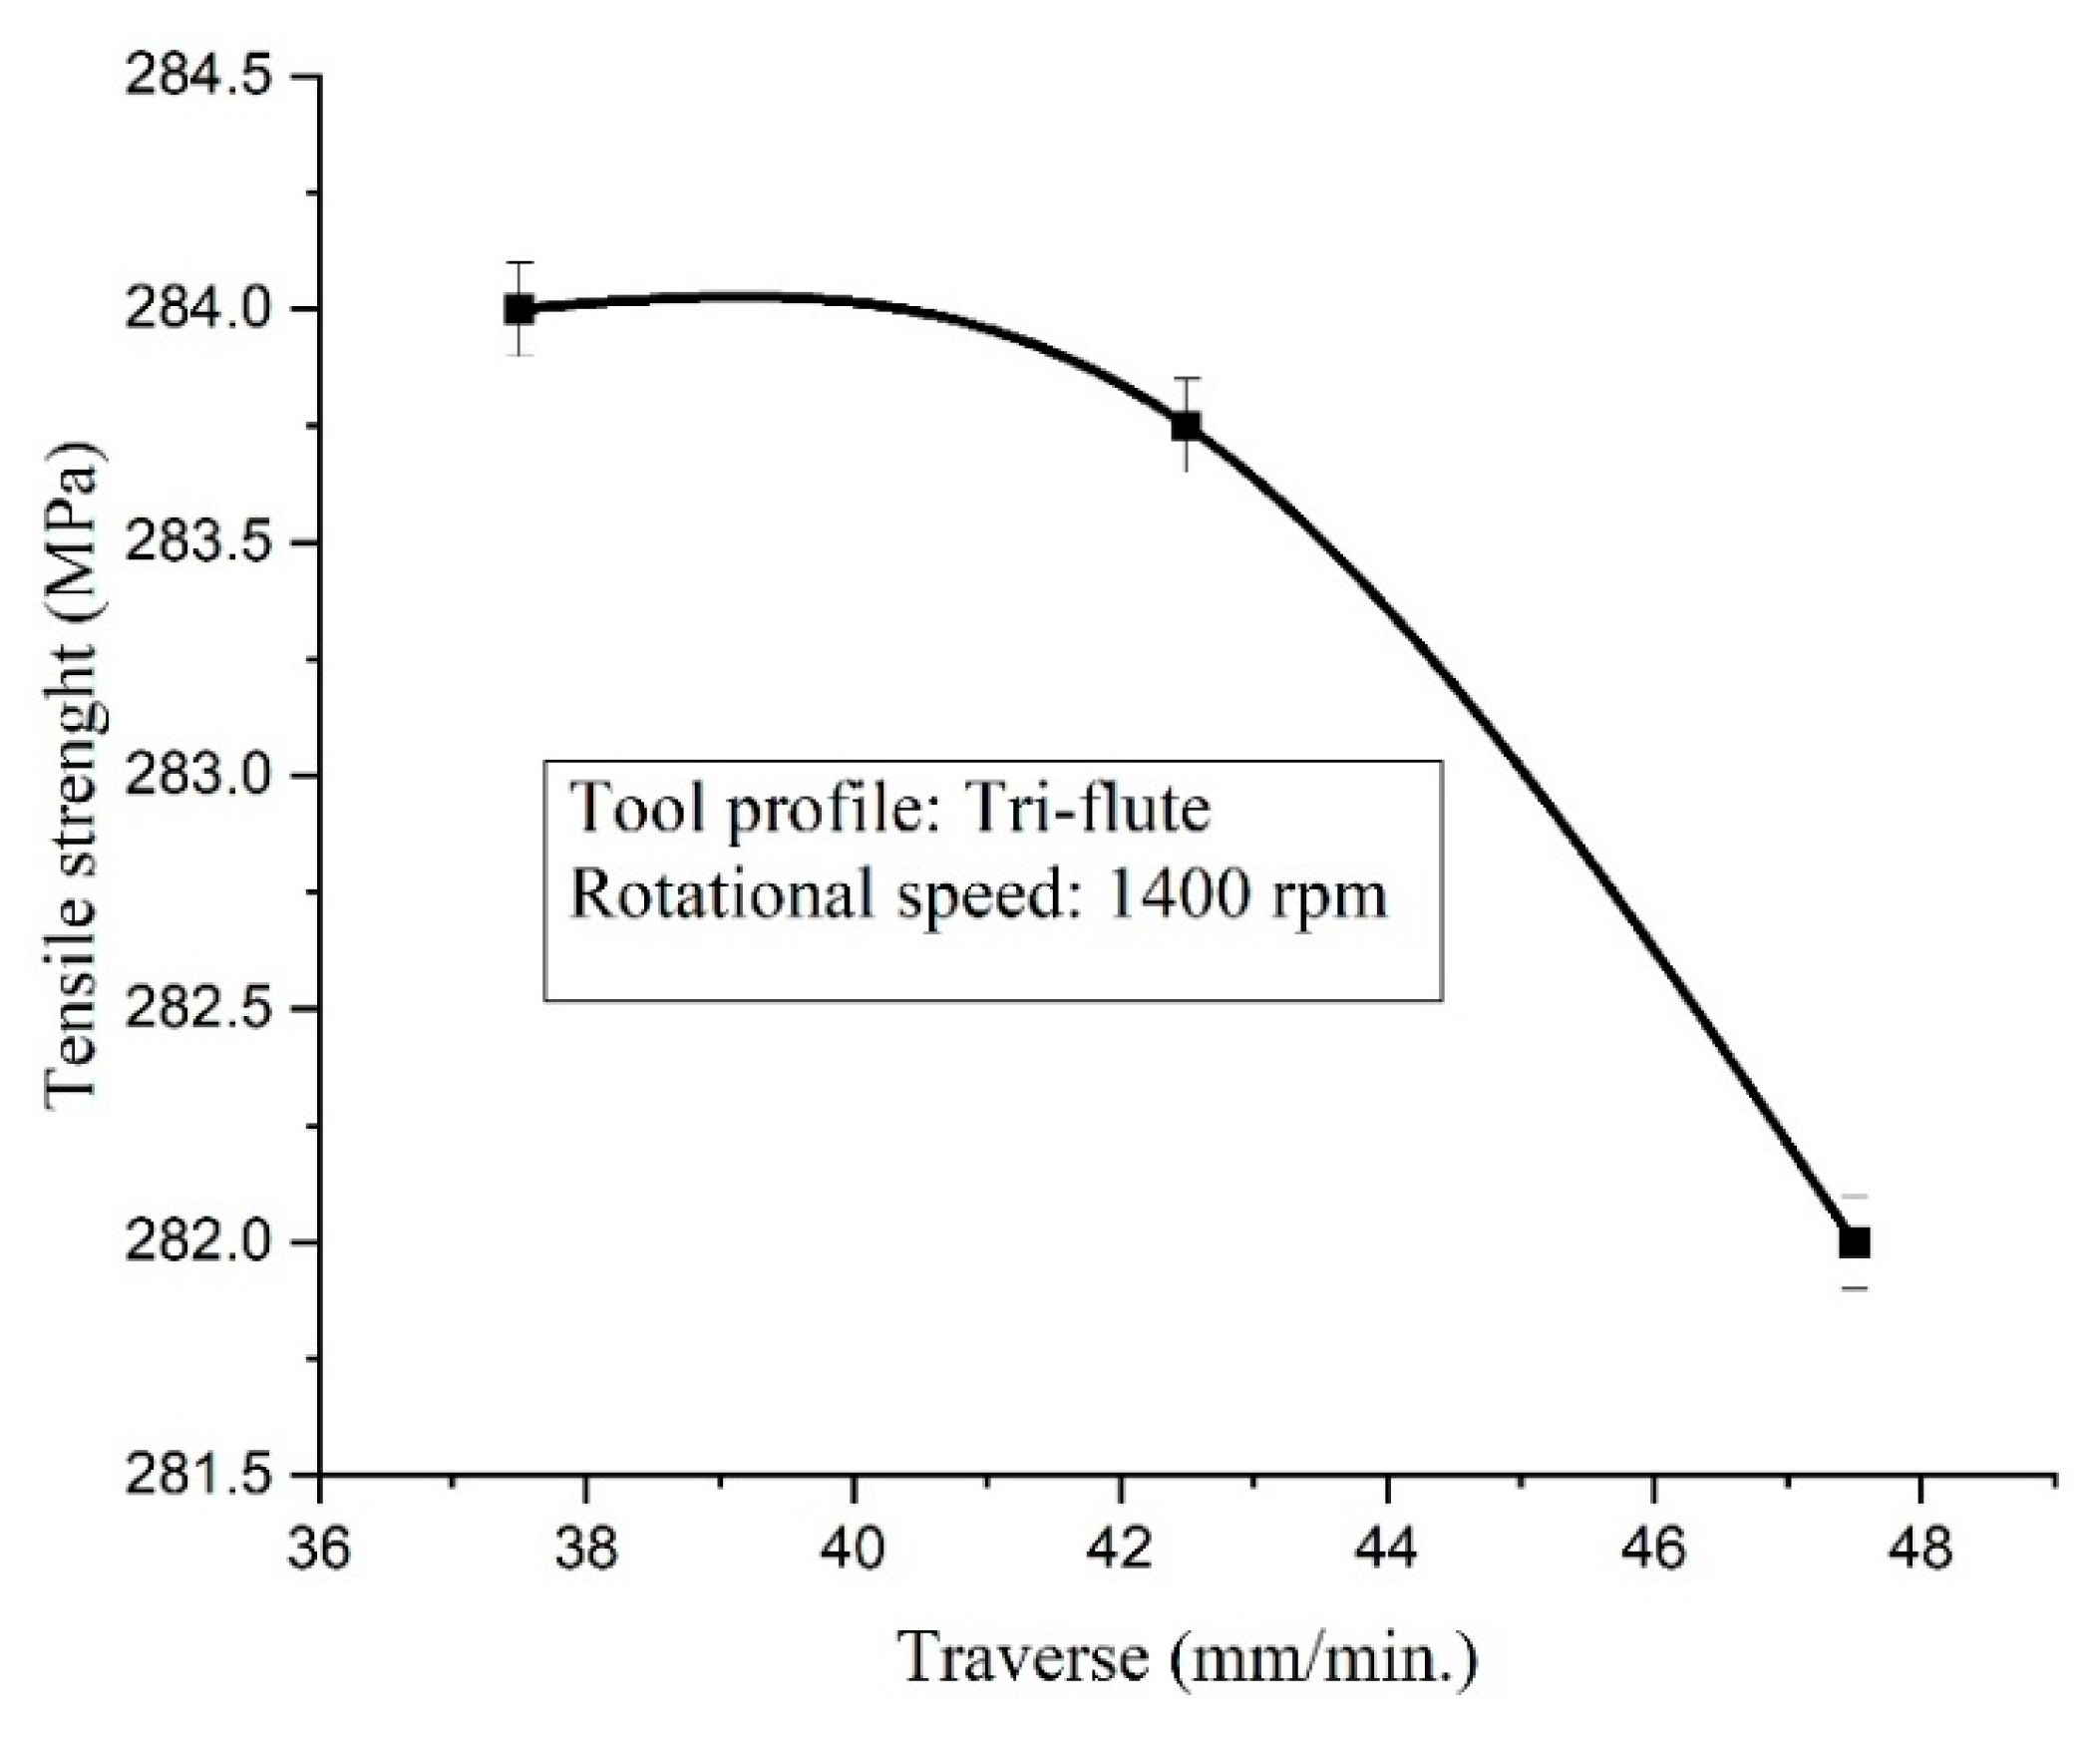
4.2. Influence of Traverse Speed of on Tensile and Hardness Strengths
5. Conclusions
- From the experimental outcome and analyses of variance, one can conclude that the rotational speed and traverse speeds are significant parameters:
- Significance shows a small change caused by the amount of this parameter will result in a diminished mechanical property of targeted quality criteria.
- Altering the value of significant controllable factors will influence the formation of defects.
- The highest hardness of 71.6 HR and tensile strength of 283 MPa was achieved at a parameter setting of the rotational speed of 1400 rpm, traverse speed of 37.5 mm/min, and tool shape of taper threaded pin. Similarly, the lowest hardness and tensile strength of 54.23 HR and 217 MPa respectively, were observed at a rotational speed of 900 rpm, traverse speed of 47.5 mm/min, and tri-flute threaded tools and, flash defect is found at the stir zone.
- The rotational speed and traverse speed are sources of welding temperature. If the rotational speed increased, the welding temperature also increased and gets a maximum hardness and tensile strength. Traverse speed is indirectly proportional to the rotational speed, and welding temperature. In addition, the maximum temperature was obtained at a tapered tool pin profile of 416 °C, which is (36.19%) less than the temperature of (652 °C) of the liquid of the base material.
- The advancing side gave higher temperatures than the retreating side, with the increment of rotational speed, and the temperature difference between the advancing and retreating side at the weld center varied from 11 °C to 23 °C.
- Based on the analysis of variance results, rpm has a greater effect, with an 80.33% contribution and the traverse speed effect has an 18.042% contribution.
- For this material, a combination parameter of the tapered threaded tool with a rotation speed of 1400 rpm and a traverse speed of 37.5 mm/min imparts a sound weld.
Author Contributions
Funding
Acknowledgments
Conflicts of Interest
References
- Elnabi, M.M.A.; Osman, T.A.E.; El Mokadem, A.E.; Elshalakany, A.B. Mechanical Properties and Microstructure of Dissimilar Friction Stir Welding of Pure Aluminum to Low Carbon Steel. Adv. J. Grad. Res. 2018, 4, 47–58. [Google Scholar] [CrossRef]
- Salih, O.S.; Neate, N.; Ou, H.; Sun, W. Influence of process parameters on the microstructural evolution and mechanical characterisations of friction stir welded Al-Mg-Si alloy. J. Mater. Process. Technol. 2020, 275, 116366. [Google Scholar] [CrossRef]
- Jaiganesh, V.; Sevvel, P. Impact of process parameters during friction stir welding of AZ80A Mg alloy. Sci. Technol. Weld. Join. 2015, 21, 1–8. [Google Scholar] [CrossRef]
- Kundu, J.; Ghangas, G.; Rattan, N.; Kumar, M. Friction Stir Welding: Merits over other Joining Processes. Int. J. Curr. Eng. Technol. 2017, 7, 1175–1177. [Google Scholar]
- Chaudhary, K. A Review on Advance Welding Processes. Int. J. Eng. Tech. 2017, 3, 86–96. [Google Scholar]
- Shinde, G.; Gajghate, S.; Dabeer, P.; Seemikeri, C. Low cost friction stir welding: A review. J. Mater. Today Proc. 2017, 4, 8901–8910. [Google Scholar] [CrossRef]
- Patel, V.; Li, W.; Wang, G.; Wang, F.; Vairis, A.; Niu, P. Friction Stir Welding of Dissimilar Aluminum Alloy Combinations: State-of-the-Art. J. Met. 2019, 9, 270. [Google Scholar] [CrossRef]
- Shirazi, H.; Kheirandish, S.; Pouraliakbar, H. Employing hooking and effective sheet thickness to achieve optimum failure load in lap joints of friction stir welded AA5456 aluminum. J. Theor. Appl. Fract. Mech. 2019. [Google Scholar] [CrossRef]
- Fuse, K.; Badheka, V. Bobbin tool friction stir welding: A review. Sci. Technol. Weld. Join. 2018. [Google Scholar] [CrossRef]
- Magalhães, V.M.; Leitao, C.; Rodrigues, D.M. Friction stir welding industrialisation and research status. Sci. Technol. Weld. Join. 2017. [Google Scholar] [CrossRef]
- Schubert, E.; Klassen, M.; Zerner, I.; Walz, C.; Sepold, G. Light-weight structures produced by laser beam joining for future applications in automobile and aerospace industry. J. Mater. Process. Technol. 2001, 115, 2–8. [Google Scholar] [CrossRef]
- Ajri, A.; Rohatgi, N.; Shin, Y.C. Analysis of defect formation mechanisms and their effects on weld strength during friction stir welding of Al 6061-T6 via experiments and finite element modeling. Int. J. Adv. Manuf. Technol. 2020, 107, 4621–4635. [Google Scholar] [CrossRef]
- Gibson, B.T.; Lammlein, D.; Prater, T.; Longhurst, W.R.; Cox, C.D.; Ballun, M.; Dharmaraj, K.J.; Cook, G.E.; Strauss, A.M. Friction stir welding: Process, automation, and control. J. Manuf. Process. 2014, 16, 56–73. [Google Scholar] [CrossRef]
- Patel, S.; Krunal, M.; Mirani, M. A Review—Friction Stir Welding of AA6061 Aluminum Alloy using Drilling Machine. IJLTEMAS 2014, 3, 33–37. [Google Scholar]
- Nourani, M.; Milani, A.S.; Yannacopoulos, S. Taguchi optimization of process parameters in friction stir welding of 6061 aluminum alloy: A review and case study. J. Eng. 2011, 3, 144–155. [Google Scholar] [CrossRef]
- Prasath, S.; Vijayan, S.; Rao, S.K. Optimization of friction stir welding process parameters for joining ZM 21 to AZ 31 of dissimilar magnesium alloys using Taguchi technique. Metall. Ital. 2016, 5, 25–33. [Google Scholar]
- Ugender, S. Influence of tool pin profile and rotational speed on the formation of friction stir welding zone in AZ31 magnesium alloy. J. Magnes. Alloy 2018, 6, 205–213. [Google Scholar] [CrossRef]
- Ugender, S.; Jayakrishna, S.; Francis, E.D. Influence of Welding Speed, Axial Force and Rotational Speed on The Formation of Friction Stir Welding zone in AZ31 Magnesium Alloy. Int. J. Mech. Eng. Technol. 2018, 9, 845–857. [Google Scholar]
- Ko, Y.-J.; Lee, K.-J.; Baik, K.-H. Effect of tool rotational speed on mechanical properties and microstructure of friction stir welding joints within Ti-6Al-4V alloy sheets. J. Adv. Mech. Eng. 2017, 9, 1–7. [Google Scholar] [CrossRef]
- Barlas, Z. The Influence of Tool Tilt Angle on 1050 Aluminum Lap Joint in Friction Stir Welding Process. Acta Phys. Pol. A 2017, 132, 679–681. [Google Scholar] [CrossRef]
- Mohanty, H.K.; Mahapatra, M.M.; Kumar, P.; Biswas, P.; Mandal, N.R. Effect of tool shoulder and pin probe profiles on friction stirred aluminum welds—A comparative study. J. Mar. Sci. Appl. 2012, 11, 200–207. [Google Scholar] [CrossRef]
- Moradi, M.M.; Aval, H.J.; Jamaati, R. Effect of tool pin geometry and weld pass number on microstructural, natural aging and mechanical behaviour of SiC-incorporated dissimilar friction-stir-welded aluminium alloys. Indian Acad. Sci. 2019, 44, 1–9. [Google Scholar] [CrossRef]
- Khan, N.Z.; Siddiquee, A.N.; Khan, Z.A. Friction Stir Welding: Dissimilar Aluminium Alloys; CRC Press: Boca Raton, FL, USA, 2017. [Google Scholar]
- Soni, N.; Chandrashekhar, S.; Kumar, A.; Chary, V. Defects Formation during Friction Stir Welding: A Review. Int. J. Eng. Manag. Res. 2017, 7, 121–125. [Google Scholar]
- Materials ASoT: Standard Test Methods for Tension Testing of Metallic Materials1; ASME Designation E 8–04; ASME: West Conshohocken, PA, USA, 2004; pp. 1–24.
- Chand, A.; Bunyan, J. Application of Taguchi Technique for Friction Stir Welding of Aluminum Alloy AA6061. Int. J. Eng. Res. Technol. 2013, 2, 409–413. [Google Scholar]
- Syed Ahamed, R.J.; Shilpa, P. A Literature Review on Aluminium-7075 Metal Matrix Composites. IRJET 2019, 6, 1384–1389. [Google Scholar]
- Meilinger, Á.; Török, I. The importance of friction stir welding tool. Prod. Process. Syst. 2013, 6, 25–34. [Google Scholar]
- Ramnath, B.V.; Elanchezhian, C.; Rajesh, S.; Prakash, S.J.; Kumaar, B.M.; Rajeshkannan, K. Design and Development of Milling Fixture for Friction Stir Welding. Mater. Today Proc. 2018, 5, 1832–1838. [Google Scholar] [CrossRef]
- Abdul Hamid, D.; Ismail, A.; Afendi, M.; Zainuddin, M.J. The Effect of Pin Size on Friction Stir Welded AA5083 Plate Lap Joint. In Proceedings of the International Conference on Production, Automobiles and Mechanical Engineering, Kuala Lumpur, Malaysia, 13–14 May 2015; pp. 87–92. [Google Scholar]
- Marashi, J.; Yakushina, E.; Xirouchakis, P.; Zante, R.; Foster, J. An evaluation of H13 tool steel deformation in hot forging conditions. J. Mater. Process. Technol. 2017, 246, 276–284. [Google Scholar] [CrossRef]
- Chiteka, K. Friction stir welding/processing tool materials and selection. Int. J. Eng. Res. Technol. 2013, 2, 8–18. [Google Scholar]
- Dar, A.A.; Anuradha, N. An application of Taguchi L9 method in Black Scholes model for European call option. Int. J. Entrep. 2018, 22, 13. [Google Scholar]
- Li, Y.; Shieh, M.-D.; Yang, C.-C.; Zhu, L. Application of Fuzzy-Based Hybrid Taguchi Method for Multiobjective Optimization of Product Form Design. J. Math. Probl. Eng. 2018, 2018, 1–18. [Google Scholar] [CrossRef]
- Ginting, E.; Tambunan, M. Selection of Optimal Factor Level FROM Process Parameters in Palm Oil Industry; IOP Conference Series: Materials Science and Engineering; IOP Publishing: Bristol, UK, 2018; pp. 1–6. [Google Scholar]
- Winer, B.J. Latin Squares and Related Designs; McGraw-Hill Book Company: New York, NY, USA, 1962. [Google Scholar]
- Achuthamenon Sylajakumari, P.; Ramakrishnasamy, R.; Palaniappan, G. Taguchi Grey Relational Analysis for Multi-Response Optimization of Wear in Co-Continuous Composite. J. Mater. 2018, 11, 1743. [Google Scholar] [CrossRef] [PubMed]
- Kasman, Ş. Optimisation of dissimilar friction stir welding parameters with grey relational analysis. Proc. Inst. Mech. Eng. Part B J. Eng. Manuf. 2013, 227, 1317–1324. [Google Scholar] [CrossRef]
- Lin, S.-T. Application of grey-relational analysis to find the most suitable watermarking scheme. Int. J. Innov. Comput. Inf. Control 2011, 7, 5389–5401. [Google Scholar]
- Vijayan, S.; Raju, R.; Rao, S.K. Multiobjective optimization of friction stir welding process parameters on aluminum alloy AA 5083 using Taguchi-based grey relation analysis. J. Mater. Manuf. Process. 2010, 25, 1206–1212. [Google Scholar] [CrossRef]
- Panda, A.; Sahoo, A.; Rout, R. Multi-attribute decision making parametric optimization and modeling in hard turning using ceramic insert through grey relational analysis: A case study. Decis. Sci. Lett. 2016, 5, 581–592. [Google Scholar] [CrossRef]
- Santhakumar, J.; Iqbal, U.M.; Prakash, M. Taguchi-Grey Relational Based Multi-Response Optimization on the Performance of Tool Coating Thickness in Pocket Milling. Mater. Today: Proc. 2018, 5, 13422–13428. [Google Scholar] [CrossRef]
- Ghetiya, N.; Patel, K.; Kavar, A. Multi-objective optimization of FSW process parameters of aluminium alloy using Taguchi-based grey relational analysis. Trans. Indian Inst. Met. 2016, 69, 917–923. [Google Scholar] [CrossRef]
- Çaydaş, U.; Hascalık, A. Use of the grey relational analysis to determine optimum laser cutting parameters with multi-performance characteristics. J. Opt. Laser Technol. 2008, 40, 987–994. [Google Scholar] [CrossRef]
- Krishnan, M.; Subramaniam, S. Multi-response optimization of friction stir corner welding of dissimilar thickness AA5086 and AA6061 aluminum alloys by Taguchi grey relational analysis. J. Proc. Inst. Mech. Eng. Part C J. Mech. Eng. Sci. 2019, 233, 3733–3742. [Google Scholar] [CrossRef]
- Kumar, D.; Gupta, A.K.; Chandna, P.; Pal, M. Optimization of neural network parameters using Grey-Taguchi methodology for manufacturing process applications. J. Proc. Inst. Mech. Eng. Part C J. Mech. Eng. Sci. 2015, 229, 2651–2664. [Google Scholar] [CrossRef]
- Gupta, M.; Kumar, S. Multi-objective optimization of cutting parameters in turning using grey relational analysis. Int. J. Ind. Eng. Comput. 2013, 4, 547–558. [Google Scholar] [CrossRef]
- Lu, H.; Chang, C.; Hwang, N.; Chung, C. Grey relational analysis coupled with principal component analysis for optimization design of the cutting parameters in high-speed end milling. J. Mater. Process. Technol. 2009, 209, 3808–3817. [Google Scholar] [CrossRef]
- Siddiquee, A.N.; Khan, Z.A.; Mallick, Z. Grey relational analysis coupled with principal component analysis for optimisation design of the process parameters in in-feed centreless cylindrical grinding. Int. J. Adv. Manuf. Technol. 2010, 46, 983–992. [Google Scholar] [CrossRef]
- Fung, C.-P.; Kang, P.-C. Multi-response optimization in friction properties of PBT composites using Taguchi method and principle component analysis. J. Mater. Process. Technol. 2005, 170, 602–610. [Google Scholar] [CrossRef]
- Rosse, P. Taguchi Techniques for Quality Engineering, Loss Function, Orthogonal Experiments, Parameter and Tolerance Design; McGraw-Hill: Toronto, ON, Canada, 1996. [Google Scholar]
- Kulekci, M.; Esme, U.; Er, O.; Kazancoglu, Y. Modeling and prediction of weld shear strength in friction stir spot welding using design of experiments and neural network. J. Mater. Wiss. Werkst. 2011, 42, 990–995. [Google Scholar] [CrossRef]
- Buffa, G.; Ducato, A.; Fratini, L. Numerical procedure for residual stresses prediction in friction stir welding. J. Finite Elem. Anal. Des. 2011, 47, 470–476. [Google Scholar] [CrossRef]
- Trueba, L.; Torres, M.A.; Johannes, L.B.; Rybicki, D. Process optimization in the self-reacting friction stir welding of aluminum 6061-T6. Int. J. Mater. Form. 2018, 11, 559–570. [Google Scholar] [CrossRef]


| Material % | Mg | Si | Fe | Cr | Cu | AL |
|---|---|---|---|---|---|---|
| AA 6061 | 0.92 | 0.6 | 0.33 | 0.18 | 0.25 | 97.72 |
| Material | Yield Strength (MPa) | Ultimate Tensile Strength (MPa) | Hardness (HRA) |
|---|---|---|---|
| AA6061 | 276 | 310 | 40 |
| Density (g/cm3) | Melting Point (°C) | Thermal Conductivity (W/m-k) | Specific Heat (J/Kg-°C) |
|---|---|---|---|
| 2.7 | 652 | 167 | 0.896 |
| No | Property at 20 °C | Mechanical Strength |
|---|---|---|
| 1 | Ultimate tensile strength | 1200–1590 MPa |
| 2 | Hardness | 53 HRA |
| 3 | Yield strength | 1000–1380 MPa |
| 4 | Modulus of elasticity | 215,116,427,448 N/m2 |
| 5 | Reduction of area | 50% |
| 6 | Poisons ratio | 0.27–0.3 |
| Material | %C | %Si | %Cr | %Mo | %V |
|---|---|---|---|---|---|
| H13 | 0.4 | 1.00 | 5.30 | 1.4 | 1.0 |
| Parameters | Level | ||
|---|---|---|---|
| 1 | 2 | 3 | |
| Tool profile | Cylindrical | Taper | Tri-flute |
| Rotational Speed, rpm | 900 | 1200 | 1400 |
| Traverse speed, mm/min | 37.5 | 42.5 | 47.5 |
| No. | Tool Profile (Type) | Rotational Speed (rpm) | Traverse Speed (mm/min) | UTS (MPa) | HR (HRA) |
|---|---|---|---|---|---|
| 1 | Cylindrical | 900 | 37.5 | 253 | 59.44 |
| 2 | Cylindrical | 1200 | 42.5 | 263 | 65.70 |
| 3 | Cylindrical | 1400 | 47.5 | 272 | 67.70 |
| 4 | Taper | 900 | 42.5 | 231 | 56.00 |
| 5 | Taper | 1200 | 47.5 | 254 | 63.66 |
| 6 | Taper | 1400 | 37.5 | 283 | 71.60 |
| 7 | Tri-flute | 900 | 47.5 | 217 | 54.23 |
| 8 | Tri-flute | 1200 | 37.5 | 276 | 69.10 |
| 9 | Tri-flute | 1400 | 42.5 | 281 | 69.80 |
| No. | Traverse Speed (Mm/min) | Rotational Speed (RPM) | Max. Temp. on Advancing Side (°C) | Max. Temp. on Retreating Side (°C) |
|---|---|---|---|---|
| 1 | 37.5 | 900 | 342 | 328 |
| 2 | 42.5 | 1200 | 388 | 371 |
| 3 | 47.5 | 1400 | 396 | 380 |
| 4 | 37.5 | 900 | 301 | 283 |
| 5 | 42.5 | 1200 | 374 | 358 |
| 6 | 47.5 | 1400 | 416 | 402 |
| 7 | 37.5 | 1200 | 319 | 296 |
| 8 | 42.5 | 1400 | 404 | 393 |
| 9 | 47.5 | 900 | 412 | 399 |
| RPM | T.S | Strength Property | Welding Joint | Observation |
|---|---|---|---|---|
| 900 | 37.5 | T.S = 248 HR = 49.44 |  | Name of the defect: Flash
|
| 1200 | 42.5 | T.S = 263 HR = 55.7 |  | Name of the defect: Defect free
|
| 1400 | 47.5 | T.S = 272 HR = 57.7 |  | Name of the defect: Defect free
|
| 900 | 42.5 | T.S = 231 HR = 46 |  | Name of the defect: Tunnel
|
| 1200 | 47.5 | T.S = 254 HR = 53.66 |  | Name of the defect: Defect free
|
| 1400 | 37.5 | T.S = 283 HR = 61.6 |  | Name of the defect: Tunnel
|
| 900 | 47.5 | T.S = 217 HR = 44.23 |  | Name of the defect: Flash
|
| 1200 | 37.5 | T.S = 275 HR = 58.1 |  | Name of the defect: Tunnel
|
| 1400 | 42.5 | T.S = 281 HR = 59.8 |  | Name of the defect: Flash
|
| No. | UTS (MPa) | HR (HRA) | S/NUTM | S/NHR |
|---|---|---|---|---|
| 1 | 253 | 59.44 | 48.0624 | 35.4816 |
| 2 | 263 | 65.70 | 48.3991 | 36.3513 |
| 3 | 272 | 67.70 | 48.6914 | 36.6118 |
| 4 | 231 | 56.00 | 47.2722 | 34.9638 |
| 5 | 254 | 63.66 | 48.0967 | 36.0773 |
| 6 | 283 | 71.60 | 49.0357 | 37.0983 |
| 7 | 217 | 54.23 | 46.7292 | 34.6848 |
| 8 | 276 | 69.10 | 48.8182 | 36.7896 |
| 9 | 281 | 69.80 | 48.9741 | 36.8771 |
| Step 1: Data Normalized | Step 2: Deviation Sequence | |||
|---|---|---|---|---|
| No. | UTS (MPa) | HR (HRA) | UTS (MPa) | HR (HRA) |
| 1 | 0.578 | 0.330 | 0.422 | 0.670 |
| 2 | 0.724 | 0.691 | 0.276 | 0.309 |
| 3 | 0.851 | 0.798 | 0.149 | 0.202 |
| 4 | 0.235 | 0.116 | 0.765 | 0.884 |
| 5 | 0.593 | 0.577 | 0.407 | 0.423 |
| 6 | 1.000 | 1.000 | 0.000 | 0.000 |
| 7 | 0.000 | 0.000 | 1.000 | 1.000 |
| 8 | 0.906 | 0.872 | 0.094 | 0.128 |
| 9 | 0.973 | 0.908 | 0.027 | 0.092 |
| Principal Component | Eigenvalues | Explained Variation (%) |
|---|---|---|
| UTS | 1.9839 | 99.2 |
| HR | 0.0161 | 0.8 |
| Quality Characteristic | Eigenvector | |
|---|---|---|
| 1st Principal | 2nd Principal | |
| UTS | 0.707 | 0.707 |
| HR | 0.707 | −0.707 |
| UTS | 0.4999 |
| HR | 0.4999 |
| Step 3: Grey Relational Coefficient | Step 4: Grey Relational Grade and It Is Rank | |||
|---|---|---|---|---|
| No | UTS (MPa) | HR (HRA) | GRG | Rank |
| 1 | 0.542 | 0.427 | 0.485 | 7 |
| 2 | 0.644 | 0.618 | 0.631 | 5 |
| 3 | 0.770 | 0.713 | 0.741 | 4 |
| 4 | 0.395 | 0.361 | 0.378 | 8 |
| 5 | 0.551 | 0.542 | 0.546 | 6 |
| 6 | 1.000 | 1.000 | 1.000 | 1 |
| 7 | 0.333 | 0.333 | 0.333 | 9 |
| 8 | 0.841 | 0.796 | 0.819 | 3 |
| 9 | 0.949 | 0.845 | 0.897 | 2 |
| Average GRG = 0.648 | ||||
| Level | Tool Profile (A) | Rotational Speed (B) | Traverse Speed (C) |
|---|---|---|---|
| 1 | 0.6191 | 0.3988 | 0.7679 |
| 2 | 0.6416 | 0.6654 | 0.6355 |
| 3 | 0.6831 | 0.8795 | 0.5404 |
| Delta | 0.0640 | 0.4807 | 0.2275 |
| Rank | 3 | 1 | 2 |
| Parameter | Level | Value |
|---|---|---|
| Tool profile | 3 | Tri-flute |
| Rotational Speed, rpm | 3 | 1400 |
| Traverse speed, mm/min | 1 | 37.5 |
| Source | DF | Adj SS | Adj MS | F-Value | P-Value | Contribution | Remark |
|---|---|---|---|---|---|---|---|
| Tool profile | 2 | 0.006332 | 0.003166 | 27.78 | 0.035 | Insignificant | |
| RPM | 2 | 0.347993 | 0.173996 | 1526.44 | 0.001 | 80.33713576 | Significant |
| Traverse speed | 2 | 0.078329 | 0.039164 | 343.58 | 0.003 | 18.04209923 | Significant |
| Error | 2 | 0.000228 | 0.000114 | 1.62 | |||
| Total | 8 | 0.432882 | 100% | ||||
| F0.01(2,2) = 99 | |||||||
| S | R-sq | R-sq(adj) | R-sq(pred) |
|---|---|---|---|
| 0.0106765 | 99.95% | 99.79% | 98.93% |
| Optimal Combination | The Response of Quality Characteristics | |||
|---|---|---|---|---|
| A3B3C1 | UTS | S/NUTS | HR | S/NHR |
| Replication 1 | 283 | 49.0357 | 72.0 | 37.1466 |
| Replication 2 | 284 | 49.0664 | 72.0 | 37.1466 |
| Replication 3 | 284 | 49.0664 | 71.6 | 37.0983 |
| Replication 4 | 284 | 49.0664 | 72.0 | 37.1466 |
| Replication 5 | 284 | 49.0664 | 72.0 | 37.1466 |
| Replication 6 | 284 | 49.0664 | 72.0 | 37.1466 |
| Replication 7 | 284 | 49.0664 | 72.0 | 37.1466 |
| Replication 8 | 284 | 49.0664 | 72.0 | 37.1466 |
| Replication 9 | 284 | 49.0664 | 72.0 | 37.1466 |
| Replication 10 | 283 | 49.0357 | 72.0 | 37.1466 |
| Mean of GRG for confirmation test = 0.933 | ||||
Publisher’s Note: MDPI stays neutral with regard to jurisdictional claims in published maps and institutional affiliations. |
© 2020 by the authors. Licensee MDPI, Basel, Switzerland. This article is an open access article distributed under the terms and conditions of the Creative Commons Attribution (CC BY) license (http://creativecommons.org/licenses/by/4.0/).
Share and Cite
Asmare, A.; Al-Sabur, R.; Messele, E. Experimental Investigation of Friction Stir Welding on 6061-T6 Aluminum Alloy using Taguchi-Based GRA. Metals 2020, 10, 1480. https://doi.org/10.3390/met10111480
Asmare A, Al-Sabur R, Messele E. Experimental Investigation of Friction Stir Welding on 6061-T6 Aluminum Alloy using Taguchi-Based GRA. Metals. 2020; 10(11):1480. https://doi.org/10.3390/met10111480
Chicago/Turabian StyleAsmare, Assefa, Raheem Al-Sabur, and Eyob Messele. 2020. "Experimental Investigation of Friction Stir Welding on 6061-T6 Aluminum Alloy using Taguchi-Based GRA" Metals 10, no. 11: 1480. https://doi.org/10.3390/met10111480
APA StyleAsmare, A., Al-Sabur, R., & Messele, E. (2020). Experimental Investigation of Friction Stir Welding on 6061-T6 Aluminum Alloy using Taguchi-Based GRA. Metals, 10(11), 1480. https://doi.org/10.3390/met10111480