Article

Corrosion Fatigue Numerical Model for Austenitic and Lean-Duplex Stainless-Steel Rebars Exposed to Marine Environments

by
Iñigo Calderón-Uríszar-Aldaca
1,*,
Estibaliz Briz
2,
Amaia Matanza
3,
Ulises Martin
4 and
David M. Bastidas
4,*
1
TECNALIA, Basque Research and Technology Alliance (BRTA), Mikeletegi Pasealekua 2, 20009 Donostia-San Sebastián, Spain
2
Department of Mechanical Engineering, University of the Basque Country (UPV/EHU), 48940 Leioa, Vizcaya, Spain
3
SIAME-MPC (UPV/EHU) Université de Pau et des pays de l’Adour ISA BTP, 64600 Anglet, France
4
National Center for Education and Research on Corrosion and Materials Performance, NCERCAMP-UA Department of Chemical, Biomolecular, and Corrosion Engineering, The University of Akron, 302 E Buchtel Ave, Akron, OH 44325-3906, USA
*
Authors to whom correspondence should be addressed.
Metals 2020, 10(9), 1217; https://doi.org/10.3390/met10091217
Submission received: 21 July 2020 / Revised: 13 August 2020 / Accepted: 5 September 2020 / Published: 10 September 2020
(This article belongs to the Special Issue Corrosion and Inhibition Processes)

Abstract

:
Steel rebars of structures exposed to cyclic loadings and marine environments suffer an accelerated deterioration process by corrosion fatigue, causing catastrophic failure before service life ends. Hence, stainless steel rebars have been emerging as a way of mitigating pitting corrosion contribution to fatigue, despite the increased cost. The present study proposes a corrosion fatigue semiempirical model. Different samples of rebars made of carbon steel, 304L austenitic (ASS), 316L ASS, 2205 duplex (DSS), 2304 lean duplex stainless steels (LDSS), and 2001 LDSS have been embedded in concrete and exposed to a tidal marine environment for 6 months. Corrosion rates of each steel rebar have been obtained from direct measurement and, considering rebar standard requirements for fatigue and fracture mechanics, an iterative numerical model has been developed to derive the cycles to failure for each stress range level. The model resulted in a corrosion pushing factor for each material, able to be used as an accelerating coefficient for the Palmgren-Miner linear rule and as a performance indicator. Carbon steel showed the worst performance, while 2001 LDSS performed 1.5 times better with the best cost-performance ratio, and finally 2205 DSS performed 1.5 times better than 2001 LDSS.

1. Introduction

Corrosion is one of the main pathologies that deteriorates reinforced concrete structures. For instance, when concrete structures are placed in corrosive environments, rich in CO2, the alkalinity of the concrete will tend to decrease, due to carbonation. This process will continue until the pH value decreases below the threshold of nine, according to the Pourbaix diagram for iron at 25 °C [1], losing its protective effect over carbon steel rebars [1,2]. The passive layers surrounding the rebars will then break down and both generalized and pitting corrosion will start to deteriorate them [3]. Many solutions have been proposed to counter such problems, namely: corrosion inhibitors in concrete [4,5], coatings applied to concrete surfaces and reinforcement surfaces, such as hydrophobic coatings, electrochemical rehabilitation and similar interventions [2]. Nevertheless, none of those treatments will definitively stop corrosive processes [3,4,5,6]. Moreover, for some retrofitting applications such as historic heritage, organic (epoxy) adhesives and composite materials are not suitable, due to their durability problems and sustainability characteristics [7].
Hence, the use of stainless steel (SS) rebars as reinforcement in concrete structures is emerging as a new approach that enables the extension of the lifetime in service under corrosive environments [8]. Nevertheless, ferritic and martensitic stainless steels are still prone to chloride pitting attacks and weldability directives promote the use of austenitic (ASS), duplex (DSS) and lean duplex stainless steels (LDSS) [9,10,11]. Accordingly, the research reported in this paper is focused on 304L ASS, 316L ASS, 2205 DSS, 2304 LDSS, and 2001 LDSS [6,7,12,13,14,15,16,17,18,19,20].
Thus, generalized corrosion is characterized by promoting crack initiation in concrete, due to the rebar expansion caused by the higher volume ratio of the oxide products formed on the concrete rebar interface, eventually prompting the spalling of the concrete cover; on the other hand, localized corrosion is identified by pit formation at rebars (pitting corrosion), which is not appreciable from the exterior. In marine environments, where the chloride concentration is high (3.5 wt.% NaCl), the chloride ions diffuse through the concrete matrix by the pores, reaching the surface of the steel reinforcement, initiating the breakdown of the passive film and eventually the dissolution of the metal. Besides, some structures are also subjected to cyclic loading such as wind, seismic activity, traffic, and sea waves. When both chloride and cyclic loads act simultaneously, fatigue cracks tend to nucleate and propagate from these pits, causing a sudden premature failure. The final implication of combining the corrosion effect to fatigue would be that design methods that are based on the constant amplitude fatigue limits or cut-off limits would become unsafe.
Hence, the synergistic corrosion-fatigue process depends on many variables: aggressiveness of the environment, pitting corrosion susceptibility of the material, load frequency, mean stress, cyclic load sequence, and stress concentration in the pit [21,22,23,24,25,26]. Crack propagation due to corrosion fatigue can be explained by two factors: mechanical propagation and corrosion pitting. While mechanical propagation dominates at higher frequencies, pitting corrosion is dominant at low frequencies [21,27,28].
The Palmgren-Miner linear rule for damage accumulation (as reported in Equation (1)) [29,30] and the Δσ-N curves to relate stress ranges (Δσ), with the expected number of cycles until failure (Nf) [31], are the most widely used fatigue damage assessment methods for structural elements in an inert environment (no chlorides) [9,21,32,33,34], according to the fracture mechanics theory based on Paris’ law [35] and the Irwin or the Rankine failure criteria [36]. Several studies regarding fatigue corrosion have been performed [37,38], however, due to the high number of variables playing a role on the process, there is no standard as of today for fatigue corrosion forecasting. Nevertheless, as presented in a previous work [22], the authors of this paper have developed an accelerating coefficient that can take account of corrosion within the same paradigm of the Δσ-N curve plus the Palmgren-Miner linear rule [29,30].
i = 1 I n i N f i = 1
where ni is the number of cycles and Nfi is the number of cycles to failure of each cycle block i of the same stress range Δσ.
In this paper, an application for DSS rebars under marine environment is developed [39], based on the same corrosion pushing factor (FCP) approach [26]. Thus, since FCP is an accelerating coefficient equivalent to corrosion leverage on the fatigue process, it can be used to set a comparative basis between different material alternatives. A marine environment can, for instance, be characterized as the tidal zone in a laboratory, one of the most aggressive environments. Six different steels were studied, namely: one CS (B500SD), two ASS (304L and 316L), one DSS (2205), and two LDSS (2304 and 2001).

2. Experimental Procedure

2.1. Materials

The fatigue corrosion assessment was carried out in the XS3 exposure class (whose full definition is tidal, splash and spray zone) environment, which was simulated under controlled conditions in the laboratory [40]. The reinforcement specimens were embedded in C30/37 concrete with a w/c ratio of 0.5 and exposed to the XS3 environment for six months. As previously mentioned, six steels were studied, CS B500SD, 304L ASS, 316L ASS, 2205 DSS, and 2001 LDSS and 2304 LDSS. All steel-reinforcing specimens were 12 mm in diameter rebars. Table 1 summarizes the chemical composition of each reinforcement in accordance with EN10080:2005 and EN10088-1:2006 [41,42].

2.2. Methodology

This paper reports a semi-empirical research study. Accordingly, the corrosion fatigue assessment was performed in two steps; firstly, the corrosion rate (vc), was measured in specimens exposed to a tidal environment, and all measurements were done in triplicate; then, fracture mechanics theory was considered for corrosion-fatigue life prediction, to build up equivalent S-N curves, as described in a previous study by the authors [22]. First of all, the specimens were exposed to simulated tidal marine environments for 6 months. The chloride content in a seawater tidal zone was assumed to be 3.5 wt.% NaCl, according to the literature [43,44]. The specimens were equally divided and placed in two polyvinyl chloride (PVC) tubs. Then, using automated pumping equipment and a timer, one tub was filled with water for 6 h while the other was left empty, exposed only to the atmosphere in the laboratory at 20 °C. After 6 h, the water was pumped into the empty tub, thereby simulating the conditions of a structure in a tidal zone.
Hence, the corrosion fatigue life prediction was based on the theoretical framework of fracture mechanics. First, the main variables involved in the corrosion fatigue process were defined. Those variables were the mean stress level (σm), the Δσ, the cycle frequencies (f), the Nf and the vc. Once all the variables were defined, the modified, Δσ-N, curves were plotted.
Finally, the semi-empirical procedure used in this study was a first generalized model, this meant that previously defined variables were only the minimum common ground for every stainless steel required to complete the procedure. Nevertheless, there were other important parameters that were indirectly considered, such as material structure, properties and metallurgical aspects. However, knowing how these metallurgical aspects affected mechanical properties and corrosion kinetics and, by means of this semi-empirical procedure, how to forecast the corrosion fatigue behaviour, it became possible to further develop new materials and processes with improved corrosion fatigue behavior.

2.2.1. Fatigue Parameters

Eurocode 2 (EC2) and the seminal European Convention for Constructional Steelwork (ECCS) document [32,45] define the fatigue resistance conditions for carbon steel reinforcements. As there is no specific directive for stainless steel reinforcements, their study would have to be based on EC2 requirements. Accordingly, a fatigue test must be performed according to UNE-EN ISO 15630-1 [46]. Table 2 summarizes the minimum requirements of rebars under cyclic loading like the Nf, superior/maximum stress (σsup), Δσ and f.
EC2 defines two service-life periods depending on the infrastructure type and importance: 50 years and 100 years [32]. Considering Nf as 2 × 10⁶ cycles during such service-life periods, based on the constant amplitude fatigue limit (CAFL) approach at EC2, two frequencies can be derived: 1.27 × 10⁻³ Hz and 6.34 × 10⁻⁴ Hz, simply by dividing the expected amount of cycles Nf by the corresponding service-life period in seconds. Another thing to consider is that the lower the f of the process, the higher the weight of the corrosion within the corrosion fatigue process [21,22,26,27,28]. Accordingly, 6.34 × 10⁻⁴ Hz was considered in this study, corresponding to a service-life period of 100 years.
Most structures are designed to withstand permanent and variable loads, but when corrosion is also involved, a doubt could arise over the development of stress corrosion cracking (SCC) process, which severely reduces the service lifetime of the structure. However, the development of corrosion fatigue and/or SCC depends on the magnitude of the variable and the permanent loads; since SCC requires σm above 80% of the yield stress (σy), it is more unlikely to happen under normal working conditions. However, considering that EC2 [32] defines conservative safety factors for ultimate limit states (ULS), namely 1.35 for permanent load majoration (γG) and 1.15 for rebar resistance minoration (γS), even if all loads were permanent, the maximum stress at the rebars would be circa 64% σy, if any such structure were in fact designed according to the standards, see Equation (2), therefore no SCC development would be expected in the rebars, unless the fatigue crack reached a large enough size for stress concentrations to get above 80% σy. Nevertheless, according to Paris’s law [35], when this occurs the fatigue propagation is so quick that the weight of any other processes is minimized and therefore negligible when compared to the mechanical fatigue.
σ sup = 1 γ G × γ S × σ y
where σsup is the superior (maximum) stress.

2.2.2. Corrosion Parameters

As previously mentioned, all the specimens were exposed to simulated tidal marine environments [39] and a corrosion current density (icorr) was measured after 6 months exposure with a Gecor8 Corrosimeter from GEOCISA (Madrid, Spain). Applying Faraday’s law (2) defined in UNE 112072-2011 [48], the mass loss (m) in mdd, defined as mg/(dm2 × day), is obtained.
m = 86400 × P a t × i c o r r F × n
where F is the Faraday constant (96,485 C/mol), Pat is the atomic weight and n is the number of electrons.
Then, a generalized corrosion rate (vcorr.g), was defined by considering the material density (ρ) in g/cm3 (see Equation (3)).
v c o r r . g = 36.5 × m ρ

2.3. Calculation Procedure Overview

Now, for demonstrative purposes of the semi-empirical proposed approach, the generalized calculating procedure is applied to a single rebar of 25 mm diameter (circa-1 inch), made of carbon steel CS, with a yield limit of 500 MPa. According to current standards, any commercial rebar should survive after 2 × 10⁶ cycles, whose Δσ = 300 MPa, and σm = 150 MPa, with a survival rate of 95% and a reliability of 75% [32,41,46,47]. Such rebars should remain under service for 50–100 years and are typically designed with reference to the CAFL, meaning mean design frequencies spanning from 6.34 × 10⁻⁴ Hz to 1.27 × 10⁻³ Hz, being the first finally chosen since they would maximize the corrosion contribution in the corrosion-fatigue process.
Besides, from the safety side, the Paris Law constants can be taken as A = 2 × 10⁻¹³ and m = 3 for any steel [22,26,49,50]. Additionally, the plane strain fracture toughness, or critical stress intensity factor (KIC) at mode I, is KIC = 3000 Nmm−3/2, a parameter related with resilience, which barely changes between steel grades [22,26,50,51]. Thus, the critical crack size (acr) determining the failure point, can be derived from Equation (4), where Ycr = Y(acr) is the geometrical factor for rebars [52] and particularized for this critical crack size and σsup = 300 MPa is the maximum stress reached at each cycle. Substituting these values into Equation (4) leads to a critical crack size acr = 12.28 mm.
a cr = 1 π ( Δ K IC Y cr σ sup ) 2
Nevertheless, the procedure to derive the initial crack size (a0) is more sensible. For instance, some approaches can be based on the threshold stress intensity factor (Kth) [22,26,50], but factors potentially relevant for a fatigue failure, such as the surface finishing or the presence of corrugation, could be then obviated. Thus, the best approach is to start from the acr and go backwards for 2 × 10⁶ cycles until reaching the initial crack size. However, since the presence of a geometrical factor depending on crack size impedes any direct calculation, an iterative calculation method is developed, i.e., discretizing the geometrical factor making it constant for smaller cycle blocks or amounts and converging to a value. The final value of the equivalent a0 now including surface finishing, etc. is then defined as a0 = 0.012 mm and the amount of cycles until failure depending on the smoothness of discretization is presented in Table 3, with a final error of less than 0.037%.
This makes the difference because in such processes corrosion is critical mainly at the first stages, where the corrosion pits initiate the cracks and the anodic zone at the very crack tip corrodes faster than the mechanical contribution to crack growth, up to a point where the mechanical process causes a faster crack growth and the situation is reversed, even going to a point where the corrosion contribution is neglectable. This can be seen in Equation (5), where the impact of increasing the vc of a certain cycle block is highly reduced by increasing the a0. Second, at the end of the day a continuous time-dependent process can be modelled by discretizing it in several steps, keeping its value constant within each step and varying it step by step. Such steps can be reduced after each iteration, letting the result to converge up to a cut-off point where it is not necessary to continue. Therefore, a constant corrosion rate approach can be generalized and applied too for any varying corrosion rate, while a varying corrosion rate model could not be suitable to another variable scenario.
Nevertheless, the best way to show how the vc variation after the initial stage affects the corrosion fatigue process is to directly calculate it. Therefore, an initial scenario of no corrosion rate is defined, equivalent to an inert environment XS0, and three more are defined under an XS3 scenario of tidal and splash marine environments, each starting at 200 μm/year, the first one vc1 parabolically decreasing until 100 μm/year at 50 years, the second one vc2 parabolically increasing until 300 μm/year at 50 years, and the third one vc3 constant. See Figure 1.
Hence, with these three corrosion rates, the crack growth can be calculated with calculation steps or iterations of 1000 mechanical cycles. Each mechanical cycle block ΔNm at certain f lasts a certain time increment Δt = f × ΔNm. Therefore, with the initial crack size of any iteration (a0,i), its particular time (ti), time increment (Δti), vc,i, and amount of mechanical cycles (ΔNm), it is possible to derive the final crack size of such an iteration (af,i) simply by adding the mechanical and corrosion effect at each calculation step, then the a0,i will be exactly the final one of the previous one a0,i + 1 = af,i, and so on continuing until reaching the acr.
Figure 2 shows the a0,i in mm with time expressed in years of a 25 mm rebar subjected to corrosion-fatigue, with cycles of Δσ = 300 MPa and σm = 150 MPa at a f = 6.34 × 10⁻⁴ Hz. It can be seen that this rebar, in an inert environment (vc0) could reach the service life of 100 years stated for infrastructures, but this is because it takes almost the whole service life (95 years) to reach 1 mm size, the point where the crack starts to grow faster and reaches its critical size in a few years more. The same mechanical fatigue but in a corrosive environments (vc1, vc2, vc3) rapidly loses this ”truce” period of 95 years because the pitting corrosion pushes forward the fatigue process, reaching the crack size of 1 mm in the first lustrum, then the crack growth with time is almost parallel at the end stage for corrosive and non-corrosive environments.
Finally, conducting a zoom on the final stage for corrosive environments, see magnification of Figure 2, it can be seen that there is not so much difference between a constant, decreasing and increasing vc scenario, because at some point when the mechanical fatigue becomes dominant on coupled corrosion–fatigue, the progress in terms of crack growth caused by pitting corrosion is neglectable.
Therefore, this evidence validates the procedure on a constant corrosion rate basis for hedge applications under corrosive environments, like marine environments in coastal areas, at least when the corrosion intensity is high enough.
As a last comment, normally fatigue at rebars occurs at the most tensioned parts of the reinforced concrete structure, where the concrete cover suffers cracks that facilitate the transport of electrolytes to the rebar surface, tending to the development of localized attacks. Thus, from the safety side, in this manuscript the pitting corrosion is assumed during all service life, neglecting diffusion time or repassivation periods. Nevertheless, the cyclic polarization technique can be used to verify whether all of them are constantly subject to pitting corrosion or only for reduced periods.

3. Results and Discussion
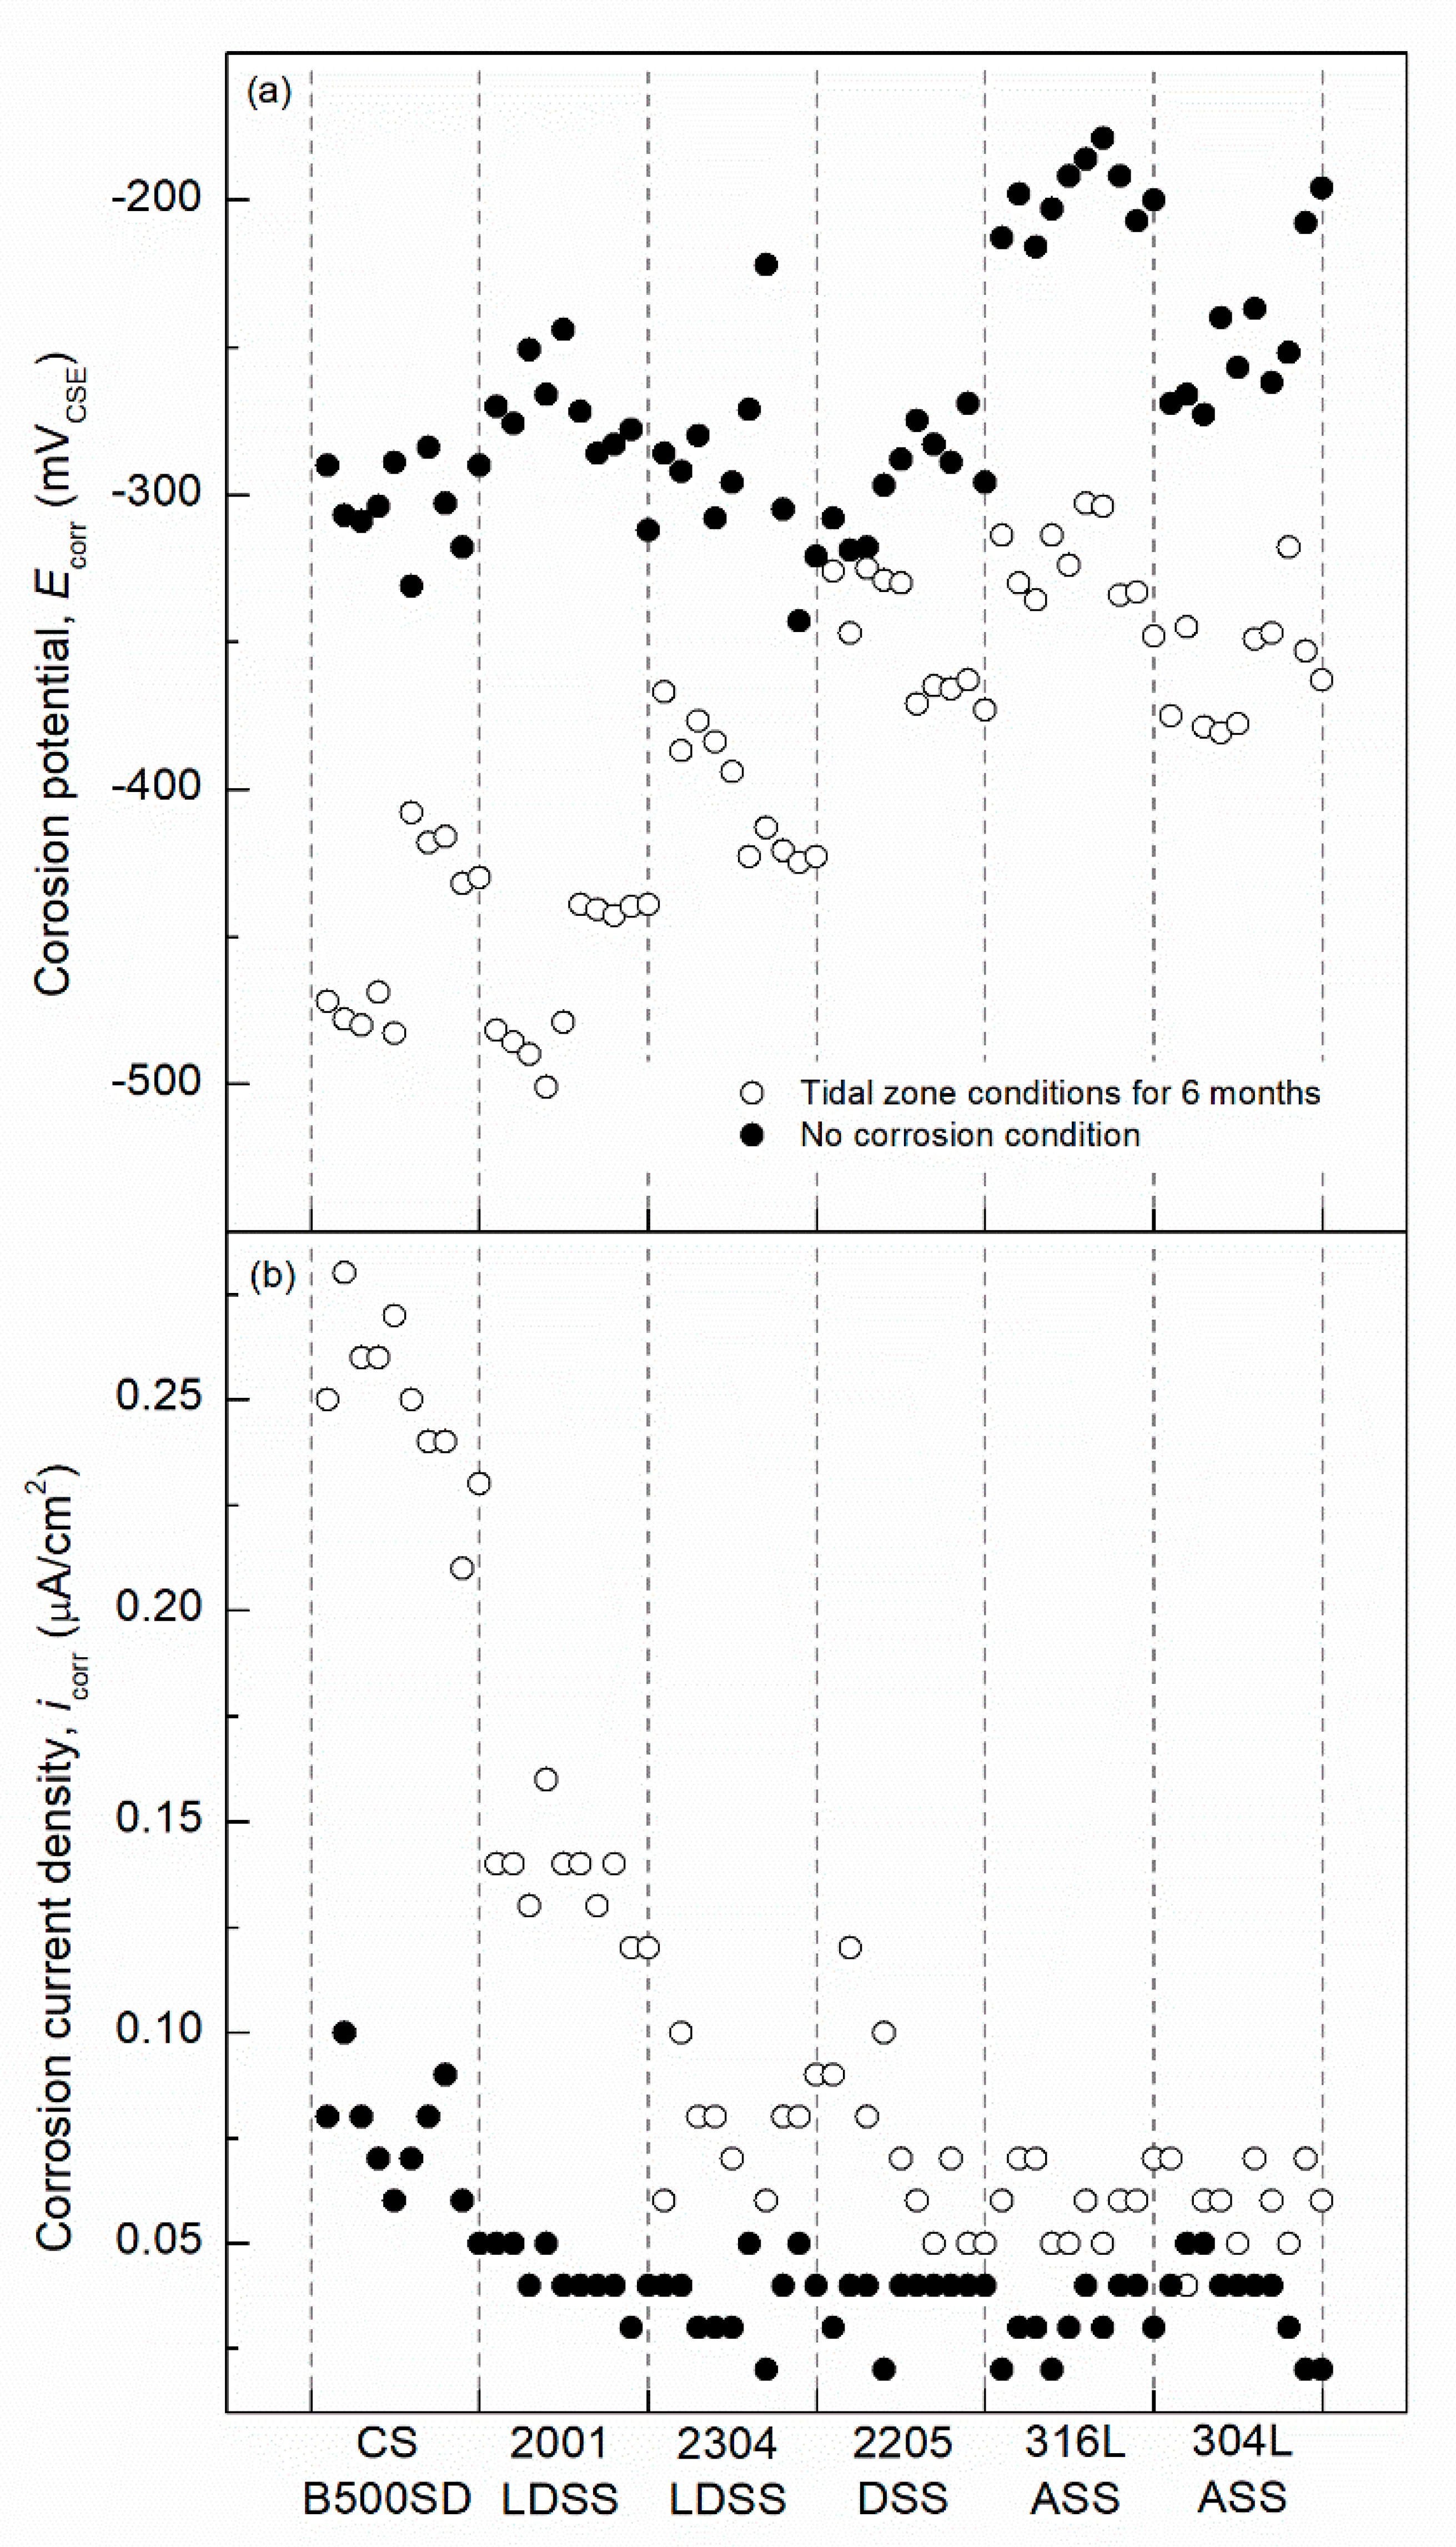
Corrosion Test

Four specimens were tested for each steel grade rebar. Table 4 summarizes the icorr mean values and vcorr,g, according to Faraday’s law, Equation (3). Therefore, the pitting corrosion rate, vcorr,p, can be derived from vcorr,g [23,53,54,55], in this study a ratio of 10 was considered from the safety side for generalized penetration to pit depth according to the literature [54,55,56].
Even though structures are designed for 50 or 100 years of service life, the directives define a generalized corrosion rate of 50 μm/year over such periods for B500SD reinforcements in concrete structures placed in a tidal zone (XS3). Considering a factor of 10, a threshold value of 500 μm/year is then defined for pitting corrosion. Dividing 500 μm/year by the vcorr,p of B500SD, a scale factor was defined to extrapolate measured values after 6 months exposure to those expected for service-life. Besides, the pitting corrosion rate obtained by the linear polarization corrosion rate, when applied in concrete with possible oxygen depolarization and SS with passive layers, is better to be compared with some known values, since these are not be the ideal conditions for this technique. Accordingly, Table 5 summarizes the vcorr,p, and the pitting corrosion rate for a whole service-life period (vcorr,p *).
Corrosion potential (Ecorr) versus time for the different steel rebars embedded in ordinary Portland cement (OPC ) concrete is shown in Figure 3a. After 6 months exposure, it was observed that B500SD rebars exposed to a chloride-free environment exhibited an Ecorr value of around −300 mVCSE, thus showing an intermediate risk of corrosion. In Figure 3, there are four points at each abscissa value, the two values in Figure 3a correspond to Ecorr measurements under an inert or non-corrosive environment (black point), and also after 6 months of tidal marine environment exposure (white point), while the values in Figure 3b show the monitored icorr. This shows the relative Ecorr drop and corresponding icorr increment of each material, the performance of each steel when compared together and the scattering of the results.
However, B500SD rebars submitted to the tidal zone suffered high corrosion risk as their Ecorr values were lower than −400 mVCSE. Critical Ecorr threshold values for carbon steel rebar in OPC concrete, measured versus copper/copper sulfate reference electrode (CSE), are as follows: Ecorr > −200 mVCSE (low corrosion, <10% risk), −200 mVCSE < Ecorr < −350 mVCSE (intermediate corrosion risk, 10–90% risk), Ecorr < −350 mVCSE (high corrosion, >90% risk), Ecorr < −500 mVCSE (severe corrosion). These changes in the B500SD Ecorr may be attributed to the moisture saturation and wetness of the pore network in the concrete specimens. The best corrosion performance was exhibited by 316 ASS rebars; more cathodic corrosion potential values close to Ecorr ≈ −200 mVCSE were registered. This outstanding corrosion behavior of 316 ASS is attributed to the high pitting resistance equivalent number (PREN). Following the 316 ASS, the 304 ASS has similar Ecorr values in the tidal zone; however, under non-corrosive conditions it has Ecorr values of −250 mVCSE, higher than the 316 ASS.
After exposure to the tidal zone XS3 environment, a very active ≈ −440 mVCSE was registered for the 2001 LDSS, showing similar trend to the carbon steel rebar BS500SD. In spite of the low Ecorr in the corrosive environment, 2001 LDSS has a more noble potential compared to the BS500SD when subjected to the non-corrosion condition. Both 2304 LDSS and 2205 DSS show a similar trend in the XS3 environment, having an Ecorr value of approximately −350 mVCSE ± 30 and 285 mVCSE, respectively; but the 2205 DSS still has a less active behavior. Comparing both SS in the non-corrosive environment, both have an Ecorr value of −280 mVCSE.
Furthermore, the icorr monitoring (Figure 3b) for the non-corrosive and tidal zone environments shows that 2304 LDSS, 2205 LDSS, 316 ASS and 304 ASS have a similar behavior, having current density values of 0.04 μA/cm2 and 0.06 μA/cm2, for the non-corrosive and tidal zone, respectively. The 2001 LDSS behaves similarly in the non-corrosive environment but it has a higher icorr value of 0.1 μA/cm2 for the corrosion environment. The worst behaving steel is CS B500SD, which shows icorr values of 0.08 μA/cm2 and 0.2 μA/cm2, for the non-corrosive and tidal zone environments, respectively (see Figure 3b).
The Δσ-N curves [31] corresponding to a certain stress range Δσ will determine the number of cycles until failure, Nf, due to mechanical processes. Besides, when the structure is exposed to a corrosive environment, the structural failure will occur with fewer cycles and both Δσ-N and S-N curves for inert environments become inappropriate for safe predictions. Thus, corrosion amplifies the number of equivalent load cycles during exposure; in other words, corrosion adds virtual cycles, reducing the number of actual mechanical cycles needed to reach the same crack size, a, compared to mechanical fatigue alone. The total cycle amount needed to reach the crack size when mechanical and corrosion processes act simultaneously can be estimated with Equation (5) (for more details, see [22]).
Δ N t = ( 2 2 m ) × { [ ( 2 m 2 × A × Δ σ m × π m / 2 × Δ N m + a 0 2 m 2 ) 2 2 m + v c f × Δ N m ] 2 m 2 a 0 2 m n } A × Δ σ m × π m / 2
Equally, Table 6 and Table 7 summarize the number of cycles until failure according to Equation (6) for 12 mm and 25 mm diameter rebars, respectively, for different stress ranges, Δσ, considering a constant mean stress of σm = 150 MPa. As a clarification, the values are obtained for a class XS3 environment, taking into account the pitting corrosion rate values for a service life shown in Table 5 for all specimens; besides, for comparative purposes, a control specimen under an inert environment was also considered. Thus, the Nf for each rebar is compared to the equivalent data for an inert environment, the control value shared by all steel types, since being stainless means no difference to fatigue behavior under corrosion-free environments; this was plotted in double logarithm scale, following Basquin’s Law [57], in Figure 4 and Figure 5. To clarify, these Δσ-N curves were derived from the crack growth obtained by fracture mechanics, adding iteratively the corrosion crack growth effect at each calculation step. Once the amount of cycles until failure for each stress range and for each material, with their corresponding corrosion rates, were known, then the S-N curve was derived.
Hence, regardless of the reinforcement diameter, CS B500SD underwent the greatest fatigue life reduction, due to coupled corrosion. Analyzing the LDSS rebars, they presented a greatly improved corrosion fatigue behavior compared to the CS, but within the two LDSS, 2205 showed the best corrosion fatigue behavior, while 2001 was slightly worse. Moreover, Figure 4 refers to 12 mm rebar diameter, where 304L ASS and 316L ASS were also studied, showing quite a similar performance to 2205 DSS surrounding the ASS reinforcements. Comparing Figure 4 and Figure 5, it can be appreciated how, in general, the 12 mm diameter rebars are moved to the left, which demonstrates that the higher the diameter, the better the reinforcement performance in fatigue and corrosion fatigue. Figure 4 and Figure 5 also show the effect of the Δσ, on corrosion fatigue. The gap between the inert curve and any specimen in an XS3 environment increased as the Δσ decreased; so, the effect of the environment under corrosion fatigue was more notorious at lower Δσ.
In a previous work, [22,39] a corrosion pushing factor was defined, enabling the use of ΔσN curves and the Palmgren-Miner linear rule for damage accumulation for coupled corrosion fatigue scenarios. The FCP increased the number of cycles considering only a purely mechanical process, simulating an increment in crack size. The FCP is therefore defined in Equation (6), where ΔNm is number of cycles until failure due to purely mechanical processes, and ΔNt is the total number of cycles needed to reach acr when mechanical and corrosion processes act simultaneously, calculated as Equation (6) (for more details see [22]). Table 8 and Table 9 show the FCP, applying Equation (7) to the data from Table 6 and Table 7, respectively.
F CP = Δ N t Δ N m
Data from Table 8 and Table 9 are plotted in Figure 6 and Figure 7, respectively. As can be appreciated, the FCP increased in an exponential way as the Δσ decreased for all of the specimens. This fact implies that, under corrosion fatigue, where mechanical and corrosive processes take part simultaneously, the lower Δσ, the higher the weight of the corrosion within the coupled corrosion fatigue process. Comparing both figures (Figure 6 and Figure 7), the corrosion pushing factor was higher in the ϕ 12 mm rebar specimens, so smaller diameter bars were more susceptible to corrosion fatigue.
Figure 6 and Figure 7 show the good corrosion fatigue performance of stainless-steel reinforcements. The use of stainless-steel reinforcements to counter corrosion problems is upheld in many studies [7,12,13,39,58]. Figure 8 presents the FCP of B500SD related to each stainless-steel reinforcement. The performance of stainless-steel reinforcements is in all cases clearly better, with all values higher than one. Examining each one, although 2205 DSS behaved better, it hardly differed from 304L ASS and 316L ASS. 2001 LDSS and 2304 LDSS showed a slightly weaker improvement when compared to the behavior of the CS rebar; an observation in concordance with other corrosion research results [18]; nevertheless, due to their lower nickel content, they are cost-effective solutions. Focusing on FCP with a lower Δσ where corrosion has a greater impact, and analyzing LDSS, 2001 LDSS FCP values compared with 2205 DSS were 1.6 higher and compared with B500SD were 1.5 lower; 2304 LDSS increased its corrosion fatigue life by up to 2 points when compared to B500SD and were quite similar to 2205 LDSS. Even for high Δσ where the corrosion effect impact is insignificant, SS reinforcements withstood more cycles than B500SD, and 2205 LDSS even withstood twice as many cycles.

4. Future Work

This semi-empirical procedure to model corrosion fatigue was done under several conservative assumptions: the corrosion during all service life without interruptions, the mechanical fatigue behaviour considered as its lower boundary according to standards and the perfect coupling between corrosion and fatigue. For instance, a crack generates an anodic zone at the tip, and a pit produces a stress concentration zone at the bottom, but corrosion can blunt the crack tip relaxing stresses, and the crack size and thickness can affect electrolyte availability because of transport mechanisms or metal residues closing the path. Therefore, at present, it can only be stated that the modeled effects of corrosion fatigue under this procedure are correct in the sense of being safe, but probably too conservative. Accordingly, future works are required to optimize the model on an empirical basis, based on direct corrosion fatigue testing able to validate some assumptions or relax others in order to improve results.
Regarding how to perform such corrosion fatigue tests properly, this is a key issue. It is better to do fatigue tests under corrosive environments, albeit such tests need to be representative of a whole service life process (50–100 years). Then, keeping in mind Equation (5), the effect of corrosion is time dependent and related to mechanical fatigue by the frequency of the process. If this balance was not kept properly, then corrosion or fatigue could have been neglected or completely dominated the process. Therefore, the scale of corrosion rate to frequency (namely, quotient vc/f) needs to be kept constant. This means that, to keep fatigue test duration under a few weeks, the tests need to be done at high frequencies, but accordingly, corrosion rate needs to be scaled properly by electrical means, and such stimulation has limits. Besides, even in an inert environment, the fatigue results are so scattered that we use the 5% percentile with a confidence of 75%, meaning multiple testing at each stress range level and for each material.
In summary, this semiempirical model is a relevant step, albeit still too conservative, in the research line on corrosion fatigue.

5. Conclusions

Different steel rebars embedded in OPC concrete have been analyzed after exposure to a marine environment (XS3): carbon steel, austenitic stainless-steel (ASS), and lean-duplex stainless-steels (LDSS), considering both the diameter and the stress range effects.
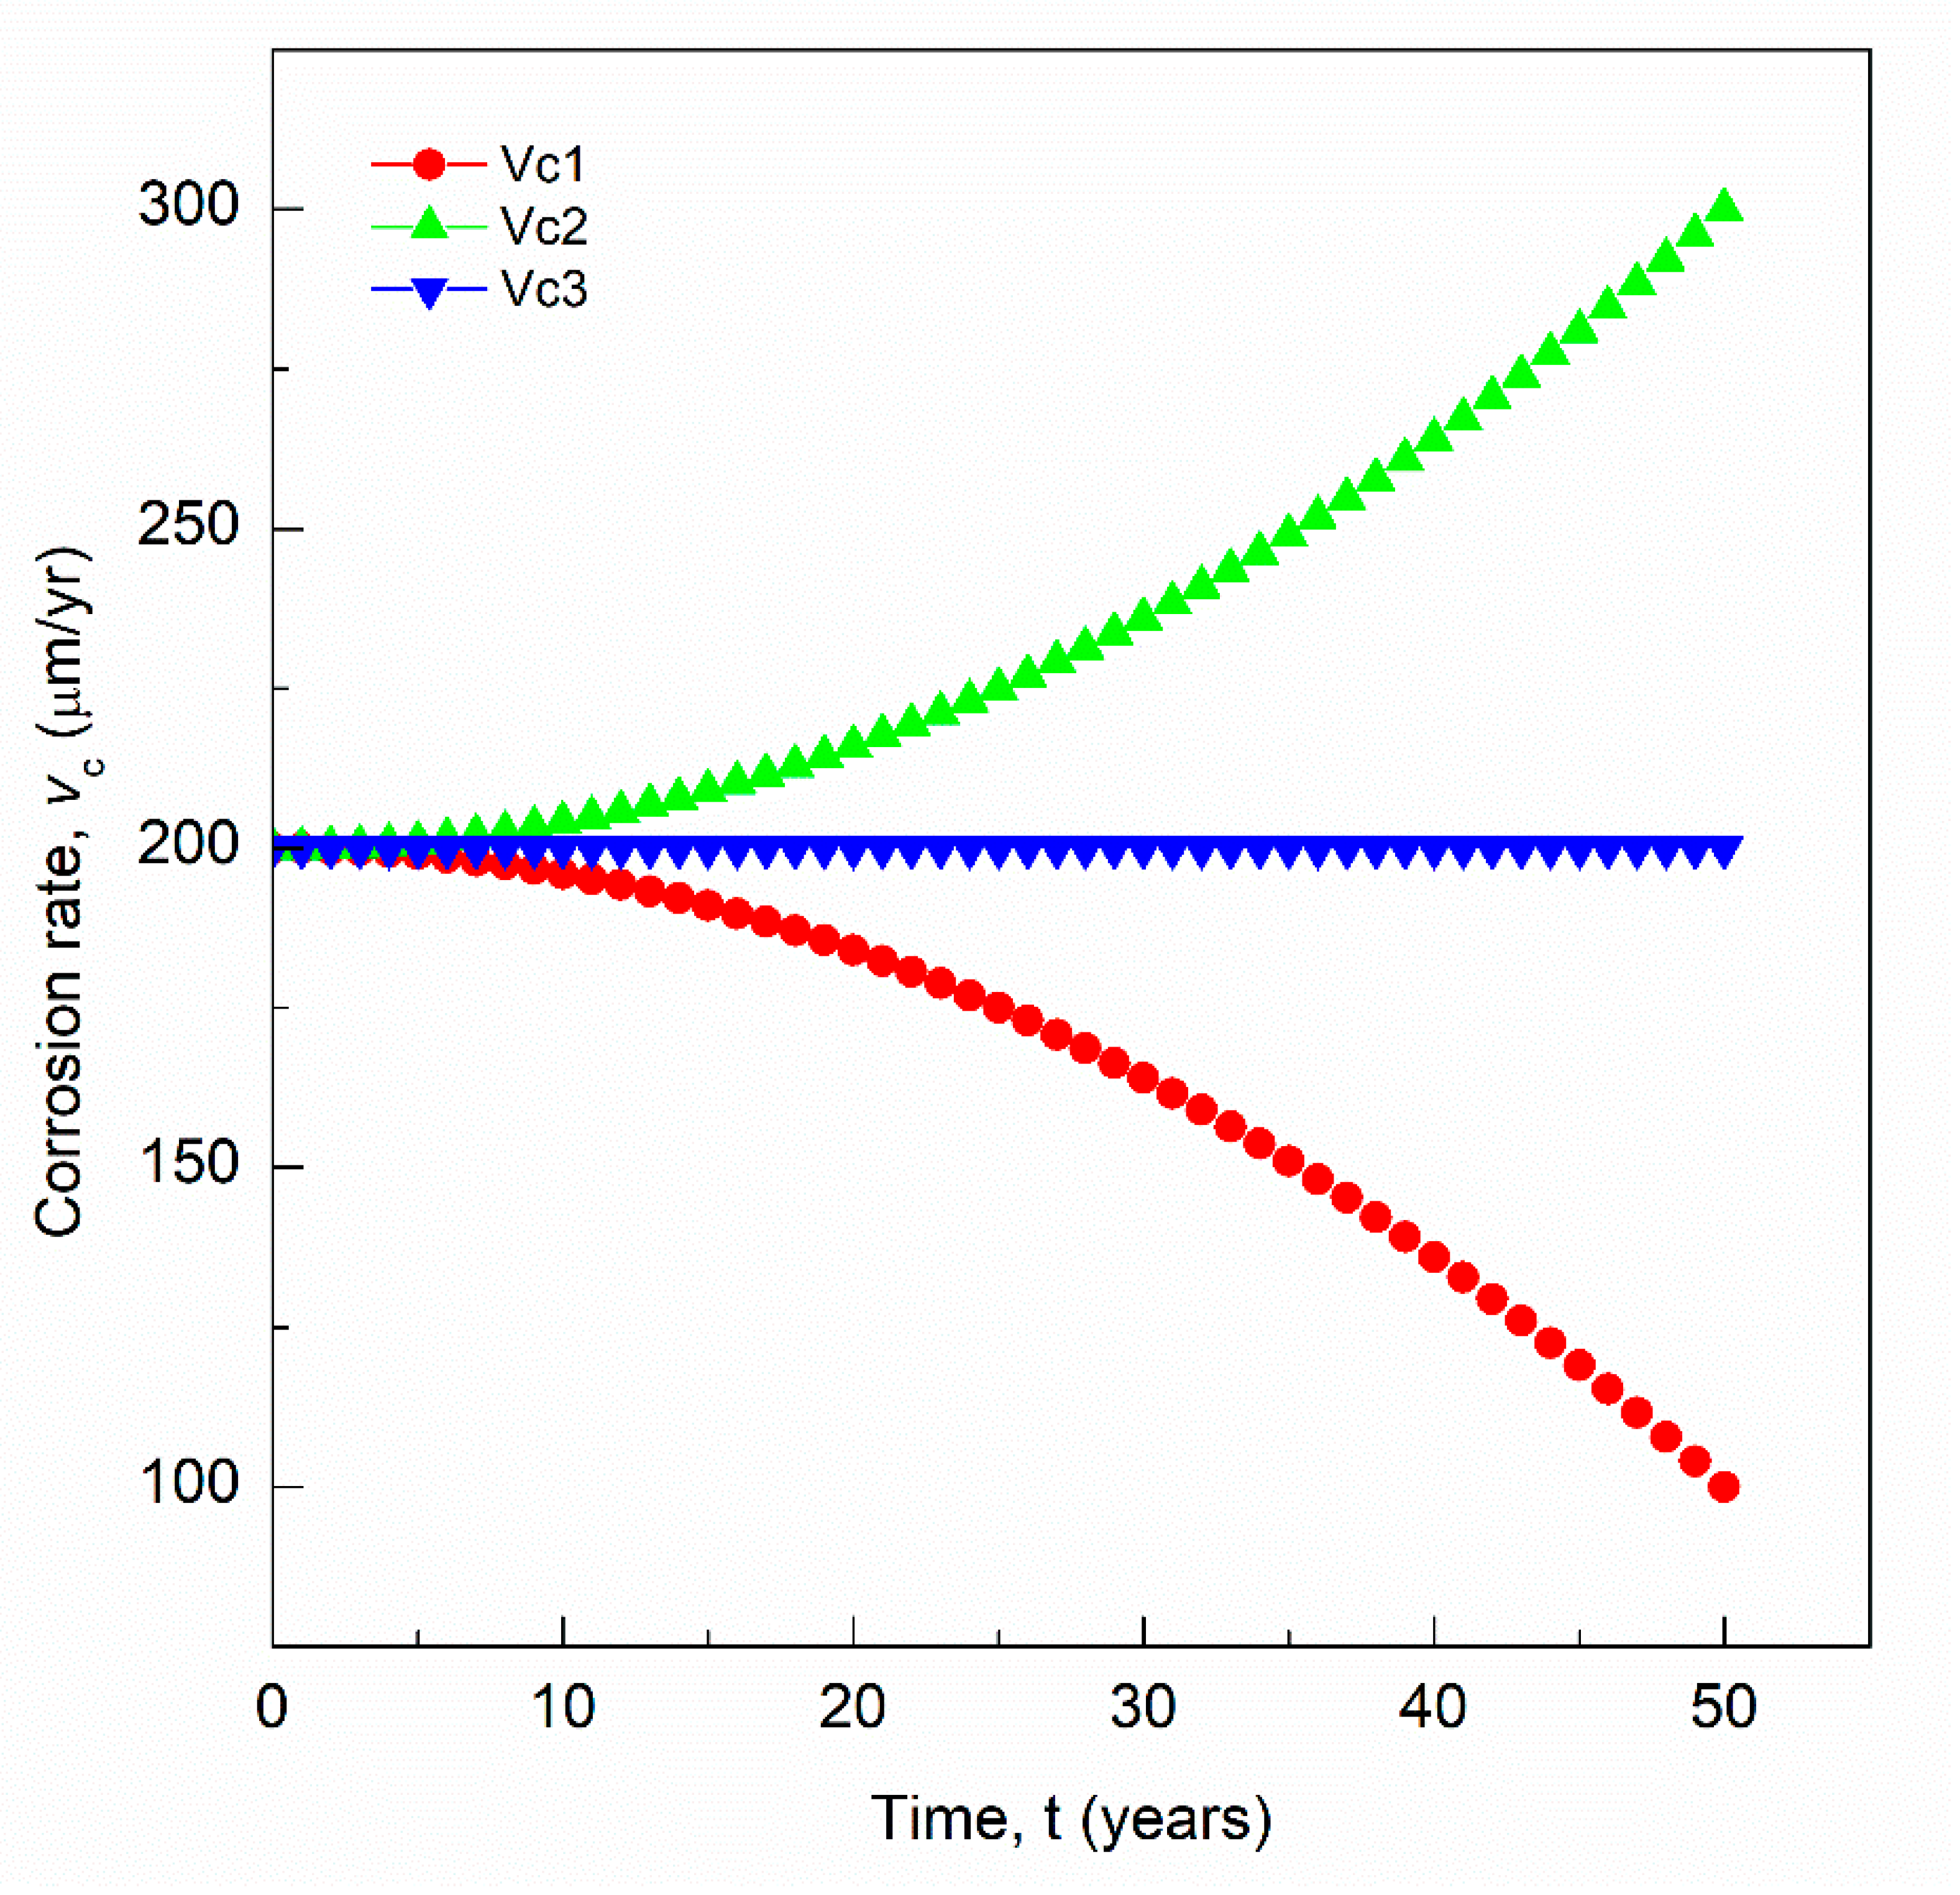
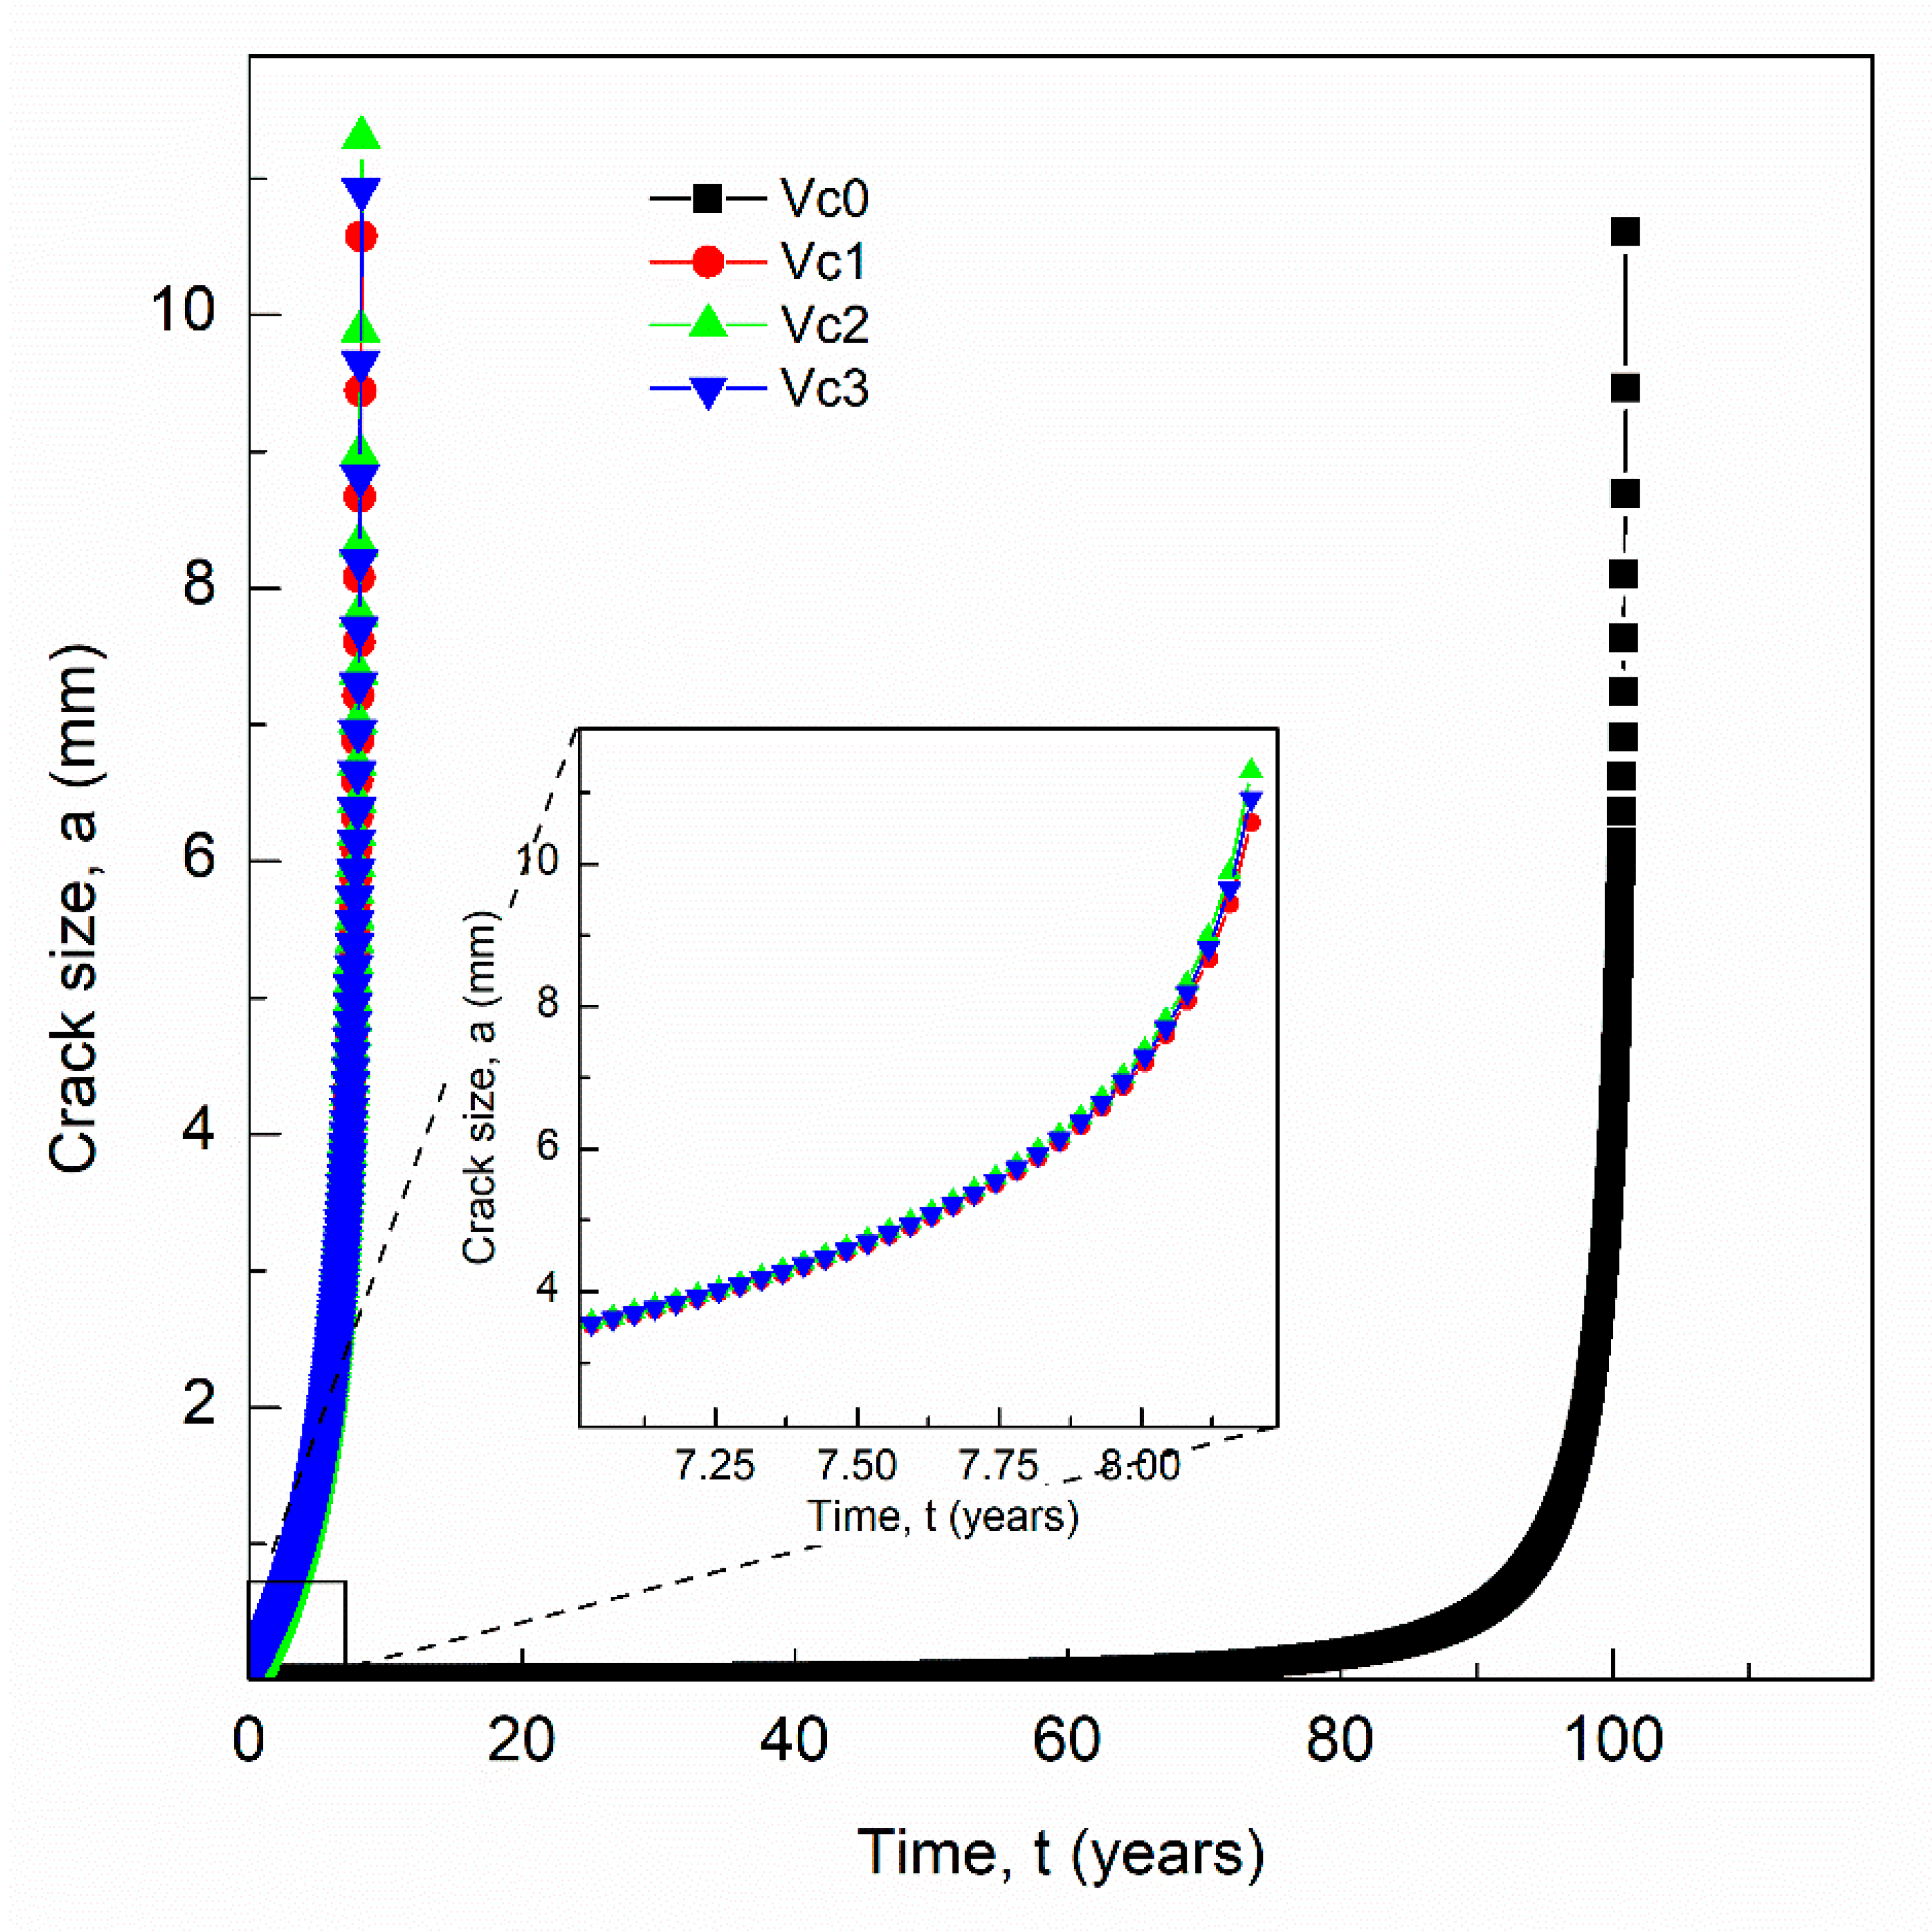
  • A semi-empirical numerical model has been developed to consider the contribution of corrosion during the fatigue process. This model is based on fracture mechanics and it is an iterative process adding the corrosion contribution to crack growth step by step. The inputs for this model came from direct measurement of corrosion rate, chemical composition, mechanical properties and standard fatigue requirements.
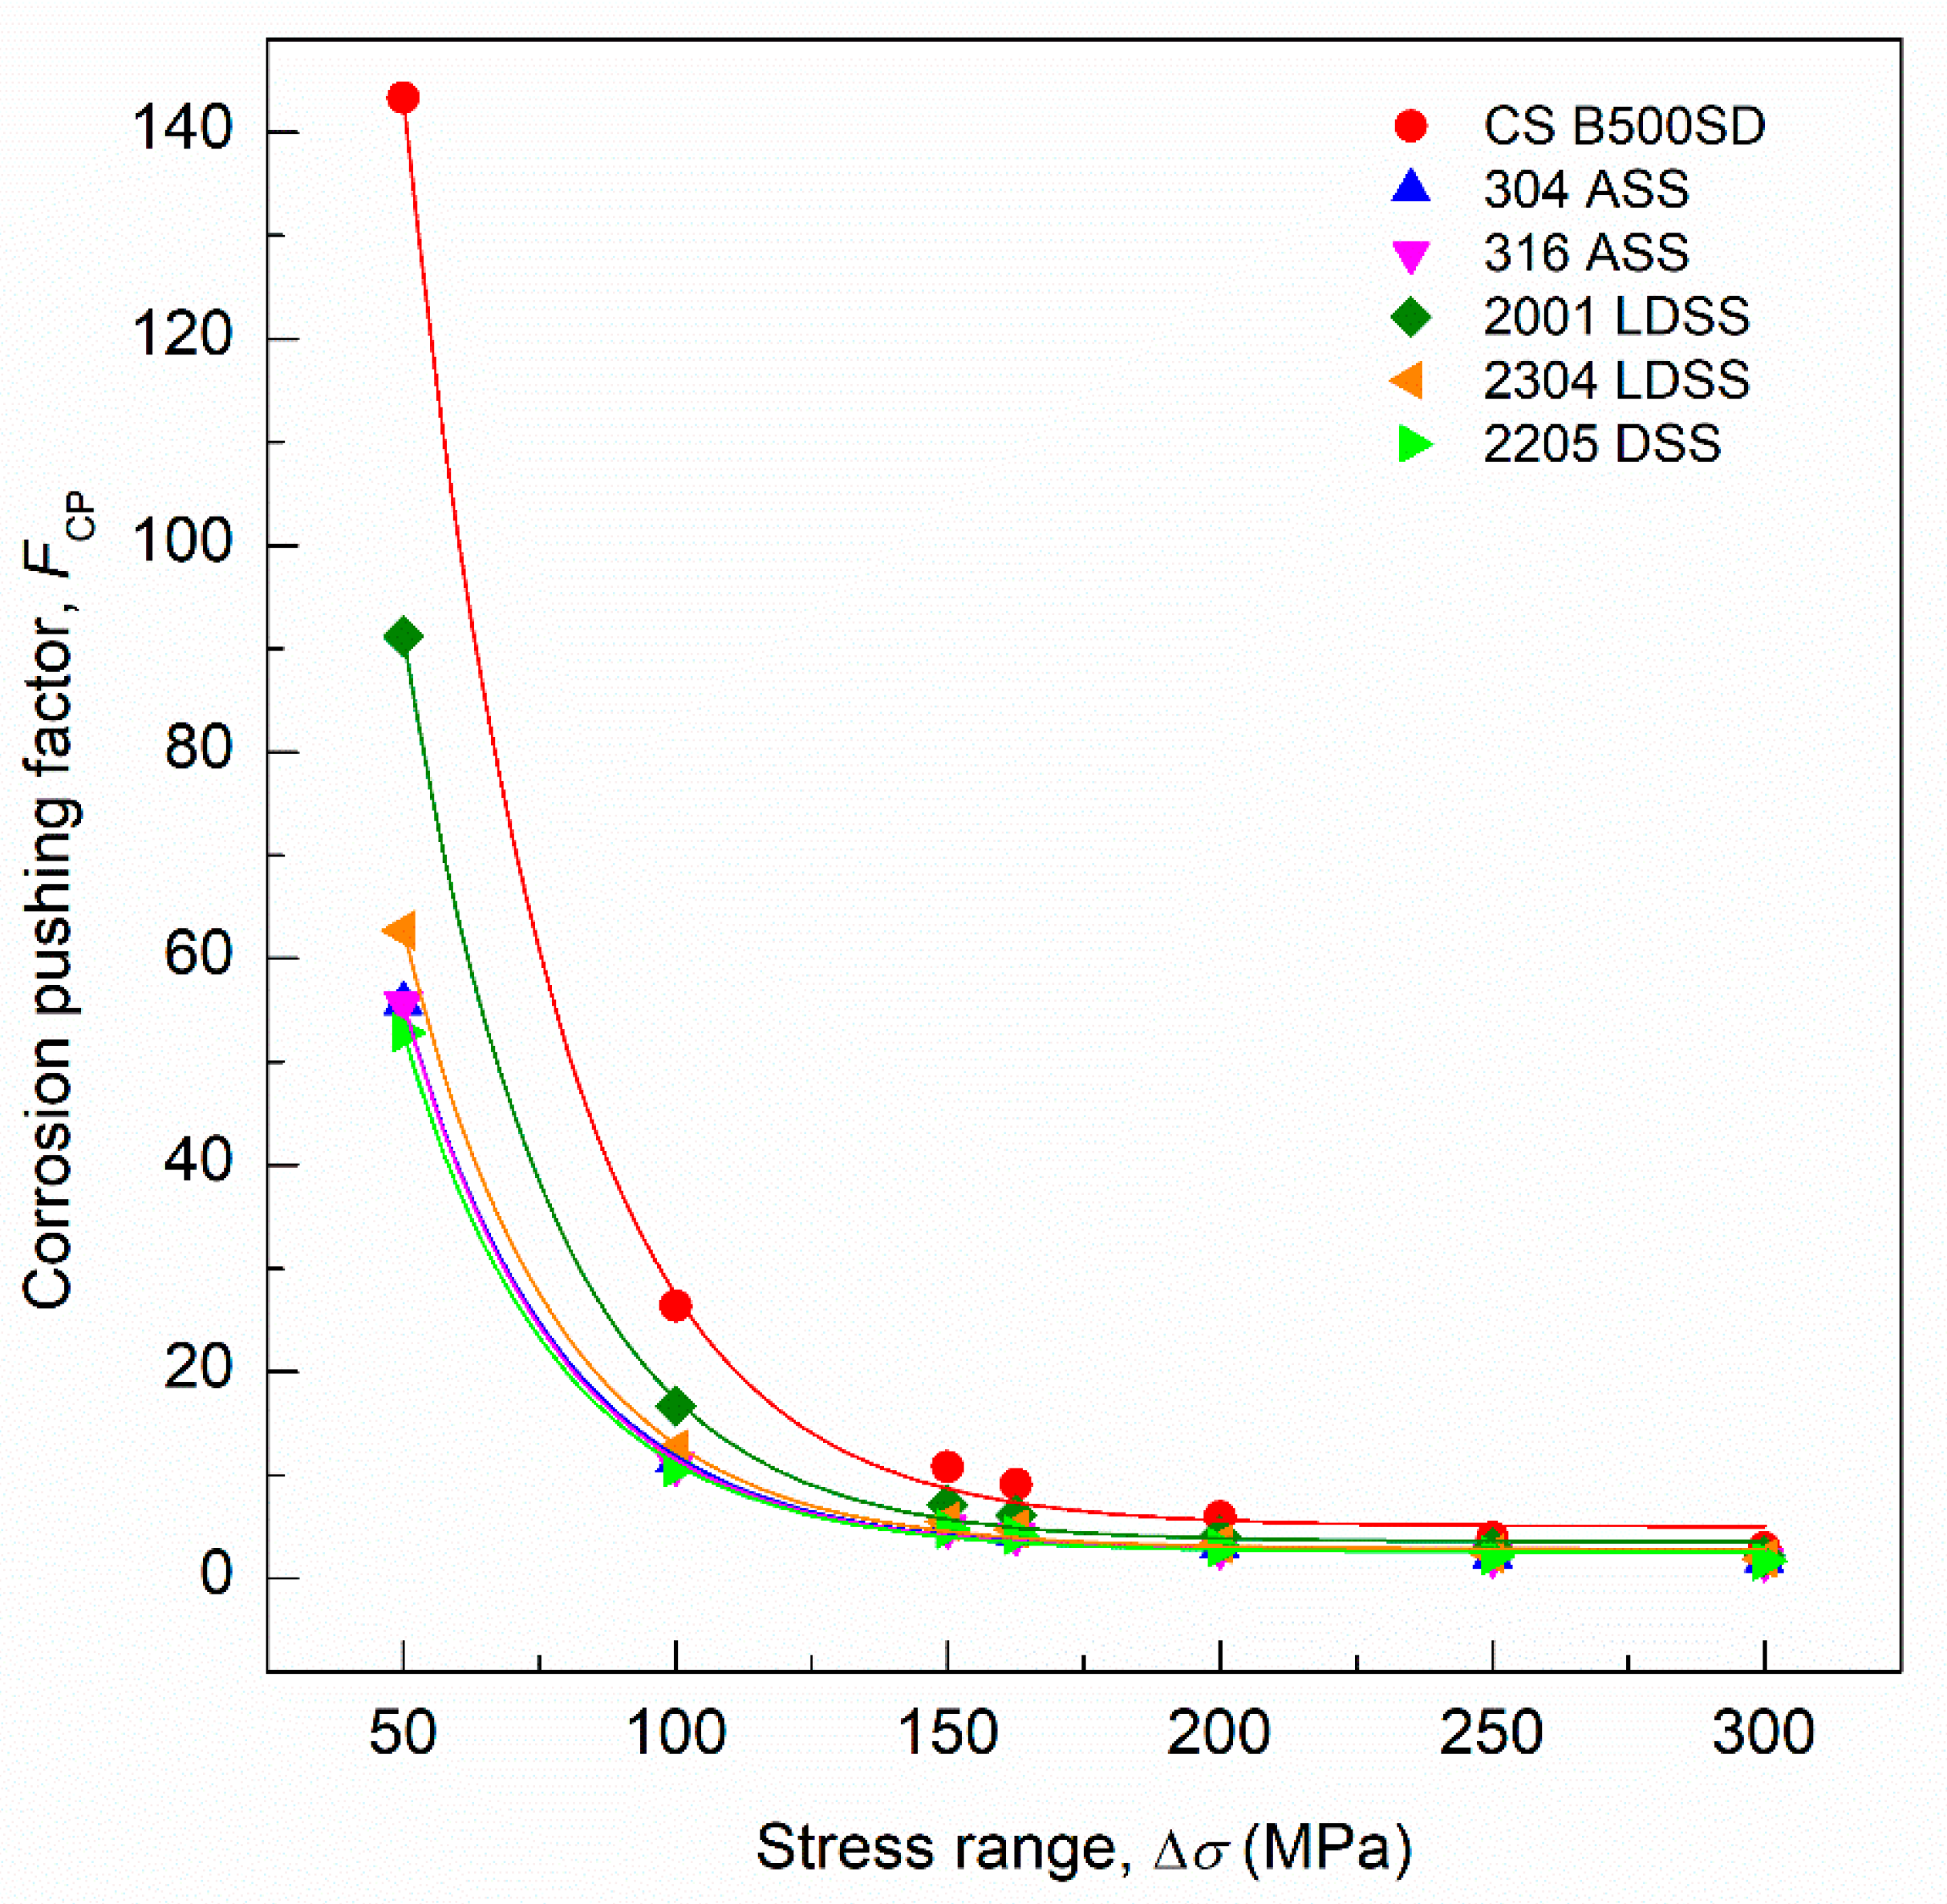
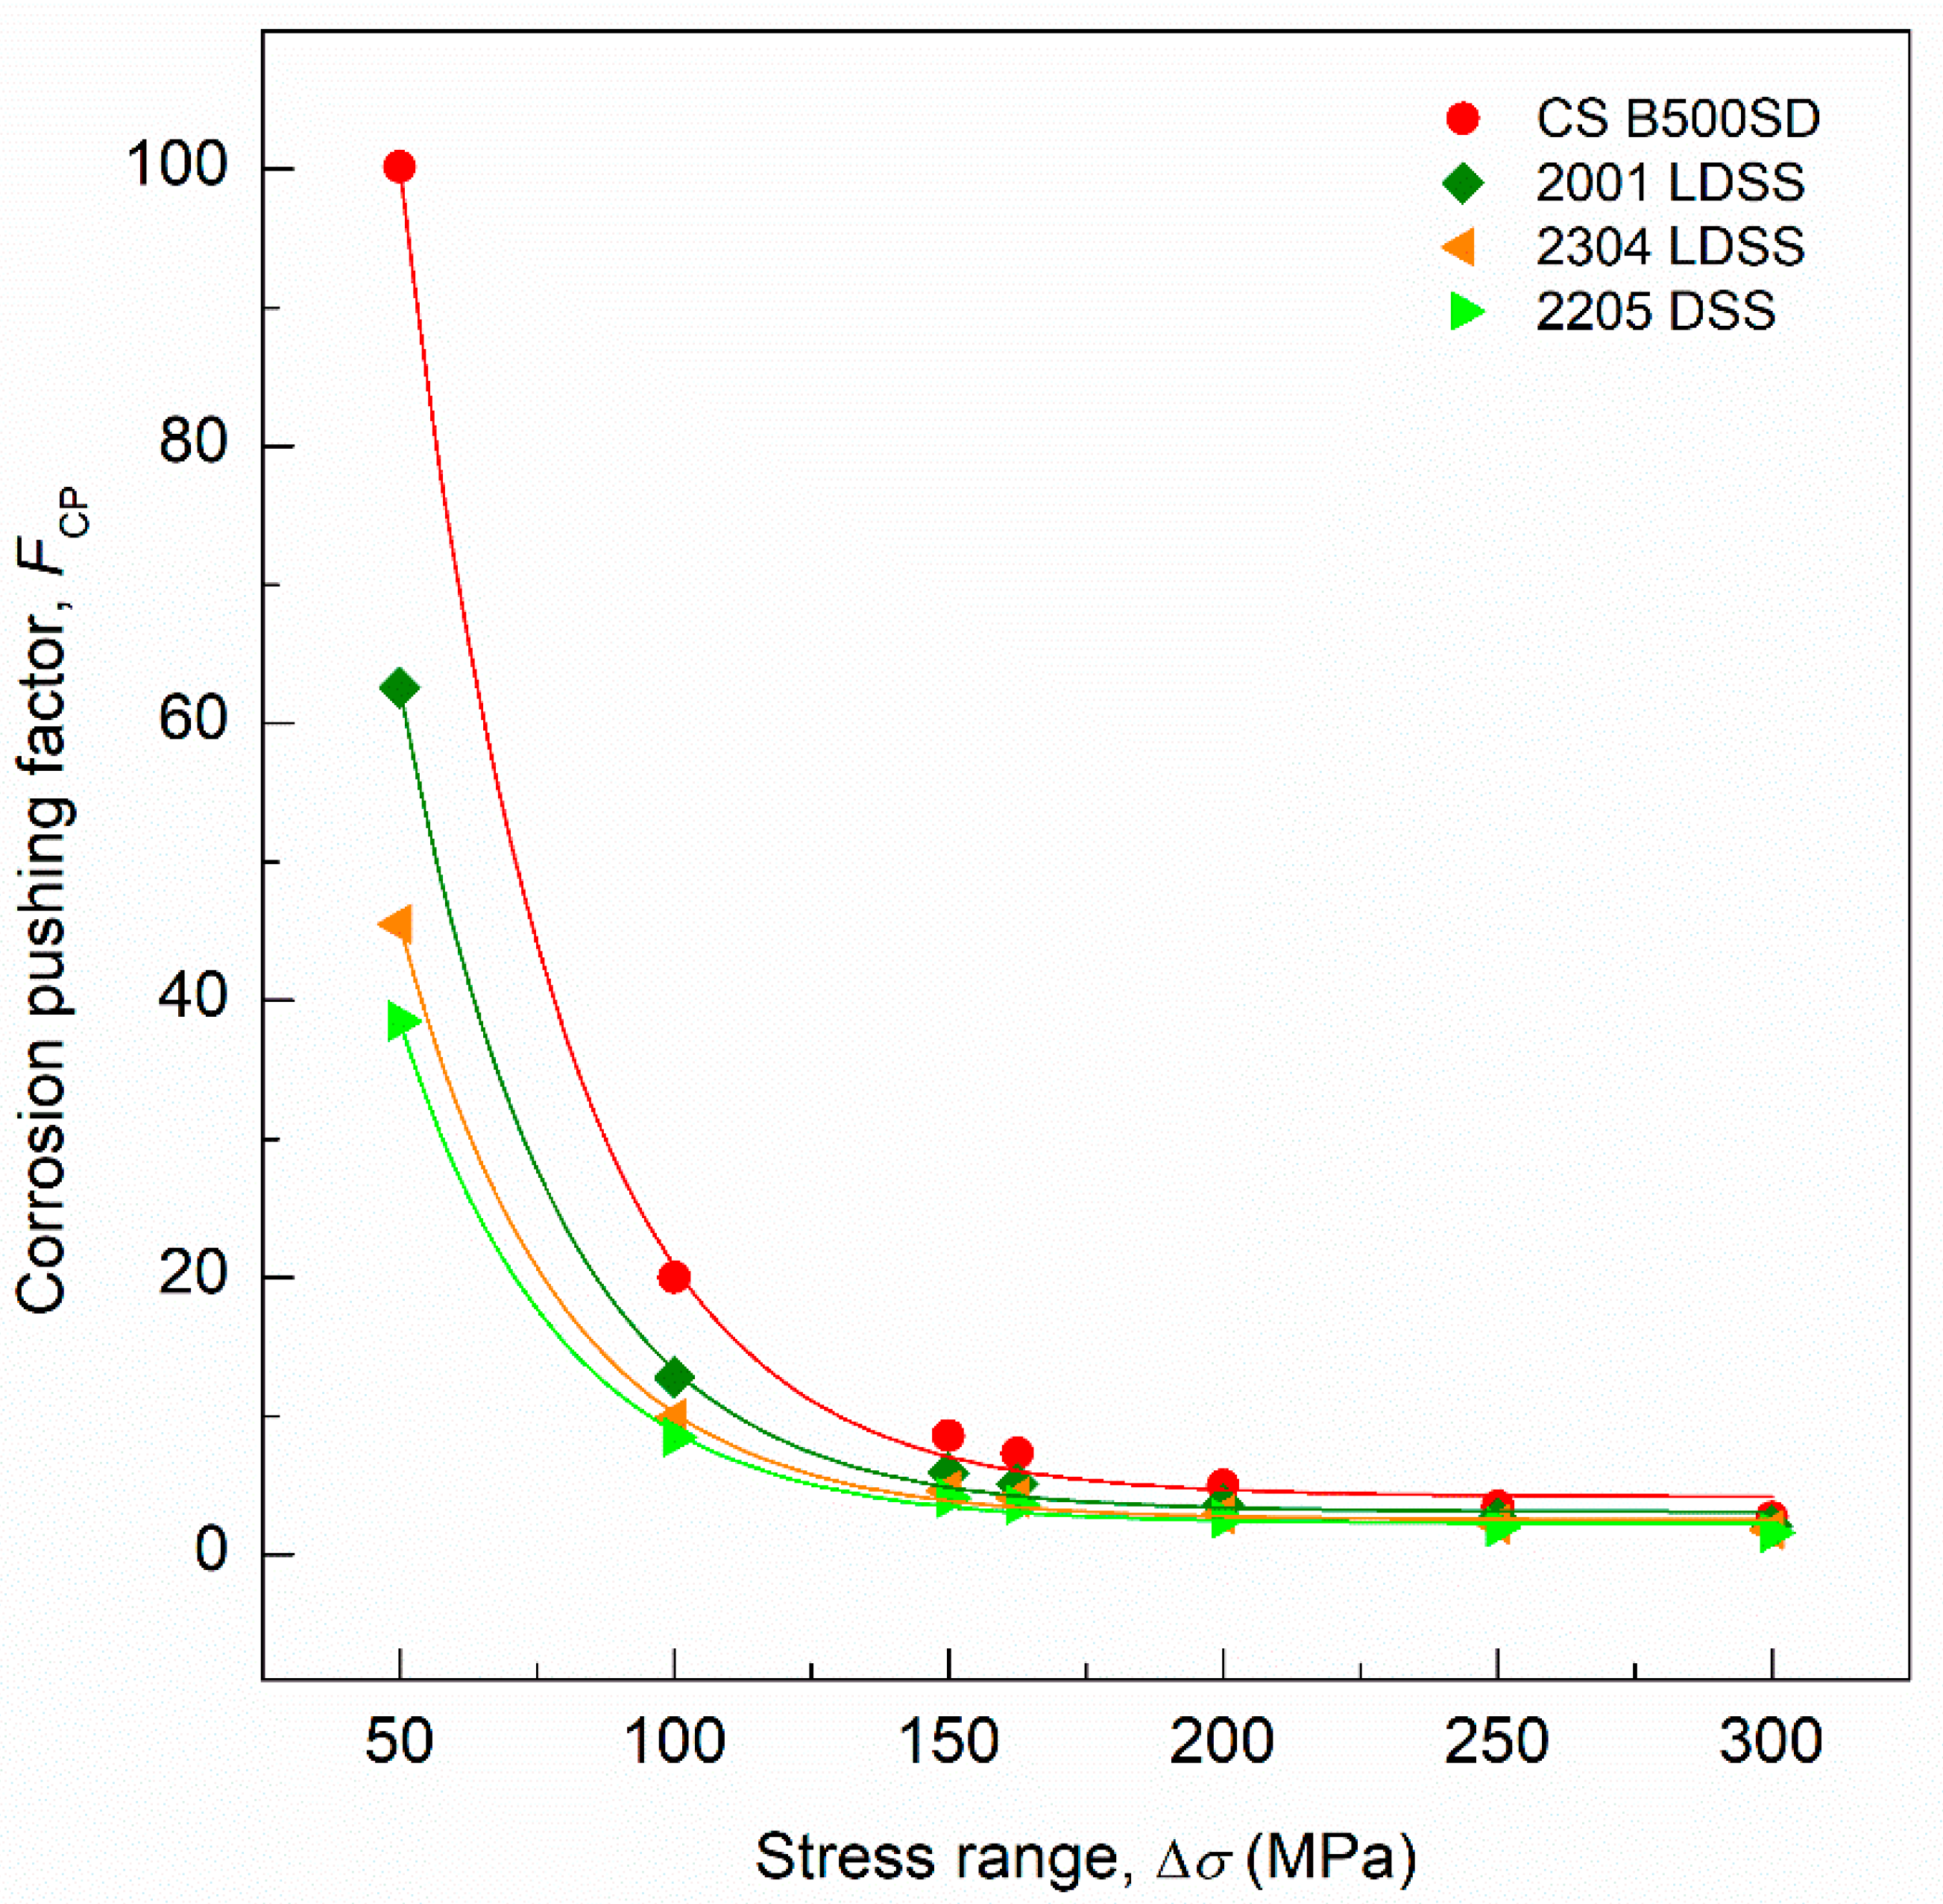
  • The corrosion pushing factor FCP has been defined to consider the synergistic deterioration caused by simultaneous mechanical fatigue and pitting corrosion processes. It increases the number of effective loading cycles during the exposure time to compute fatigue damage as if it was due only to a mechanical process. Besides, it serves as an indicator of corrosion fatigue performance.
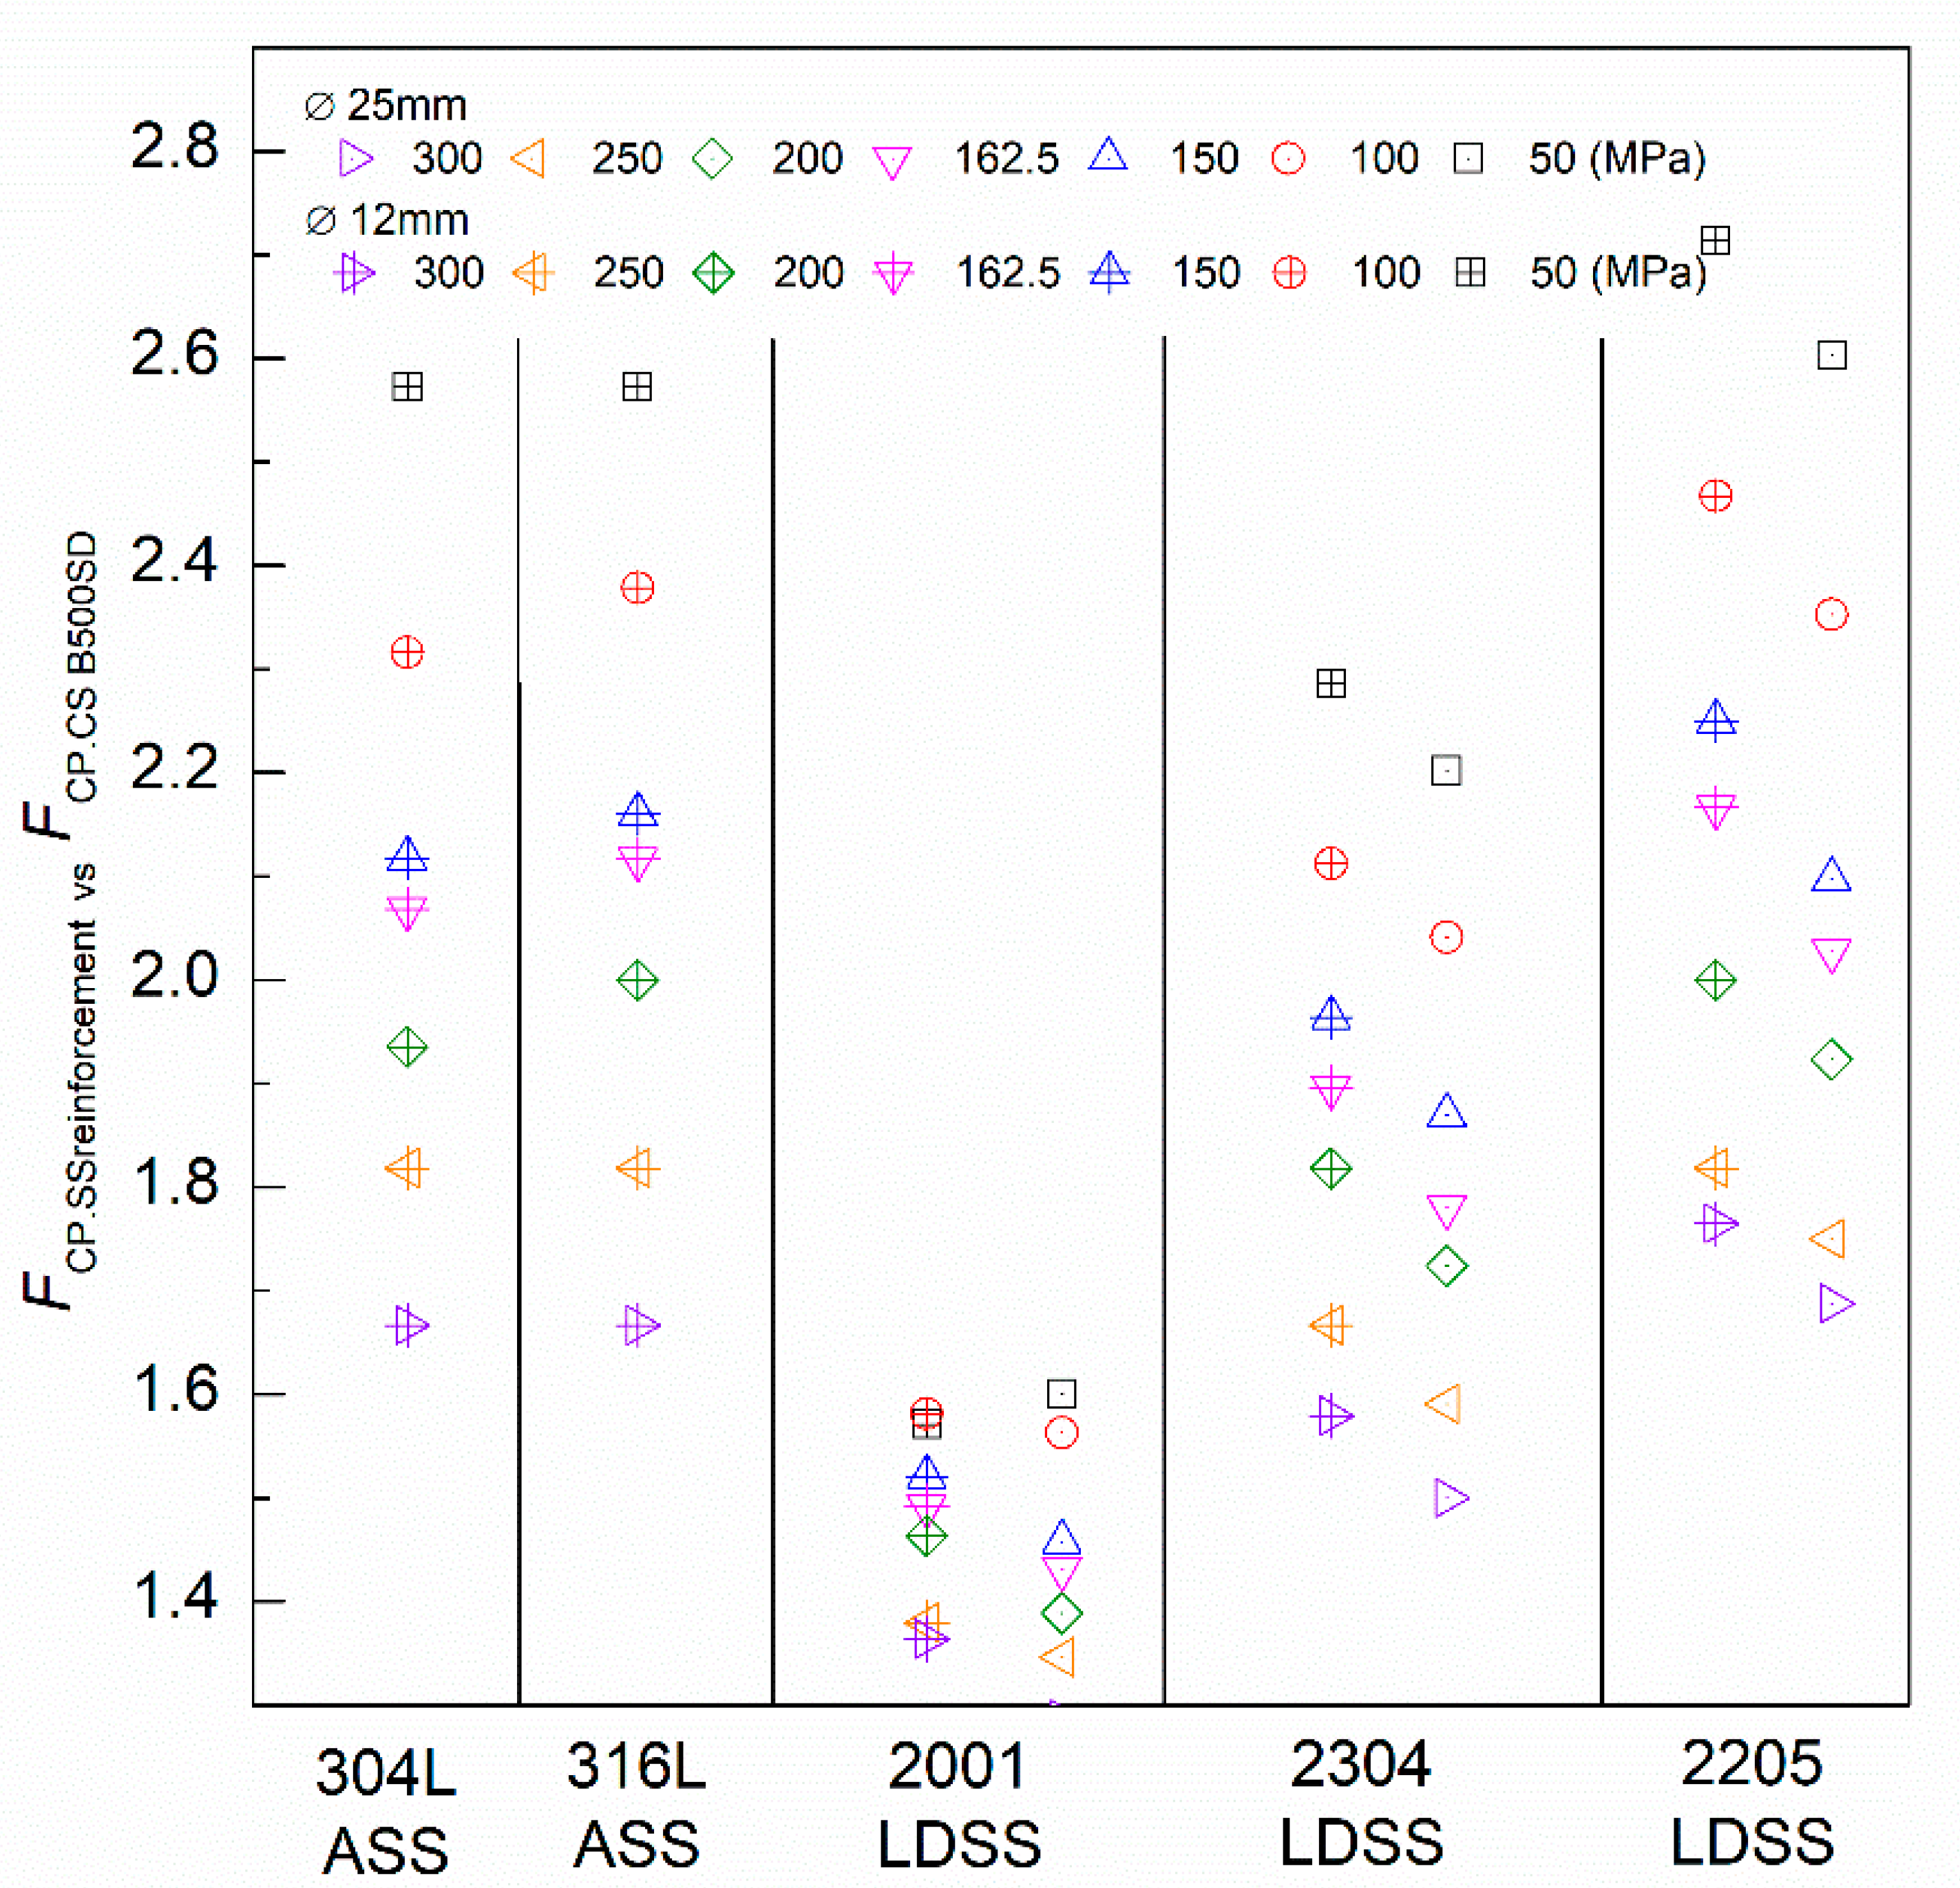
  • Corrosion fatigue life decreased as the reinforcement diameter decreased. It can be due to a higher perimeter to cross-section area relationship, increasing the relative surface under exposure.
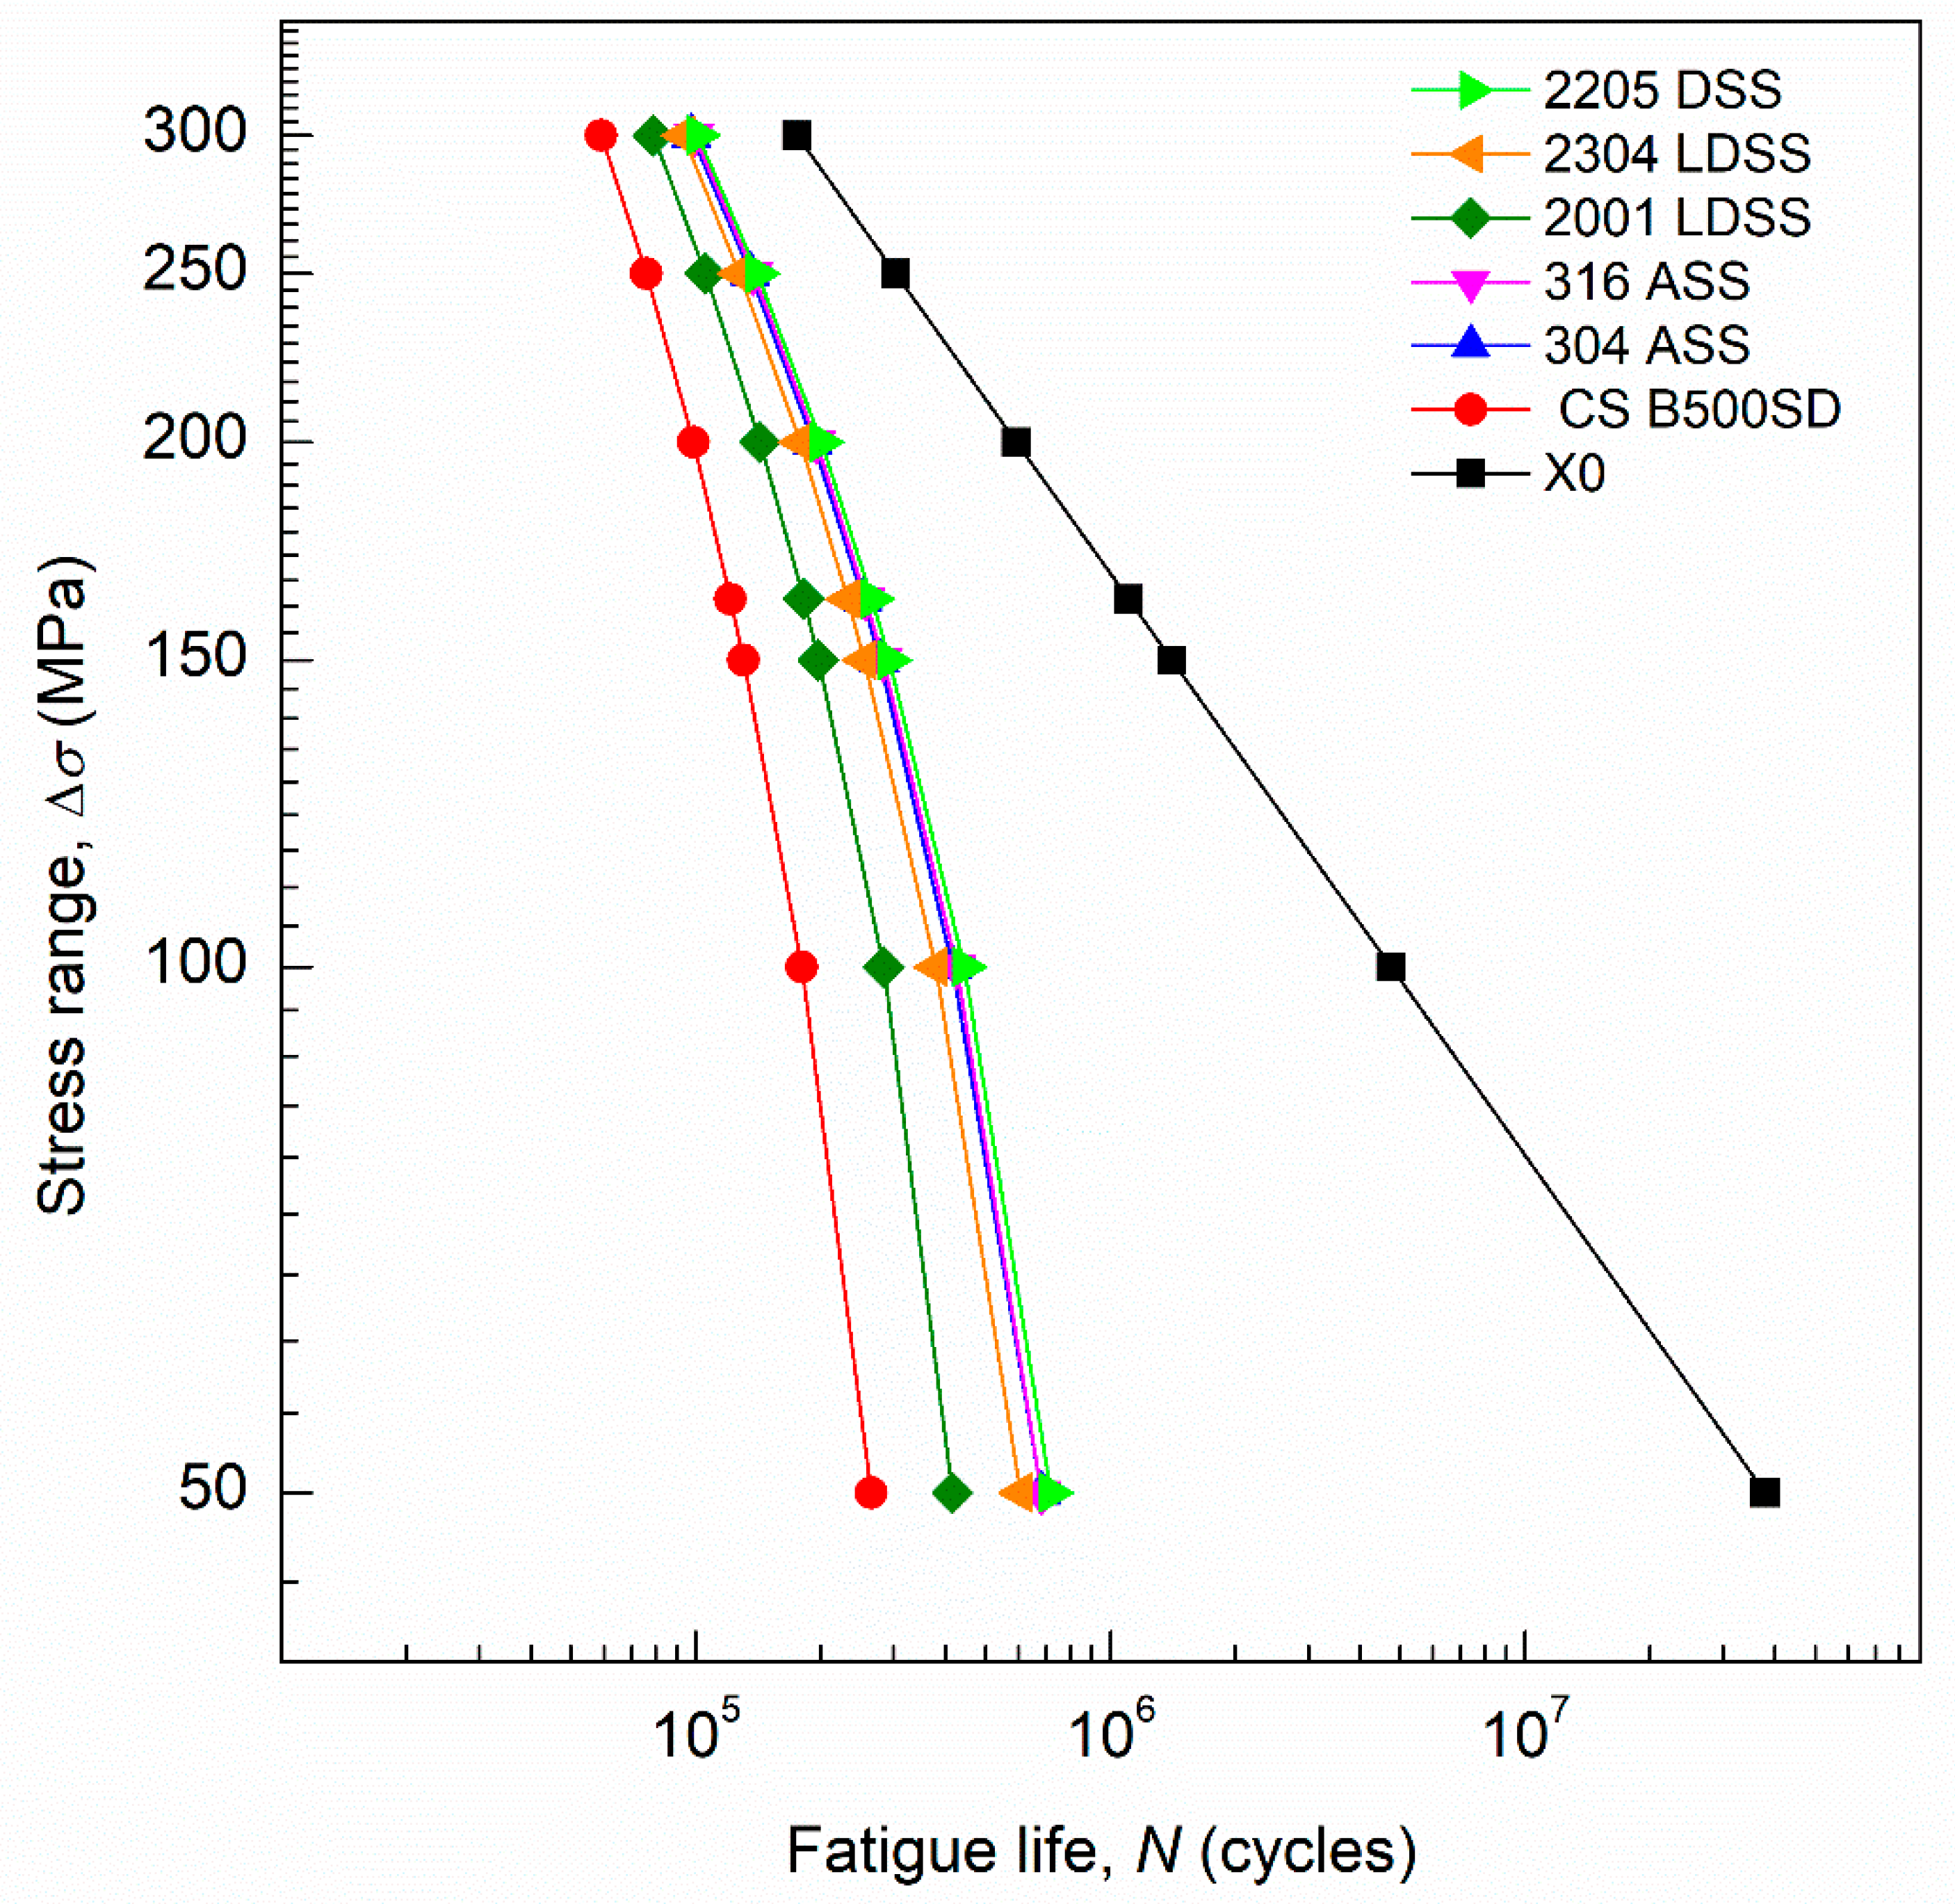
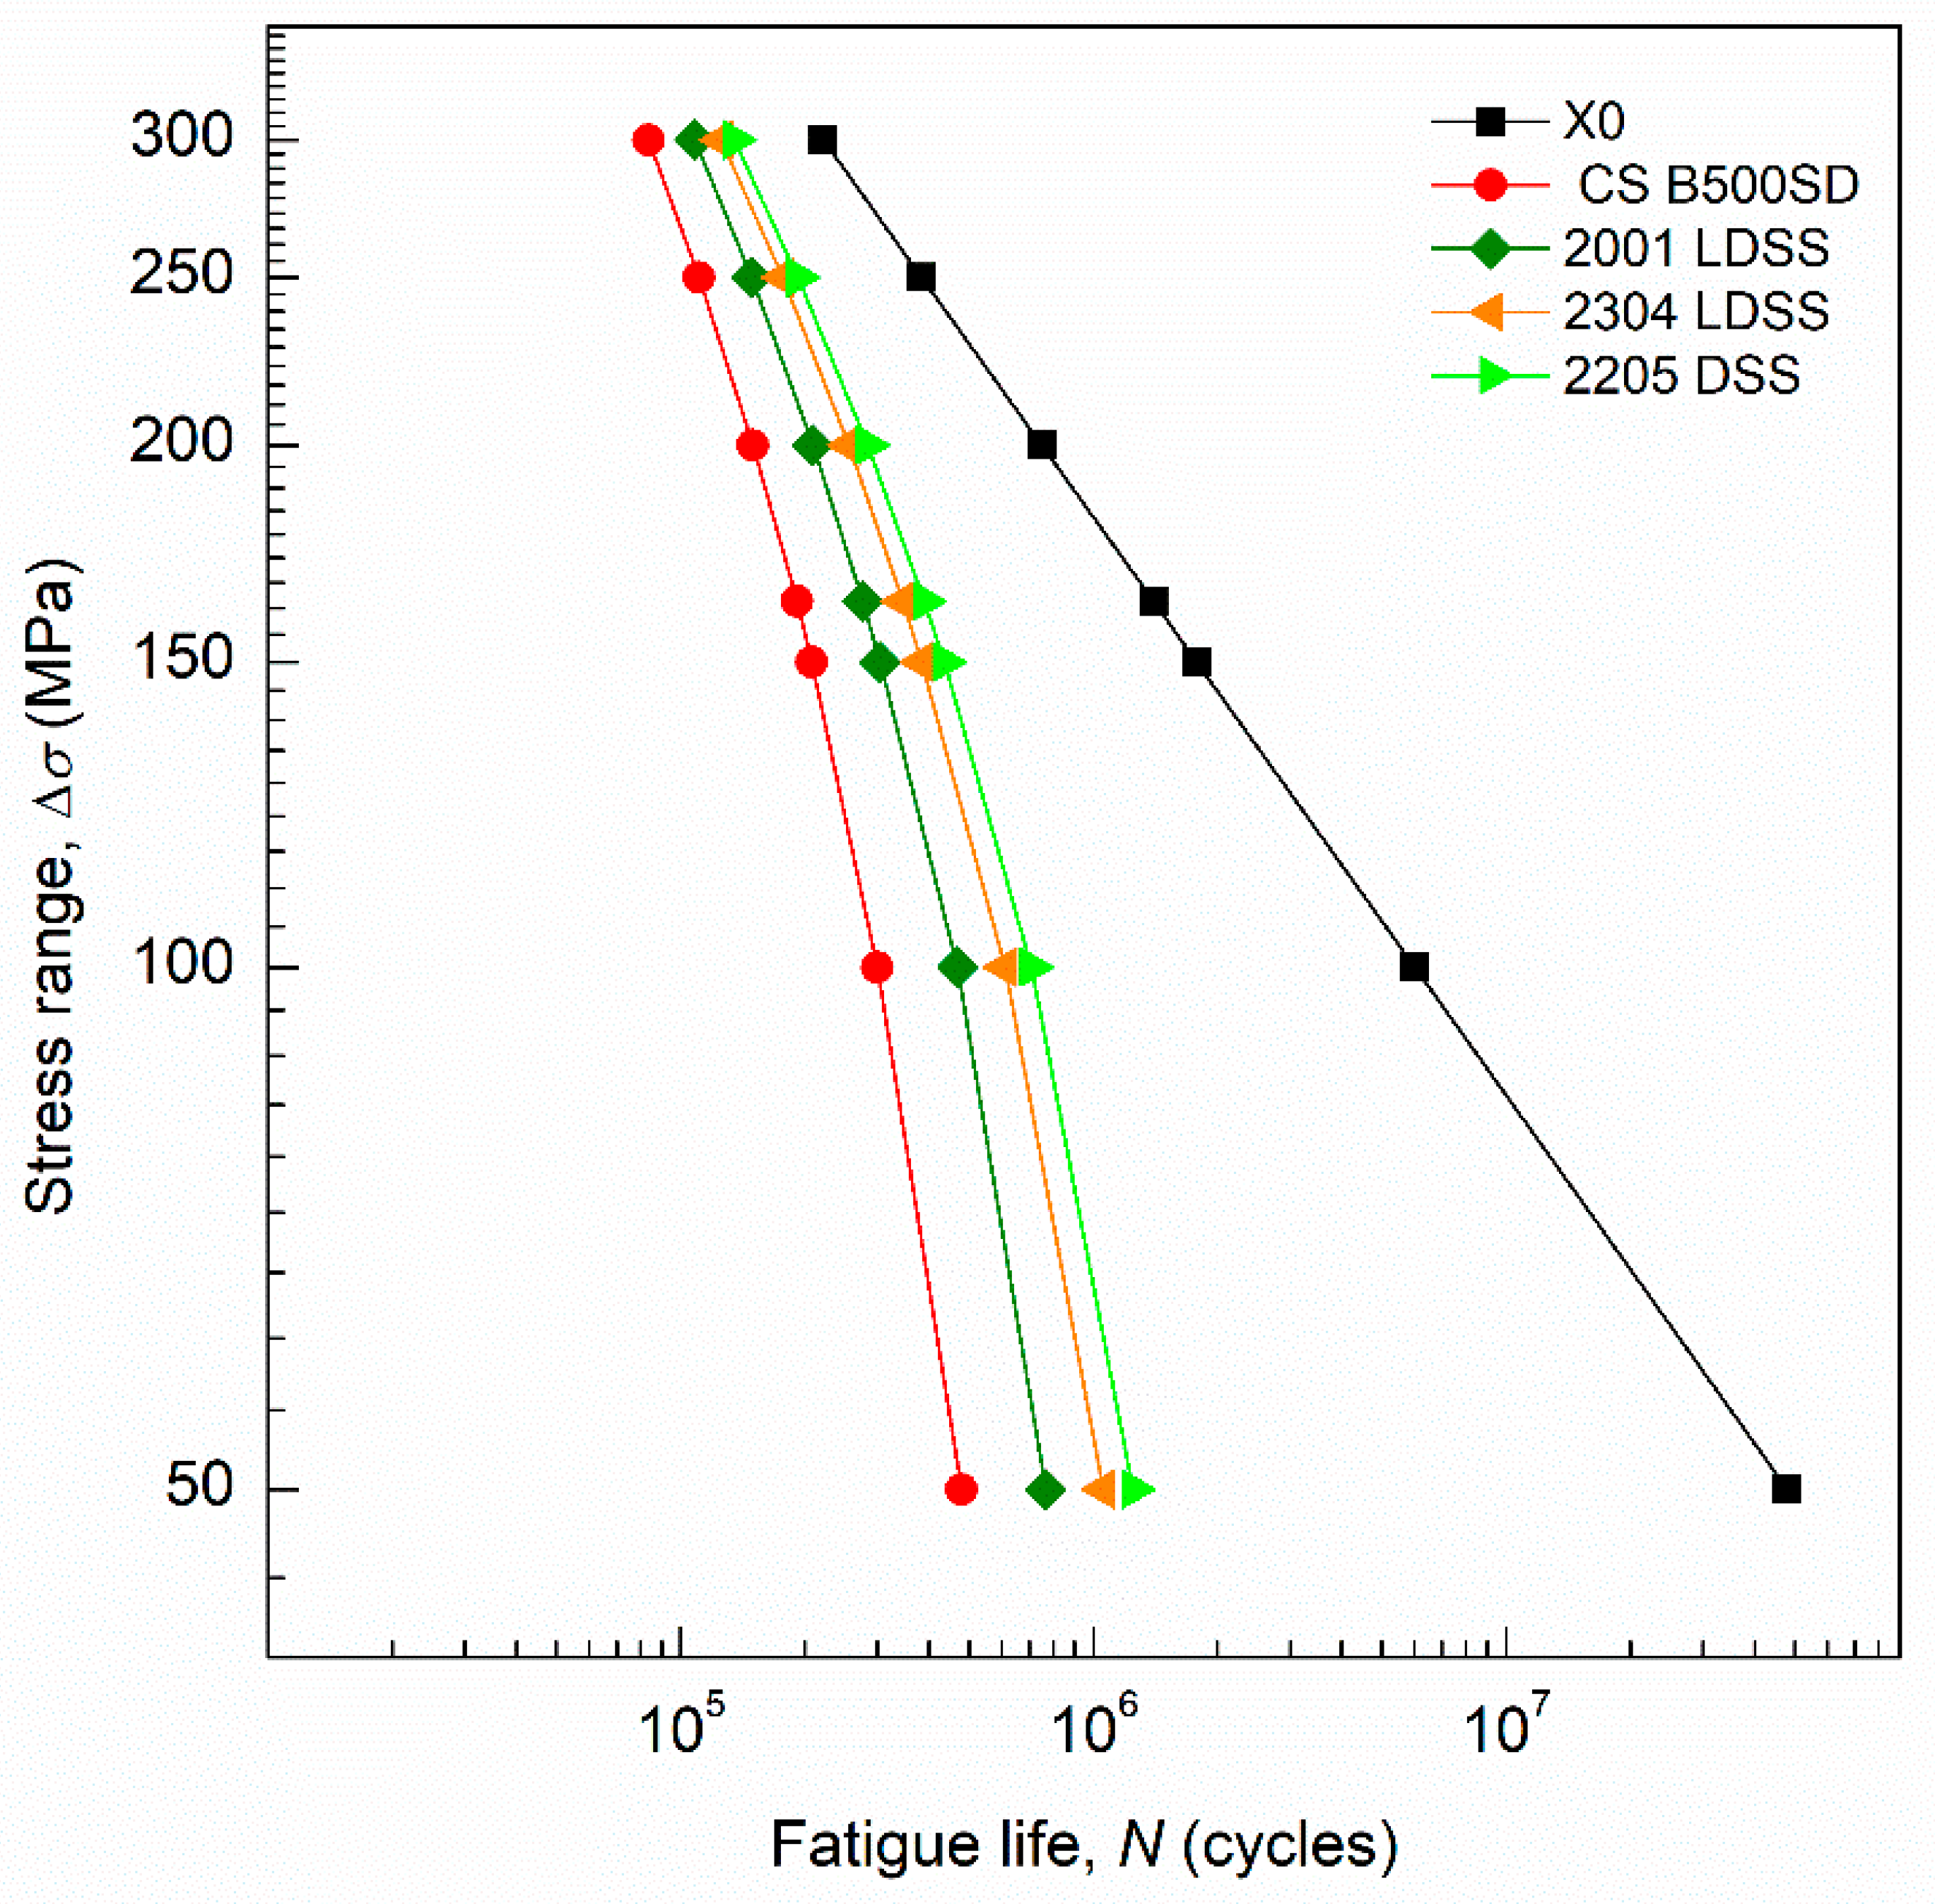
  • The influence of corrosion was clearly higher at lower stress ranges, where the pitting corrosion became more dominant. Figure 4 and Figure 5 show the gap between the specimens at inert X0 and at tidal marine XS3 environments in terms of cycles to failure loss at each stress range level. The lower the stress range, the higher the cycle loss by coupled pitting corrosion.
  • Stainless-steel reinforcements had better corrosion fatigue resistance than carbon steel reinforcements. The values of the corrosion pushing factor endorse the use of stainless-steel reinforcements in marine environments.
  • Comparing 2001 LDSS with B500SD, the performance of 2001 LDSS was 1.5 times better. So, attending to the nickel content, 2001 LDSS is the best cost-performing and it can be a cost-effective alternative for reinforced concrete structures exposed to marine environments, considering material optimization at the design stage and maintenance savings during infrastructure exploitation.
  • The 2001 LDSS presented the lowest corrosion fatigue resistance increment compared to 304L ASS, 316L ASS, 2304 LDSS, and 2205 DSS. Besides, 2205 DSS showed the best improvement, 1.5 times better than 2001 LDSS, which in turn was 1.5 times better than CS B500SD carbon steel.
  • The FCP defined the fatigue service life and damage to structural elements in an easy way. It also served as a performance indicator for comparative purposes.

Author Contributions

I.C.-U.-A. conceived and designed the experimental procedure and methodology, with scientific advice from D.M.B. and E.B. performed the experiments. I.C.-U.-A. and A.M. contributed reagents/materials/analysis tools. U.M. and D.M.B. analyzed the data regarding corrosion potential and intensity, E.B. did it for other parts. I.C.-U.-A. performed the calculations and developed the numerical model with the assistance of A.M. Besides, I.C.U.-A. wrote the original report, while E.B. did the first-draft of the manuscript, U.M. and D.M.B. did the improved version and I.C.-U.-A. the final version, after being revised by I.C.-U.-A. and D.M.B. All authors have read and agreed to the published version of the manuscript.

Funding

The authors would like to acknowledge funding support from Centre for Industrial Technological Development CDTI and ACERINOX EUROPA, that funded the materials and experiments through the grant of IISIS project: IPT-20111023 and UPV/EHU PPGA19/61 contract. Besides, they would also like to acknowledge the University of Akron, Fellowship Program FRC-207367, the IT1314-19 (Basque Government) and GIU19/029 (UPV/EHU) research groupsand the Laboratoire des ciencies de l’ingenieur appliquées, Fédération IPRA-EA4581, from the Université de Pau et Pays de l’Adour, for their support setting a cooperation framework for this research.

Acknowledgments

The tests presented in this manuscript were performed as part of the IISIS: “Investigación Integrada en Islas Sostenibles” (Integrated research in Sustainable Islands) research project, in receipt of funding from the Center for the Development of Industrial Technology (CDTI) and the Technological Fund, part of the Spanish Ministry of Industry, through the INNPRONTA research program. The final goal of the project is to research different technologies for building offshore island-cities, involving construction, energy and smart technologies with leading companies and research centers focused on each field. In the field of construction, the challenge is to develop modular construction and special marine reinforced concrete for the construction of islands that are capable of withstanding corrosive marine environments. In this context, most pathologies linked to reinforced concrete in marine environments are caused by rebar deterioration within the concrete and especially by chloride attack. The use of stainless steels is a very promising way to solve this problem, as has been demonstrated in several tests, among which are those presented in this paper. Finally, we are also especially thankful to ACERINOX EUROPA (part of the ACERINOX Group) for funding the IISIS project, supplying the necessary rebar samples for testing, and particularly to Rafael Sanchez and Julia Contreras from Technical Departments/Labs for their expertise and for their commitment that greatly assisted our research.

Conflicts of Interest

The authors declare no conflict of interest.

References

  1. Bastidas, D.M.; González, J.A.; Feliu, S.; Cobo, A.; Miranda, J.M. A quantitative study of concrete-embedded steel corrosion using potentiostatic pulses. Corrosion 2007, 63, 1094–1100. [Google Scholar] [CrossRef]
  2. Reyes-Diaz, E.P.; Maldonado, B.E.; Almeray, C.F.; Bastidas, D.M.; Baltazar, Z.M.; Chacón, N.J.; Martínez-Villafañe, A.; Bastidas, J.M.; Gaona, T.C. Corrosion behavior of steel embedded in ternary concrete mixtures. Int. J. Electrochem. Sci. 2011, 6, 1892–1905. [Google Scholar]
  3. Lv, J.; Liang, T.; Wang, C.; Dong, L. Comparison of corrosion properties of passive films formed on coarse grained and ultrafine grained AISI 2205 duplex stainless steels. J. Electroan. Chem. 2015, 757, 263–269. [Google Scholar] [CrossRef]
  4. Al-Mehthel, M.; Al-Dulaijan, S.; Al-Idi, S.H.; Shameem, M.; Ali, M.R.; Maslehuddin, M. Performance of generic and proprietary corrosion inhibitors in chloride-contaminated silica fume cement concrete. Constr. Build. Mater. 2009, 23, 1768–1774. [Google Scholar] [CrossRef]
  5. Bastidas, D.M.; La Iglesia, V.M.; Criado, M.; Fajardo, S.; La Iglesia, A.; Bastidas, J.M. A prediction study of hydroxyapatite entrapment ability in concrete. Constr. Build. Mater. 2010, 24, 2646–2649. [Google Scholar] [CrossRef]
  6. Refait, P.; Jeannin, M.; Sabot, R.; Antony, H.; Pineau, S. Corrosion and cathodic protection of carbon steel in the tidal zone: Products, mechanisms and kinetics. Corros. Sci. 2015, 90, 375–382. [Google Scholar] [CrossRef]
  7. Corradi, M.; Schino, A.D.; Borri, A.; Rufini, R. A review of the use of stainless steel for masonry repair and reinforcement. Constr. Build. Mater. 2018, 181, 335–346. [Google Scholar] [CrossRef]
  8. Medina, E.; Medina, J.; Cobo, A.; Bastidas, D.M. Evaluation of mechanical and structural behavior of austenitic and duplex stainless steel reinforcements. Constr. Build. Mater. 2015, 78, 1–7. [Google Scholar] [CrossRef]
  9. ECCS. Good Design Practice—A Guideline for Fatigue Design; Handbook; European Convention for Constructional Steelwork; ECCS: Brussels, Belgium, 2000. [Google Scholar]
  10. BSI. BS6744 Stainless Steel Bars for the Reinforcement of and Use in Concrete-Requirements and Test Methods; Standard; British Standard Institution (BSI): London, UK, 2016. [Google Scholar]
  11. CARES. Stainless Reinforcing Steels; UK Cares: Sevenoaks, UK, 2011. [Google Scholar]
  12. Alonso, M.C.; Luna, F.J.; Criado, M. Corrosion behavior of duplex stainless steel reinforcement in ternary binder concrete exposed to natural chloride penetration. Constr. Build. Mater. 2019, 199, 385–395. [Google Scholar] [CrossRef]
  13. Bautista, A.; Paredes, E.C.; Velasco, F.; Alvarez, S.M. Corrugated stainless steels embedded in mortar for 9 years: Corrosion results of non-carbonated, chloride-contaminated samples. Constr. Build. Mater. 2015, 93, 350–359. [Google Scholar] [CrossRef] [Green Version]
  14. Du, Y.; Cullen, M.; Li, C. Structural effects of simultaneous loading and reinforcement corrosion on performance of concrete beams. Constr. Build. Mater. 2013, 39, 148–152. [Google Scholar] [CrossRef]
  15. Duarte, R.G.; Castela, A.S.; Neves, R.; Freire, L.; Montemor, M.F. Corrosion behavior of stainless steel rebars embedded in concrete: An electrochemical impedance spectroscopy study. Electrochim. Acta 2014, 124, 218–224. [Google Scholar] [CrossRef]
  16. Elsariti, S.M.; Haftirman. Behaviour of stress corrosion cracking of austenitic stainless steels in sodium chloride solutions. Procedia Eng. 2013, 53, 650–654. [Google Scholar] [CrossRef] [Green Version]
  17. Franco, N.; Biscaia, H.; Chastre, C. Experimental and numerical analyses of flexurally-strengthened concrete t-beams with stainless steel. Eng. Struct. 2018, 172, 981–996. [Google Scholar] [CrossRef]
  18. Pachón-Montaño, A.; Sánchez-Montero, J.; Andrade, C.; Fullea, J.; Moreno, E.; Matres, V. Threshold concentration of chlorides in concrete for stainless steel reinforcement: Classic austenitic and new duplex stainless steel. Constr. Build. Mater. 2018, 186, 495–592. [Google Scholar] [CrossRef]
  19. Pérez-Quiroz, J.T.; Terán, J.; Herrera, M.J.; Martínez, M.; Genescá, J. Assessment of stainless steel reinforcement for concrete structures rehabilitation. J. Constr. Steel Res. 2008, 64, 1317–1324. [Google Scholar] [CrossRef]
  20. Tsai, W.T.; Chen, M.S. Stress corrosion cracking behavior of 2205 duplex stainless steel in concentrated nacl solution. Corros. Sci. 2000, 42, 545–559. [Google Scholar] [CrossRef]
  21. Adedipe, O.; Brennan, F.; Kolios, A. Corrosion fatigue load frequency sensitivity analysis. Mar. Struct. 2015, 42, 115–136. [Google Scholar] [CrossRef]
  22. Calderón-Uríszar-Aldaca, I.; Briz, E.; Biezma, M.V.; Puente, I. A plain linear rule for fatigue analysis under natural loading considering the coupled fatigue and corrosion effect. Int. J. Fatigue 2019, 122, 141–151. [Google Scholar] [CrossRef]
  23. Ma, Y.; Xiang, Y.; Wang, L.; Zhang, J.; Liu, Y. Fatigue life prediction for aging RC beams considering corrosive environments. Eng. Struct. 2014, 79, 211–221. [Google Scholar] [CrossRef]
  24. Calderon-Uriszar-Aldaca, I.; Biezma, M. A plain linear rule for fatigue analysis under natural loading considering the sequence effect. Int. J. Fatigue 2017, 103, 386–394. [Google Scholar] [CrossRef] [Green Version]
  25. Calderon-Uriszar-Aldaca, I.; Biezma, M.; Matanza, A.; Briz, E.; Bastidas, D.M. Second-order fatigue of intrinsic mean stress under random loadings. Int. J. Fatigue 2020, 130, 105257. [Google Scholar] [CrossRef]
  26. Calderon-Uriszar-Aldaca, I. Fatigue of Structural Elements by Random Dynamic Actions in Aggressive Environment. Ph.D. Thesis, Universidad de Cantabria, Santander, Spain, 2014. [Google Scholar]
  27. Knop, M.; Heath, J.; Sterjovski, Z.; Lynch, S.P. Effects of cycle frequency on corrosion-fatigue crack growth in cathodically protected high-strength steels. Procedia Eng. 2010, 2, 1243–1252. [Google Scholar] [CrossRef] [Green Version]
  28. Gingell, A.D.B.; King, J.E. The effect of frequency and microstructure on corrosion fatigue crack propagation in high strength aluminium alloys. Acta Mater. 1997, 45, 3855–3870. [Google Scholar] [CrossRef]
  29. Palmgren, A.G. Die Lebensdauer von Kugellagern. Z. Ver. Dtsch. Ing. 1924, 14, 339–341. [Google Scholar]
  30. Miner, M. Cumulative damage in fatigue. J. Appl. Mech. 1945, 67, 159–164. [Google Scholar]
  31. Wöhler, A. Über die festigkeitsversuche mit eisen und stahl. Z. Bauwes. 1870, 20, 73–106. [Google Scholar]
  32. CEN. EN 1992-1-1 Design of Concrete Structures—Part 1-1: General Rules and Rules for Buildings; Standard; Comité Européen de Normalisation: Brussels, Belgium, 2015. [Google Scholar]
  33. AISC. Fatigue and Fracture Control in Steel Structures; Standard; American Institute of Steel Construction: Chicago, IL, USA, 2007. [Google Scholar]
  34. CEN. EN 1993-1-9 Design of Steel Structures—Part 1-9: Fatigue; Standard; Comité Européen de Normalisation: Brussels, Belgium, 2013. [Google Scholar]
  35. Paris, P.; Erdogan, F. A critical analysis of crack propagation laws. J. Fluids Eng. 1963, 85, 528–533. [Google Scholar] [CrossRef]
  36. Irwin, G. Analysis of stresses and strains near the end of a crack traversing a plate. J. Appl. Mech. 1957, 24, 361–364. [Google Scholar]
  37. Olguin Coca, F.J.; Loya Tello, M.U.; Gaona-Tiburcio, C.; Romero, J.A.; Martínez-Villafañe, A.; Maldonado, B.E.; Almeraya-Calderón, F. Corrosion Fatigue of Road Bridges: A review. Int. J. Electrochem. Sci. 2011, 6, 3438–3451. [Google Scholar]
  38. Adedipe, O.; Brennan, F.; Kolios, A. Review of corrosion fatigue in offshore structures: Present status and challenges in the offshore wind sector. Renew. Sustain. Energy Rev. 2016, 61, 141–154. [Google Scholar] [CrossRef]
  39. Calderon-Uriszar-Aldaca, I.; Briz, E.; Larrinaga, P.; Garcia, H. Bonding strength of stainless steel rebars in concretes exposed to marine environments. Constr. Build. Mater. 2018, 172, 125–133. [Google Scholar] [CrossRef]
  40. CEN. EN 206:2013+A1:2016 Concrete. Specification, Performance, Production and Conformity; Standard; Comité Européen de Normalisation: Brussels, Belgium, 2016. [Google Scholar]
  41. CEN. UNE-EN 10080 Steel for the Reinforcement of Concrete—Weldable Reinforcing Steel—General; Standard; Comité Européen de Normalisation: Brussels, Belgium, 2016. [Google Scholar]
  42. CEN. UNE-EN 10088-1 Stainless Steels—Part 1: List of Stainless Steels; Standard; Comité Européen de Normalisation: Brussels, Belgium, 2006. [Google Scholar]
  43. CEN. UNE-EN ISO 11130 Corrosion of Metals and Alloys—Alternate Immersion Test in Salt Solution; Standard; Comité Européen de Normalisation: Brussels, Belgium, 2011. [Google Scholar]
  44. Sánchez-Deza, A.; Bastidas, D.M.; Iglesia, A.L.; Mora, E.; Bastidas, J. Predicción de la vida útil en servicio de edificios de 50 años expuestos a ambientes marinos. Rev. Metal. 2018, 54, e111. [Google Scholar] [CrossRef] [Green Version]
  45. ECCS. Document 43—Recommendations for the Fatigue Design of Steel Structures; Handbook; European Convention for Constructional Steelwork; ECCS: Brussels, Belgium, 2011. [Google Scholar]
  46. CEN. UNE-EN ISO 15630-1 Steel for the Reinforcement and Prestressing of Concrete—Test Methods—Part 1: Reinforcing Bars, Wire rod and Wire; Standard; Comité Européen de Normalisation: Brussels, Belgium, 2011. [Google Scholar]
  47. CPH. EHE-08 Instrucción de Hormigón Estructural; Standard; Spanish Ministry of Public Works: Madrid, Spain, 2008. [Google Scholar]
  48. AENOR. UNE 112072 Laboratory Measurement of Corrosion Speed Using the Polarization Resistance Technique; Standard; Asociación Española de Normalización: Madrid, Spain, 2011. [Google Scholar]
  49. Hirt, M.; Bez, R.; Nussbaumer, A. Construction Métallique: Notions Fondamentales et Méthodes de Dimensionnement. Traité de Génie Civil, 1st ed.; Presses Polytechniques et Universitaires Romandes: Lausanne, Switzerland, 2006. [Google Scholar]
  50. Rocha, M.; Brühwiler, E. Prediction of fatigue life of reinforced concrete bridges using fracture mechanics. Proc. Bridge Maint. Saf. Manag. Resil. Sustain. 2012, 1, 3755–3761. [Google Scholar] [CrossRef] [Green Version]
  51. Herwig, A. Reinforced Concrete Bridges under Increased Railway Traffic Loads: Fatigue Behaviour and Safety Measures. Ph.D. Thesis, École Polytechnique Fédérale de Lausanne, Lausanne, Switzerland, 2008. [Google Scholar] [CrossRef]
  52. BSI. BS 7910:2005 Guide to Methods for Assessing the Acceptability of Flaws in Metallic Structures; Standard; British Standard Institution: London, UK, 2005. [Google Scholar]
  53. Zhao, Z.; Fu, L. The probability distribution of pitting for accelerated corrosion reinforcement. Case Stud. Constr. Mater. 2018, 9, e00193. [Google Scholar] [CrossRef]
  54. Andrade, C.; Gonzalez, J.A. Quantitative measurement of corrosion rate of reinforcing steels embedded in concrete using polarization resistance measurements. Werkst. Korros. 1978, 29, 515–519. [Google Scholar] [CrossRef]
  55. Andrade, C.; Alonso, C. Corrosion rate monitoring in the laboratory and onsite. Constr. Build. Mater. 1996, 10, 315–328. [Google Scholar] [CrossRef]
  56. González, J.; Andrade, C.; Alonso, C.; Feliu, S. Comparison of rates of general corrosion and maximum pitting penetration on concrete embedded steel reinforcement. Cem. Concr. Res. 1995, 25, 257–264. [Google Scholar] [CrossRef]
  57. Basquin, O. The exponential law of endurance tests. Proc. Am. Soc. Test. Mater. 1910, 10, 625–630. [Google Scholar]
  58. Briz, E.; Biezma, M.V.; Bastidas, D.M. Stress corrosion cracking of new 2001 lean-duplex stainless steel reinforcements in chloride contained concrete pore solution: An electrochemical study. Constr. Build. Mater. 2018, 192, 1–8. [Google Scholar] [CrossRef]
Figure 1. Corrosion rate (vc) values for decreasing vc1, increasing vc2 and constant vc3 scenarios in μm/year.
Metals 10 01217 g001
Figure 2. Crack size growth for inert vc0, decreasing vc1, increasing vc2 and constant vc3 scenarios with magnification at the final stage.
Metals 10 01217 g002
Figure 3. Different steel rebars embedded in ordinary Portland cement (OPC) concrete, after 6 months exposure to tidal zone conditions at a w/c ratio of 0.5 and in a non-corrosive environment: (a) Ecorr values, and (b) icorr values.
Metals 10 01217 g003
Figure 4. Δσ-N curves of ϕ 12 mm rebars after 6 months exposure to an XS3 environment vs. an inert environment.
Metals 10 01217 g004
Figure 5. Δσ-N curves of ϕ 25 mm rebars after 6 months exposure to an XS3 environment vs. an inert environment.
Metals 10 01217 g005
Figure 6. Corrosion pushing factor (FCP) of ϕ 12 mm rebars.
Metals 10 01217 g006
Figure 7. Corrosion pushing factor (FCP) of ϕ 25 mm rebars.
Metals 10 01217 g007
Figure 8. Corrosion pushing factor (FCP) values of stainless-steel reinforcement specimens related to CS B500SD.
Metals 10 01217 g008
Table 1. Elemental composition of steel reinforcements (wt.%). Fe balance.
Steel GradeCSiMnPSCrNiMoNCu
CS B500SD0.240.220.720.055<0.010.130.13--0.18
304L ASS0.020.281.410.0340.02318.17.90.220.050.33
316L ASS0.0160.251.180.030.00118.510.12.50.11-
2205 DSS0.020.341.610.0350.00122.24.73.50.220.22
2304 LDSS0.020.350.810.0290.01522.84.50.290.140.31
2001 LDSS0.030.754.190.023<0.0120.11.780.220.170.08
Table 2. Fatigue resistance: minimum requirements [32,46,47].
Nf≥2 × 10⁶ Cycles
σsup300 MPa
Δσ300 MPa
f1 ≤ f ≤ 200 Hz
Table 3. Cycles to failure (Nf) from initial crack size (a0) of 0.012 mm to critical crack sizes (acr) of 12.38 mm discretizing geometrical factor (Ycr = Y (a)) for an amount of mechanical cycles (ΔNm).
ΔNmNf
100,0002,000,000
50,0002,000,000
10,0002,020,000
50002,020,000
20002,020,000
10002,019,000
7502,019,000
Table 4. Mean corrosion rate values for the ϕ 12 mm reinforced specimen after 6 months exposure time in a simulated tidal environment.
Steel
(Grade)
icorr
(μA/cm2)
Mass Loss, Mdd
(mg × dm2/Day)
vcorr,g
(μm/Year)
vcorr,p
(μm/Year)
B500SD0.1553.8818.041180.41
304L ASS0.051.255.8258.2
316L ASS0.051.215.62656.26
2205 DSS0.0451.145.31853.18
2304 LDSS0.061.436.64666.46
2001 LDSS0.092.129.87798.77
Table 5. Pitting corrosion rate for 6 months exposure, scale factor and pitting corrosion rates for service life (vcorr,p *).
Steel
(Grade)
vcorr,p
(μm/Year)
Scale Factor
(#)
vcorr,p *
(μm/Year)
B500SD180.412.77500.00
304L ASS58.20161.29
316L ASS56.26155.91
2205 DSS53.18147.39
2304 LDSS66.46184.17
2001 LDSS98.77273.72
Table 6. Number of cycles until failure (Nf) for 12 mm diameter rebars under a tidal environment (XS3) vs. control specimen under an inert environment (MPa). Control, B500SD, 304L ASS, 316L ASS 2001.
Δσ
(MPa)
ControlB500SD304L
ASS
316L
ASS
2001
LDSS
230
LDSS
2205
DSS
503.80 × 1072.65 × 1056.82 × 1056.82 × 1054.17 × 1056.06 × 1057.19 × 105
1004.75 × 1061.80 × 1054.16 × 1054.26 × 1052.84 × 1053.79 × 1054.45 × 105
1501.41 × 1061.30 × 1052.78 × 1052.83 × 1051.98 × 1052.55 × 1052.93 × 105
162.51.11 × 1061.21 × 1052.53 × 1052.57 × 1051.82 × 1052.33 × 1052.66 × 105
2005.93 × 1059.88 × 1041.92 × 1051.95 × 1051.43 × 1051.79 × 1052.00 × 105
2503.03 × 1057.60 × 1041.35 × 1051.37 × 1051.05 × 1051.27 × 1051.41 × 105
3001.76 × 1055.92 × 1049.77 × 1049.90 × 1047.90 × 1049.30 × 1041.01 × 105
Table 7. Number of cycles until failure (Nf) for 25 mm diameter rebars under a tidal environment (XS3) vs. control specimen under an inert environment.
Δσ
(MPa)
ControlCS
B500SD
2001
LDSS
230
LDSS
2205
DSS
504.81 × 1074.80 × 1057.68 × 1051.06 × 1061.25 × 106
1006.01 × 1063.00 × 1054.68 × 1056.12 × 1057.08 × 105
1501.78 × 1062.08 × 1053.04 × 1053.84 × 1054.35 × 105
162.51.40 × 1061.91 × 1052.77 × 1053.45 × 1053.90 × 105
2007.51 × 1051.50 × 1052.09 × 1052.56 × 1052.84 × 105
2503.84 × 1051.11 × 1051.48 × 1051.76 × 1051.93 × 105
3002.22 × 1058.37 × 1041.08 × 1051.25 × 1051.35 × 105
Table 8. Comparison of the corrosion pushing factor (FCP) for ϕ 12 stainless-steel rebars under different stress ranges, Δσ.
Δσ (MPa)B500SD304L ASS316L ASS2001 LDSS2304 LDSS2205 DSS
50143.355.755.791.262.752.8
10026.411.411.116.712.510.7
15010.85.15.07.15.54.8
162.59.14.44.36.14.84.2
2006.03.13.04.13.33.0
2504.02.22.22.92.42.2
3003.01.81.82.21.91.7
Table 9. Comparison of the corrosion pushing factor (FCP) for ϕ 25 stainless-steel rebars under different stress ranges (Δσ).
Δσ (MPa)B500SD2001 LDSS2304 LDSS2205 DSS
50100.262.645.538.5
10020.012.89.88.5
1508.65.94.64.1
162.57.35.14.13.6
2005.03.62.92.6
2503.52.62.22.0
3002.72.11.81.6

