Abstract
Intergranular corrosion (IGC) and pitting transition caused by grain boundary β-phase saturation of aluminum alloy AA5083 sensitized at 150 °C was investigated in 3.5 wt% NaCl solution. The change in the localized corrosion mechanism from IGC to pitting was studied by microstructural and electrochemical analysis, where IGC was found to be the primary mechanism at low degrees of sensitization (DoS) and pitting corrosion was observed to develop after grain boundary β-phase saturation. Evaluation of the double layer capacitance by electrochemical impedance spectroscopy (EIS) and charge passed through the specimens by potentiostatic current monitoring demonstrated a well differentiated three-stage dissolution mechanism.
1. Introduction
AA5XXX series aluminum alloys (AA) are non-heat-treatable and valued in marine and automotive applications for their corrosion resistance, strength, light weight and formability from solid solution strengthening and cold work [1,2,3]. Corrosion of Al–Mg alloys AA5XXX is heavily influenced by the chemical composition of intermetallic phases present in the alloy [4,5]. Although significantly corrosion-resistant, these alloys contain a substantial amount of Mg supersaturated (4.5 wt%) above the solubility limit of 3 wt% Mg in Al; high Mg content provides increased solution strengthening, but can decrease the corrosion performance of the alloy if exposed to elevated temperatures [6,7]. During the service life of the alloy, prolonged exposure of AA5083 to temperatures between ~50–220 °C causes precipitation and growth of β-phase (Al3Mg2) in the grain boundaries, thus the alloy is said to be “sensitized” [8].
The most common method for measuring the degree of sensitization (DoS) of AA is the nitric acid mass-loss test (NAMLT) consisting of measuring the mass loss per unit area of aluminum in nitric acid over a period of 24 h [9]. Sensitization can cause the AA5083 to be highly susceptible to intergranular corrosion (IGC) and pitting corrosion due to the anodic behavior and preferential dissolution of the β-phase [10,11,12]. The accelerated corrosion behavior is caused by an increase in electrical conductivity and chemical reactivity from the Mg rich β-phase precipitates [13,14]. ASTM B928 states that DoS values below 15 mg/cm2 are considered to be IGC resistant, while DoS values above 25 mg/cm2 are susceptible to IGC [15]. For high sensitization temperatures, DoS values above 25 mg/cm2 have been shown to be more variable; this can be attributed to the use of a high sensitization temperature at or above 150 °C, which approaches the α + β → α phase transition, thus decreasing the equilibrium phase fraction of β-phase [16,17]. In addition, the nucleation of intragranular β-phase occurs above 150 °C with longer times of exposure, which will not be detected using the NAMLT [18,19].
Several studies have been done on the sensitization of Al–Mg alloys with a wide range of sensitization temperatures between 70–175 °C [8,10,16,20]. Overall, the precipitation of the β-phase forms into chains or thin films in the grain boundaries at these temperatures [19,21]. Conversely, at temperatures of 200 °C or above, discontinuous “pearl-like” structures of β-phase in the grain boundaries were shown separated from each other [22]. Searles et al. observed a similar phenomenon when sensitizing AA5083 at 150 °C for prolonged exposure times (333 h), revealing discontinuous β-phase precipitates in the grain boundaries causing the grain boundary to be less susceptible to intergranular attack and decreasing β-phase dissolution [23]. β-phase has been shown to propagate by site-saturation in the grain boundaries, with particle sizes of β-phase precipitates increasing for longer sensitization times with temperatures up to 200 °C [24]. As well, cold rolling has also been shown to favor the dislocation density and nucleation sites for β-phase and, thus, increase the β-phase precipitate density [25].
Both IGC and pitting corrosion are forms of localized attack resulting from the breakdown of the surface passive film; pitting is the consequence of attack on the matrix or intermetallic particles and ICG is restricted to attack on the grain boundaries [26,27]. The presence of the β-phase precipitates in the grain boundaries has been shown to lead to increased susceptibility to IGC and exfoliation [13,14]. The electrochemical performance of pure β-phase is difficult to determine due to the size of the precipitates, ranging from 50–190 nm in width and 100–1000 nm in length, as well as the formation of an altered surface layer created when polishing the sensitized specimen [28,29,30]. By bulk synthesis of Mg2Al3 intermetallic particles as well as nanoscale analysis of the metastable β”-phase (MgAl3) and β’-phase (hcp-Mg2Al3) formation, the corrosion performance and nature of the equilibrium β-phase (fcc-Mg2Al3) precipitates has been studied in several works [23,31,32,33,34,35]. The proposed mechanism by Aballe et al. for pitting corrosion in AA5083 involves the intermetallic precipitates of Al (Mn, Fe, Cr) composition, in aerated saline environment, acting as permanent cathodes with respect to the matrix [36]. The presence of nitrate ions has been shown to increase the passivity breakdown potential or pitting potential, associated with intermetallic dissolution by decreasing the growth kinetics [37]. Previous works studying pitting behavior of aluminum alloys find a lack of complete repassivation, instead a transition potential is observed [38]. The mechanism and explanation for this transition potential has been subject to debate. Pride et al. assert that the increased currents and lack of repassivation occur due to an acidification of the boundary surface layer, stirring the solutions during polarization tests, thus decreasing surface acid buildup was observed to decrease the reverse scan current density [39]. However, Yasuda et al. postulate that the transition potential and increased current are observed due to the repassivation of small pits while the larger pits lack complete repassivation, thus the current is greater and complete repassivation is not observed [40]. The study from Moore et al. found that surface acidification was insufficient to completely explain the lack of repassivation and that pit tunnels formed in larger pits on AA5083, which held increased NaCl concentrations that would not be repassivated [41].
The control and prevention of sensitization corrosion of aluminum alloys have been studied using inhibitors, coatings, annealing treatments and protective film formation [23,42,43,44,45]. Modeling and analysis of the DoS as a tool for alloy design has also been an area of interest in preventing sensitization [19,46]. Detecting the existence and extent of β-phase development using the NAMLT procedure is highly destructive, therefore the ability to detect DoS and β-phase formation of AA5083 using a nondestructive procedure can prove to be a significant advancement for corrosion monitoring of AA5083. Other methods of detecting DoS in aluminum have been explored in the literature including electromagnetic acoustic transducer ultrasonic test [47].
The aim of this work is to study the intergranular to intragranular pitting corrosion transition mechanism of sensitized AA5083 at 150 °C in 3.5 wt% NaCl. Characterization of sensitized AA5083-H116 at 150 °C was done using NAMLT to identify DoS and IGC susceptibility. The microstructure was imaged using scanning electron microscopy (SEM) and energy dispersive X-ray spectroscopy (EDS) analysis to study the IGC and pitting of the sensitized specimens in acidic media at resting potential. Pitting corrosion was investigated electrochemically using cyclic potentiodynamic polarization (CPP), electrochemical impedance spectroscopy (EIS) and potentiostatic current transient monitoring. The pitting potential (Epit), corrosion potential (Ecorr) and pitting transition potential (Eptp) for sensitized specimens were examined as a function of the DoS. Pitting depth and density of the polarized specimens was studied using infinite focus microscopy (IFM). Potentiostatic current transient monitoring was conducted using a potential value of–710 mVSCE, which lies above the pitting potential of all the sensitized specimens and shows the most stable response in current density. The total charge of the specimens was calculated from the current transient data and to identify a trend compared to DoS.
2. Experimental
Commercial AA5083-H116 specimens with composition shown in Table 1 were cut to dimensions of 40 × 20 × 3 mm. The specimens were washed with ethanol, air dried and thermally aged in a CarboLite Gero oven at 150 °C for sensitization. The specimens were removed at periods of 2, 7, 14, 21 and 30 days of exposure and allowed to cool in air. The specimens were ground with SiC paper down to grade 1200 and washed with water and finally rinsed in ethanol.

Table 1.
Elemental (wt%) composition of commercial AA5083-H116.
The DoS was tested by NAMLT according to ASTM G67–18 [9]. The specimen polishing was repeated to both faces of the specimens. Next, the specimens were etched in 5 wt% NaOH solution (80 °C) for 1 min, rinsed in water and weighed. Then, the specimens were exposed to 70.0 wt% HNO3 solution for 24 h at 30 °C. After exposure, the specimens were washed, dried and weighed again, recording the mass. The difference in mass per unit surface area was then recorded as the DoS. Additionally, the specimens were immersed in acidified 0.4-M ammonium persulfate solution (pH 1.2) for selective dissolution of β-phase [48]. Finally, a Hitachi TM3030 SEM (Hitachi ltd, Chiyoda city, Japan) coupled with an EDS spectrometer were used to study IGC and pitting corrosion in AA5083-H116 specimens. An accelerating voltage of 15.0 kV was used with a working distance of 8.0 mm.
Electrochemical characterization of the sensitized specimens was carried out on a Gamry Series 600 potentiostat (Gamry Instruments, Warminster, PA, USA) with a three-electrode configuration cell setup: using AA5083-H116 specimens as working electrode, graphite as counter electrode and a saturated calomel reference electrode (SCE). Sensitized AA5083-H116 specimens were mounted in a flat cell with a selected working area of 0.5 cm2 and exposed to a 3.5 wt% NaCl solution, at room temperature (25 °C), to study IGC and pitting corrosion mechanisms. The electrochemical tests performed include open circuit potential (OCP), CPP, EIS and potentiostatic current transient monitoring. The OCP was examined for one hour to obtain a stable potential value. The CPP tests were carried out with a polarization range of −200 mVOCP to +200 mVOCP, using a forward and reverse scan rate of 0.1667 mV/s [27]. From the CPP curves, Epit was determined by a sharp increase in current density on the anodic branch. In addition, Eptp was determined by the inflection point on the reverse scan of the anodic branch, in which small pits are repassivated and large pits begin repassivation, as shown by Yasuda [40,49]. EIS was conducted at OCP with an AC amplitude of 10-mV RMS between frequencies of 105–10–2 Hz using 5 points per decade. Finally, the specimens were analyzed by optical 3D surface characterization using an Alicona Infinite Focus G5 microscope for pit depth and pit density evaluation.
The potentiostatic current transients for the 30 days sensitized AA5083-H116 specimen were conducted at different applied potentials between −710 mVSCE to −770 mVSCE for one hour, in a 3.5 wt% NaCl solution at neutral pH and room temperature (25 °C). The applied polarization potential of −710 mVSCE, above Epit, was selected to measure potentiostatic current transients as it ensures the pitting process. All experiments were performed in triplicate to ensure reproducibility.
3. Results and Discussion
The NAMLT results are shown in Figure 1, with values in Table 2. The as-received AA5083 specimen showed the lowest DoS of 8 mg/cm2, due to the absence of sensitization treatment. The DoS of the AA5083 specimen increased significantly between days 0 and 7 to a value of 58 mg/cm2, with a decreasing rate of sensitization as the aging time increased. NAMLT results for 14 and 21 days showed 81 and 83 mg/cm2, respectively. The greatest DoS measured was for day 30, plateauing to 89 mg/cm2. In AA5083 specimens sensitized at 150 °C for times greater than 14 days, the β-phase becomes saturated in the grain boundaries, which can be seen reflected in the NAMLT results as the DoS plateaus after 14 days [9,21,22,27,50]. Likewise, Zhang et al. found a similar behavior for the relationship between the DoS and sensitization time for 150 °C [10].
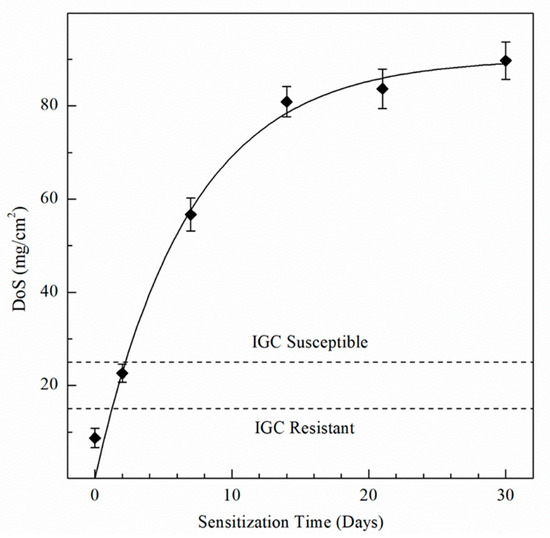
Figure 1.
Degree of sensitization (DoS) values for AA5083 sensitized at 150 °C using the NAMLT test standard ASTM G67–18. Error bars represent the standard deviation from the mean.
Table 2.
Average values of DoS obtained by NAMLT test, as well as icorr, Ecorr, Epit, Eptp, Ceff,f, deff, Ceff,int and Ceff,dl values calculated from cyclic potentiodynamic polarization (CPP) and electrochemical impedance (EIS) data for sensitized AA5083 at 150 °C for specified times. Parentheses represent standard deviation.
The microstructure of the AA5083 specimens etched for 40 min in 0.4 M ammonium persulfate solution (pH 1.2) can be seen in the SEM images in Figure 2. For the as-received AA5083 specimen in Figure 2a, intergranular discontinuous β-phase can be seen as dark pearl shaped voids outlining grain boundaries. Because the amount of β-phase in the as-received specimen is low (8 mg/cm2), the dissolution of β-phase during the etching process is minimal, which is corroborated by the amount of dark areas observed in the SEM micrograph and by the lack of continuous grain boundary dissolution. Figure 2b shows the microstructure of the specimen sensitized for 2 days at 150 °C, active grain boundary dissolution can be observed. Similarly, 7, 14, 21, and 30 days sensitized specimens in Figure 2c–f show grain boundary dissolution as well as pitting within the grain. A change in localized corrosion mechanism is observed from the as-received specimen (0 days) to 30-day sensitization. The initial stage of the corrosion process shows preferential dissolution of the grain boundaries, IGC, where the β-phase precipitates segregate. However, after saturation of β-phase in grain boundaries, a different stage is observed where the intragranular β-phase precipitates are formed and begin to cause pitting within the grain, similar to a transition from IGC to pitting corrosion seen for AA2024 reported by Zhang et al. [16,26]. The EDS mapping of the 21-day sensitized specimen is shown in Figure 3. The pitting corrosion process is identified by the dark portions corresponding to pinholes. An abundance of Al and O on the surface is found, attributed to the Al2O3 passive layer. These small dark areas form discontinuous grain boundaries due to the segregation of β-phase formed during the alloy creation, partially outlining the grains in the alloy. In addition, the larder dark circles are attributed to pitting in the alloy, likely due to defects in the alloy structure or higher concentrations of Mg which is more reactive than bulk alloy. In addition, MnOx oxides were identified as white precipitate particles on all SEM images in Figure 2. These results were consistent for the as-received specimen as well as those sensitized for 2, 7, 14 and 21 days.
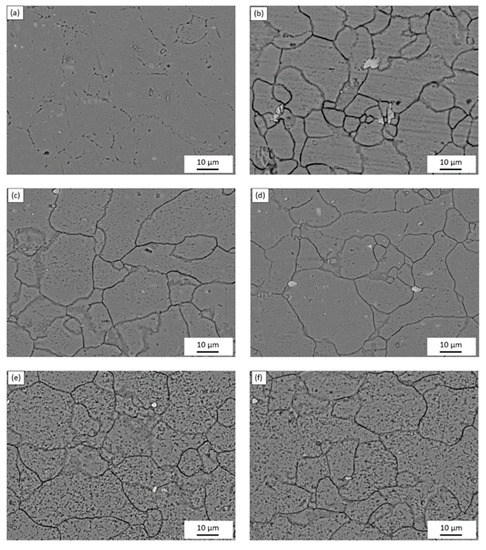
Figure 2.
SEM micrographs of AA5083 etched with acidified 0.4 M ammonium persulfate for the (a) as-received specimen and AA5083 sensitized at 150 °C for (b) 2 days, (c) 7 days, (d) 14 days, (e) 21 days and (f) 30 days.
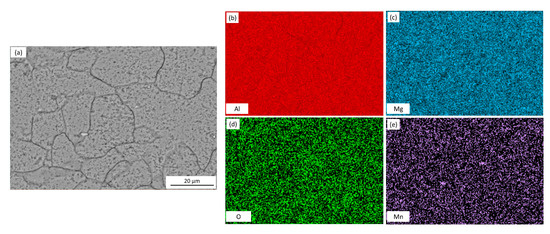
Figure 3.
SEM micrograph for (a) AA5083 sensitized at 150 °C for 21 days with EDS mapping of (b) Al, (c) Mg, (d) O and (e) Mn, etched in acidified 0.4 M ammonium persulfate.
The CPP results are depicted in Figure 4. The Ecorr and icorr values obtained for the sensitized specimens are shown in Table 2. Ecorr values of sensitized specimens are significantly more active than unsensitized AA5083, with an Ecorr value of −726 mVSCE for the unsensitized specimen, which decreased progressively to −888 mVSCE after 30 days of sensitization (DoS = 89 mg/cm2), indicating an increase in IGC susceptibility [33]. All specimens show a decrease in the Ecorr, towards more active potentials, as well as a higher icorr. The reverse polarization scans follow the trend of the forward scans, showing a more active behavior for the 30 days sensitized (DoS = 89 mg/cm2), revealing a reverse scan Ecorr below −1.0 VSCE. Calculated icorr values can be seen in Table 2, increased corrosion susceptibility was found for higher DoS, where icorr values increased an order of magnitude from 1.12 × 10⁻⁷ A/cm2 to 2.33 × 10⁻⁶ A/cm2. The changes of icorr values show a direct correlation with DoS until NAMLT values above 25 mg/cm2, where the current density reaches a magnitude of μA, as the AA5083 is now considered susceptible to IGC by ASTM G67–18 standard, similar to the trend found by Jain et al. [33]. Ecorr vs. DoS results are shown in Figure 5, it is observed a decay towards more active Ecorr values as DoS increases, this change results from the increase in the anodic current densities. On the anodic branch the specimens showed a sharp increase in current density, denoting Epit, which corresponds to Ecorr for the as-received specimen due to the rapidly increasing anodic current density and because the rate of the oxygen reduction reaction was higher than the passive current density of the specimen [29]. The Epit values decrease as the DoS increases.
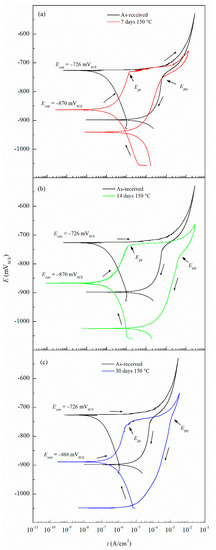
Figure 4.
Cyclic potentiodynamic polarization (CPP) curves for AA5083 as-received and sensitized at 150 °C for (a) 7 days, (b) 14 days and (c) 30 days. Epit represents the pitting potential and Eptp represents pitting transition potential.
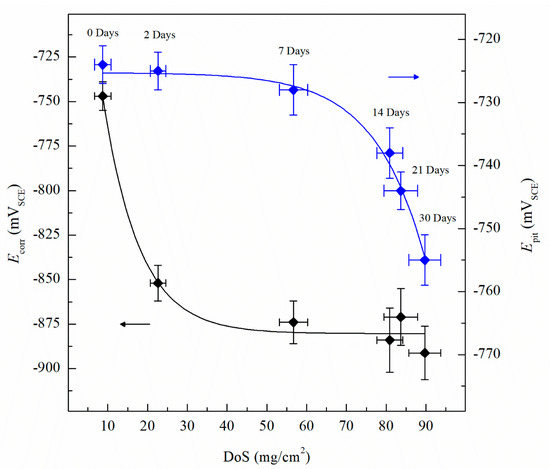
Figure 5.
Average corrosion potential values (Ecorr) and the average pitting potential (Epit) quantified from CPP for varying DoS measured by nitric acid mass loss test (NAMLT). Error bars represent standard deviation from the mean.
The Epit values for varying DoS are shown in Figure 5. More active values of Epit are exhibited by the AA5083 specimens with greater DoS and generally decrease as sensitization increases, dropping considerably after 7 days of sensitization (DoS = 56 mg/cm2). The most noble value is observed by the unsensitized, as-received AA5083 specimen when the Epit value is −724 mVSCE (DoS = 8 mg/cm2) and decreases to −756 mVSCE for the 30 days sensitized specimen (DoS = 89 mg/cm2), with a clear downward trend as sensitization time increases. This trend is due to the IGC susceptibility of grain boundaries and the grains becoming susceptible to pitting corrosion caused by the presence of β-phase precipitates, decreasing the Epit and, thus, local passivity breakdown occurs [15,33]. In the reverse polarization scan, all tests revealed a pitting transition potential, Eptp, before returning to a more active potential relative to the forward scan Ecorr. The Eptp describes the complete repassivation of small pits and partial repassivation of larger pits [51]. In the larger pits, pitting tunnels are formed after the potential decrease causes a local NaCl concentration gradient, which accelerates dissolution and creates tunnels, thus causing an increased reverse scan current density [41]. In general, the transition potential occurred below the pitting potential, however in the 30 days sensitized AA5083 specimen the transition (Eptp = −755 mV) occurred at a potential slightly above the Epit, −750 mV, as shown in Figure 4. Therefore, the transition potential on the reverse scan cannot be attributed to pit repassivation only, as suggested by Pride et al. [39] and Yasuda et al. [49], since the repassivation potential (Erep) should be lower than Epit. Contrarily, the transition potential is promoted by the propagation of tunnels into the metal, suggesting that the Eptp mechanism could be related to partial dissolution of intergranular β-phase [41]. This is consistent with the higher DoS observed for the 30 days sensitized specimen, where the β-phase saturated grain boundaries are the dominant effect, as it was only found for this specimen. Due to the pits, an ohmic drop is produced by the constriction of mass and charge transfer from the geometry of the local cell pit. The values of Eptp also shows a slight decreasing trend from the as-received specimen to the sensitized specimens (Figure 6), from −750 mVSCE to an average value of −758 mVSCE. This decrease in Eptp is likely due to the change in the local chemistry inside the pits, causing deeper pits and pitting tunnels which are unable to completely repassivate. As found by the work of Trueba et al. the Eptp potential step or steepness of the shoulder observed in the CPP results, is explained by the penetration of Al grain and, therefore, β-phase precipitation [38,52]. Although the Eptp values slightly decrease over the sensitization period, the steepness of the shoulder indicated in the CPP results in Figure 4 clearly increases from 0 to 30 days sensitized. The Eptp is less influenced by the development of the β-phase than Ecorr and Epit, a similar trend in Eptp has been seen in AA7075, AA2024 and AA6082 alloys by Comotti et al. [38]. The IFM results in Figure 7 show images of the pitting observed for each specimen. The line profiles of the major pits observed are shown in Figure 8. The pits increase in depth and density for the specimens with higher DoS, which corroborates the trend seen in Epit and Eptp. These intragranular pits can be differentiated from the pitting observed in Figure 2 as the specimens are polarized and the pitting is caused by the anodic dissolution of the Al matrix as opposed to β-phase precipitates within the grain [36]. Therefore, these results show that the sensitization causes increased amount of intermetallic species, namely β-phase, which are cathodes with respect to the alloy matrix, making the alloy more susceptible to pitting.
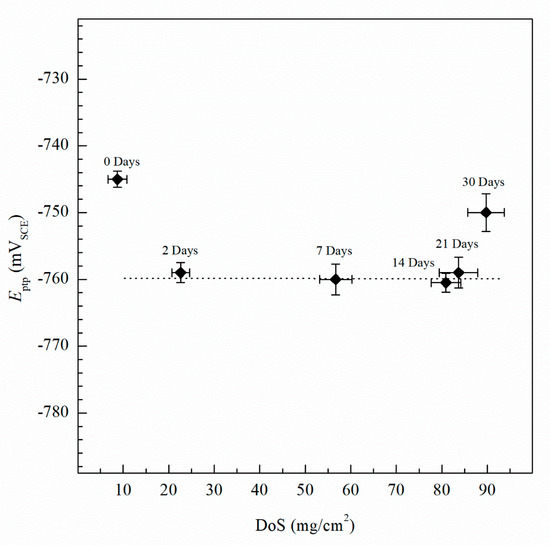
Figure 6.
Average pitting transition potential (Eptp) measured by CPP for varying DoS measured by NAMLT. Error bars represent the standard deviation from the mean. Dotted line represents the average Eptp after sensitization, −760 mVSCE. Error bars represent standard deviation from the mean.
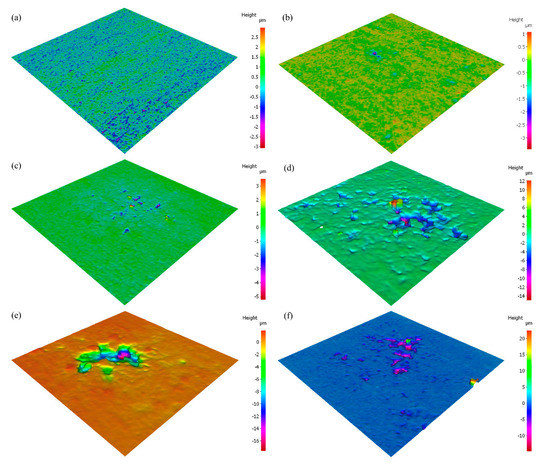
Figure 7.
Infinite focus microscope (IFM) 3D images of pitting observed on AA5083 after polarization in 3.5 wt% NaCl solution sensitized at 150 °C for (a) 0 days, (b) 2 days, (c) 7 days, (d) 14 days, (e) 21 days and (f) 30 days.
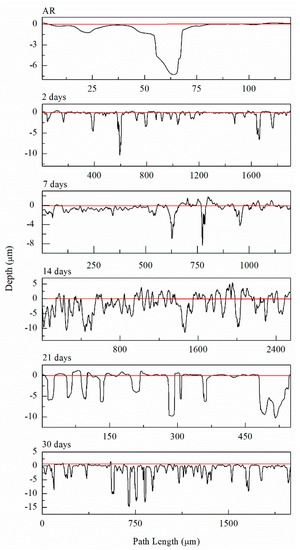
Figure 8.
Line profiles of the deepest pits observed from IFM imaging for AA5083 as-received (AR) and sensitized at 150 °C for 2 days, 7 days, 14 days, 21 days and 30 days.
The EIS results can been seen by the Nyquist and Bode diagrams in Figure 9 and Figure 10, respectively, for the critical days of sensitization (0, 14 and 30) for clarity. It is found from the EIS results that the impedance decreases as sensitization time increases. The Nyquist plots (Figure 9) show a decrease in the impedance of the specimen as the time of sensitization is increased as well as the development of an intermediate frequency time constant, which results from the response of the formation of intermetallic β-phase [53]. By the Bode plot in Figure 10, three inflection points from the phase angle, θ, can be seen, indicating a three-time constant system.
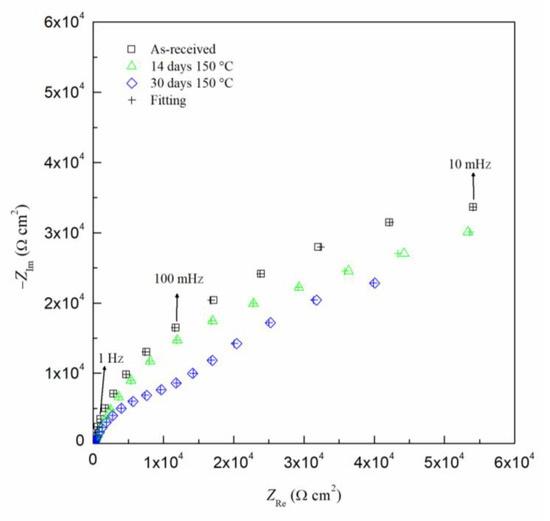
Figure 9.
Nyquist plot for AA5083 in 3.5 wt% NaCl sensitized at 150 °C for 0, 14 and 30 days. Cross marks represent EIS fitting results using EEC.
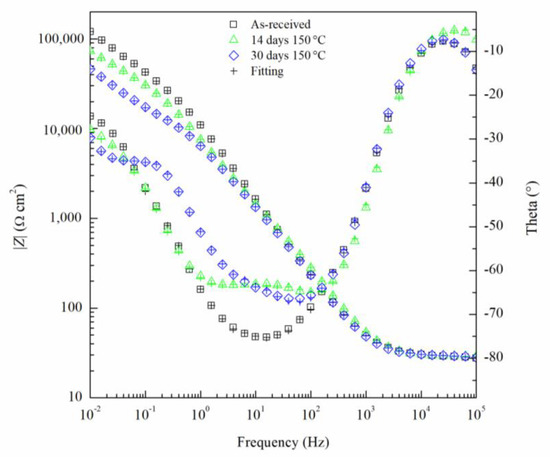
Figure 10.
Bode plot for AA5083 in 3.5 wt% NaCl sensitized at 150 °C for 0, 14 and 30 days. Cross marks represent EIS fitting results using EEC.
The robustness of experimental EIS data were evaluated using the Kramers–Kronig (K–K) transforms defined by Equations (1) and (2) [54,55]:
where ZRe(ω) and ZIm(ω) are the real and imaginary parts of the impedance, respectively. The integration variable, x, is between 0 and ∞ and ω angular frequencies (rad/s). The imaginary portion of the impedance can be transformed into the real by Equation (1) and the reverse can be obtained using Equation (2). Comparing the experimental values of the real and imaginary components of the impedance data to the K–K-transformed values in Figure 11, the calculated values are nearly identical and the goodness of fit of the K–K transform was found to be 3.2 × 10⁻⁶ indicating the robustness of the EIS data. This analysis was done for each EIS test performed to ensure the validity of the data and the goodness of fit were found to be below 105 for each test.
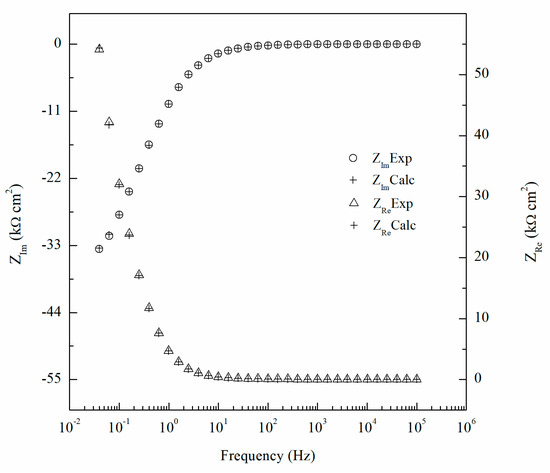
Figure 11.
Comparison of experimental impedance data for 14 days sensitized specimen and calculated values using Kramers–Kronig (K–K) transformation for AA5083.
The proposed electrical equivalent circuit (EEC) for sensitized AA5083 in NaCl, presents a three-time constant model, as depicted in Figure 12 and in agreement with the EEC proposed by Li et al. also showing a three-time constant model showing pitting corrosion [31,56]. Table 3 shows the EIS fitting values for all specimens tested. In the proposed EEC model, Re is the resistance of the electrolyte, Rf–CPEf represent the response of the oxide passive film, Rint–CPEint is the time constant associated with the response of the intermetallic species and Rct–CPEdl are the charge transfer resistance and the capacitance of the double layer, respectively where capacitance is represented by a constant phase element (CPE) to account for non-ideal capacitor behavior. The Rct−CPEdl time constant can be seen in the Nyquist plots in the low frequency semicircle, which decreases significantly as sensitization time increases, indicating a lower resistance to the charge transfer and a higher capacitance of the double layer, thus more susceptible to corrosion. As stated by Aballe et al. the effect of the intermetallic species is seen in the high frequency domain [57]. The change in the semicircle associated with Rint−CPEint develops as sensitization time increases, indicating the formation of more intermetallic phases including β-phase precipitation. Comparing the values of the fitting data over the different sensitization times, Re remains consistent around 28 Ω·cm2. Significant changes can be seen in the Rct–CPEdl time constant, where the process of anodic dissolution (charge transfer) occurs. Rct decreases to 1.53 × 10⁴ Ω·cm2 as DoS increases, compared to the as-received specimens showing a Rct value of 4.80 × 10⁴ Ω·cm2. This change is likely due to the formation of the active β-phase allowing for higher anodic reactions kinetics at the electrical double layer of the electrode/liquid interface, thus, greater dissolution at the grain boundaries where the β-phase precipitates are most present.
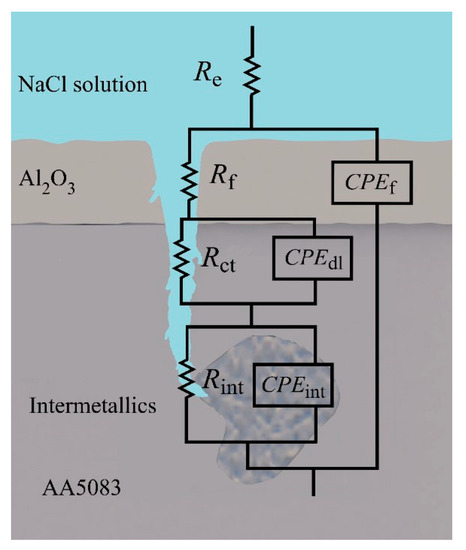
Figure 12.
Physical model and electrical equivalent circuit (EEC) diagram of the proposed system of AA5083 in 3.5 wt% NaCl solution.
Table 3.
EIS fitting results using the EEC shown in Figure 12.
The effective capacitances of the double layer (Ceff,dl, µF/cm2) and the passive film (Ceff,f, µF/cm2) can be calculated for a CPE using the relationships developed by Brug et al. [58] and Hsu and Mansfeld [59], respectively, see Equations (3) and (4).
where Ydl is the admittance for the double layer, Yf is the admittance for the passive film, is the frequency at which the imaginary impedance (–Zimag) is maximized, ndl and nf are the CPE exponent of the double layer and passive film, respectively, where n = 1 for an ideal capacitor, ε0 and ε are the permittivity of free space and the dielectric constant of the passive film, respectively and deff is the thickness of the oxide passive film. For calculating deff using Equation (5), ε0 = 8.85 × 10⁻¹⁴ F/cm for the permittivity of vacuum and ε = 9.34 for alumina (Al2O3) film were used [60,61]. Table 2 includes Ceff,f, Ceff,dl, Ceff,int and deff calculated using Equations (3)−(5) for unsensitized and sensitized AA5083 in 3.5 wt% NaCl solution. Figure 13 shows the change in Ceff,dl as sensitization time increases. In Table 2, calculated Ceff,dl values are presented, the as-received specimen shows a Ceff,dl of 4.04 µF/cm2 which is significantly lower than the values seen for the sensitized specimens. The Ceff,dl values increase with DoS reaching a plateau near 4.47 µF/cm2. After 14 days of sensitization (80 mg/cm2), Ceff,dl begins to increase again to 5.95 µF/cm2 for the 30 days sensitized specimen (89 mg/cm2). As the β-phase develops and precipitates to the grain boundaries the Ceff,dl increases and plateaus, which is also seen by the NAMLT data in Figure 1. However, after 14 days of sensitization at 150 °C, the Ceff,dl increases further. This three-stage mechanism showing an increase in Ceff,dl can be attributed to the precipitation and eventual saturation of β-phase in the grain boundaries and further formation of intragranular β-phase within the grain, which is corroborated by the SEM imaging. The capacitance of the intermetallic precipitates layer (Ceff,int) was calculated analogous to Ceff,dl using Equation (3) from the EIS data obtained and is shown in Figure 14. The continuous increase of the Ceff,int demonstrates the continual growth of β-phase in the specimens over the entire period of aging. A three-stage process similar to that observed in Ceff,dl can be observed and is attributed to the continuous β-phase precipitation mechanism. Inflection points are seen for 2 days and 14 days, a smaller slope is observed between these two points. This large Ceff,int increase over the sensitization time demonstrates that, although the DoS remains similar for high sensitization times, the corrosion susceptibility of the specimen is continuing to increase from intermetallic β-phase precipitates within the grain that are not detected by the NAMLT. The Ceff,f shown in Table 2 present a steady value around 38 µF/cm2 for all the DoS range studied, the thickness of the passive film can be calculated using Equation (5), the obtained deff values are plotted in Figure 15 [62]. The as-received specimen displays a Ceff,f of 33.8 µF/cm2 corresponding to a deff = 8 nm, while the 30 days sensitized specimen shows deff = 10 nm. Because all specimens were prepared and tested using the same methods and allowing for similar times of exposure to air after polishing, the oxide thickness does not change dramatically for the tested specimens.
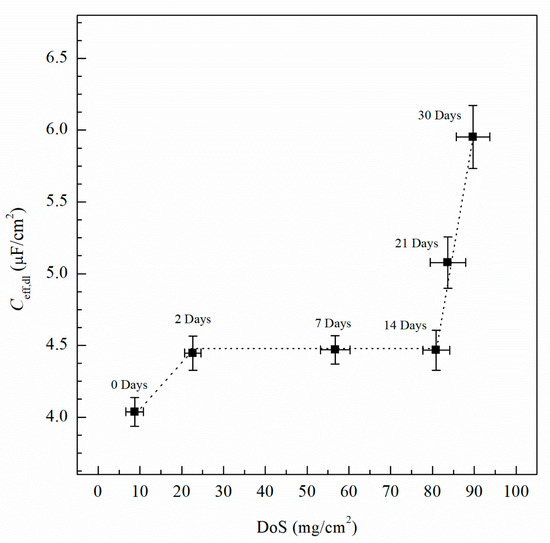
Figure 13.
Effective capacitance values of the double layer (Ceff,dl) calculated from EIS fitting data using Equation (3). Error bars represent standard deviation from the mean.
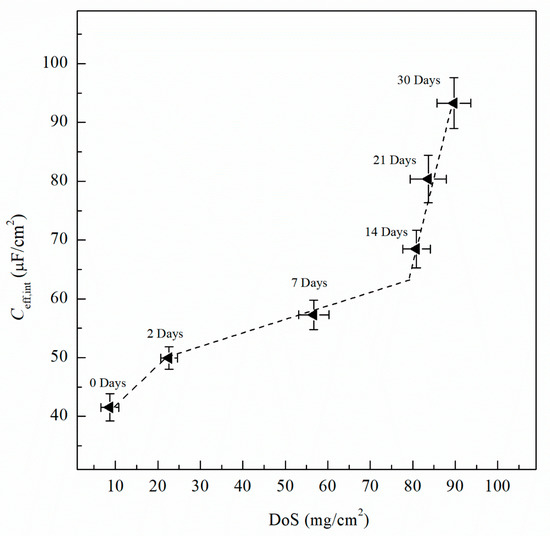
Figure 14.
Effective capacitance of the intermetallics (Ceff,int) calculated from the EIS data fitting data using Equation (3). Error bars represent standard deviation from the mean.
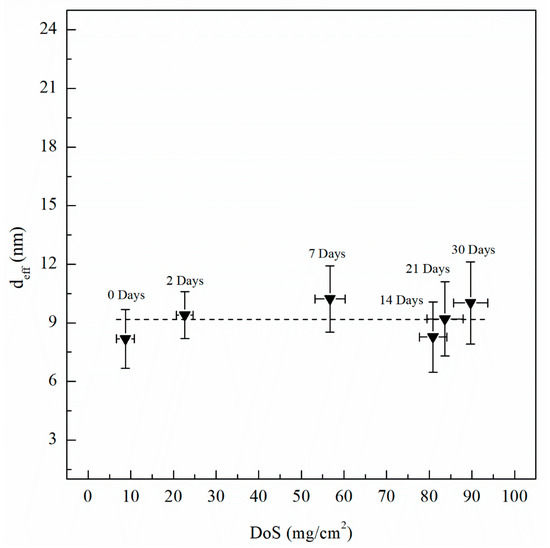
Figure 15.
Passive film thickness (deff) calculated using Equation (5) and Ceff,f values from EIS fitting data. Error bars represent standard deviation from the mean.
For potentiostatic current transient monitoring, the range selected was between −770 mVSCE and −710 mVSCE as it includes potentials values below and above the Epit for all the sensitized AA5083 specimens. Figure 16 shows the current density values obtained by potentiostatic polarization for 1 h of the 30 days sensitized AA5083 specimen, the current stabilized around 0.7 mA/cm2. Current transients for −770 mVSCE and −750 mVSCE showed low current density values nearing 1 μA/cm2 without stabilizing, corresponding to the lower part of the anodic branch of the CPP curve where pitting is absent, thus the current density is low and continues to rise over time. Both current transients at −770 mVSCE and −750 mVSCE show small peaks in current denoting metastable pitting. At these applied potentials, the current densities are measured below the Epit, therefore the corrosion mechanism that would be present is IGC by the dissolution of β-phase in the grain boundaries. The transient of −730 mVSCE above the Epit and displays a stable current after 1 h. The potential of −710 mVSCE in the anodic branch of the CPP was selected as it showed the fastest response and most stable current density value after testing, as well as being above Epit for all the specimens tested. Once the potential was selected, it was repeated for all the different sensitization values and the curves for all the different DoS can be seen in Figure 17. Starting from the as-received specimen—which has the lowest current density value—the higher the degree of sensitization, the larger the current densities. The potentiostatic current transients of the sensitized specimens continue to increase with the higher sensitization time. This rise in the current density is due to the electrochemical dissolution of the β-phase intermetallic (Mg2Al3).
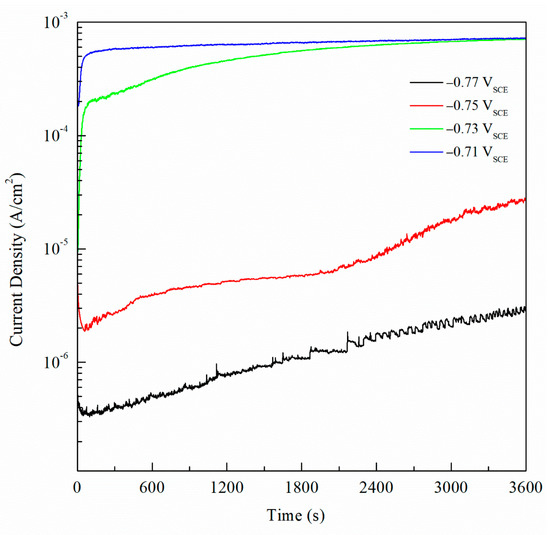
Figure 16.
Current transient data for the AA5083 sensitized at 150 °C for 30 days polarized at −0.77, −0.75, −0.73 and −0.71 VSCE.
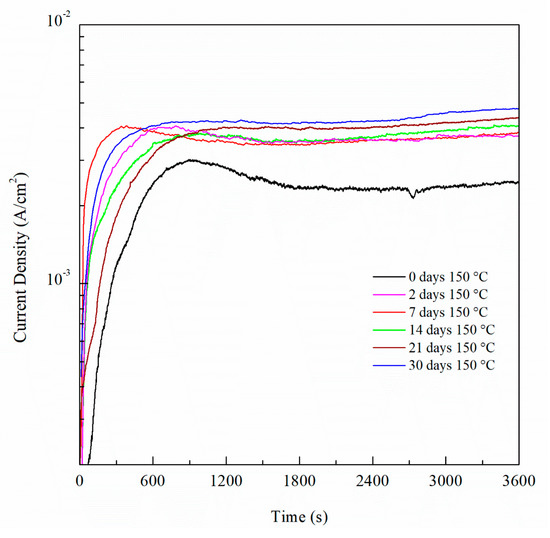
Figure 17.
Potentiostatic current transient measured at −0.71 VSCE of AA5083 sensitized at 150 °C for up to 30 days.
Integrating the current density over time, total charge was obtained for one-hour test period. Figure 18 shows the charge for the varying DoS. As sensitization time increases, the total charge increases, indicating a more active specimen and higher susceptibility to pitting and intergranular corrosion due to the β-phase development. As shown by the current transient in Figure 17, an increasing trend of the total electric charge is found. From the as-received AA5083 specimen to the 2 days sensitized specimen, the total charge increases notably which corresponds to the intergranular precipitation of a continuous β-phase [33,63]. Thereafter, a plateau is obtained from 7 day sensitized until 14 day sensitized—after which the total charge increases again. The increase in charge is likely due to the intragranular β-phase precipitation after the grain boundaries have become saturated [18]. The behavior shown by the charge is comparable to that in Figure 13 for calculated Ceff,dl of the double layer, and is likely caused by precipitation and saturation of intergranular β-phase and further development of intragranular β-phase precipitates, showing the three-stage dissolution process, where inflection points located at 2 days and 14 days of sensitization. At 2 days, the DoS is 23 mg/cm2, close to 25 mg/cm2 where the specimen is considered susceptible to IGC. At 14 days of sensitization, previous work has shown that further exposure to 150 °C can lead to development of intragranular β-phase [19]. As the specimens were polarized to −710 mVSCE for 1 h, a great amount of dissolution occurred, and significant corrosion was observed after testing. By visible inspection, large pits were observed on the surface. Because these precipitates are not measured by NAMLT, the DoS measures seem to plateau. However, increased DoS values produced a higher corrosion susceptibility, as observed by CPP, EIS and potentiostatic current transients.
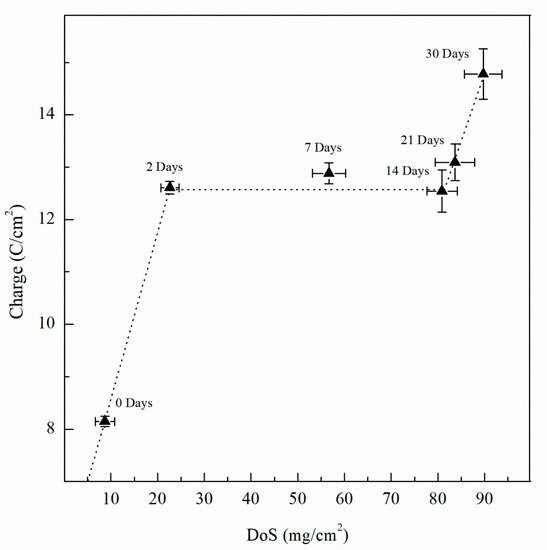
Figure 18.
Charge calculated from current transient data for AA5083 sensitized at 150 °C for up to 30 days. Error bars represent the standard deviation from the mean.
4. Conclusions
The main conclusions on the effect of the DoS of AA5083-H116 at 150 °C on the transition mechanism between IGC and pitting corrosion, influenced by β-phase intermetallic (Mg2Al3) precipitation at intergranular and intragranular regions, are summarized as follows:
The DoS evaluated using the NAMLT increased and plateaued to 89 mg/cm2 at 30 days of exposure. By ASTM G67–18 standard, AA5083 sensitized at 150 °C for longer than two days presented susceptibility to IGC and has DoS values above 25 mg/cm2. SEM analysis of sensitized AA5083 in acidified ammonium persulfate clearly indicated that IGC acts as the dominant corrosion mechanism until the grain boundaries are saturated with β-phase and intragranular precipitates are formed, resulting in pitting within the grains. Therefore, sensitization of AA5083 decreases the induction time of IGC to pitting corrosion due to the development of intergranular and intragranular β-phase precipitates.
The Ecorr was directly influenced by DoS and time of sensitization, showing values continuously decreasing from −747 mVSCE to −888 mVSCE, thus displaying increased corrosion susceptibility. The Epit showed a decreasing trend with increasing time of sensitization starting from −728 mVSCE and decreasing to −756 mVSCE, indicating a greater susceptibility to alloy matrix pitting corrosion after greater amounts of β-phase intermetallics are present to act as cathodic sites to promote Al dissolution. This conclusion is corroborated by the IFM images finding an increased pit density and pit depth for specimens with higher DoS. Values of Eptp show a decrease after sensitization, however no significant change was observed for greater DoS. The steepness of the potential step associated with Eptp, however, increased greatly with sensitization indicating further intragranular pitting. The Eptp shows small variations and is not highly influenced by the presence and development of β-phase after short times of sensitization.
Interestingly, the Ceff,dl and Ceff,int calculated from EIS data along with the total charge measured from potentiostatic current transients demonstrate a three-stage dissolution process with respect to DoS. First, Ceff,dl and charge increase as the specimen is sensitized near 25 mg/cm2, denoting the IGC susceptibility and intergranular β-phase precipitation. Between values of 25 mg/cm2 and 80 mg/cm2, Ceff,dl and total charge displayed a plateau where the grain boundary presents a continuous β-phase. Finally, for values larger than 80 mg/cm2, a secondary increase can be observed. Over the entire period, growth of β-phase intermetallics is demonstrated by increasing NAMLT and Ceff,int values, with capacitance values showing inflection corresponding to that seen by Ceff,dl. This inflection corresponds to the point of which intragranular β-phase was observed in SEM imaging, suggesting the increase to be caused by saturation of the grain boundaries and intragranular precipitation of β-phase, causing the AA5083 to be susceptible to IGC as well as pitting by intragranular β-phase dissolution.
Author Contributions
Conceptualization, D.M.B.; methodology, J.R., U.M., J.B. and D.M.B.; formal analysis, J.R., U.M., J.B. and D.M.B.; investigation, J.R., U.M., J.B. and D.M.B.; resources, D.M.B.; data curation, J.R., U.M., J.B. and D.M.B.; writing—original draft preparation, J.R., U.M., J.B. and D.M.B.; writing—review and editing, J.R., U.M., J.B. and D.M.B.; visualization, D.M.B.; supervision, D.M.B.; funding acquisition, R.K.G. and D.M.B. All authors have read and agreed to the published version of the manuscript.
Funding
This research was funded by The University of Akron, and by Concurrent Technologies Corporation (Award 1000004476).
Acknowledgments
The authors acknowledge funding support from The University of Akron. Funding from the Concurrent Technologies Corporation (Award 1000004476) with Robert Mason as technical program manager is highly appreciated.
Conflicts of Interest
Authors declare no conflict of interest.
References
- Mondolfo, L.F. Aluminum Alloys; Butterworth-Heinemann: London, UK, 1976. [Google Scholar]
- Polmear, I.J. Light Alloys, 4th ed.; Butterworth-Heinemann: Oxford, UK, 2005. [Google Scholar]
- Muller, I.L.; Galvele, J.R. Pitting potential of high purity binary aluminium alloys—II. AlMg and AlZn alloys. Corros. Sci. 1977, 17, 995–1007. [Google Scholar] [CrossRef]
- Birbilis, N.; Buchheit, R.G. Electrochemical characteristics of intermetallic phases in aluminum alloys: An experimental survey and discussion. J. Electrochem. Soc. 2005, 152, B140–B151. [Google Scholar] [CrossRef]
- Buchheit, R.G. A compilation of corrosion potentials reported for intermetallic phases in aluminum alloys. J. Electrochem. Soc. 1995, 142, 3994–3999. [Google Scholar] [CrossRef]
- Grimm, M.; Lohmüller, A.; Singer, R.F.; Virtanen, S. Influence of the microstructure on the corrosion behaviour of cast Mg-Al alloys. Corros. Sci. 2019, 155, 195–208. [Google Scholar] [CrossRef]
- Davenport, A.J.; Yuan, Y.; Ambat, R.; Connolly, B.J.; Strangwood, M.; Afseth, A.; Scamans, G.M. Intergranular corrosion and stress corrosion cracking of sensitised AA5182. Mater. Sci. Forum 2006, 519, 641–646. [Google Scholar] [CrossRef]
- Yi, G.; Zhu, Y.; Cullen, D.A.; Derrick, A.T.; Free, M.L. Light Metals; Springer: San Diego, CA, USA, 2014. [Google Scholar]
- ASTM G67–18 Standard Test Method for Determining the Susceptibility to Intergranular Corrosion of 5XXX Series Aluminum Alloys by Mass Loss after Exposure to Nitric Acid (NAMLT Test); ASTM International: West Conshohocken, PA, USA, 2018.
- Zhang, R.; Knight, S.P.; Holtz, R.L.; Goswami, R.; Davies, C.H.J.; Birbilis, N. A survey of sensitization in 5xxx series aluminum alloys. Corrosion 2015, 72, 144–159. [Google Scholar] [CrossRef]
- Lyndon, J.A.; Gupta, R.K.; Gibson, M.A.; Birbilis, N. Electrochemical behaviour of the β-phase intermetallic (Mg2Al3) as a function of pH as relevant to corrosion of aluminium–magnesium alloys. Corros. Sci. 2013, 70, 290–293. [Google Scholar] [CrossRef]
- Oguocha, I.N.A.; Adigun, O.J.; Yannacopoulos, S. Effect of sensitization heat treatment on properties of Al–Mg alloy AA5083-H116. J. Mater. Sci. 2008, 43, 4208–4214. [Google Scholar] [CrossRef]
- Yan, J.; Heckman, N.M.; Velasco, L.; Hodge, A.M. Improve sensitization and corrosion resistance of an Al-Mg alloy by optimization of grain boundaries. Sci. Rep. 2016, 6, 1–10. [Google Scholar] [CrossRef]
- Lim, M.L.C.; Matthews, R.; Oja, M.; Tryon, R.; Kelly, R.G.; Scully, J.R. Model to predict intergranular corrosion propagation in three dimensions in AA5083-H131. Mater. Des. 2016, 96, 131–142. [Google Scholar] [CrossRef]
- ASTM standard B928/B928M-15: Standard Specification for High Magnesium Aluminum-Alloy Products for Marine Service and Similar Environments; ASTM International: West Conshohocken, PA, USA, 2018.
- Goswami, R.; Spanos, G.; Pao, P.S.; Holtz, R.L. Precipitation behavior of the ß phase in Al-5083. Mater. Sci. Eng. 2010, 527, 1089–1095. [Google Scholar] [CrossRef]
- Massalski, T.B.; Murray, J.L.; Bennett, L.H.; Baker, H. Binary Alloy Phase Diagrams; American Society for Metals: Metals Park, OH, USA, 1986. [Google Scholar]
- Ding, Y.; Gao, K.; Huang, H.; Wen, S.; Wu, X.; Nie, Z.; Guo, S.; Shao, R.; Huang, C.; Zhou, D. Nucleation and evolution of β phase and corresponding intergranular corrosion transition at 100–230 °C in 5083 alloy containing Er and Zr. Mater. Des. 2019, 174, 107778. [Google Scholar] [CrossRef]
- Steiner, M.A.; Agnew, S.R. Modeling sensitization of Al–Mg alloys via β-phase precipitation kinetics. Scri. Mater. 2015, 102, 55–58. [Google Scholar] [CrossRef]
- Holroyd, N.J.H.; Burnett, T.L.; Seifi, M.; Lewandowski, J.J. Improved understanding of environment-induced cracking (EIC) of sensitized 5XXX series aluminium alloys. Mater. Sci. Eng. 2017, 682, 613–621. [Google Scholar] [CrossRef]
- Goswami, R.; Holtz, R.L. Transmission electron microscopic investigations of grain boundary beta phase precipitation in Al 5083 aged at 373 K (100 °C). Metall. Mater. Trans. A 2013, 44, 1279–1289. [Google Scholar] [CrossRef]
- Dix, E.H., Jr.; Anderson, W.A.; Shumaker, M.B. Influence of service temperature on the resistance of wrought aluminum-magnesium alloys to corrosion. Corrosion 1959, 15, 19–26. [Google Scholar] [CrossRef]
- Searles, J.L.; Gouma, P.I.; Buchheit, R.G. Stress corrosion cracking of sensitized AA5083 (Al-4.5Mg-1.0Mn). Metall. Mater. Trans. A 2001, 32, 2859–2867. [Google Scholar] [CrossRef]
- Scotto D’Antuono, D.; Gaies, J.; Golumbfskie, W.; Taheri, M.L. Direct measurement of the effect of cold rolling on β phase precipitation kinetics in 5xxx series aluminum alloys. Acta Mater. 2017, 123, 264–271. [Google Scholar] [CrossRef]
- Zhang, R.; Steiner, M.A.; Agnew, S.R.; Kairy, S.K.; Davies, C.H.J.; Birbilis, N. Experiment-based modelling of grain boundary β-phase (Mg2Al3) evolution during sensitisation of aluminum alloy AA5083. Sci. Rep. 2017, 7, 2961. [Google Scholar] [CrossRef]
- Zhang, X.; Zhou, X.; Hashimoto, T.; Liu, B. Localized corrosion in AA2024-T351 aluminium alloy: Transition from intergranular corrosion to crystallographic pitting. Mater. Charact. 2017, 130, 230–236. [Google Scholar] [CrossRef]
- Zhang, W.; Frankel, G.S. Transitions between pitting and intergranular corrosion in AA2024. Electrochim. Acta 2003, 48, 1193–1210. [Google Scholar] [CrossRef]
- Jain, S.; Hudson, J.L.; Scully, J.R. Effects of constituent particles and sensitization on surface spreading of intergranular corrosion on a sensitized AA5083 alloy. Electrochim. Acta 2013, 108, 253–264. [Google Scholar] [CrossRef]
- Seong, J.; Yang, F.; Scheltens, F.; Frankel, G.S.; Sridhar, N. Influence of the altered surface layer on the corrosion of AA5083. J. Electrochem. Soc. 2015, 162, C209–C218. [Google Scholar] [CrossRef]
- Aballe, A.; Bethencourt, M.; Botana, F.J.; Marcos, M. CeCl3 and LaCl3 binary solutions as environment-friendly corrosion inhibitors of AA5083 Al–Mg alloy in NaCl solutions. J. Alloys Compd. 2001, 323, 855–858. [Google Scholar] [CrossRef]
- Li, Y.; Cai, J.M.; Guan, L.; Wang, G. pH-dependent electrochemical behaviour of Al3Mg2 in NaCl solution. Appl. Surf. Sci. 2019, 467, 619–633. [Google Scholar] [CrossRef]
- Südholz, A.D.; Kirkland, N.T.; Buchheit, R.G.; Birbilis, N. Electrochemical properties of intermetallic phases and common impurity elements in magnesium alloys. Electrochem. Solid-State Lett. 2011, 14, C5–C7. [Google Scholar] [CrossRef]
- Jain, S.; Lim, M.L.C.; Hudson, J.L.; Scully, J.R. Spreading of intergranular corrosion on the surface of sensitized Al-4.4Mg alloys: A general finding. Corros. Sci. 2012, 59, 136–147. [Google Scholar] [CrossRef]
- Gupta, R.K.; Sukiman, N.L.; Cavanaugh, M.K.; Hinton, B.R.W.; Hutchinson, C.R.; Birbilis, N. Metastable pitting characteristics of aluminium alloys measured using current transients during potentiostatic polarisation. Electrochim. Acta 2012, 66, 245–254. [Google Scholar] [CrossRef]
- Foley, D.L.; Leff, A.; Lang, A.C.; Taheri, M.L. Evolution of β-phase precipitates in an aluminum-magnesium alloy at the nanoscale. Acta Mater. 2019, 185, 279–286. [Google Scholar] [CrossRef]
- Aballe, A.; Bethencourt, M.; Botana, F.J.; Cano, M.J.; Marcos, M. Localized alkaline corrosion of alloy AA5083 in neutral 3.5% NaCl solution. Corros. Sci. 2001, 43, 1657–1674. [Google Scholar] [CrossRef]
- Zhang, W.; Frankel, G.S. Localized corrosion growth kinetics in AA2024 alloys. J. Electrochem. Soc. 2002, 149, B510–B519. [Google Scholar] [CrossRef]
- Comotti, I.M.; Trueba, M.; Trasatti, S.P. The pit transition potential in the repassivation of aluminium alloys. Surf. Interface Anal. 2013, 45, 1575–1584. [Google Scholar] [CrossRef]
- Pride, S.T.; Scully, J.R.; Hudson, J.L. Metastable pitting of aluminum and criteria for the transition to stable pit growth. J. Electrochem. Soc. 1994, 141, 3028–3039. [Google Scholar] [CrossRef]
- Yasuda, M.; Weinberg, F.; Tromans, D. Pitting corrosion of Al and Al-Cu single crystals. J. Electrochem. Soc. 1990, 137, 3708. [Google Scholar] [CrossRef]
- Moore, K.L.; Sykes, J.M.; Grant, P.S. An electrochemical study of repassivation of aluminium alloys with SEM examination of the pit interiors using resin replicas. Corros. Sci. 2008, 50, 3233–3240. [Google Scholar] [CrossRef]
- Kramer, L.; Phillippi, M.; Tack, W.; Wong, C. Locally reversing sensitization in 5xxx aluminum plate. J. Mater. Eng. 2012, 21, 1025–1029. [Google Scholar] [CrossRef]
- Liu, Y.; Yang, Y.; Zhang, C.; Zhang, T.; Yu, B.; Meng, G.; Shao, Y.; Wang, F.; Liu, L. Protection of AA5083 by a zirconium-based conversion coating. J. Electrochem. Soc. 2016, 163, C576–C586. [Google Scholar] [CrossRef]
- Seong, J.; Frankel, G.S.; Sridhar, N. Corrosion inhibition of sensitized and solutionized AA5083. J. Electrochem. Soc. 2015, 162, C449–C456. [Google Scholar] [CrossRef]
- Xia, D.-H.; Pan, C.; Qin, Z.; Fan, B.; Song, S.; Jin, W. Covalent surface modification of LY12 aluminum alloy surface by self-assembly dodecyl phosphate film towards corrosion proteciton. Prog. Org. Coat. 2020, 143, 105638. [Google Scholar] [CrossRef]
- Zhang, R.; Li, J.; Li, Q.; Qi, Y.; Zeng, Z.; Qiu, Y.; Chen, X.; Kairy, S.K.; Thomas, S.; Birbilis, N. Analysing the degree of sensitisation in 5xxx series aluminium alloys using artificial neural networks: A tool for alloy design. Corros. Sci. 2019, 150, 268–278. [Google Scholar] [CrossRef]
- Li, F.; Xiang, D.; Qin, Y.; Pond, R.B.; Slusarski, K. Measurements of degree of sensitization (DoS) in aluminum alloys using EMAT ultrasound. Ultrasonics 2011, 51, 561–570. [Google Scholar] [CrossRef] [PubMed]
- Buczynski, J. Electrochemical Analyses of Etchants Used to Detect Sensitization in Marine-Grade 5XXX Aluminum-Magnesium Alloys. Master’s Thesis, University of Virginia, Charlottesville, VA, USA, 2012. [Google Scholar]
- Yasuda, M. Pitting Corrosion and Intergranular Corrosion of Al and Al-Cu Alloy Single Crystals and Bicrystals. Ph.D. Thesis, University of British Columbia, Vancouver, BC, Canada, 1988. [Google Scholar]
- Craig, H.L., Jr. Nitric Acid Weight Loss Test for the H116 and H117 Tempers of 5086 and 5456 Aluminum Alloys. In Localized Corrosion—Cause of Metal Failure; ASTM International: West Conshohocken, PA, USA, 1972; pp. 17–37. [Google Scholar]
- Shaw, B.A.; McCosby, M.M.; Abdullah, A.M.; Pickering, H.W. The localized corrosion of Al 6XXX alloys. JOM 2001, 53, 42–46. [Google Scholar] [CrossRef]
- Trueba, M.; Trasatti, S.P. Study of Al alloy corrosion in neutral NaCl by the pitting scan technique. Mater. Chem. Phys. 2010, 121, 523–533. [Google Scholar] [CrossRef]
- Bethencourt, M.; Botana, F.J.; Cano, M.J.; Marcos, M.; Sánchez-Amaya, J.M.; González-Rovira, L. Using EIS to analyse specimens of Al–Mg alloy AA5083 treated by thermal activation in cerium salt baths. Corros. Sci. 2008, 50, 1376–1384. [Google Scholar] [CrossRef]
- Ohta, K.; Ishida, H. Comparison among several numerical integration methods for Kramers-Kronig transformation. Appl. Spectrosc. 1988, 42, 952–957. [Google Scholar] [CrossRef]
- Bohren, C.F. What did Kramers and Kronig do and how did they do it? Eur. J. Phys. 2010, 31, 573–578. [Google Scholar] [CrossRef]
- Aballe, A.; Bethencourt, M.; Botana, F.J.; Cano, M.J.; Marcos, M. On the mixed nature of cerium conversion coatings. Mater. Corros. 2002, 53, 176–184. [Google Scholar] [CrossRef]
- Aballe, A.; Bethencourt, M.; Botana, F.J.; Cano, M.J.; Marcos, M. Inhibition of the corrosion process of alloy AA5083 (Al-Mg) in seawater by cerium cations. An EIS study. Mater. Corros. 2001, 52, 344–350. [Google Scholar] [CrossRef]
- Brug, G.J.; van den Eeden, A.L.G.; Sluyters-Rehbach, M.; Sluyters, J.H. The analysis of electrode impedances complicated by the presence of a constant phase element. J. Electroanal. Chem. Interf. Electrochem. 1984, 176, 275–295. [Google Scholar] [CrossRef]
- Hsu, C.H.; Mansfeld, F. Technical note: Concerning the conversion of the constant phase element parameter Y0 into a capacitance. Corrosion 2001, 57, 747–748. [Google Scholar] [CrossRef]
- Yao, M.; Shan, W. Dielectric behavior of alumina thin film under high DC electric field prepared by sol–gel method. J. Adv. Dielectr. 2013, 3, 1350017. [Google Scholar] [CrossRef]
- Hirschorna, B.; Orazem, M.E.; Tribollet, B.; Vivier, V.; Frateur, I.; Musianid, M. Determination of effective capacitance and film thickness from constant-phase-element parameters. Electrochim. Acta 2010, 55, 6218–6227. [Google Scholar] [CrossRef]
- Benoit, M.; Bataillon, C.; Gwinner, B.; Miserque, F.; Orazem, M.E.; Sanchez-Sanchez, C.M.; Tribollet, B.; Vivier, V. Comparison of different methods for measuring passive film thickness on metals. Electrochim. Acta 2016, 201, 340–347. [Google Scholar] [CrossRef]
- Gao, W.; Wang, D.; Seifi, M.; Lewandowski, J.J. Anisotropy of corrosion and environmental cracking in AA5083-H128 Al-Mg alloy. Mater. Sci. Eng. A 2018, 730, 367–379. [Google Scholar] [CrossRef]


© 2020 by the authors. Licensee MDPI, Basel, Switzerland. This article is an open access article distributed under the terms and conditions of the Creative Commons Attribution (CC BY) license (http://creativecommons.org/licenses/by/4.0/).