Article

Modeling of Convex Surface Topography in Milling Process

1
Key Laboratory of Advanced Manufacturing and Intelligent Technology, Ministry of Education, Harbin University of Science and Technology, No. 52 Xuefu Road, Nangang District, Harbin 150080, China
2
Department of Production Engineering, KTH Royal Institute of Technology, 10044 Stockholm, Sweden
3
Woodruff School of Mechanical Engineering, Georgia Institute of Technology, Atlanta, 30332-0405 GA, USA
*
Author to whom correspondence should be addressed.
Metals 2020, 10(9), 1218; https://doi.org/10.3390/met10091218
Submission received: 12 August 2020 / Revised: 31 August 2020 / Accepted: 4 September 2020 / Published: 10 September 2020
(This article belongs to the Section Metal Casting, Forming and Heat Treatment)

Abstract

:
Cr12MoV die steel is a typical high-strength and high-hardness material. Because of the high hardness of Cr12MoV die steel, which is approximately 50–65 HRC after quenching, and the tool’s weak rigidity, cutting vibration, and tool deformation are inevitable during the cutting process. In this paper, a model for predicting the surface topography of a convex curved die steel machined by a ball-end milling cutter was established. In addition, the surface springback of the workpiece is considered. According to the surface characteristics of the convex curved workpiece, the vector algorithm and transformation matrix are applied to calculate the milling cutter motion trajectory equation. Then, the influence of dynamic factors on the tool path is calculated, and finally the surface topography of the workpiece is simulated through the Z-map model. The simulation error of three-dimensional surface roughness Sa at different positions of the curved surface is between 10% and 16%. After considering the dynamic factors, the simulation error is reduced by about 50%.

1. Introduction

Auto panel dies generally use Cr12MoV and 7CrSiMnMoV tool steels, which have a hardness of approximately 50–65 HRC after quenching. They are typical high-strength and high-hardness materials, so they are difficult to process. In order to pursue efficient production, the company generally uses hard cutting technology to finish the mold. The surface topography of the product has a large impact on the performance of the product [1]. For example, the components (such as automotive parts and aircraft structural parts) are subjected to cyclic loading, and their fatigue life is highly dependent on the surface topography. The cutting conditions directly affect the state of the machined surface (surface texture, surface topography, surface residual stress, and so on), and then affect the final properties of the workpiece [2]. As the surface features of the auto panel die are mostly curved surfaces, the contact area between the tool and the workpiece changes momentarily during the milling result in the surface topography is different at different positions of the curved surface and different milling parameters [3]. The influence of milling parameters on the surface morphology has been studied a lot.
Buj-Corral et al. [4] has studied the effects of feed per tooth and width of cut on the surface topography. The results show that, at lower width of cut, no matter how much feed rate is taken, the surface roughness is small. When the width of cut is high, the higher the feed rate, the greater the surface roughness. Yao et al. [5] has studied the surface topography during high-speed milling of TB6. What they found is that the feed per tooth has the greatest influence on the surface roughness, followed by the width of cut. Bouzakis et al. [6] has studied the influence of the inclination angle of the tool on the surface roughness and develops a milling simulation algorithm “BALLMILL” to calculate the surface roughness in multi-axis milling. The study shows that the roughness continuously decreases with the tilt angle in the range of 0° to 5°, and then as the inclination angle continues to increase, the roughness gradually increases. Xu et al. [7] has simulated the surface topography of milling process based on the method of sweeping surface and proposes an interpolation method to improve the prediction accuracy of the surface roughness. The simulation method is used to study the effects of milling parameters and the inclination angle of the tool on the surface topography, and the simulation results are generally smaller than the experimental results. Wojciechowski et al. [8,9] studied the displacement model of ball-end milling cutters considering the tool deformation caused by runout and cutting force. Combining the model and experiment, the optimization of the inclination angle and feed per tooth is obtained. Under this parameter, the force, vibration, and surface roughness are simultaneously minimized. Wojciechowski et al. [10] proposed an experimental method to estimate the vibration of a ball-end milling cutter, and analyzed the relationship between the instantaneous displacement of the tool and the surface roughness. The research results show that the amount of tool overhang has an important influence on the mechanism of surface roughness during fine finishing. Urbikain et al. [11] proposed a time-domain model of surface topography considering the influence of tool runout for side milling of circular-segment cutter. The model can predict the interval between the maximum (down) and minimum (up) roughness values. The research results show that the tilt angle has a significant effect on the roughness and should be as small as possible. The above scholars have studied the effects of milling parameters on the surface topography, which provides a favorable reference for the optimization of milling parameters during milling. However, the factors such as cutting vibration and deflection of the tool or workpiece during milling will also affect the surface topography [12]. Therefore, it is necessary to study the effects of the above factors on the surface topography.
Toh et al. [13] has studied the effect of the milling path on the surface topography of hardened steel. The results show that the bottom-up milling resulted in a lower surface roughness than the top-down milling method. Shajari et al. [14] has studied the cutting force and surface topography considering the tool path when milling the convex stainless steel. The results show that the radial tool path obtains the best surface topography and the lowest cutting force, and the spiral strategy obtains the worst surface topography and the largest cutting force. The above scholars have studied the surface topography by cutting experiments and have analyzed the effect of tool path on the surface morphology, which helps to improve the surface quality.
At present, most of the experimental research on the surface topography is focused on the influence of milling parameters and tool path. Surface topography is one of the final indexes for evaluating surface integrity. Any slight error in the cutting process will affect the surface topography. In addition to the milling parameters, studying the effects of other factors such as cutting vibration and tool deformation on the surface topography plays an important role in the surface topography simulation.
Lavernhe et al. [15] has simulated the three-dimensional surface topography of the workpiece on the five-axis machine tool. The simulation model based on the N-buffer method is applied to study the surface topography. The results show that the cutting vibration has a great effect on the surface topography. Furthermore, Lavernhe et al. [16] considers the actual edge geometry of the cutting tool to establish a more accurate surface topography simulation model, which simulates the surface flaws during the five-axis milling process and predicts the local flaws of the machined surface accurately. Arizmendi et al. [17] establishes a model to simulate surface topography, which takes into account the influence of the offset and the tilt of the tool axis. The model also quantitatively evaluates the effects of tool geometry, tool position error, and feed rate on surface roughness. Omar et al. [18] has studied the effects of tool runout, machine tool-workpiece dynamics, tool wear, and tool axis tilt on surface roughness by simulation model and has analyzed the sensitivity of surface roughness to machining error. Denkena et al. [19] establishes a model for simulating the surface topography based on the measured cutting force, which provides online monitoring of the surface of the workpiece during milling under relatively stable cutting conditions. Jiang et al. [20] proposes an algorithm for simulating the surface of the workpiece based on the vibration displacement signal measured online during milling to analyze the effect of the cutting vibration on the surface topography. The above scholars have studied the effects of various machining errors on the surface topography. In the simulation process of surface topography, the more influential factors we consider, the closer the simulation results are to the experimental results.
The mapping laws between milling parameters, tool geometry parameters, and surface topography are established by the simulation model. However, most of the current surface topography simulation models are established under ideal conditions or only considers the effects of fewer factors on the surface topography. There is a big difference between the actual machining conditions and the actual milling process. There are cutting vibration, tool wear, and springback of the workpiece surface in the actual milling process, which have a great impact on the surface topography, so it is meaningful to establish a surface topography simulation model that fully considers the machining errors. In this paper, a simulation model whose machining conditions are closer to the actual conditions is established for the convex curved die steel machined by a ball-end milling cutter. In the model, considering the effects of cutting vibration and tool deformation on the surface topography during milling can obtain more accurate surface topography simulation results. The main research contents of this paper are as follows:
(1) Establishing a model for simulating surface topography of convex surface.
According to the contact relationship between cutting tool and the workpiece during milling of the convex surface, the model simulating surface topography is established. The effects of milling parameters, vibration displacement, and tool deformation on the surface topography are considered in this model.
(2) Comparison of simulation and experiment on surface topography at different positions of convex curved surface.
The surface topography and surface roughness simulation results are output from the established model, then the effects of different positions of the convex surface on the surface topography and surface roughness are studied. The simulation results are compared with the experiment data to verify the simulation results and analyze the mechanism of surface topography.

2. Model of Cutting Edge for Ball-End Milling Cutter

To establish a surface topography model during milling, the first step is to obtain the equation of the cutting edge of the ball-end milling cutter. Because only the ball portion of the ball-end milling cutter is involved in cutting, it is only necessary to establish the equation of the cutting edge of the ball portion. First, the tool coordinate system O1-X1Y1Z1 (CS1) should be established. In this paper, the centre of the ball is used as the origin of the CS1, and O1Z1 coincides with the tool axis, as shown in Figure 1.
The cutting edge of the ball portion is a spiral edge, on which there is any point called P. The distance from the point P to the point O1 is the radius R of the ball portion, the angle between the line O1P and the Z1-axis is α, and the angle between the line O1P and the X1-axis is Ψ. Therefore, the coordinates of the point P in the CS1 can be expressed as
{ x 0 = R sin α cos Ψ y 0 = R sin α sin Ψ z 0 = R cos α
The angle Ψ has the following relationship with the helix angle γ of the milling cutter.
Ψ = tan γ ln ( cot ( α / 2 ) )
Combining Equation (2) with Equation (1), we get the equation of the coordinates of the point P, which consists of the tool radius R, the angle γ and α [21].
{ x 0 = R sin α cos ( tan γ ln ( cot ( α / 2 ) ) ) y 0 = R sin α sin ( tan γ ln ( cot ( α / 2 ) ) ) z 0 = R cos α
In general, the ball-end milling cutter has a plurality of cutter teeth, and the plurality of cutter teeth is evenly distributed. When the ball-end milling cutter has N teeth, the angle between the first tooth and the positive direction of the X-axis in the CS1 is θ1, then the angle between the jth tooth and the positive direction of the X1-axis is as follows:
θ j = θ 1 + j 1 N × 2 π
According to the principle of coordinate transformation, in the CS1, the coordinates of any point on the jth tooth can be expressed as follows:
[ x j y j z j 1 ] = [ cos θ j sin θ j 0 0 sin θ j cos θ j 0 0 0 0 1 0 0 0 0 1 ] [ x 0 y 0 z 0 1 ]

3. Mathematical Model of Tool Motion for Milling Convex Surface

3.1. Establish a Trajectory Model of the Cutting Edge

In the second section, the coordinates of any point on the jth tooth in the static state of the tool are obtained. During the actual machining, the tool rotates at a high speed and moves relative to the workpiece. By converting the tool speed ns (r/min) to the angular velocity ωs (rad/s), the transformation matrix of any point on the jth tooth at any time is as follows:
T 1 = [ cos ω s t sin ω s t 0 0 sin ω s t cos ω s t 0 0 0 0 1 0 0 0 0 1 ]
Therefore, the coordinates of any point on the jth tooth at any time are as follows:
[ x 1 , y 1 , z 1 , 1 ] T = T 1 [ x j , y j , z j , 1 ] T
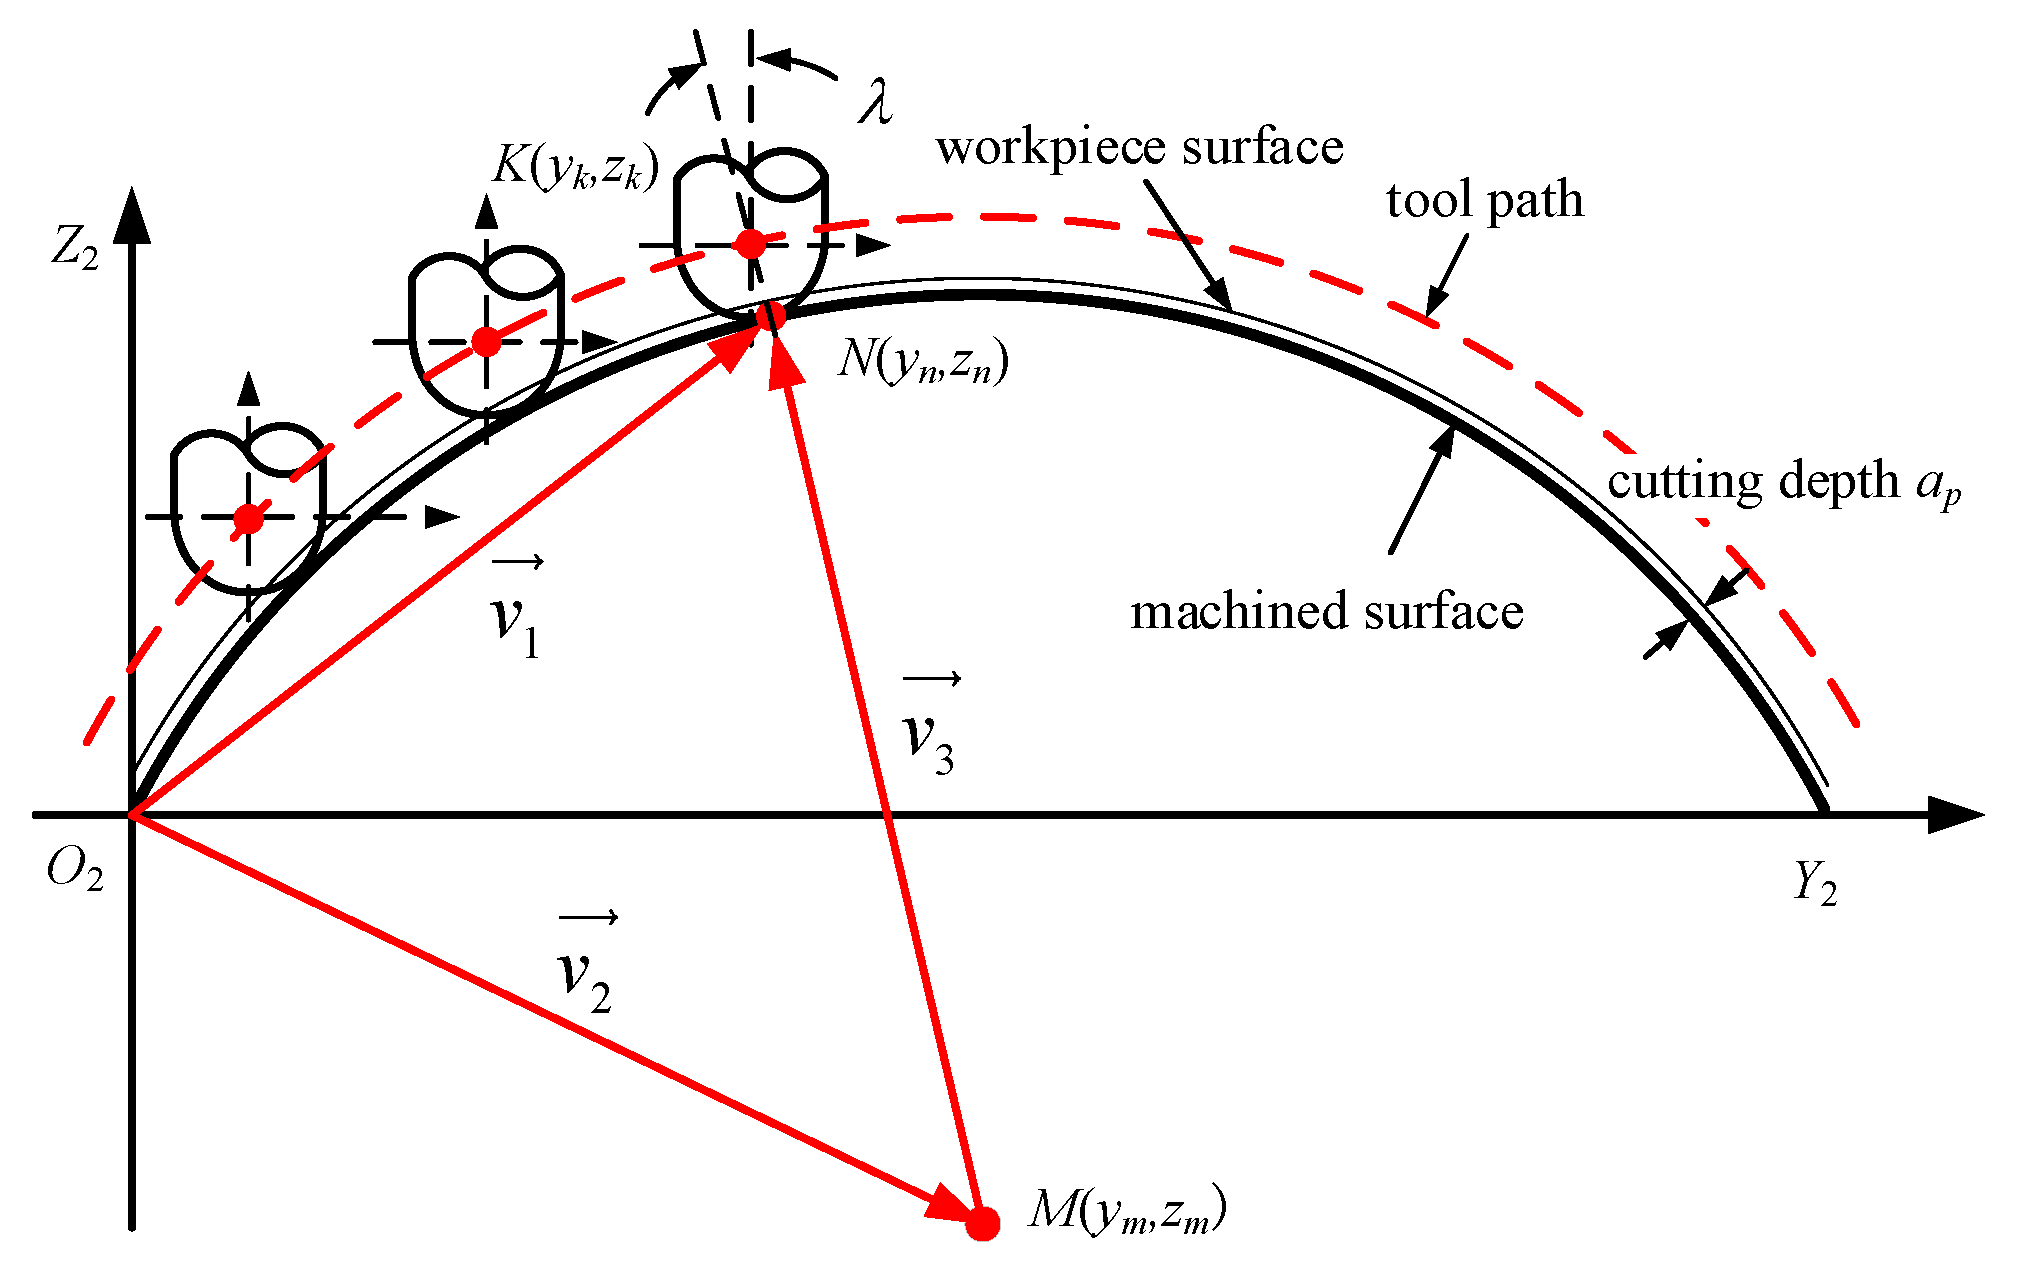
The equations above are all established with reference to the CS1. The coordinate system moves with the movement of the spindle. Then, the workpiece coordinate system O2-X2Y2Z2 (CS2) is set, which is a fixed coordinate system and does not change with the progress of the machining. The relationship between the CS1 and the CS2 is the trajectory of the tool relative to the workpiece during machining. The trajectory is shown in Figure 2.
The workpiece is an arc-shaped workpiece with constant curvature, and the center of the arc is M. The coordinates in the coordinate system O2-Y2Z2 are M(ym, zm), and the coordinates of a point N on the surface are (yn, zn), so there are the following:
v 1 = O 2 N = ( y n , z n )
v 2 = O 2 M = ( y m , z m )
v 3 = v 1 v 2 = ( y n y m , z n z m )
The direction of vector v 3 is as follows:
tan λ = y n y m z n z m
λ = arctan y n y m z n z m
The depth of cut is ap and the width of cut is ae. From the above equation, the coordinates of K on the path of the tool can be obtained by the coordinates of any point N(yn, zn) on the convex surface. The coordinates of K are as follows:
{ y k = y n ( R a p ) sin λ z k = z n + ( R a p ) cos λ
The tool feed rate vf is fed in the Y2 direction in the CS2. The curve equation of the cross section of the convex surface is u = (yn,zn). The equation for zn of yn is zn = v(yn). At any time t, yn = vf × t.
Figure 3 shows the tool path in the CS2, and x0 is the abscissa value of the initial position of the CS1 in the CS2. Then, the coordinates of a point on the CS2 at any time are as follows:
{ x k = x 0 + ( i 1 ) a e y k = y n ( R a p ) sin λ z k = v ( y n ) + ( R a p ) cos λ
Therefore, the transformation matrix from the CS1 to the CS2 can be expressed as follows:
T 2 = [ 1 0 0 x 0 + ( i 1 ) a e 0 1 0 y n ( R a p ) sin λ 0 0 1 v ( y n ) + ( R a p ) cos λ 0 0 0 1 ]
Considering the effect of the rotation and feed motion of the tool on the CS1, at any time, the coordinates of the point P on the cutting edge in the CS2 can be obtained, which can be expressed as Equation (16):
[ x 2 , y 2 , z 2 , 1 ] T = T 2 [ x 1 , y 1 , z 1 , 1 ] T

3.2. Effect of Cutting Vibration on Surface Topography

In order to improve the simulation accuracy of the surface topography simulation model, this paper considers the influence of the cutting vibration and the tool deformation on the surface topography. The dynamics model is assumed to be a three degree of freedom spring-damper system corresponding to the X, Y, and Z directions, respectively. The three-dimensional dynamic model can be expressed by the following equation [22]:
{ x ¨ ( t ) + 2 ξ x ω x x ˙ ( t ) + ω x 2 x ( t ) = ω x 2 k x F x ( t ) y ¨ ( t ) + 2 ξ y ω y y ˙ ( t ) + ω y 2 y ( t ) = ω y 2 k y F y ( t ) z ¨ ( t ) + 2 ξ z ω z z ˙ ( t ) + ω z 2 z ( t ) = ω z 2 k z F z ( t )
where x ( t ) is the displacement of the tool in the X direction, x ˙ ( t ) is the vibration speed of the tool in the X direction, x ¨ ( t ) is the vibration acceleration of the tool in the X direction, and the two directions of Y and Z are the same as X. Fx(t), Fy(t), and Fz(t) are the components of the milling forces in the X, Y, and Z directions, respectively. ξ, ω, and k are the damping ratio, mode frequency, and mode stiffness, respectively, which can be determined by mode experiments.
In this paper, the milling force model proposed by Armarego [23] is used. The section of milling forces can be expressed as follows:
{ d F t ( j , θ , φ ) = K t e d s + K t c t j d b d F r ( j , θ , φ ) = K r e d s + K r c t j d b d F a ( j , θ , φ ) = K a e d s + K a c t j d b
where Kte, Kre, and Kae are the edge force coefficients; Ktc, Krc, and Kac are the cutting force coefficients [24]; ds and db are the differential length and width of the cutting edge; dFt, dFr, and dFa are the tangential force, radial force, and axial force of the cutting edge discrete arbitrary infinitesimal elements, respectively; and tj is the chip thickness.
The undeformed chip thickness in surface machining can be expressed as Equation (19), and its detailed derivation process is described in [25].
{ t j = f cos λ sin α sin θ j f sin λ cos α θ j = θ 1 Ψ ( α ) + π / 2 2 π ( j 1 ) / N
where f is the feed rate, λ is the inclination angle of the tool along the feed direction during the machining of the curved surface, and Ψ(α) is the lag angle of the cutting edge infinitesimal element.
The tangential, radial, and axial forces of any infinitesimal element of discrete cutting edges are projected onto the X, Y, and Z axes as follows:
[ d F x d F y d F z ] = [ cos ( θ j ) sin ( α ) sin ( θ j ) cos ( α ) sin ( θ j ) sin ( θ j ) sin ( α ) cos ( θ j ) cos ( α ) cos ( θ j ) 0 cos ( α ) sin ( α ) ] [ d F t d F r d F a ]
The overall milling forces can be expressed as follows:
[ F x F y F z ] T = j = 1 N klow kup [ d F x d F y d F z ] T
The milling dynamics Equation (18) can be solved by the Runge–Kutte method, and the vibration displacements x(t), y(t), and z(t) are obtained. In order to fulfill the requirements of calculation accuracy and calculation speed, this paper uses the fourth-order Runge–Kutta method to solve the vibration differential equation [26]. Taking the vibration displacement in the X direction as an example, the detailed process of calculating the vibration differential equation by the fourth-order Runge–Kutta method is given in detail. The methods of calculating the vibration displacement in the Y and Z directions are completely consistent with the method of calculating the vibration displacement in the X direction. First, the vibration differential equation in the X direction is modified as follows:
[ F x F y F z ] T = j = 1 N klow kup [ d F x d F y d F z ] T x ¨ = ω x k x [ ω x F x ( t ) 2 ξ x x ω x x ˙ ]
The initial conditions x 0 and x ˙ 0 of the time domain differential equation are set to the following:
{ x 0 = x ( 0 ) = 0 x ˙ 0 = x ˙ ( 0 ) = 0
Decreasing the order of Equation (22) and using q to represent x ˙ , we can get Equation (22) downgraded to the first-order differential equation:
{ x ˙ = q q ˙ = f ( x , q , t )
According to the Runge–Kutta method, the displacement component and the velocity component in Equation (24) are expressed as a form of addition of polynomials:
{ x i + 1 = x i + Δ t 6 ( K 1 + 2 K 2 + 2 K 3 + K 4 ) q i + 1 = q i + Δ t 6 ( L 1 + 2 L 2 + 2 L 3 + L 4 )
where t i = i Δ t and L1, L2, L3, L4, K1, K2, K3, and K4 can be expressed as follows:
{ K 1 = q i , L 1 = f ( t i , x i , q i ) K 2 = q i + Δ t 2 L 1 , L 2 = f ( t i + Δ t 2 , x i + Δ t 2 K 1 , q i + Δ t 2 L 1 ) K 3 = q i + Δ t 2 L 2 , L 3 = f ( t i + Δ t 2 , x i + Δ t 2 K 2 , q i + Δ t 2 L 2 ) K 4 = q i + Δ t 2 L 3 , L 4 = f ( t i + Δ t 2 , x i + Δ t 2 K 3 , q i + Δ t 2 L 3 )

3.3. Effect of Deformation on Surface Topography

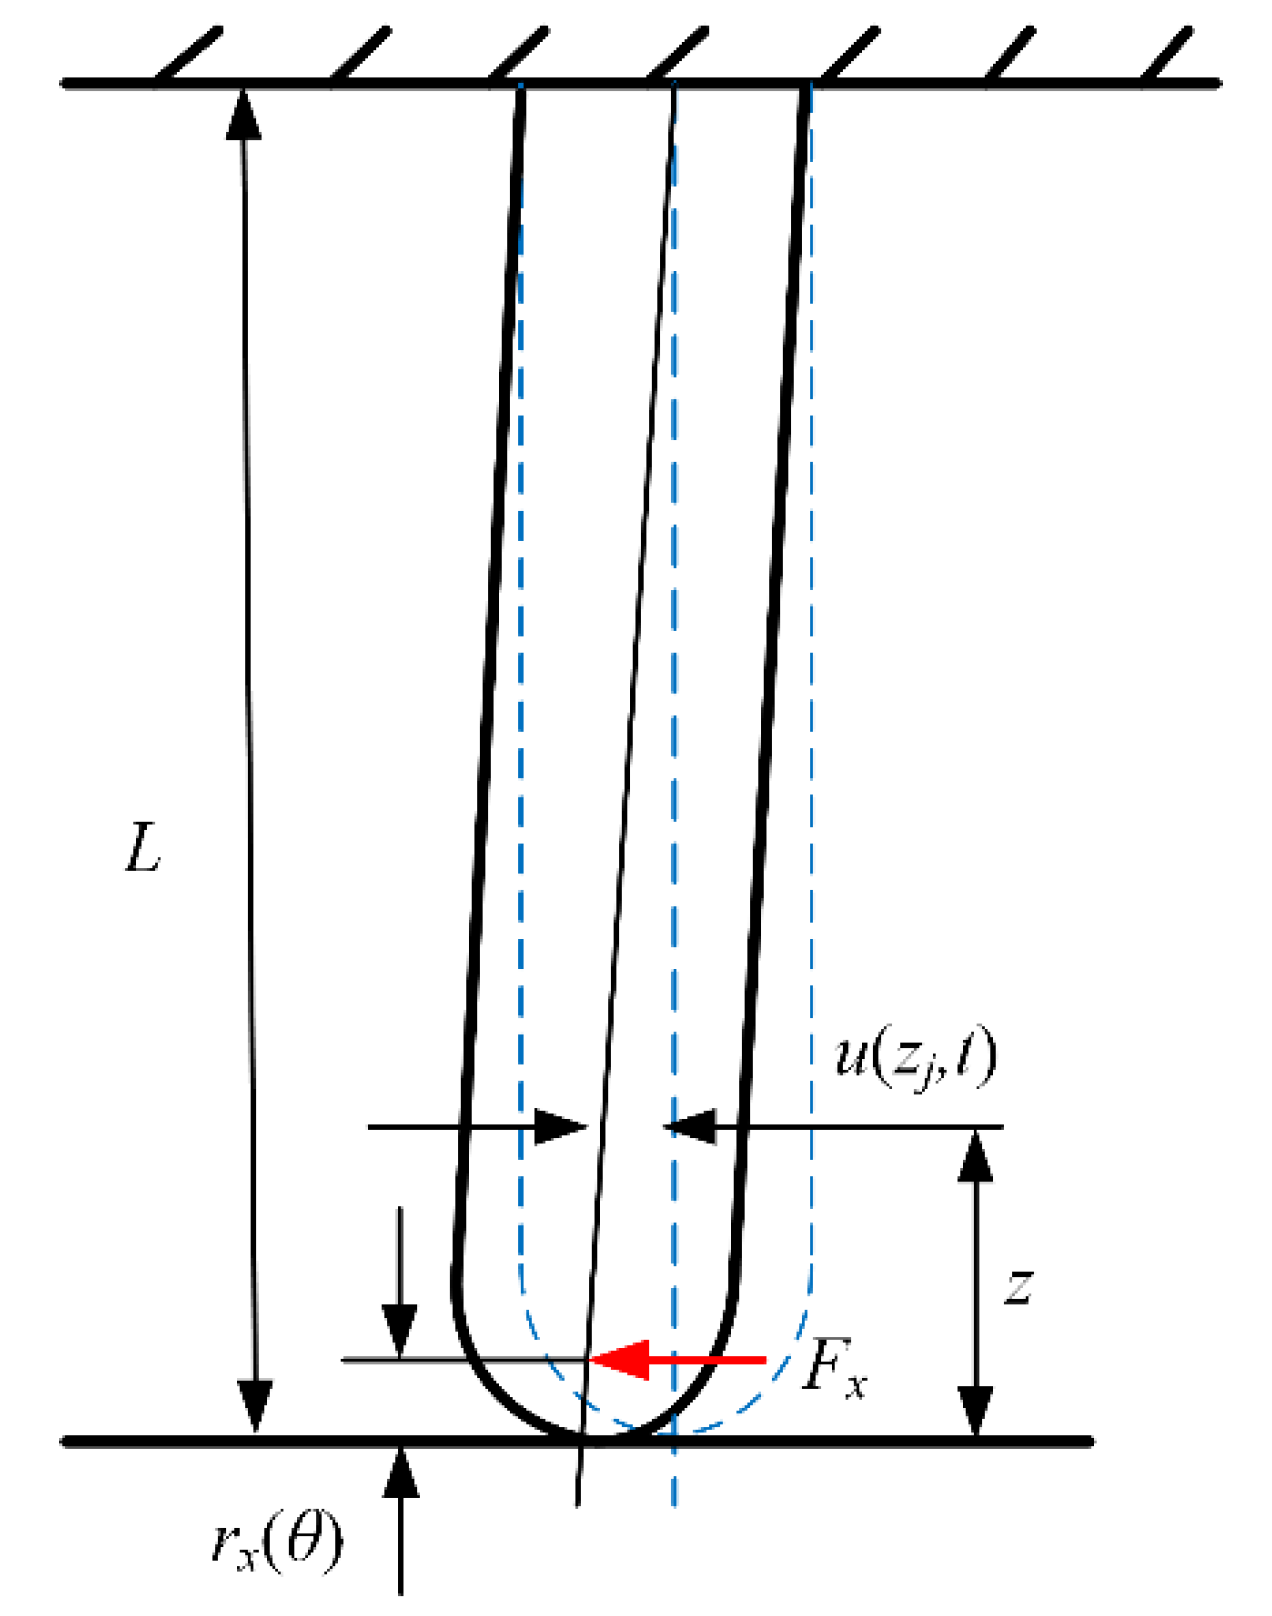
Tool deformation during milling is mainly caused by the cutting force in the cutting direction and feed direction. Tool deformations in the X and Y directions are represented by u(zj,t) and v(zj,t), respectively. To calculate the tool deformation, simplify the tool to a cantilever beam, as shown in Figure 4. In order to simplify the calculation process, the force distributed on the cutting edge is simplified to the force acting at a certain point, which is called the center of the cutting force. Then, the static deformation in the X direction can be expressed by the following equation [27]:
u ( z j , t ) = F x 6 E I [ ( r x ( θ ) z ) 3 ( L z ) 3 + 3 ( L z ) 2 ( L r x ( θ ) ) ]
where E is the Young’s modulus, I is the inertia moment, Fx is the milling force in the X direction, L is the length of the tool overhang, and rx(θ) is the distance between the center of the instantaneous cutting force and the point of the tool nose in the X direction. rx(θ) is determined by Equation (28). The method of calculating the tool deformation in the Y direction is completely consistent with that in the X direction.
r x ( θ ) = L ( L r F x ) j = 1 N k low k up d F x F x
where r F x is the distance between the tool nose and the action point of the differential unit dFx on the cutting edge.
In the Z direction, there are two main factors affecting the surface topography; that is, the plastic deformation of the machined surface, and the cutting vibration during milling. The plastic strain follows a first-order negative exponential distribution with a maximum on the skin layer of the machined surface, and it decreases sharply along the direction perpendicular to the machined surface. The distribution of plastic strain can be expressed as follows [27]:
ε ( z ) = J 1 exp ( J 2 z )
where J1 and J2 are negative exponential distribution factors, which can be obtained by Equation (30):
{ J 1 = cos ( α 0 ) 3 sin ( φ ) cos ( φ α 0 ) J 2 = 1 ( n 1 + 1 ) d ln [ 1 ( n 1 + 1 ) ( F x cos ( φ ) F y sin ( φ ) ( 3 sin ( φ ) ) n 1 + 1 cos n 1 ( φ α 0 ) ) K a e a p cos n 1 ( α 0 ) ]
where α0 is the tool rake angle, φ = arcsin(ae(theory)/ae(actual)), K is the material yield strength, n1 is the material hardening index, and d is the depth of plastic deformation of the material [27].
The plastic deformation of the workpiece material is represented by δd, which can be obtained by the following equation:
δ d = J 1 J 2 exp ( J 2 d )
Considering the above several errors, the left side of the motion trajectory matrix of the tool in the simulation model is multiplied by the coefficient matrix TC:
T C = [ 1 0 0 u ( z j , t ) + x ( t ) 0 1 0 v ( z j , t ) + y ( t ) 0 0 1 δ d + z ( t ) 0 0 0 1 ]
Combined with the factors affecting the cutting process, the equation of any point of the cutting edge during the cutting process can be expressed as follows:
[ x 3 , y 3 , z 3 , 1 ] T = T C T 2 [ x 1 , y 1 , z 1 , 1 ] T

4. Surface Topography Simulation

4.1. Determination of the Contact Area between the Tool and the Workpiece

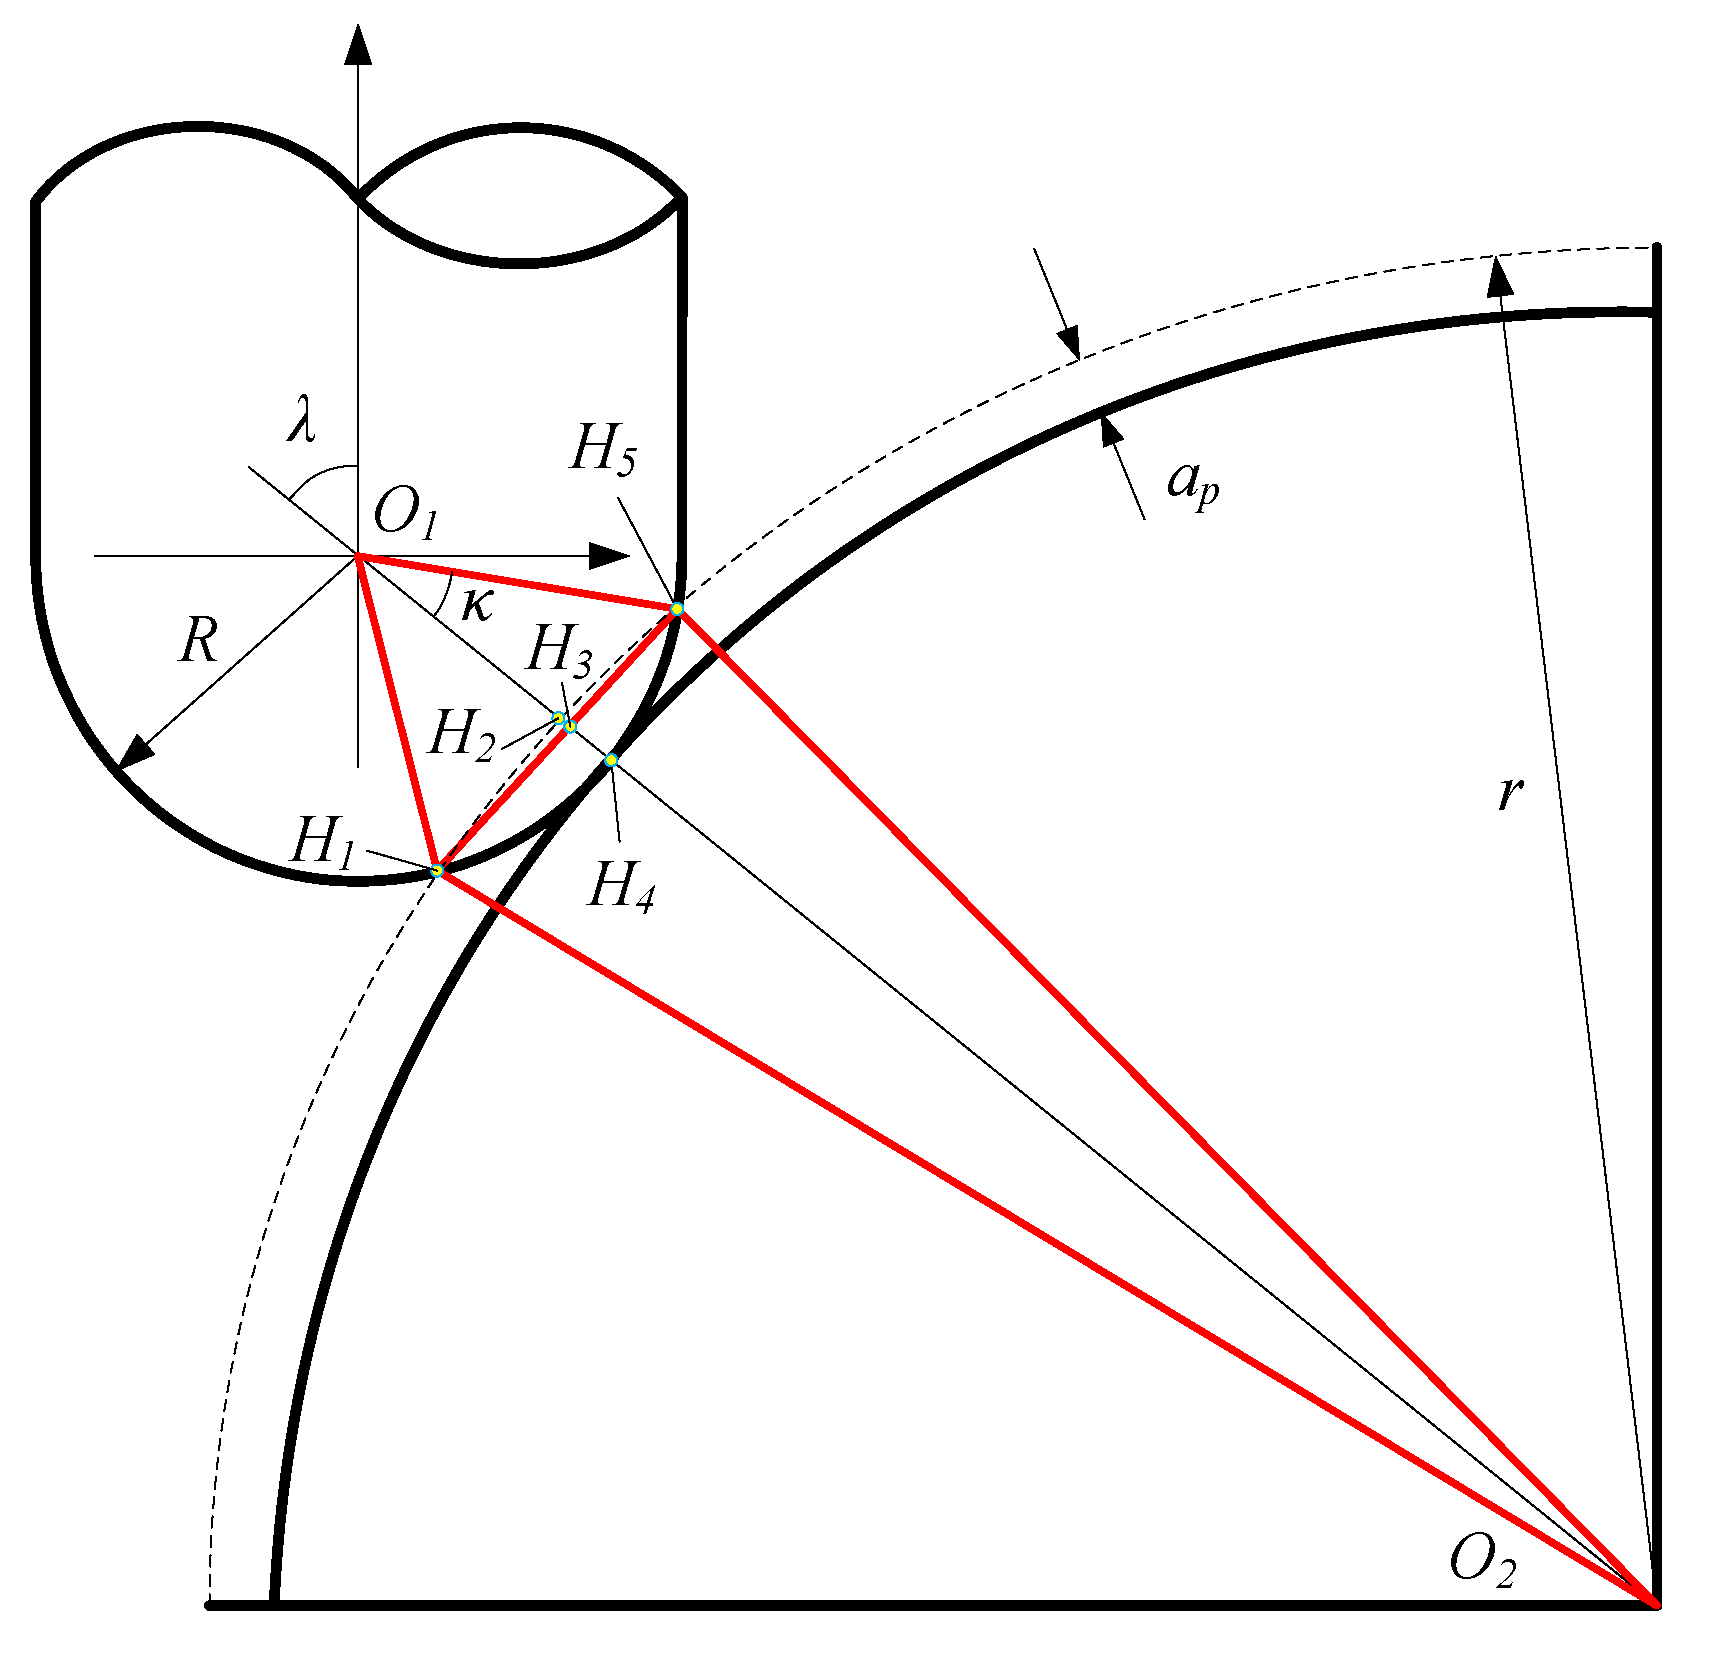
In the milling process, the contact area between the tool and the workpiece (CATW) changes momentarily owing to the curvature of the workpiece. Figure 5 shows the CATW during milling the convex curved surface, where ap is the depth of cut, λ is the inclination angle of the tool along the feed direction, R is the tool radius, r is the radius of curvature of the curved workpiece, H2 is the intersection of the straight line O1O2 and the workpiece surface, and H3 is the intersection of the straight line O1O2 and the straight line H1H5.
The relationship between the various parameters in Figure 5 is as follows:
( H 1 H 3 ) 2 = ( O 1 H 1 ) 2 ( O 1 H 3 ) 2 = ( O 2 H 1 ) 2 ( O 2 H 3 ) 2
O 2 H 1 = r
O 2 H 3 = r a p + H 3 H 4
O 1 H 1 = R
O 1 H 3 = R H 3 H 4
Equations (39) and (40) are obtained by building the simultaneous equations:
H 3 H 4 = a p 2 + 2 r a p 2 R 2 a p + 2 r
O 1 H 3 = R a p 2 + 2 r a p 2 R 2 a p + 2 r
κ can be calculated by O1H3:
κ = arccos O 1 H 3 R
Therefore, the range of the CATW can be expressed as follows:
{ φ min 1 = λ κ φ max 1 = λ + κ
Considering the cutting vibration and the deformation of the tool, the range of the CATW during the simulation should be slightly larger than the theoretical value, taking the coefficient a (a > 1), and the range of the CATW is expressed as follows:
{ φ min 2 = λ α κ φ max 2 = λ + α κ
The coefficient a in Equation (43) is determined based on the cutting conditions, but φmin2 ≥ 0, φmax2 ≤ 90° should be guaranteed. In order to ensure the accuracy of the simulation, the discrete length of the tool must be shorter than the discrete length of the workpiece. The discrete length of the tool is dw, and the number of discrete points in the range (φmin2, φmax2) is n:
n = ( φ max 2 φ min 2 ) × R d w

4.2. Discrete Surface of Workpiece based on the Z-Map Model

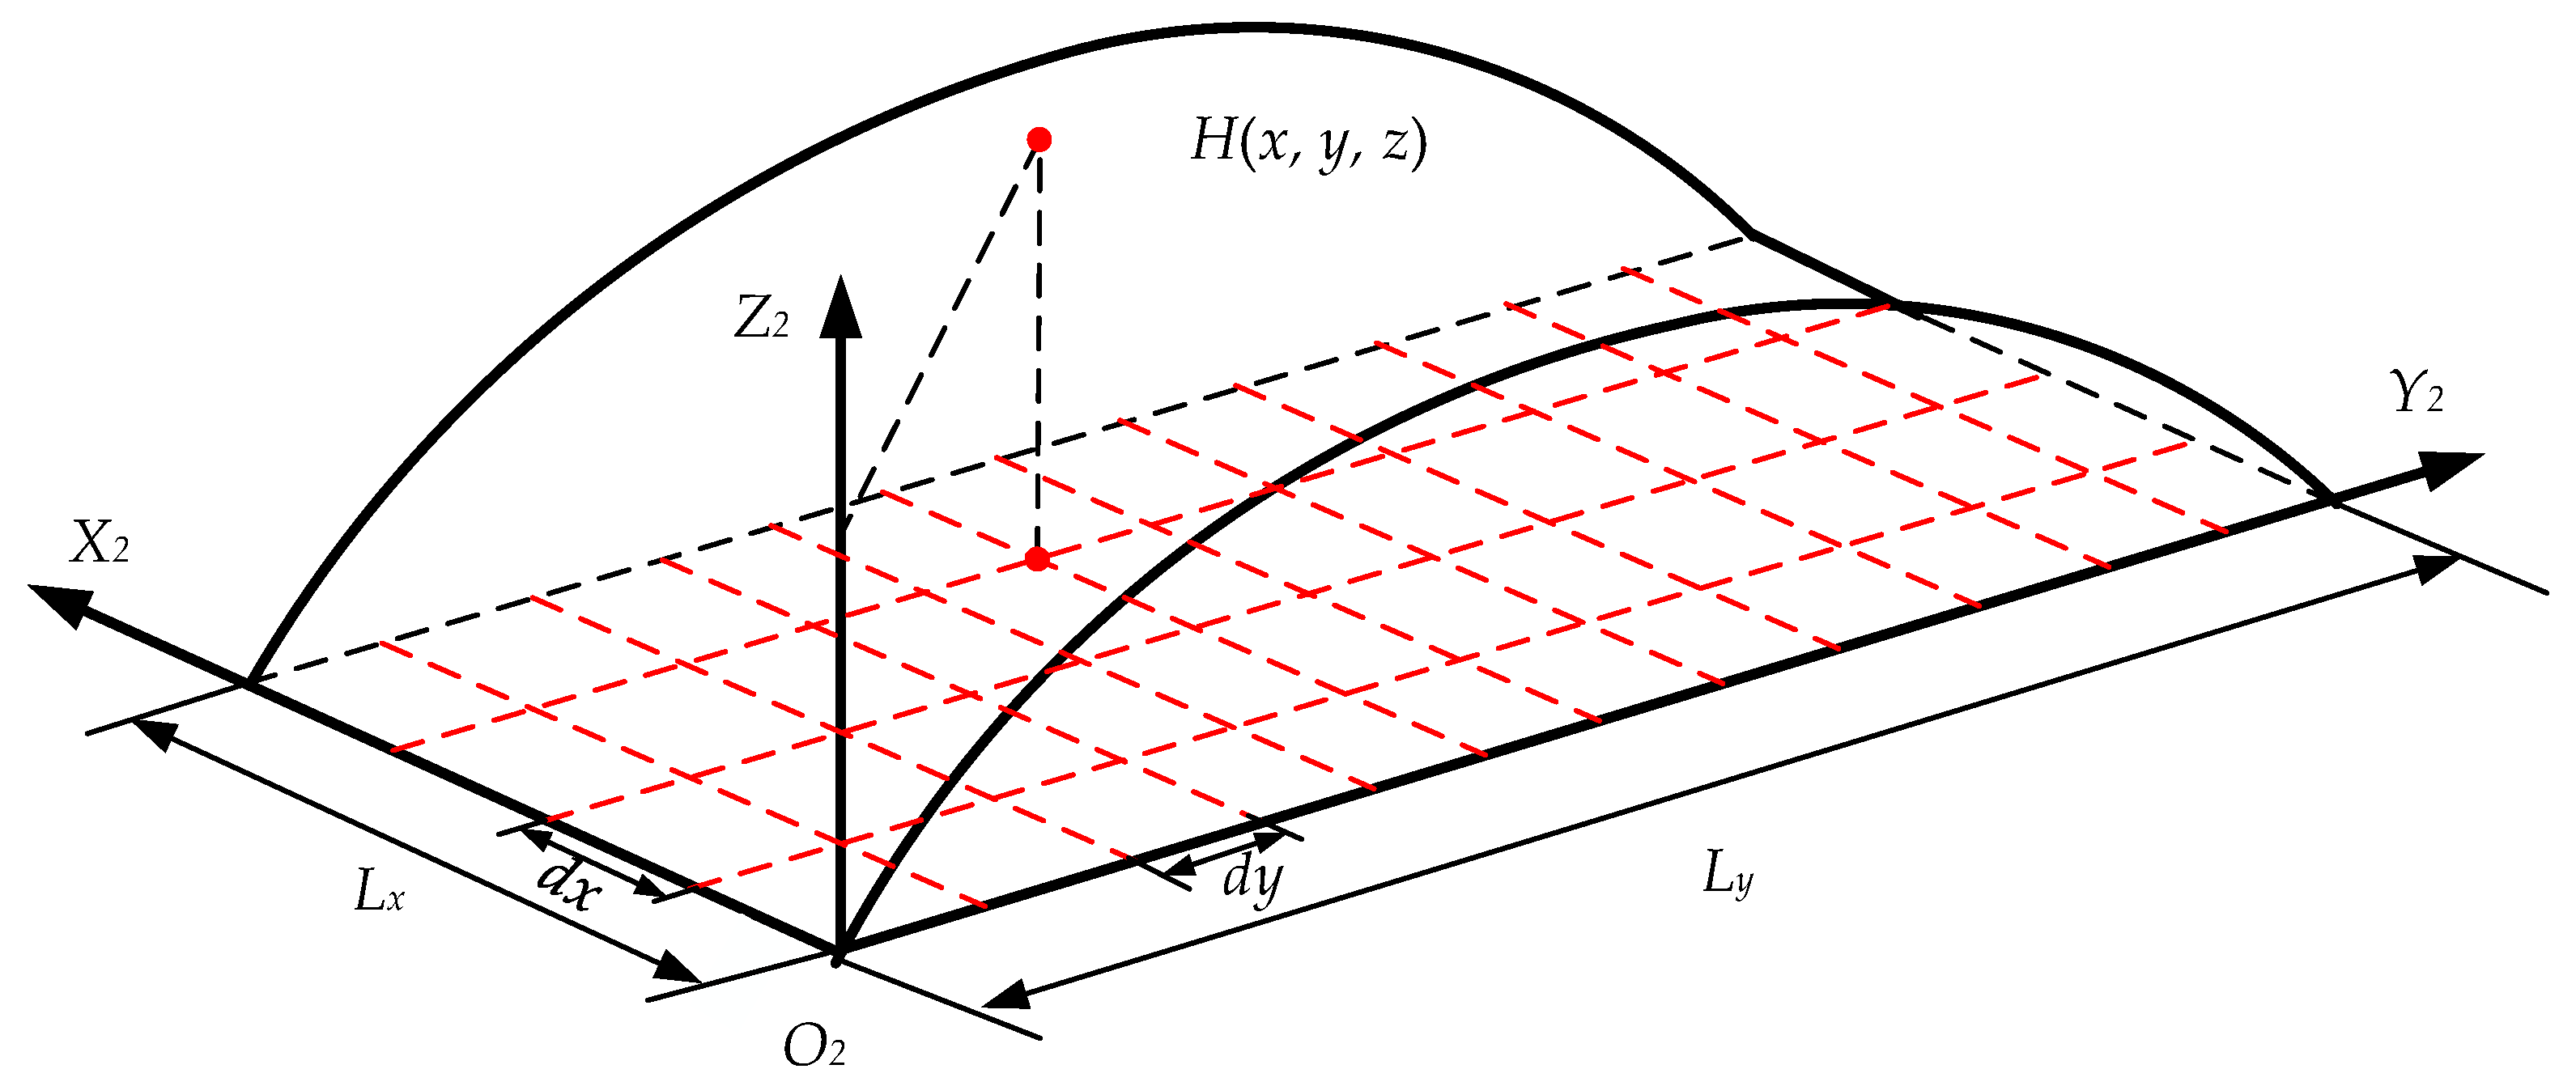
The model of workpiece in surface topography simulation is established by the Z-map model, a method based on discretization idea representation model. The workpiece is projected into the XOY plane, and the projected rectangular parallelepiped is dispersed into m × n grids. In other words, the model of workpiece is composed of m × n grids, and the height of the grid nodes is used to represent the surface characteristics of the workpiece.
As shown in Figure 6, the model of workpiece is divided into m and n infinitesimal elements along the X direction and the Y direction and the lengths of the discrete elements are dx and dy (Lx = m × dx and Ly = n × dy), respectively. The coordinate value of the node coordinates in the X direction is xi = (i − 1) dx, (i = 1, 2, 3,…, m + 1). The coordinate value of the node coordinates in the Y direction is yj = (j − 1) dy, (j = 1, 2, 3,…, n + 1). According to the surface equation z = u(x,y), the corresponding zi×j can be solved by xi and yj. Then, it is determined that the number of z has (m + 1) × (n + 1), and it is stored as a matrix of (m + 1) × (n + 1), and the surface topography of the workpiece is represented by the matrix.
In the process of surface topography simulation, while the tool and the workpiece are discrete, it is also necessary to discretize the time t of the milling process into a plurality of infinitesimal elements Δt. When discretizing time t, it must be ensured that the discrete points on each cutting edge move at each discrete moment less than the minimum discrete length of the workpiece. When discretizing time t, it must be ensured that the moved distance of the discrete points on each cutting edge is less than the minimum discrete length of the workpiece at each discrete moment. As Δt is very small, the trajectory of the discrete points on the cutting edge can be considered to be approximately straight in time Δt:
ω × 2 π × Δ t × R × sin φ max 2 < min ( d x , d y )
So, the range of Δt is as follows:
0 < Δ t < min ( d x , d y ) ω × 2 π × R × sin φ max 2

4.3. Surface Topography Simulation Algorithm for Milling with Ball-End Milling Cutter

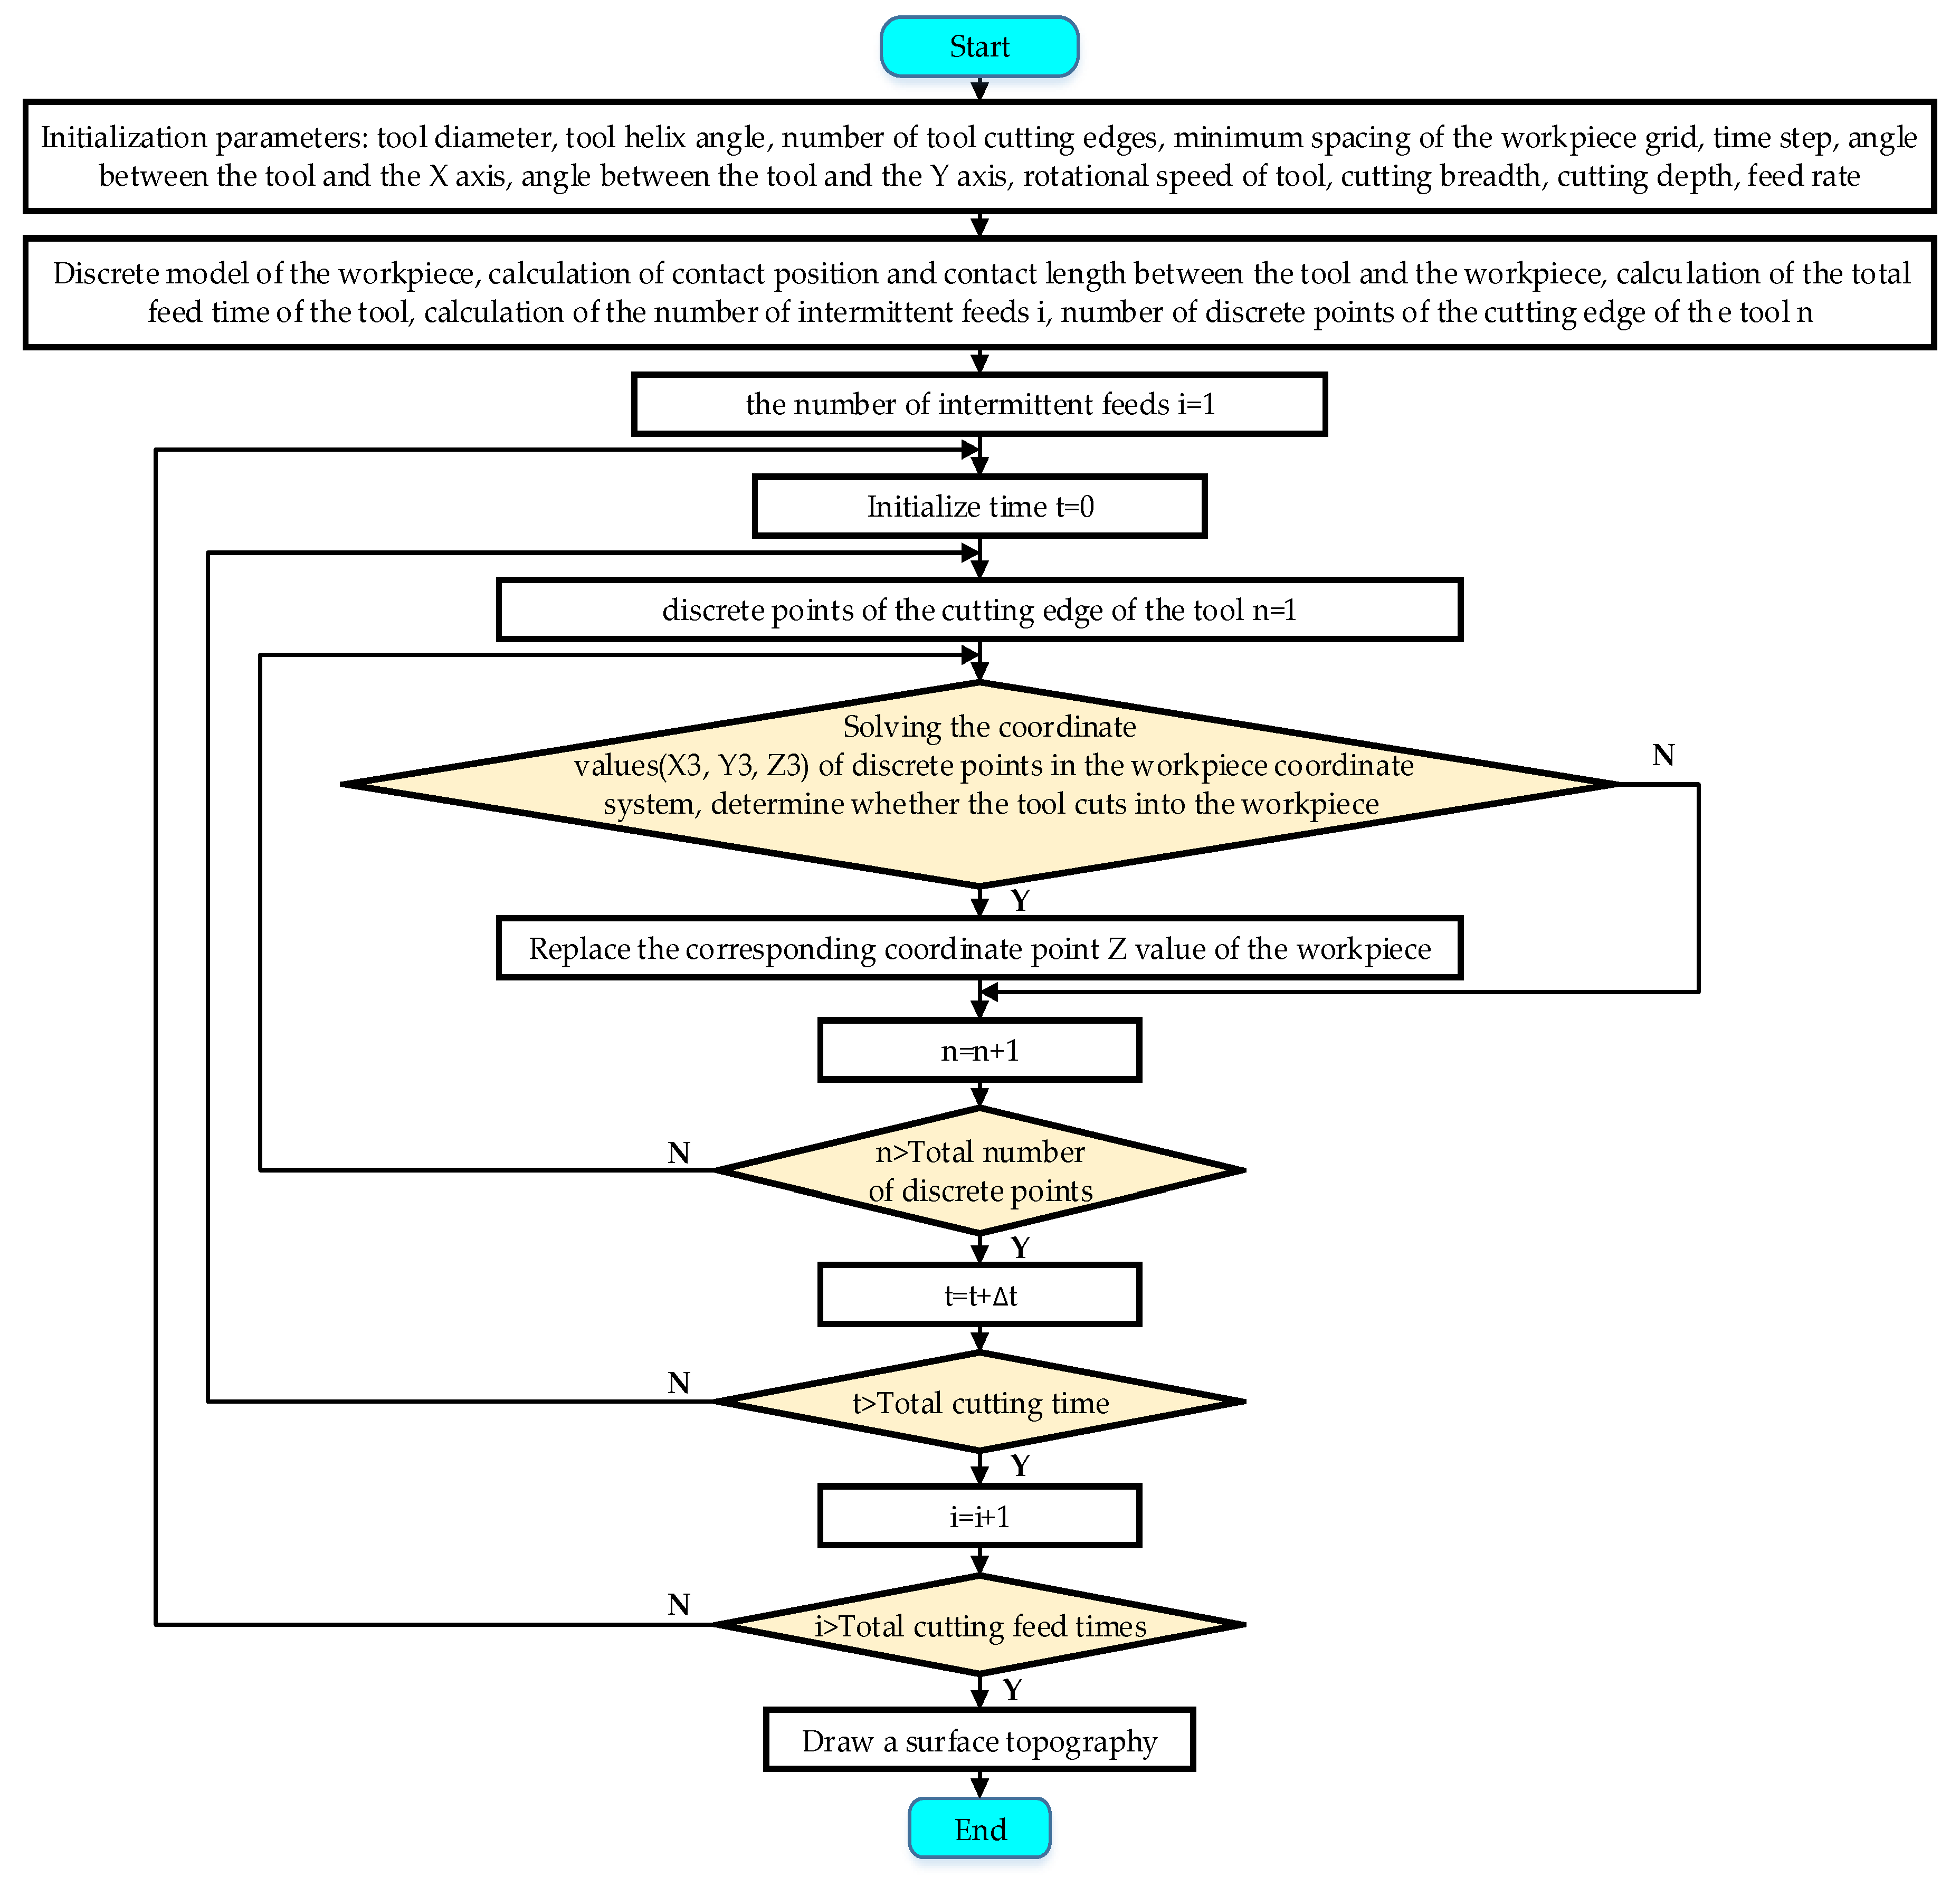
The surface topography is simulated by the discrete method to discretize the model of tool and workpiece into infinitesimal element, and then simulate the milling process, calculate the residual height of the machined surface, and store it in the matrix. Finally, the predicted surface topography image is drawn by software. The flow chart of surface topography simulation is shown in Figure 7.
To simulate the surface topography, it is necessary to establish models of the tool and the workpiece. The discrete points on the tool and the workpiece correspond to the three-dimensional coordinates. The process of simulating the surface topography is essentially the process of determining whether the tool is cutting into the workpiece. When the cutting edge is cutting into the workpiece, the height z of the discrete point on the cutting edge is compared with the height z of the workpiece’s point that is closest to it. If the height z of the discrete point of the cutting edge is smaller than the height z of the discrete point of the workpiece, the height z of the discrete point of the workpiece is replaced by the height z of the discrete point of the cutting edge. On the contrary, the height z of the discrete point of the workpiece does not change. The substitution process is shown in Figure 8. When the coordinate values of the discrete points on the entire processing zone are replaced, the obtained height zij is the residual height of the machined surface.
Figure 9a shows the residual height z of the machined surface after the simulation is completed. Figure 9b shows a three-dimensional image with the residual height z fitted.
As the workpiece is a convex curved surface, the analysis of the surface topography is affected, and the residual height of machined surface cannot be clearly compared. Therefore, after the simulation is completed, the obtained surface topography needs to be expanded to a plane along the curvature of the workpiece. Figure 10a shows the residual height z of the machined surface after removing curvature. Figure 10b shows a three-dimensional image with the residual height z after removing curvature.

5. Simulation and Experimental Verification

5.1. Experimental Conditions and Simulation Parameters

The machine tool used in this experiment is the VDL-1000E triaxial machining center produced by Dalian TongDa. The SH300-H monolithic carbide ball-end milling cutter produced by Xiamen Golden Egret is used for the cutting tool. The geometric parameters of the tool are shown in Table 1. The convex curved workpiece is made of Cr12MoV hardened steel with a hardness of 50HRC. The main components of the material are shown in Table 2. No coolant was used in the experiment.
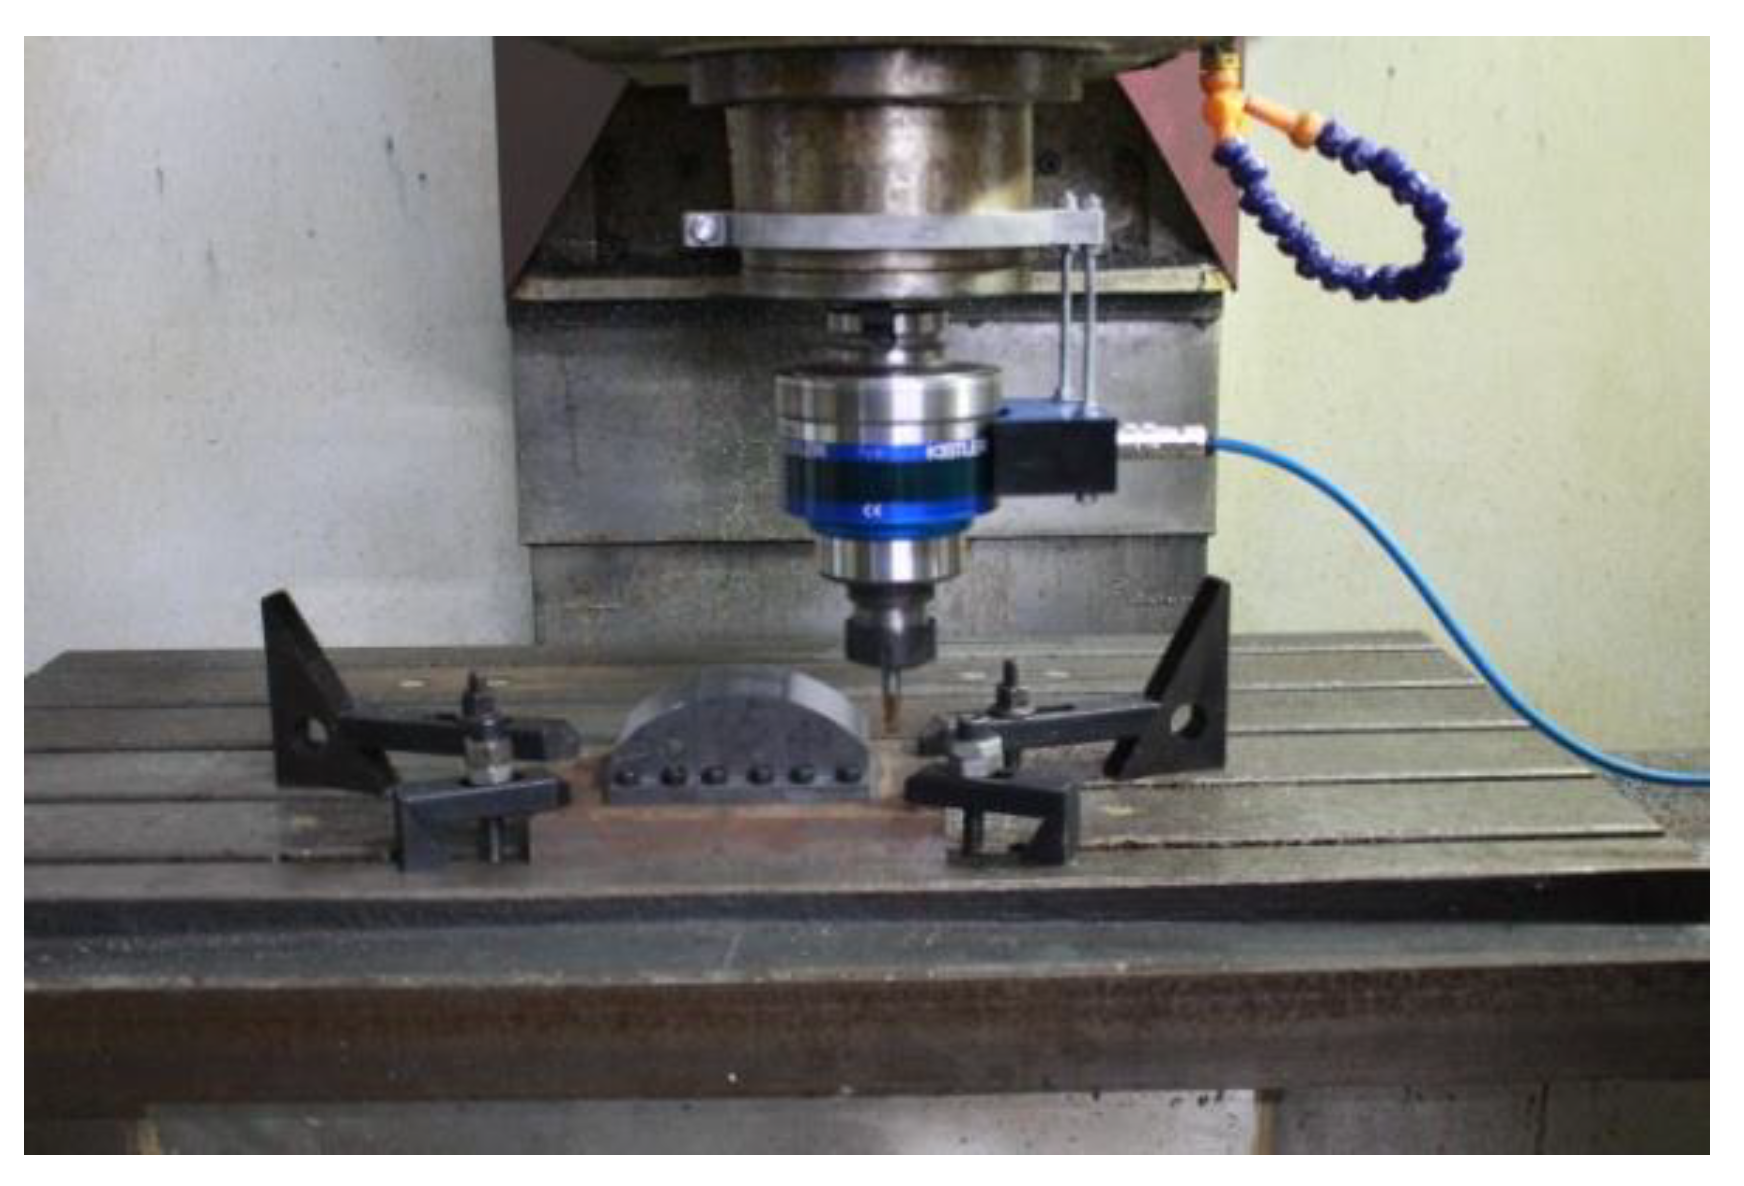
The milling force coefficients are based on the experiment of milling groove. The milling force coefficients are obtained by calculating the average value of the milling forces at different feed rates and combining the formula of calculating milling force coefficients. The milling forces are measured with a Kistler 5236B rotary dynamometer (Kistler Group, Winterthur, Switzerland), as shown in Figure 11. Substituting into the formula for calculating the milling force coefficients [24], the obtained milling force coefficients are shown in Table 3.
The mode parameters of the milling system in this model can be obtained from the mode experiment with the hammering method. The mode obtained by the experiment is multi-order, but the high-order mode has less effect on the milling system, so only the first-order mode and the second-order mode of the system are taken, as shown in Table 4.
The device for measuring the surface topography in this experiment is a Taylor Map CCI white light interferometer. The single point acquisition range of the device is 0.86 mm × 0.86 mm and the pixel is 1024 × 1024.

5.2. Simulation of Surface Topography at Different Positions of Curved Surfaces

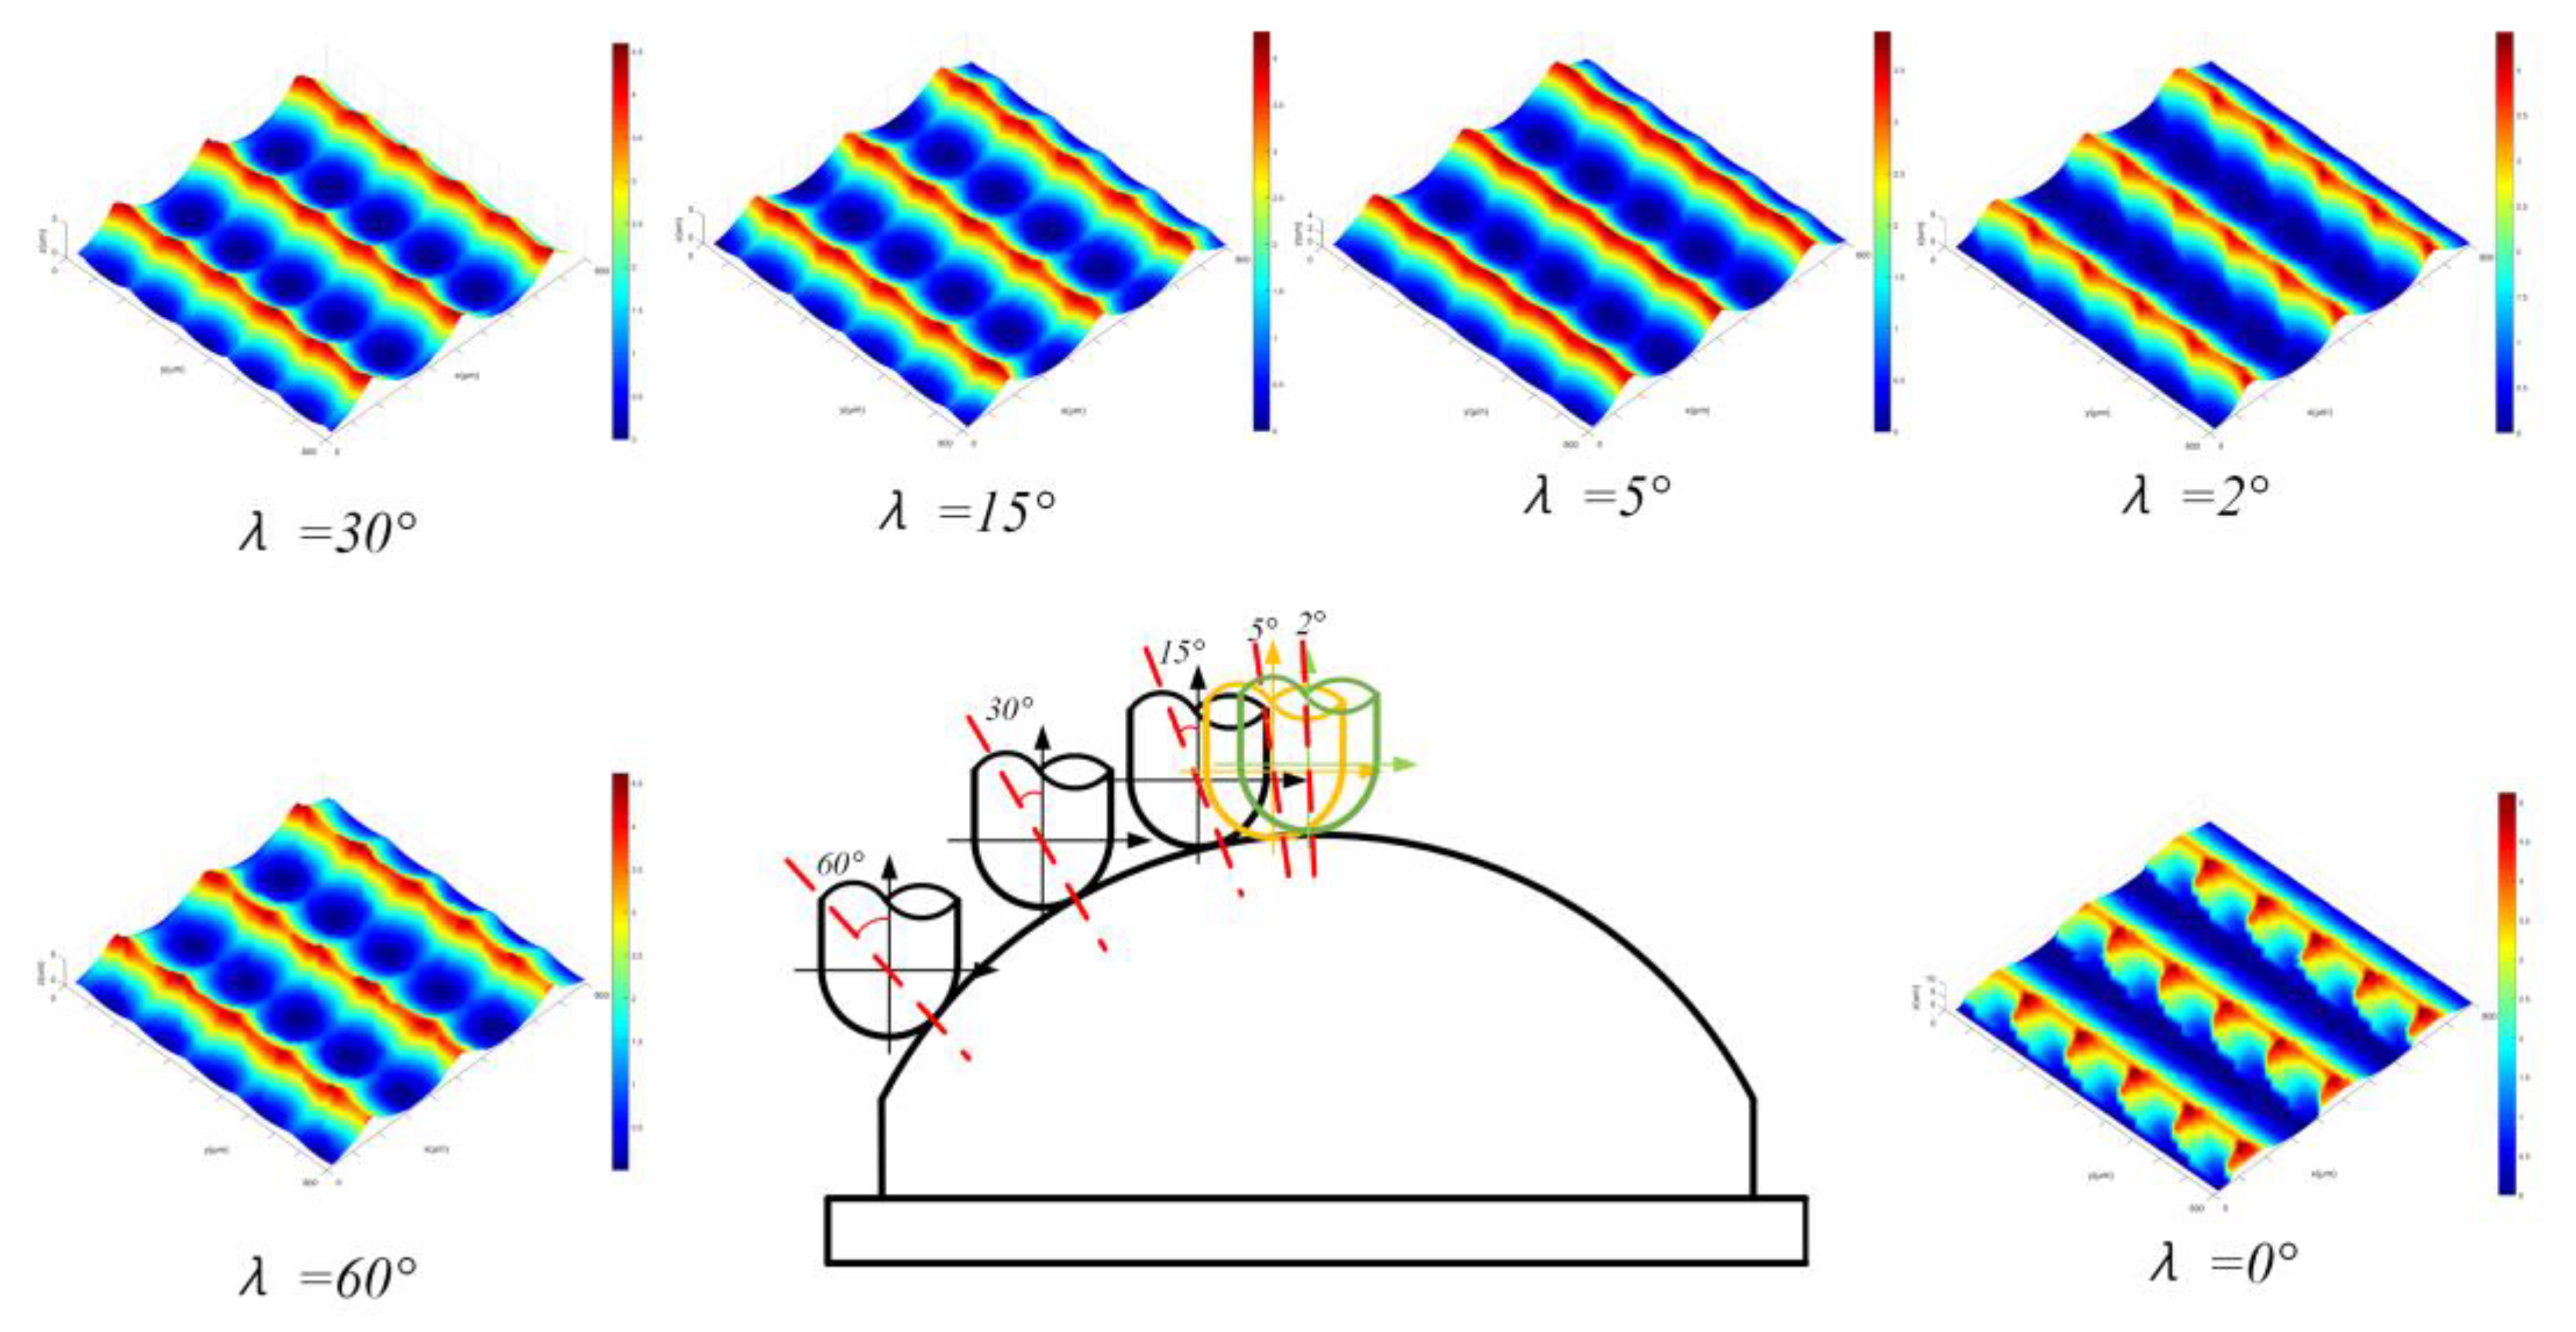
When machining a convex curved die steel, the CATW changes continuously as the position of the tool changes. The CATW has a great effect on the surface topography. Under the conditions that ns is 4000 rad/min, ae is 0.3 mm, ap is 0.3 mm, and fz is 0.1 mm/z, the simulation results of the surface topography at different positions of the convex curved die steel are shown in Figure 12.
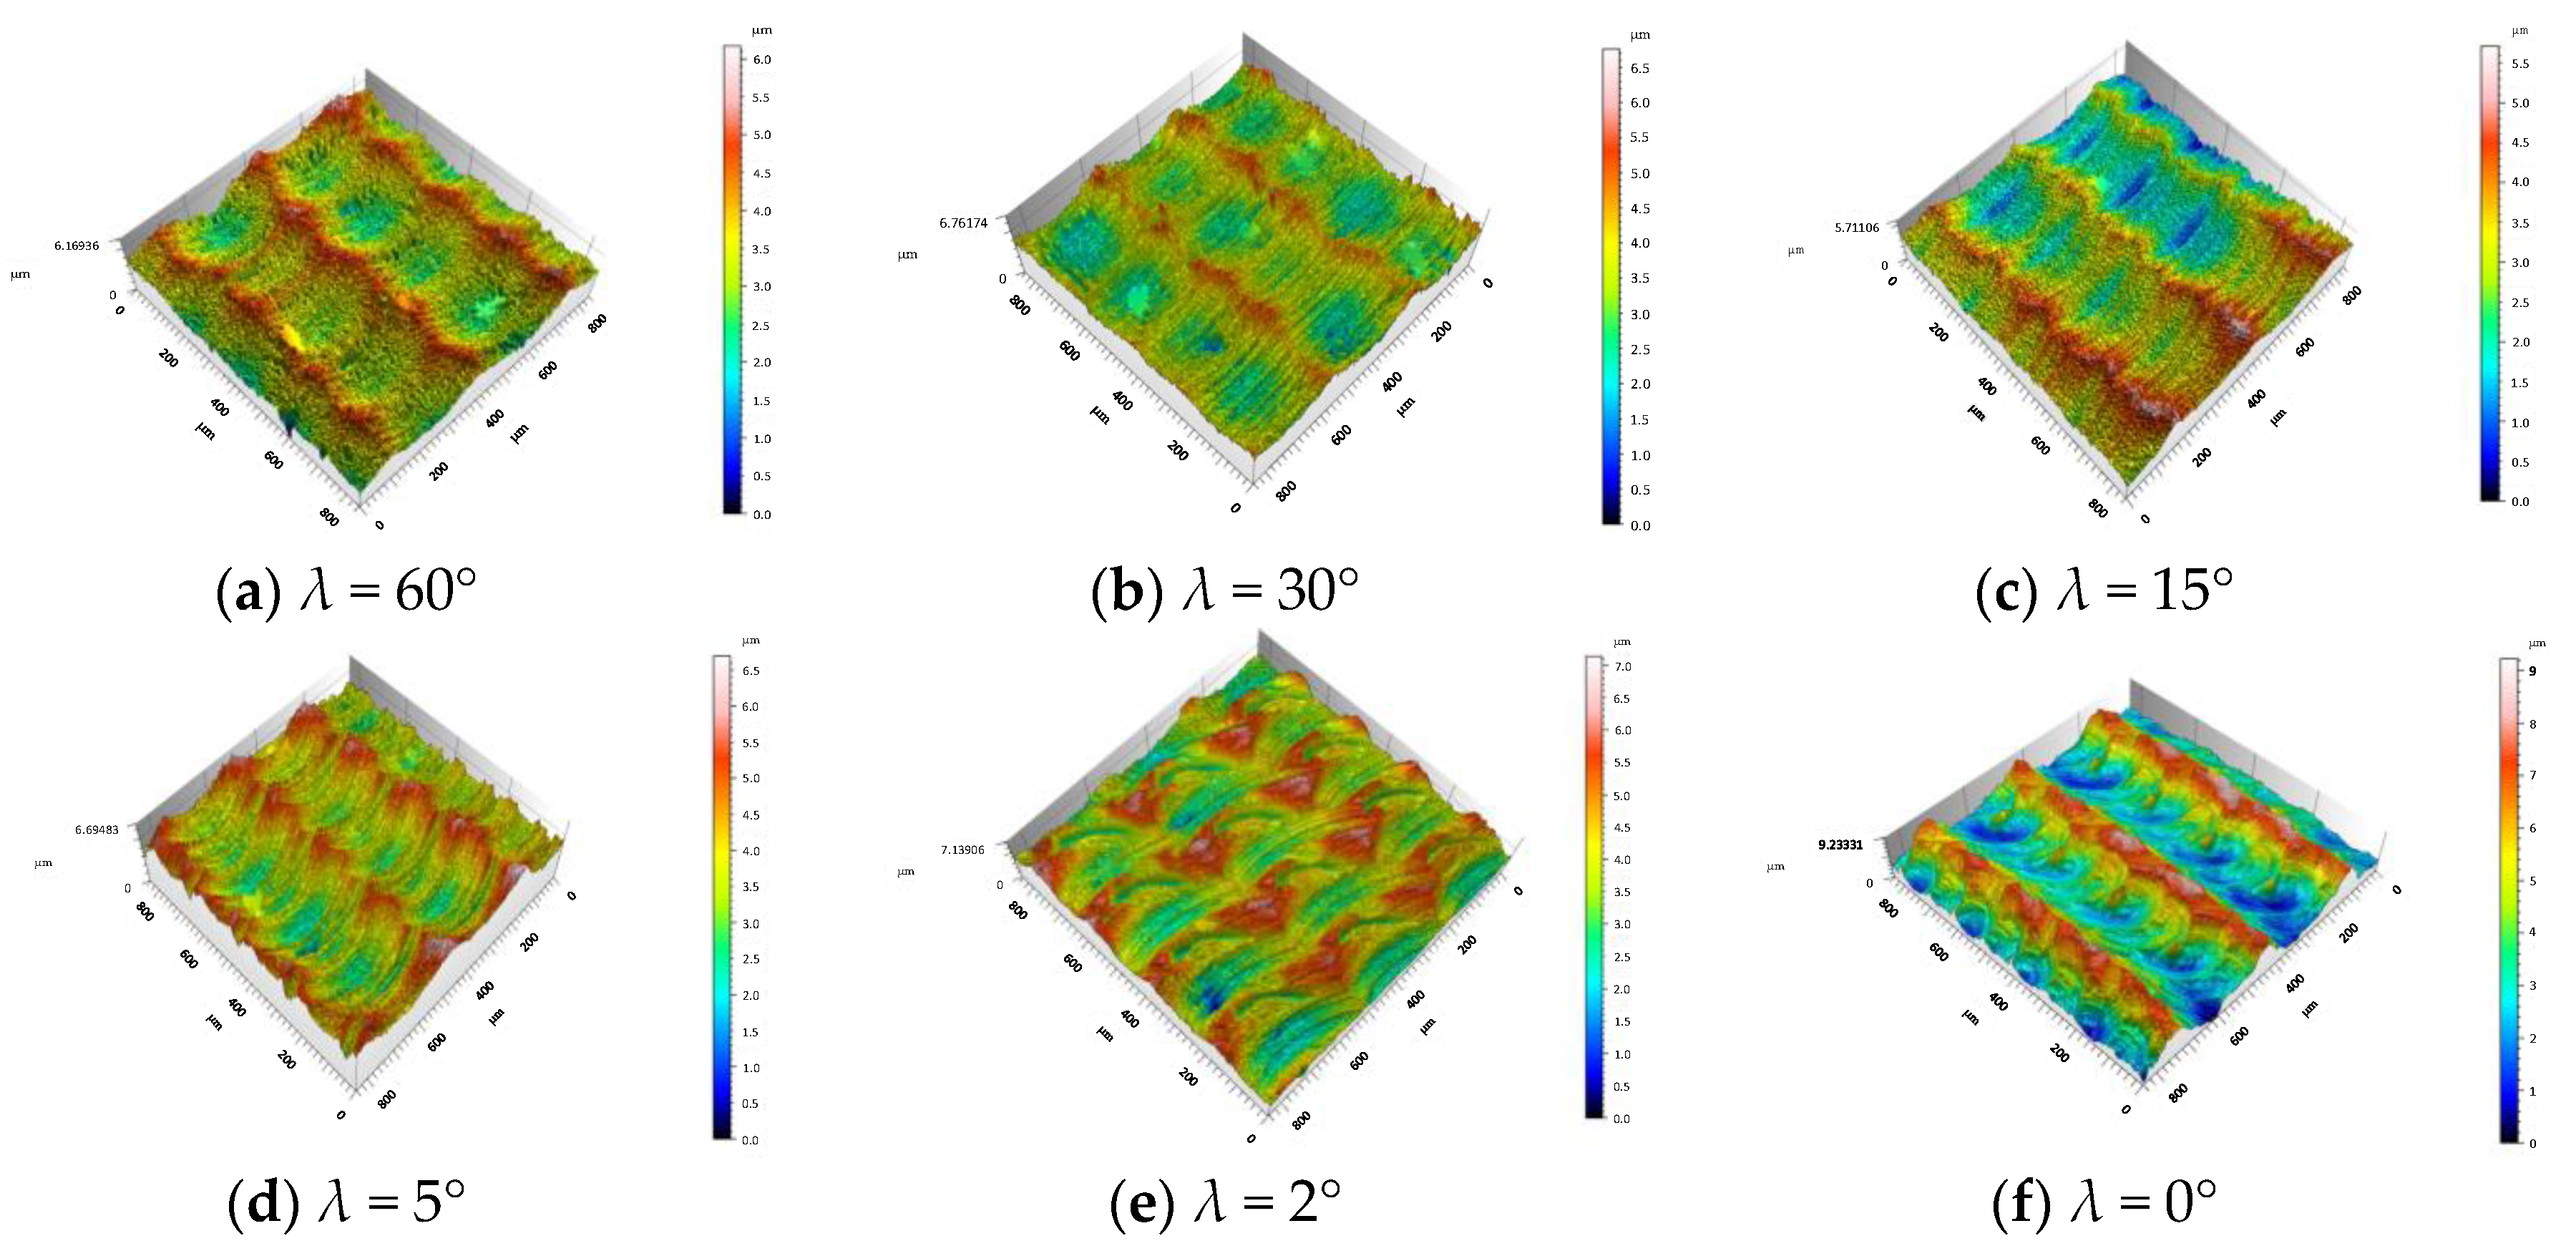
The experimental surface topography under the same milling parameters is shown in Figure 13. It can be seen from Figure 12 and Figure 13 that the effect of λ on the surface topography is not obvious when λ is larger than 15°. When λ is between 0° and 15°, the change of surface texture is remarkable. As λ decreases, the scallop shape in the texture begins to change from a rectangle to a parallelogram, eventually forming the surface texture shown in Figure 13f. The guess is that the change of λ only changes the position where the cutting edge contacts the workpiece when λ is larger than 15° (the size and shape of the CATW do not change significantly), so the surface topography does not change significantly. When λ is 0°, the cutting edge is at the position where the depth of cut is the largest, and it is directly traversed through the surface in the feeding direction, resulting in the lowest residual height of the surface on which the cutting edge is swept in the feeding direction. However, the surface of the workpiece perpendicular to the feed direction is abnormally raised, resulting in a large residual height difference from other positions.
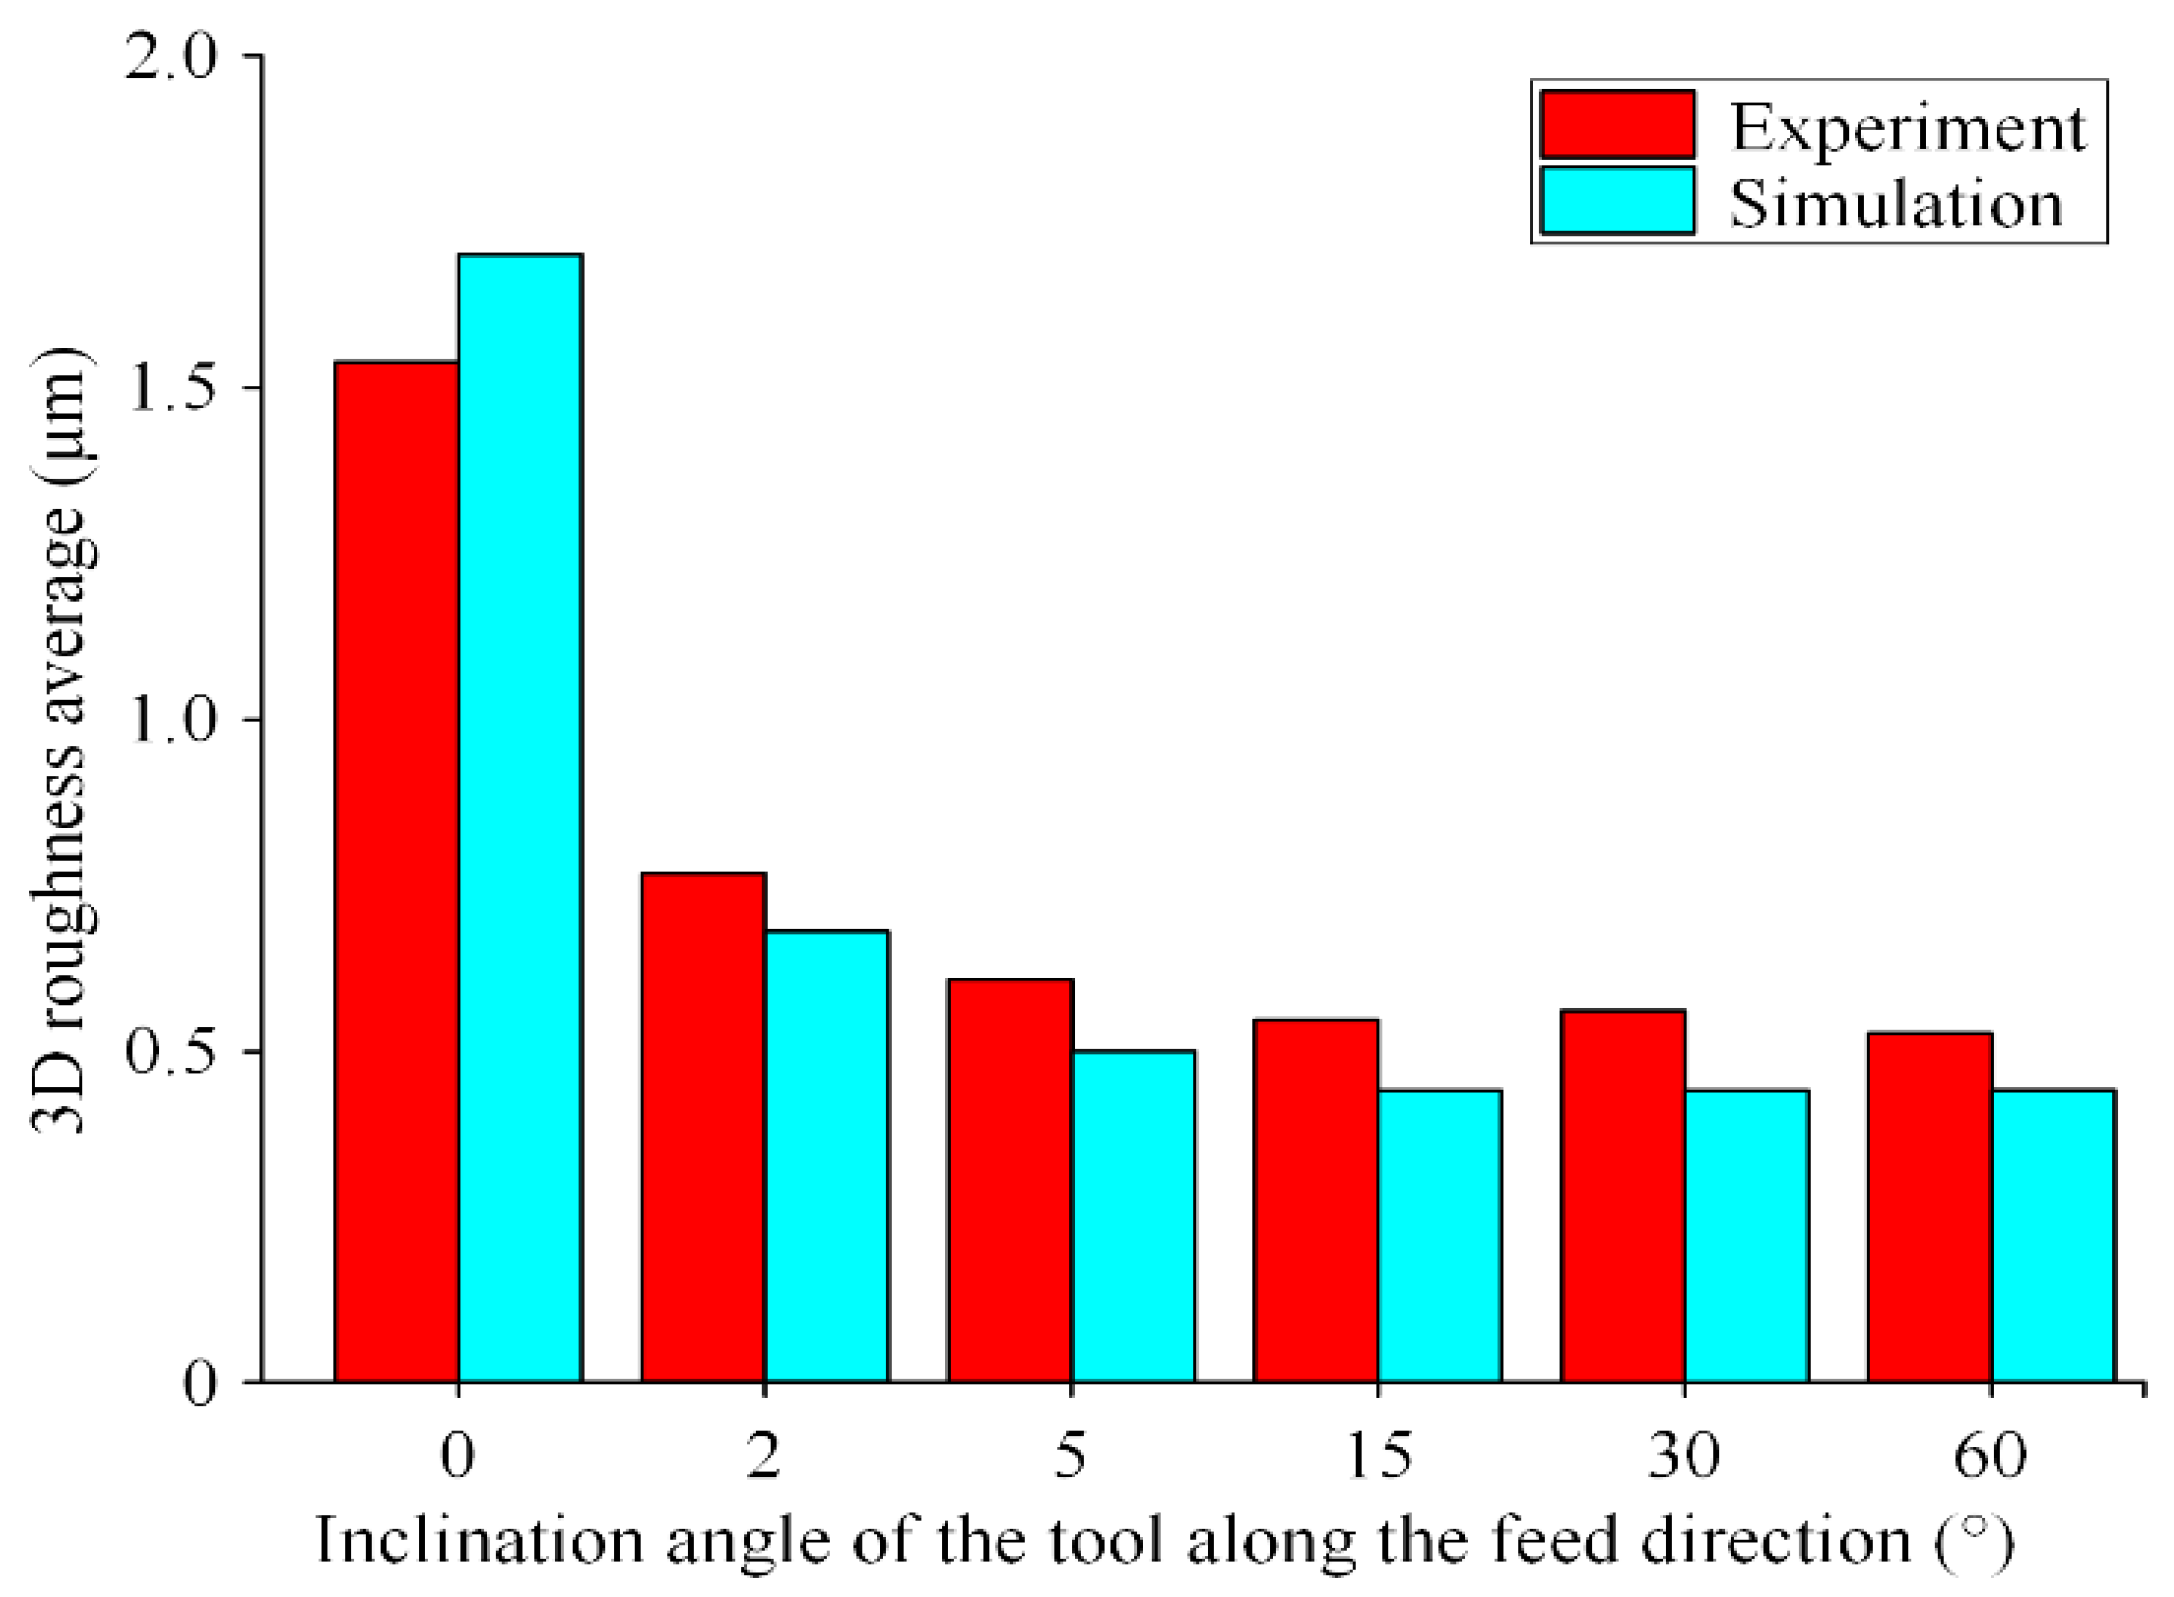
Figure 14 shows the comparison of the three-dimensional surface roughness Sa between the experimental values and the simulated values at different positions of the curved surface. The simulation error is between 10% and 16%. When λ is 0°, the simulated value of surface roughness is larger than the experimental value. In the other positions, the simulation value is less than the experimental value. The reason for this phenomenon is that, during the milling process, when λ is 0°, the tool axis is perpendicular to the surface of the workpiece and the speed of the tool nose is zero, which directly traverses the surface of the workpiece and causes the surface material to be squeezed. Therefore, the experimental value of surface roughness is lower than the theoretical value under ideal conditions. In other locations, the experimental values of the surface roughness are larger than the simulated values owing to the cutting vibration and the friction between the tool and the workpiece.

5.3. Simulation Results of Surface Topography under the Effects of Cutting Dynamic Factors

The surface topography is the result of many factors, among which the cutting vibration and tool deformation have the most significant effect on the surface topography. Figure 15 shows that, under ideal conditions (no cutting vibration and tool deformation), the tool path is consistent with the ideal machined surface, forming a uniform and periodic surface topography along the feed direction. When considering cutting vibration and tool deformation, the workpiece generates transient displacement in the Z direction and the tool generates transient displacement in the Y direction, which eventually causes the tooth of the ball-end milling cutter to irregularly vibrate during milling, and the tool path will no longer be consistent with the ideal machined surface, causing “overcut” or “undercut” and increasing the residual height of the machined surface. Under cutting vibration conditions, there will be a single-edge cutting phenomenon; in other words, the first milling cycle performs effective cutting, but the second cycle does not cut the workpiece owing to “undercut”, resulting in the surface topography being formed by the third milling cycle and the first milling cycle. Therefore, cutting vibration has a great effect on the surface topography.
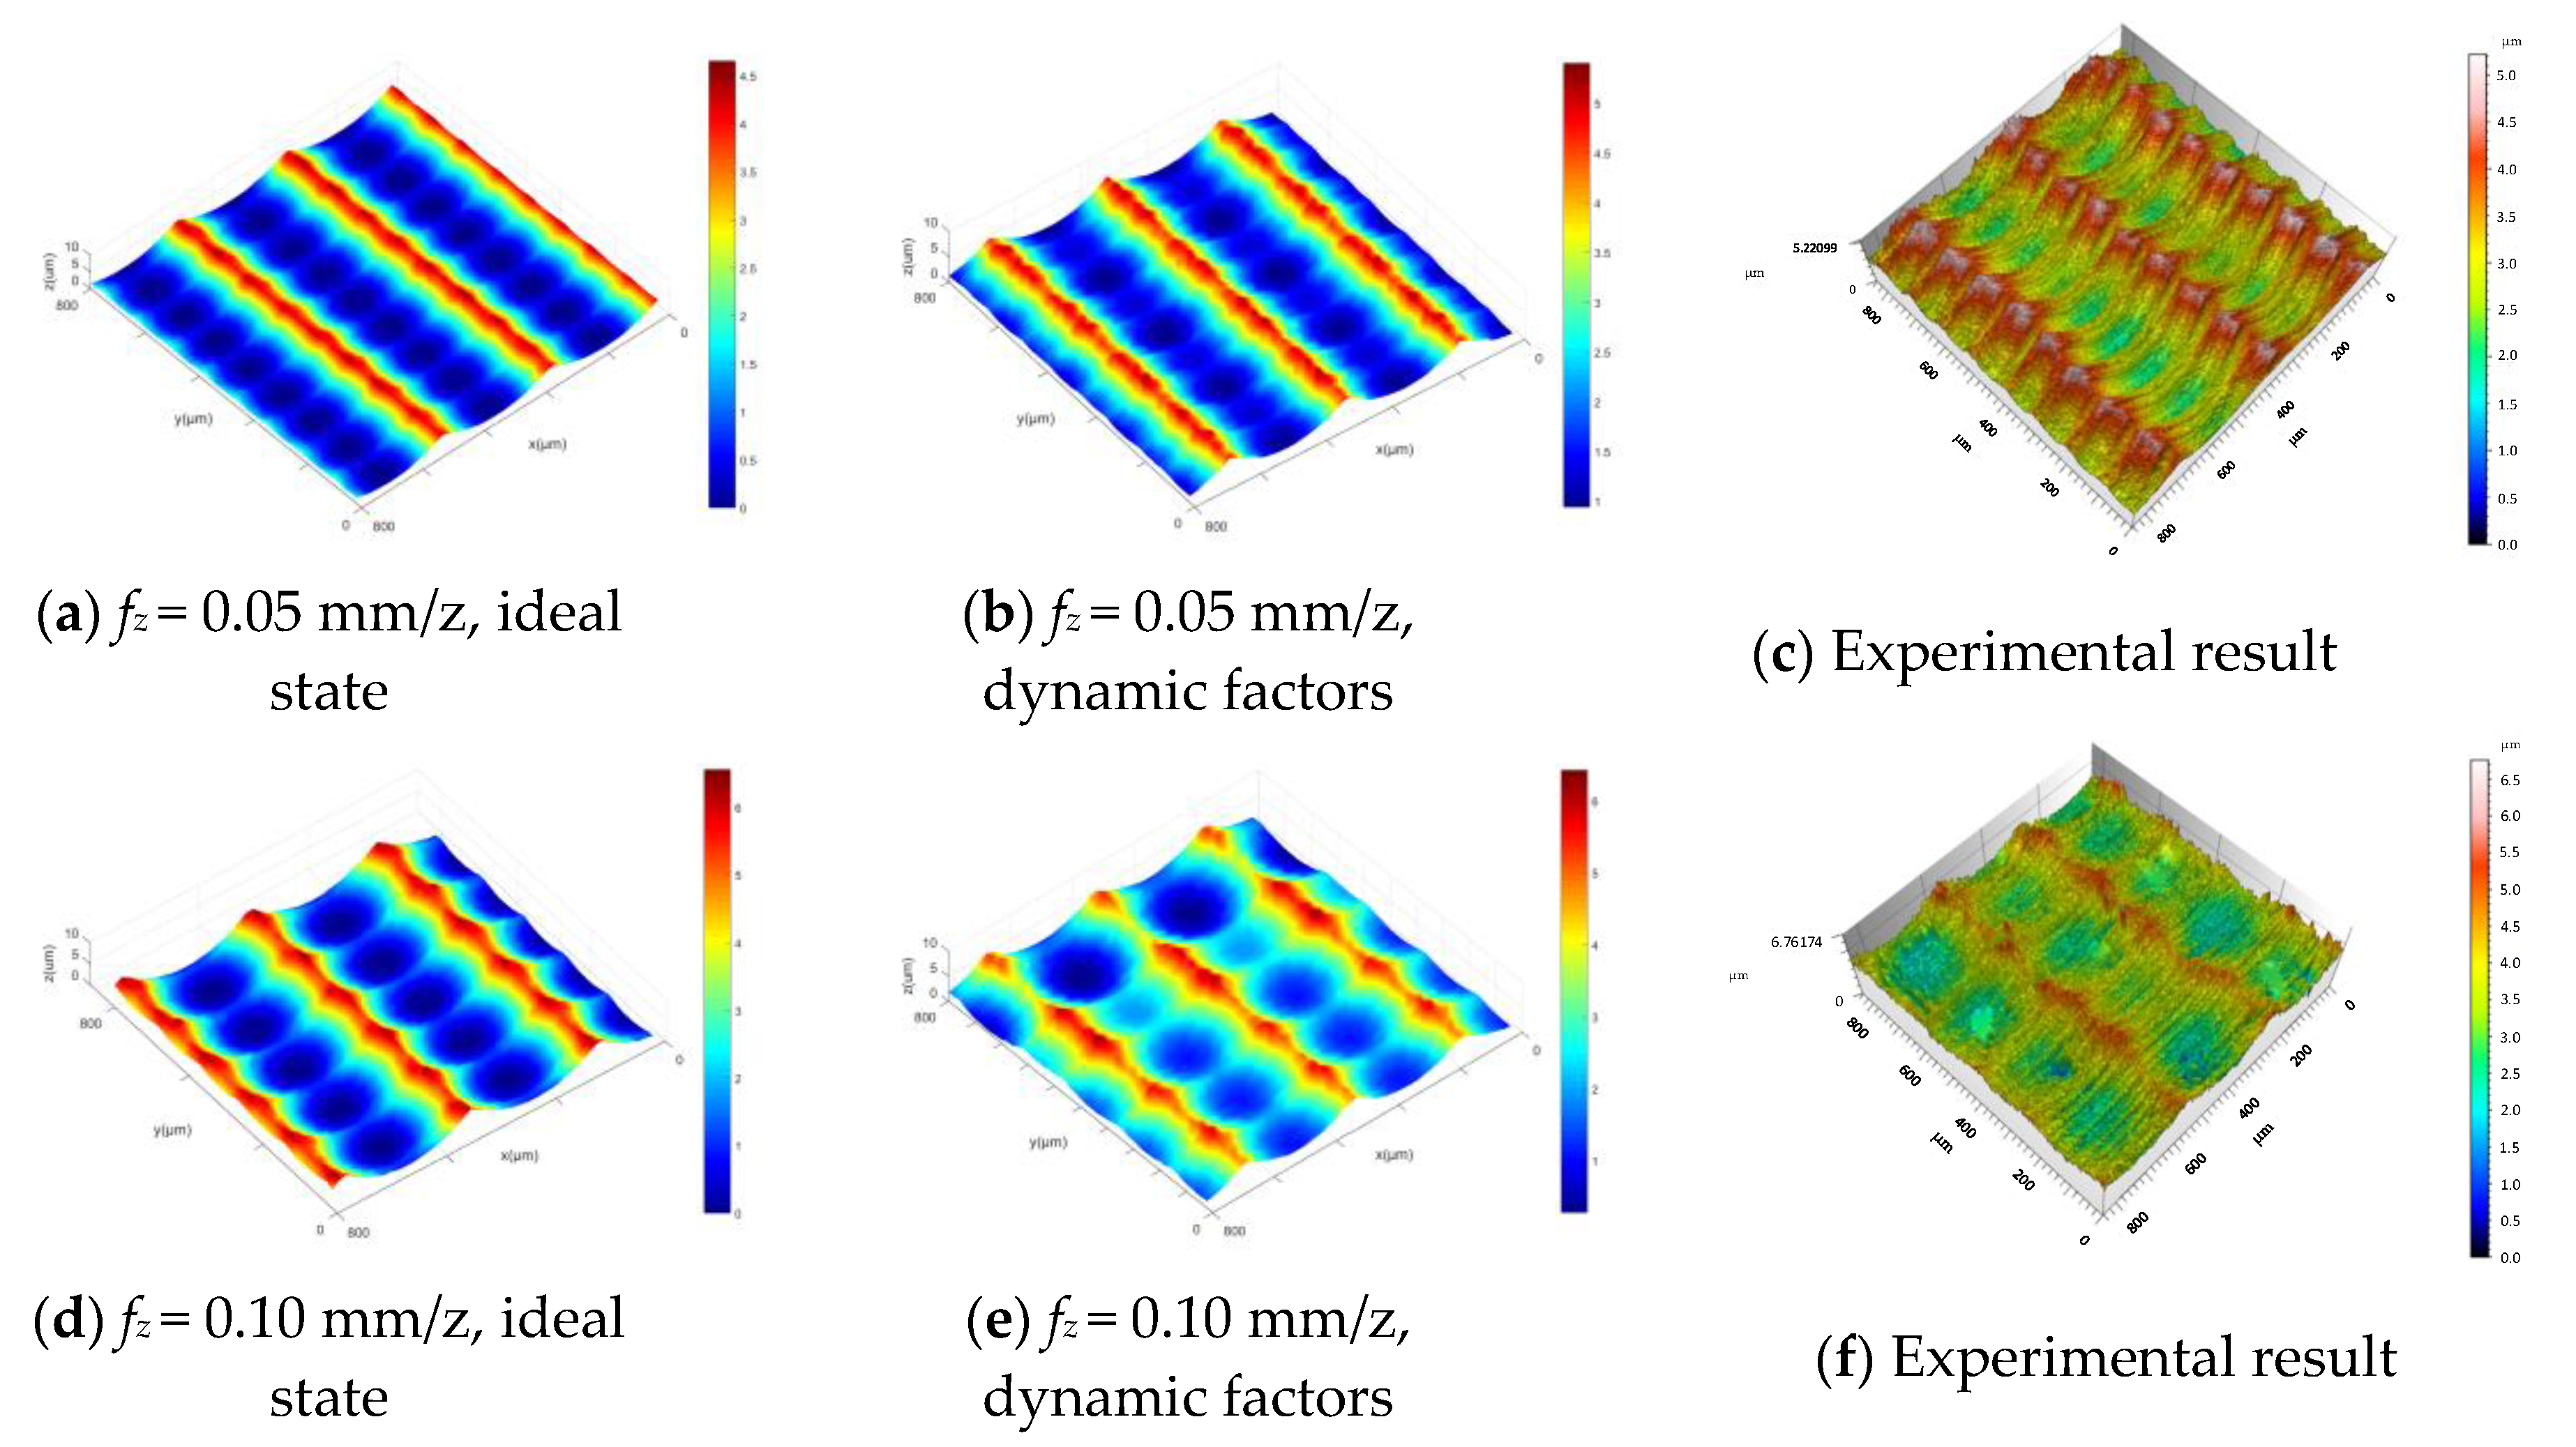
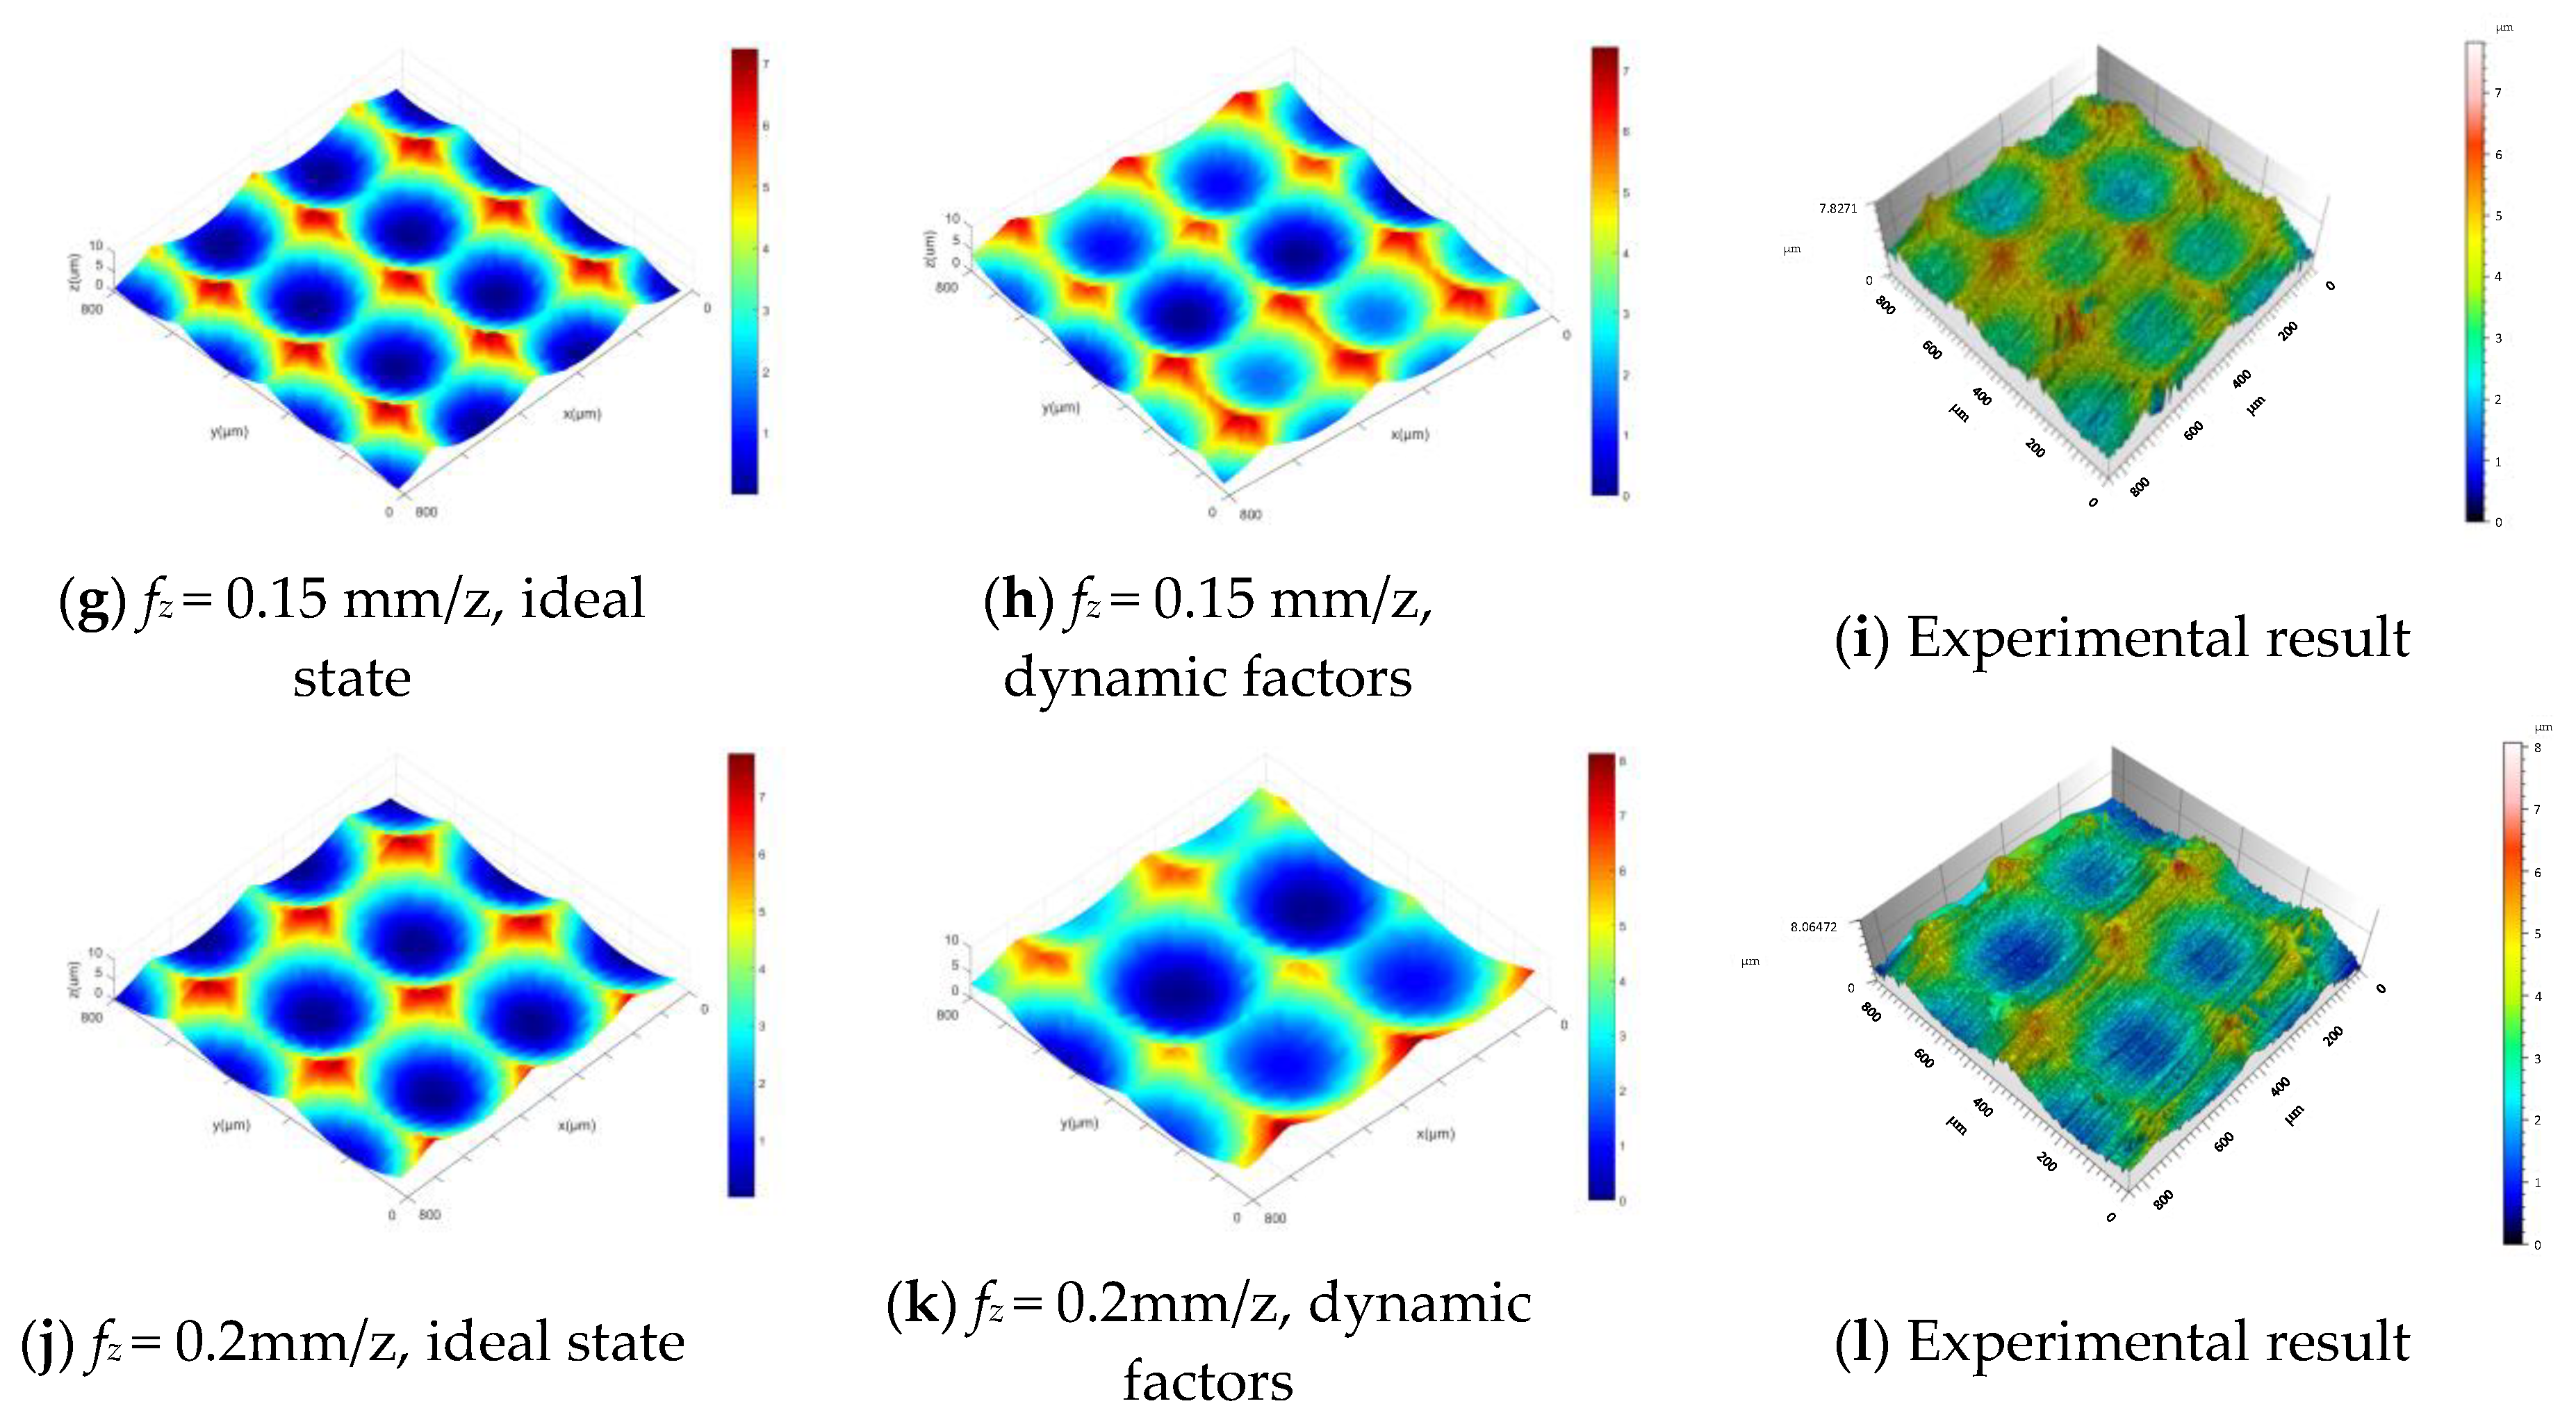
According to the established dynamic equation, the correction matrix of the effects of cutting vibration and tool deformation on the surface topography during milling is established. The correction matrix is used to modify the surface topography model of the convex curved die steel to further improve the accuracy of the simulation results. Because the workpiece is a curved workpiece, the dynamic characteristics of the milling system at different positions of the workpiece are different. This paper only selects the simulation results of the position where the λ is 30°. Under the conditions that the cutting speed ns is 4000 r/min, ap is 0.3 mm, ae is 0.3 mm, and the phase angle difference between adjacent cutter paths is 0°, the surface topography of different fz is simulated, and the simulation results are shown in Figure 16.
Figure 16a,d,g,j show the surface topography simulation results without considering the dynamic factors under different feed rates. As the fz increases, the frequency of the residual height in the feed direction gradually decreases, and the surface texture is periodically distributed. Figure 16b,e,h,k show simulation results of surface topography considering dynamic factors, and Figure 16c,f,i,l are experimental results of surface topography. Because of the effects of system cutting vibration and tool deformation on the surface topography, the machined surface exhibits an irregular residual height and texture shape. The larger the fz, the more irregular the distribution of the surface topography in the feed direction.
As can be seen from Figure 16, under the conditions of cutting vibration and tool deformation, the surface texture of the feed direction tends to merge, and the peak and valley of the surface residual height are increased, thus the surface quality is deteriorated.
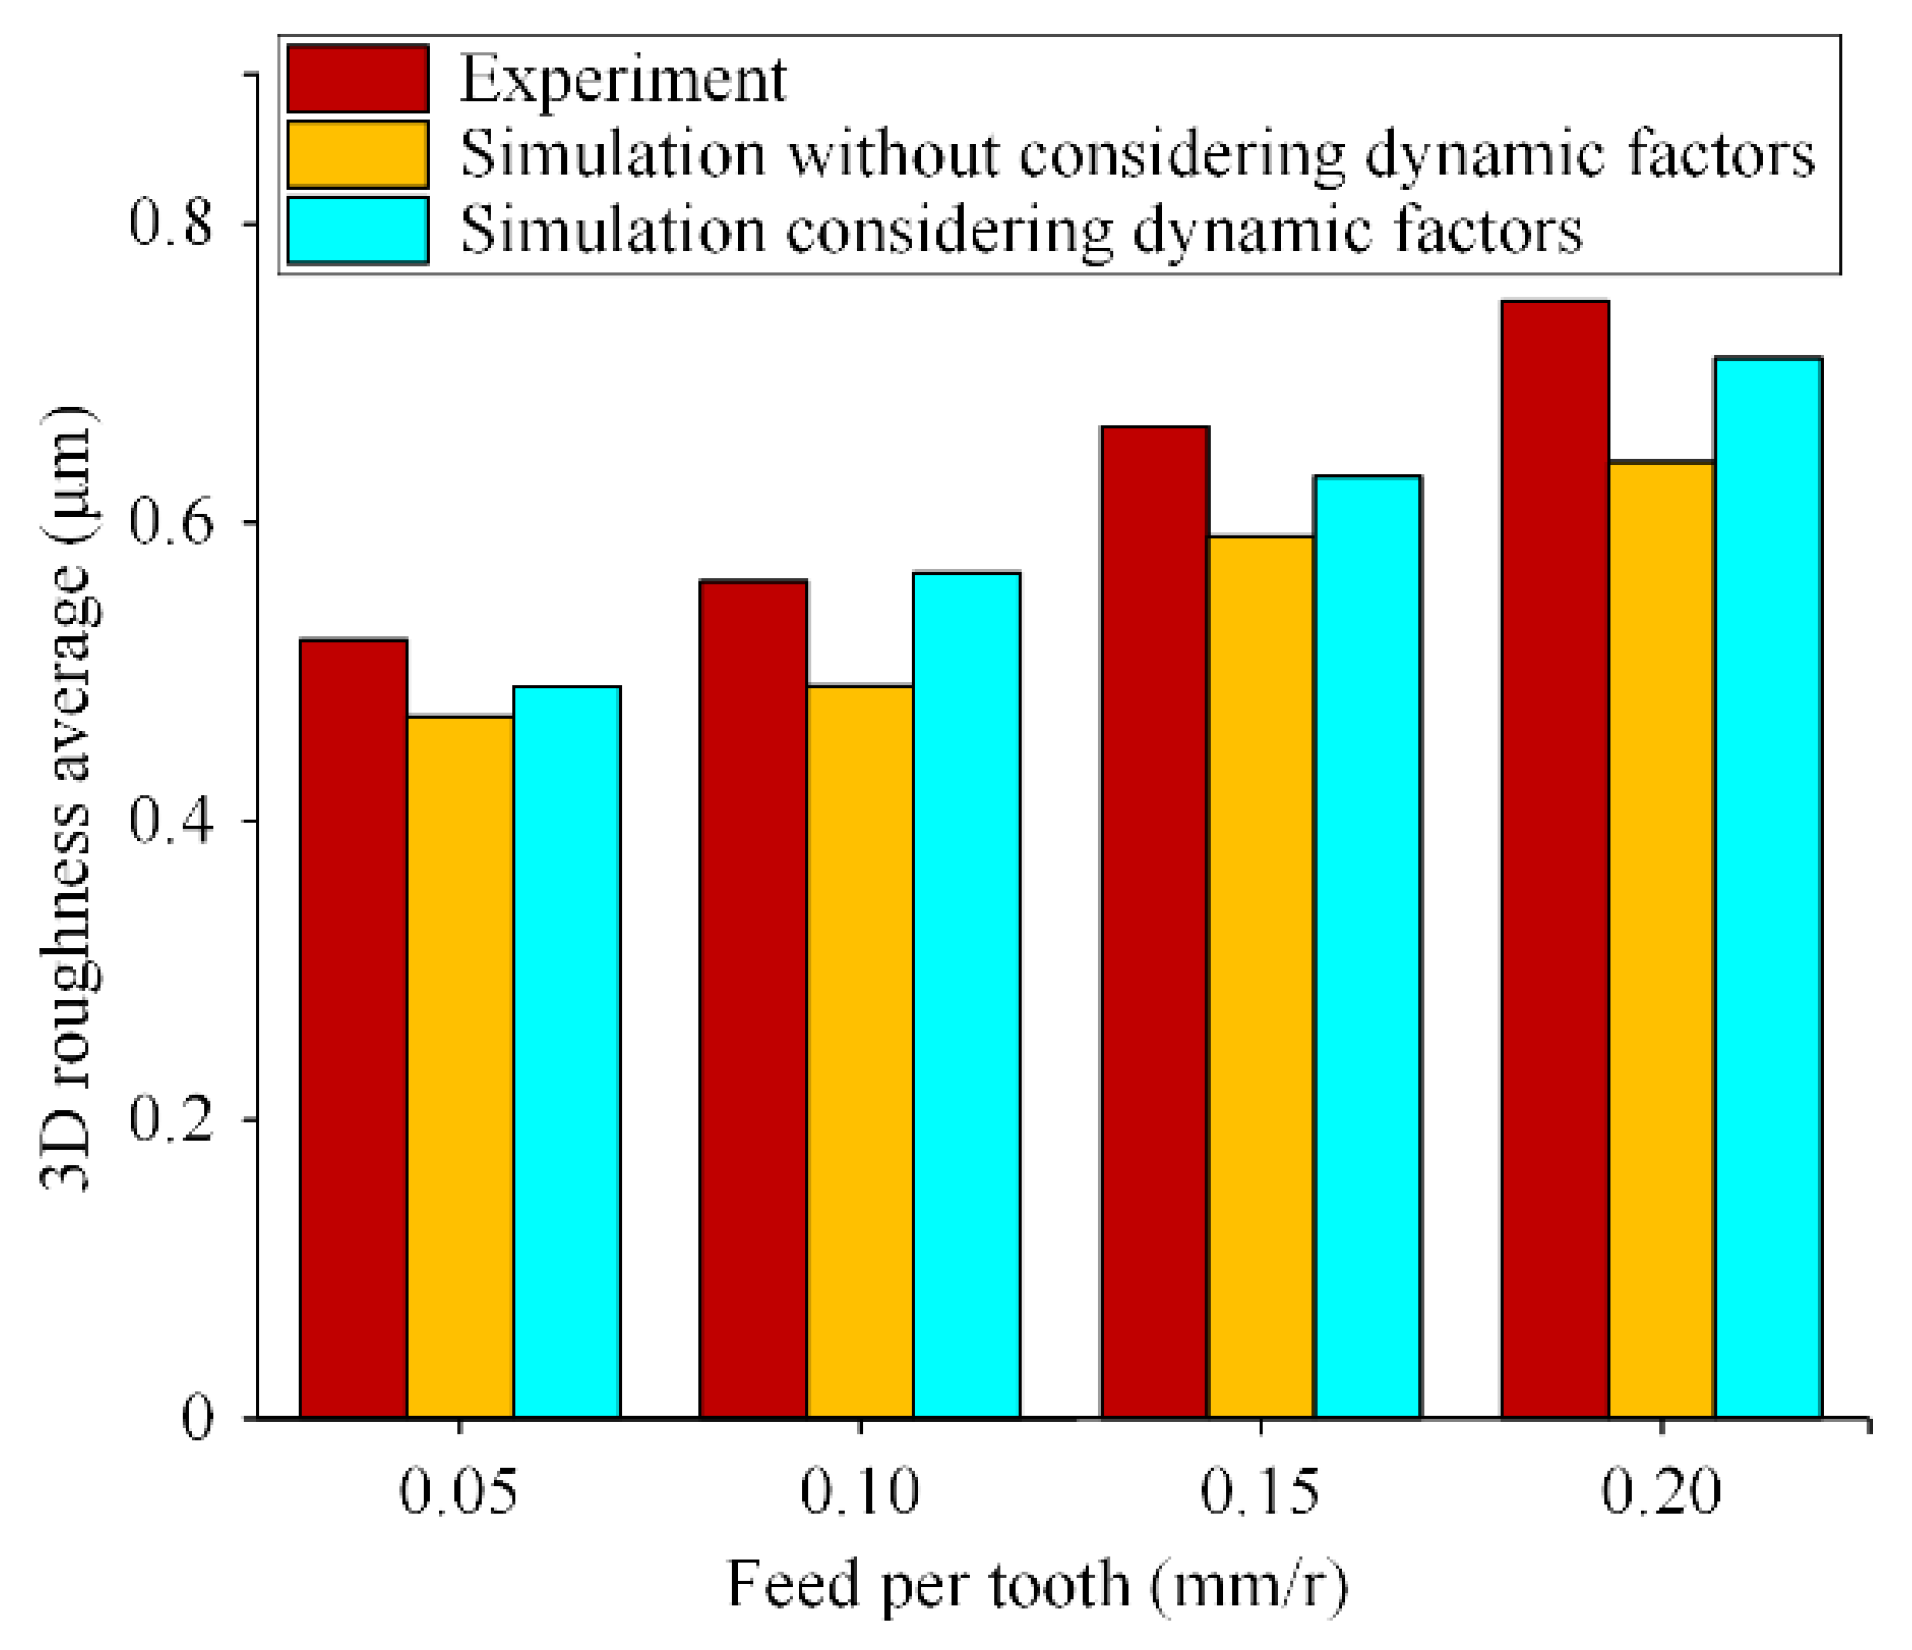
Figure 17 shows the comparisons of surface roughness between the experimental values and the simulation values with and without dynamic factors under different feed rates. When the dynamic factors are not considered, the average error between the simulated value and the experimental value of the surface roughness is 7–13%. After considering the dynamic factors, the average error is 3–6%, which is reduced by about 50%. The simulation accuracy of the surface topography simulation model after considering the dynamic factors is greatly improved, but there is still error with the experimental value. The reasons there is still error may be that the friction between the tool and the workpiece, the springback of the surface material after machining, and other external factors affecting the surface topography are not considered in the model. Moreover, during the experiment, considering the randomicity of the entrance angle of the tool, the impact caused by different entrance angles is different, which is also an important reason for the error between the experimental value and the simulated value of surface roughness and surface topography.

6. Conclusions

In this paper, a surface topography simulation model is established for the convex curved die steel of Cr12MoV material. The effects of cutting vibration and tool deformation on the surface topography are considered in the model, and the established model is verified by experiments. The following conclusions are obtained:
(1)
By comparing the simulation results with the experimental results, it is proved that the established model can accurately predict the surface topography, and the simulation error is 10–16%.
(2)
During the milling process of convex curved die steel, the contact relationship between the tool and the workpiece is different at different positions of the curved surface, which can be regarded as the change process of the inclination angle λ of the tool along the feed direction. When λ is greater than 15°, the position of the curved surface has a lesser effect on the surface topography. When λ is less than 15°, the position of the curved surface has a greater effect on the surface topography. As λ decreases, the scallop shape in the texture begins to change from a rectangle to a parallelogram and, the smaller the λ, the greater effect the λ have on the surface topography.
(3)
When λ is 0°, the tool nose causes the effect of squeezing on the surface material of the workpiece, so the experimental value of surface roughness is lower than the theoretical value under ideal conditions. Therefore, the simulation value is greater than the experimental value. In other locations, the experimental values of the surface roughness are larger than the simulated values owing to the cutting vibration and the friction between the tool and the workpiece.
(4)
The cutting vibration and tool deformation during milling destroy the periodicity of the surface topography, thus the adjacent topography tends to merge with each other. Considering the effects of cutting vibration and tool deformation on the surface topography, the simulation error of the model decreases from 7–13% to 3–6%.
The model considers the effects of cutting vibration, tool deformation, and spring back of the workpiece surface. Combined with the Z-map algorithm, the influence of dynamic factors on the surface topography is reflected through the change of the tool’s path. Therefore, the model can simulate the surface topography of convex curved workpieces. For the machining of the workpiece with high hardness, this modeling method has potential. The limitation is that the workpiece needs to be assumed to be a rigid part.
In theory, cutting vibration and tool deformation are coupled and interacted. This coupling phenomenon is not considered in this paper. For the milling process of convex curved workpieces, it is too complex to analyze this coupling phenomenon from the perspective of mechanism. Solving this coupling problem will be a breakthrough.

Author Contributions

Conceptualization and Validation: C.Y., X.H., and Y.N.; Formal analysis: C.Y., Y.N., and X.L.; Investigation: C.Y., X.H., and Y.N.; Supervision: C.Y., X.L., L.W., and S.Y.L.; Writing—Review and Editing: C.Y. and X.H. All authors have read and agreed to the published version of the manuscript.

Funding

This research was funded by National Key Research and Development Project (Grant No. 2018YFB2002201), Natural Science Outstanding Youth Fund of Heilongjiang Province (Grant No. YQ2019E029), and Outstanding Youth Project of Science and Technology Talents (Grant No. LGYC2018JQ015).

Conflicts of Interest

The authors declare no conflict of interest.

Nomenclature

nsSpindle speed
ωsAngular velocity
apDepth of cut
aeWidth of cut
vfFeed rate
fFeed of every rotation
α0Tool rake angle
γHelix lag angle
NNumber of teeth of ball end milling cutter
RRadius of ball end milling cutter
rCurvature radius of convex surface workpiece
ξDamping ratio
ωModal frequency
kModal stiffness
tjChip thickness
λThe inclination angle of the tool along the feed direction
EYoung’s modulus
IMoment of inertia of an area
KYield strength of materials
n1Material hardening exponent
dDepth of plastic deformation of material
δdPlastic deformation
PAny point on the edge of a milling cutter
αThe angle between the line O1P and the Z1-axis
O1-X1Y1Z1 (CS1)Tool coordinate system
O2-X2Y2Z2 (CS2)Workpiece coordinate system
Ψ The angle between the line O1P and the X1-axis
θjThe angle between the jth tooth and the positive direction of the X1-axis
x ( t ) The displacement of the tool in the X direction at time t
x ˙ ( t ) The vibration speed of the tool in the X direction at time t
x ¨ ( t ) The vibration acceleration of the tool in the X direction at time t
Fx(t), Fy(t), Fz(t) The component of the milling force in the X, Y, and Z directions
Kte, Kre, KaeTangential, radial, and axial edge force coefficient
Ktc, Krc, KacTangential, radial, and axial cutting force coefficient
dsDifferential length of the cutting edge
DbDifferential width of the cutting edge
dFt, dFr, dFaThe tangential force, radial force, and axial force of the cutting edge discrete arbitrary infinitesimal elements
U, vTool deformations in the X and Y directions
LThe length of the tool overhang
rx(θ)The distance between the center of the instantaneous cutting force and the point of the tool tip in the X direction
r F x The distance between the tip and the action point of the differential unit dFx on the cutting edge

References

  1. Jiang, Z.P.; Gao, D.; Yong, L.; Liu, X.L. Optimization of cutting parameters for trade-off among carbon emissions, surface roughness, and processing time. Chin. J. Mech. Eng. 2019, 32, 94. [Google Scholar] [CrossRef] [Green Version]
  2. Yue, C.X.; Gao, H.N.; Liu, X.L.; Liang, S.Y. Part Functionality Alterations Induced by Changes of Surface Integrity in Metal Milling Process: A Review. Appl. Sci. 2018, 8, 2550. [Google Scholar] [CrossRef] [Green Version]
  3. Yue, C.X.; Zhong, Z.N.; Ma, J.; Yang, Y.H. Research on Formation of Metamorphic Layer in Hard Cutting Process of Cr12MoV. J. Harbin Univ. Sci. Technol. 2015, 20, 32–36. [Google Scholar]
  4. Buj-Corral, I.; Vivancos-Calvet, J.; Domínguez-Fernández, A. Surface topography in ball-end milling processes as a function of feed per tooth and radial depth of cut. Int. J. Mach. Tools Manuf. 2012, 53, 51–159. [Google Scholar] [CrossRef]
  5. Yao, C.F.; Wu, D.X.; Jin, Q.C.; Huang, X.C.; Ren, J.X.; Zhang, D.H. Influence of high-speed milling parameter on 3D surface topography and fatigue behavior of TB6 titanium alloy. Trans. Nonferr. Met. Soc. China 2013, 23, 650–660. [Google Scholar] [CrossRef]
  6. Bouzakis, K.D.; Aichouh, P.; Efstathiou, K. Determination of the chip geometry, cutting force and roughness in free form surfaces finishing milling, with ball-end tools. Int. J. Mach. Tools Manuf. 2003, 43, 499–514. [Google Scholar] [CrossRef]
  7. Xu, J.T.; Zhang, H.; Sun, Y.W. Swept surface-based approach to simulating surface topography in ball-end CNC milling. Int. J. Adv. Manuf. Tech. 2018, 98, 107–118. [Google Scholar] [CrossRef]
  8. Wojciechowski, S.; Chwalczuk, T.; Twardowski, P.; Krolczyk, G.M. Modeling of cutter displacements during ball end milling of inclined surfaces. Arch. Civ. Mech. Eng. 2015, 15, 798–805. [Google Scholar] [CrossRef]
  9. Wojciechowski, S.; Mrozek, K. Mechanical and technological aspects of micro ball end milling with various tool inclinations. Int. J. Mech. Sci. 2017, 134, 424–435. [Google Scholar] [CrossRef]
  10. Wojciechowski, S.; Wiackiewicz, M.; Krolczyk, G.M. Study on metrological relations between instant tool displacements and surface roughness during precise ball end milling. Measurement 2018, 129, 686–694. [Google Scholar] [CrossRef]
  11. Urbikain, G.; de Lacalle, L.N.L. Modelling of surface roughness in inclined milling operations with circle-segment end mills. Simul. Model. Pract. Theory 2018, 84, 161–176. [Google Scholar] [CrossRef]
  12. Yue, C.X.; Gao, H.N.; Liu, X.L.; Liang, S.Y.; Wang, L.H. A review of chatter vibration research in milling. Chin. J. Aeronaut. 2019, 32, 1–28. [Google Scholar] [CrossRef]
  13. Toh, C.K. Surface topography analysis in high speed finish milling inclined hardened steel. Precis. Eng. 2004, 28, 386–398. [Google Scholar] [CrossRef]
  14. Shajari, S.; Sadeghi, M.H.; Hassanpour, H. The influence of tool path strategies on cutting force and surface texture during ball-end milling of low curvature convex surfaces. Sci. World J. 2014, 2014, 374526. [Google Scholar] [CrossRef]
  15. Lavernhe, S.; Quinsat, Y.; Lartigue, C. Model for the prediction of 3D surface topography in 5-axis milling. Int. J. Adv. Manuf. Tech. 2010, 51, 915–924. [Google Scholar] [CrossRef] [Green Version]
  16. Lavernhe, S.; Quinsat, Y.; Lartigue, C.; Brown, C. Realistic simulation of surface defects in five-axis milling using the measured geometry of the tool. Int. J. Adv. Manuf. Tech. 2014, 74, 393–401. [Google Scholar] [CrossRef]
  17. Arizmendi, M.; Fernández, J.; Gil, A.; Veiga, F. Effect of tool setting error on the topography of surfaces machined by peripheral milling. Int. J. Mach. Tools Manuf. 2009, 49, 36–52. [Google Scholar] [CrossRef]
  18. Omar, O.E.E.K.; El-Wardany, T.; Ng, E.; Elbestawi, M.A. An improved cutting force and surface topography prediction model in end milling. Int. J. Mach. Tools Manuf. 2007, 47, 1263–1275. [Google Scholar] [CrossRef]
  19. Denkena, B.; Krüger, M.; Bachrathy, D.; Stepan, G. Model based reconstruction of milled surface topography from measured cutting forces. Int. J. Mach. Tools Manuf. 2012, 54–55, 25–33. [Google Scholar] [CrossRef]
  20. Jiang, H.; Long, X.H.; Meng, G. Study of the correlation between surface generation and cutting vibrations in peripheral milling. J. Mater. Process. Technol. 2008, 208, 229–238. [Google Scholar] [CrossRef]
  21. Zhao, H.W.; Zhang, S.; Zhao, B.; Zhang, Q.; Zhao, G.Q. Simulation and prediction of surface topography machined by ball-nose end mill. Comput. Integr. Manuf. Syst. 2014, 20, 880–889. [Google Scholar]
  22. Sun, M.Q.; Wang, L.C. Research on Dynamic Model and Milling Stability of Ball End Milling Cutter. Mach. Tool Hydraul. 2012, 40, 52–54. [Google Scholar]
  23. Armarego, E.J.A.; Whitfield, R.C. Computer based modeling of popular machining operations for force and power predictions. Cirp Ann. 1985, 34, 65–69. [Google Scholar] [CrossRef]
  24. Grossi, N.; Sallese, L.; Scippa, A.; Campatelli, G. Speed-varying cutting force coefficient identification in milling. Precis. Eng. 2015, 42, 321–334. [Google Scholar] [CrossRef]
  25. Wei, Z.C.; Wang, M.J.; Cai, Y.J.; Wang, L. Milling Force Prediction for Ball-end Milling of 3D Curved Surfaces. J. Mech. Eng. 2013, 49, 178–184. [Google Scholar] [CrossRef]
  26. Gao, H.N.; Yue, C.X.; Liu, X.L.; Nan, Y.C. Simulation of Surface Topography Considering Cut-in Impact and Tool Flank Wear. Appl. Sci. 2019, 9, 732. [Google Scholar] [CrossRef] [Green Version]
  27. Yang, D.; Liu, Z.Q. Surface plastic deformation and surface topography prediction in peripheral milling with variable pitch end mill. Int. J. Mach. Tools Manuf. 2015, 91, 43–53. [Google Scholar] [CrossRef]
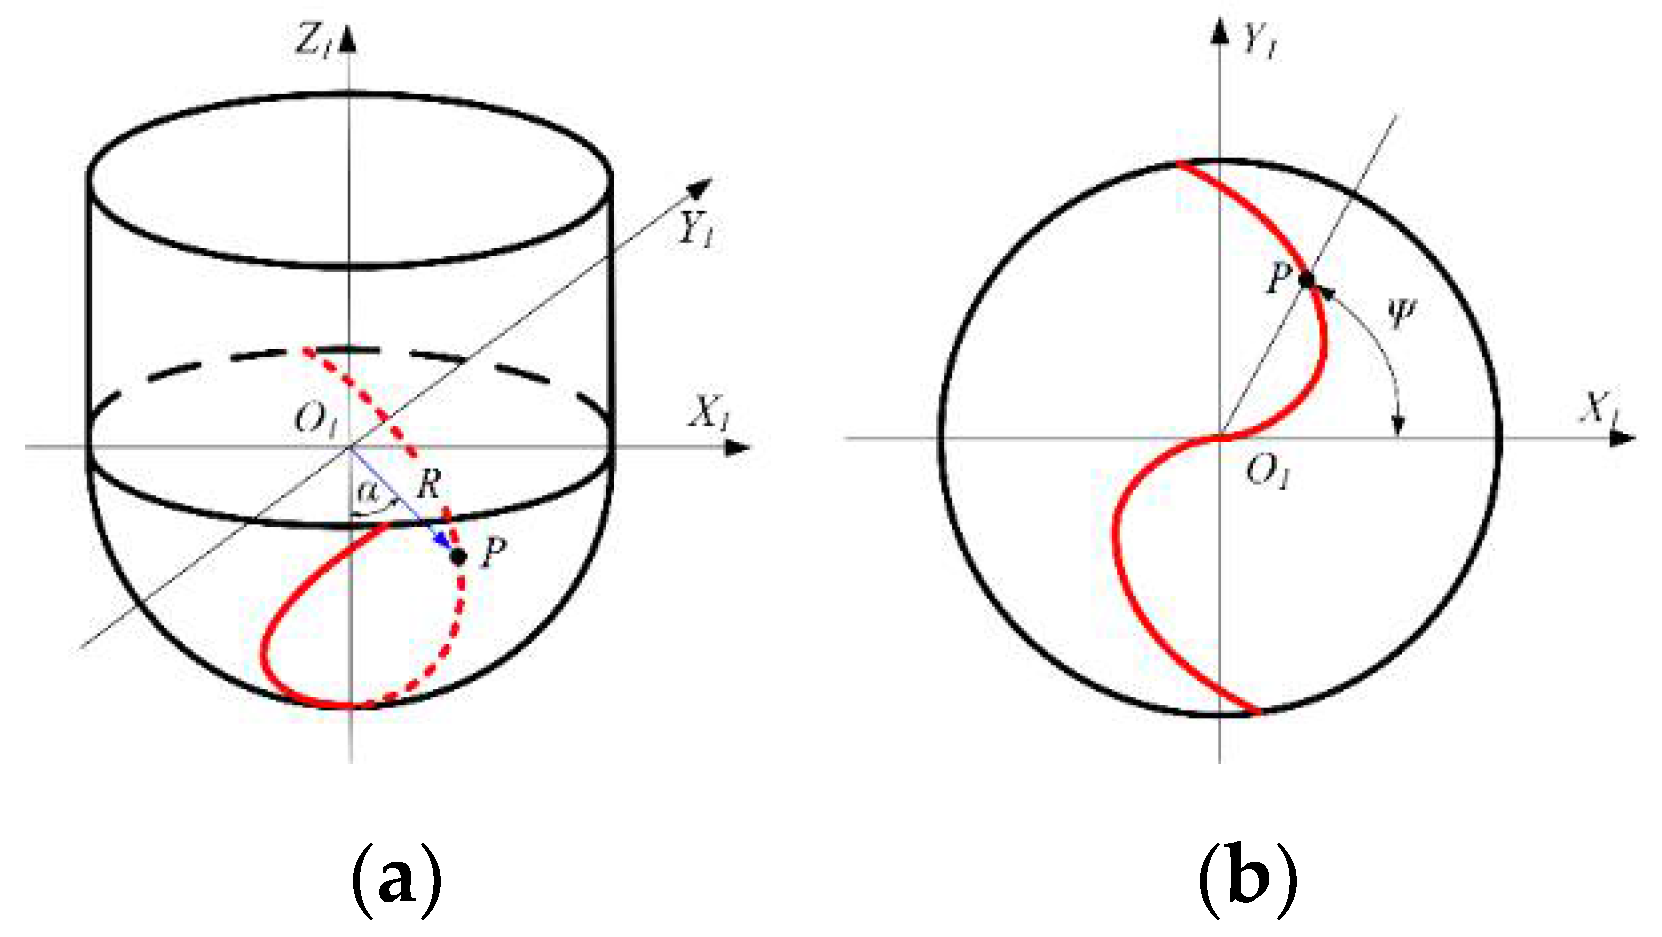
Figure 1. Tool coordinate system of ball-end milling cutter. (a) Cutting edge of the ball portion; (b) The projection of the cutting edge on the XOY plane.
Metals 10 01218 g001
Figure 2. Schematic diagram of the milling process of convex curved workpieces.
Metals 10 01218 g002
Figure 3. Schematic diagram of tool path for the milling convex surface.
Metals 10 01218 g003
Figure 4. Schematic diagram of the tool deformation.
Metals 10 01218 g004
Figure 5. Geometric relationship of the contact area between the tool and the workpiece.
Metals 10 01218 g005
Figure 6. Discrete model of workpiece.
Metals 10 01218 g006
Figure 7. Flow chart of surface topography simulation.
Metals 10 01218 g007
Figure 8. Substitution process of coordinates of discrete points of workpiece.
Metals 10 01218 g008
Figure 9. Topography simulation results of the machined surface. (a) Residual height z of the machined surface; (b) three-dimensional image of the machined surface.
Metals 10 01218 g009
Figure 10. Simulation results of surface topography after removal of curvature. (a) Residual height z after removal of curvature; (b) three-dimensional image after removing curvature.
Metals 10 01218 g010
Figure 11. Kistler5236B rotary dynamometer.
Metals 10 01218 g011
Figure 12. Surface topography simulation results at different positions of the surface.
Metals 10 01218 g012
Figure 13. Experimental measurement of surface topography at different λ.
Metals 10 01218 g013
Figure 14. Comparison of surface roughness between experiments and simulations.
Metals 10 01218 g014
Figure 15. Schematic diagram of the effect of vibration on surface topography.
Metals 10 01218 g015
Figure 16. Surface topography simulation considering dynamic factors.
Metals 10 01218 g016aMetals 10 01218 g016b
Figure 17. Comparison of surface roughness between experiments and simulations.
Metals 10 01218 g017
Table 1. Geometric parameters of the ball-end milling cutter.
Tool TypeTool DiameterTool LengthRake AngleRelief AngleHelix Angle
Ball-end milling cutter10 mm75 mm12°30°
Table 2. Chemical composition table of Cr12MoV steel.
CompositionCSiMnPSCrVMoNiCu
Contents (%)1.45–1.70≤0.40≤0.40≤0.03≤0.0311.0–12.500.15–0.300.40–0.60≤0.25≤0.30
Table 3. Milling force coefficients of 50 HRC hardened steel.
Ktc (N/mm2)Kte (N/mm2)Krc (N/mm2)Kre (N/mm2)Kac (N/mm2)Kae (N/mm2)
1512.8198.5656.8110.1−1123.4−42.4
Table 4. Modal parameter table of the milling system.
Tool DirectionOrderNatural Frequency (HZ)Damping RatioStiffness (N/m)
X17850.02461.74 × 107
216000.01791.01 × 107
Y18000.02631.71 × 107
216000.01831.18 × 107
Z17530.02151.21 × 107
211040.01657.5 × 106