Article

Thermomechanical Simulations of Residual Stresses and Distortion in Electron Beam Melting with Experimental Validation for Ti-6Al-4V

by
Fawaz M. Abdullah
1,*,
Saqib Anwar
1 and
Abdulrahman Al-Ahmari
1,2
1
Industrial Engineering Department, College of Engineering, King Saud University, P. O. Box 800, Riyadh 11421, Saudi Arabia
2
Raytheon Chair for Systems Engineering (RCSE Chair), King Saud University, P.O. Box 800, Riyadh 11421, Saudi Arabia
*
Author to whom correspondence should be addressed.
Metals 2020, 10(9), 1151; https://doi.org/10.3390/met10091151
Submission received: 13 July 2020 / Revised: 18 August 2020 / Accepted: 20 August 2020 / Published: 25 August 2020
(This article belongs to the Special Issue Numerical Modelling and Simulation of Metal Processing)

Abstract

:
Electron beam melting (EBM) is a relatively new process in three-dimensional (3D) printing to enable rapid manufacturing. EBM can manufacture metallic parts with thin walls, multi-layers, and complex internal structures that could not otherwise be produced for applications in aerospace, medicine, and other fields. A 3D transient coupled thermomechanical finite element (FE) model was built to simulate the temperature distribution, distortion, and residual stresses in electron beam additive manufactured Ti-6Al-4V parts. This research enhances the understanding of the EBM-based 3D printing process to achieve parts with lower levels of residual stress and distortion and hence improved quality. The model used a fine mesh in the layer deposition zone, and the mesh size was gradually increased with distance away from the deposits. Then, elements are activated layer by layer during deposition according to the desired material properties. On the top surface, a Gaussian distributed heat flux is used to model the heat source, and the temperature-dependent properties of the powder and solid are also included to improve accuracy. The current simulation has been validated by comparing the FE distortion and temperature results with the experimental results and other reported simulation studies. The residual stress results calculated by the FE analysis were also compared with the previously reported simulation studies on the EBM process. The results showed that the finite element approach can efficiently and accurately predict the temperature field of a part during the EBM process and can easily be extended to other powder bed fusion processes.

1. Introduction

Due to current rapid changes in technology, manufacturing engineering is receiving a lot of attention. Manufacturing methods and designs have been improved to make life easier and more straightforward, especially concerning technologies that allow for accurate and fast manufacturing. Electron beam melting (EBM) is a relatively new additive manufacturing technology based on the powder bed fusion process [1]. The components can be produced on a layer-by-layer basis by melting the powder metal using an electron beam. The energy density of an electron beam is high enough to melt a wide variety of metals and alloys. The material then cools and solidifies to form a fully dense geometry [2]. A unique feature of EBM is its ability to fabricate complex geometries and structures (e.g., meshed, porous, cellular). Schwerdtfeger et al. used electron beam melting to manufacture a unique structure that exhibited “auxetic behavior” a negative Poisson’s ratio, and high impact and shear resistance [3]. EBM processes have the potential to work with many material classes, for example, aluminum alloys [4], steel (H13) [5], cobalt-based super-alloys [6], and titanium alloys [7]. The material used in this study is Ti-6Al-4V, which has many applications, such as medical and aerospace, due to its properties, including good biocompatibility and corrosion resistance, low density, human allergic response, and mechanical strength [8].
Despite a great interest in obtaining part accuracy using the electron beam melting process [9], there have been only a few studies reporting on the geometric aspects of electron beam melting. The accuracy of the EBM parts is greatly affected by the residual stresses and thermal distortions resulting from rapid heating and cooling cycles [10], which are not well understood. These are important issues because they severely degrade the dimensional accuracy and mechanical performance of the components. It is crucial to study, understand, and control distortion and residual stresses through the simulation of the additive manufacturing process. Some methods have been applied to decrease distortion and residual stresses in parts produced by similar processes (e.g., welding). These methods include the use of appropriate design approaches, such as presetting/offsetting, mechanical restraint, preheating, limiting heat input, controlling process parameters, and applying mechanical stress relief techniques [11].
Research work has been undertaken to investigate the thermal phenomena of the EBM process with the help of finite element (FE) modeling. Some studies have been carried out on this issue, such as Denlinger et al. [12] developed a FE model for predicting the in situ thermomechanical response of Ti-6Al-4V during the electron beam melting process. The 3D thermomechanical analysis is performed to model the distortion, residual stress in the workpiece, and experimental temperature in situ. The distortion measurements were performed during the deposition of a single-bead-wide of 16 layers to validate the model. Both in situ deformation and post-process residual stress measurements indicate that stress relaxation occurs during Ti-6Al-4V deposition. The results showed that failure to apply stress relaxation in the constituent model leads to errors in residual stress and situ deformation predictions of more than 500% when compared to experimental measurements. Cheng et al. [13] developed a FE model to simulate the thermomechanical process in EBM to build overhanging parts. A two-dimensional thermomechanical model was developed by using ABAQUS to simulate residual stress distribution, temperature, and overhanging part model distortions. The process parameters included in the FE model were beam scanning speed, beam diameter, and beam current. Thermomechanical characteristics such as thermal gradients and thermal stresses around the overhang build were evaluated and analyzed. The main results showed that the overhang areas have a higher maximum temperature, higher tensile stress, and greater distortion than the areas above the solid base plate.
Ninggang [14] utilized a 3D FE model in ABAQUS to study the complex thermal process of Electron-beam additive manufacturing (EBAM). The finite element model was developed to simulate the transfer of transit heat in one part during EBAM under a moving heat source. The selected parameters in the FE model included efficiency coefficient, voltage, current, penetration, and beam diameter. The key findings include the following: (1) concerning the state of the powder layer, the size of the melt pool is greater with higher maximum temperature compared to a solid layer, which indicates the importance of taking powder into account for the accuracy of the model. (2) The diameter of the larger electron beam will reduce the maximum temperature in the melting trough, and temperature gradients can be much smaller, which gives a lower cooling rate. In another study [15], a 3D transient fully coupled thermomechanical model was built to study the deformation and residual stress in the EBM of Ti-6Al-4V plates. Single-layer, 6-layers, and 11-layers were optimized using both simulations and experiments to ensure the model accuracy and provide confidence in using simulations to optimize the process. The process parameters used in this study were current, voltage, and speed. The results showed that preheating at least twice is an effective way to reduce both distortion and residual stresses. The results also showed that, instead of distortion accumulating in a monotonous manner as more layers are added, the distortion increases as the first 2–3 layers are deposited, and then decreases with the deposition of additional layers.
Umer et al. [16] used a two-dimensional thermomechanical FE model to predict the stresses and distortions associated with the manufacture of overhang structures by EBM for Ti-6Al-4V alloys. The EBM process parameters were (Beam current, speed, voltage and etc.). Various support structure geometries were designed and evaluated. The key findings of this study are as follows. (1) Temperature predictions during each accumulated layer could be useful in determining the phase transform from powder to the liquid and from liquid to solid. (2) The residual stress patterns of the deposited layers with supports were found to be completely different from the unsupported model. Also, the overhang regions showed fluctuating stresses from tensile to compression.
It can be seen from the reviewed literature that very few papers have reported on the modeling of the electron beam melting process. It is worth mentioning that all the reported FE models on the EBM are focused on thick parts (>1 mm). At the same time, thin-walled parts (<1 mm) show different behavior during EBM as compared to the thick parts. Furthermore, none of the reported models consider the combined effect of real conditions, such as preheating temperature, the energy of the electron beam, cooling time, beam scanning path, and beam speed, when applying the FE modeling approach. The current study takes into consideration the real conditions, which were not incorporated into the previous finite element based model for analyzing the EBM process. The objective of this work is to develop a finite element model to study and understand the thermomechanical characteristics of the thin-walled Ti-6Al-4V parts during the electron beam melting process. According to previous studies, the thin-walled EBM parts have good stability to control the surface roughness [17,18]. The thin wall EBM parts were selected due to their significant applications such as biomedical implants with a very limited filling area [19]. A three-dimensional (3D) fully coupled temperature-displacement finite element model is developed to simulate the thermomechanical behavior in the electron beam melting of thin-walled Ti-6Al-4V components.

2. Materials and Methods

2.1. Finite Element Modeling

Finite element analysis was run using the commercial software ABAQUS 6.13 (Dassault Systèmes, Paris, France) to simulate the temperature history, residual stresses distribution, and distortion in multi-layer raster scanning and deposition during EBM of thin-walled Ti-6Al-4V parts. The thermomechanical analysis was performed using a 3D transient, fully coupled temperature-displacement approach. The finite element analysis package Abaqus/Standard was used to simulate the electron beam melting process.
The model was divided into two sections; the stainless-steel base-plate (also known as the substrate) and the powder layers of Ti-6Al-4V. Figure 1 shows a view of the FE model of the electron beam melting process consisting of a base-plate and some layers of Ti-6Al-4V. The dimensions of the base plate are 10 mm (length) × 3.6 mm (width) × 1.5 mm (height). The dimensions of each powder layer are 5 mm (length) × 0.6 mm (width) × 0.05 mm (thickness). It should be noted that, after the deposition of several layers, the width of the layers will become the thickness of the final part. Further, the minimum thickness of a part that can be produced in the ARCAM AB machine is 0.6 mm. Furthermore, the thickness of 0.05 mm (50 µm) is the recommended layer deposition thickness from ARCAM AB for producing Ti-6Al-4V parts. The 5 mm length of each layer was based on the previous FE modeling studies reported on the EBM of Ti-6Al-4V [20]. The FE model was developed in two configurations for studying the thermomechanical behavior of the thin-walled parts. In the first configuration, the FE model consists of five EBM layers and was used to study the residual stresses and temperature distributions in the deposited layers. In the second configuration, the FE model comprises of fifteen EBM layers to study the distortion and variation of thermal gradient in the deposited layers. It should be noted that the initial plan was to run the second configuration of the FE model with fifty EBM layers so that the distortion simulated in the FE model can be directly compared with the 2.5 mm height EBM fabricated parts (50 layers).

2.1.1. Material Properties

It should be noted that the EBM process is a thermomechanical process, so the temperature-dependent properties of the material must be used. In the current model, the temperature-dependent thermal and mechanical properties of the base plate and Ti-6Al-4V are considered, as listed in Table 1 and Table 2, respectively. It should be noted that the main difference in the powder and solid Ti-6Al-4V is between the thermal conductivity (see Table 2), other properties are almost the same as mentioned in [21]. Also, it can be noticed in Table 2 that the thermal conductivity at T = 1950 K is quite high because the Ti-6Al-4V transform to the liquid phase and exists as a liquid between 1950 < T < 2700 K, as reported by [22]. The thermal conductivity of the liquid Ti-6Al-4V is quite high as compared to the solid-state [22,23,24]. It should be noted that the melt pool dynamics depend on the EBM process parameters as well as on the properties of the material used. However, the melt the pool is most sensitive to the thermal conductivity for Ti-6Al-4V, as explained by [25].

2.1.2. Initial and Boundary Conditions

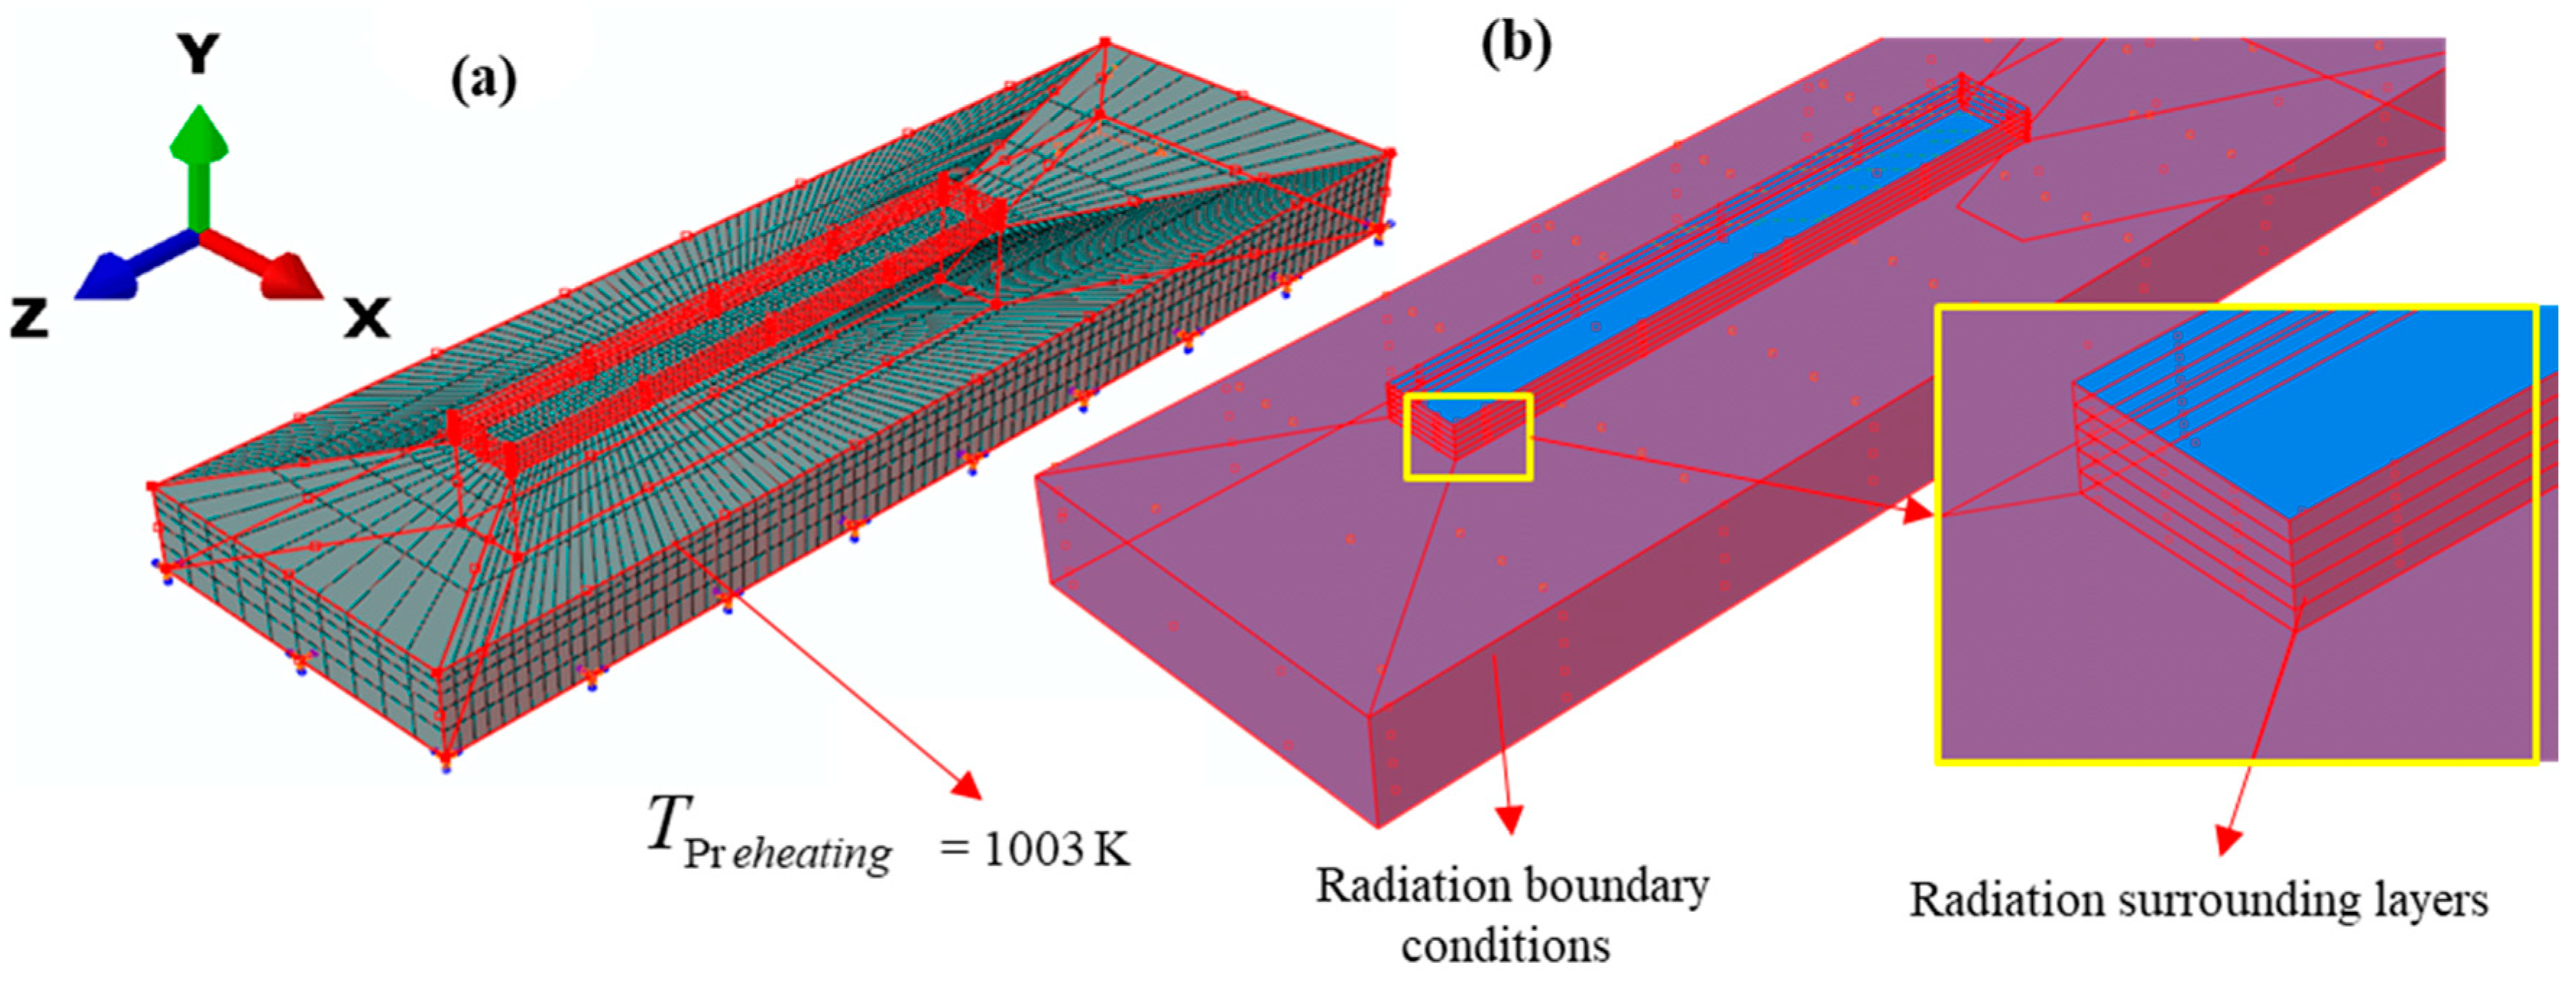
The preheating temperature of 1003 K was applied as an initial condition to the base plate at t = 0 s as shown in Figure 2a. The preheating temperature was 1003 K, as reported in previous studies [13]. Moreover, all the external surfaces of the base plate and the deposited layers were assigned radiation boundary conditions. Equation (1) shows the heat loss by radiation surrounding the layers
Q = A · σ · ε   ( T 4 T a 4 )
where A is the surface area, σ is the Stefan–Boltzmann constant,   ε is the emissivity, and T a is the ambient temperature. The negative sign indicates the heat loss due to radiation. The transient temperature field T (x y z t) throughout the domain was obtained by solving the 3D heat conduction equation, Equation (2)
ρ C T t = x ( k T x ) + y ( k T y ) + z ( k T z ) + Q
where T is the temperature, ρ   is the density, C is the specific heat, k is the heat conductivity, and Q is the internal heat generation per unit volume. For thermoelasticity, the materials expand or contract as temperature changes; therefore thermal strain, which depends on current and initial temperatures, is an important part of the total strain. The total strain in the component, ε Total can be represented as
ε Total = ε p + ε e + ε T
where   ε Total , ε p , ε e , and   ε T are the total strain, plastic strain, elastic strain, and thermal strain, respectively. However, the plastic strain ( ε p )   was not computed in the current model, as the FE model was set to perform the elastic thermal analysis during the EBM process. The constitutive equation for the stress can be written as
a   =   C ( ε e + ε T )
where a is the stress and C is the fourth-order material stiffness tensor. To better illustrate the constitutive law, the equation can be written in indicial notation as follow:
Q i j = E ( 1 + V ) ( 1 2 V ) ( V δ i j ε k k + ( 1 + v ) ε j j   ( 1 + v ) α Δ T δ i j )
where (i, j, k = 1, 2, 3), v is Poisson’s ratio, E is Young’s modulus, and δ i j is the Kronecker delta. The elastic behavior was modeled using the isotropic generalized Hooke’s law.
The temperature-dependent material properties have been used to improve accuracy. Thermal radiation is considered as the boundary condition, described by Newton’s law of cooling and the Stefan-Boltzmann law, as the part is produced by EBM in a full vacuum. The ARCAM AB vacuum system provides a basic pressure of 5 × 10⁻⁵ mbar or better throughout the entire building cycle. During the process, the partial pressure of He is 4 × 10⁻³ mbar. This confirms a clean and controlled building environment, which is important for maintaining the chemical specifications of building materials. However, the convection between the environment and the powder layers due to the vacuum is not included. Hence, the radiation is taken to be the heat transfer between part/powder and the surroundings. Radiation from the side of the base plate, sides of layers, and any free surfaces on the model have been used, as shown in Figure 2b.

2.1.3. Electron Beam Modeling

The heat distribution from the electron beam was simulated as a conical moving heat source with a Gaussian distributed intensity at each depth [14]. In this research, the heat source was modeled as Equation (6). The intensity decreases with an increase in penetration depth.
S ( x , y , z ) = f ( z ) 8 y U I b π Φ E 2 e x p { 8 ( x x s ) 2 + ( y y s ) 2 Φ E 2 }
whereas f(z) is given by Equation (7)
f ( z )   =   2 h ( 1 z h )
The terms used in Equations (3) and (4) are defined as follows: (x,,z) is the volumetric heat source along X, Y, and Z axes, efficiency coefficient η (0.9), voltage U (60 kV), beam current Ib (0.002 mA), beam penetration h (0.05 mm), and beam diameter ΦE (0.3 mm). xs and ys are the positions of the heat source (electron beam) center.
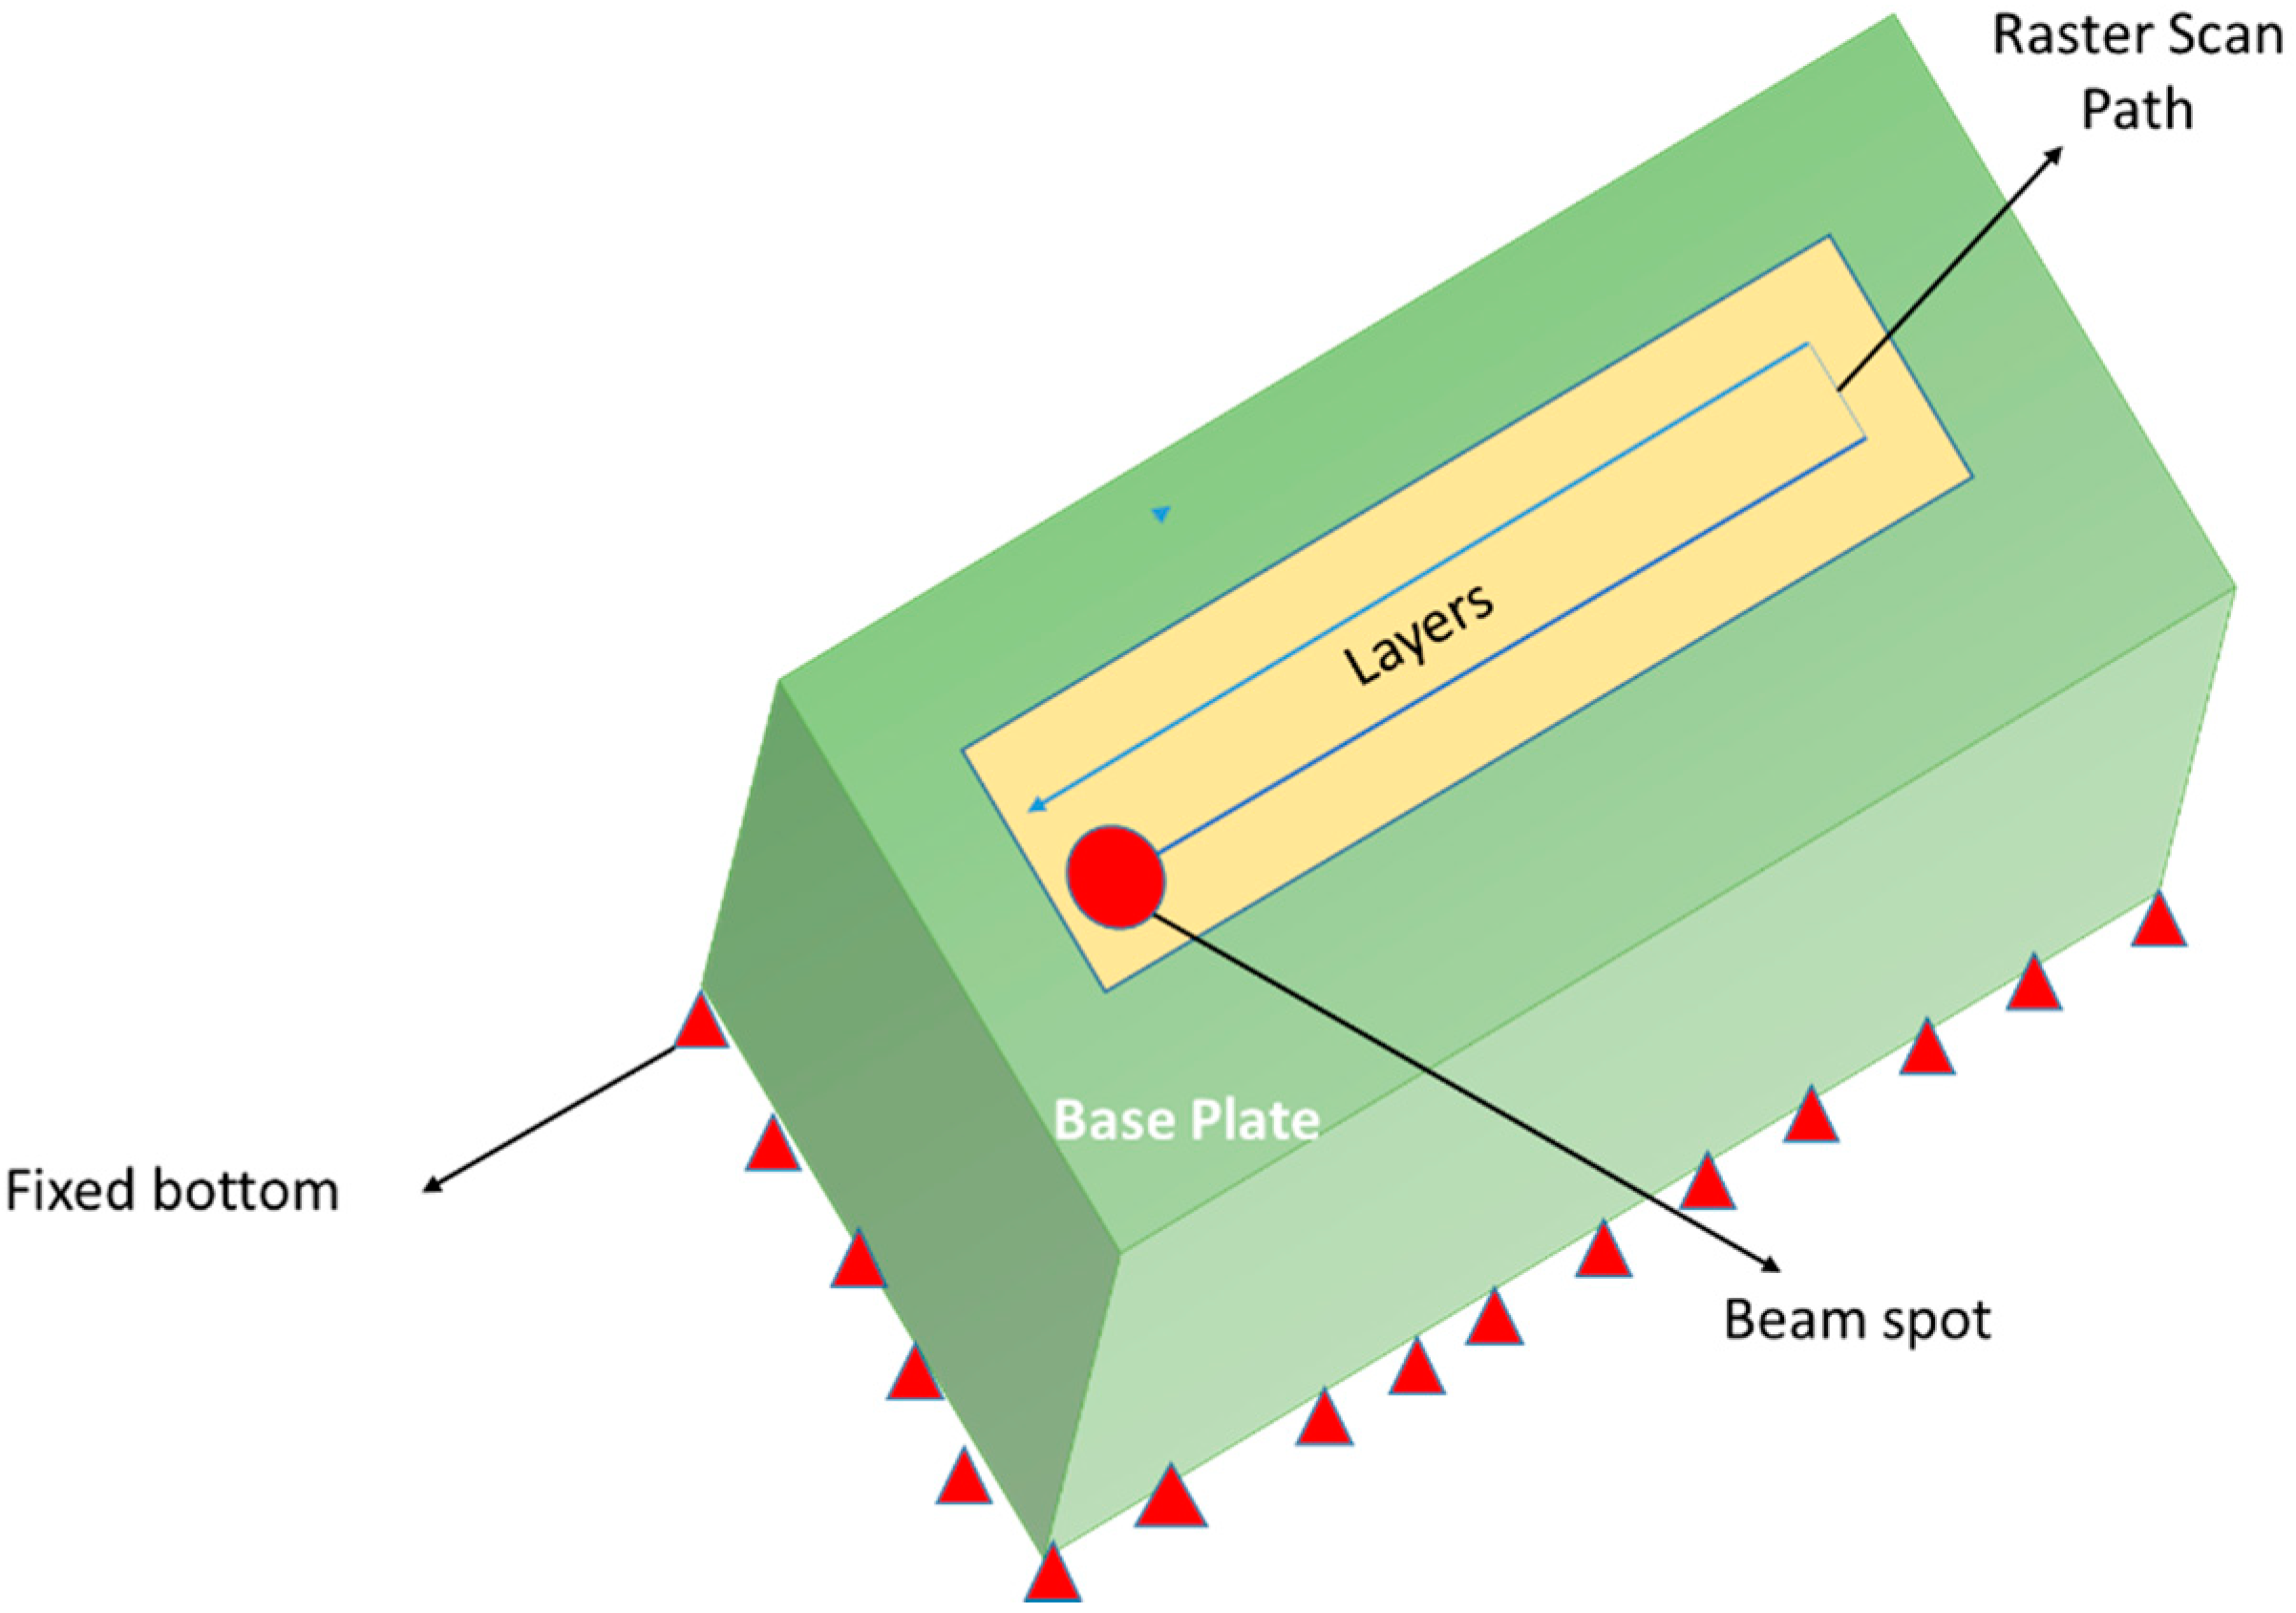
A user subroutine DFLUX coded in FORTRAN was used to apply the heat source in the FE model. The subroutine DFLUX was called under the interaction module so that contact could be established between the heat source (electron beam spot) and layers, as shown in Figure 3. It is called at the beginning of each iteration and reads the simulation time to determine the position of the heat source center so that the domain of the volumetric heat flux can be established. In this study, the penetration of the beam was chosen to be the same as the thickness of the layer, as adopted by [28].

2.2. Contact

Contact between the base plate material and powder layers was assumed to be rigid. The tie constraint in ABAQUS was used to transfer the heat from the first layer to the base plate, and also from the nodes of the top layers to the bottom layers, as shown in Figure 4. The tie constraint locks the temperature and deformation degrees of freedom between the nodes such that the slave nodes (bottom nodes) follow the master nodes (top nodes). The characteristics of the tie constraints are:
The deformation effect will be transferred from one layer to another layer through the tied nodes.
Heat degree of freedom will be transferred from one layer to another through the tied nodes.

2.3. FE Mesh

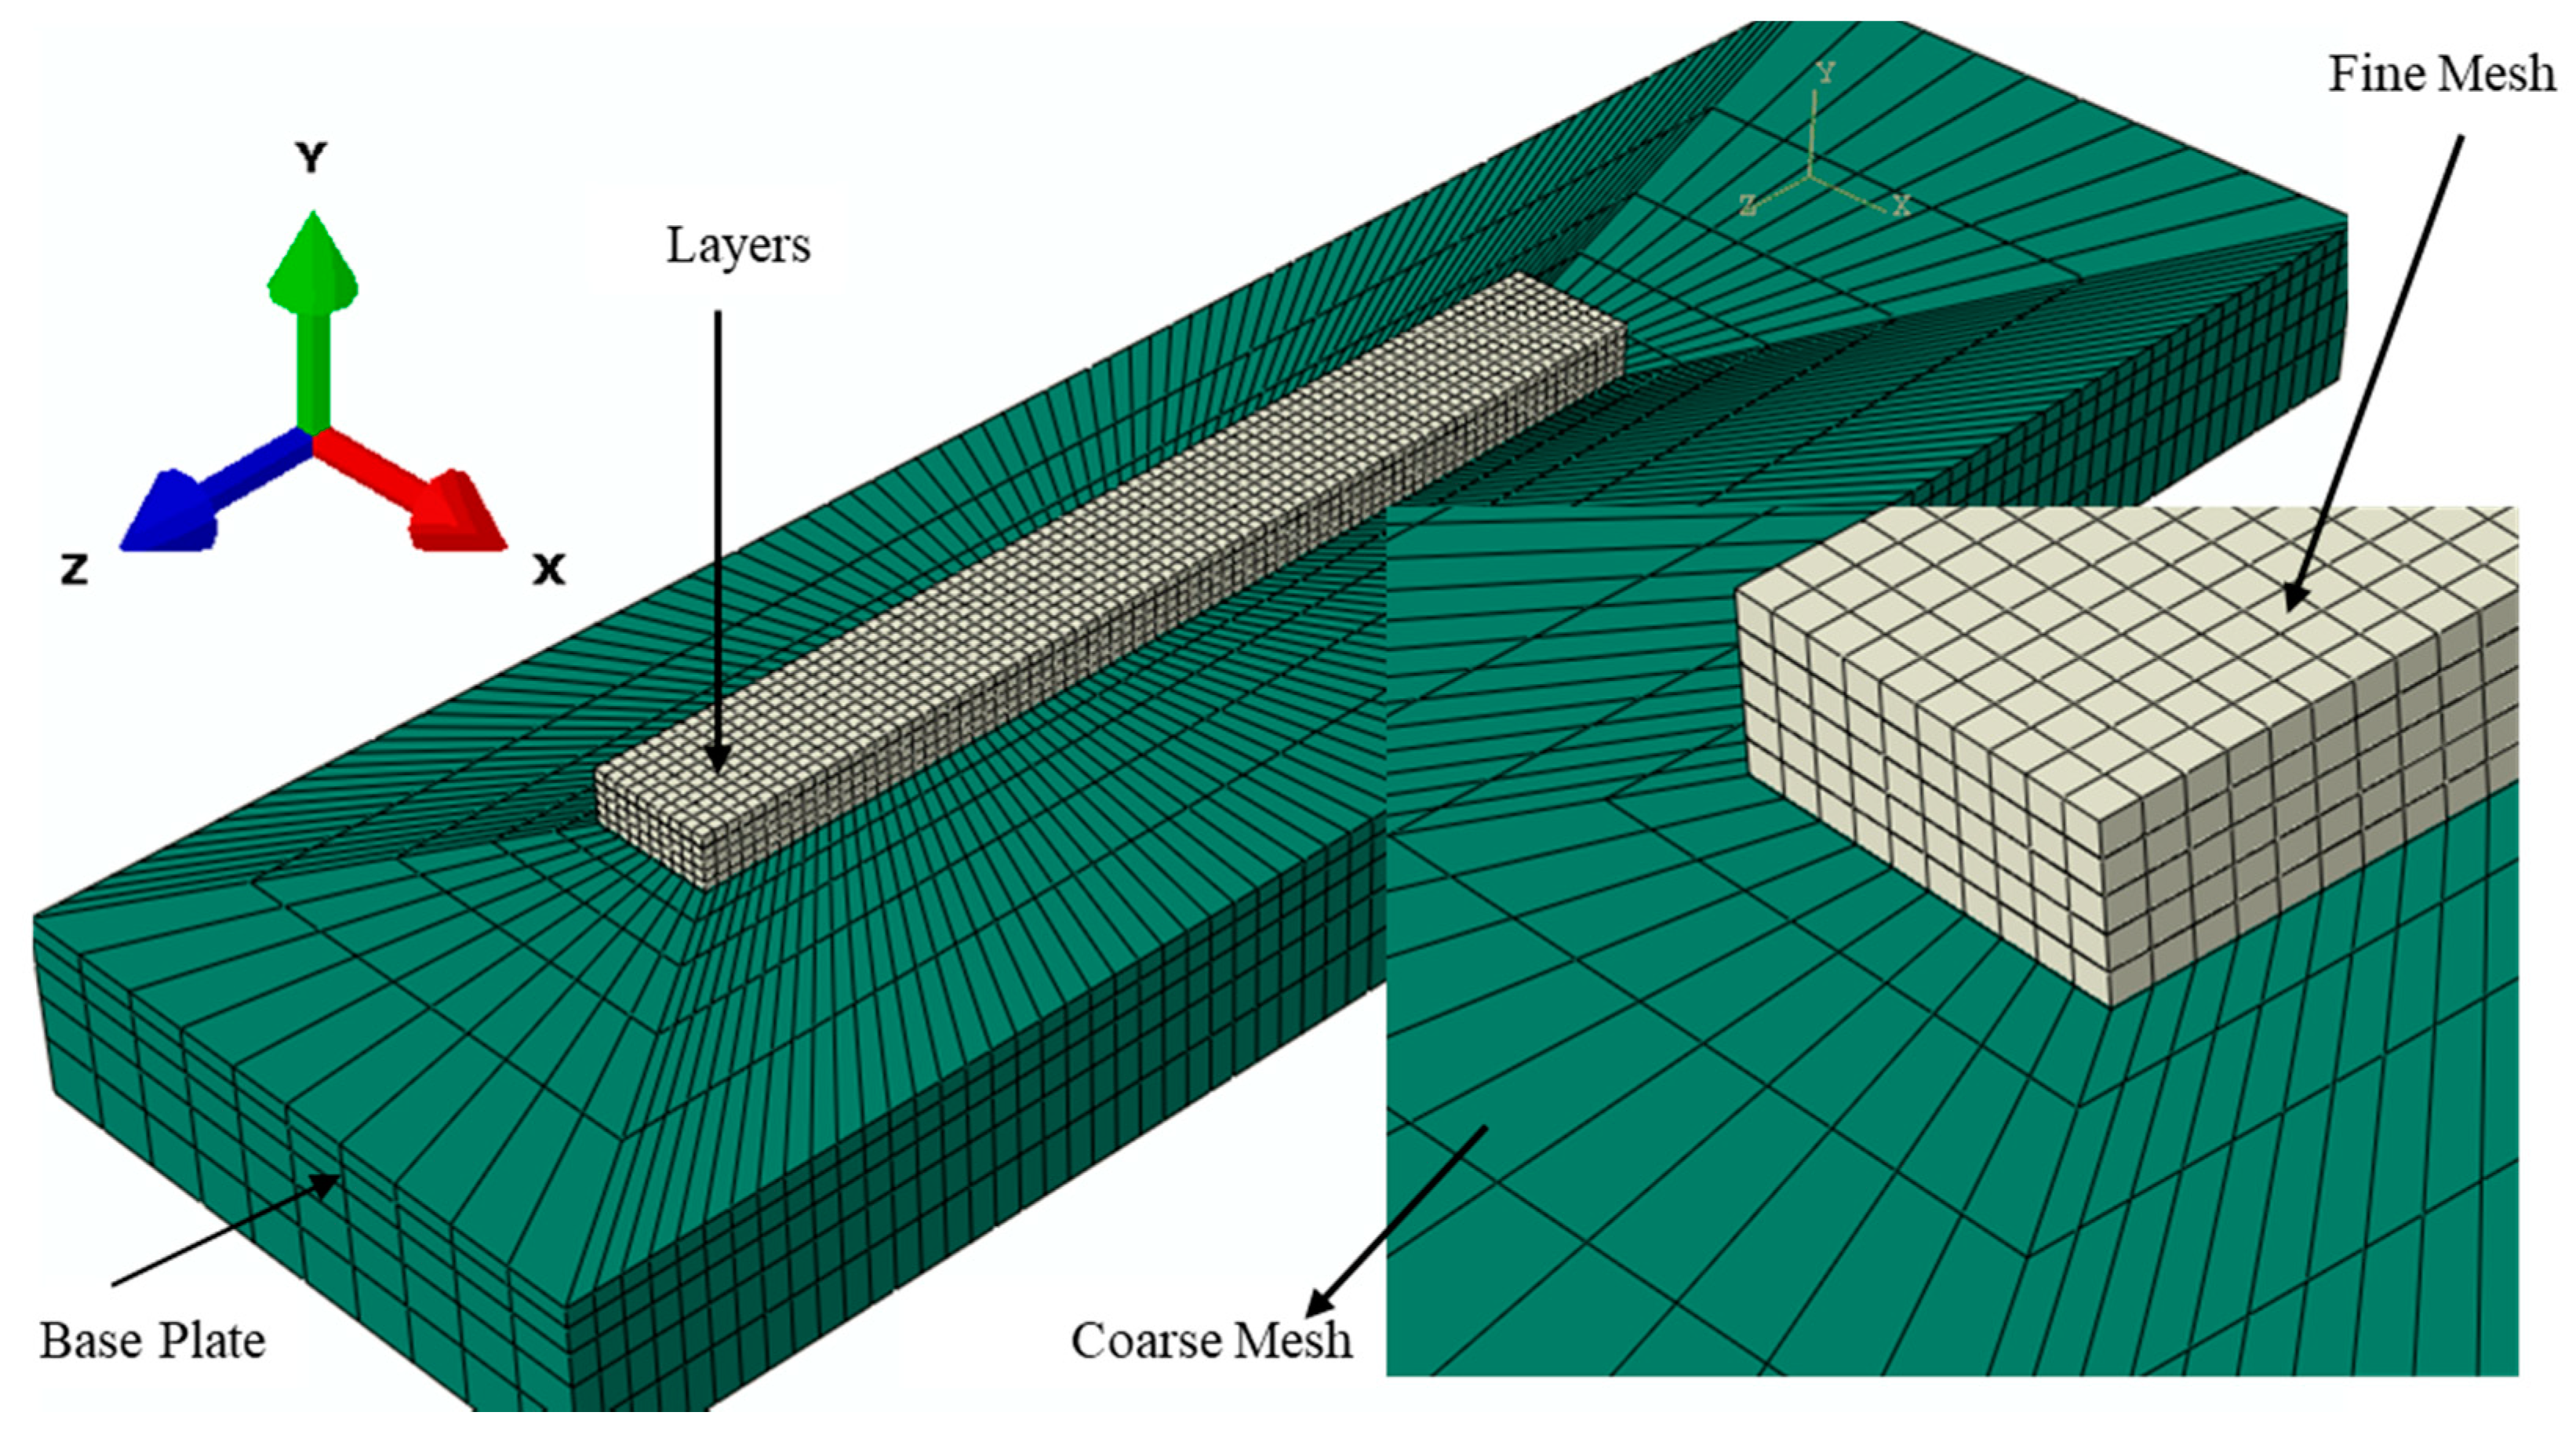
The mesh size for the model was selected after several trials. The model was run with different mesh sizes, and the results from each model were compared. Hence, fine meshes were used in the layers deposition zone, and the mesh size was gradually increased with distance from the deposits. In regions more separated from the heat-affected area, coarser meshes were utilized. The C3D8T coupled thermal-displacement elements were used to mesh the base plate and the powder layers. Mesh sensitivity analysis was carried out to ensure that the used mesh (element) size was neither too time-consuming nor leading to discretization errors. Eight node coupled thermal-displacement elements (C3D8T) were selected to mesh the layers with an element size dimension of 0.06 mm × 0.06 mm × 0.05 mm. The same element type was used in the base plate. The size of the elements in the fine mesh region in the base plate was also the same as for the layers. Figure 5 shows the mesh used in this model.

2.4. Powder Addition in a Layer by Layer Fashion

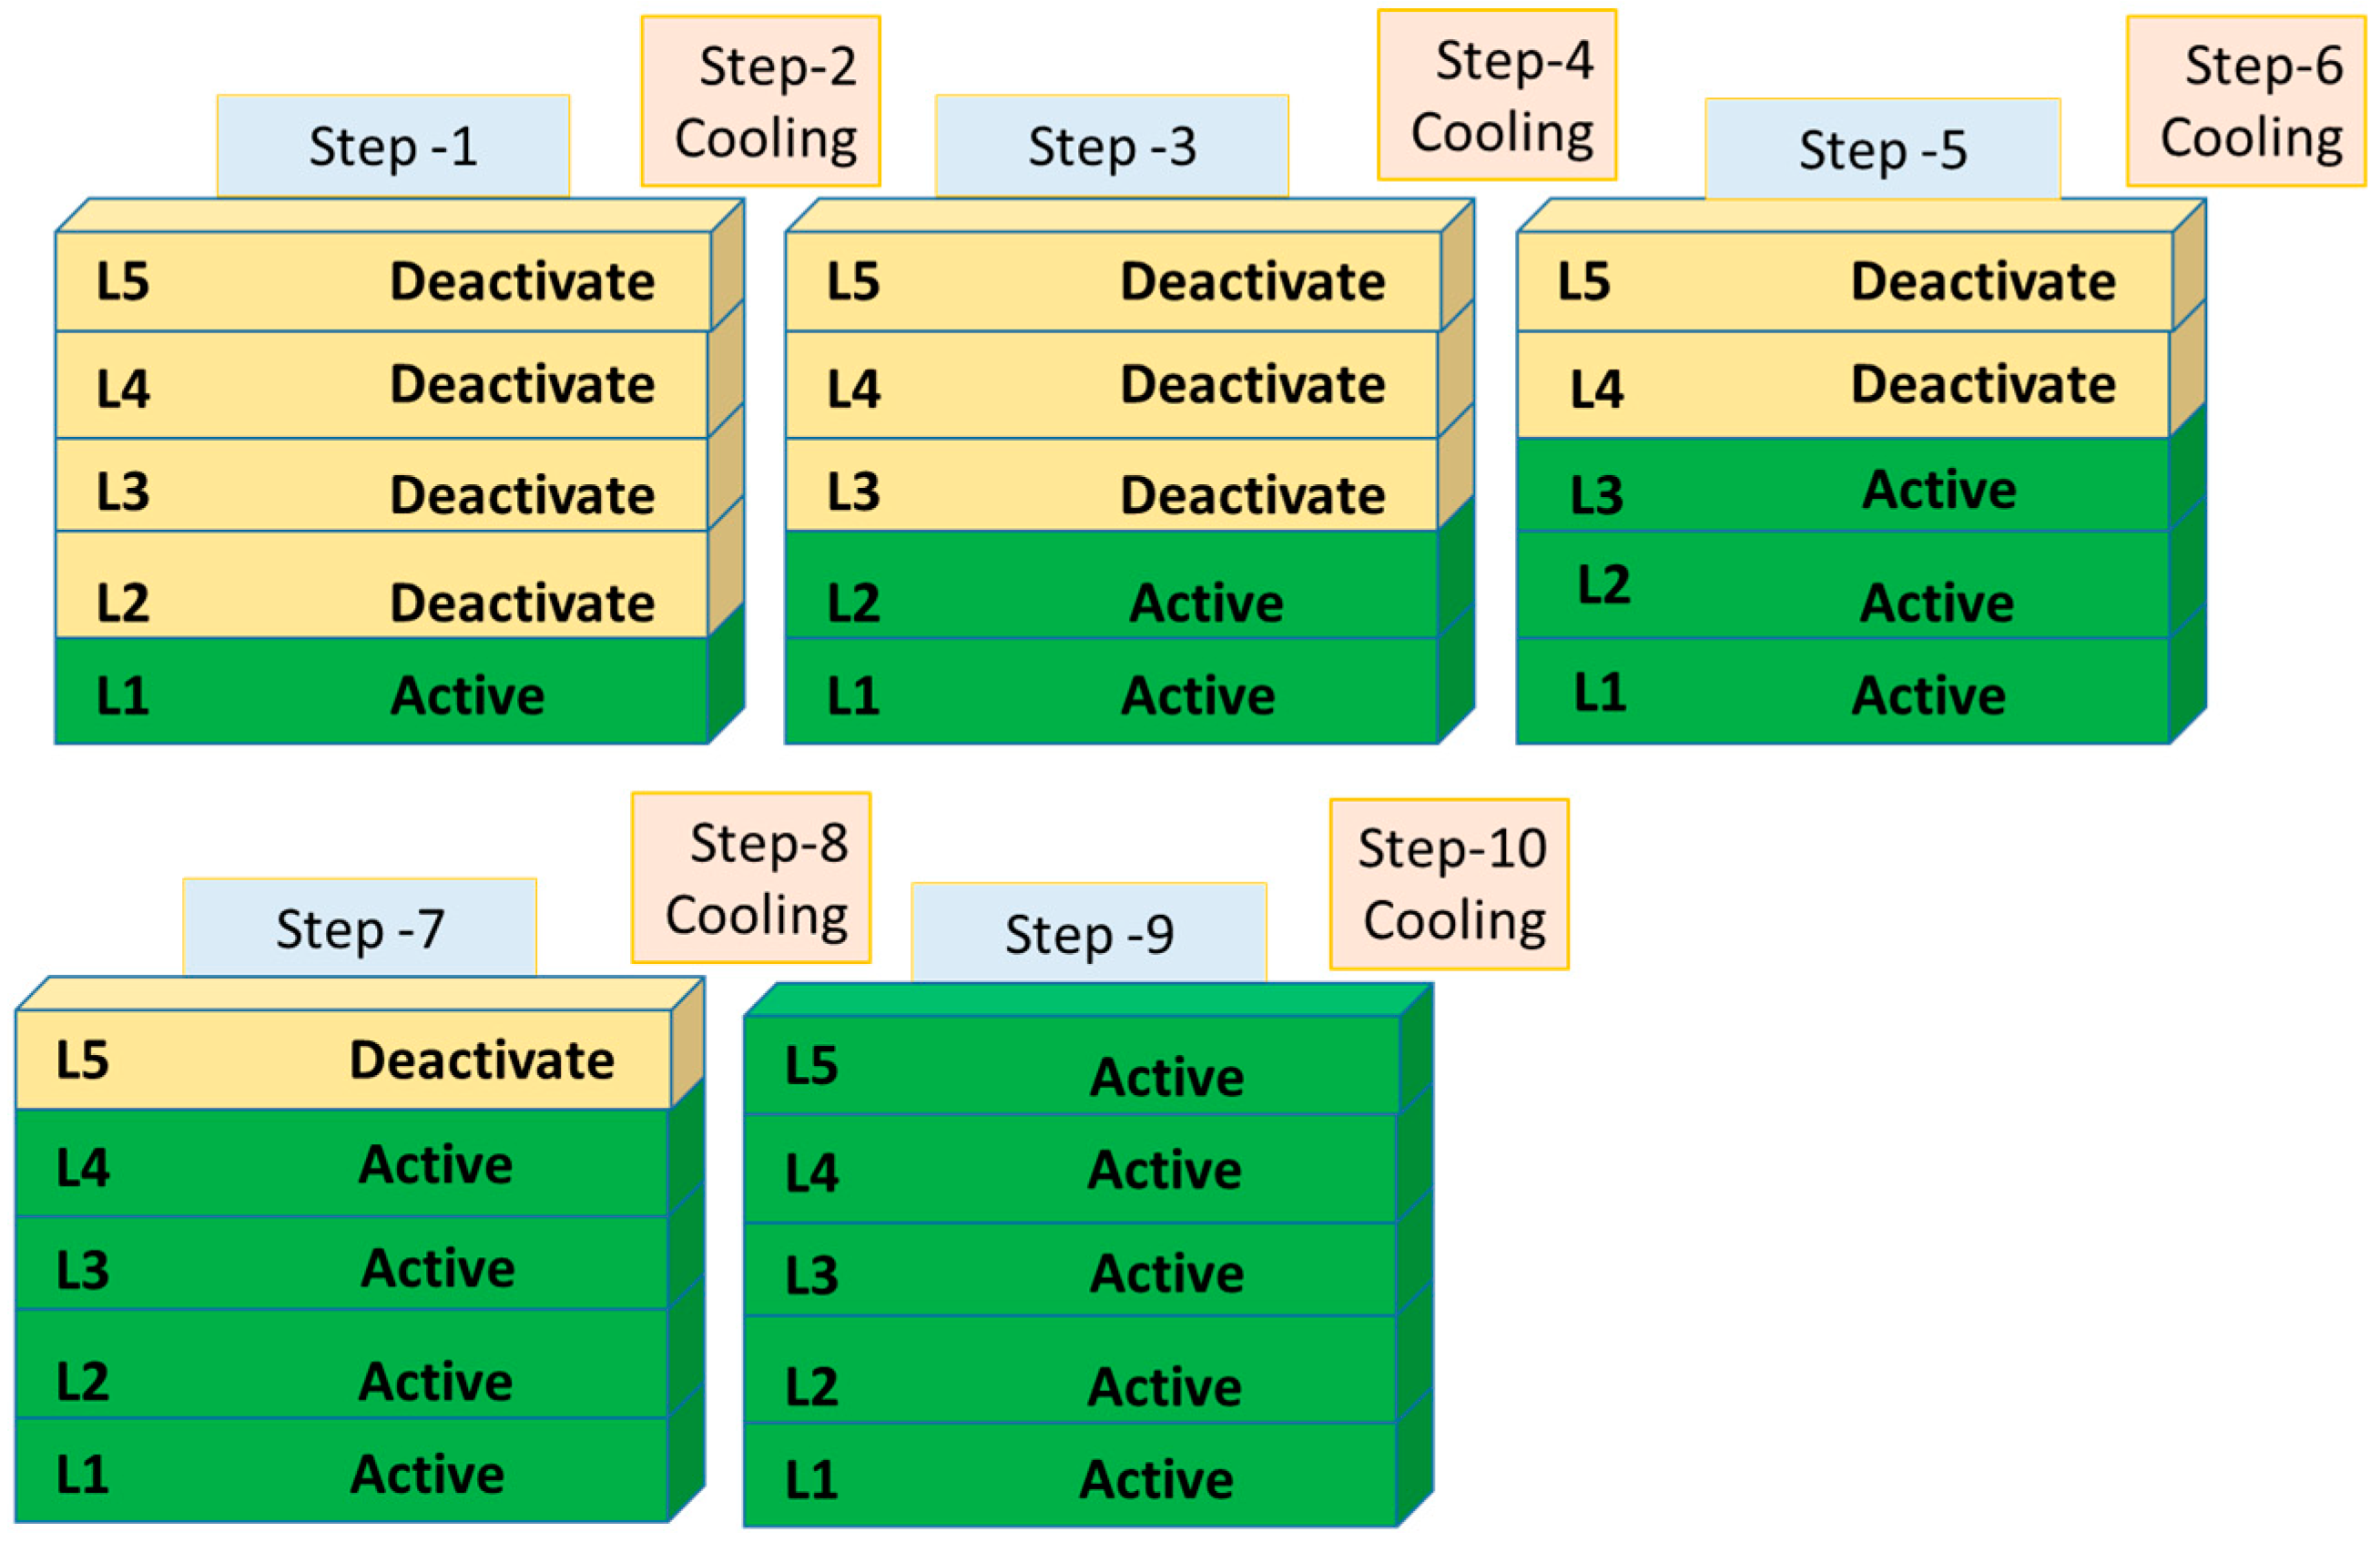
To add layers one by one in the FE model, the model change option in ABAQUS was used. At a step in time, a set of elements was added onto the base plate by activating the layer to form rectangular deposits along the centerline of the base plate by using the model change option in the interaction module. However, at the first step, all layers were deactivated except layer one (L1). After the melting phase in the L1, the cooling phase (Step-2 in Figure 6) was followed in this layer. The time for the cooling step was assumed to be 3 s [29]. After the cooling time ended, the second layer (L2) was activated on top of the previously melted and cooled L1, and so on for the remaining layers, as shown in Figure 6. Once a layer is activated, it remains active for the remaining analysis to take part in the heating, conduction, and radiation phenomena.
The whole model (base plate and powder layers) was assigned with a uniform temperature distribution of T-preheat as the initial thermal condition. During the simulation, the electron beam traveled along the X and Z-axes on the top surface of each powder layer. After the melting phase, the phase was changed from powder to solid phase, and then the simulation of the cooling phase followed. The field variables in ABAQUS were used to transform the martial properties from powder to solid-state. During the electron beam scanning in Step-1 (melting phase), the Ti-6Al4V properties were maintained as powder by activating the field variable 1. After the electron beam scan was accomplished, Ti-6Al4V properties were changed to solid by activating the field variable 2 in Step-2 (cooling phase). This process was repeated in the subsequent melting and cooling steps. The field variable can be controlled in the ABAQUS within the property module, step module, and edit keywords options. The time for the cooling step was assumed to be 3 s, as shown in Table 3. Five layers were built with ten steps (transient fully coupled temperature-displacement) to handle the model. The last cooling step was 1100 s, which was the time needed for the temperature of the EBAM part to drop to a room temperature of 293 K.

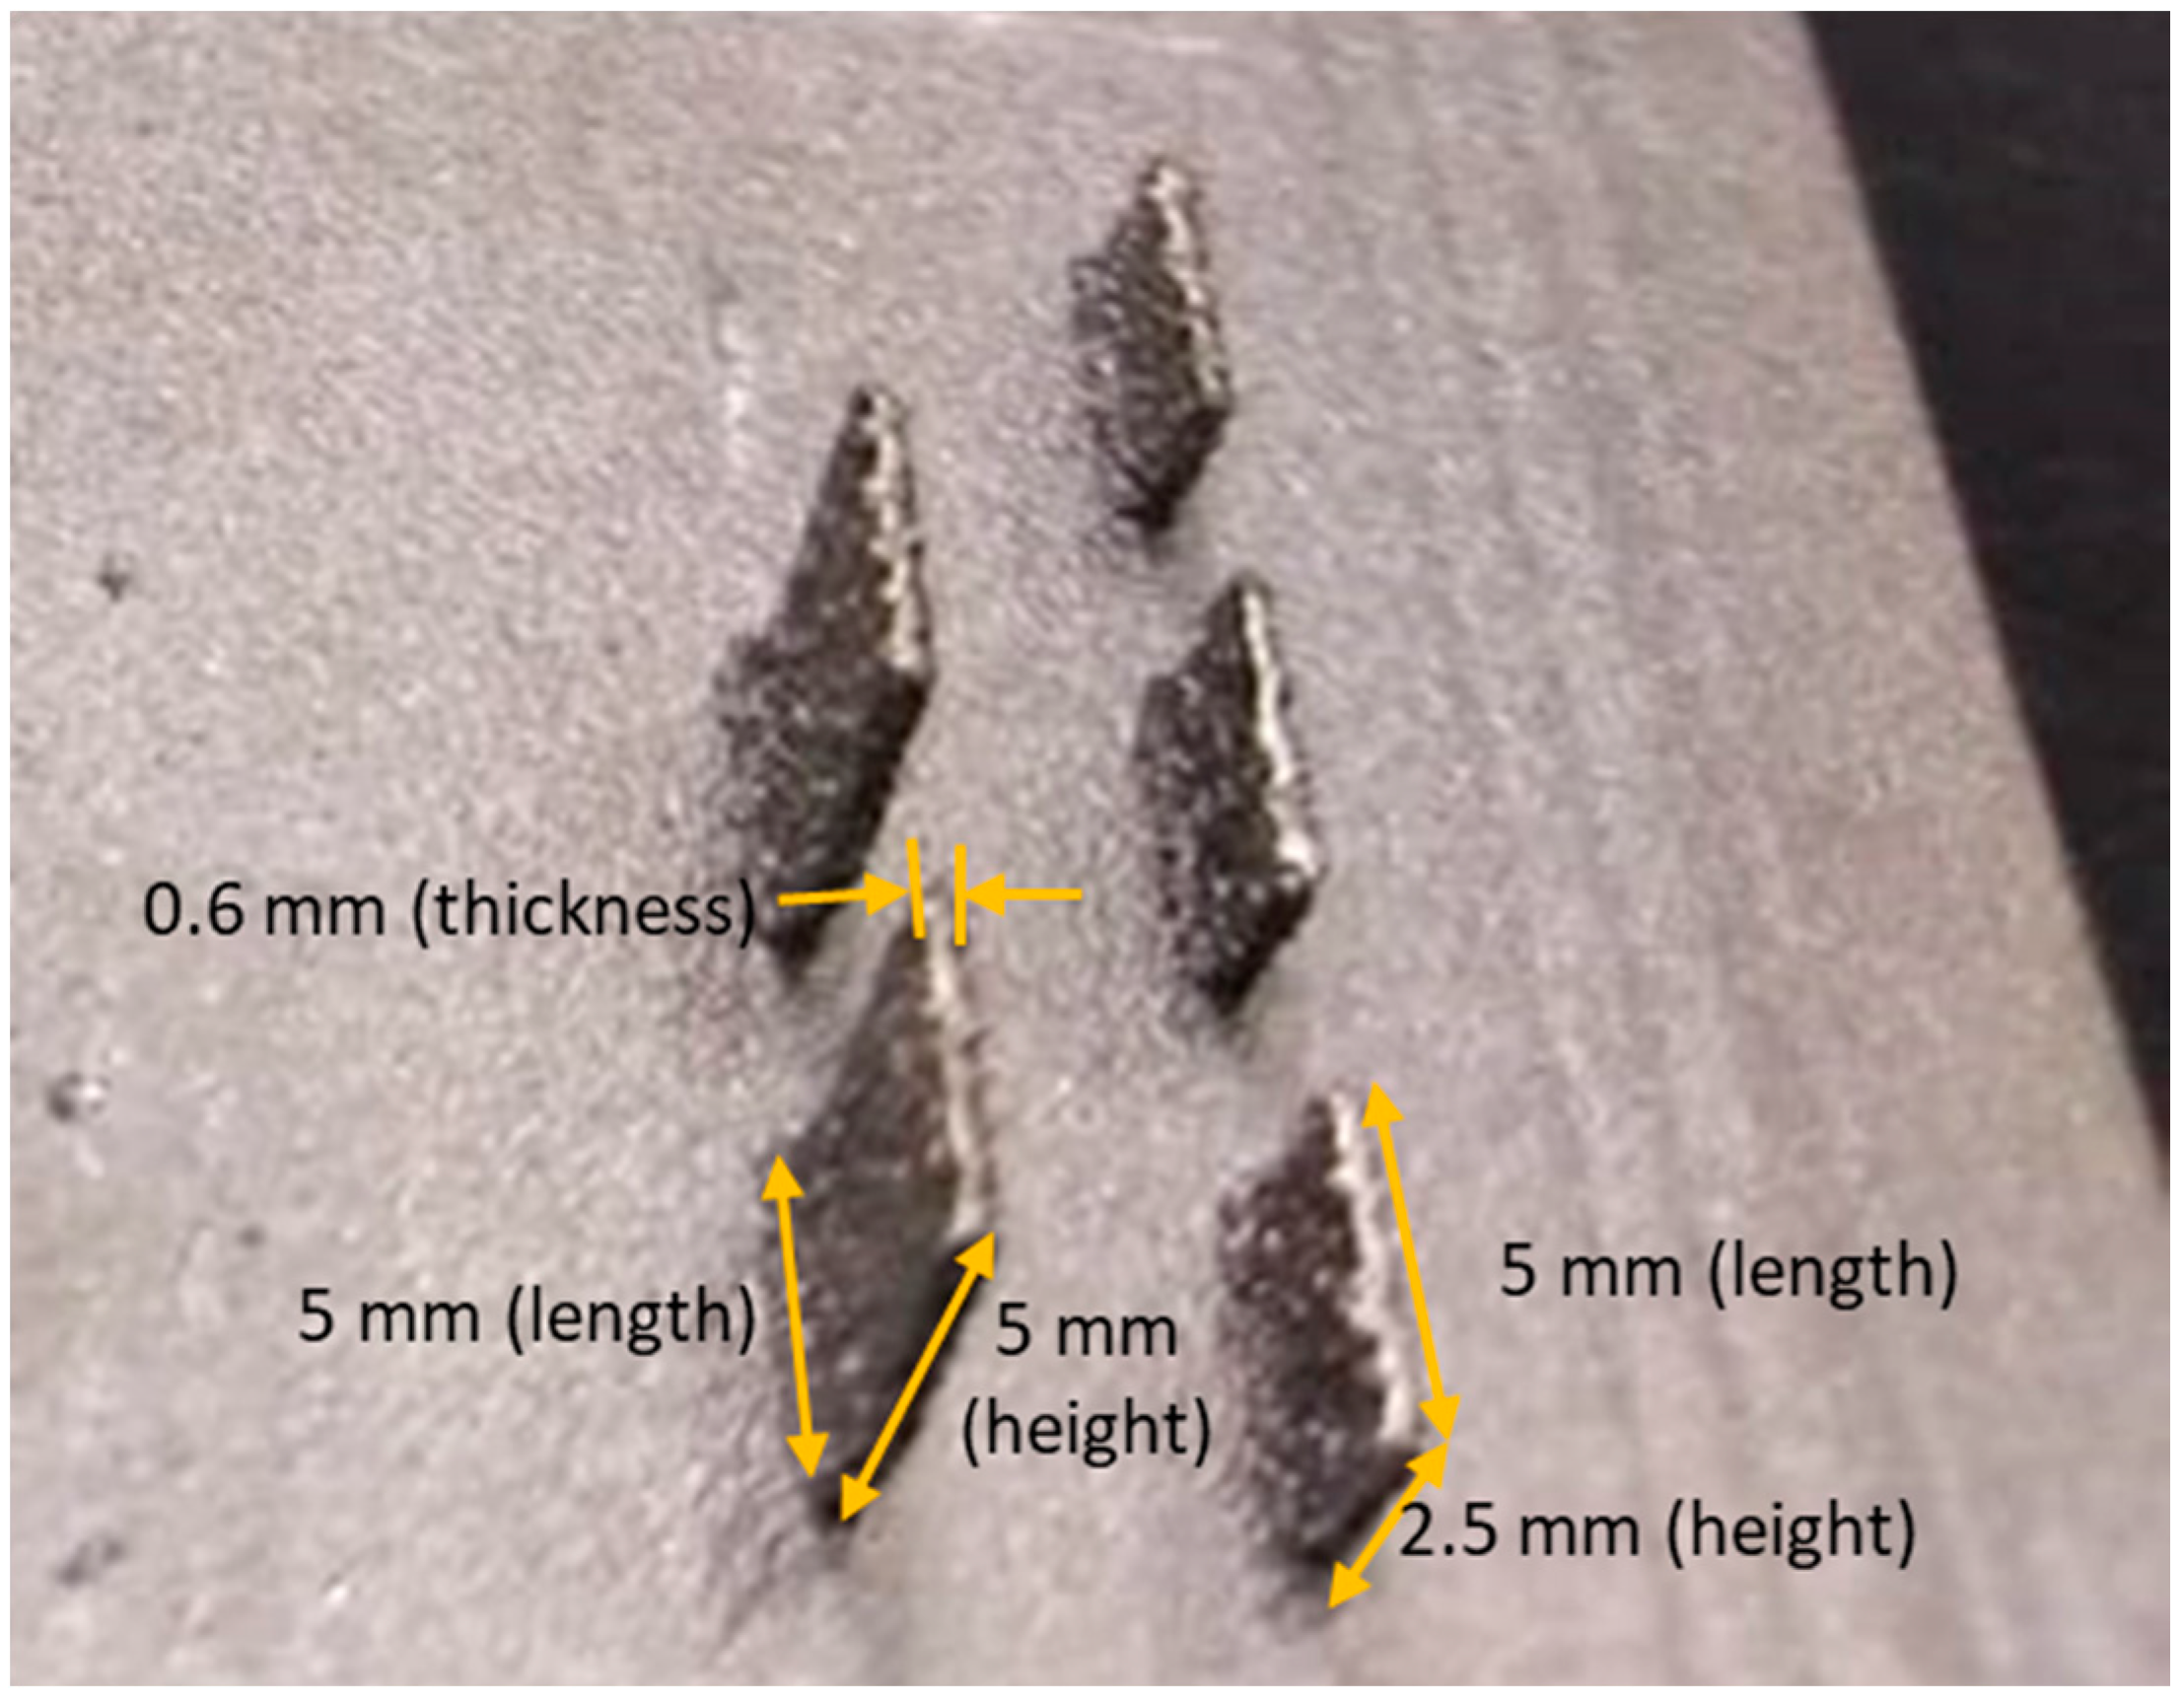
2.5. Fabrication of the Thin-Walled EBM Parts

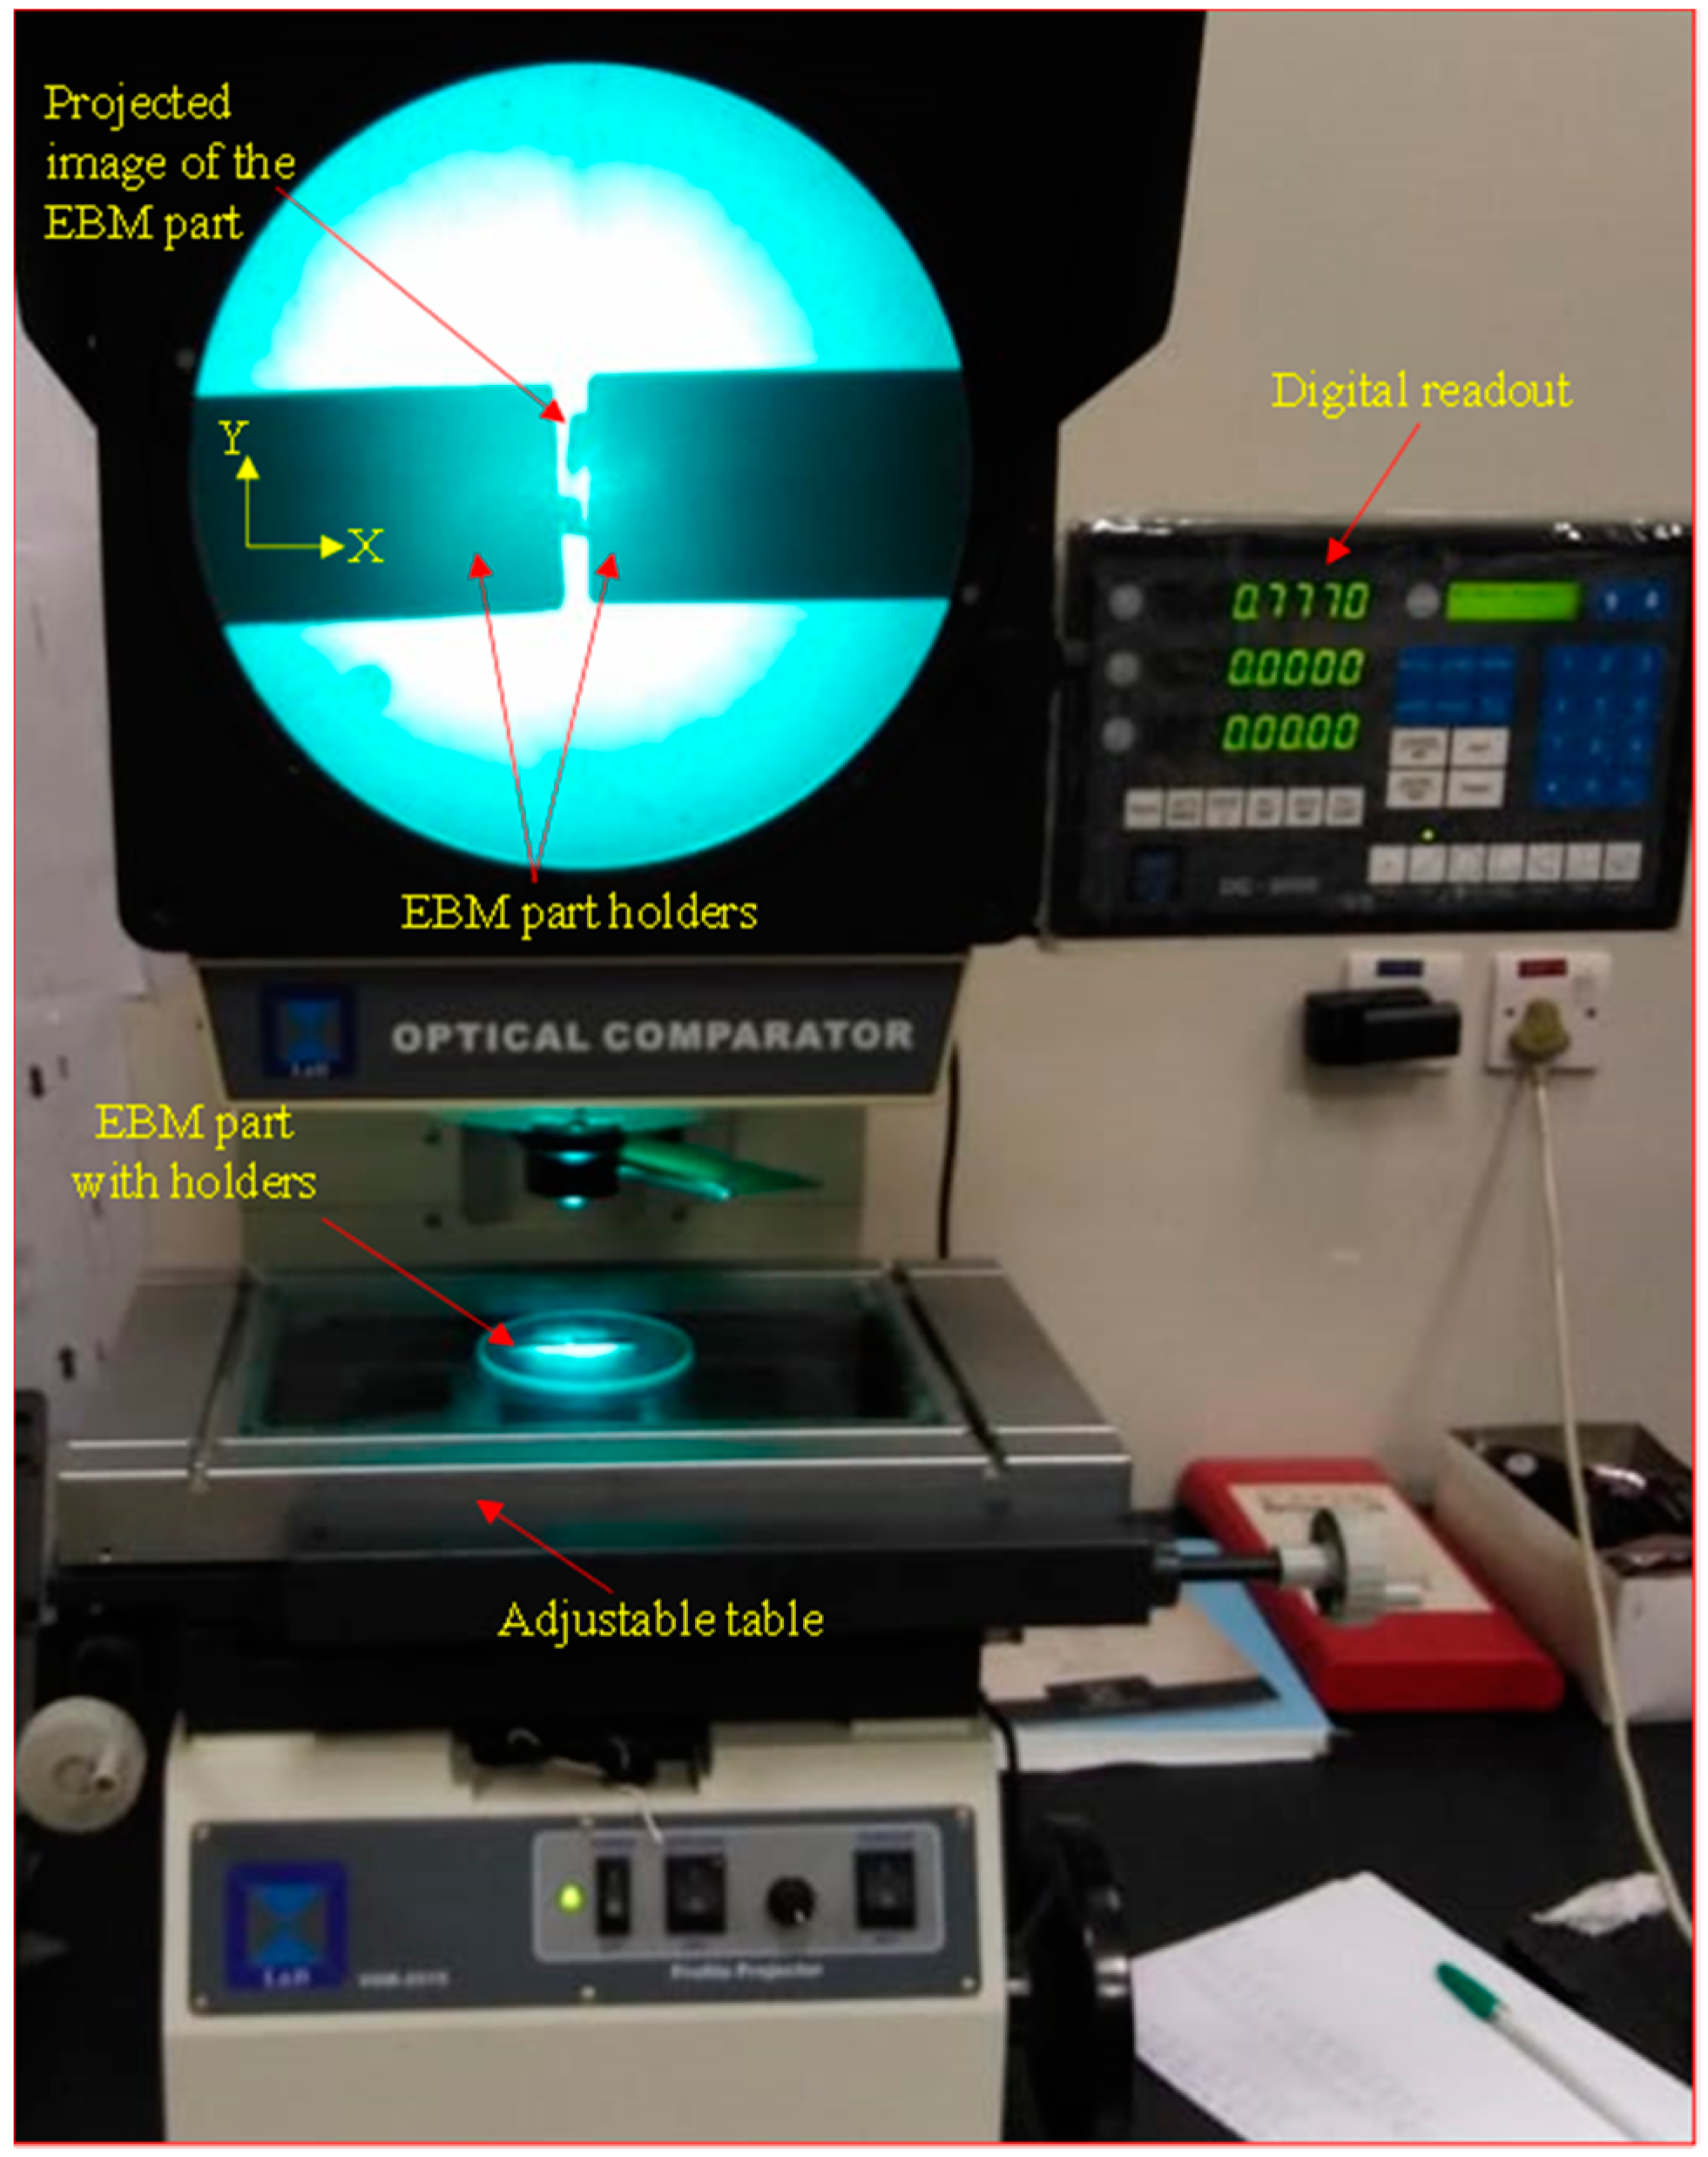
To validate the FE model results, thin-walled Ti-6Al-4V parts were produced via the electron beam melting machine from ARCAM A2 machine (ARCAM AB, Mölndal, Sweden). The particle size of the Ti-6Al-4V powder was between 10 µm and 50 µm in which the particle diameter of 37 µm occupies the highest proportion, and the layer thickness of 50 µm was used [30]. The thickness of the thin-walled parts was set at 0.6 mm, and the length of the parts was set as 5 mm. Two types of thin-walled parts were produced; one with a height of 5 mm (100 EBM layers), and second with the height of the 2.5 mm (50 EBM layers). The layout of the thin-walled parts fabricated on the stainless steel base plate is shown in Figure 7. Parts were fabricated by using the ARCAM AB recommended process parameters, as listed in Table 4. It should be noted that the 0.6 mm thickness is the minimum width of the parts that can be produced with the selected Ti-6Al-4V powder using the ARCAM AB recommended process parameters (see Table 4). A profile projector was used to measure the distortion in the thin-walled parts, as shown in Figure 8. The heights of the EBM parts were more than the heights of the parts simulated in the FE model due to the size constraints of the distortion measuring equipment (profile projector). The distortion in the bigger height parts can be measured more conveniently and reliably as compared to the small height parts, i.e., 0.75 mm as produced in simulations due to computational constraints.
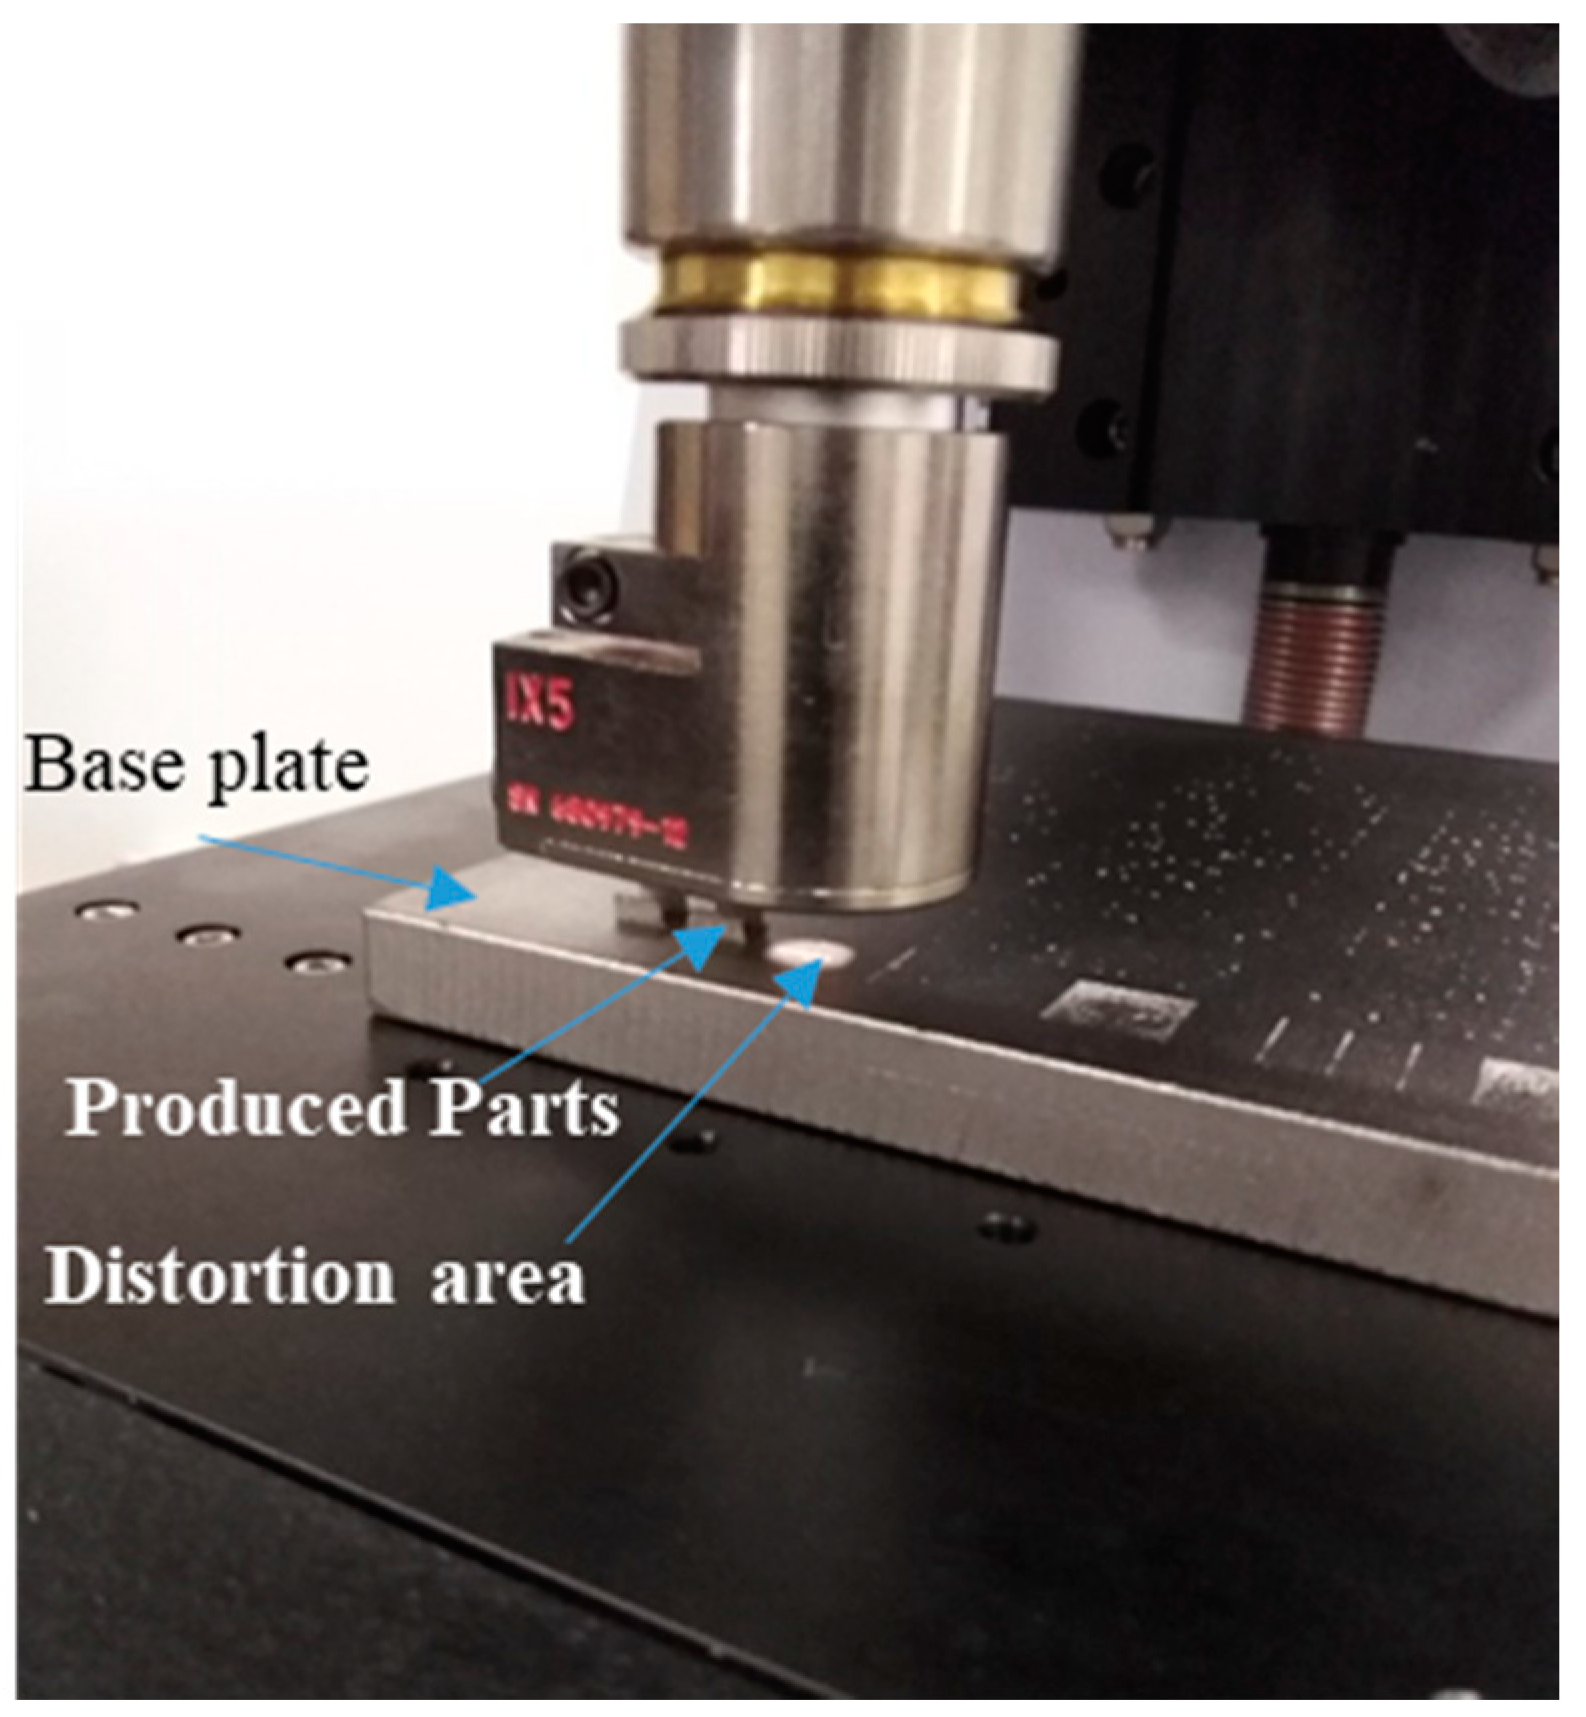
A white light interferometer based 3D profilometer Contour GTK from Bruker (Tucson, AZ, USA) was used to measure the distortion profile on the base plate after the removal of the thin-walled parts, as shown in Figure 9. A 5× interferometer lens with a fixed field of view 2.2 mm × 1.7 mm was used to capture the distortion profile on the base plate.
Furthermore, the microstructures of the thinned walled parts were also revealed on the side faces (0.6 mm thickness side). The samples were first ground with SiC papers P180, P300, P600, P800, P1000, and P1500 and then polished with Al2O3 suspension followed by etching with Kroll’s agent. The microstructures were obtained primarily to link the microstructural variations of the alpha and beta phases along the thin side faces with the recorded temperature distributions from the FE simulations. This is because the percentage of the alpha and beta phases and the size of these phases are significantly affected by the temperature input. The developed FE model provided the opportunity to study the temperature–time history, and to link it with the achieved microstructures.

3. Results and Discussion

The results and discussion are arranged as follows: temperature field, residual stresses, thermal distortion, experimental validation, and microstructure evolution.

3.1. Temperature Field

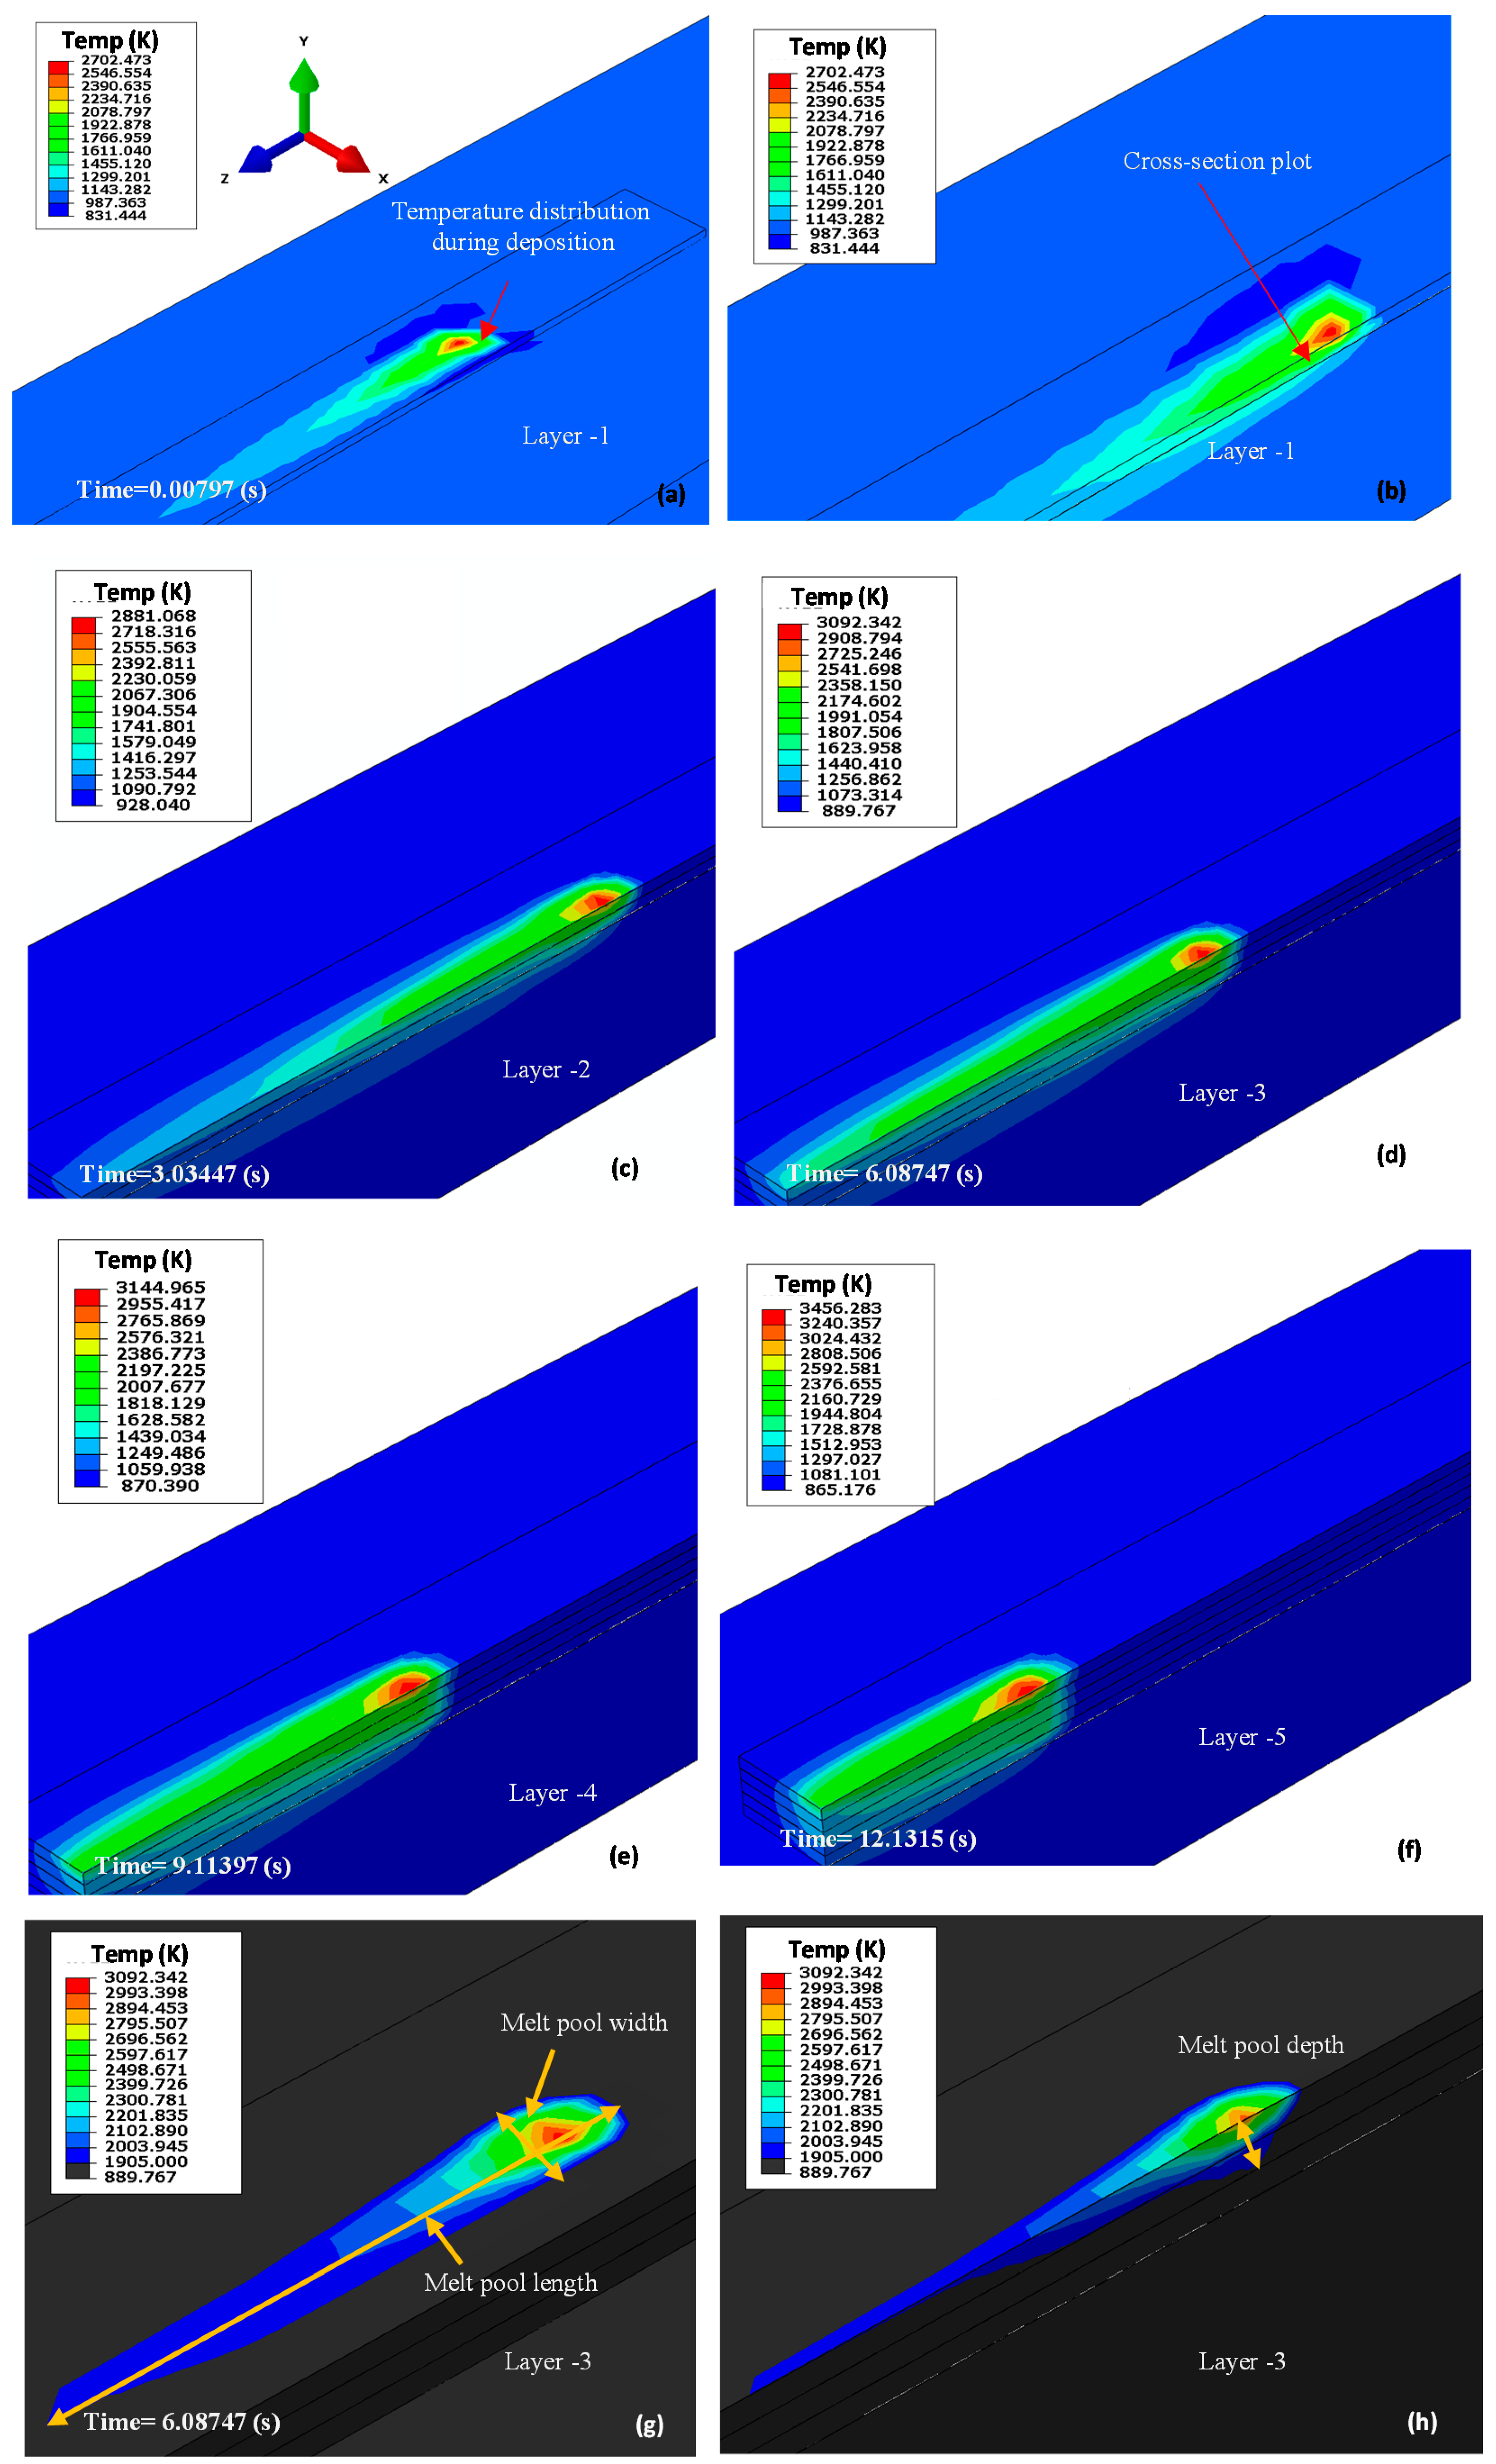
Figure 10 shows the contour and cross-section plots of the temperature field of the melt pool and surrounding areas at different times. The cross-sections aim to show the effect of heat from the electron beam on the EBM layers and base plate. Figure 10 also shows that the peak temperature during the process in the first layer was 2702 K, while the highest temperature during the layer-5 deposition was 3456 K. It can be concluded that the temperature increases from one layer to another due to heat accumulation between layers as the process proceeds. It should be noted that, in some regions in the model, the lowest temperature was below the preheating temperature because the radiation boundary conditions were defined on all the external surfaces of the base plate and the deposited layers. Furthermore, the preheating temperature was defined as an initial temperature, which was subject to change as the model computes. Therefore, in some regions in the model, the temperature goes below the initial preheat temperature due to the radiation effect. Also, in some regions, the temperature goes higher due to the heat input from the electron beam. The same methodology was adopted in other studies as well reported by Cheng, Lu, and Chou [31,32]. They showed that after the cooling step, the temperature goes below the preheating temperature due to the radiation effect.
To show the dimensions of the melt pool, Figure 10g,h are presented with the lower limit of the temperature as the melting point of the Ti-6Al-4V, so that only the melt pool would be visible. Figure 10g,h show the contour and cross-sectional views of the melt pool size and shape as the beam traveled during the deposition of layers at different times. The melt pool shape and size depend on the material properties and the EBM parameters. The depth of the melt pool can be influenced by the movement of temperature-dependent fluid within the melt pool [33]. However, the size and shape of a melt pool plays a crucial role in the determination of the microstructure in manufactured metals [33].

3.1.1. Temperature Gradient

The temperature gradients were analyzed along the beam trailing direction (Z-direction) and below the beam center point (Y-direction), as shown in Figure 11a,c. The Z-direction nodes were along the top surface of the layers, while the Y-direction nodes were along the height of the deposited layers. Figure 11b presents the thermal gradients along the Z-axis, which have reached a maximum temperature of 3030 K from the focused electron beam. The temperature gradually decreases along the Z-axis to the preheating temperature. Figure 11d shows the temperature curve for thermal gradients along the Y-axis (height) of the selected side cross-section view layers, which have reached a maximum temperature of 2716 K from the focused electron beam. The temperature gradually decreases along the Y direction. Since the electron beam melting process is a hot process, during which the powder is kept at high temperatures throughout the entire melting process. The melting of the electron beam can easily reach temperatures 2000 K and more to melt the materials such as titanium alloys. The melting point for titanium alloys is 1900 K [34]. Figure 11 shows that the temperature is high enough to melt the selected material that is difficult to dissolve through traditional technologies.

3.1.2. Model Validation

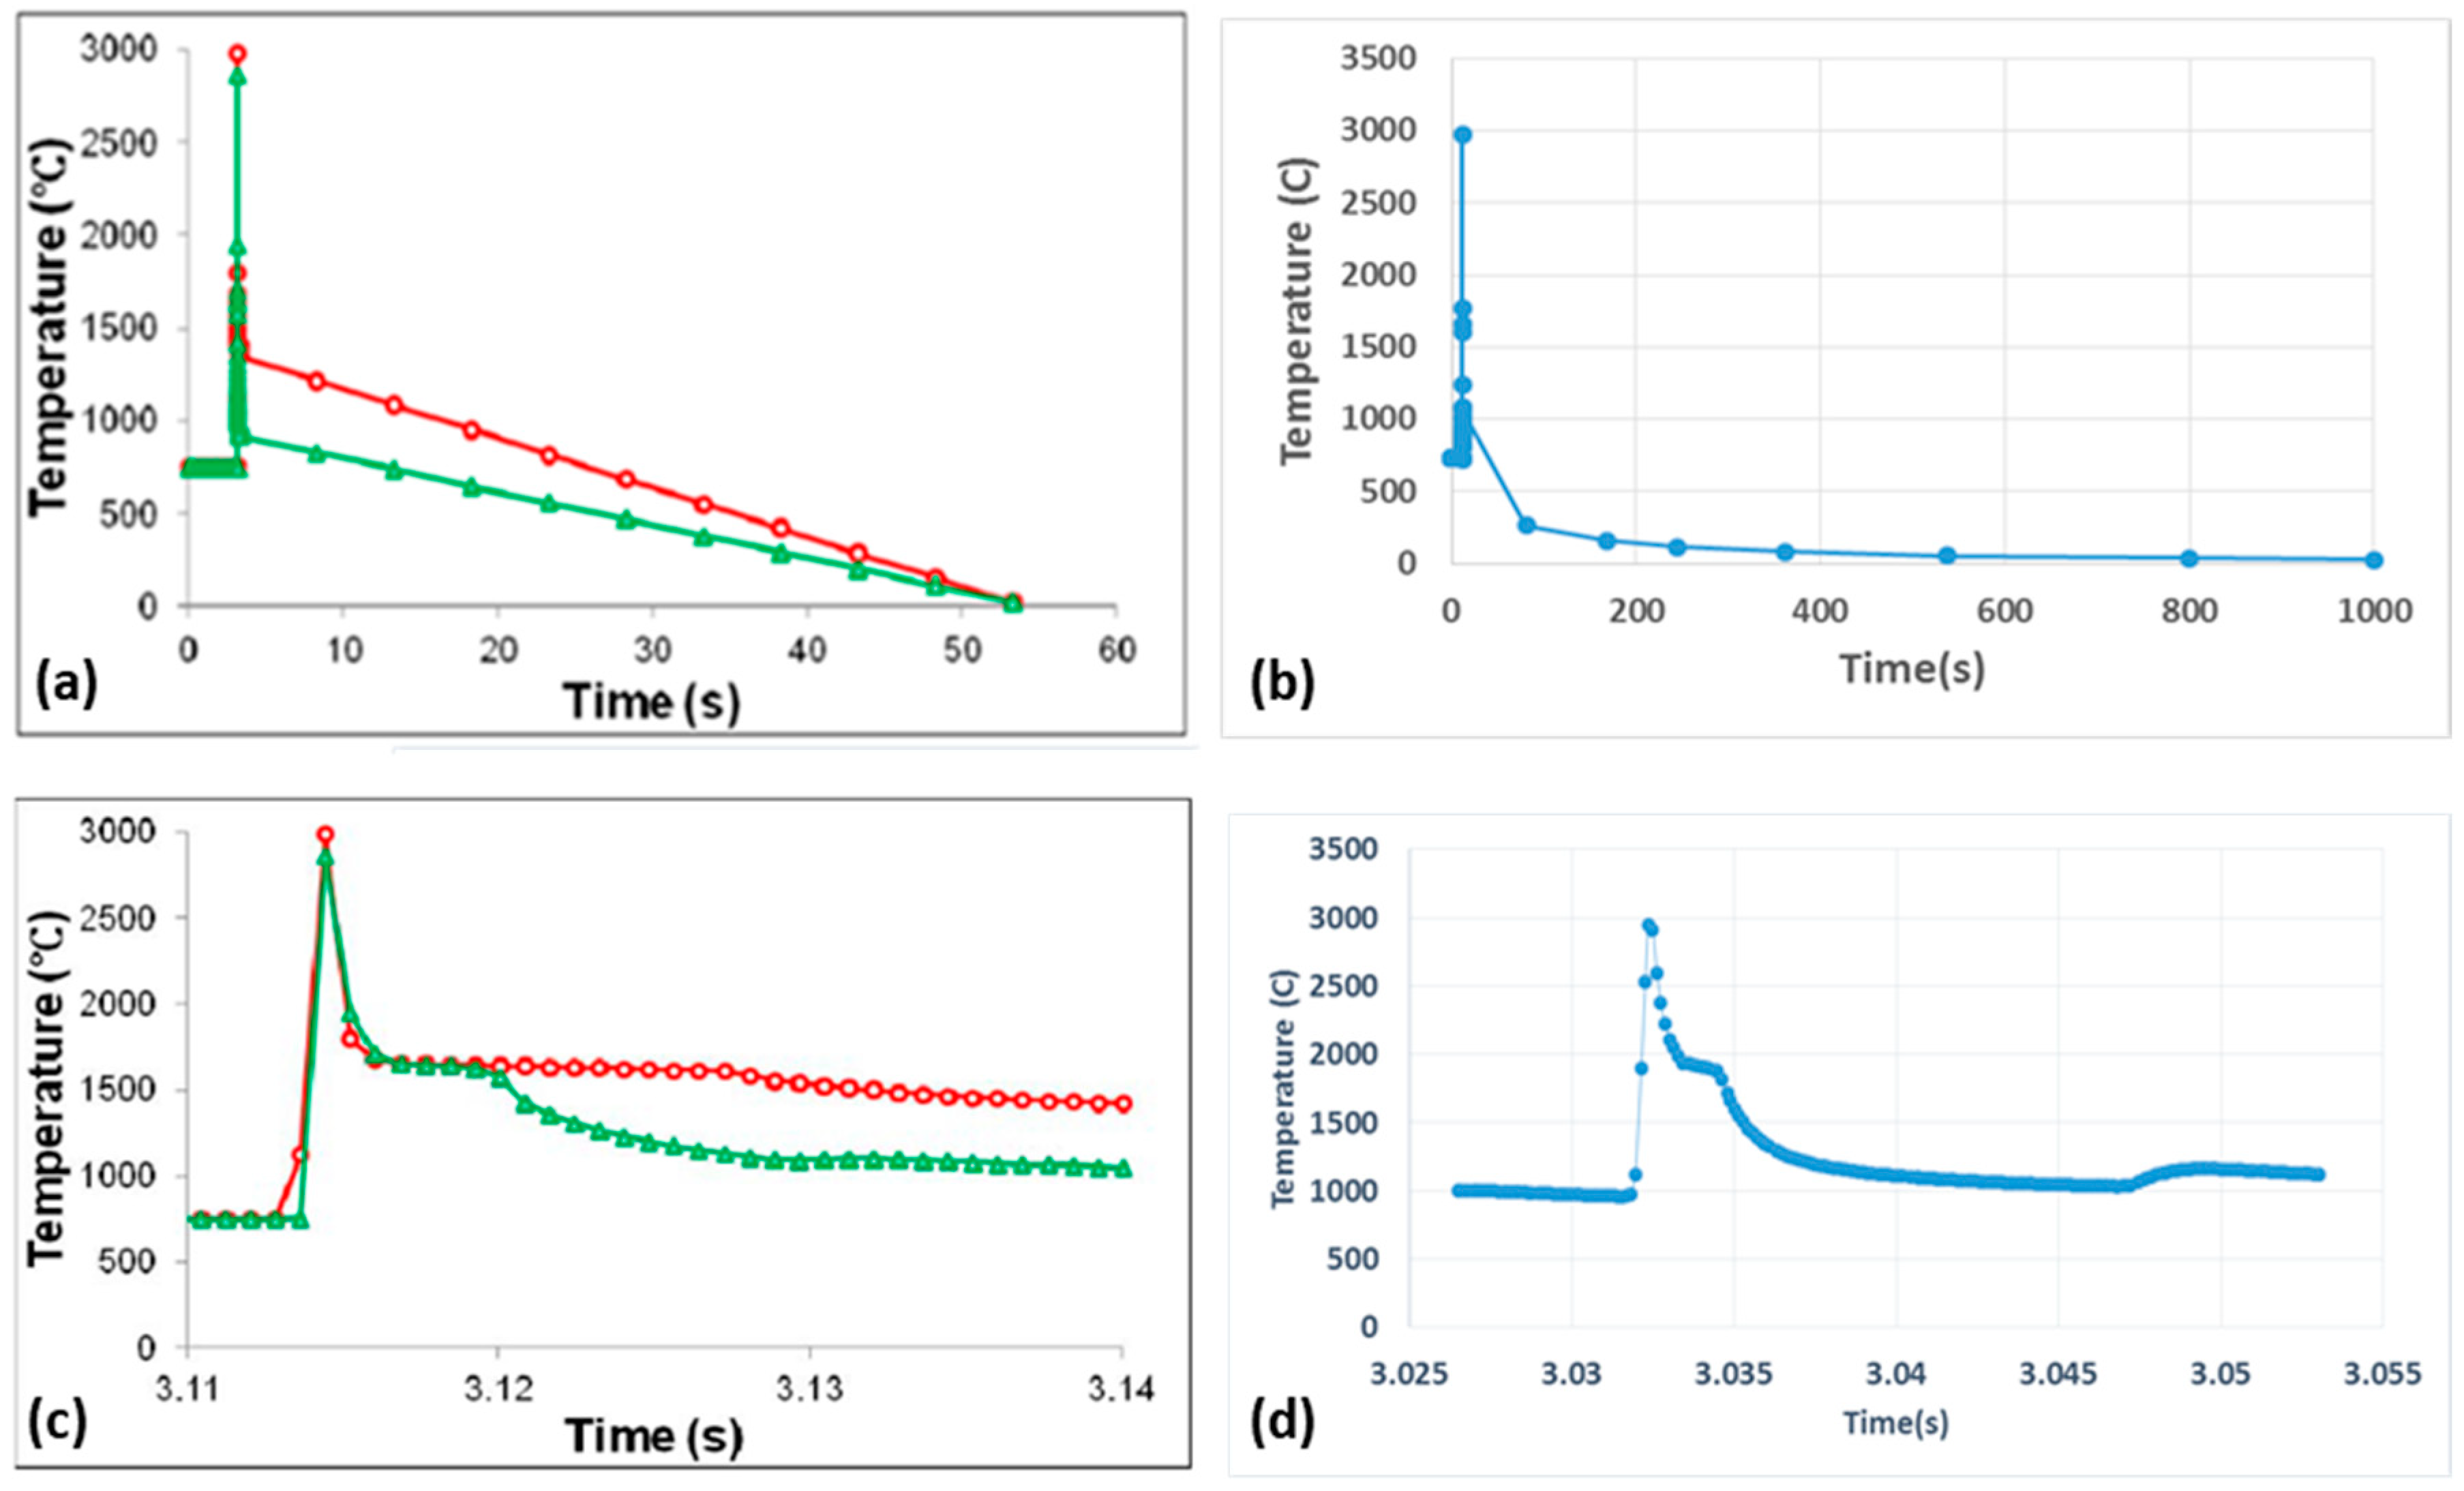
The results obtained from the EBM process model have been validated by comparing them with the results from the reported studies. Figure 12 presents the simulation results of temperature history after final cooling from Shen and Chou [14] and the current model simulation results on the electron beam melting process (ARCAM AB) with the same parameters for both models. Figure 12 shows that the range of the temperature gradient during deposition is almost the same. The maximum temperature (Shen & Chou) [14] is 3007 °C, and 3015 °C for the simulated result. The temperature dropped to room temperature (25 °C) after final cooling on both models. The temperature rose from 750 °C (preheating temperature) to 3015 °C in 0.3 s and dropped again to 750 °C in about 3 s.
Figure 13 shows a comparison of the maximum temperature for the electron beam melting process when producing thin-wall parts. The current model results are compared with the experimental and simulation results reported by Shen and Chou [14]. The histogram shows that the maximum temperature for the current model and experimental results (Shen and Chou) are almost the same, with a minimal difference of around 170 °C. It can also be seen from Figure 13 that the maximum temperatures for the experimental, simulation (Shen and Chou), and current simulated results are 2800 °C, 2950 °C, and 2970 °C, respectively.

3.2. Residual Stresses

The residual stress is the stress resident inside a structure after all applied forces have been removed. The magnitude and nature of residual stresses occurring in the final deposits affect the integrity of the whole structure. In general, compressive residual stresses are beneficial because they increase the load resistance and prevent the growth of cracks. However, tensile residual stresses are disadvantageous because they reduce the load resistance and accelerate the growth of cracks.
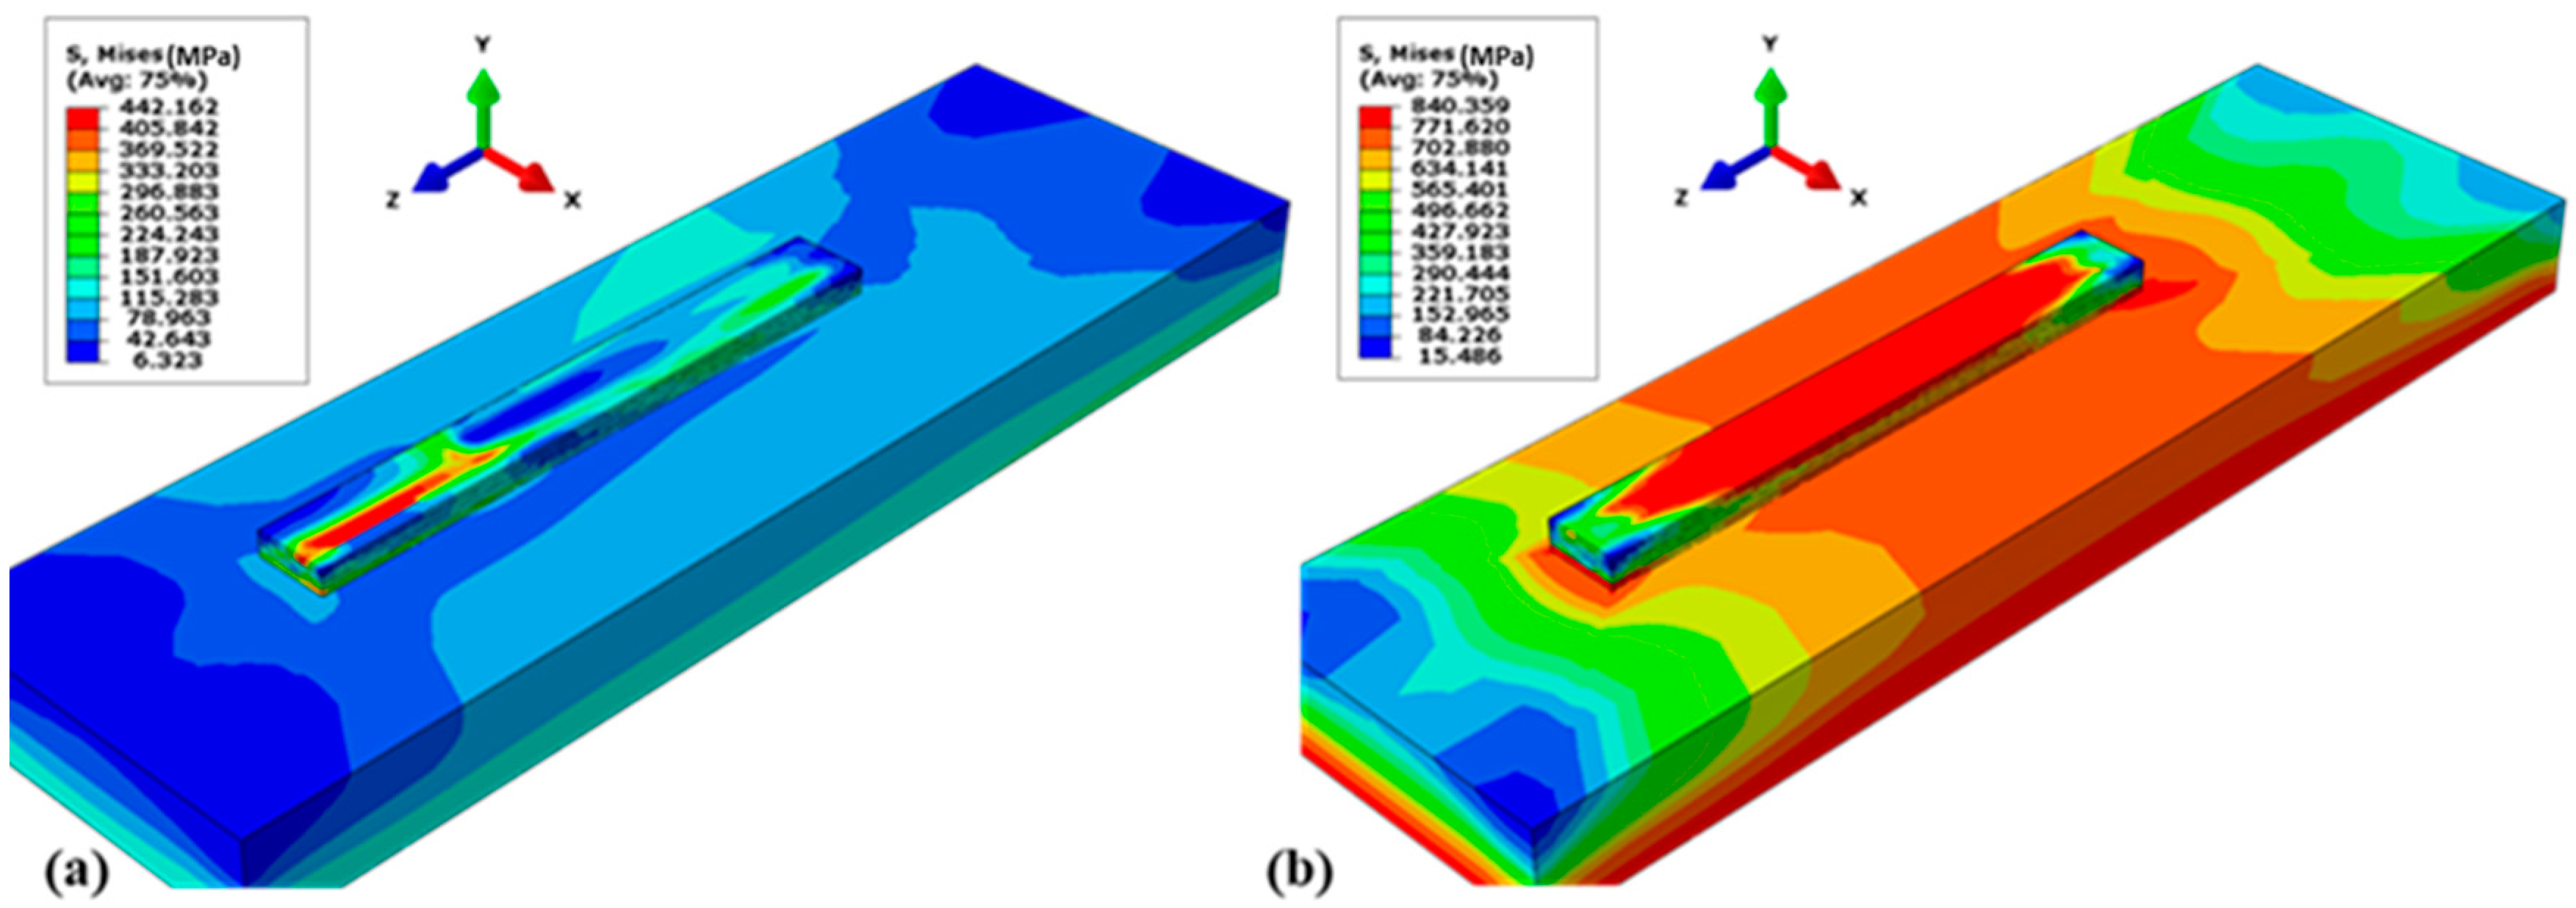
The von Mises stress distribution in the electron beam melting process of the five-layer model after the final cooling stage shows that the maximum stress occurs at the end of the electron beam scanning location and has a magnitude of about 840 MPa. After the EBM process started, the von Mises stress rapidly increased to 442 MPa. During the deposition process, it maintained a value between 333 MPa and 442 MPa, and after final cooling, it rose to 840 MPa, as shown in Figure 14b.
The residual stress distribution during deposition is shown in Figure 14a. It shows the stresses along with the three axes. Figure 14a,b indicate that the residual stresses in the lower part were mostly tensile stress due to the cooling phase of the molten layers [29]. After deposition, the re-melted base of the deposits began to shrink. This shrinkage was restricted by the underlying material and hence encouraged the tensile stresses.
The components of normal stress along the X-Axis and Z-Axis are stresses along the scan direction, which are indicated as S11 and S33, respectively. S33 are the normal stresses along the beam scan direction along the length of the layers, while the S11 are the normal stresses along the beam scan direction along the width of the layers. In contrast, S22 defines the normal residual stresses along the beam penetration direction (Y-axis). Such stress components reflect the highest possible magnitude of the residual stress at the given point being selected. Von mises stress and normal stresses S11, S22, and S33 along three spatial directions are shown in Figure 15. The residual stress distribution after the final cooling step is shown in Figure 15a–d (a cross-sectional view is used to show the internal residual stress). The maximum tensile stress of 592 MPa and the maximum compressive stress of 353 MPa can be observed in Figure 15. Although these residual stress values are lower than the yield point of the Ti-6Al-4V, still such EBM parameters should be used that the residual stresses in the produced parts should be minimum for better and safe performance [14]. The FE model allows us to explore the EBM parameters, which can lead to lower residual stresses, as discussed later in Section 4.

3.2.1. Instantaneous Stress

The instantaneous von Mises stress within the deposits during the electron beam melting process is shown in Figure 16. As the EBM process started, the von Mises stress rapidly increased to 820 MPa. The maximum von Mises stress existed at the end of the electron beam scanning location with a value of around 830 MPa. The von Mises stress after the deposition process had a greater magnitude than that during the deposition process.
Three paths are drawn on the top surface of the deposits to present the average distribution and magnitude of residual stresses in part. Along the z-direction, the middle part of the top surface was compressed with a stress magnitude of approximately 700 MPa, while at the edges, it was lower, as shown in Figure 17. The trend of residual stress on each path was relatively uniform along the longitudinal direction in the left and right sides. For the normal stresses along z, tensile stresses with a magnitude of approximately 700 MPa existed near the center part, and residual stresses ranging from 300 to 400 MPa existed at both edges.

3.2.2. Model Results Versus Reported Results

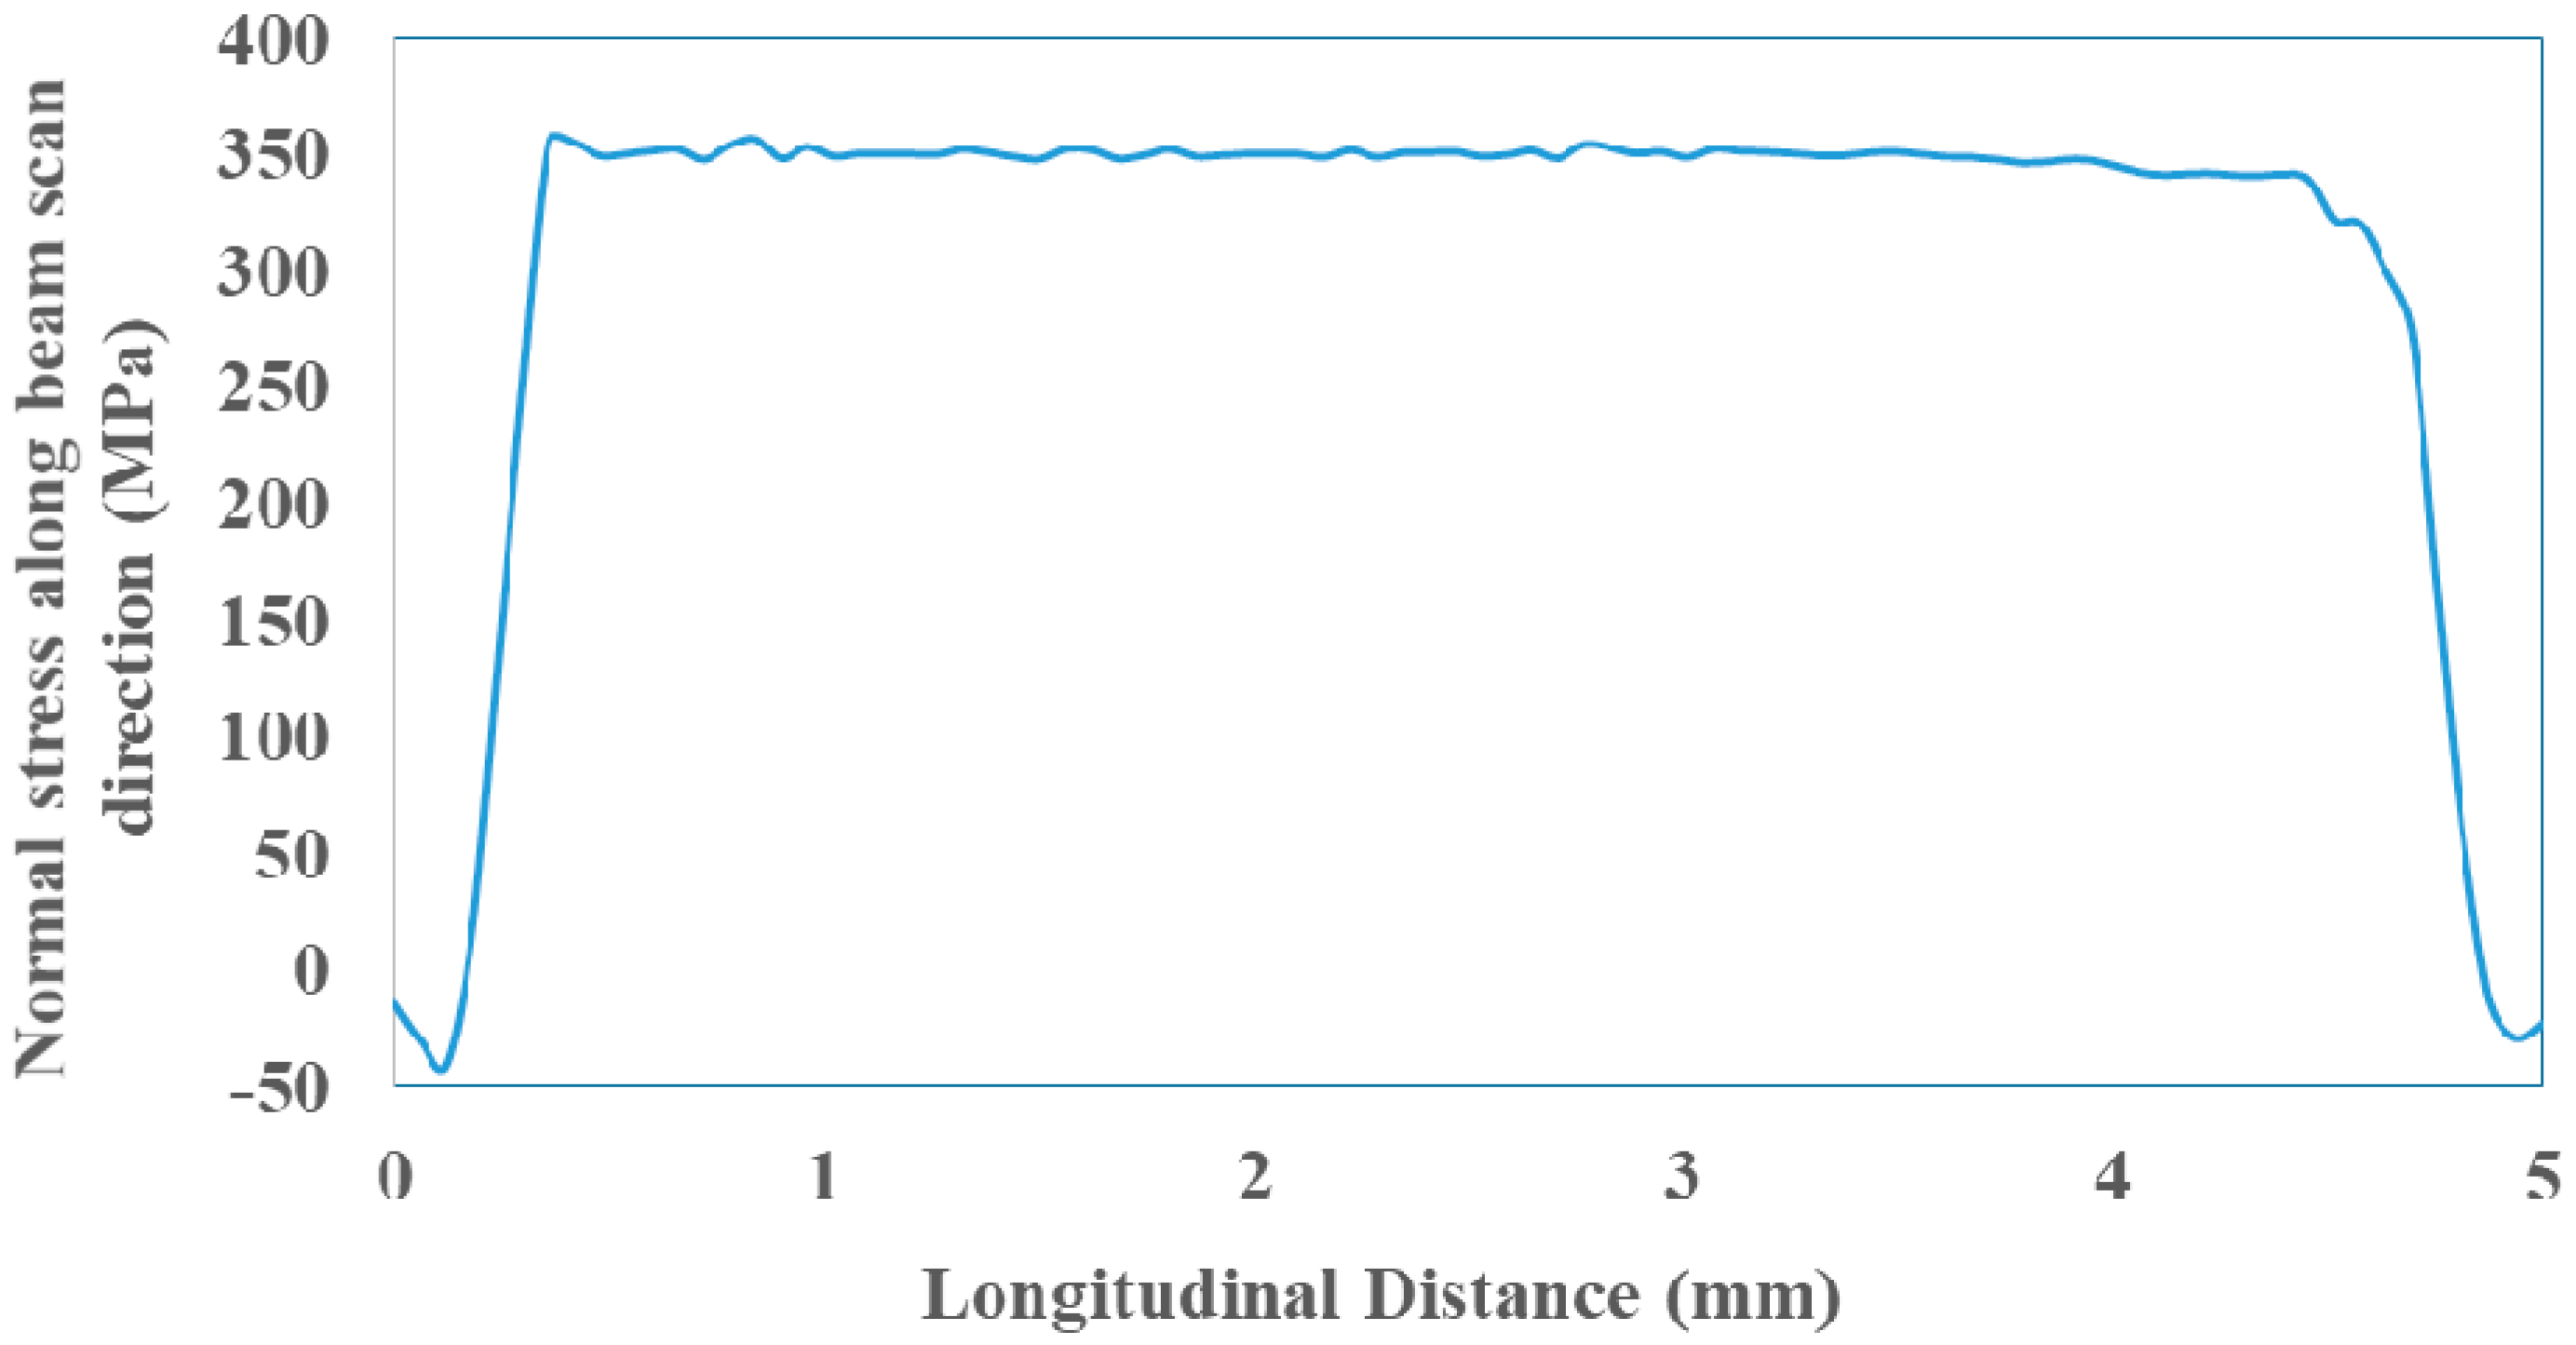
Figure 18 compared the normal stress from the current model after cooling with the results of [15] along the beam scan direction (along the length of the layers). The residual stress levels are approximately the same (5%), with minimal differences due to the location of the path chosen on each model. It can be seen that the maximum residual stress in [15] after the cooling is 350 MPa, which is almost the same (5% error) as simulated in the current model.

3.3. Thermal Distortion

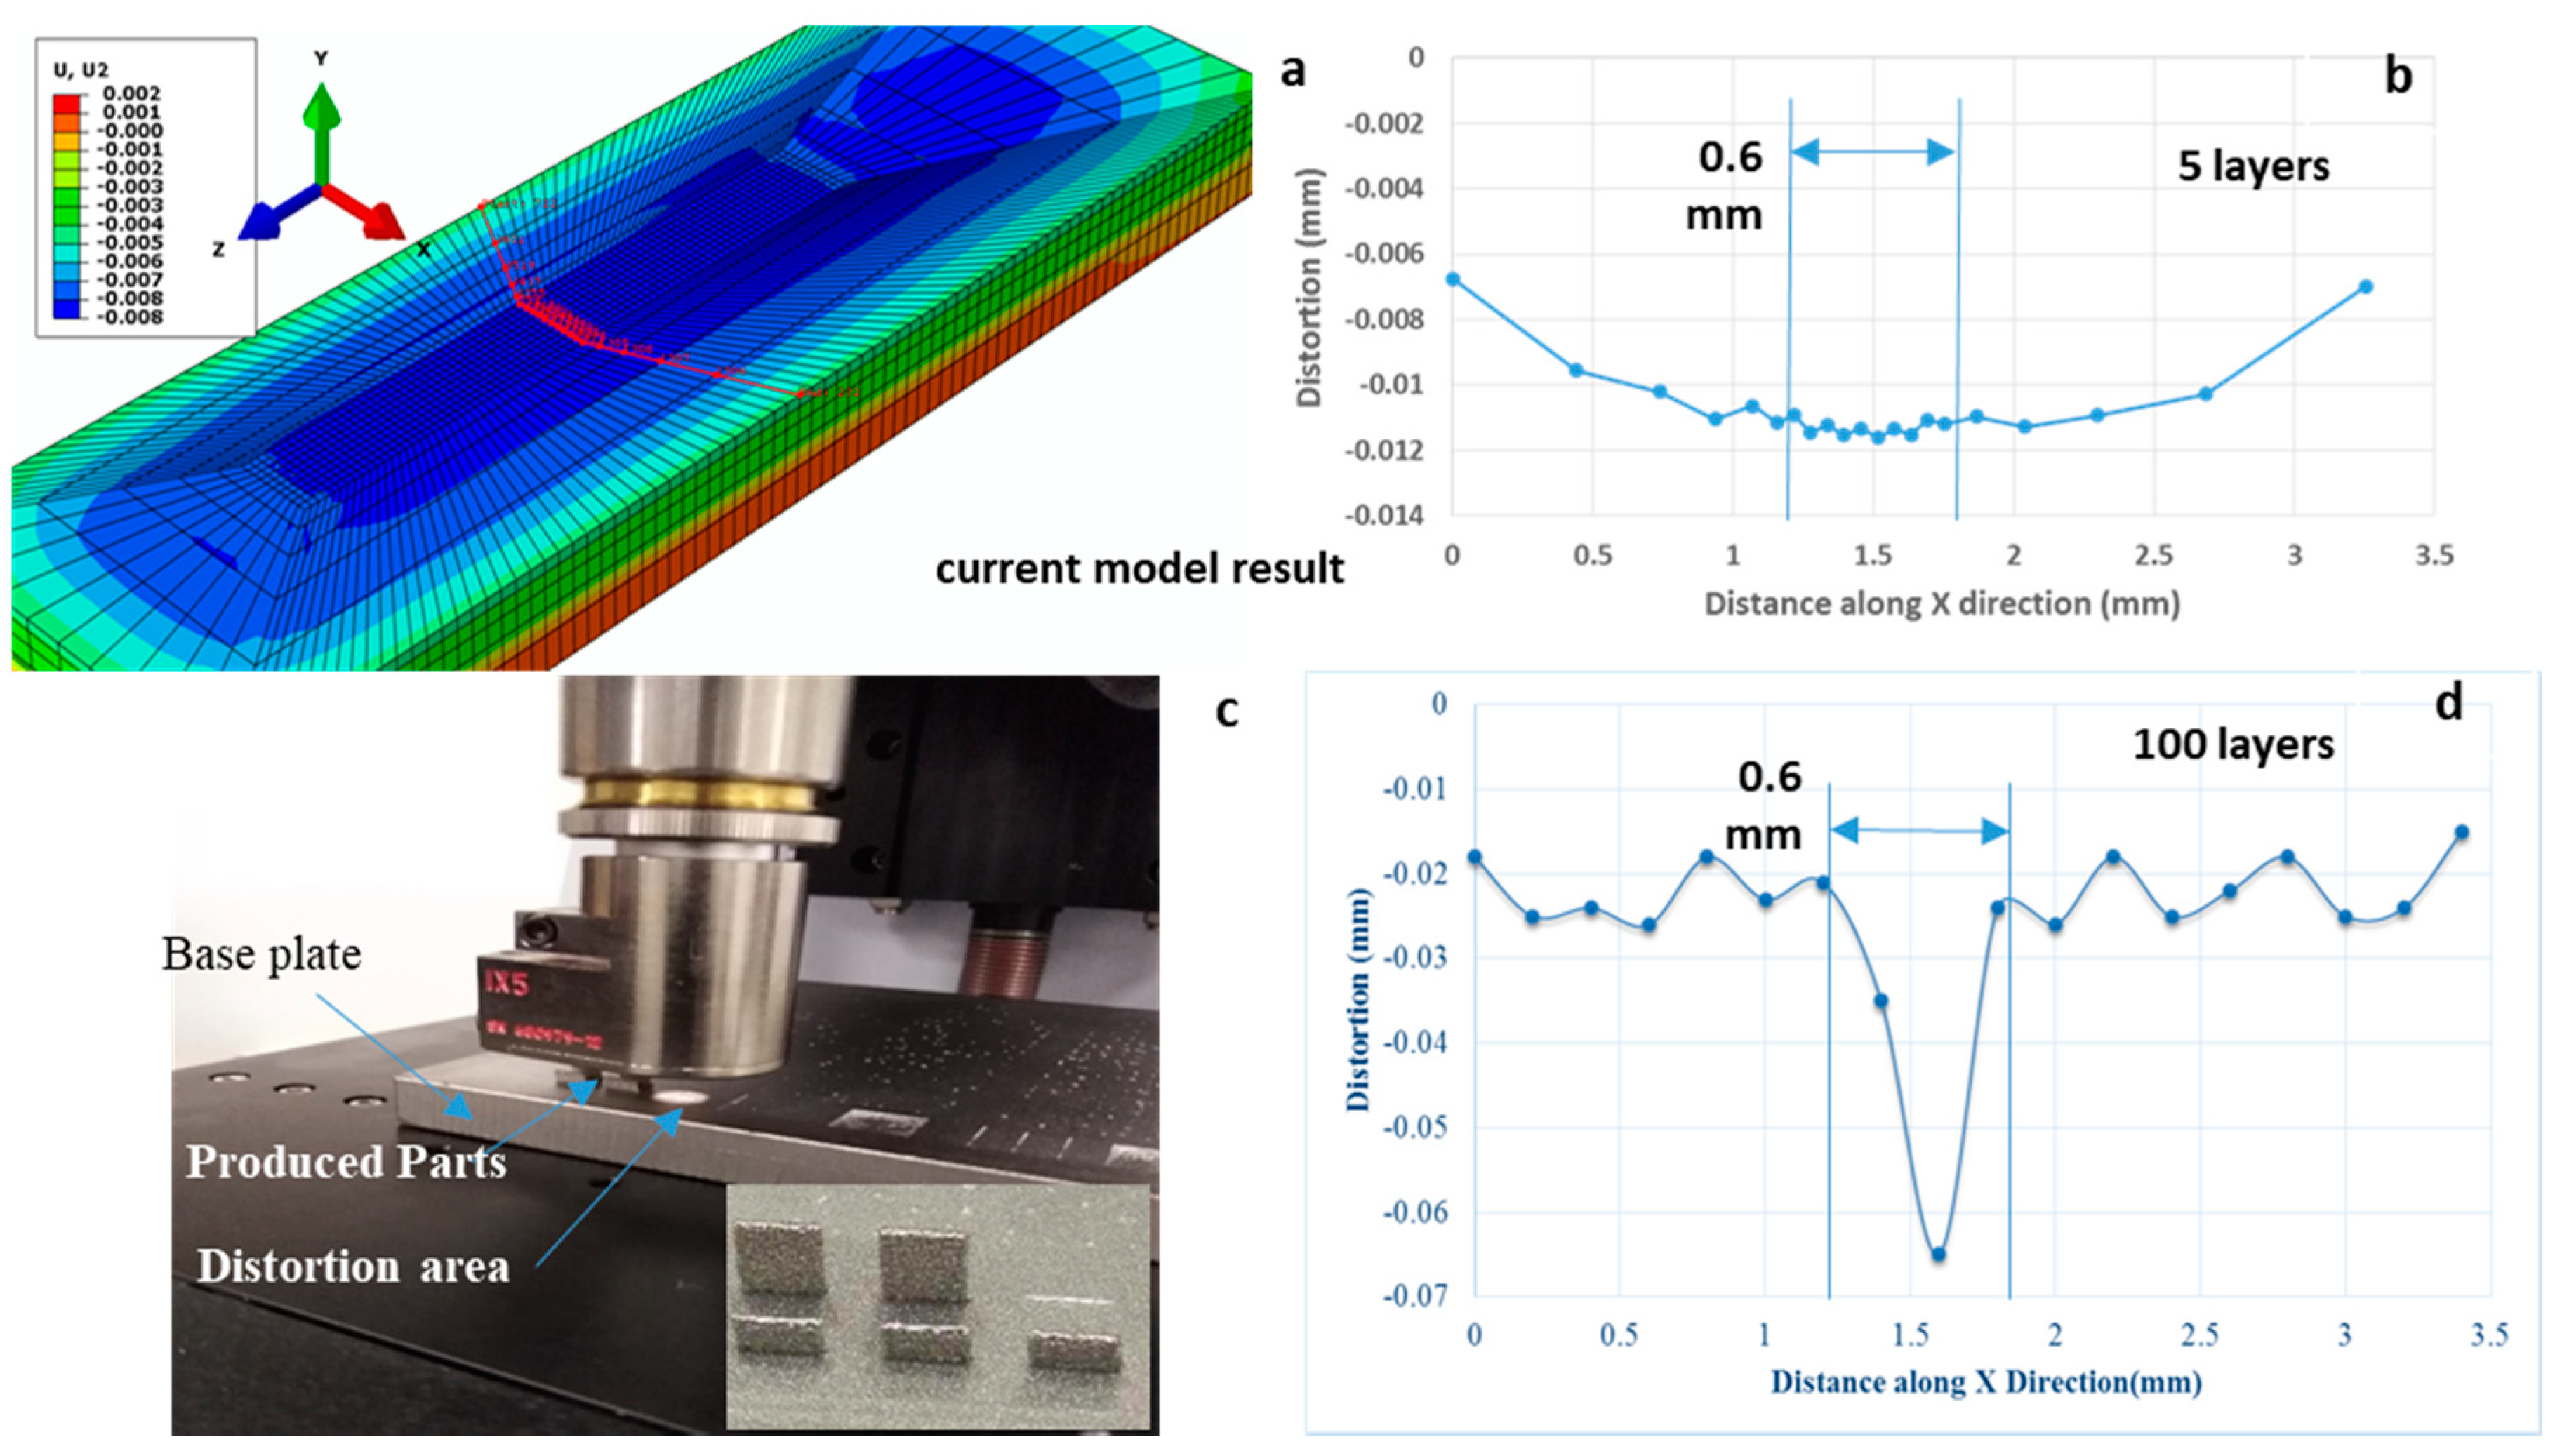
Heating and cooling during the EBM process produce non-uniform thermal expansion, which results in a problematic distribution of residual stresses in the heat-affected zone and unexpected distortion. These residual stresses may increase fatigue and fractures during deposition. Deformation is determined from the dimensional accuracies of the structures. It is therefore very important to predict the behavior of the material after the EBM process, and to study manufacturing parameters, to control deformation and residual stresses. During EBM, the base plate will continuously shrink and expand, leading to a deformed shape. In this research, deformation along the X-direction was the main focus under consideration, and Figure 19a illustrates the base plate deflection during the electron beam melting process. For each deposition layer, the base plate first bent down due to thermal expansion on the top surface and then bent up due to thermal shrinkage during the cooling process. The curve of base plate distortion along the X-axis is shown in Figure 19b. After completely cooling down, the base plate maintained its deformed shape. In Figure 19a–d, it can be concluded that more layers lead to higher distortion in the base plate.

3.4. Experimental Validation

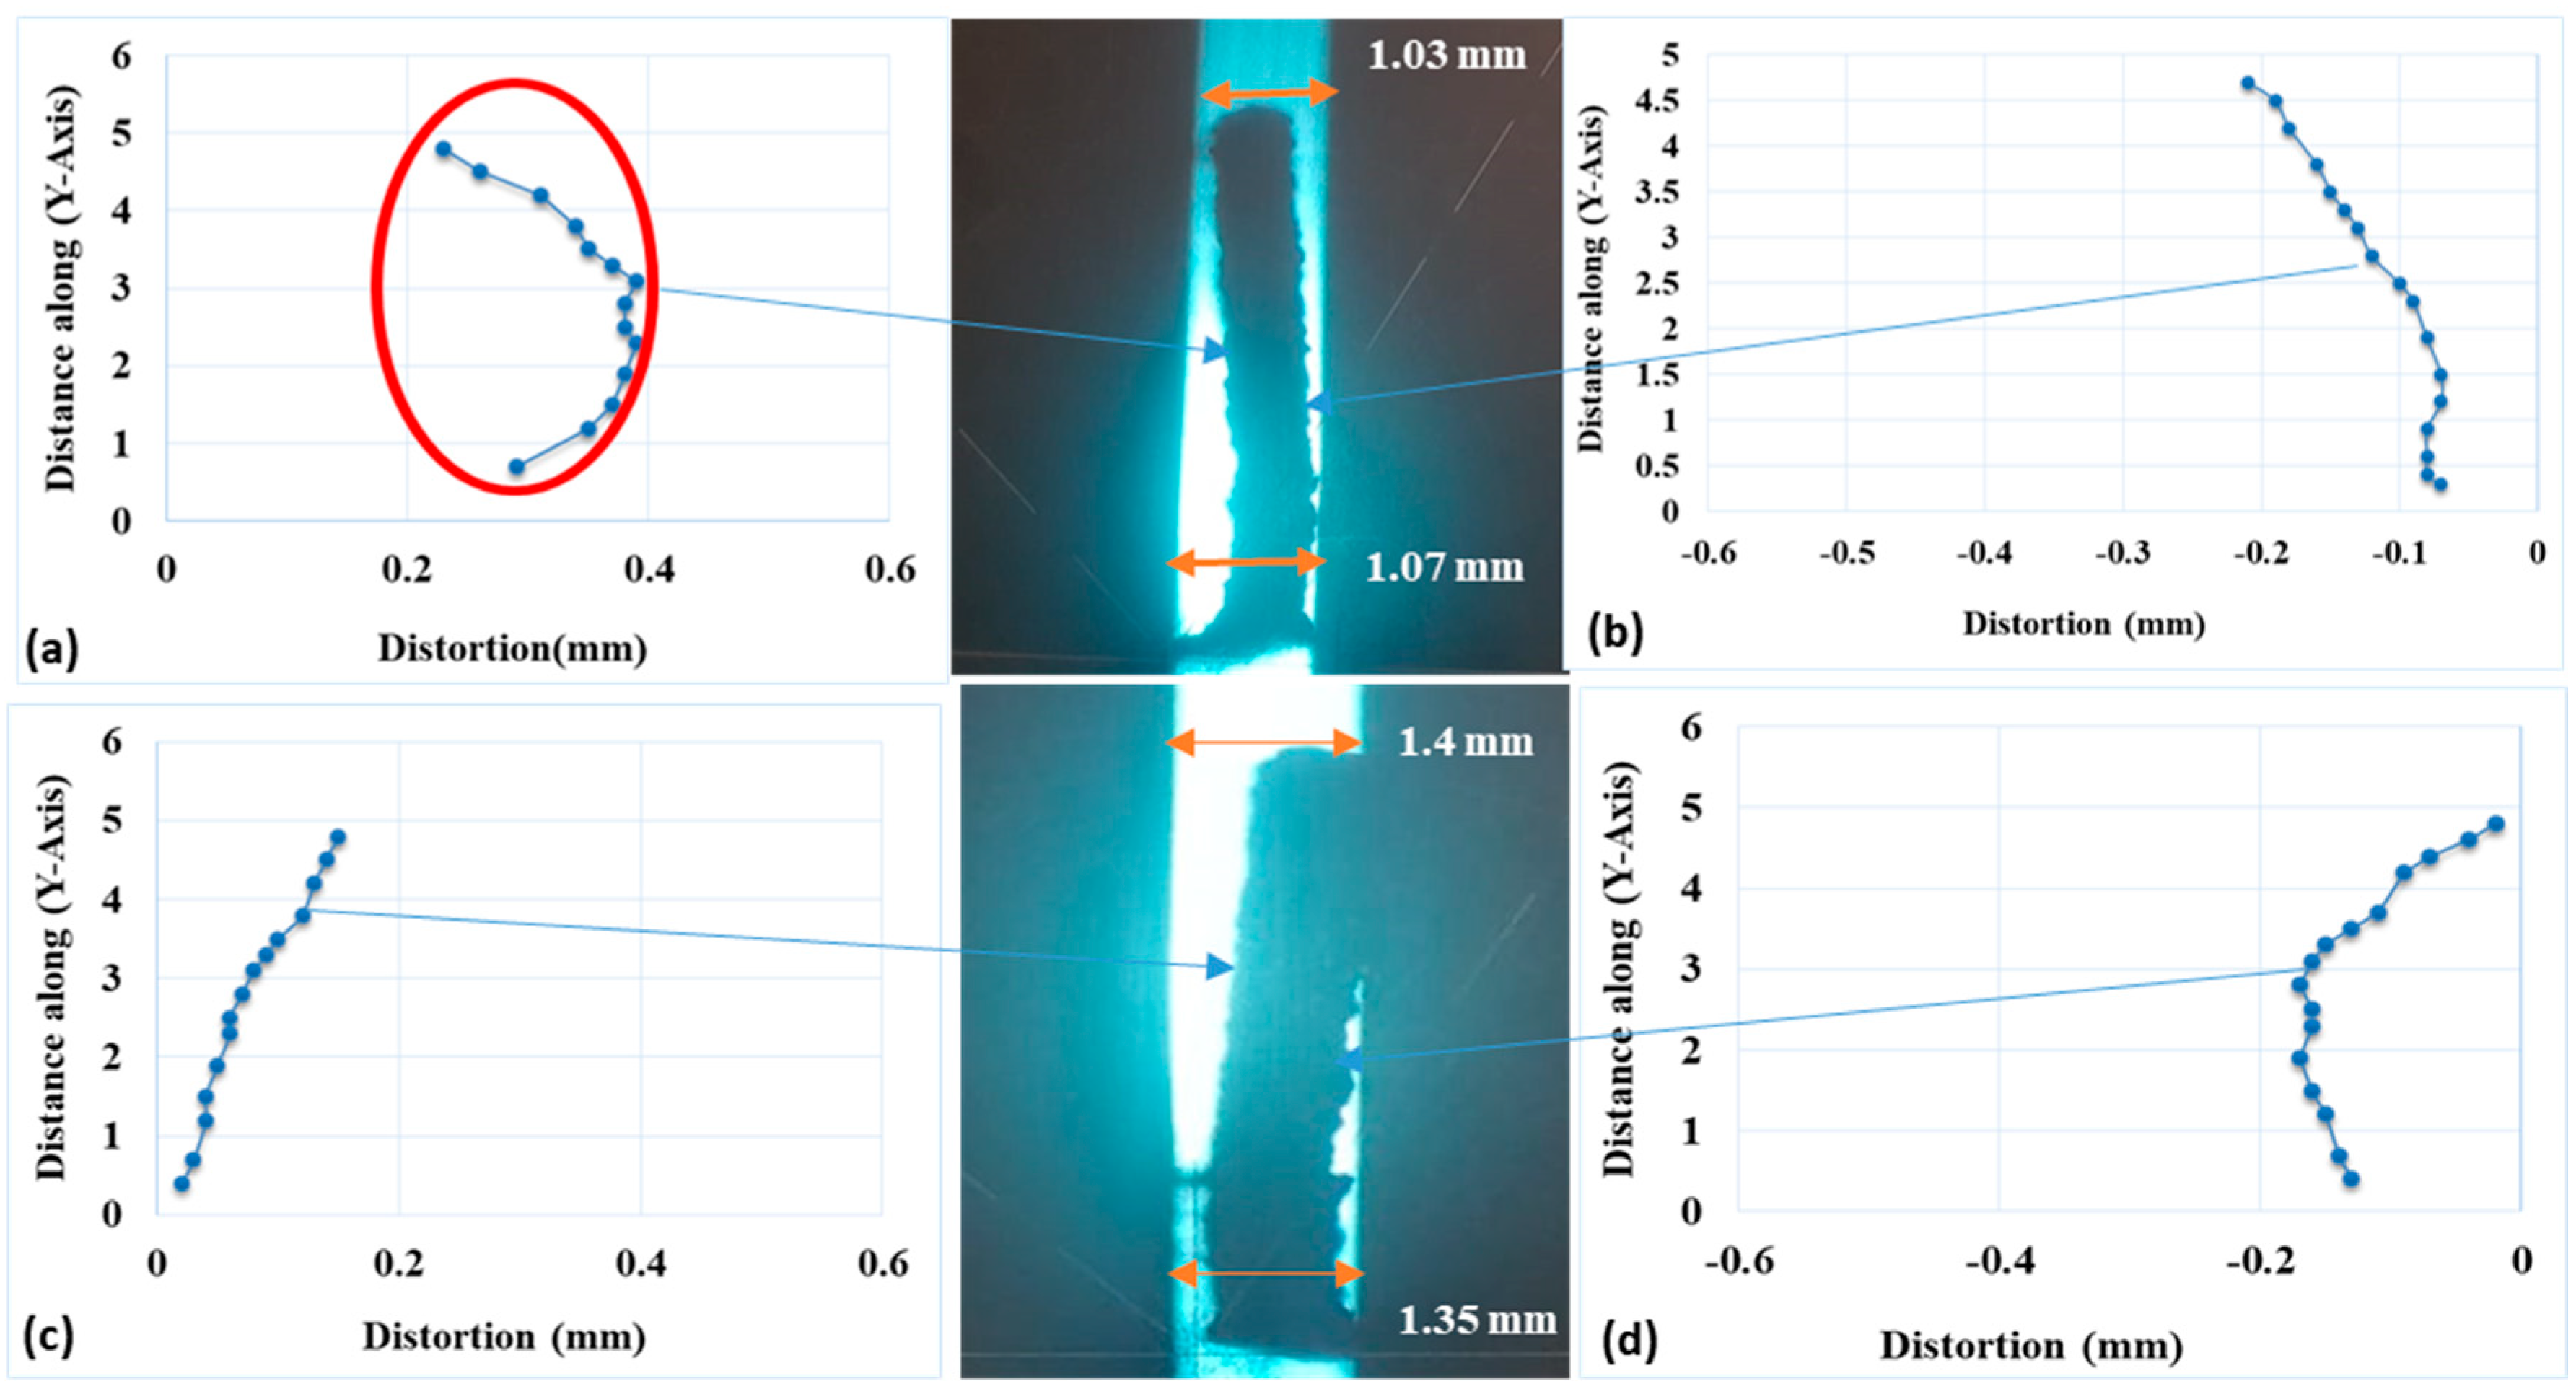
The profile projector machine was used to measure the distortion results of the parts produced by EBM. The profile of the EBM parts can be seen on the screen, as shown in Figure 20. The projector magnifies the profile of the specimen and displays this on the built-in projection [1] screen on this screen. There is typically a grid that can be rotated 360 degrees so that the X-Y axis of the screen can be aligned with a straight edge of the part to be examined or measured. This projection screen displays the profile of the piece, which is magnified for ease of measurement. The distortion measurement from both sides for the 50-layer part (2.5 mm height) produced with EBM/Ti-6Al-4V are shown in Figure 20a–d. The distortion seems to increase in the base plate, and the first few layers as more layers are added. The profiles of the distortion in the right and left sides can be clearly seen in Figure 20.
The distortion measurement from both sides is shown in Figure 21a–d for the 100 layer part (5 mm height), produced with EBM/Ti6Al-4V. The distortion increases in the base plate and the first few layers as more layers are added. The profile of distortion can be seen more clearly than in the previous profile of 50 layers part, as shown in Figure 21.
An important observation is made from Figure 20 and Figure 21 that the overall total distortion in the EBM produced parts remains almost the same, independent of height. For example, the total distortion in the 2.5 mm height part was measured to be around 0.15 mm, and the total distortion measured in the 5 mm height part was approximately 0.17 mm, which is a very similar value.
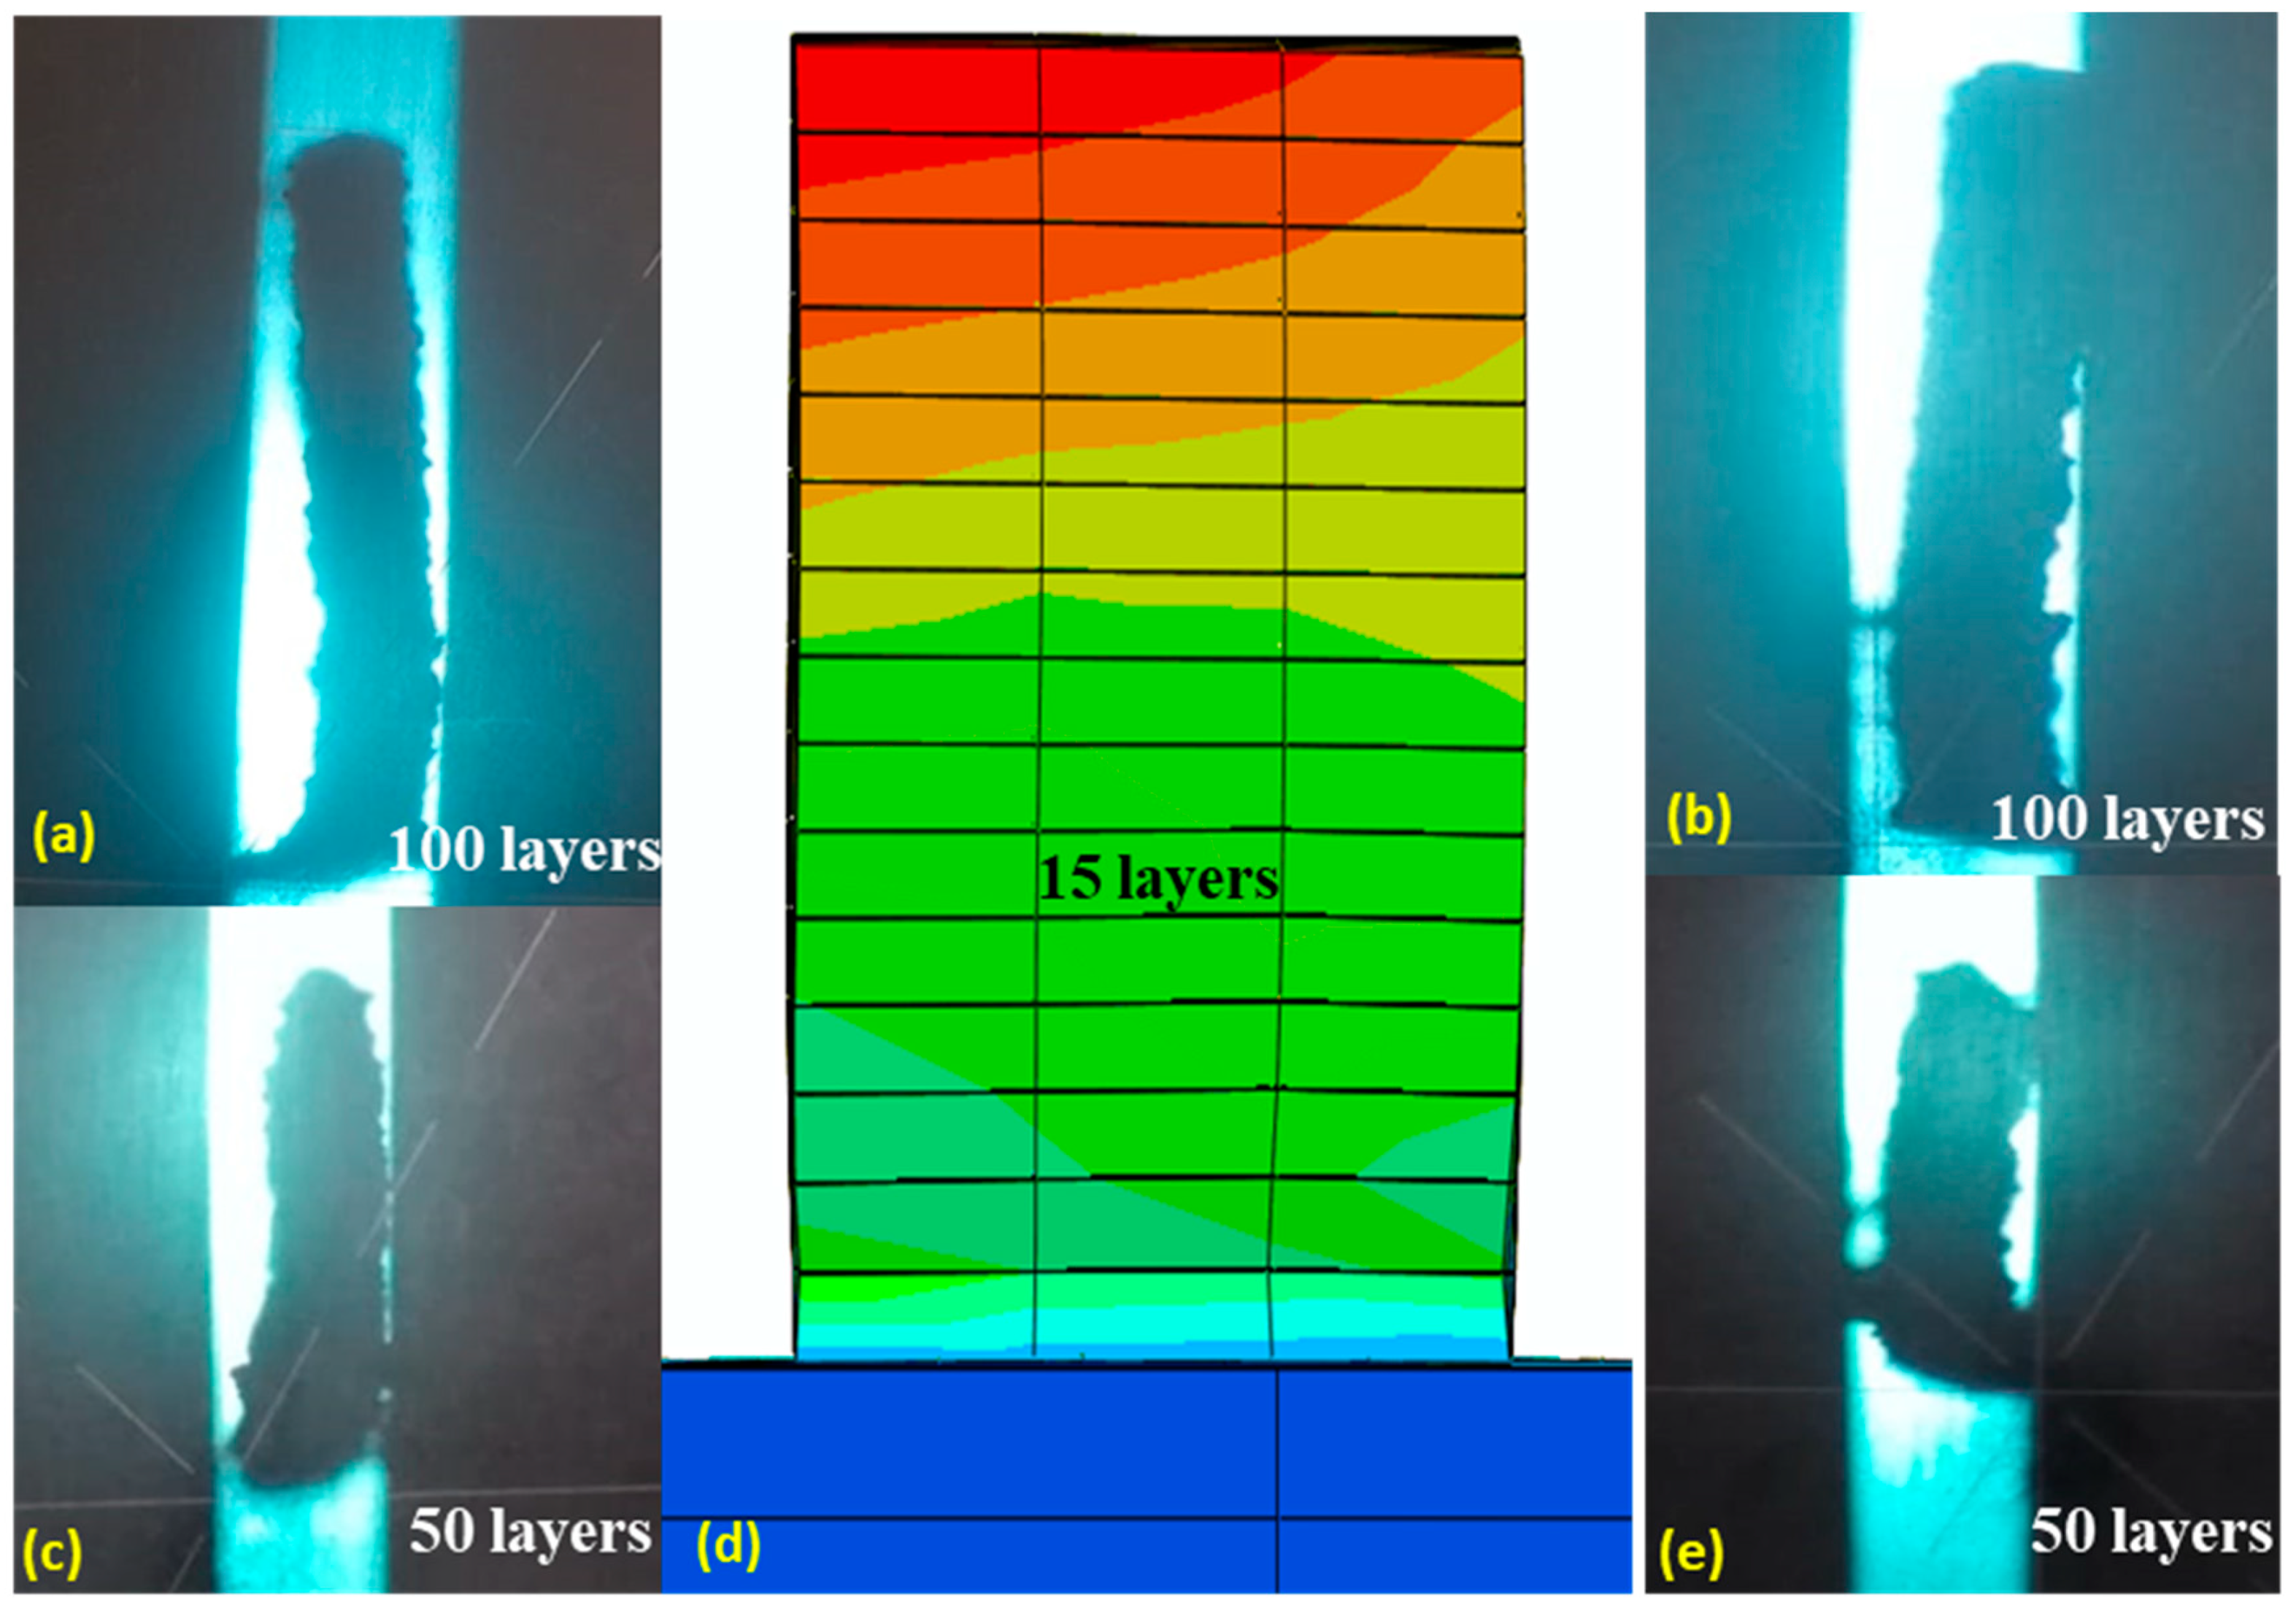
The comparison of distortion in the built layers between the experimental and simulation results is presented in Figure 22a–e. Although inherently capable of performing calculations on 50 or 100 layers, limitations of the computer used meant that simulation was stopped at 15 layers, as shown in Figure 22. The distortion in the EBM produced parts was experimentally measured. The experimental results showed that the overall distortion was independent of the part height produced. The simulated pattern of the distortion in the FE model results was qualitatively compared with experimental data and showed a similar trend. When more layers are added, the first few layers are bent down due to thermal expansion on the top surface and then bent up due to thermal shrinkage during the cooling process. After complete cooling down, the layers maintained their profile shape.

3.5. Microstructure Evolution

The samples were first grinding with SiC papers P180, P300, P600, P800, P1000, and P1500, and then polishing with Al2O3 suspension followed by etching with Kroll’s agent. The microstructures were obtained primarily to see the variation of the alpha and beta phases along the thin side faces.
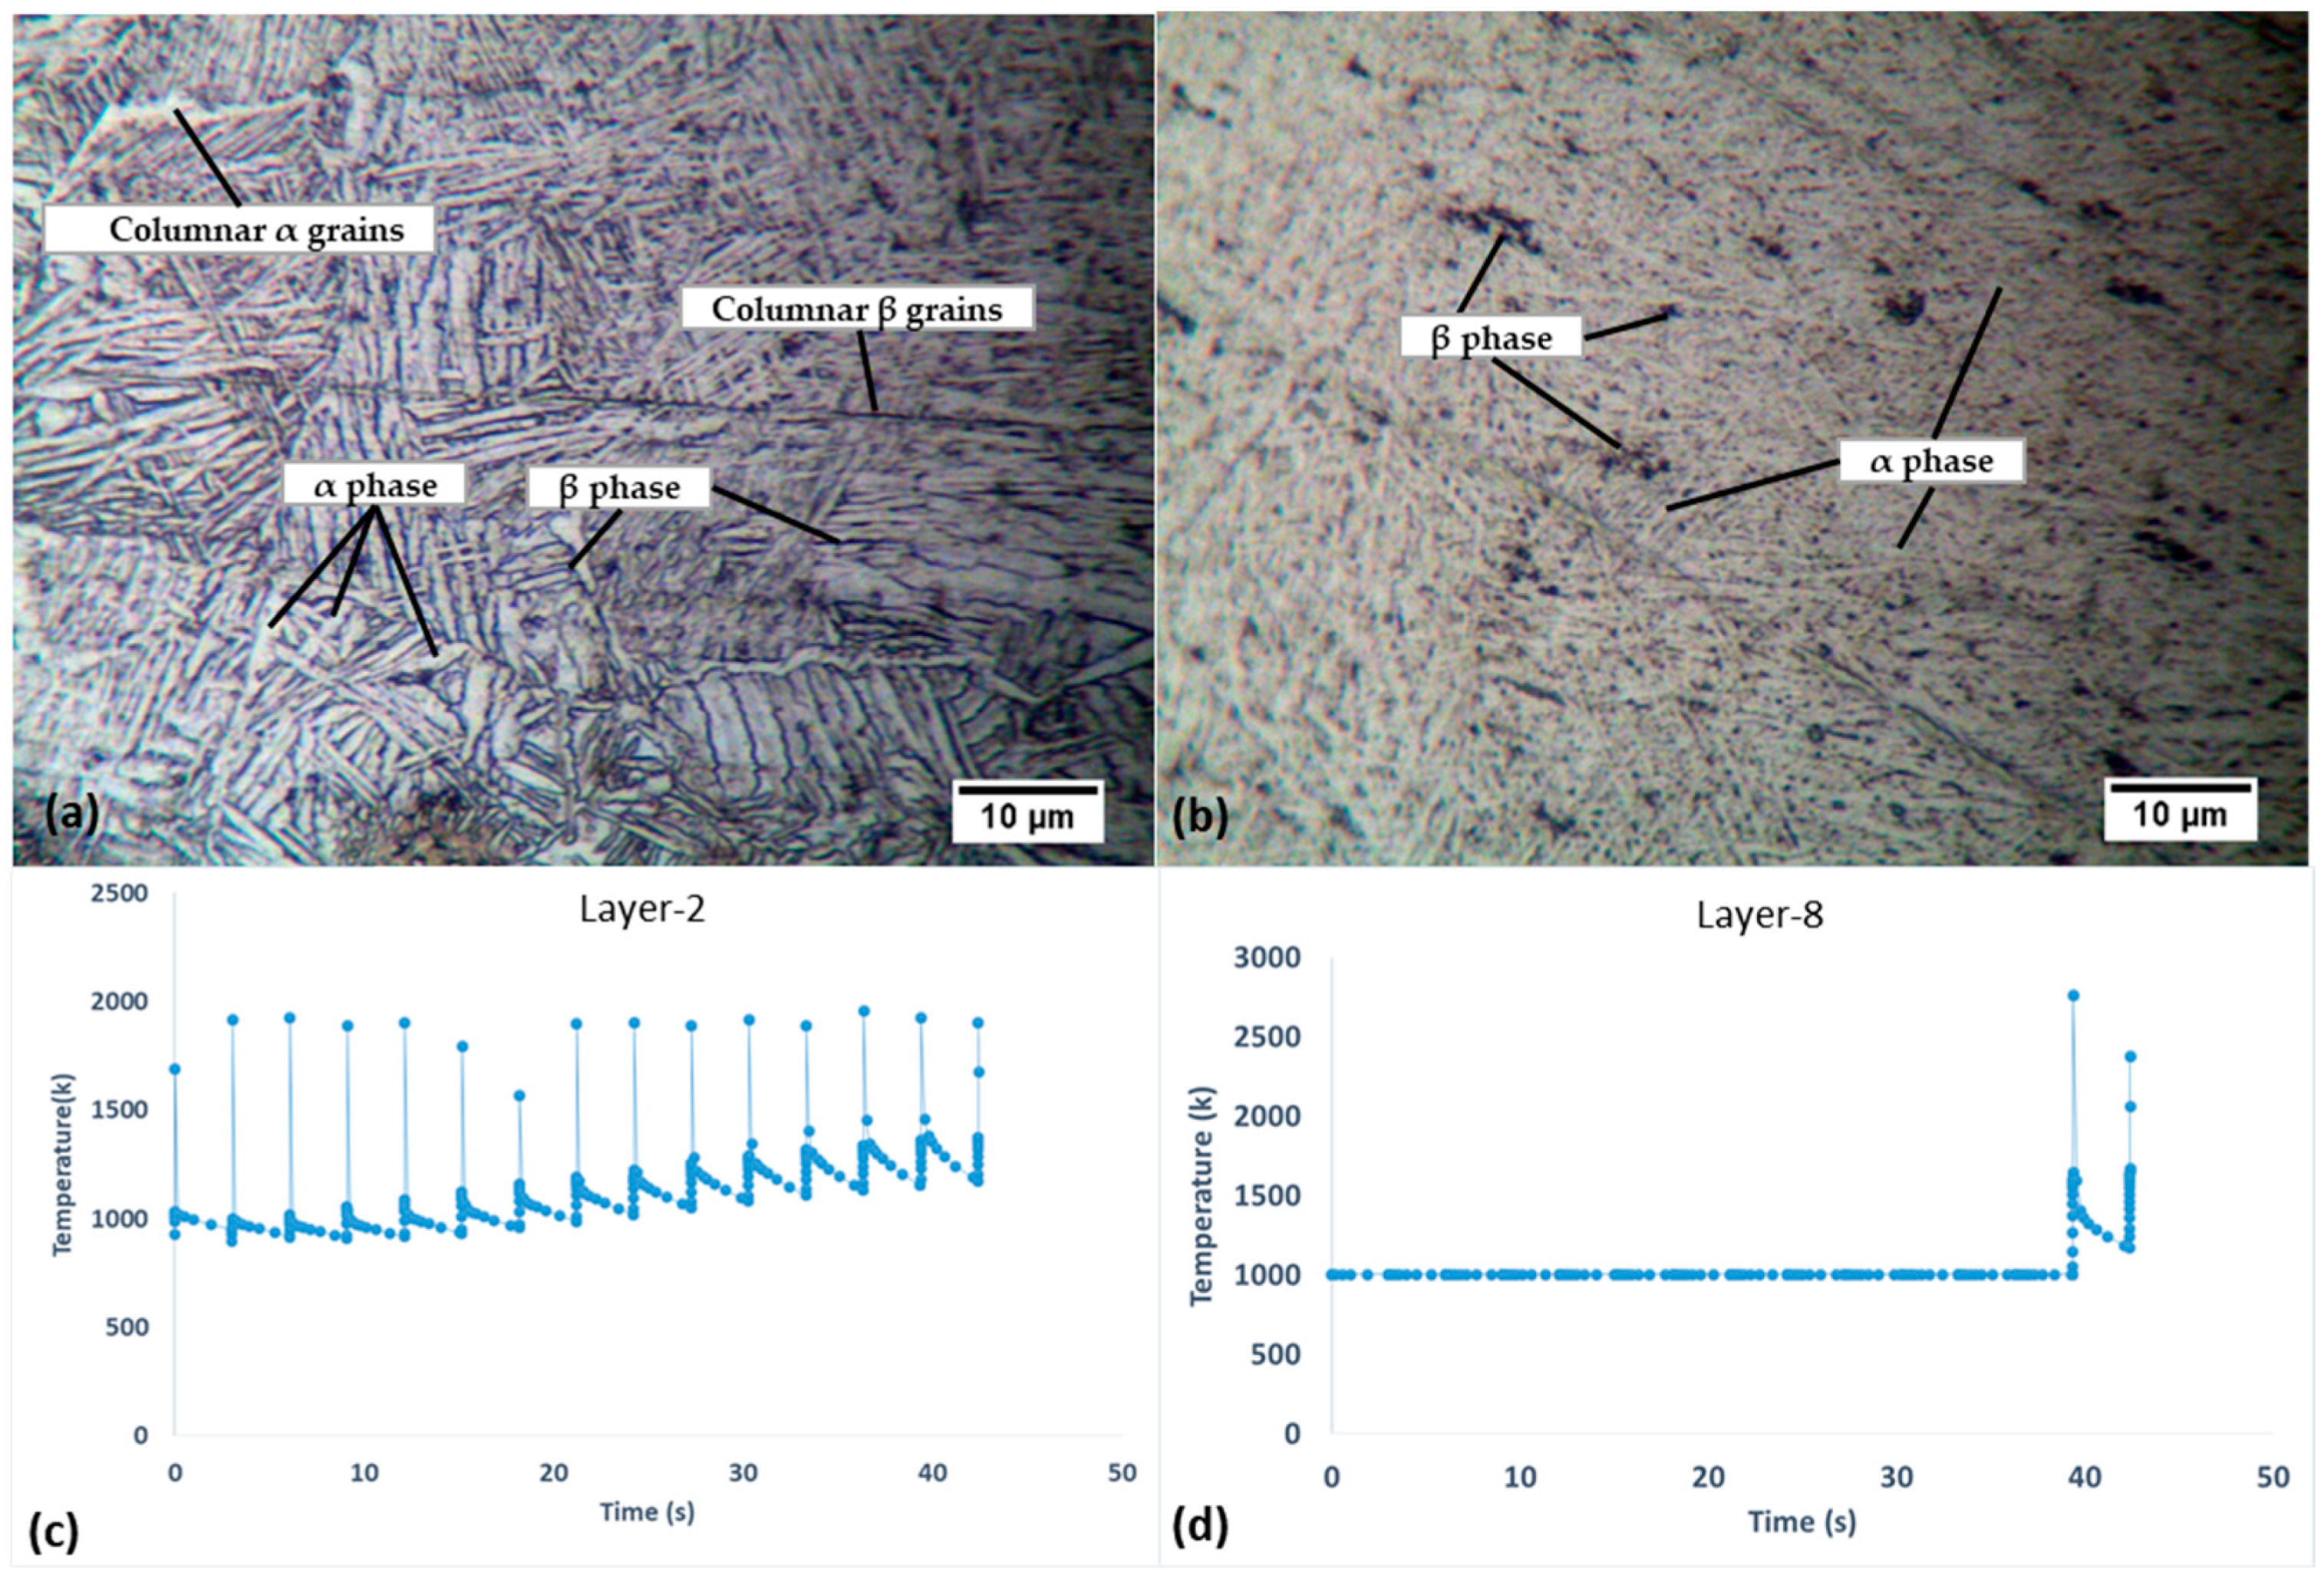
Figure 23a,b presents the microstructure of the EBM produced Ti-6Al-4V parts. It can be noted that the columnar grains (α and β) are found in the bottom (almost first three layers) of the produced part due to the cumulative heat deposited in the part near the bottom, as shown in Figure 23a. The result shows that the coarse structure has been found above the base plate, fine structure at the mid of the building layers, and finer structure near the top of the produced layers. This is because the bottom of the simulated model has more heat cycles due to the cumulative heat deposited when compared with the middle region of the part which receives fewer heat cycles. For instance, in Figure 23c, it can be seen that layer-2 receives several heat cycles due to electron beam scans on subsequent layers as compared to layer-8, which only receives 2 heat cycles (see Figure 23d). Usually, the higher heat accumulation and rapid extraction of heat favor the higher concentration of the beta phase and vice versa for the alpha phase [35,36]. Therefore, in Figure 23a, more β phase and wider α grains could be observed. In contrast, in Figure 23b, a refined lamellar α + β structure is produced because this region (middle region) receives fewer heat cycles (see Figure 23d) and experiences less heat accumulation as compared to the bottom region.

4. The Effects of Different Electron Beam Parameters

This section shows the effects of EBM processing parameters on producing a thin part of Ti-6Al-4V. Three parameters are studied: beam speed, beam current, and voltage. These three parameters were selected as they are easily adjusted and are believed to be the ones having the most influence on the objects produced. Beam current is the current due to the electrons in the electron beam. Beam speed is the electron beam scan speed. In the study, Ti6Al-4V parts were modeled using different processing parameters.
Process parameter values were chosen according to the machine’s parameter range in order to achieve the largest difference between the high and low values of each process parameter. Using a wide range in each parameter increases the probability that significant effects will be detected. As mentioned above, Cheng and Chou reported the EBM parameters used for producing a part by ARCAM AB machine, which were 400 mm, 0.002 mA, and 60 kV. However, in this section, nine combinations have been used to study the effect of real conditions such as beam speed, current, and voltage for a selected geometry.

4.1. The Effect of Scan Speed on the EBM Process

Table 5 shows the combination of parameters used with varying scan speed with other parameters fixed. The scan speed has been varied within the range reported for the ARCAM AB Machine, which is capable of scan speeds up to 8000 m/s (ARCAM AB, 2016).
Figure 24 shows the scan speed versus temperature with other parameters fixed to study the effect of scan speed on the electron beam melting process. The results conclude that the increase in scan speed leads to a decrease in temperature. The first combination of 300 mm/s, 0.002 mA, and 60 kV, has the highest temperature of 3977 K. The second combination has a temperature of 3193 K, and the third has a lower value of 2765 K. Figure 24 presents the scan speed versus von Mises stress to study the effect of scan speed on stress in the electron beam melting process. The results show that an increase in scan speed leads to an increase in the residual stresses deposited in the part produced by EBM. The first combination of 300 mm/s, 0.002 mA, and 60 kV received the least residual stress with a value of 665 MPa. The second combination had a value of 676 MPa, and the third had the highest residual stress value of 705 MPa. It can be concluded that, as the speed increases, the time of contact becomes less, which leads to a decrease in the temperature and an increase in the residual stress.

4.2. The Effect of Current on the EBM Process

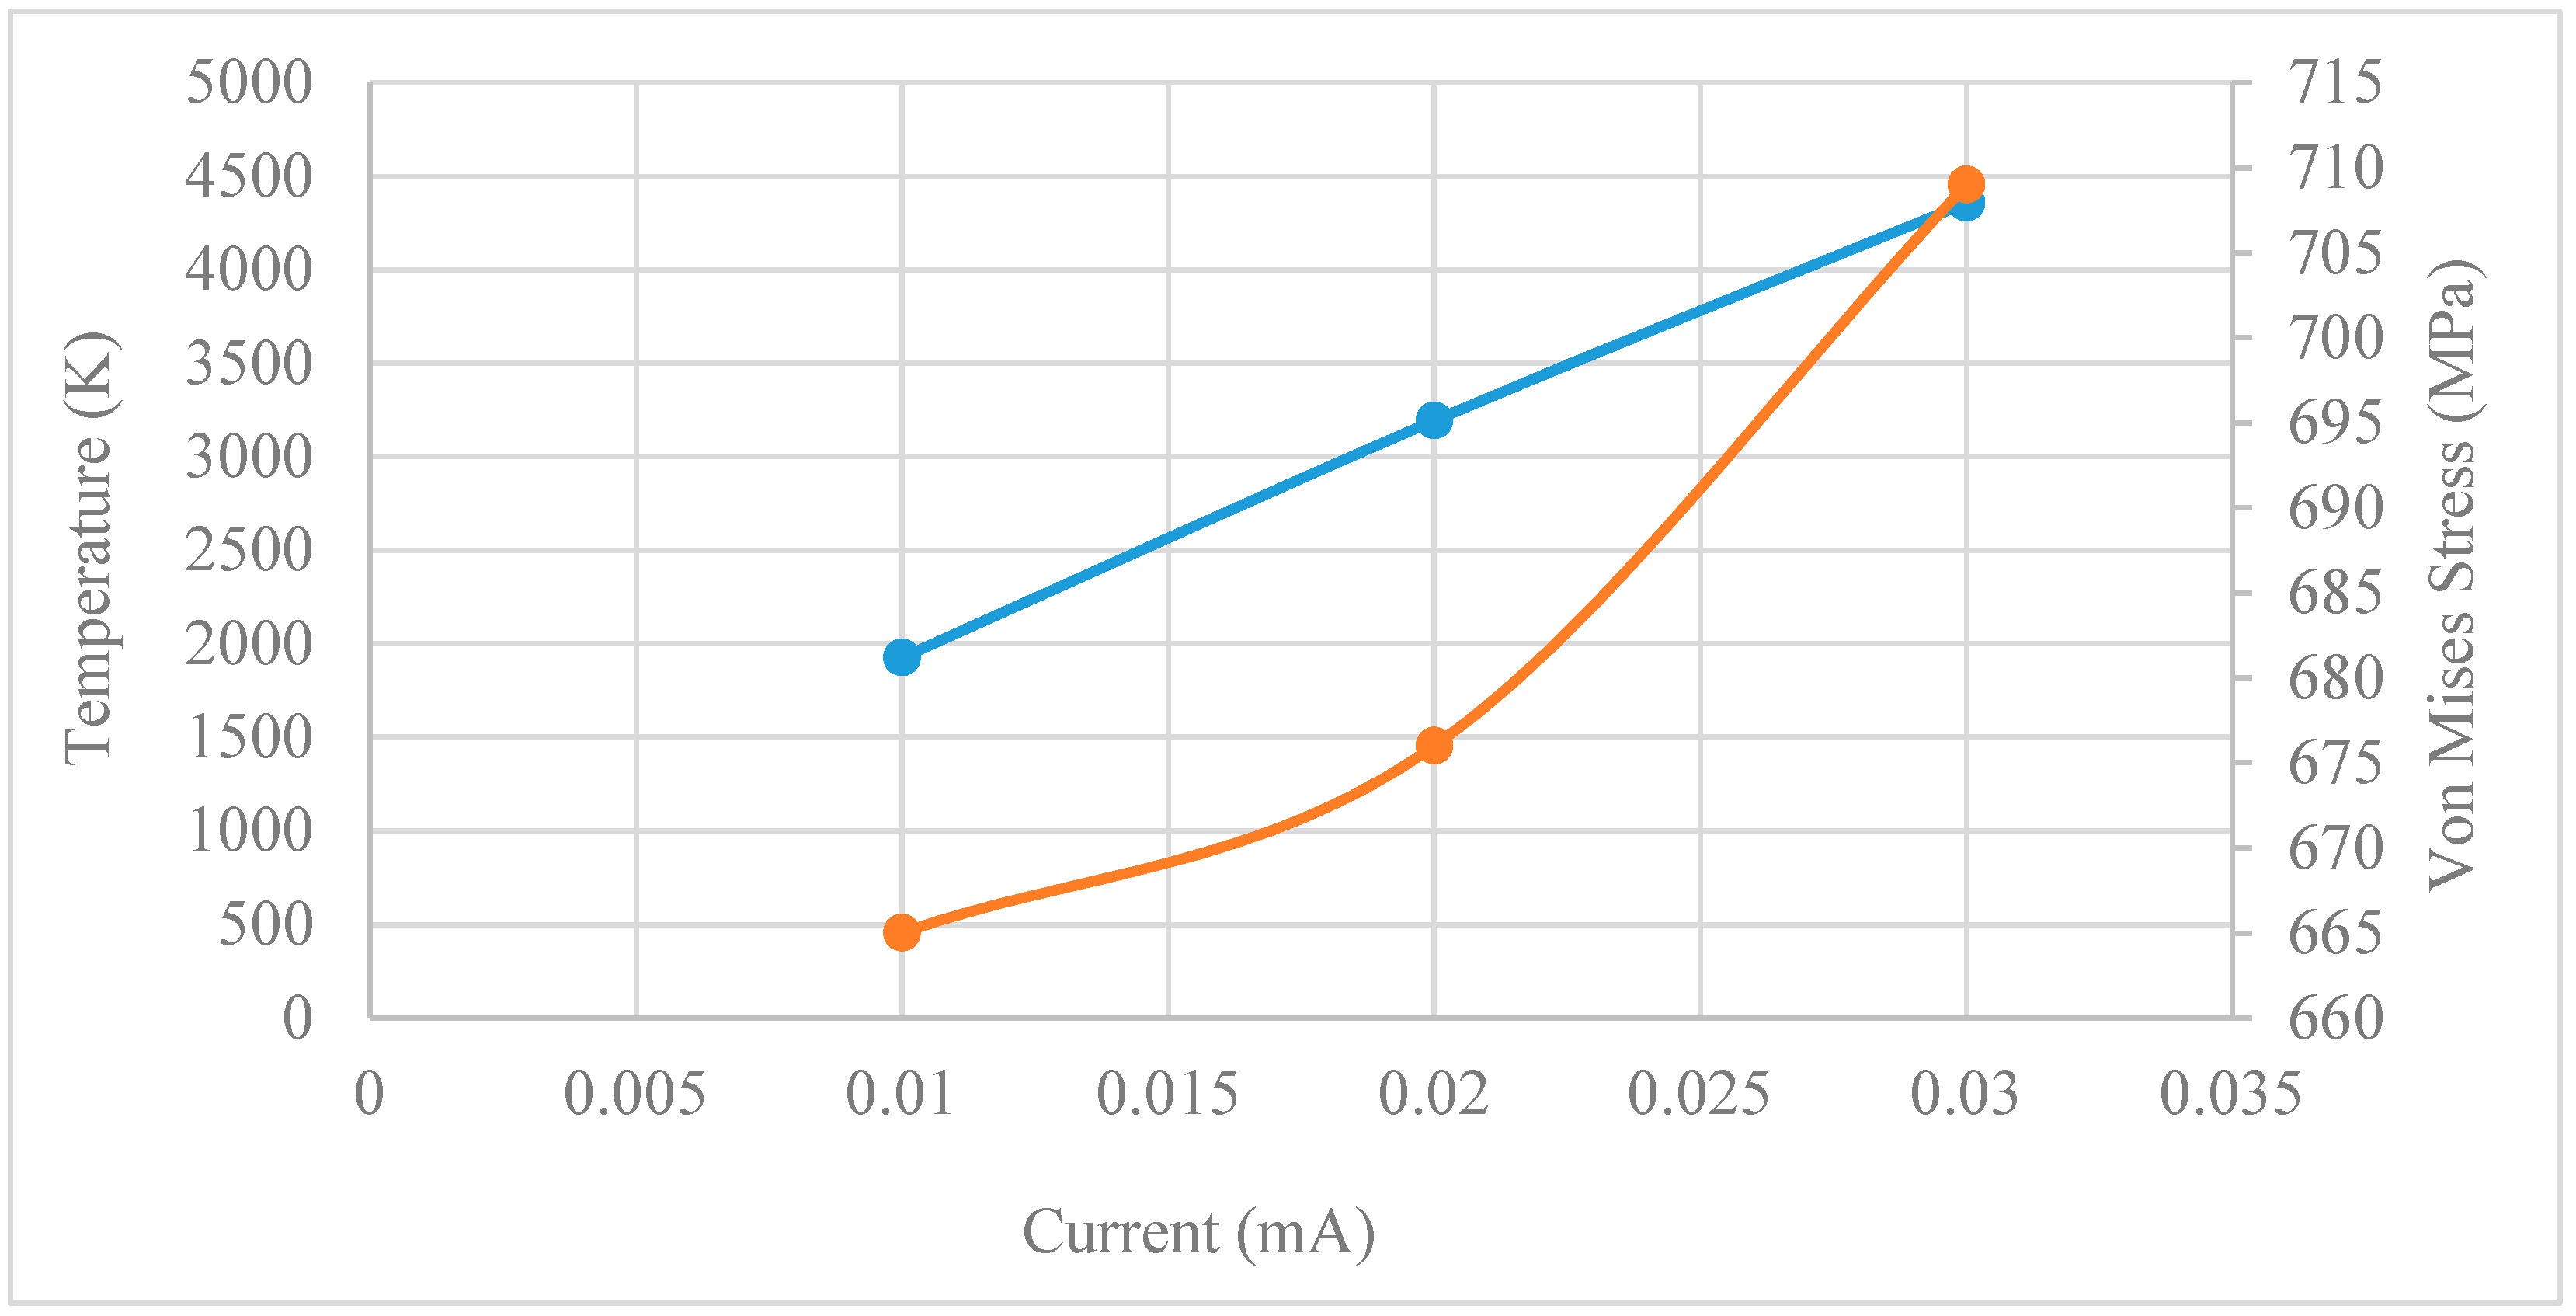
Table 6 shows the combination of parameters used with varying current, and other parameters fixed. The current has been varied within the range reported H. Gong, Rafi, Starr, & Stucker [37] for the ARCAM AB machine (0.001, 0.002, and 0.003 mA).
Figure 25 shows the current versus temperature to study the effect of current on the temperature in the electron beam melting process. The results conclude that the increase in current leads to a rise in the temperature of the electron beam melting process. The first combination of 300 mm/s, 0.001 mA, and 60 kV, has the lowest temperature of 1926 K. The second combination has a temperature of 3192 K, and the third has the highest value of 4357 K. Figure 25 presents the current versus von Mises stress at different applied currents, to study the effect of current on stress in the electron beam melting process. It is concluded that the increase in current leads to an increase in the residual stress deposited in the part produced by EBM. The first combination of the three parameters has the least residual stress, with a value of 666 MPa. The second combination has a value of 676 MPa, and the third has the highest residual stress with a value of 709 MPa. It can be concluded that, as the current increases, the spot size is decreasing the beam energy, so it leads to an increase in the temperature and residual stress.

4.3. The Effect of Voltage on the EBM Process

The combination of parameters used with varying voltage and other parameters fixed is shown in Table 7. The voltages used are 50, 60, and 70 kV.
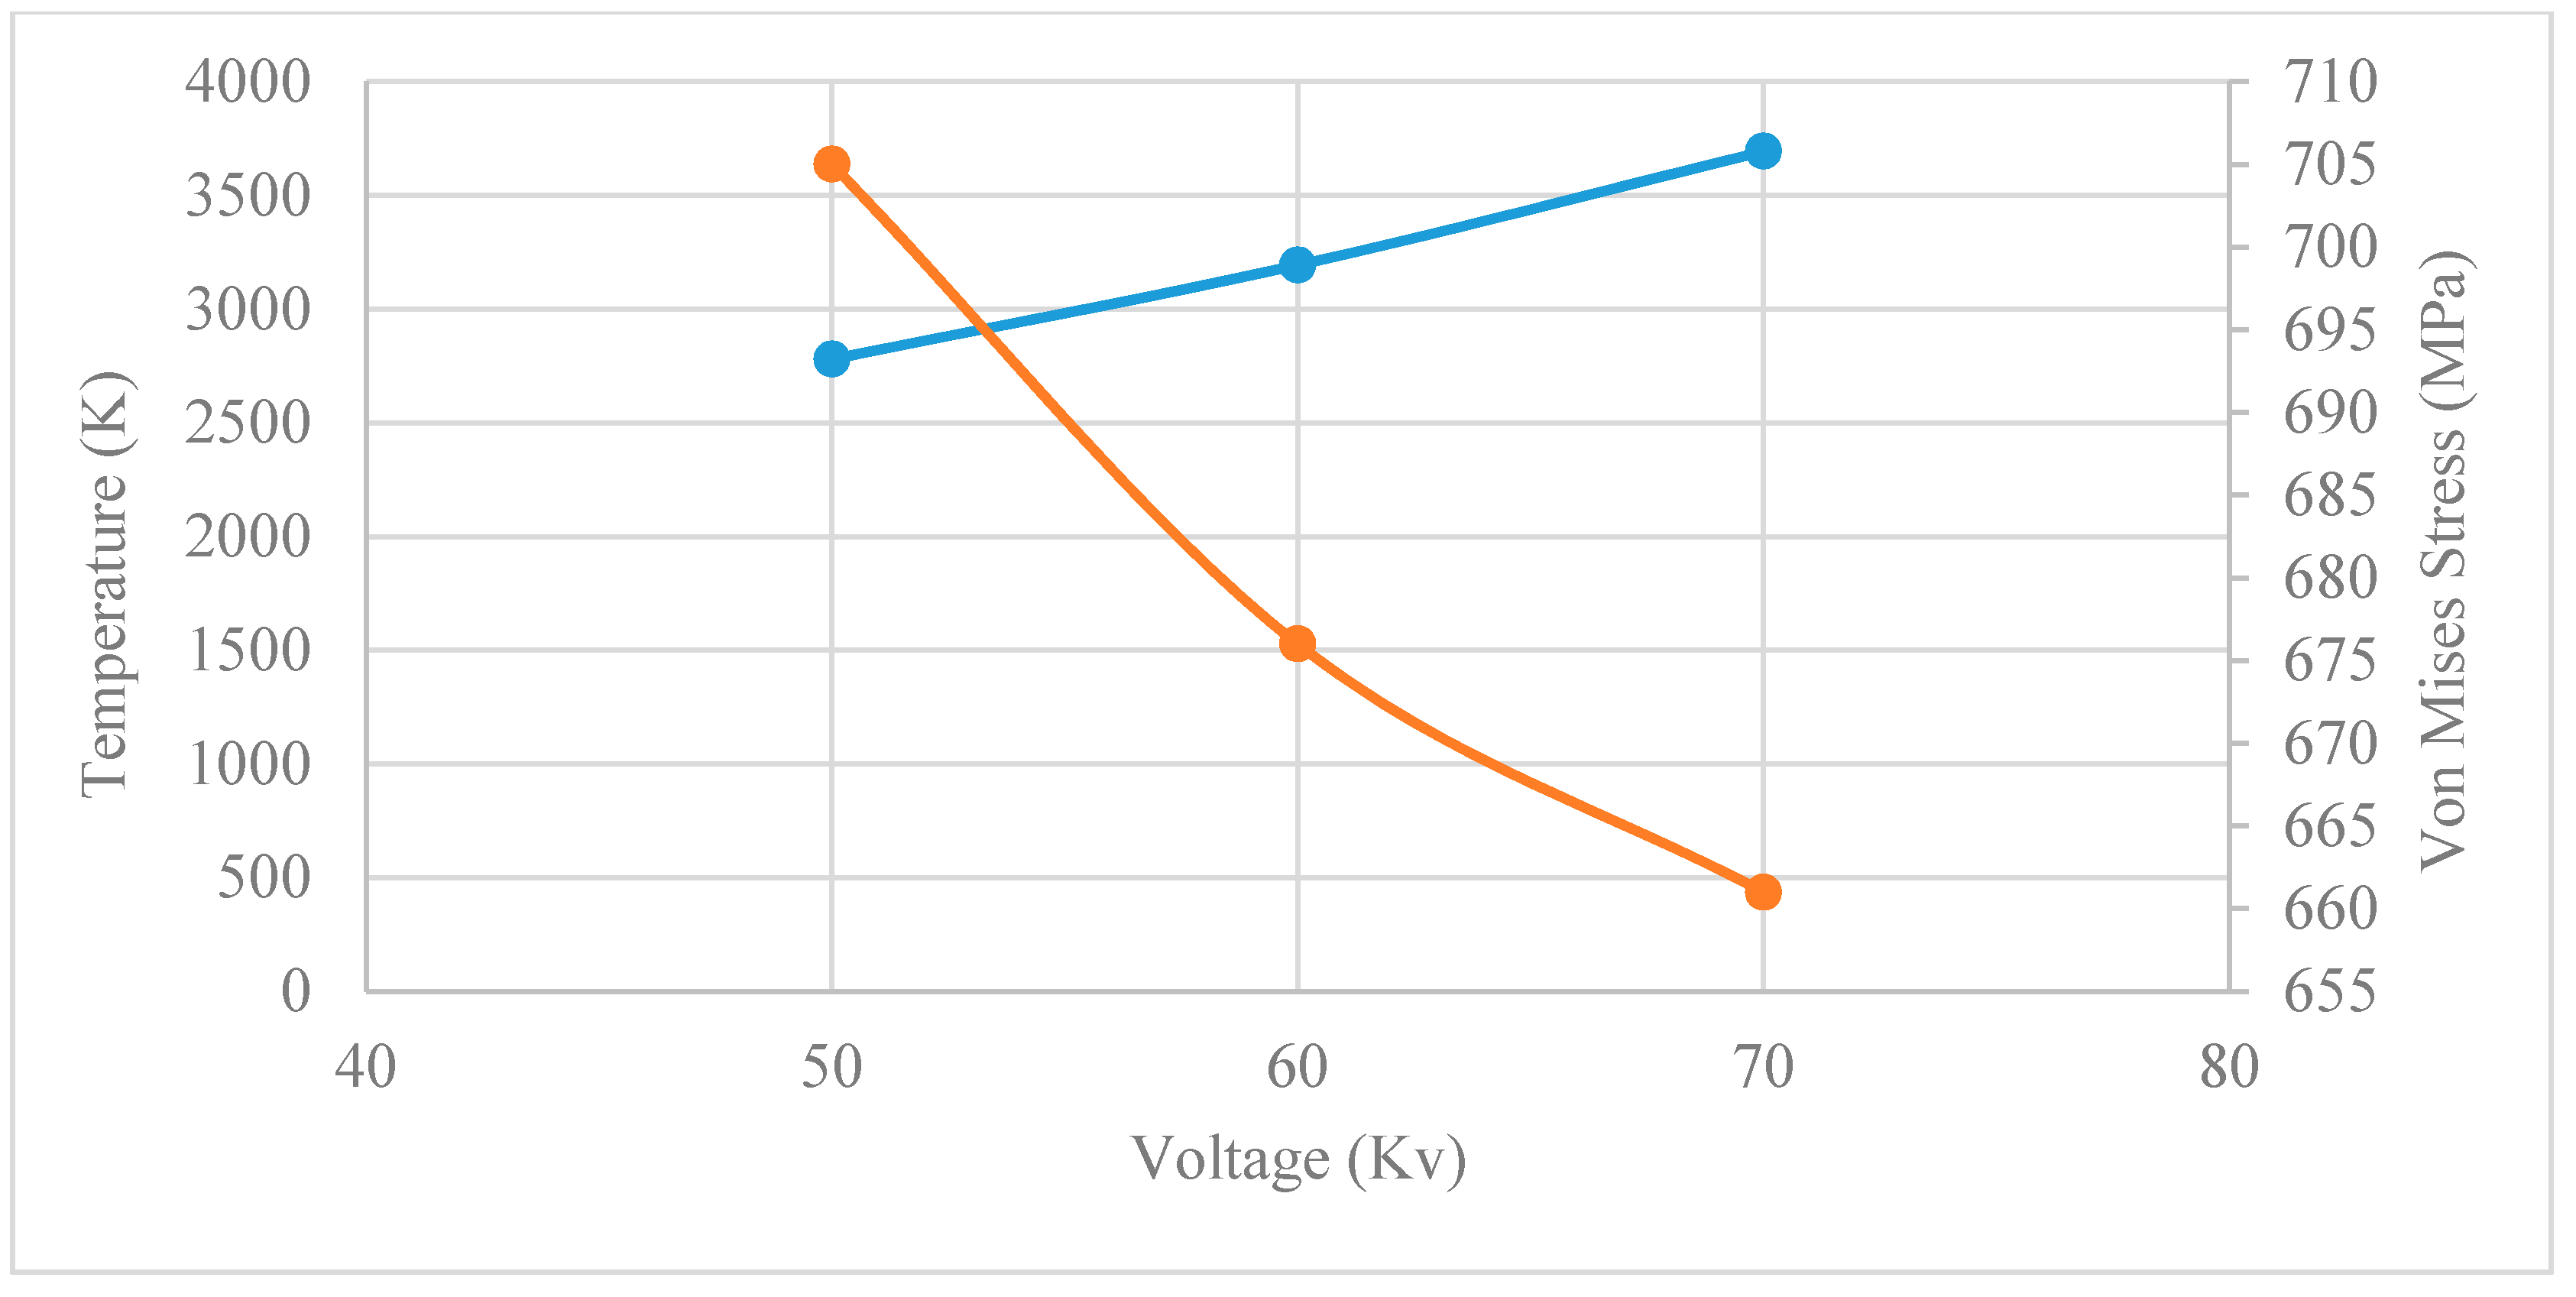
Figure 26 shows the voltage versus temperature at various set voltages to study the effect of voltage on the temperature in the EBM process. The results conclude that the increase in voltage leads to a rise in the temperature of the EBM process. The first combination of scan speed, current, and voltage has the lowest temperature of 2780 K. The second combination has a temperature of 3192 K, and the third has the highest value of 3693 K. Figure 26 presents the voltage versus von Mises stress at different set voltages to study the effect of voltage on stress in the EBM process. It can be concluded that the increase in voltage leads to lower residual stresses deposited in the part produced by EBM. The first combination of the three parameters has the highest residual stress with a value of 705 MPa. The second combination has a value of 676 MPa, and the third has the least residual stress with a value of 661 MPa. The results conclude that as the voltage increases as the energy increases, leading to an increase in the temperature and a decrease in the residual stress due to the potential difference between the two nodes.

5. Conclusions

The thermomechanical finite element model was developed for the multi-layer EBM process of Ti-6Al-4V, to investigate the thermal and mechanical behavior of deposited materials involved in the electron beam melting process. In this study, the thermomechanical analysis was performed using a 3D transient, fully coupled temperature-displacement model.
The developed FE model study the effect of real conditions such as preheating temperature, the energy of the electron beam, cooling time, and beam scanning path and speed for a selected geometry. The simulated results have been compared with other reported simulated results on EBM, and the experimental results. The results revealed the characteristics of temperature distribution, residual stress, and deformation within the deposited layers and the base plate. Based on the results and discussion, several conclusions have been drawn and can be stated as follows:
The FEA can predict the thermomechanical behavior of products fabricated by the electron beam melting process or similar processes with localized heat sources such as laser sintering, laser cladding, and welding.
During the deposition of layers with EBM, high residual stresses resulted after final cooling, i.e., the stresses in the deposited layers increased with cooling due to thermal contraction. It is highly recommended to validate the FE residual stress results by conducting the experimental observations and measurements as well.
The distortion in the EBM produced parts was experimentally measured. The experimental results showed that the overall distortion was independent of the part height produced. The simulated pattern of the distortion in the results from the FE model was found to be in close agreement with the experimental data.
The maximum predicted temperatures and the temperature profiles were found to be in close agreement with the reported experimental and simulated results.
The effects of EBM processing parameters on the production of a thin part of Ti-6Al-4V have been studied to understand the most influential parameters. Findings are as follows:
An increase in scan speed leads to a decrease in temperature.
An increase in scan speed leads to an increase in the residual stresses within the part produced by EBM.
An increase in current leads to a rise in temperature of the electron beam melting process.
A decrease in current leads to a reduction in the residual stresses within the part produced by EBM.
An increase in voltage leads to a rise in the temperature of the electron beam melting process.
An increase in voltage leads to lower residual stresses within the part produced by EBM.
For the EBM machine, characteristics of the beam, and materials used in this study, the best combination of parameters was 400 mm/s, 0.002 mA, and 60 kV speed, current, and voltage, respectively, to achieve parts with low levels of residual stress and distortion and hence improved quality.

Author Contributions

F.M.A.: Data curation, formal analysis, investigation, methodology, software, visualization, writing—original draft; S.A.: conceptualization, data curation, formal analysis, investigation, methodology, software, supervision, validation, visualization, writing–original draft, writing—review & editing; A.A.-A.: funding acquisition, resources, supervision, writing—review & editing. All authors have read and agreed to the published version of the manuscript.

Funding

This study received funding from the Raytheon Chair for Systems Engineering. The authors are grateful to the Raytheon Chair for Systems Engineering for funding.

Acknowledgments

The authors thank the Deanship of Scientific Research and RSSU at King Saud University for their technical support.

Conflicts of Interest

The authors declare no conflict of interest.

References

  1. Ameen, W.; Al-Ahmari, A.; Mohammed, M.K. Self-supporting overhang structures produced by additive manufacturing through electron beam melting. Int. J. Adv. Manuf. Technol. 2019, 104, 2215–2232. [Google Scholar] [CrossRef]
  2. Ameen, W.; Al-Ahmari, A.; Mohammed, M.; Mian, S. Manufacturability of overhanging holes using electron beam melting. Metals 2018, 8, 397. [Google Scholar] [CrossRef] [Green Version]
  3. Schwerdtfeger, J.; Heinl, P.; Singer, R.; Körner, C. Auxetic cellular structures through selective electron-beam melting. Phys. Status Solidi B 2010, 247, 269–272. [Google Scholar] [CrossRef]
  4. Yu, P.; Qian, M.; Tomus, D.; Brice, C.A.; Schaffer, G.B.; Muddle, B.C. Electron beam processing of aluminium alloys. In Materials Science Forum; Trans Tech Publications Ltd.: Stafa-Zurich, Switzerland, 2009; Volume 618, pp. 621–626. [Google Scholar]
  5. Cormier, D.; Harrysson, O.; West, H. Characterization of H13 steel produced via electron beam melting. Rapid Prototyp. J. 2004, 10, 35–41. [Google Scholar] [CrossRef]
  6. Gaytan, S.M.; Murr, L.E.; Martinez, E.; Martinez, J.L.; Machado, B.I.; Ramirez, D.A.; Medina, F.; Collins, S.; Wicker, R.B. Comparison of microstructures and mechanical properties for solid and mesh cobalt-base alloy prototypes fabricated by electron beam melting. Metall. Mater. Trans. A 2010, 41, 3216–3227. [Google Scholar] [CrossRef]
  7. Parthasarathy, J.; Starly, B.; Raman, S.; Christensen, A. Mechanical evaluation of porous titanium (Ti6Al4V) structures with electron beam melting (EBM). J. Mech. Behav. Biomed. Mater. 2010, 3, 249–259. [Google Scholar] [CrossRef]
  8. Leyens, C.; Peters, M. Titanium and Titanium Alloys: Fundamentals and Applications; John Wiley & Sons: Hoboken, NJ, USA, 2003. [Google Scholar]
  9. Liu, W.; Li, L.; Kochhar, A. A method for assessing geometrical errors in layered manufacturing. Part 1: Error interaction and transfer mechanisms. Int. J. Adv. Manuf. Technol. 1998, 14, 637–643. [Google Scholar] [CrossRef]
  10. Lim, G.; Lau, K.; Cheng, W.; Chiang, Z.; Krishnan, M.; Ardi, D. Residual Stresses in Ti-6Al-4V Parts Manufactured by Direct Metal Laser Sintering and Electron Beam Melting. Brit. Soc. Strain Meas. 2017, 71, 348–353. [Google Scholar]
  11. Weman, K. Welding Processes Handbook; Elsevier: Amsterdam, The Netherlands, 2011. [Google Scholar]
  12. Denlinger, E.R.; Heigel, J.C.; Michaleris, P. Residual stress and distortion modeling of electron beam direct manufacturing Ti-6Al-4V. Proc. Inst. Mech. Eng. Part B J. Eng. Manuf. 2015, 229, 1803–1813. [Google Scholar] [CrossRef]
  13. Cheng, B.; Chou, K. Thermal stresses associated with part overhang geometry in electron beam additive manufacturing: Process parameter effects. Proc. Annu. Int. Solid Free. Fabr. Symp. 2014, 25, 1076. [Google Scholar]
  14. Shen, N.; Chou, K. Thermal modeling of electron beam additive manufacturing process: Powder sintering effects. In Proceedings of the ASME 2012 International Manufacturing Science and Engineering Conference Collocated with the 40th North American Manufacturing Research Conference and in participation with the International Conference on Tribology Materials and Processing, Notre Dame, IN, USA, 4–8 June 2012; pp. 287–295. [Google Scholar]
  15. Cao, J.; Gharghouri, M.A.; Nash, P. Finite-element analysis and experimental validation of thermal residual stress and distortion in electron beam additive manufactured Ti-6Al-4V build plates. J. Mater. Process. Technol. 2016, 237, 409–419. [Google Scholar] [CrossRef]
  16. Umer, U.; Ameen, W.; Abidi, M.H.; Moiduddin, K.; Alkhalefah, H.; Alkahtani, M.; Al-Ahmari, A. Modeling the Effect of Different Support Structures in Electron Beam Melting of Titanium Alloy Using Finite Element Models. Metals 2019, 9, 806. [Google Scholar] [CrossRef] [Green Version]
  17. Algardh, J.K.; Horn, T.; West, H.; Aman, R.; Snis, A.; Engqvist, H.; Lausmaa, J.; Harrysson, O. Thickness dependency of mechanical properties for thin-walled titanium parts manufactured by Electron Beam Melting (EBM)®. Addit. Manuf. 2016, 12, 45–50. [Google Scholar] [CrossRef]
  18. Isaev, A.; Grechishnikov, V.; Pivkin, P.; Ilyukhin, Y.; Kozochkin, M.; Peretyagin, P. Structure and machinability of thin-walled parts made of titanium alloy powder using electron beam melting technology. J. Silic. Based Compos. Mater. 2016, 68, 46. [Google Scholar]
  19. Cormier, D.; West, H.; Harrysson, O.; Knowlson, K. Characterization of Thin Walled Ti-6Al-4V Components Reduced via Electron Beam Melting 440. In Proceedings of the 2004 International Solid Freeform Fabrication Symposium, Austin, TX, USA, 4 August 2004. [Google Scholar]
  20. Everhart, W.; Dinardo, J.; Barr, C. The effect of scan length on the structure and mechanical properties of electron beam-melted Ti-6Al-4V. Metall. Mater. Trans. A 2017, 48, 697–705. [Google Scholar] [CrossRef]
  21. Fu, C.; Guo, Y. 3-dimensional finite element modeling of selective laser melting Ti-6Al-4V alloy. In Proceedings of the 25th Annual International Solid Freeform Fabrication Symposium, Tuscaloosa, AL, USA, 4 August 2014; pp. 1129–1144. [Google Scholar]
  22. Boivineau, M.; Cagran, C.; Doytier, D.; Eyraud, V.; Nadal, M.H.; Wilthan, B.; Pottlacher, G. Thermophysical properties of solid and liquid Ti-6Al-4V (TA6V) alloy. Int. J. Thermophys. 2006, 27, 507–529. [Google Scholar] [CrossRef]
  23. Liu, S.; Shin, Y.C. Additive manufacturing of Ti6Al4V alloy: A review. Mater. Des. 2019, 164, 107552. [Google Scholar] [CrossRef]
  24. Abbes, B.; Anedaf, T.; Abbes, F.; Li, Y. Direct energy deposition metamodeling using a meshless method. Eng. Comput. 2020. [Google Scholar] [CrossRef]
  25. Ahmed, S.H.; Mian, A. Influence of material property variation on computationally calculated melt pool temperature during laser melting process. Metals 2019, 9, 456. [Google Scholar] [CrossRef] [Green Version]
  26. Seyedian, C.M.; Haghpanahi, M.; Sedighi, M. Investigation of the Effect of Clamping on Residual Stresses and Distortions in Butt-Welded Plates; Scientia Iranica. Transaction B: Mechanical Engineering: Tehran, Iran, 2010. [Google Scholar]
  27. Ameen, W.; Al-Ahmari, A.; Mohammed, M.; Abdulhameed, O.; Umer, U.; Moiduddin, K. Design, finite element analysis (FEA), and fabrication of custom titanium alloy cranial implant using electron beam melting additive manufacturing. Adv. Prod. Eng. Manag. 2018, 13, 267–278. [Google Scholar] [CrossRef] [Green Version]
  28. Gong, X.; Cheng, B.; Price, S.; Chou, K. Powder-bed electron-beam-melting additive manufacturing: Powder characterization, process simulation and metrology. In Proceedings of the Early Career Technical Conference, Birmingham, AL, USA, 2–3 November 2013; pp. 55–66. [Google Scholar]
  29. Cheng, B.; Lu, P.; Chou, K. Thermomechanical investigation of overhang fabrications in electron beam additive manufacturing. In Proceedings of the ASME 2014 International Manufacturing Science and Engineering Conference Collocated with the JSME 2014 International Conference on Materials and Processing and the 42nd North American Manufacturing Research Conference, Detroit, MI, USA, 9–13 June 2014. [Google Scholar]
  30. He, J.; Li, D.; Jiang, W.; Ke, L.; Qin, G.; Ye, Y.; Qin, Q.; Qiu, D. The Martensitic Transformation and Mechanical Properties of Ti6Al4V Prepared via Selective Laser Melting. Materials 2019, 12, 321. [Google Scholar] [CrossRef] [PubMed] [Green Version]
  31. Shen, N.; Chou, K. Thermomechanical investigation of overhang fabrications in electron beam additive manufacturing. In Proceedings of the International Manufacturing Science and Engineering Conference, Detroit, MI, USA, 9–13 June 2014; p. V002T02A024. [Google Scholar]
  32. Shen, N.; Chou, K. Numerical thermal analysis in electron beam additive manufacturing with preheating effects. In Proceedings of the 23rd solid freeform fabrication symposium, Tuscaloosa, AL, USA, 6 August 2012; pp. 774–784. [Google Scholar]
  33. Guo, Q.; Zhao, C.; Qu, M.; Xiong, L.; Escano, L.I.; Hojjatzadeh, S.M.; Parab, N.D.; Fezzaa, K.; Everhart, W.; Sun, T.; et al. In-situ characterization and quantification of melt pool variation under constant input energy density in laser powder bed fusion additive manufacturing process. Addit. Manuf. 2019, 28, 600–609. [Google Scholar] [CrossRef]
  34. Cezairliyan, A.; Miiller, A. Melting point, normal spectral emittance/at the melting point/, and electrical resistivity/above 1900 K/ of titanium by a pulse heating method. J. Res. 1977, 82, 119–122. [Google Scholar] [CrossRef]
  35. Raghavan, S.; Nai, M.L.S.; Wang, P.; Sin, W.J.; Li, T.; Wei, J. Heat treatment of electron beam melted (EBM) Ti-6Al-4V: Microstructure to mechanical property correlations. Rapid Prototyp. J. 2018, 24, 774–783. [Google Scholar] [CrossRef]
  36. Singh, A.P.; Yang, F.; Torrens, R.; Gabbitas, B. Heat Treatment, Impact Properties, and Fracture Behaviour of Ti-6Al-4V Alloy Produced by Powder Compact Extrusion. Materials 2019, 12, 3824. [Google Scholar] [CrossRef] [Green Version]
  37. Gong, H.; Rafi, K.; Starr, T.; Stucker, B. The effects of processing parameters on defect regularity in Ti-6Al-4V parts fabricated by selective laser melting and electron beam melting. In Proceedings of the 24th Annual International Solid Freeform Fabrication Symposium—An Additive Manufacturing Conference, Austin, TX, USA, 12 August 2013; pp. 424–439. [Google Scholar]
Figure 1. FE model of the EBM process, (a) with five layers, (b) with fifteen layers.
Metals 10 01151 g001
Figure 2. (a) Preheating temperature for the whole model. (b) Radiation surrounding the base plate and deposited layers.
Metals 10 01151 g002
Figure 3. Electron beam movement.
Metals 10 01151 g003
Figure 4. Contact between the base plate material and the powder layers, and between successive layers.
Metals 10 01151 g004
Figure 5. Meshed FE model.
Metals 10 01151 g005
Figure 6. Using model change to activate the deactivated layers during the EBM process.
Metals 10 01151 g006
Figure 7. EBM printed thin-walled parts for model validation.
Metals 10 01151 g007
Figure 8. Profile projector setup for measuring the distortion in the EBM parts.
Metals 10 01151 g008
Figure 9. The Contour GTK 3D profilometer from Bruker.
Metals 10 01151 g009
Figure 10. Contour and cross-section plots of temperature field of the melt pool and surrounding areas at different times: (a) Layer-1 (contour plot), (b) Layer-1 (cross-section plot), (c) Layer-2 (cross-section plot), (d) Layer-3 (cross-section plot), (e) Layer-4 (cross-section plot), (f) Layer-5 (cross-section plot), (g) Layer-3 (melt pool contour plot), and (h) Layer-3 (melt pool cross-section).
Metals 10 01151 g010
Figure 11. (a) Nodal path along the Z-axis (b) The plot for the temperature variation along the Z-axis nodal path, (c) nodal path along Y-axis, (d) the plot of the temperature variation along the Y-axis nodal path.
Metals 10 01151 g011
Figure 12. (a) Simulation results of temperature history after final cooling (Shen & Chou [14]) (b) Zoomed-in view of simulation results of temperature history after final cooling (Shen & Chou [14]) cooling (c) Current model simulation results of temperature history after final cooling (d) Zoomed-in view of current model simulation results of temperature history after final.
Metals 10 01151 g012
Figure 13. The Maximum temperatures compared with the experimental results.
Metals 10 01151 g013
Figure 14. (a) Von Mises stress during deposition at t = 9.125 s, layer-4. (b) Von Mises stress after final cooling.
Metals 10 01151 g014
Figure 15. Contour plots of residual stress within deposition (cross-section). (a) Von mises stress. (b) Normal stresses along the beam scan direction (S11, along X-axis), (c) normal stresses along the beam penetration direction (S22, along Y-axis), and (d) normal stresses along the beam scan direction (S33, along Z-axis).
Metals 10 01151 g015
Figure 16. Von Mises stress plot (a) During deposition (MPa) (b) Zoomed-in view at the first 15 s.
Metals 10 01151 g016
Figure 17. Von Mises stress after final cooling along the length of the deposited layers.
Metals 10 01151 g017
Figure 18. Current model simulation results of residual stress along with beam scan direction (length of the layers).
Metals 10 01151 g018
Figure 19. (a) Thermal distortion of the base plate along the X-axis. (b) Thermal distortion curve of the base plate along the X-axis. (c) Thermal distortion of the experimental base plate along the X-axis. (d) Thermal distortion curve of the experimental base plate along the X-axis.
Metals 10 01151 g019
Figure 20. Distortion along the Y-axis for the 50-layers (all sides) for 2.5 mm parts. (a) Left side from the front view. (b) Right side from the front view. (c) Left side from the bottom view. (d) Right side from the bottom view
Metals 10 01151 g020
Figure 21. Distortion along the Y-axis for the 100-layers (all sides) for 5 mm height parts. (a) Left side from the front view. (b) Right side from the front view. (c) Left side from the bottom view. (d) Right side from the bottom view
Metals 10 01151 g021
Figure 22. Comparison between current model result and measured distortion within the layers. (a) Left side from the front view (100 layers). (b) Right side from the bottom view (100 layers). (c) Left side from the front view (50 layers). (d) The distortion in the current model result (e) Right side from the bottom view (50 layers).
Metals 10 01151 g022
Figure 23. Microstructures obtained by microscope for Ti-6Al-4V alloys vs. current simulated model temperature profiles. (a) At 0.075 mm above the base plate (layer-2). (b) At 0.375 mm above the base plate (layer-8). (c) Temperature profile for layer-2. (d) Temperature profile for layer-8.
Metals 10 01151 g023
Figure 24. Scanning speed vs. temperature & stress.
Metals 10 01151 g024
Figure 25. Current vs. temperature& Von Mises Stress.
Metals 10 01151 g025
Figure 26. Voltage vs. temperature & Von Mises Stress.
Metals 10 01151 g026
Table 1. Material properties for the 304 stainless steel base plate [26].
Temperature (K)Density (kg/m3)Heat Capacity (J/(kg K))Thermal Conductivity (W/(m K))Thermal Expansion Coefficient (m/(m K))Yield Strength (MPa)Young’s Modulus (GPa)Poisson’s Ratio
2730.00794620.0146 1.7 × 10 5 265198.50.294
3730.007884960.0151 1.7 × 10 5 2181930.295
4730.007835120.0161 1.8 × 10 5 1861850.301
5730.007795250.0179 1.9 × 10 5 1701760.31
6730.007755400.018 1.9 × 10 5 1551670.318
8730.007665770.0208 2.0 × 10 5 1491590.326
10730.007566040.0239 2.0 × 10 5 911510.333
14730.007376760.0322 2.1 × 10 5 25600.339
15730.007326920.0337 2.1 × 10 5 21200.342
17730.007329350.12 2.2 × 10 5 10100.388
Table 2. Material properties for Ti-6Al-4V [15,27].
Temperature (K)Density (kg/m3)Heat Capacity (J/(kg K))Thermal Conductivity (W/(m K))
Solid
Thermal Conductivity (W/(m K))
Powder [21]
Thermal Expansion Coefficient (m/(m K))Yield Strength (MPa)Young’s Modulus (GPa)Poisson’s Ratio
293442054670.2 9 × 10 6 8501020.345
40044025677.8- 9.16 × 10 6 7201010.35
50043915918.9- 9.31 × 10 6 680950.355
600437661110.5- 9.46 × 10 6 630910.36
700436163611.7- 9.61 × 10 6 590850.365
800434565613- 9.76 × 10 6 540800.37
900433167914.5- 9.90 × 10 6 490750.375
1000431969916.2- 1.01 × 10 5 450700.385
1100430371918.4- 1.02 × 10 5 400650.395
1200428973320.1- 1.04 × 10 5 360600.405
1300427864719.7- 1.05 × 10 5 315350.43
1400426466421.7- 1.06 × 10 5 268200.43
195041897907228.3 1.10 × 10 5 20100.43
Table 3. Model transformation phases.
LayerPhaseStepDescriptionTime (s)Total Time (s)
Complete modelPreheatingInitialPreheating phase for the whole model at 1003k00
L1Melting1Electron beam scanning along X-Z direction0.02650.0265
Cooling2Transformation of material from powder to solid-state then cooling phase33.0265
L2Melting3Activation of layer-2 and scanning of electron beam along X-Z direction0.02653.0795
Cooling4Transformation of material from powder to solid-state then cooling phase36.0795
L3Melting5Activation of layer-3 and scanning of electron beam along X-Z direction0.02656.106
Cooling6Transformation of material from powder to solid-state then cooling phase39.106
L4Melting7Activation of layer-4 and scanning of electron beam along X-Z direction0.02659.1325
Cooling8Transformation of material from powder to solid-state then cooling phase312.1325
L5Melting9Activation of the next layer and scanning of electron beam along X-Z direction0.026512.159
Cooling10Transformation of material from powder to solid-state then cooling phase1100112.16
Total time1112.16
Table 4. Parameters used in the simulations and for producing the EBM parts [29].
ParametersValues
Electron beam diameter, Φ (mm)0.3
Scan speed, v (mm/s)400
Acceleration voltage, U (kV)60
Beam current, Ib (mA)0.002
Powder layer thickness, tlayer (mm)0.05
Beam penetration depth, dP (mm)0.05
Preheat temperature, Tpreheat (k)1003
Table 5. The levels of scan speed changes.
ParameterLevel-1Level-2Level-3
Speed (mm/s)300400500
Current (mA)0.0020.0020.002
Voltage (kV)606060
Table 6. The levels of current changes.
ParameterLevel-1Level-2Level-3
Speed (mm/s)400400400
Current (mA)0.0010.0020.003
Voltage (kV)606060
Table 7. The levels of Voltage changes.
ParameterLevel-1Level-2Level-3
Speed (mm/s)400400400
Current (mA)0.0020.0020.002
Voltage (kV)50 60 70 k