Abstract
Wire and arc additive manufacturing (WAAM) provides a promising alternative to conventional machining for the production of large structures with complex geometry, as well as individualized low quantity components, using cost-efficient production resources. Due to the layer-by-layer build-up approach, process conditions, such as energy input, deposition patterns and heat conduction during the additive manufacturing process result in a unique thermal history of the structure, affecting the build-up properties. This experimental study aims to describe the effects of thermal cycling on the geometrical and material properties of wire arc additive manufactured Al-5356 aluminum alloy. Under consideration, that Al-5356 is a non-heat treatable alloy, a significant effect on geometrical formation is expected. Linear wall samples were manufactured using pulsed cold metal transfer (CMT-P) under variation of wire-feed rate, travel speed and interpass temperatures. The samples were analyzed in terms of geometry; microstructural composition; hardness and residual stress. Furthermore, the mechanical properties were determined in different building directions.
1. Introduction
In recent years, additive manufacturing (AM) of metallic components gained growing interest in a wide range of industrial sectors such as civil engineering, turbine construction as well as automotive and aerospace industry [1,2,3,4]. Thereby, the economic efficiency compared to conventional manufacturing processes is mainly determined by high geometrical complexity and/or small series production [5,6]. In order to meet the requirements of different industrial sectors, a variety of AM processes, following different approaches of material deposition, have been developed. These processes can mainly be classified into powder-bed, powder and wire-feed processes [7]. Due to higher deposition rates and significantly higher maximum part size, wire-based processes such as wire and arc additive manufacturing (WAAM) are particularly suitable for near net-shape production of large components [8]. Furthermore, wire filler metals are more cost-efficient and available in a wider range of materials compared to powder materials [9,10]. On the other hand, the geometrical accuracy and the attainable component complexity are lower compared to powder-based processes [7].
During WAAM processing, the component is generated by a layer-wise deposition of molten filler metal. Melting of the filler material is achieved using electric arc or plasma as a heat source, thus combining well known arc welding processes such as gas metal arc welding (GMAW), gas tungsten arc welding (GTAW) or plasma arc welding (PAW) with wire as the feedstock [11,12,13]. Due to a simultaneously energy input and wire feed, the wire-feed orientation during GMAW is perpendicular to the forming substrate, offering advantages in automation and productivity [14].
Basic prerequisite for the application of AM technologies is that the resulting component properties meet the requirements of the operation purpose. This applies in particular to mechanical properties such as hardness, strength and ductility as well as to specific requirements such as corrosion resistance. Due to the layer-by-layer build-up approach, both the WAAM process itself and the geometrical and mechanical properties of the resulting components are directly related to the welding parameters and the deposited material. Compared to conventionally manufactured components, the primary material of AM components merely consists of weld metal. Accordingly, there is an increasing number of studies on material-specific processability and component properties. Regarding the resulting geometry, studies in [15,16] have shown an increase in surface waviness with increased energy input per length unit, reporting the main dependencies of geometry formation on heat input and heat accumulation during the AM process. Other than the effects on the resulting geometry, the welding process always results in a heat treatment of the surrounding material during deposition, causing microstructural changes in the current layer and the adjacent material. Depending on the deposited material, this can lead a non-uniform distribution of the mechanical properties [17]. Regarding this, various studies on WAAM of low-alloy and high-grade steels reported an increase in hardness and grain refinement towards the top layers of the deposited structure [11,18,19]. Aiming to reduce the influence of thermal cycling during WAAM and to actively affect the temperature–time regime during deposition as well as the resulting grain structure, recent studies have explored the implementation of active cooling systems [20,21,22]. However, most of the current research regarding the influence of temperature regimes on the resulting properties during additive manufacturing is focused on steel and titanium alloys. Research on WAAM using various aluminum alloys is mainly focused on microstructural evolution, pore formation as well as the effects of different arc modes on microstructure characteristics and mechanical properties [14,23,24,25,26].
Summarizing, the specific objective of this study is to investigate the heat accumulation and the influence of different temperature-time regimes on the resulting component properties during wire and arc additive manufacturing of Al-5356, providing a contribution on geometry formation and mechanical properties.
2. Materials and Methods
The experimental setup is presented in Figure 1a. A Fronius CMT Advanced 4000 R welding system (Fronius International GmbH, Wels, Austria) was used in CMT-Pulse mode with current characteristics according to the deposited material. The welding torch was connected to a KUKA KR22 6-axis robotic system (KUKA Deutschland GmbH, Augsburg, Germany). The presented studies have been conducted using thin-walled specimen with a length of 300 mm and a build-up height of approximately 140 mm. The process sequence is given in Figure 1b. Depending on the underlying process parameters, 100–120 single pass layers were conducted during sample preparation.
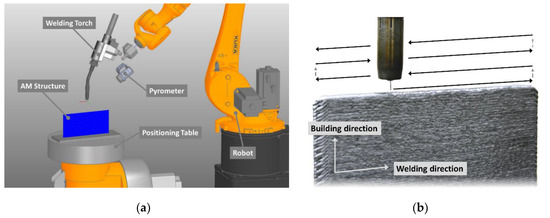
Figure 1.
Experimental setup (a) and process sequence for sample preparation (b).
The experimental trials were carried out on Al-6082 base plates with dimensions of 400 × 125 × 15 mm3. The base plate material was chosen as a typical aluminum alloy ensuring good weldability and thermal conductivity. As the presented research is focused on the material and geometrical properties of the AM component, the base plate material does not affect the findings. Prior to welding, organic residues on the base plate were removed with acetone. The deposited wire was an Al-5356 solid wire electrode with a diameter of 1.0 mm. The chemical composition of the used materials is given in Table 1.

Table 1.
Nominal composition of welding wire and substrate material.
Referring to previous findings, welding parameters such as wire feed and welding speed show a great influence on the geometrical characteristics of the components processed by WAAM. In order to further describe the influence of the process parameters on geometrical properties, thin-walled samples were manufactured with two different settings of process parameters (Series A, Series B). The process parameters of Series A and Series B were chosen to result in similar energy input per unit length to ensure a comparable heat input during welding. Aiming to obtain different temperature profiles during the build-up sequence, thin-walled samples were prepared using different intermediate times (ti) between layers. Table 2 provides the welding parameters used for processing the samples. For all specimens, the preheating temperature of the base plate was set at approximately 100 °C. During build-up, a contact tube to work piece distance of 10 ± 3 mm was maintained. Pure Argon (Ar ≥ 99.996%) was used as shielding gas with a flow rate of 14 L/min.
Table 2.
Welding parameters for processing of samples.
In order to describe the occurring temperatures during welding, type-K thermocouples were positioned at the base plate at a distance of 9.5 ± 0.8 mm to the fusion line. Further, an infrared pyrometer (Optris CTlaser 3MH, Optris GmbH, Berlin, Germany) with a measuring range from 100 to 600 °C was used to determine the interpass temperature in the middle of the respective topmost layer during build-up.
Prior to mechanical testing, the specimens were visually examined and measured regarding the resulting height and width. To assess changes in geometry during build-up, a width measurement was conducted at ten measurement points in building direction. Further, residual stress was analyzed by means of X-ray diffraction in the Series A specimen using a cobalt radiation source. Several measurements were taken in welding direction on the top layer and against the building direction. To produce a homogeneous surface for the measurement, electrolytic polishing was performed in the measuring area before testing. Stresses were determined from diffraction patterns by means of the sin²Ψ method using the (hkl) crystalline plane {331} of aluminum at eight Ψ-angles between 144° and 154°. The elastic constant was 0.5S2 = 18.93 mm²/N.
Samples for metallographic cross-sections, hardness measurement and tensile testing were sectioned from the AM structures as depicted in Figure 2. The start and end sections of the thin-wall were discarded. Metallographic samples were polished and etched using 2% hydrofluoric acid for macroscopic examination and Kroll etchant for microsections. Hardness measurements (HV1) were conducted equidistant on the cross-sectional samples using hardness testing according to Vickers (TUKON1202, ITW Test & Measurement GmbH, Esslingen, Germany). In addition, the micro hardness (HV0.005) was measured at different areas of the microsections depending on the microstructure composition. Samples for tensile testing were prepared and tested according to EN ISO 6892-1 standards (Figure 2b) at an extension rate of 3.2 mm/min.
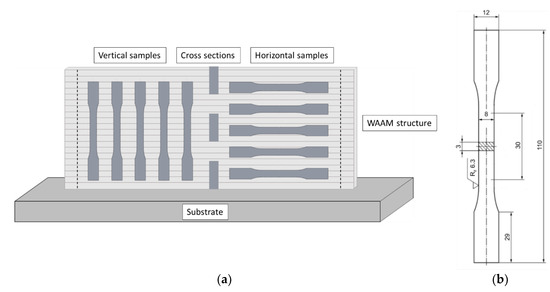
Figure 2.
Schematic representation of sample extraction (a) and dimensions of tensile samples according to DIN 50125 (b).
3. Results
3.1. Temperature Formation During WAAM
In order to describe temperature related effects on structural and mechanical properties of additive manufactured structures, temperature measurements were carried out on both the base plate and on the top layer during build-up. This allowed the determination of the temperature–time regimes during WAAM build-up with different intermediate times between layers. Due to similar energy input per unit length, both regarded parameter settings (Series A, B) resulted in comparable temperature profiles. Differences in the resulting geometry based on varying parameter settings, as described in Section 3.2, only showed a minor influence on the heat distribution due to a similar heat input. For the purpose of improved clarity, only temperature profiles of Series B are discussed below. However, the results can be transferred to Series A likewise.
The resulting temperature-time regime at the base plate is shown in Figure 3. Particular differences in temperature distribution can be detected during the first 10 to 15 build-up layers. For intermediate times of 120 s and 60 s, the graphs show a slight decrease in the average temperature due to heat dissipation at the base plate and the welding table. During build-up with an intermediate time of 30 s, no significant decrease in the base plate temperature could be observed. Further progression of the temperature profiles shows an increase in base plate temperature, reaching a peak at approximately half of the build-up height. During further build-up the base plate temperature decreases. The visible discontinuities in the curves for intermediate times of 120 s and 30 s near the top layers are caused by process interruptions. Due to their location outside of the tensile samples gauge length, the interruptions have no major effect on further results.
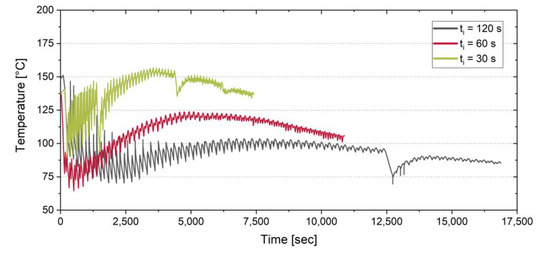
Figure 3.
Temperature distribution on the baseplate by example of Series B specimen.
The resulting temperature profiles on the base plate can be explained by basic mechanisms of heat flow. The heat flow in the thin-walled structure is described by terms of heat conduction, convection and thermal radiation. Neglecting the heat flow by thermal radiation, the heat flow at the base plate is mainly determined by heat conduction and convection. The heat conduction in the thin-walled structure is given by (1) with thermal conductivity λ, the cross-section area A and the wall height h:
Further, the heat flow to the environment due to convection is given by (2) with the heat transfer coefficient η, the surface area of the wall S and the temperature difference between wall and room temperature:
Relating to the periodically growing wall structure, the wall height increases over time, leading to a constant decrease of the heat flow . By contrast, the heat flow due to convection increases over time as the wall surface increases, leading to a higher heat transfer to the environment. In combination, the temperature on the base plate decreases with increasing wall height, after reaching a maximum at a build-up height of about 70 mm.
The following Figure 4 shows the development of interpass temperature for the examined intermediate times between layers during additive manufacturing. The data indicates a correlation between interpass and base plate temperature during the first 30 layers. Further build-up leads to increasing interpass temperatures, reaching saturation depending on the intermediate time between the layers. Thereby, the determined interpass temperature substantially exceeds the base plate temperature for intermediate times of 60 s and 30 s.
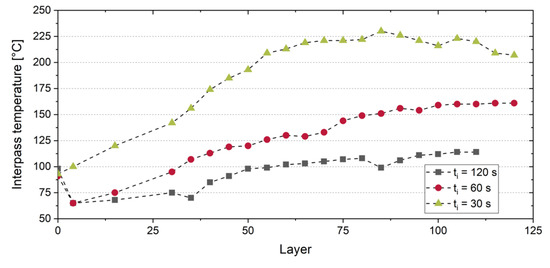
Figure 4.
Interpass temperature depending on number of layers and intermediate time between layers by example of Series B specimen.
The results on temperature distribution identify that the measuring point is of key importance in order to describe the heat distribution and correlations between energy input and occurring temperatures. Based on the examined thin-walled structure, a direct influence of the continuously changing geometry during additive manufacturing on the temperature distribution within the component could be shown.
3.2. Effects on Resulting Geometry
During additive manufacturing of complex components with high requirements on geometrical and material accuracy, information about the effects of process parameters on the resulting geometry is of primary importance. Aiming to describe the influence of the underlying welding parameters at different temperature–time regimes on the resulting geometry, the average layer height as well as the wall width were determined at the final samples.
The material accumulation during WAAM is presented in Figure 5 by means of cross-section micrographs taken from the center of the respective thin-walled structures. Overall, the micrographs show a defined deposition pattern throughout the considered range of the building parameters. What stands out is a periodical lateral shift of the layers at the Series A (ti = 30 s) sample. These shifts only show minor influence on the overall waviness of the wall surface. By visual inspection, a more even surface could be obtained using an intermediate time between layers of ti ≤ 60 s resulting in interpass temperatures Ti > 125 °C. Further, a fine dispersed porosity could be detected in the Series A (ti = 120 s) sample.
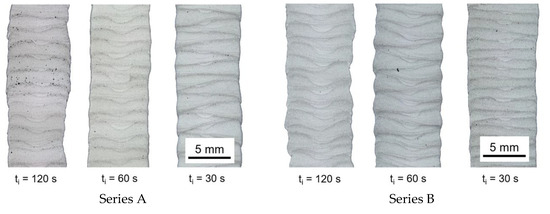
Figure 5.
Cross-section micrographs of wire and arc additive manufacturing (WAAM) samples with varying process strategies.
Previous findings reported in [27,28] have shown the influence of wire feed and welding speed on the height and width of the resulting geometry. It was reported that the wall width increases at higher wire-feed rates and decreases at higher welding speeds, whereas the wire feed shows a dominant influence. Further, the layer height increases at higher wire feed and decreases at higher welding speed with dominant influence of the welding speed.
Figure 6 compares the resulting layer height (Figure 6a) and the wall width (Figure 6b) as a function of the intermediate time ti between each layer for both welding strategies considered. For both welding strategies, the average layer height shows a steady increase with increasing waiting time between layers. This indicates that higher interpass temperatures lead to a reduction in layer height. On average, the layer height of Series A is about 0.15 mm higher compared to Series B, confirming the dominant influence of the welding speed on the average layer height reported in [27]. Although the difference in height is low in regard to single layers, the differences add up during build-up and may cause process instability or errors. The wall width showed higher values for Series B specimen due to the influence of a higher wire feed used compared to Series A specimen. Further, the wall width was found to increase in the building direction, indicating an influence of the interpass temperature. Since the interpass temperatures increase in building direction (Section 3.1.), it can be concluded that higher interpass temperatures lead to an increase in wall width. This also leads to comparatively high deviations due to average determination on basis of ten measured values in building direction.
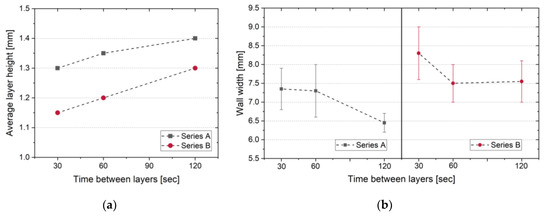
Figure 6.
Effect of building strategy on average layer height (a) and wall width (b).
The investigation of the resulting geometry indicated a different geometrical formation despite similar energy input per length unit for the welding strategies considered and thus confirming a different emphasis of the main welding parameters influence on geometrical formation during WAAM. Accordingly, a verification of the geometry after any adaption of the process parameters is suggested.
3.3. Residual Stress and Mechanical Properties
The longitudinal residual stress was analyzed on samples of Series A in the as-welded condition manufactured. Figure 7a shows the stress distribution determined on the top layer of the specimens. The residual stress in welding direction varies along the measuring path from approximately −75 MPa to +150 MPa. The individual scatter at discrete measuring locations from the sin²-calculation is in the order of ±30 to ±50 MPa due to coarse microstructure. However, a clear influence of the intermediate time between layers is not visible.
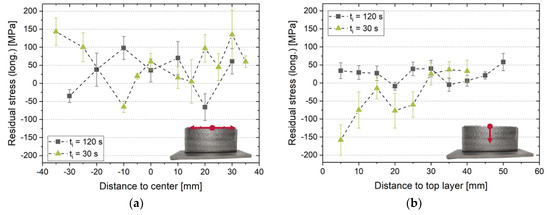
Figure 7.
Residual stress in welding (a) and building (b) direction (Series A).
Figure 7b depicts the residual stress distribution at the side of the specimens, measured from top layer downwards. The abscissa indicates the distance of the measuring point from the top layer with positive values directing to the base plate. In addition, shown here are the residual stresses in the welding direction. The residual stress magnitudes are more homogeneous than on the top layer and the scatter is smaller. The residual stress ranges from approximately 0 MPa to +50 MPa at an intermediate time of 120 s. A tendency of decreasing residual stress can be observed near the top layers at an intermediate time of 30 s.
Overall, the residual stress in the investigated WAAM aluminum structure appears to be of low magnitude. This can be explained by the heat conduction properties of the alloy in combination with its low yield strength. This leads to homogeneous temperature distributions during relatively fast cooling times. Further, the metal is relatively soft causing yielding of residual stress. These effects are also known from conventional fusion welding of aluminum alloys.
The hardness test according to Vickers was conducted using cross-section samples from the bottom, middle and top part from the thin-walled samples (see Figure 2). The hardness distributions for different intermediate time between the layers in the as-build condition are given in Figure 8 by example of Series B specimen. Hardness values ranged from 66 to 72 HV1 showing no significant dependency on the build-up height and therefore stating independency of hardness values on temperature distribution. This result can be explained by the fact that the investigated aluminum Al-5356 is a non-heat treatable alloy.
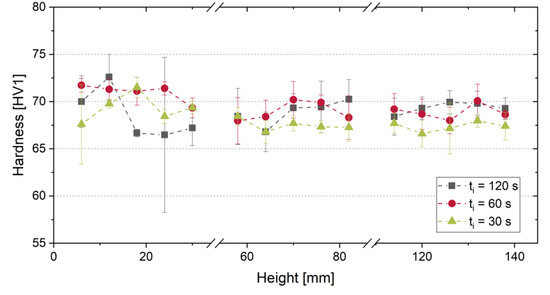
Figure 8.
Hardness distribution depending on build-up height and intermediate time between layers by example of Series B.
Aiming to describe the tensile properties of additive manufactured Al-5356 depending on the investigated process settings, yield strength (Rp0.2), tensile strength and elongation were determined horizontally and vertically to the welding direction. The results on tensile properties can be compared in Figure 9.
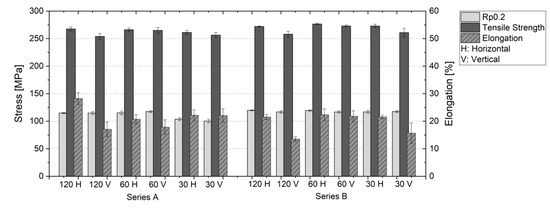
Figure 9.
Tensile properties of WAAM processed Al-5356.
Depending on the welding parameters and test direction, the average values of yield strength reach 115–120 MPa, ultimate tensile strength 254–277 MPa and elongation 14–28%. Therefore, all batches achieved both strength and ductility properties of wrought material (EN AW-5019 (F): Rm ≥ 250 MPa; Rp0,2 ≥ 110 MPa; A ≥ 14%). What stands out is that tensile strength and elongation were generally found to be lower for batches in vertical direction compared to horizontal samples (see Figure 9). Especially at long intermediate times between layers, i.e., lower interpass temperatures, the elongation showed up to 40% lower values in vertical direction. The higher deviation in the values for vertical specimens from Series B welded with ti = 30 s can be attributed to fracture locations near the end of the gage length and therefore measurement of elongation could contain errors. The result of an anisotropic material behavior may be explained by an inhomogeneous microstructure at the fusion line boundaries, resulting in less favorable conditions for the vertical load direction. On basis of the microscopic examination shown in Figure 10, three distinct areas of different metallurgical properties in the layer structure could be determined. Near the fusion line boundary, regions with a fine grain microstructure and comparatively high micro hardness are formed (Figure 10a). By contrast, regions below the interlayer boundary are characterized by coarse grain microstructure with an increased formation of segregations (Al8Mg5) at the grain boundaries and lower hardness (Figure 10c). The grain growth may be explained by the thermal influence of the following layer. An interlayer boundary zone with a further increased occurrence of segregations can be identified (Figure 10b). In these regions, primary stages and segregations merged at the grain boundaries as a result of comparatively long heat exposure. Due to the difference in hardness, grain size and the formation of segregations, these areas can act as metallurgical notches, thus affecting the mechanical properties in vertical loading direction. The most consistent results regarding the anisotropic material behavior could be found for Series B specimen with intermediate time between layers of 30 s. Although interpass temperature was increasing during the built-up sequence, no distinct effect of sample allocation on the tensile properties could be observed.
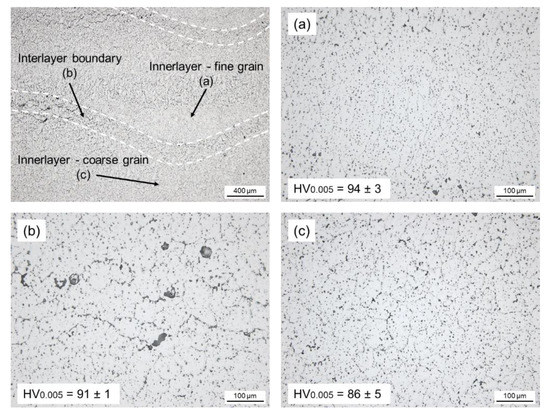
Figure 10.
Microstructure and micro hardness of innerlayer fine grain (a), interlayer boundary (b) and innerlayer coarse grain (c) regions for Series A specimen with ti = 120 s.
4. Conclusions
Within the underlying study, the effects of different temperature-time regimes during wire and arc additive manufacturing of Al-5356 on both the geometrical and mechanical properties have been systematically investigated. Linear thin-walled samples were built and analyzed with the following conclusions:
- Temperature profiles during WAAM processing indicated that the temperature distribution is directly related to the geometry of the additive manufactured component. Due to a continuously changing geometry, a non-steady temperature distribution during WAAM can be assumed. However, steady geometrical build-up results can be expected by obtaining uniform temperature fields.
- Although different process strategies, using the same energy input per length unit, lead to comparable temperature distributions and cooling rates, they showed differences in the resulting geometry of the component. An increase in wire feed and welding speed resulted in lower layer height and increased wall width. Furthermore, higher interpass temperatures led to an increase in wall width and lower layer height.
- Residual stresses in the top layer and on the surface of the wall specimen appeared of low magnitude due to small temperature gradients combined with a comparably low yield strength of the regarded material.
- Material properties were evenly distributed over the build-up geometry with values comparable to AlMg5 wrought material. No significant dependency on the temperature-time regime during processing could be detected. However, the mechanical properties, especially the elongation at fracture, showed dependencies on the loading in relation to the build-up direction.
Author Contributions
Conceptualization, M.K. and J.H.; methodology, M.K. and J.H.; validation, J.H.; formal analysis, M.K.; investigation, M.K.; resources, K.D.; data curation, J.H.; writing—original draft preparation, M.K.; writing—review and editing, J.H.; visualization, M.K.; supervision, K.D.; project administration, J.H. and K.D. All authors have read and agreed to the published version of the manuscript.
Funding
This research received no external funding.
Acknowledgments
We acknowledge support by the German Research Foundation and the Open Access Publication Funds of the Technische Universität Braunschweig.
Conflicts of Interest
The authors declare no conflict of interest.
References
- Buchanan, C.; Gardner, L. Metal 3D printing in construction: A review of methods, research, applications, opportunities and challenges. Eng. Struct. 2019, 180, 332–348. [Google Scholar] [CrossRef]
- Frazier, W.E. Metal Additive Manufacturing: A Review. J. Mater. Eng. Perform. 2014, 23, 1917–1928. [Google Scholar] [CrossRef]
- Grunwald, R.; Mayer, M.; Schörghuber, M. WAAM-Technologie und aktuelle Anwendungen: DVS-Berichte Congress 2018. DVS Media GmbH 2018, 344, 97–103. [Google Scholar]
- Brandl, E.; Baufeld, B.; Leyens, C.; Gault, R. Additive manufactured Ti-6Al-4V using welding wire: Comparison of laser and arc beam deposition and evaluation with respect to aerospace material specifications. Phys. Procedia 2010, 5, 595–606. [Google Scholar] [CrossRef]
- Busachi, A.; Erkoyuncu, J.; Colegrove, P.; Martina, F.; Watts, C.; Drake, R. A review of Additive Manufacturing technology and Cost Estimation techniques for the defense sector. CIRP J. Manuf. Sci. Technol. 2017, 19, 117–128. [Google Scholar] [CrossRef]
- Cunningham, C.; Wikshåland, S.; Xu, F.; Kemakolam, N.; Shokrani, A.; Dhokia, V.; Newman, S. Cost Modelling and Sensitivity Analysis of Wire and Arc Additive Manufacturing. Procedia Manuf. 2017, 11, 650–657. [Google Scholar] [CrossRef]
- Ding, D.; Pan, Z.; Cuiuri, D.; Li, H. Wire-feed additive manufacturing of metal components: Technologies, developments and future interests. Int. J. Adv. Manuf. Technol. 2015, 81, 465–481. [Google Scholar] [CrossRef]
- Thomas-Seale, L.E.J.; Kirkman-Brown, J.C.; Attallah, M.M.; Espino, D.M.; Shepherd, D.E.T. The barriers to the progression of additive manufacture: Perspectives from UK industry. Int. J. Prod. Econ. 2018, 198, 104–118. [Google Scholar] [CrossRef]
- Baufeld, B.; Widdison, R.; Dutilleul, T.; Bridger, K. Electron Beam Additive Manufacturing at the Nuclear AMRC. Elektron. Elektrotech. 2016, 51, 25. [Google Scholar]
- Taminger, K.M.; Hafley, R.A. Electron Beam Freeform Fabrication for Cost Effective Near-Net Shape Manufacturing. In Proceedings of the Meeting on Cost Effective Manufacture via Net Shape Processing, Amsterdam, The Netherlands, 15–17 May 2006. [Google Scholar]
- Liberini, M.; Astarita, A.; Campatelli, G.; Scippa, A.; Montevecchi, F.; Venturini, G.; Durante, M.; Boccarusso, L.; Minutolo, F.M.C.; Squillace, A. Selection of Optimal Process Parameters for Wire Arc Additive Manufacturing. Procedia CIRP 2017, 62, 470–474. [Google Scholar] [CrossRef]
- Hoefer, K.; Haelsig, A.; Mayr, P. Arc-based additive manufacturing of steel components—Comparison of wire-and powder-based variants. Weld World 2018, 62, 243–247. [Google Scholar] [CrossRef]
- Reisgen, U.; Sharma, R.; Oster, L.; Zanders, E. Plasma-Mehrdraht-Schweißen zum Herstellen gradierter Strukturen. In Proceedings of the DVS CONGRESS, Friedrichshafen, Germany, 17–18 September 2018; DVS 344. pp. 109–114. [Google Scholar]
- Fang, X.; Zhang, L.; Li, H.; Li, C.; Huang, K.; Lu, B. Microstructure Evolution and Mechanical Behavior of 2219 Aluminum Alloys Additively Fabricated by the Cold Metal Transfer Process. Materials 2018, 11, 812. [Google Scholar] [CrossRef]
- Kazanas, P.; Deherkar, P.; Almeida, P.; Lockett, H.; Williams, S. Fabrication of geometrical features using wire and arc additive manufacture. Proceedings of the Institution of Mechanical Engineers. Part B J. Eng. Manuf. 2012, 226, 1042–1051. [Google Scholar] [CrossRef]
- Venturini, G.; Montevecchi, F.; Scippa, A.; Campatelli, G. Optimization of WAAM Deposition Patterns for T-crossing Features. Procedia CIRP 2016, 55, 95–100. [Google Scholar] [CrossRef]
- Workowski, M.; Nitschke-Pagel, T.; Dilger, K. Load induced inhomogeneous plastic deformations in welded aluminium joints. Weld. World 2014, 58, 529–538. [Google Scholar] [CrossRef]
- Ge, J.; Lin, J.; Chen, Y.; Lei, Y.; Fu, H. Characterization of wire arc additive manufacturing 2Cr13 part: Process stability, microstructural evolution, and tensile properties. J. Alloys Compd. 2018, 748, 911–921. [Google Scholar] [CrossRef]
- Suryakumar, S.; Karunakaran, K.P.; Chandrasekhar, U.; Somashekara, M.A. A study of the mechanical properties of objects built through weld-deposition. Proc. Inst. Mech. Eng. Part B J. Eng. Manuf. 2013, 227, 1138–1147. [Google Scholar] [CrossRef]
- Henckell, P.; Günther, K.; Ali, Y.; Bergmann, J.P.; Scholz, J.; Forêt, P. The Influence of Gas Cooling in Context of Wire Arc Additive Manufacturing—A Novel Strategy of Affecting Grain Structure and Size. In The Minerals, Metals & Materials Series, TMS 2017 146th Annual Meeting & Exhibition Supplemental Proceedings; BSpringer International Publishing: Cham, Switzerland, 2017; pp. 147–156. [Google Scholar]
- Li, F.; Chen, S.; Shi, J.; Zhao, Y.; Tian, H. Thermoelectric Cooling-Aided Bead Geometry Regulation in Wire and Arc-Based Additive Manufacturing of Thin-Walled Structures. Appl. Sci. 2018, 8, 207. [Google Scholar] [CrossRef]
- Shi, J.; Li, F.; Chen, S.; Zhao, Y.; Tian, H. Effect of in-process active cooling on forming quality and efficiency of tandem GMAW–based additive manufacturing. Int. J. Adv. Manuf. Technol. 2019, 101, 1349–1356. [Google Scholar] [CrossRef]
- Gu, J.; Ding, J.; Williams, S.; Gu, H.; Ma, P.; Zhai, Y. The effect of inter-layer cold working and post-deposition heat treatment on porosity in additively manufactured aluminium alloys. J. Mater. Process. Technol. 2016, 230, 26–34. [Google Scholar] [CrossRef]
- Cong, B.; Ding, J.; Williams, S. Effect of arc mode in cold metal transfer process on porosity of additively manufactured Al-6.3%Cu alloy. Int. J. Adv. Manuf. Technol. 2015, 76, 1593–1606. [Google Scholar] [CrossRef]
- Fang, X.; Zhang, L.; Chen, G.; Dang, X.; Huang, K.; Wang, L.; Lu, B. Correlations between Microstructure Characteristics and Mechanical Properties in 5183 Aluminium Alloy Fabricated by Wire-Arc Additive Manufacturing with Different Arc Modes. Materials 2018, 11, 2075. [Google Scholar] [CrossRef] [PubMed]
- Derekar, K.; Lawrence, J.; Melton, G.; Addison, A.; Zhang, X.; Xu, L. Influence of Interpass Temperature on Wire Arc Additive Manufacturing (WAAM) of Aluminium Alloy Components. MATEC Web Conf. 2019, 269, 5001. [Google Scholar] [CrossRef]
- Köhler, M.; Tóth, T.; Hensel, J.; Dilger, K. Prozesscharakteristiken bei der lichtbogenbasierten generativen Fertigung metallischer Komponenten. DVS Ber. 39 Assist. Fügetechnik 2019, 356, 96–102. [Google Scholar]
- Köhler, M.; Fiebig, S.; Hensel, J.; Dilger, K. Wire and Arc Additive Manufacturing of Aluminum Components. Metals 2019, 9, 608. [Google Scholar] [CrossRef]


© 2020 by the authors. Licensee MDPI, Basel, Switzerland. This article is an open access article distributed under the terms and conditions of the Creative Commons Attribution (CC BY) license (http://creativecommons.org/licenses/by/4.0/).