Article

Effect of Annealing Prior to Cold Rolling on the Microstructure Evolution and Energy Losses of Low-Si, Ultra-Low-C Hot-Rolled Electrical Steel

by
Héctor Ortiz Rangel
1,*,
Armando Salinas Rodríguez
1 and
Omar García Rincón
2
1
Department of Metallurgical Engineering and Materials Science, Centro de Investigación y de Estudios Avanzados del Instituto Politécnico Nacional (CINVESTAV Saltillo), Ramos Arizpe 25900, Coahuila, Mexico
2
Depatment of Enginnering and Development, Ternium México S.A. de C.V, Monterrey 66450, Mexico
*
Author to whom correspondence should be addressed.
Metals 2020, 10(7), 957; https://doi.org/10.3390/met10070957
Submission received: 4 June 2020 / Revised: 6 July 2020 / Accepted: 8 July 2020 / Published: 16 July 2020

Abstract

:
The microstructure of a low Si, ultra-low-C, hot-rolled electrical steel strip is modified by annealing at T < To, the α→γ transformation temperature. This heat treatment causes the abnormal anisotropic growth of surface grains which consumes the original hot-rolled microstructure. The growth of the surface grains first takes place parallel to the rolling direction and then in a columnar form parallel to the normal direction until grains growing in opposite directions from the surfaces impinge at the center of the strip. It is shown that cold rolling and a short annealing treatment at temperatures between 700 and 800 °C leads to microstructures which result in iron energy losses that can be as much as 30% lower than those observed in the same material not subjected to the annealing prior to cold rolling. The magnitude of the reduction in energy losses depends on strip thickness and processing parameters. The major effect is observed in material annealed at 710 °C and the relative effect (with respect to material that is not annealed prior to cold rolling) decreases as the strip thickness decreases. It is shown that these effects can be attributed to the effect of the processing conditions on texture and grain size. The maximum reduction in energy losses is observed when the final microstructure consists of ferrite grains ~1.5 times larger than those obtained if the material is not annealed prior to cold rolling.

1. Introduction

Grain non-oriented (GNO) electrical steel is a soft magnetic material used for the manufacture of cores of electrical machinery, such as motors, generators, alternators, etc., where low energy losses and high permeability are required [1,2,3]. In general, grain size, crystallographic texture and secondary phase impurities strongly affect the final properties of this material [4,5,6,7]. The effect of grain size is rather complex: As the grain size increases, the energy losses due to magnetic hysteresis decrease but energy losses due to eddy currents increase. Therefore, there exists an optimum grain size that minimizes the total energy losses due to the alternating current [8,9]. Texture is also important in regard of the energy losses in these materials. The texture that minimizes the in-plane energy losses of GNO electrical steels is the <100>//ND fiber texture [10,11]. In contrast, the γ-fiber texture, <111>//ND, usually produced as a result of recrystallization and grain growth of cold-rolled and annealing of low-C steels, is very detrimental for magnetic properties since the lowest permeability axis <111> is aligned parallel to the normal direction of the sheet [12,13].
Conventionally, GNO electrical steel strips are processed from hot-rolled strips by cold rolling, continuous or batch annealing and temper rolling. Finally, after stamping from strip blanks, the laminations are subjected to long-term grain growth and decarburization annealing treatment at temperatures below Ac1 [8,14,15,16]. Alternative processing routes have been reported for the production of low core loss electrical steel grades. Optimized hot rolling, annealing prior to cold rolling and cold rolling in two steps with an intermediate annealing treatment [1,12] are some examples of these strategies.
The effect of annealing prior to cold rolling has been investigated by Hou [17] in an electrical steel containing 0.0023%C, 0.31%Si and 0.002%Al. The annealing of the hot-rolled strip caused an increase in the (110) and (200) pole densities and a decrease in the (211) and (222) pole densities at the end of processing. This type of texture, together with an increment in grain size, caused a reduction in energy losses in the final product. Other researchers [18] studied the effect of the temperature of annealing prior to cold rolling on the core losses of GNO electrical steels containing 0.0036%C, 0.3%Si and 0.0002%Al. It was observed that increasing the temperature of annealing of the hot band increases the {110} pole density and decreases the {211} and {222} pole densities during the final annealing. Although there was no significant effect of the temperature of annealing prior to cold rolling on the final grain size, the texture developed during the final annealing caused an improvement in the core losses. Paolinellia and da Cunha [1] produced a low core loss electrical steel with 3% (Si + Al) by optimizing the hot rolling process followed by a two-step cold rolling. The optimization of the core losses was attributed to the decrease in the [111]//ND texture component and the simultaneous increase in the [100]//ND texture component. However, this type of processing produced a negative effect on the mechanical properties, i.e., low elongation to fracture and high yield and tensile strengths. Kovac et al. [11] reported that the rotated cube {001} <110> texture developed during annealing at temperatures in the intercritical region causes an improvement in magnetic properties. The formation of the rotated cube texture was attributed to strain-induced boundary migration.
Previous work [19] has demonstrated that the intercritical annealing of low C, low Si-Al hot-rolled electrical steel strips at temperatures between Ac1 and Ac3 causes rapid decarburization and the development of large columnar ferrite grains free of carbide particles which, after cold rolling and a short annealing treatment, leads to carbide-free, large ferrite grain microstructures with magnetic and mechanical properties at least 30% superior to those observed typically in the same steel in the industrially fully processed conditions. These results have been attributed to the increment in grain size and to the development of a {100} fiber texture during the final annealing at temperatures up to 850 °C. Annealing at higher temperatures, T > Ac3, results in a strong {111} fiber texture and increases the quantity of second phase particles present in the microstructure which, in turn, result in negative effects on the final magnetic properties. In this way, annealing prior to cold rolling has been shown to be an attractive alternative processing route for the manufacture of fully processed low-C, low Si-Al GNO electrical steels strips.
One disadvantage of this processing route is that the hot-band annealing stage must be performed under oxidizing conditions to ease the decarburization process. Therefore, the steel strips must be strongly pickled prior to cold rolling. The oxidation of Si-Al, low-C electrical steels at T > 700 °C leads to four-layered oxide scales: an inner adherent, a thin iron–silicon–aluminum oxide layer (very difficult to remove by pickling) and an outer three-layered wüstite–magnetite–hematite oxide layer. It has been shown [20] that the significant decarburization in air of Si-Al, low-C electrical steels can occur in the range of 800 and 850 °C when thin, cracked oxide scales are formed. At higher temperatures, decarburization becomes slower due to the formation of thicker, crack-free oxide scales until at T > 950 °C, decarburization is practically inhibited. These observations are of great importance since decarburization is a requisite for the occurrence of the abnormal growth of surface ferrite grains which, after cold rolling and fast, short-term annealing, leads to microstructures that exhibit a significant reduction in energy losses. Slow decarburization leads to normal grain growth and the development of microstructures (grain size and texture) that impair the magnetic properties observed at the end of processing.
An obvious solution to this processing problem is the use of ultra-low-C steels and to perform the annealing of the hot band under non-oxidizing atmospheres. In this case, however, the intercritical temperature range occurs at significantly higher temperatures, which may not be suitable for the application of the hot-band annealing treatments in current box- or continuous-annealing industrial facilities. In addition, it is not known whether the same type of large columnar ferrite grains that lead to low core energy losses after cold rolling and fast, short-term annealing treatments of low carbon steels can be produced in ultra-low-C electrical steels.
This paper presents the results of an experimental study of the evolution of the microstructure of hot-rolled ultra-low-C electrical steel strips during annealing prior to hot rolling at T < T0, the α→γ transformation temperature, under a non-oxidizing atmosphere. In addition, the effects of the magnitude of the deformation (65–95% reduction in thickness by rolling) and the temperature of a fast, 3-min annealing treatment applied at temperatures between 700 and 800 °C on the resulting microstructure (texture and grain size) and iron energy losses were also investigated.

2. Experimental Material and Procedure

The material used in the present investigation comes from a 1.1 m wide, 1 m long and 2.34 mm thick sample cut from the end edge of a hot-rolled commercial electric steel coil. The sample plate was fabricated from a 200 mm thick continuous cast slab which was hot rolled in a four-high reversible mill into a 34 mm thick transfer bar. Finish rolling was performed in a six-stand continuous mill. Figure 1 illustrates the strain–temperature profile of finish rolling. In this figure, T0 = 950 °C is the ferrite to asutenite transformation temperature measured by dilatometry during heating at 0.25 °C/s. Water was used for descaling and no lubricant additives were used during hot rolling. As can be seen, most of the hot rolling deformation was applied in the austenite phase field, there was a total strain of −2.31, and the last pass was applied in the ferrite phase field (a strain of −0.23).
Table 1 shows the chemical composition of the hot-rolled plate measured by means of optical emission spectroscopy and the combustion method recommended by ASTM-1019 for C and S. From this sample, a number of 50 mm wide and 100 mm long strips were sectioned and annealed at temperatures in the range of 710 to 1030 °C. The heat treatments were performed under an ultra-high purity Ar atmosphere in a Thermo Scientific BF546 34PC furnace using a heating rate of 0.025 °C/s. The soaking time was varied from 103 to 5 × 10⁵ s depending on the temperature. Finally, in-furnace cooling was performed at a rate of −0.025 °C/s and the samples were pickled using a 20% HCL solution.
Cold rolling of the annealed hot rolled samples was performed using a laboratory two-high mill to total reductions in thickness of 65, 73, 82 and 92%. No lubrication was applied during cold rolling. Finally, the cold rolled samples were subjected to a fast annealing treatment for 3 min at temperatures of 700, 750 and 800 °C and air cooled. A reference sample was processed following the same route but without applying the annealing treatment to the hot-rolled material prior to cold rolling.
The ferrite to austenite transformation temperature was determined by dilatometry using a NETZSCH model DIL 402 dilatometer (NETZCH, Selb, Germany). Samples for dilatometry were 40 mm long, 10 mm wide and 2.34 mm thick and were heated at a rate of 0.025 °C/s under a UHP–Ar atmosphere.
The microstructure evolution through the processing route was characterized by optical microscopy and scanning electron microscopy. The grain size was measured from images obtained using an Olympus reflected light microscope (Model Vanox AH3, Olympus, (Tokio, Japón) and commercial image analysis software (Image-Pro version 7.0) using the average linear intercept procedure recommended in ASTM E-112. The growth kinetics of abnormal columnar grains were followed using images obtained at a magnification of 50× to determine the area fraction of columnar grains in the equiaxial grained matrix. These procedures were performed in at least 30 micrographs per sample.
Texture analysis at all processing steps was performed by Orientation Imaging Microscopy (OIM, Mahwah, NJ, USA) using back scattering electron diffraction in a Phillips XL30-ESEM electron microscope (Philips, Eindhoven, In the Netherlands) equipped with a TexSEM Laboratories TSL-OIM system. Orientation imaging maps were obtained throughout the thickness of the strips from rectangular areas 3990 × 2068 µm (~8 mm2) with a step size which was selected depending on the grain size, the smaller the grain size the smaller the step size. The large area scanned was selected since samples annealed prior to cold rolling developed microstructures with columnar grains with sizes exceeding 500 µm. The orientation distribution function (ODF), grain average misorientation (GAM) and image quality (IQ) maps were calculated using TSL-OIM 7.4 software. The ODFs were calculated using Bunge’s methodology, as implemented in the TSL-OIM software package.
Iron energy losses were measured in the rolling direction at 60 Hz in a SOKEN model DAC-BHW-6 single-sheet tester at 1.5 T and 60 Hz, using 30 mm × 70 mm samples through their thickness.

3. Results and Discussion

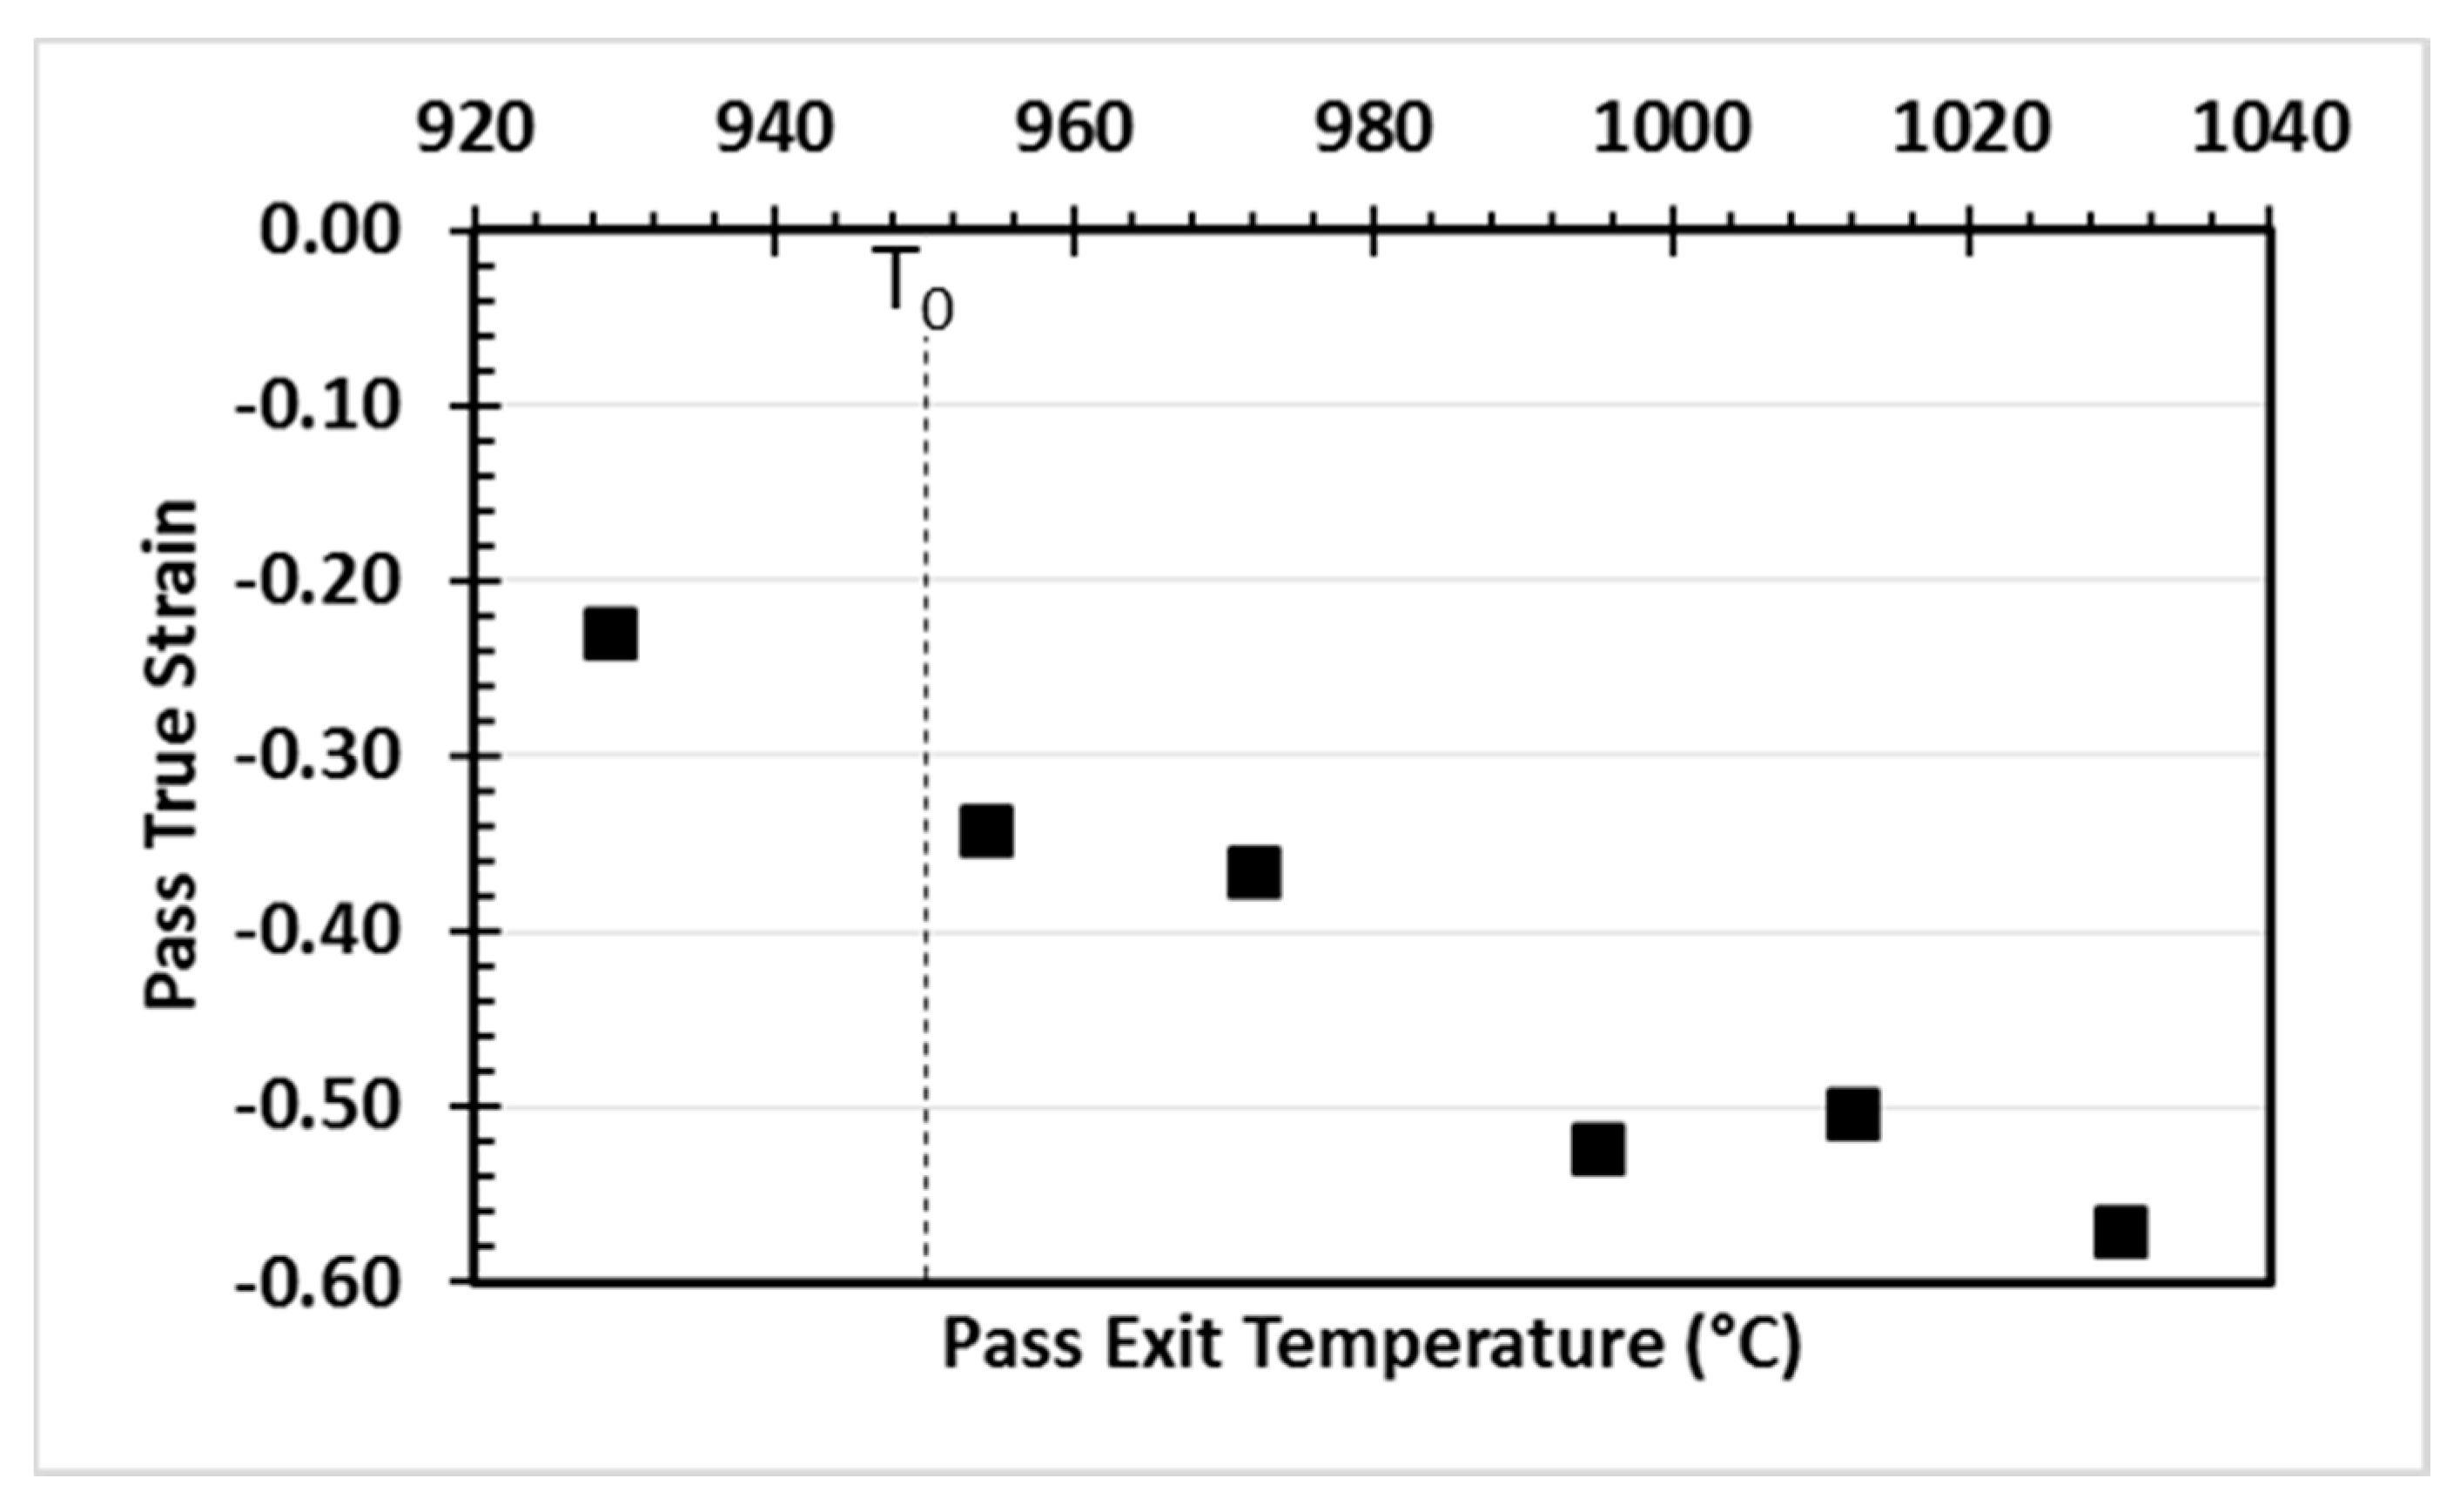
3.1. Characterization of the Microstructure of the Hot-Rolled Band

Figure 2a shows the IQ map obtained through the thickness of the hot-rolled sample. As can be observed, the grains exhibit a “pancake” morphology, slightly elongated parallel to the rolling direction. The average grain diameter for the bands indicated in the map was calculated using the area fraction method, assuming spherical grains. The following results were obtained: Band 1: 17.8 μm, Band 2: 26.4 µm, Band 3: 28.1 µm and Band 4: 33.5 µm. This result shows that, although the real morphology of the grains is not spherical, the difference in grain size between mid-thickness and the surface of the strip is significantly large (~46%).
The variation of the IQ index from the surface to mid-thickness is shown in Figure 2b. As can be seen, the IQ index decreases from mid-thickness to the surface. The IQ index depends on the local quantity of crystal defects (mainly dislocations). Therefore, the stored energy of the hot-rolled microstructure increases from the strip mid-thickness to its surfaces. Finally, an additional distinctive characteristic of the grains closer to the surface of the hot-rolled strip is shown in Figure 2c, the grain average misorientation (GAM) map. In general, the plastic deformation of polycrystalline materials results in local crystal rotation which gives rise to variations in lattice orientation, which can be calculated from individual measurements of Electron Backscatter Diffraction (EBSD) patterns. Thus, in principle, the GAM map may be related to variation in local plastic strain in the material. As can be seen in Figure 2c, although the GAM is fairly uniform within the individual grains, grains closer to the surfaces of the strip exhibit larger values of misorientation. Thus, the hot-rolled strip exhibits a strain gradient from the center of the surface of the strip. This type of strain gradient is typical of hot-rolled steel strips and are usually associated with the effects of friction between the strip and the rolls during processing. As will be shown below, this strain and stored energy gradients play major roles during the evolution of the microstructure during the annealing of the hot-rolled band. In summary, near surface grains in the hot-rolled strip can be considered special due to two main characteristics: (a) they have a smaller average size, (b) they exhibit larger accumulated plastic strain and, consequently, higher deformation stored energy.

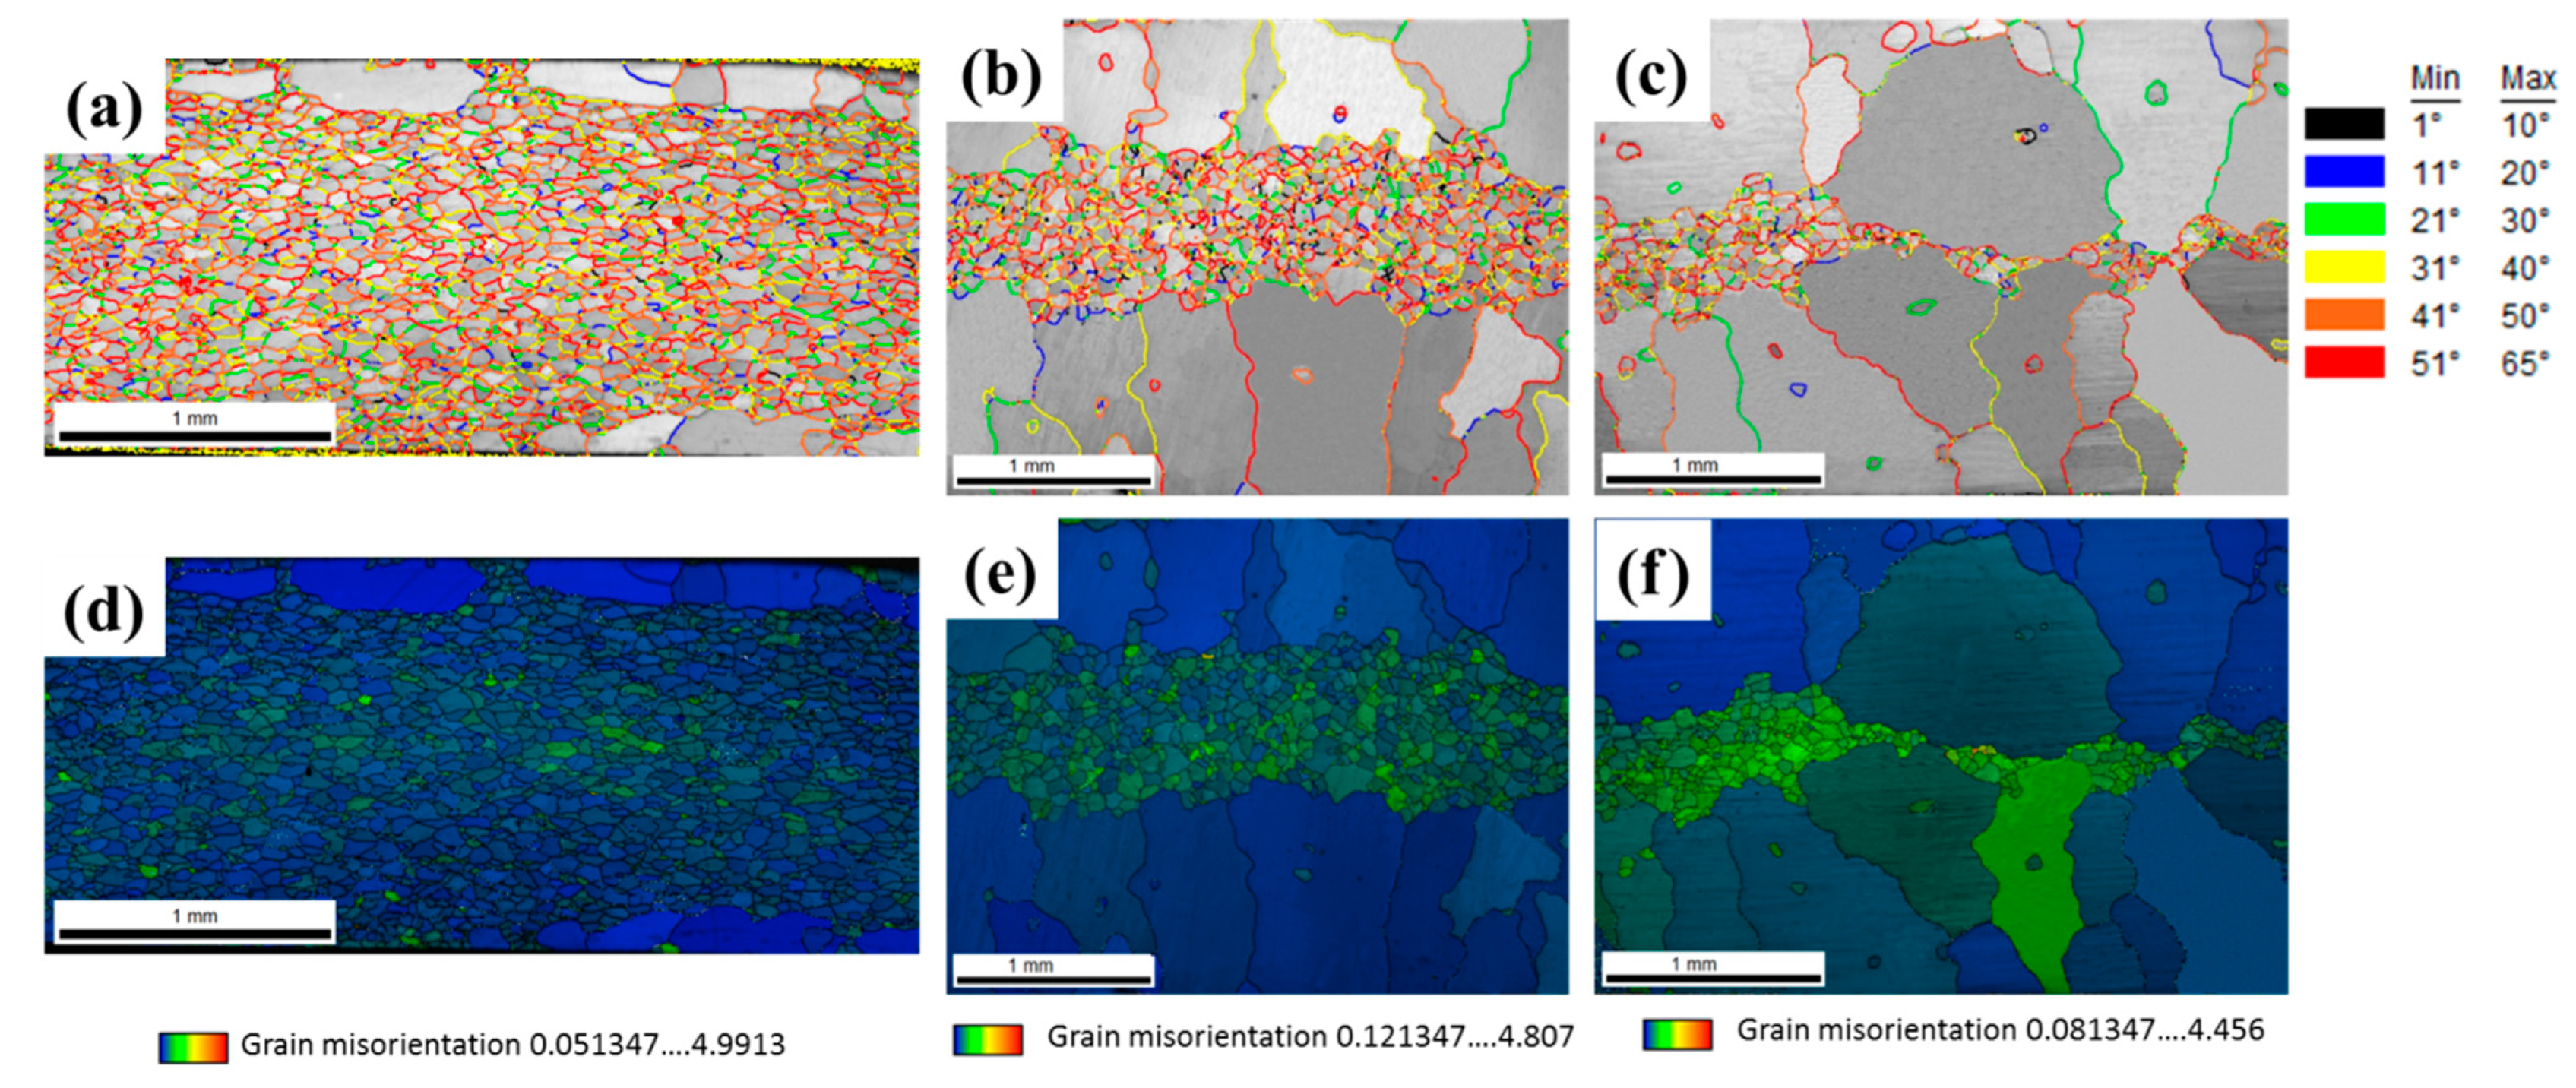
3.2. Columnar Grain Growth during Hot-Band Annealing

Figure 3 shows the dilatometry curve for the steel investigated. This elongation–temperature curve was obtained during heating at 0.025 °C/s. As can be seen, the contraction due to the start of the formation of the face centered cubic (FCC) phase is first detected at 950 °C and the transformation ends after 3320 s at 1033 °C. Therefore, the body centered cubic (BCC) and FCC phases coexist under non-equilibrium conditions during heating in the temperature range 950–1033 °C. This result indicates that isothermal heat treatments at 950 > T > 1033 °C take place in the BCC (ferrite, α) and the FCC (austenite, γ) phase fields, respectively. However, isothermal heat treatments performed in the range 950 < T < 1033 °C will need some time to complete the transformation of the BCC phase. According with the results presented in Figure 3, this transformation can take approximately 1 h when heating is performed slowly. Of course, as the temperature increases within this range, the α→γ transformation kinetics become faster and the time needed to complete the transformation is shorter.
Figure 4 illustrates the effect of annealing temperature on the microstructure through the thickness of the samples. As can be seen, annealing at T < 850 °C requires up to 72 h to completely replace the hot-rolled microstructure by the growth of the columnar grains. In contrast, annealing at T ≥ 850 °C required only 15 min. The areas of small grains observed at the mid-thickness of the strip annealed at 710 °C are part of the hot-rolled microstructure not yet consumed by the large columnar growing grains. The fraction of these small grains is very small compared with the fraction that represents the columnar microstructure and, therefore, we assume that they do not affect the analysis and conclusions of the present paper.
The microstructures can be classified into two different types. Materials annealed at temperatures lower than the α→γ transformation start temperature (T0) exhibit columnar ferrite grains. In this case, there are only two grains across the thickness of the strip. In contrast, materials annealed at T > T0 exhibit ferrite grains with very irregular morphologies and smaller sizes. In this case, the microstructures are the result of the α→γ→α transformation cycle. It should be noted that the samples annealed at 960 and 1030 °C still exhibit a few columnar grains. Columnar grains are no longer observed in samples annealed at T > 1030 °C. It appears then that the columnar ferrite grains observed in the sample annealed at 960 °C do not fully transform to austenite during the 15 min that the samples remain isothermally at that temperature. Therefore, in this sample, the microstructure consists of untransformed ferrite grains that grow in a columnar manner during heating, and irregularly shaped ferrite grains that are formed as a result of the γ→α transformation upon cooling. It is also noteworthy that the columnar grain growth rate depends very strongly on the annealing temperature below T0.
Figure 5 shows the evolution of the microstructure of the hot-rolled strip during annealing at 710 and 740 °C. As can be seen, after 12 h at 710 °C and 4 h at 740 °C, some grains with sizes several times larger than the matrix grains appear at the surface of the strips. These abnormal grains are formed by growth in two directions, parallel and normal to the rolling plane. Initially, the growth rate parallel to the rolling direction is faster that that parallel to the normal direction. This growth rate anisotropy results in grains with a pancake morphology, with their long dimension parallel to the rolling direction. It is evident in Figure 5 that this type of growth continues until grains that started to grow at different locations on the surface impinge and stop growing parallel to the rolling direction. When this occurs, the grains continue to grow parallel to the normal direction, leading to the columnar grain morphology. Columnar grain growth finally stops when grains growing from opposite surfaces of the strip impinge on each other at approximately the strip mid-thickness. The evolution of the microstructure during annealing at 850 °C is very similar to that observed at 710 and 740 °C but, as shown in Figure 4c, the process is completed in only 15 min.
It is clear then that some “special” grains present at or near the surface of the hot-rolled strip grow preferentially in the RD–TD plane, consuming all the matrix grains near the strip surface, and then in a columnar manner, consuming all the matrix grains in the sub-surface regions of the strip, until they impinge at mid-thickness.
Abnormal grain growth can occur only when the growth advantage of some “special” grains can persist as growth proceeds. It is evident in Figure 5c that the growth advantage of the growing columnar grains persists during the complete annealing treatment. Additionally, it is surprising that, at least in a qualitative way, the matrix grains do not change significantly in size as annealing proceeds. A growth advantage can result from: a) an energy advantage, i.e., greater driving force for growth due to elastic or plastic strain energy or surface energy or b) a mobility advantage, i.e., the grain can grow faster than its neighbors due to the intrinsic structure of its grain boundaries or due to the dragging effects of solutes or particles on the boundaries of other grains. Figure 6a–c show the grain boundary misorientation maps for samples annealed at 710 °C for 12, 36 and 48 h, respectively. As can be seen, most grain boundaries are general high angle boundaries and the annealing time does not have a significant effect on the grain misorientation distribution. Therefore, the growing columnar grains do have a size advantage but their grain boundaries do not seem to have a mobility advantage. Thus, the question is: Why and how do these surface grains develop a size advantage and maintain it during annealing? Srolovitz et al. [21] used Monte Carlo simulations to demonstrate that abnormal grain growth is favored in microstructures that exhibit differences in the gas–metal surface energy between grains of different crystallographic orientations. In this case, it was shown that the area fraction of abnormally growing grains follows Avrami-type kinetics with a time exponent of 1.8.
In the present investigation, the surface grains in the hot-rolled plate exhibit larger strain and stored energy (lower values of IQ index and greater values of GAM, see Figure 2) than sub-surface grains. These stored energy gradients are due to the severe shear deformation that the surface ferrite grains undergo during the last rolling pass (see Figure 1). Some of these surface grains with higher stored energy can recrystallize during annealing and reduce their local dislocation density to values lower than those of subsurface grains which do not have enough stored energy to recrystallize. As a result, a difference in local dislocation density at a high angle grain boundary between a recrystallized surface grain and a non-recrystallized sub-surface grain can be produced. This energy difference can provide the driving force for strain-induced boundary migration, which is responsible for both keeping the size advantage of the abnormally growing grains and the columnar morphology of these grains. As shown in Figure 7 the abnormal columnar grain growth at 710 and 740 °C in the present material also follows Avrami-type kinetics with time exponents of 1.81 and 1.89 at 710 and 740 °C, respectively. These values are in good correspondence with time exponents calculated by Srolovitz et al. [21].
A similar type of columnar abnormal growth behavior has been reported in hot-rolled and slightly cold-worked (5% reduction in thickness), low-C electrical steels [22]. In this case, it was demonstrated that columnar grains developed by strain-induced boundary migration (SIBM) due to the presence of through-thickness strain (deformation energy) gradients, similar to those shown in Figure 5 in the present material. Surface grains grow under the strain differences until they form larger grains with lower strain. The size advantage and the lower strain of grains covering a thin continuous layer right beneath the surface causes inversion of the strain gradient and further growth of the surface grains occurs in a direction perpendicular to the surface. This final growth results in the columnar morphology at the end of growth. Figure 6c–e illustrate the GAM maps for samples annealed at 710 °C for 12, 36 and 48 h, respectively. Comparing these maps with the one presented in Figure 2c for the hot-rolled material clearly makes it evident that the inversion of the strain gradient also occurs in the present material.

3.3. Effect of Columnar Grain Growth on Texture

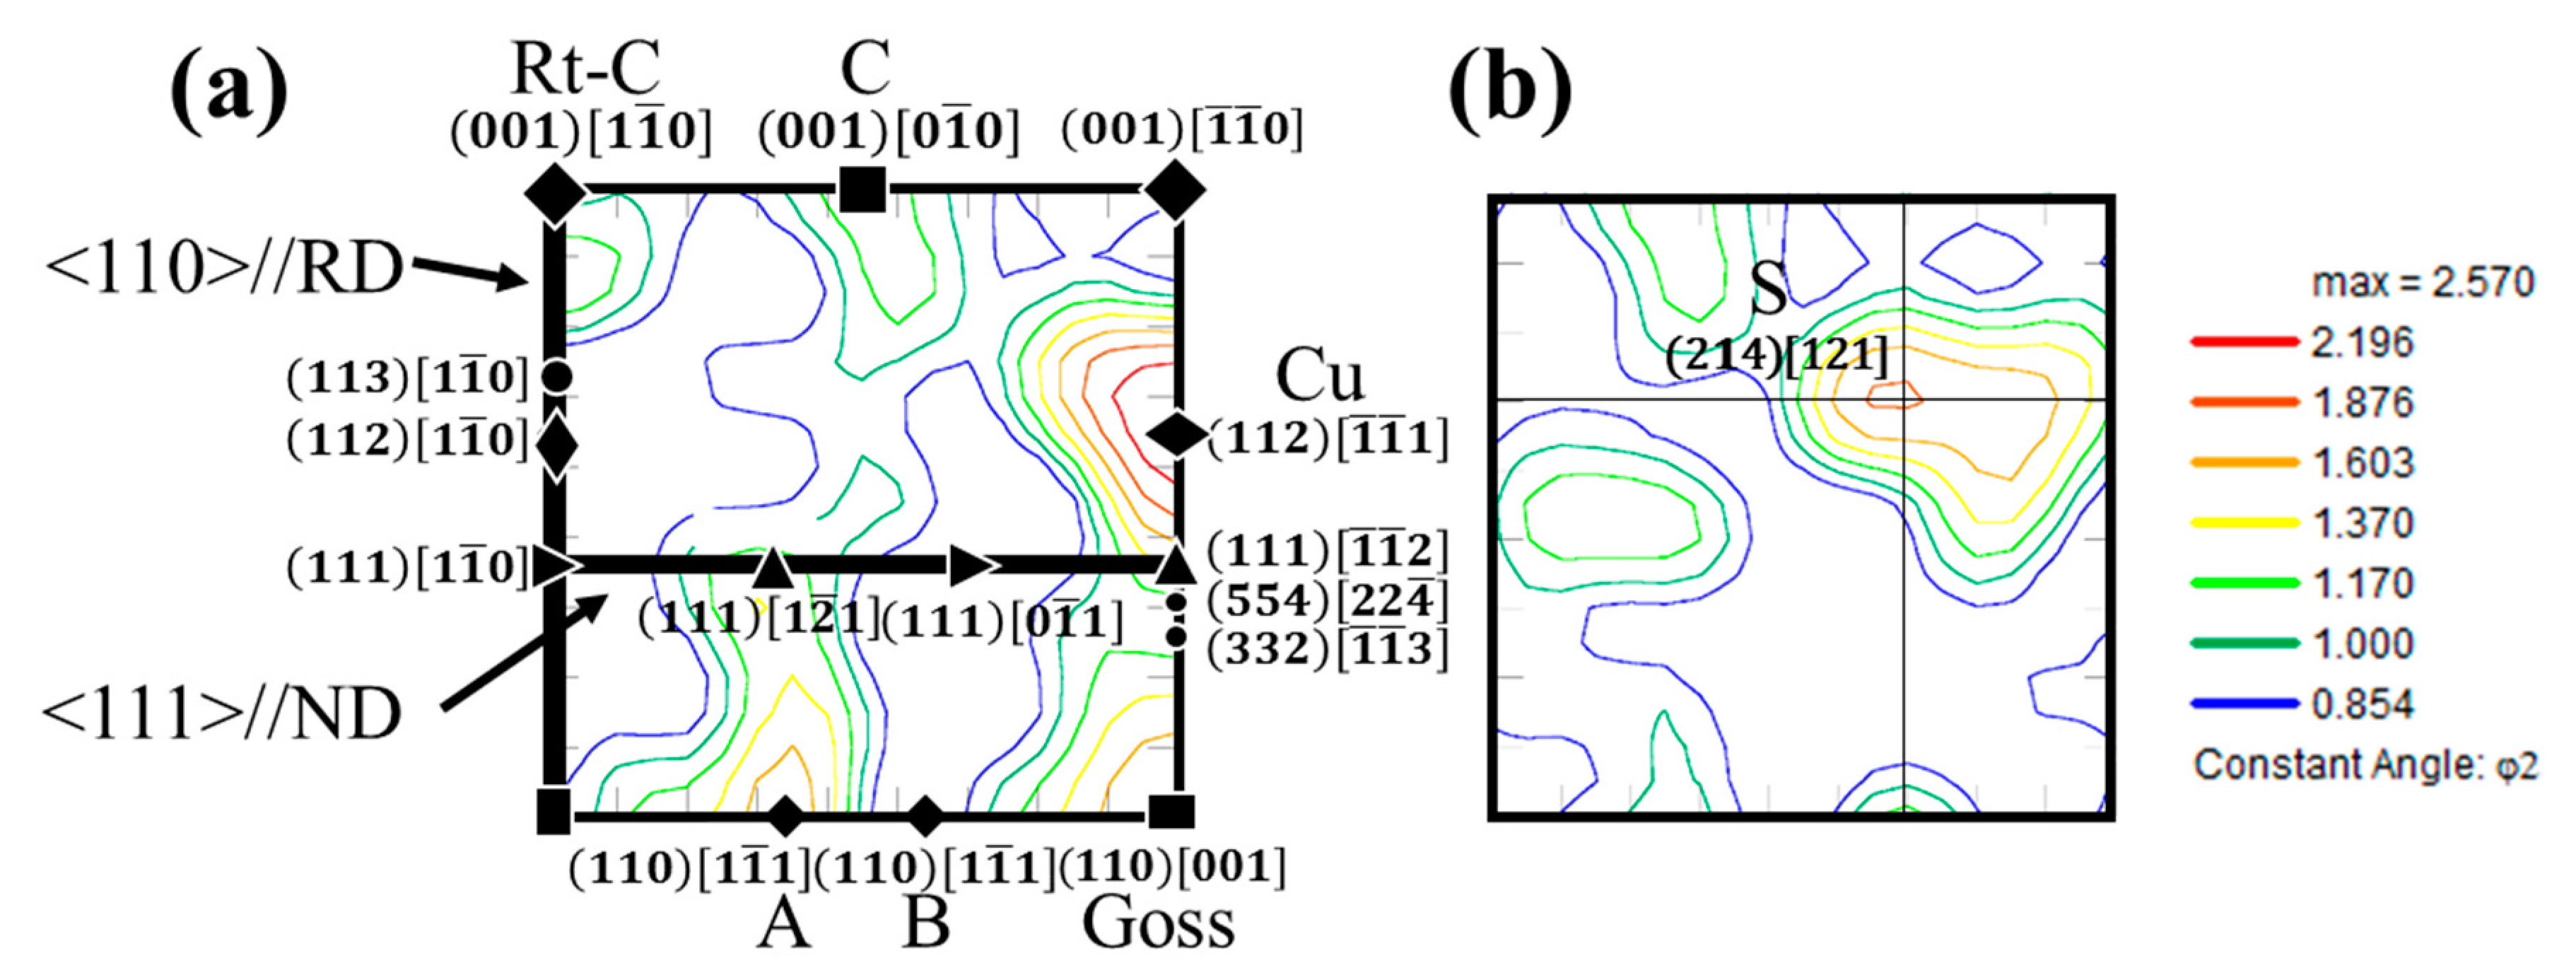
3.3.1. Hot-Rolling Texture

The γ→α transformation start temperature, measured by dilatometry on heating, was 950 °C and the reported finish rolling and coiling temperatures were 930 and 721 °C, respectively. Thus, as shown in Figure 1, the processing of the hot-rolled band involved deformation in the austenite phase field up to the fifth pass and hot rolling in the ferrite phase field during the last rolling pass. Therefore, the texture of the hot-rolled band can be attributed to the transformation of deformed austenite and the deformation and static recrystallization of ferrite.
Figure 8a shows the φ2 = 45° section of the ODF corresponding to the hot-rolled plate. As can be seen, the texture exhibits a maximum orientation density of 2.6 at the ( 112 ) [ 11 1 ¯ ] orientation, the Cu component. Additional intensity maxima with smaller orientation densities can be observed at ( 001 ) [ 0 1 ¯ 0 ] , ( 001 ) [ 110 ] , ( 110 ) [ 001 ] , the cube (C), rotated cube (Rt-C) and Goss texture components, respectively, and the ( 110 ) [ 1 1 ¯ 1 ] , the so-called A component. The α- and γ-fibers (indicated by the thick lines in Figure 8a) are poorly developed, although the ( 001 ) [ 1 1 ¯ 0 ] orientation of the α-fiber and the { 111 } 1 2 ¯ 1 components of the γ-fiber (indicated by the filled right triangles) exhibit orientation densities between 1 and 1.5 mrd.
The hot-rolling texture in the present material may be described as an orientation spread running from the Cu to the Goss components, a weak γ-fiber and three relative orientation density maxima at the C, Rt-C and A components. The Cu and Goss orientations have been observed to form as a result of shear deformation in electrical steels [23]. Therefore, the presence of these components in the hot-rolled plate can be attributed to friction during ferrite rolling in the last pass, where the temperature is lower than the γ→α transformation start temperature. Ferrite shear textures also exhibit the so-called Brass ( 110 ) [ 1 1 ¯ 2 ] and S { 213 } 36 4 ¯ components. The Brass orientation, indicated by a filled rhombus in Figure 8a, is only 20° from the A component. Therefore, it is also possible that the A component formed in the hot-rolling texture as a result of friction. The S component is also present in the hot-rolling texture, as shown in Figure 8b, the φ2 = 65° section of the ODF.
Ferrite formed by the transformation of recrystallized austenite usually exhibits ( 001 ) [ 110 ] , ( 110 ) [ 001 ] and ( 110 ) [ 1 1 ¯ 0 ] orientations (indicated by the filled squares and rectangles in Figure 8a) [24]. In contrast, ferrite formed by the transformation of deformed austenite produced by hot rolling below the austenite non-recrystallization temperature, Tnr, usually exhibits two major components: ( 332 ) [ 11 3 ¯ ] and ( 113 ) [ 1 1 ¯ 0 ] , [25]. These orientations, indicated by filled circles in Figure 8a, originate from the ( 110 ) [ 112 ] and ( 112 ) [ 11 1 ¯ ] orientations of the deformed austenite. Kestens and Pirgazi [26] indicated that the transformation texture of deformed austenite is dominated by the ( 112 ) [ 1 1 ¯ 0 ] and ( 554 ) [ 22 5 ¯ ] components, which are also indicated by filled circles in Figure 8a. All these texture components are present to some degree in the texture of the hot-rolled material. Therefore, the texture of the hot-rolled band can be attributed to: (a) plane strain deformation and the transformation of austenite to ferrite and, (b) plane strain and the shear deformation of ferrite. From a quantitative viewpoint, it appears that the shear deformation of ferrite as a result of friction between the rolls and the workpiece plays an important role in defining the texture of the hot-rolled strip.

3.3.2. Effect of Annealing Temperature on the Texture of the Hot-Rolled Band

The annealing textures of hot-rolled steel plates and strips have not received much attention despite the large effects that these textures may have on the cold-rolling and annealing textures. In the present work, annealing was performed on a hot-rolled strip and, as described in the previous section, the evolution of the microstructure at temperatures below the α→γ transformation start temperature is characterized by the abnormal columnar growth of some special surface ferrite grains. The size of these grains at the end of annealing exceeded 500 µm. As indicated in the experimental procedure, the OIM scans were performed over an area of ~8 mm2 in the cross section of the samples. This area is approximately the same (~4% larger) as the area of the microstructures shown in Figure 4. Therefore, the number of grains measured in each sample are those which are observed in the micrographs. From a statistical viewpoint, the number of grains measured is very limited (20–30 grains depending on the actual grain size) and calculation of an ODF from such measurements is questionable. Nevertheless, the size of the area of the OIM scans represents ~7% of the cross section of the sample. This type of scan was repeated in different sections of the cross section and the results were qualitatively similar. Therefore, although from a quantitative viewpoint the statistical significance of the ODFs presented in Figure 9a,d are questionable, they do represent the orientation distribution of the large columnar grains in the cross section of the samples subjected to annealing prior to cold rolling. The ODFs were calculated using a typical Gaussian half width of 5°, which is about the size of the angular spread around the orientation density maxima observed in the ODFs. Thus, each orientation density maximum represents the orientation of at least one large columnar grain in the microstructure.
Figure 9a,d present the effect of annealing at 710 and 740 °C on the texture (φ2 = 45° sections of the ODFs) of the hot-rolled strip (Figure 8). As can be seen, the growth of columnar grains transforms the texture of the hot-rolled band significantly. Annealing for 72 h at 710 °C causes a significant increase in the orientation density of texture components in the <001>//ND fiber, mainly the ( 001 ) [ 1 1 ¯ 0 ] and ( 001 ) [ 0 1 ¯ 0 ] components, although the cube component seems to rotate a few degrees off the exact position at (Φ = 0°, ϕ1 = 45°), as shown in Figure 9a. It is noteworthy that all other components in the hot-rolled texture, present as a result of the transformation of austenite and the deformation and recrystallization of ferrite at high temperature, disappear during columnar grain growth at 710 °C. Finally, as shown by the filled pentagons in Figure 9a, four new orientations appear with strong orientation densities.
In contrast, the growth of columnar grains over 42 h at 740 °C leads to a texture consisting mainly of components belonging to the γ-fiber, { 111 } 1 1 ¯ 0 and { 111 } 1 ¯ 1 ¯ 2 , plus the ( 112 ) [ 1 ¯ 1 ¯ 1 ] and the slightly rotated ( 110 ) [ 1 1 ¯ 1 ] , as shown in Figure 9d. The annealing of the hot-rolled strip at 850 °C for 15 min produces a texture similar to that observed after annealing at 710 °C, although the components that belong to the <001> fiber are less well developed and the four new orientations (already observed after annealing at 710 °C, Figure 8b) appear with stronger orientation densities and are slightly shifted from the angular positions observed at 710 °C. These results suggest that the surface grains selected for abnormal columnar growth depend on the annealing temperature.

3.3.3. Effect of Columnar Microstructures on the Cold-Rolling Texture

Figure 9 illustrates the effect of deformation, a 65% (Figure 9b,e) and 92% (Figure 9c,f) reduction in thickness, on the texture of the hot-rolled plates annealed at 710 and 740 °C. As can be seen, the end textures after 93% cold reduction are remarkably similar. They consist of two orientation spreads: (a) one centered in the ( 111 ) [ 1 2 ¯ 1 ] orientation, which runs up to ( 110 ) [ 1 1 ¯ 1 ] at ϕ1 = 35°, and (b) one centered in the ( 111 ) [ 1 ¯ 1 ¯ 2 ] orientation of the γ-fiber running up to the Goss orientation ( 110 ) [ 001 ] . It is noteworthy that the orientation densities in the ODF of the sample annealed at 740 °C are about twice as large as those observed in the sample annealed at 710 °C. Despite the similarities of the end textures, the texture evolution with increasing strain is significantly different.
A comparison of the ODFs for the material annealed at 710 °C (Figure 9a) with that observed after a 65% reduction in thickness (Figure 9b) makes evident that this deformation causes all crystal orientations in the annealed hot-rolled plate to rotate to positions in the orientation spreads centered in the ( 111 ) [ 1 2 ¯ 1 ] and ( 111 ) [ 1 ¯ 1 ¯ 2 ] orientations in the γ-fiber. Continued deformation (92% reduction in thickness) causes sharpening of the texture (Figure 9c). In contrast, the evolution of the texture of the hot-rolled plate annealed at 740 °C, which consists mainly of orientations located in the γ-fiber (see Figure 9d), follows a different pattern. As can be seen in the ODF of Figure 9e, the initial γ-fiber orientations are not stable after a 65% reduction in thickness and a series of new relative orientation density maxima appear at the positions of the ( 001 ) [ 0 1 ¯ 0 ] , ( 001 ) [ 1 1 ¯ 0 ] , ( 110 ) [ 1 1 ¯ 1 ] and ( 112 ) [ 1 ¯ 1 ¯ 1 ] orientations. It is noteworthy that the Cu component, which is already observed in the annealed hot-rolled material, is the sharpest texture component at this strain. As deformation increases, all these orientations rotate progressively, until at a 92% reduction in thickness, the orientation spreads centered in the ( 111 ) [ 1 2 ¯ 1 ] and ( 111 ) [ 1 ¯ 1 ¯ 2 ] orientations in the γ-fiber are well developed.
The end textures shown in Figure 9c,f are unusual since they do not exhibit the partial α-fibers normally present in cold-rolled textures of steels. Additionally, the orientation spreads of ~45° at ϕ1 = 35° and 90° are uncommon. For example, Campos et al. [27] evaluated the effect of cold rolling on the textures of hot-rolled electrical steels with 0.5 and 1.25% Si. The hot-rolled starting material exhibited a random texture. Cold rolling to a 80–90% reduction in thickness resulted in a typical BCC rolling texture consisting of α- and γ-fibers. In the present work, the orientations in the {001}//ND and in the {111}//ND fibers of the hot-rolled and annealed materials are not stable for deformations up to a 65% reduction in thickness (Figure 9b,e). However, although the end textures at a 92% reduction in thickness do not depend on the annealing temperature prior to cold rolling, texture evolution during cold rolling is faster in the material annealed at 710 °C and the final texture is already observed at a 65% reduction in thickness. Gonzalez et al. [28] showed that the cold-rolled texture of large-grained columnar ferrite microstructures in low-C steel strips is characterized by the absence of α- and γ-fibers and the development of a strong θ-fiber (<001>//ND). Zhang and coworkers [29] investigated the cold-rolled texture and microstructure of Fe-3%Si electrical steel with columnar grains with <001>//ND orientation produced by strip casting. At intermediate rolling reductions, the material exhibits a {001} texture, indicating that the columnar microstructure effectively inhibits the formation of the typical <111>//ND + <110>//RD cold-rolled texture. Similarly, Xu et al. investigated the effect of single- and double-step cold rolling on the microstructure, texture and magnetic properties of strip-cast Fe-2.6%Si steel [30]. These researchers reported that two-stage rolling increases the in-grain shear bands and the retention of the <001>//ND texture inherited from the texture produced by the strip casting process. It appears that, at present, the texture evolution during the cold rolling of large columnar ferrite microstructures is not yet fully understood and further research is still needed.
Figure 10 illustrates the IQ and the orientation maps for samples annealed at 710 and 740 °C and cold rolled to a 72% reduction in thickness. As can be seen, regardless of grain orientation, intragranular shear bands developed as a result of the very inhomogeneous deformation caused by the size and morphology of the columnar grains. The formation of shear bands during the cold rolling of GNO electrical steels plays a major role in the formation of cube and Goss texture components during the final annealing step of processing. Park and Szpunar [31] found that shear bands are formed in coarse grains with orientations {112}<110>, {111}<110> and {111}<112>. The shear bands formed in grains with these orientations are preferential nucleating sites for Goss and cube grains. Xu et al. [32] also found that shear bands formed during the cold rolling of the rotated Goss { 110 } 1 1 ¯ 0 texture component present in strip-cast non-oriented silicon steel act as favorable nucleation sites during recrystallization annealing. As will be shown below, this type of microstructure has profound effects on the texture and grain size produced during final annealing.

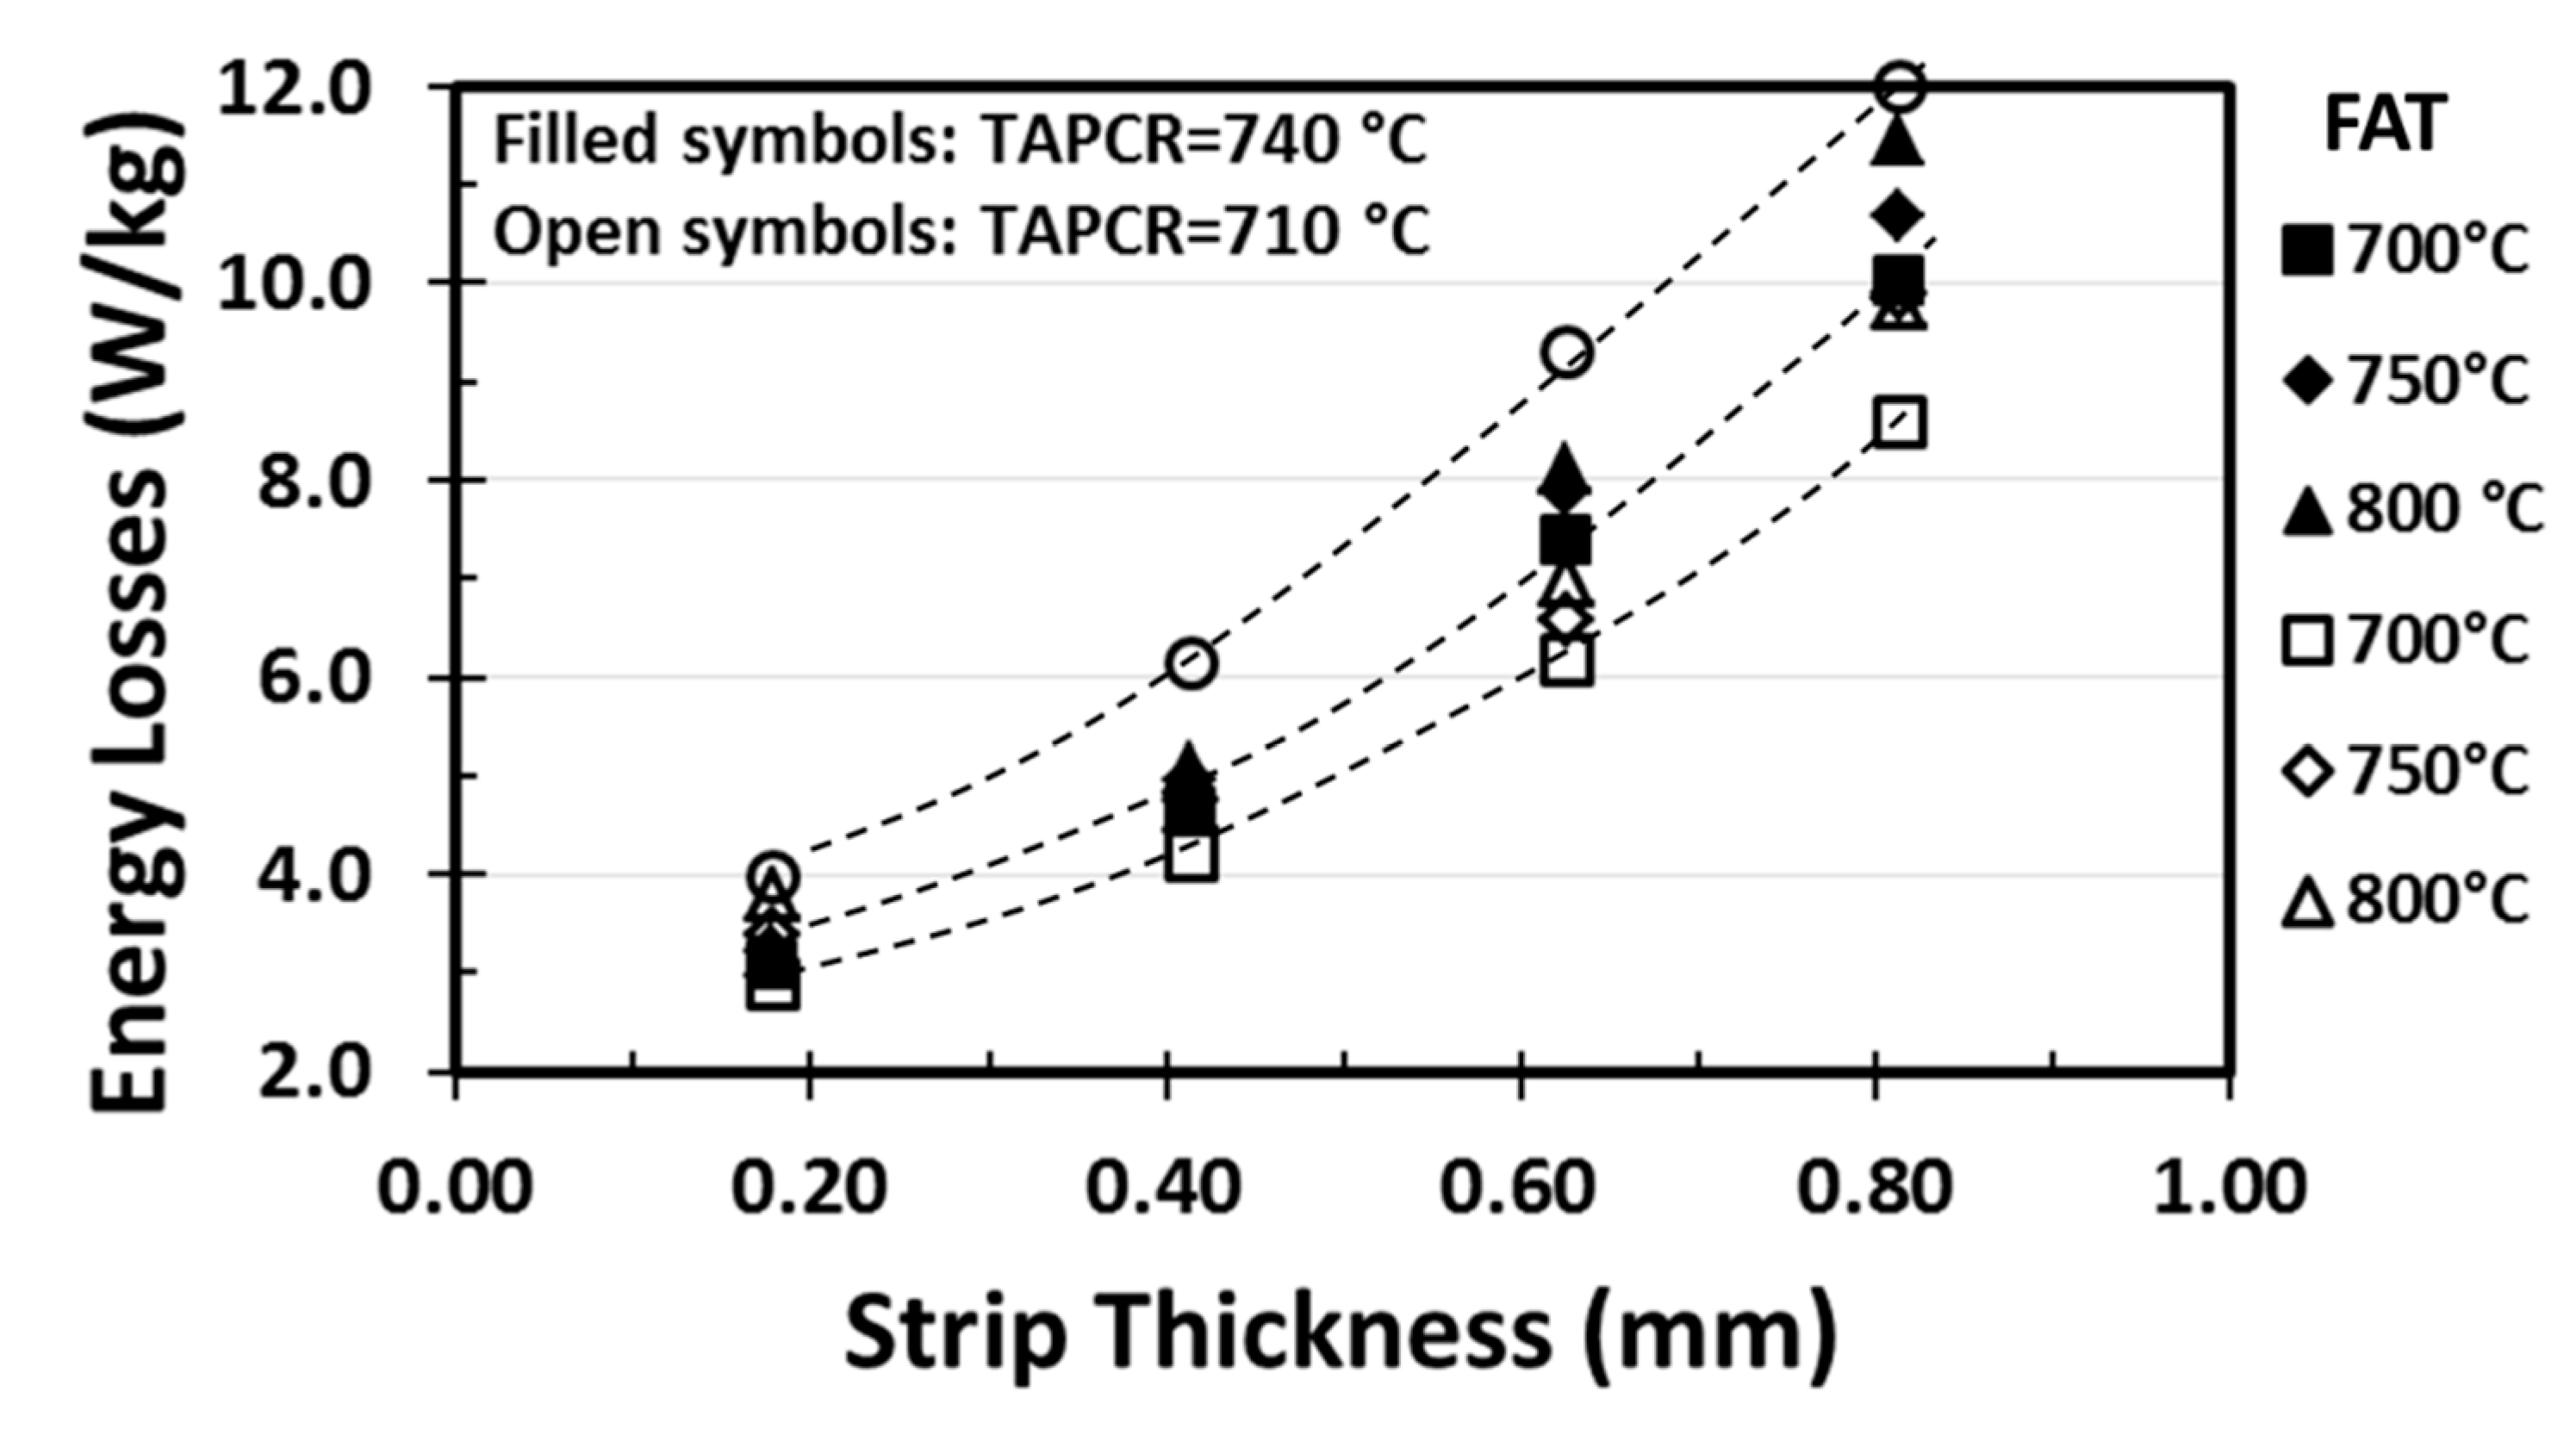
3.4. Effect of Final Microstructure on Iron Energy Losses

The main objective of this investigation was to determine the effects of annealing under non-oxidizing conditions prior to cold rolling on the evolution of the microstructure of hot-rolled ultra-low-C electrical GNO steel strips. To summarize, it has been shown that the effect of annealing prior to cold rolling is abnormal anisotropic grain growth. This process produces columnar ferrite grains with long axes parallel to the ND of the strips when annealing is applied at T < T0. The type of texture produced depends on the annealing temperature. Significantly, it was observed that annealing at T > 710 °C causes columnar ferrite microstructures which exhibit a texture dominated by the γ-fiber. In contrast, annealing at 710 °C causes columnar ferrite microstructures where some of the components of the <001>//ND fiber become important. The cold rolling of the columnar ferrite microstructures resulted in sharp { 111 } 11 2 ¯ textures with orientation spreads of ~45° at ϕ1 = 35° and 90° and the absence of the <110>//RD fiber typically observed in cold-rolled steels. In the remainder of this article, the effects of the final microstructure produced by annealing for three minutes at temperatures between 700 and 800 °C on the iron energy losses will be described.
Motor iron energy losses (WM) have contributions from losses caused by the alternating current (WA), the rotational motion (WR) and the high frequency (WH). According to Shimanaka et al. [33], the motor iron losses may be represented by a linear expression:
W M = a W A + b W R + c W H + d
In this equation, a, b, c and d are empirically determined constants. For a steel of a given chemical composition, the microstructure of the steel (grain size, texture and impurity content) has profound effects on all WA, WR and WH and, therefore, on the overall performance of the motor. Alternating current iron energy losses (WA) are mainly due to magnetic hysteresis (Wh) and eddy currents (We). Eddy current losses are directly proportional to the square of the frequency of the magnetic excitation (f):
W e = ( π B m f t ) 2 6 ρ
where Bm is the magnetic excitation flux density, t is the sheet thickness and ρ is the resistivity of the steel. As can be seen from Equation (2), for a given chemical composition, reduction in sheet thickness is a very effective method to reduce WM through its effects on We and WA. WR, on the other hand, affects WM mainly due to the effect of texture. Shimanaka et al. [33] reported results of measurements of rotational hysteresis losses in Fe-3%Si single crystals. These results showed that WR increases as the orientation of the crystal changes in the following sequence: <100>–<110>–<111>–<112>. As mentioned earlier, WA = We + Wh represents energy losses due to eddy currents and magnetic hysteresis. The contribution of Wh to WA in non-oriented Si steel sheets may be as large as 60–80%. Therefore, reducing Wh is an effective method to improve the efficiency of a motor. For a steel of a given chemical composition and impurity content, this method consists of controlling grain size and texture during the processing of the strip. In general, the grain size affects Wh and We in proportion to 1/D and D, respectively. Therefore, the relationship between WA and grain size must exhibit a minimum at a certain optimum value.
The processing parameters that most affect grain size and texture during final annealing are the amount of deformation (as a result of cold rolling) and the temperature and time of the annealing. Of course, recrystallization and grain growth control the resulting grain size and texture and these must have adequate values to optimize the energy losses of a strip of a given thickness. In the present work, the magnitudes of the reduction in thickness by cold rolling were selected so that strip thicknesses from 0.19 to 0.82 mm were produced from the 2.34 mm thick hot-rolled strip. Therefore, the effects of grain size and texture factor produced by a set of annealing conditions (temperature of annealing prior to cold rolling and final annealing temperature) on the energy losses is presented as a function of the strip thickness.
A texture factor was defined in order to grade the resulting textures in terms of their suitability for use in the manufacture of laminations for rotary electric cores: f ( g ) = V 001 + V 110 V 111 , where V<001>, V<110> and V<111> are the volume fractions of ferrite grains with <001>//ND, <110>//ND and <111>//ND, respectively. Of course, a large value of f(g) implies easy magnetization in the plane of the strip and low values of core losses due to magnetic hysteresis. It would be highly desirable that, for a given set of processing parameters, the resulting values of V<001> + V<110> and V<111> are, respectively, as large and as small as possible.
Figure 11 shows the effect of strip thickness, temperature of annealing prior to cold rolling (TAPCR) and final annealing temperature (FAT) on the iron energy losses of the material investigated. Included in the graph are the energy losses measured in the material which was not annealed prior to cold rolling. As expected, the iron energy losses decrease rapidly as the strip thickness is reduced. However, the data also show that a significant reduction in iron energy losses is caused by the abnormal columnar grained microstructure produced by annealing prior to cold rolling at both 710 and 740 °C. The major effect is observed in the material annealed at 710 °C and the relative effect decreases as the strip thickness decreases.
These last two effects can be attributed to the effect of the processing conditions on texture. As shown in Figure 12a, the texture factor for samples annealed at T > 700 °C increases slightly as the strip thickness decreases. However, the texture factor is smaller than that observed in the material that was not annealed prior to cold rolling. In contrast, the texture factor values for the material annealed at 700 °C is always larger than that of the reference material and decreases as the strip thickness is reduced. It appears, then, that the beneficial effect of texture on reducing iron energy losses decreases (or plays a secondary role) as the thickness of the strip decreases. This effect can be attributed to the decrease in the volume fraction of ferrite grains with <001> directions in the plane of the strip, as shown in Figure 12. Similar effects are observed in the material annealed at 740 °C prior to cold rolling (Figure 12b and Figure 13), although the data for the material finally annealed at 700 °C exhibit a larger dispersion.
Finally, Figure 14 illustrates the effect of annealing prior to cold rolling on the relationship between grain size and iron energy losses. In this case, the values of grain size and energy losses are divided by the values observed in material not subjected to annealing prior to cold rolling. Although there is a significant amount of dispersion in the data, particularly for large grain sizes, the graph shows two important effects. First, the annealing of the hot-rolled material prior to cold rolling at temperatures below T0 produces a microstructure of large columnar ferrite grains and causes a significant decrease in iron energy losses. Quantitatively, this effect is about 20% for grain sizes larger than about 2.5 times the grain size that can be obtained if the material is not annealed prior to cold rolling. However, the data clearly show that there is an optimum grain size that results in a decrease in iron energy losses of ~30%. This optimum grain size is ~1.5 times the grain size that can be obtained if the material is not annealed prior to cold rolling. Furthermore, the data also show that this optimum grain size varies only between 1.35 and 1.55 for strip thicknesses between 0.19 and 0.81 mm.

4. Conclusions

The results of the present investigation have shown that:
(1)
Annealing at T < T0 the α→γ start transformation temperature, under a non-oxidizing atmosphere for low-Si, ultra-low-C hot-rolled electrical steel causes abnormal anisotropic grain growth that produces columnar ferrite grains with long axes parallel to ND. The size of the columnar grains is about 1 2 the strip thickness.
(2)
Cold rolling and a short final annealing treatment at T < T0 of the abnormally large columnar grain microstructure produced by annealing prior to cold rolling causes a significant reduction in iron energy losses. The magnitude of this reduction depends on strip thickness and the temperatures of annealing before and after cold rolling. The major effect is observed in material annealed at 710 °C and the relative effect decreases as the strip thickness decreases. These effects can be attributed to the effect of the processing conditions on texture.
(3)
The texture factor values for material finally annealed at 700 °C is always larger than that of the reference material and decreases as the strip thickness is reduced. This result suggests that the beneficial effect of texture on reducing iron energy losses decreases (or plays a secondary role) as the thickness of the strip decreases.
(4)
Hot-band annealing under the appropriate conditions results in a reduction in iron energy losses of ~30% when the final microstructure consists of ferrite grains ~1.5 times larger than those obtained in material that is not annealed prior to cold rolling.

Author Contributions

Conceptualization, H.O.R. and A.S.R.; methodology, H.O.R.; software, H.O.R.; validation, H.O.R., A.S.R. and O.G.R.; formal analysis, H.O.R. and A.S.R.; investigation, H.O.R.; resources, A.S.R.; data curation, H.O.R.; writing—original draft preparation, A.S.R.; writing—review and editing, H.O.R.; visualization, H.O.R.; supervision, A.S.R.; project administration, A.S.R.; funding acquisition, A.S.R. All authors have read and agreed to the published version of the manuscript.

Funding

This research received no external funding

Acknowledgments

The authors, H.O.R and A.S.R., are indebted to the National Council for Science and Technology of México and Ternium S.A. de C.V. for the support granted to carry out this research. The technical support of Felipe Márquez, Martha Rivas, Sergio Rodríguez, Francisco Botello and Socorro Garcia, of the technical staff of Cinvestav Saltillo, is duly recognized.

Conflicts of Interest

The authors declare no conflict of interest.

References

  1. Paolinelli, S.C.; da Cunha, M.A. Development of a new generation of high permeability non-oriented silicon steels. J. Magn. Magn. Mater. 2006, 304, e596–e598. [Google Scholar] [CrossRef]
  2. Sidor, Y.; Kovac, F. Microstructural aspects of grain growth kinetics in non-oriented electrical steels. Mater. Charact. 2005, 55, 1–11. [Google Scholar] [CrossRef]
  3. Chaudhury, A.; Khatirkar, R.; Viswanathan, N.N.; Singal, V.; Ingle, A.; Joshi, S.; Samajdar, I. Low silicon non-grain-oriented electrical steel: Linking magnetic properties with metallurgical factors. J. Magn. Magn. Mater. 2007, 313, 21–28. [Google Scholar] [CrossRef]
  4. Chen, C.-W. Magnetism and Metallurgy of Soft Magnetic Materials; North-Holland Publishing Company: North Holland, The Netherlands, 1977. [Google Scholar]
  5. Bacaltchuk, C.M.; Castello-Branco, G.A.; Ebrahimi, M.; Garmestani, H.; Rollett, A.D. Effect of magnetic field applied during secondary annealing on texture and grain size of silicon steel. Scr. Mater. 2003, 48, 1343–1347. [Google Scholar] [CrossRef]
  6. Park, J.T.; Szpunar, J.A. Effect of initial grain size on texture evolution and magnetic properties in nonoriented electrical steels. J. Magn. Magn. Mater. 2009, 321, 1928–1932. [Google Scholar] [CrossRef]
  7. Landgraf, F.J.G.; Emura, M. Losses and permeability improvement by stress relieving fully processed electrical steels with previous small deformations. J. Magn. Magn. Mater. 2002, 242, 152–156. [Google Scholar] [CrossRef]
  8. Beckley, P. Electrical Steels for Rotating Machines; Institution of Electrical Engineers: London, UK, 2002. [Google Scholar]
  9. Honda, A.; Obata, Y.; Okamura, S. History and Recent Development of Non-Oriented Electrical Steel in Kawasaki Steel. Tech. Rep. 1998, 39, 13–20. [Google Scholar]
  10. Takashima, M.; Komatsubara, M.; Morito, N. Texture Development by Two-stage Cold RollingMethod in Non-oriented Electrical Steel. ISIJ Int. 1997, 37, 1263–1268. [Google Scholar] [CrossRef]
  11. Kovac, F.; Stoyka, V.; Petryshynets, I. Strain-induced grain growth in non-oriented electrical steels. J. Magn. Magn. Mater. 2008, 320, e627–e630. [Google Scholar] [CrossRef]
  12. Wenk, H.R.; Van Houtte, P. Texture and anisotropy. Rep. Prog. Phys. 2004, 67, 1367–1428. [Google Scholar] [CrossRef]
  13. Verbeken, K.; Gomes, E.; Schneider, J.; Houbaert, Y. Correlation between the magnetic prpierties and the crystallographic texture during the processing of non oriented electrical steel. Solid State Phenom. 2010, 160, 189–194. [Google Scholar] [CrossRef] [Green Version]
  14. Lee, J.W.; Howell, P.R. Microstructural development in non-oriented lamination steels. Mater. Sci. 1987, 22, 3631–3641. [Google Scholar] [CrossRef]
  15. Kestens, L.; Jonas, J.J.; Van Houtte, P.; Aernoudt, E. Orientation selective recrystallization of nonoriented electrical steels. Metall. Mater. Trans. A 1996, 27, 2347–2358. [Google Scholar] [CrossRef]
  16. Marder, A.R. Factors affecting the final grain size of decarburized lamination steels. Metall. Trans. A 1986, 17, 1277–1285. [Google Scholar] [CrossRef]
  17. Hou, C.-K. Effect of Hot Band Annealing Temperature on the Magnetic Properties of Low-carbon Electrical Steels. ISIJ Int. 1996, 36, 563–571. [Google Scholar] [CrossRef] [Green Version]
  18. Yashiki, H.; Kaneko, T. Effect of hot-band annealing on anisotropy of magnetic properties in low-Si semi-processed electrical steels. J. Magn. Magn. Mater. 1992, 112, 200–202. [Google Scholar] [CrossRef]
  19. Gutiérrez-Castañeda, E.J.; Salinas-Rodríguez, A. Effect of annealing prior to cold rolling on magnetic and mechanical properties of low carbon non-oriented electrical steels. J. Magn. Magn. Mater. 2011, 323, 2524–2530. [Google Scholar] [CrossRef]
  20. Gutiérrez-Castañeda, E.J.; Salinas-Rodríguez, A.; Deaquino-Lara, R.; Márquez-Torres, F. High temperature oxidation and its effects on microstructural changes of hot-rolled low carbon non-oriented electrical steels during air annealing. Oxid. Met. 2015, 83, 237–252. [Google Scholar] [CrossRef]
  21. Srolovitz, D.J.; Grest, G.S.; Anderson, M.P. Computer simulation of grain growth—V. Abnormal grain growth. Acta Metall. 1985, 33, 2233–2247. [Google Scholar] [CrossRef]
  22. Gutiérrez-Castañeda, E.J.; Miranda, M.H.; Rodríguez, A.S.; Carrillo, J.A.; Domínguez, I.R. An EBSD investigation on the columnar grain growth in non-oriented electrical steels assisted by strain induced boundary migration. Mater. Lett. 2019, 252, 42–46. [Google Scholar] [CrossRef]
  23. Kim, J.K.; Lee, D.N.; Koo, Y.M. The evolution of the Goss and Cube textures in electrical steel. Mater. Lett. 2014, 122, 110–113. [Google Scholar] [CrossRef]
  24. Inagaki, H.; Suda, T. The Development of Rolling Textures in Low-Carbon Steels. Texture Stress Microstruct. 1972, 1, 129–140. [Google Scholar] [CrossRef] [Green Version]
  25. Ray, R.K.; Jonas, J.J. Transformation Textures in Steels. ISIJ Int. 1994, 34, 927–942. [Google Scholar] [CrossRef]
  26. Kestens, L.A.I.; Pirgazi, H. Texture formation in metal alloys with cubic crystal structures. Mater. Sci. Tech-Lond. 2016, 32, 1303–1315. [Google Scholar] [CrossRef] [Green Version]
  27. De Campos, M.F.; Landgraf, F.J.; Falleiros, I.G.; Fronzaglia, G.C.; Kahn, H. Texture Evolution during the Processing of Electrical Steels with 0.5% Si and 1.25% Si. ISIJ Int. 2004, 44, 1733–1737. [Google Scholar] [CrossRef] [Green Version]
  28. Gutiérrez-Castañeda, E.J.; Palafox Cantú, C.N.; Torres Castillob, A.A.; Salinas Rodríguez, A.; Deaquino Lara, R.; Botello Rionda, F.; Márquez Torres, F.; García Guillermo, S. Columnar grain growth during annealing prior to cold rolling of non-oriented electrical steels. Mater. Sci. Eng. B 2019, 243, 8–18. [Google Scholar] [CrossRef]
  29. Weimin, Z.N.Y.P.M. Influence of columnar grains on the cold rolling texture evolution in fe-3%Si\ electrical steel. Acta Metall. Sin. 2012, 48, 782–788. [Google Scholar]
  30. Xu, Y.; Jiao, H.; Qiu, W.; Misra, R.D.; Li, J. Effect of cold rolling process. on microstructure, texture and properties of strip cast Fe-2.6% Si steel. Materials 2018, 11, 1161. [Google Scholar] [CrossRef] [PubMed] [Green Version]
  31. Park, J.-T.; Szpunar, J.A. Evolution of recrystallization texture in nonoriented electrical steels. Acta Mater. 2003, 51, 3037–3051. [Google Scholar] [CrossRef]
  32. Xu, Y.B.; Zhang, Y.X.; Wang, Y.; Li, C.G.; Cao, G.M.; Liu, Z.Y.; Wang, G.D. Evolution of cube texture in strip-cast non-oriented silicon steels. Scr. Mater. 2014, 87, 17–20. [Google Scholar] [CrossRef]
  33. Shimanaka, H.; Ito, Y.; Matsumara, K.; Fukuda, B. Recent development of non-oriented electrical steel sheets. J. Magn. Magn. Mater. 1982, 26, 57–64. [Google Scholar] [CrossRef]
Figure 1. Strain–temperature profile used for finish rolling of the sample plate used in the present investigation. T0 = 950 °C is the ferrite to asutenite transformation temperature measured by dilatometry during heating at 0.25 °C/s.
Metals 10 00957 g001
Figure 2. Microstructural characteristics of the hot-rolled material: (a) IQ contrast map, (b) variation of the IQ index from the surface to mid-thickness and (c) grain average misorientation (GAM) map.
Metals 10 00957 g002
Figure 3. Dilatometry curve for the hot-rolled steel obtained during heating at 0.025 °C/s.
Metals 10 00957 g003
Figure 4. (a) Time to 710 °C: 7.6 h, soaking time 72 h, (b) time to 740 °C: 7.9 h, soaking time 42 h, (c) time to 850 °C: 9.1 h, soaking time 0.25 h, (d) time to 960 °C: 10.4 h, soaking time 0.25 h and (e) time to 1030 °C: 12 h, soaking time 0.25 h. Micrographs were taken through the thickness of the strips.
Metals 10 00957 g004
Figure 5. Evolution columnar grain growth during isothermal annealing at: 710 °C for (a) 12, (b) 48 and (c) 72 h and 740 °C for (d) 4, (e) 14 and (f) 24 h. Micrographs were taken through the thickness of the strips.
Metals 10 00957 g005
Figure 6. Maps of the angle of disorientation of samples annealed at 710 °C for (a) 12 h, (b) 36 h and (c) 48 h and GAM–EBSD maps of samples at (d) 12 h, (e) 36 h and (f) 48 h. Images were taken through the thickness of the strips.
Metals 10 00957 g006
Figure 7. Kinetics of abnormal grain growth at 710 and 740 °C during isothermal annealing.
Metals 10 00957 g007
Figure 8. (a) φ2 = 45° and (b) φ2 = 65° sections of the ODF corresponding to the hot-rolled plate.
Metals 10 00957 g008
Figure 9. Effect of annealing at (a) 710 and (d) 740 °C prior to cold rolling to 65% (b,e) and 92% (c,f) reductions in thickness on the φ2 = 45° sections of the ODF.
Metals 10 00957 g009
Figure 10. IQ (a,b) and orientation maps (c,d) for samples annealed at 710 (a,c) and 740 °C (b,d) and cold rolled to a 72% reduction in thickness.
Metals 10 00957 g010
Figure 11. Effect of temperature of annealing prior to hot rolling (TAPHR), final annealing temperature (FAT) and strip thickness on energy losses. Data for material not annealed prior to cold rolling are indicated by open circles.
Metals 10 00957 g011
Figure 12. Effect of temperature of annealing prior to cold rolling (TAPCR) at: (a) 710 °C and (b) 740 °C, final annealing temperature (FAT) and strip thickness on texture factor. Data for material not annealed prior to cold rolling are indicated by open squares.
Metals 10 00957 g012
Figure 13. Effect of temperature of annealing prior to cold rolling on V(001) and V(111) for material finally annealed at 700 °C for 3 min.
Metals 10 00957 g013
Figure 14. Effect of grain size and strip thickness on energy losses relative to the values observed in material that was not annealed prior to cold rolling.
Metals 10 00957 g014
Table 1. Chemical composition of steel (wt. %).
CSSiAlMnPCuCrNi
0.0080.0040.3280.0620.5540.0630.0120.0020.025

