Article

Computing the Growth of Small Cracks in the Assist Round Robin Helicopter Challenge

1
Centre of Expertise for Structural Mechanics, Department of Mechanical and Aerospace Engineering, Monash University, Clayton 3800, Victoria, Australia
2
Titomic Limited, Building 3/270 Ferntree Gully Rd, Notting Hill 3130, Victoria, Australia
3
Department of Chemical Engineering, Monash University, Clayton 3800, Victoria, Australia
*
Author to whom correspondence should be addressed.
Metals 2020, 10(7), 944; https://doi.org/10.3390/met10070944
Submission received: 17 June 2020 / Revised: 1 July 2020 / Accepted: 8 July 2020 / Published: 14 July 2020

Abstract

:
Sustainment issues associated with military helicopters have drawn attention to the growth of small cracks under a helicopter flight load spectrum. One particular issue is how to simplify (reduce) a measured spectrum to reduce the time and complexity of full-scale helicopter fatigue tests. Given the costs and the time scales associated with performing tests, a means of computationally assessing the effect of a reduced spectrum is desirable. Unfortunately, whilst there have been a number of studies into how to perform a damage tolerant assessment of helicopter structural parts there is currently no equivalent study into how to perform the durability analysis needed to determine the economic life of a helicopter component. To this end, the present paper describes a computational study into small crack growth in AA7075-T7351 under several (reduced) helicopter flight load spectra. This study reveals that the Hartman-Schijve (HS) variant of the NASGRO crack growth equation can reasonably accurately compute the growth of small naturally occurring cracks in AA7075-T7351 under several simplified variants of a measured Black Hawk flight load spectra.

1. Introduction

It is now known that “ab initio” design and aircraft sustainment [1,2] are best tackled using different computational tools. United States Air Force (USAF) airworthiness standard MIL-STD-1530D [3] states that analysis is the key to both damage tolerant design and to assessing the economic life of military aircraft. MIL-STD-1530D also states that the primary role of testing is “to validate or correct analysis methods and results and to demonstrate that requirements are achieved”. The USAF-McDonnell Douglas study into the economic life of USAF F-15 aircraft [1] was arguably the first to reveal that sustainment analyses need to use the short crack da/dN versus ∆K curve, and not the da/dN versus ∆K curve determined as per the US American Society for Testing and Materials (ASTM) fatigue test standard ASTM E647-13a [4]. (The term durability is defined in MIL-STD-1530D [3] as: “Durability is the attribute of an aircraft structure that permits it to resist cracking, corrosion, thermal degradation, delamination, wear, and the effects of foreign object damage for a prescribed period of time”. MIL-STD-1530D [3] defines the term economic service life: The economic service life is the period during which it is more cost-effective to maintain, repair, and modify an aircraft component or aircraft than to replace it.) This conclusion is now echoed in ASTM E647-13a, Appendix X3. Whereas the ability of various crack growth equations to capture the growth of long cracks under a representative helicopter flight load spectrum has been studied [5,6,7] as part of the “Helicopter Damage Tolerance Round-Robin” challenge [8], there are few studies into the ability of crack growth equations to model small crack growth of small under helicopter flight load spectra. This shortcoming is particularly important since the durability/economic “initial flaw assumptions” contained in the US Joint Services Structures Guidelines JSSG2006 [9], which in MIL-STD-1530D are termed as equivalent initial damage sizes (EIDS), are typically 0.05 inches (0.127 mm). Indeed, this size of EIDS is also referenced in Structures Bulletin EZ-19-01, which presents the USAF approach to the Durability and Damage Tolerance Certification for Additive Manufacturing of Aircraft Structural Metallic Parts [10]. The importance of a validated predictive capability is highlighted in MIL-STD-1530D Sections 5.2.5 and 5.2.6, which state that a damage tolerance and a durability analysis must be performed for all aircraft, and in Section 5.3.4 which states that the purpose of full scale fatigue testing is to “validate or correct the analysis”. MIL-STD-1530D also states that a factor of 2 is to be used on these analyses. The Australian Defence Science and Technology (DST) Group’s small crack Helicopter Round Robin Challenge [11,12] is, to the best of the author’s knowledge, the first attempt to address this shortcoming, i.e., the lack of a validated analysis for small crack growth under a helicopter flight load spectrum.
It has previously been shown [7] that the Hartman-Schijve (HS) crack growth equation [2], which is an extension of a concept first proposed in [13], accurately predicted crack growth in the “Helicopter Damage Tolerance Round-Robin” challenge [8]. It has also been shown [2,7,14,15,16,17,18] that this formulation can also predict small crack growth under maritime aircraft, combat aircraft, and civil aircraft flight load spectra, and that the small crack equation needed for a durability/economic life analysis can often be determined from the associated long crack equation by setting the fatigue threshold term to a small value. The HS equation has also been shown to hold for crack growth in adhesively-bonded joints, bonded wood structures, and both bridge and rail steels [19,20,21,22,23,24,25], as well as for delamination crack growth in composite structures [26,27,28,29,30,31,32]. Consequently, the focus of the present paper is to examine if the HS crack growth equation can also capture crack growth in the DST Advancing Structural Simulation to drive Innovative Sustainment Technologies (ASSIST) small crack Helicopter Round Robin Challenge.
The general form of the HS equation used in this paper is as given in [2], viz:
da/dN = D (Δκ)n
where a is the crack length/depth, N is the number of cycles, D is a material constant and n is another material constant that is often approximately 2. The crack driving force Δκ used in Equation (1) was first suggested by Schwalbe [33], viz:
Δκ = (ΔK − ΔKthr)/(1 − Kmax/A)1/2
here K is the stress intensity factor, Kmax and Kmin are the maximum and minimum values of the stress intensity factor seen in the cycle, ∆K = (KmaxKmin) is the range of the stress intensity factor that is seen in a cycle, ΔKthr is the “effective fatigue threshold”, and A is the cyclic fracture toughness. As per [2,14,16,18], the values of the terms ΔKthr and A are chosen to fit the measured data. As further explained in [34], the term ΔKthr is related to the ASTM E647-13a definition of the fatigue threshold ΔKth, namely the value of ΔK at a value of da/dN of 10−10 m/cycle, by:
ΔKth = ΔKthr + (10−10/D)1/n
as a general rule, crack growth predictions made using Equations (1) and (2) are quite sensitive to the value used for ΔKthr, and relatively insensitive to the value of A.
The HS equation has also been shown [34,35,36,37,38] to capture the growth of both small and long cracks in additively manufactured materials (AM), and has an ability to account for the effect of residual stresses in both conventionally and additively manufactured materials [39]. It has also been shown to be able to capture the effect of surface roughness on the fatigue life of a component [39]. This finding is particularly important given the statement by the Under Secretary of Defense, Acquisition and Sustainment [40] that “AM parts can be used in both critical and non-critical applications”, and the statement in the USAF Structures Bulletin EZ-19-01 [10] that for AM parts that the most difficult challenge is to establish an “accurate prediction of structural performance” specific to durability and damage tolerance (DADT). As such it is envisaged that if it can be shown that the HS equation can be shown to reasonably accurately compute the growth of small cracks subjected to helicopter flight load spectra, then it may be useful for assessing if an AM (helicopter) replacement part, or an AM repair to a helicopter part, meets the durability requirement inherent in the Structures Bulletin EZ-19-01.

2. Materials and Methods

The majority of references quoted in this paper are taken from peer reviewed journals. The refereed conferences, proceedings, and texts referenced are either publicly available, or available from Google searches. Thirty-nine of the journal papers referenced are in journals that are either listed in SCOPUS or in the World of Science (WOS). The book chapters referenced are listed in SCOPUS. In the case of conference papers, one is in the Proceedings of 13th International Conference on Fracture (ICM13), two are contained in the Proceedings of the 1st Virtual European Conference on Fracture, two are available on Research Gate; seven references are available on various US Department of Defense DTIC websites, one is available on the American Helicopter Society website, and another is on the US Pentagon website. Keywords that were used in these searchers were durability, damage tolerance, Hartman-Schijve, small cracks, additive manufacturing, crack growth in operational aircraft, and aircraft certification.
The paper begins by using the HS equation [2] to compute crack growth in an AA7075-T7352 specimen under a FALLSTAFF (which is an industry standard combat aircraft spectrum) flight load spectrum. It is then used evaluate crack growth under several variants of a US Army Blackhawk spectrum.

3. Crack Growth in 7075-T7351

3.1. Crack Growth under a FALSTAFF Flight Load Spectrum

Before we can compute crack growth in the Helicopter Challenge, we need to establish the constants in the HS equation. To do this we examined the crack length histories given in [41] for the growth of through-the-thickness cracks in a 6.35 mm thick middle tension (MT) panel, with a rectangular cross section, tested under a FALSTAFF flight load spectrum. A plan view of the specimen geometry is shown in Figure 1. The specimens were pre-cracked to a length of approximately 2 mm before the main fatigue test. The specimens were then tested under FALSTAF, an industry-standard combat aircraft load spectrum. The test loads were applied at a frequency of 10 Hz, see [41]. The maximum load in the spectrum was 60 kN. This corresponds to a remote stress of 157.48 MPa in the working section. One block of FALSTAFF load spectrum consisted of 9006 cycles. This equates to 100 equivalent flight hours. The various crack growth histories for the 25 tests performed in [41] are shown in Figure 2.
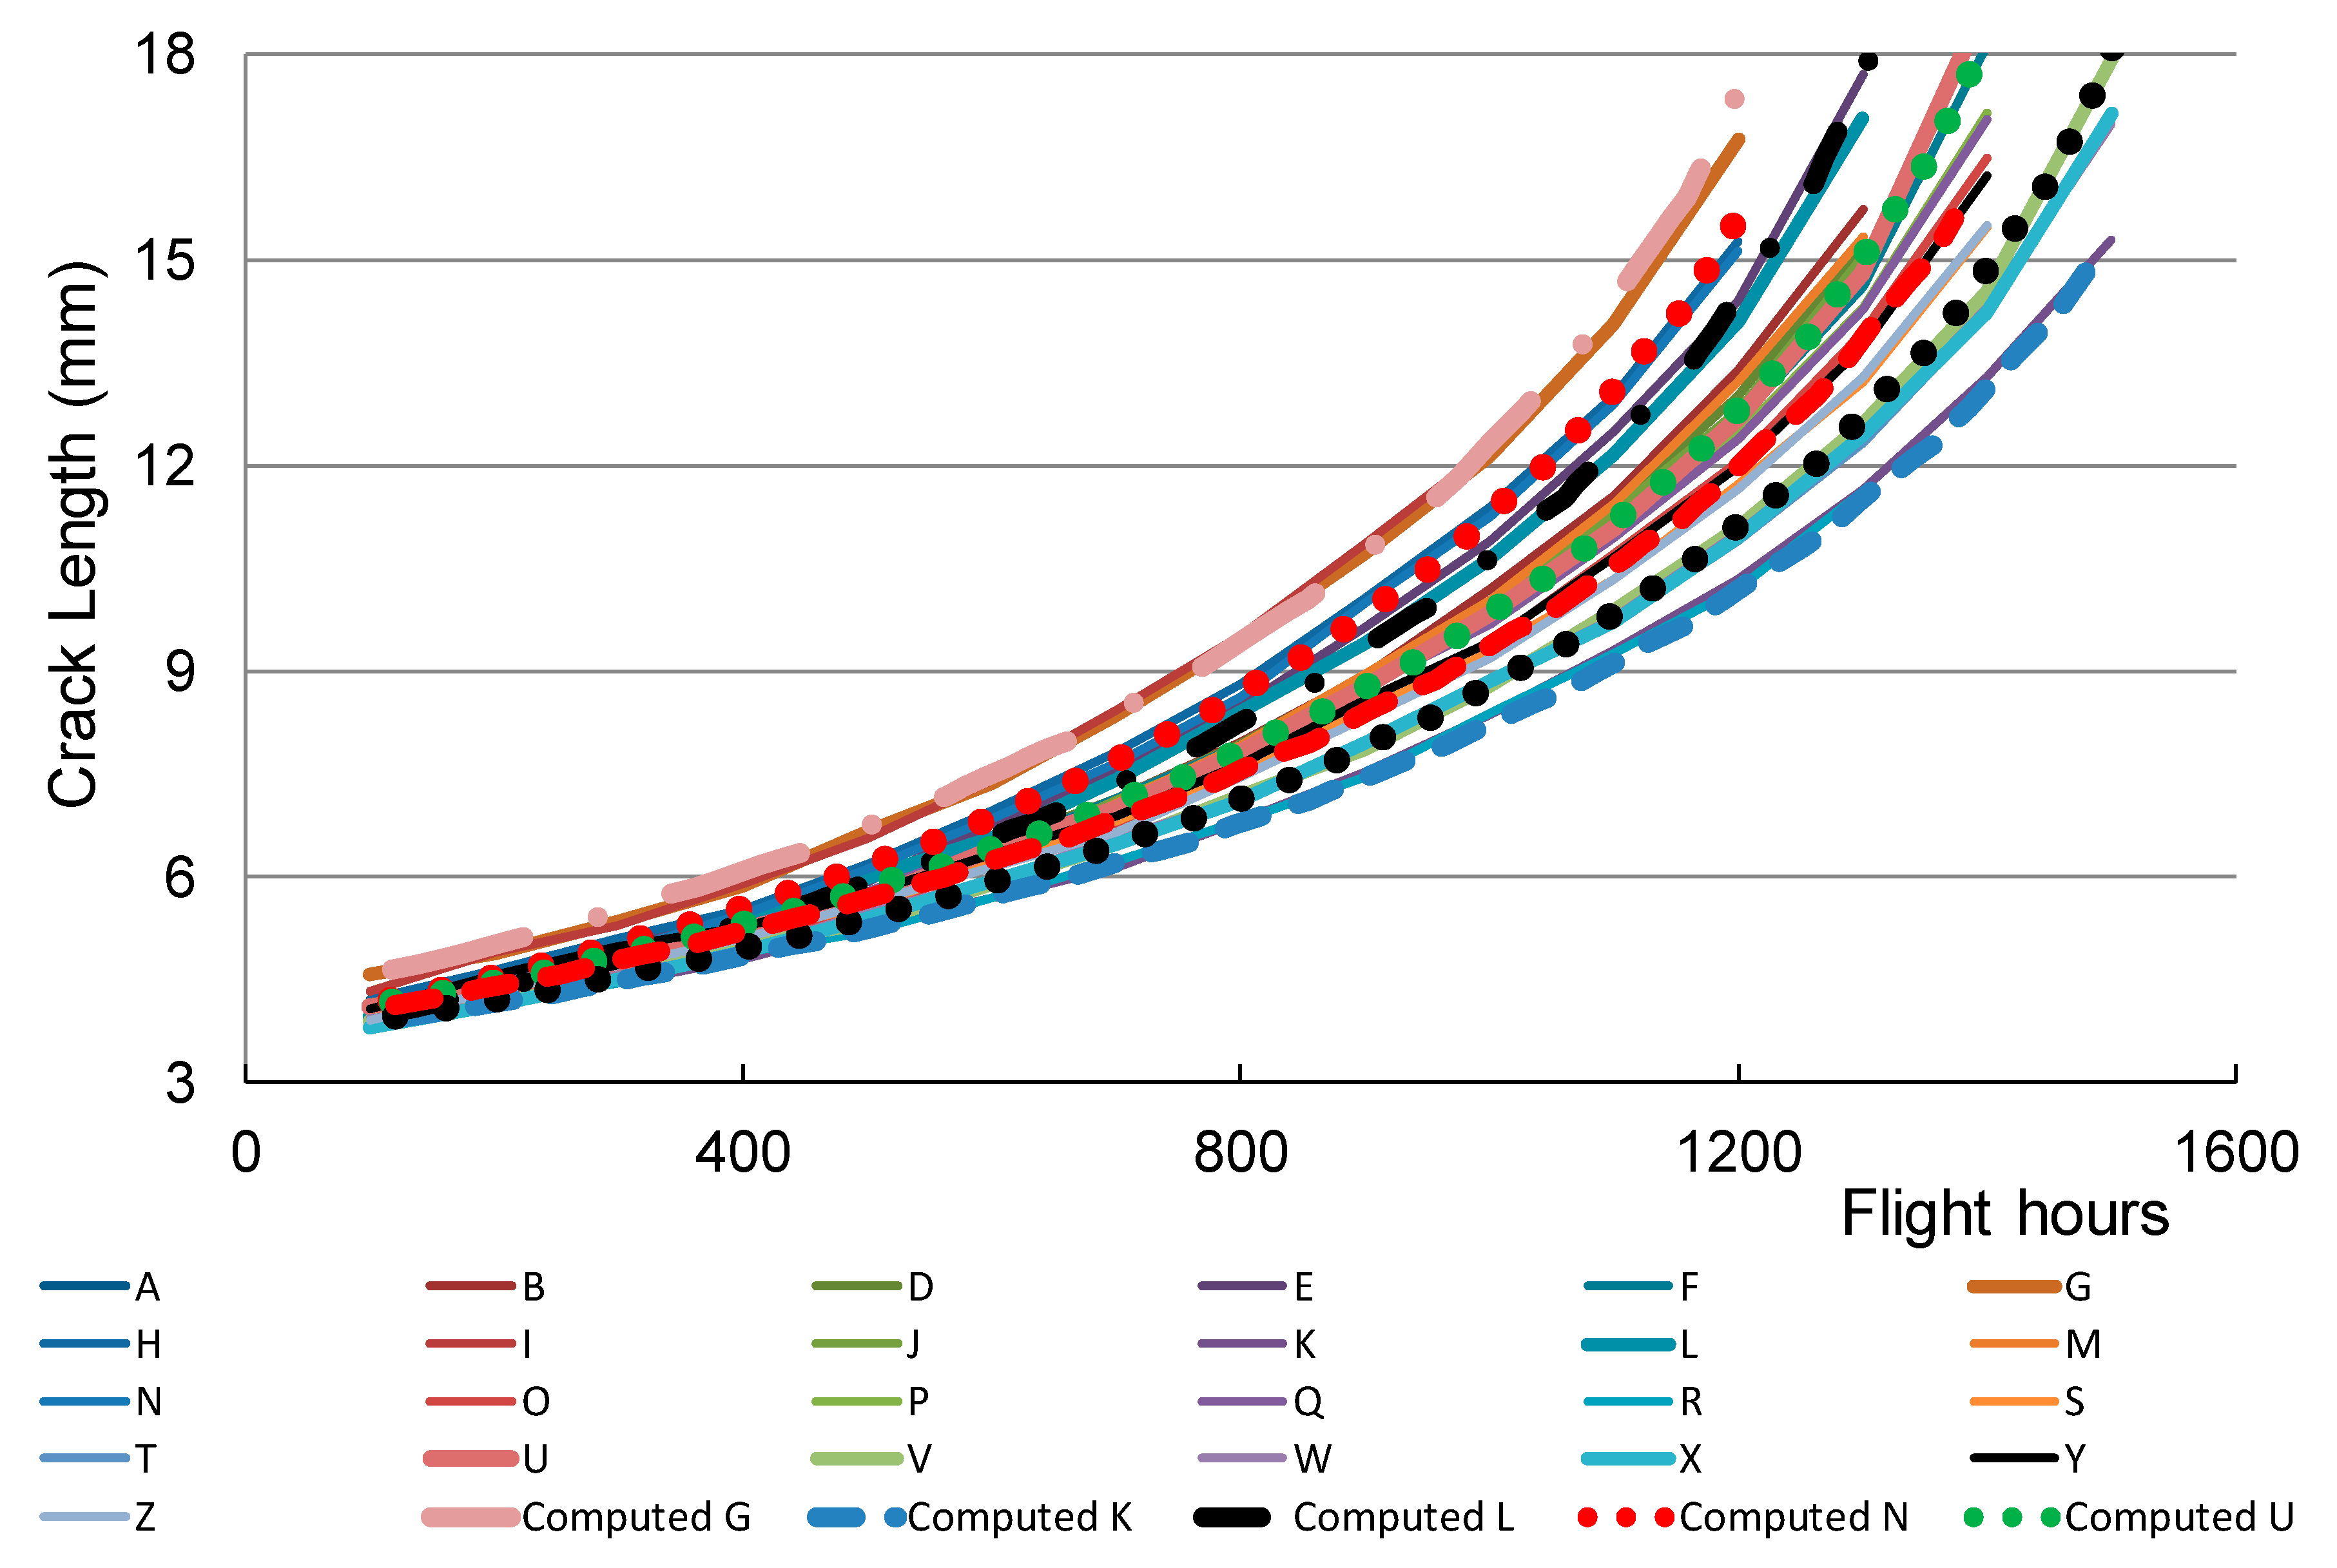
The similarity between the da/dN versus ΔK crack growth curves associated with AA7075-T6 and AA7075-T7351 meant that the values of the constants D and n in Equation (1) for AA7075-T7351 could be taken to be as given in [14] for AA7075-T6, namely: D = 1.86 × 10⁻⁹ (MPa−2 cycle−1), and n = 2. The value of A was taken from that given in [14] for tests on small cracks in AA7075-T7351, viz: A = 111 MPa √m. A similar value is given in [42]. The resultant measured and computed crack growth histories are shown in Figure 2, and the values of A and ΔKthr used in the analysis are given in Table 1. Figure 2 reveals excellent agreement between the measured and computed crack growth histories. Figure 2 also reveals that, as reported in [2,15,16,18,38,43], the scatter in the crack growth histories can be captured by allowing for variability in the term ΔKthr. Figure 3 presents the crack growth history plotted using log-linear axes. Figure 3 reveals that crack growth in these 25 tests could be approximated as being exponential. As explained in [2] this is due to the test program being performed on cracks in an MT panel.

3.2. Short Cracks in 7075-T7351

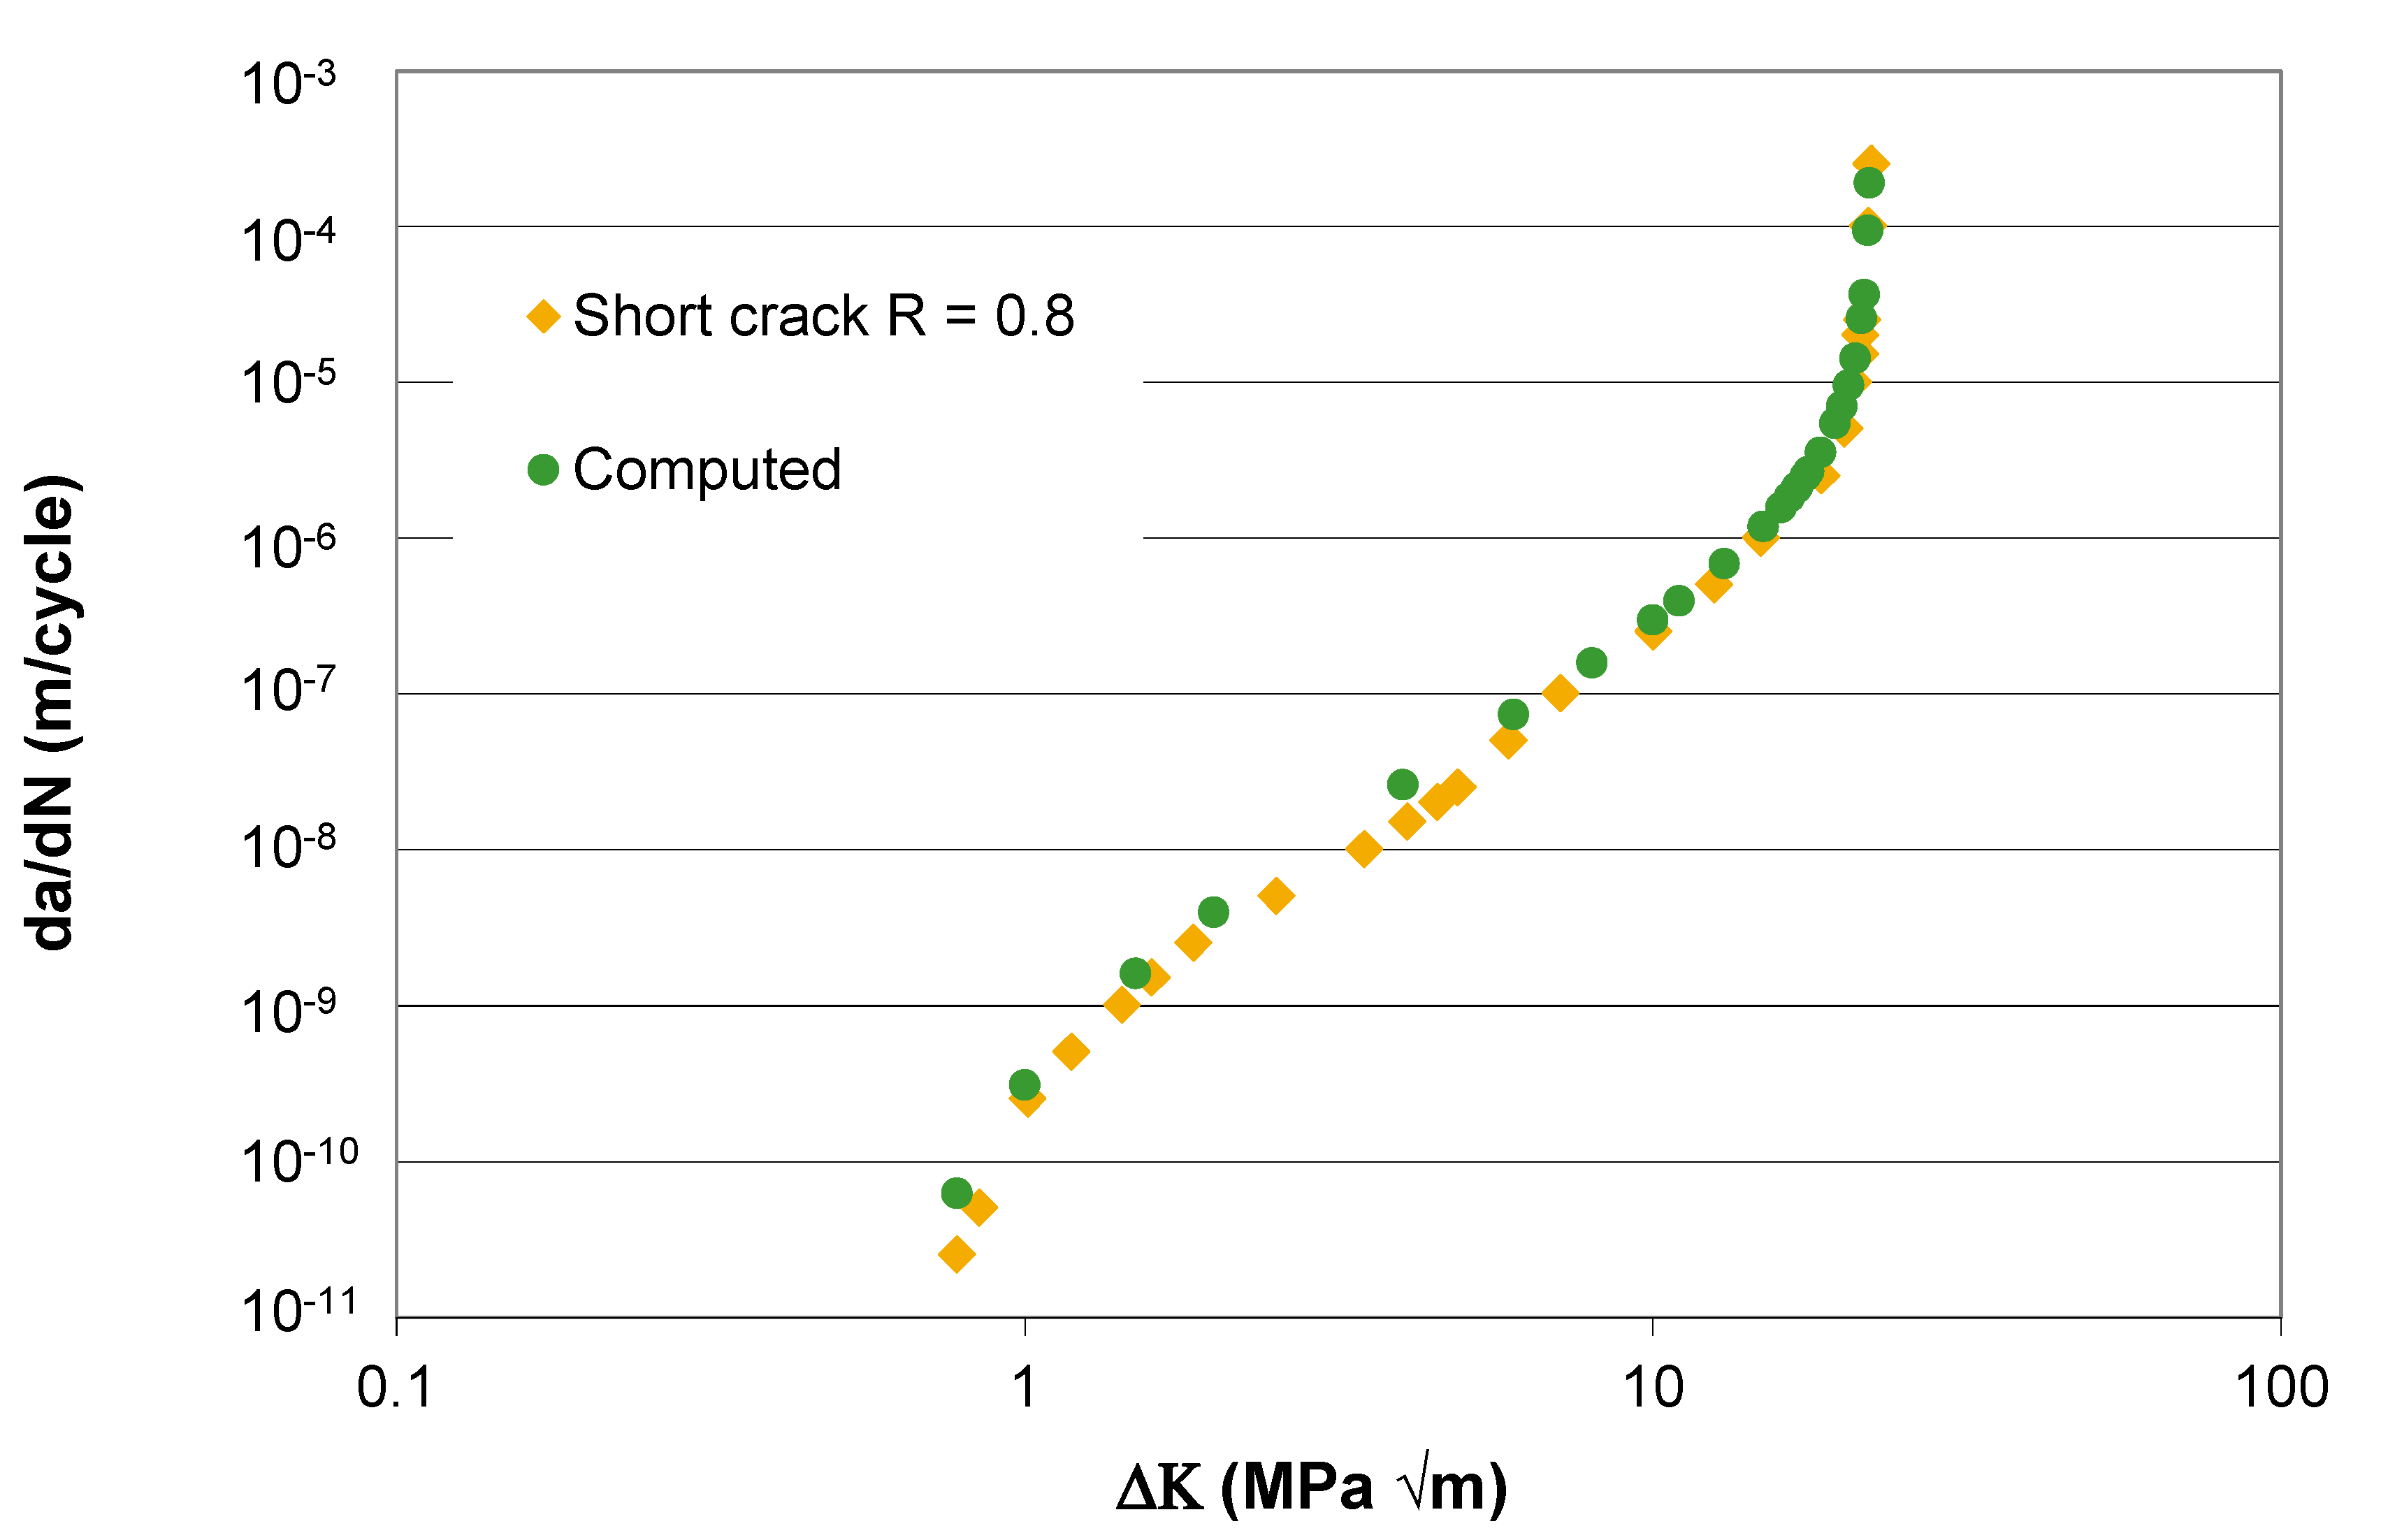
Having determined the crack growth equation for AA7075-T7351 a comparison between the R = 0.8 AA7075-T73 short crack da/dN versus ΔK curve presented in [44] and the corresponding curve predicted using Equation (1) with D = 1.86 × 10⁻⁹, and n = 2, ΔKthr = 0.6 MPa √m and A = 111 MPa √m is given in Figure 4. Figure 4 reveals that there is an excellent agreement between the computed and the measured curve presented in [44]. The next section will use these values of D, n, ΔKthr, and A to compute crack growth in the DST Helicopter Challenge.

4. Computing Crack Growth in the DST Small Crack Helicopter Round Robin Challenge

The focus of problem proposed in the (DST) Group’s small crack Helicopter Round Robin Challenge was to compute the growth of small cracks in 8.4 mm thick AA7075-T7351 specimens under a range of simplified helicopter flight load spectra [11,12]. The baseline spectrum, which is described in [45], was obtained from a flight strain survey conducted on a US Army H-60 Black Hawk helicopter. The crack growth data and details of the specimen and the various helicopter flight load spectra were made publicly available via the DST ASSIST initiative and are available at [11,12].
The load sequences provided by DST as part of the ASSIST Round Robin were termed IRF-E14, IRF-E15, and IRF-E16. These spectra are simplified/reduced versions of the baseline spectrum, where different numbers of small amplitude cycles have been removed. Sequences termed CSL090SSXX, which are truncated versions of the IRF-E16 spectrum, were also provided. The CSL090SSXX spectra had: (a) an additional 90% of the smallest cycles removed, and (b) the mid-range cycles were scaled by XX%.
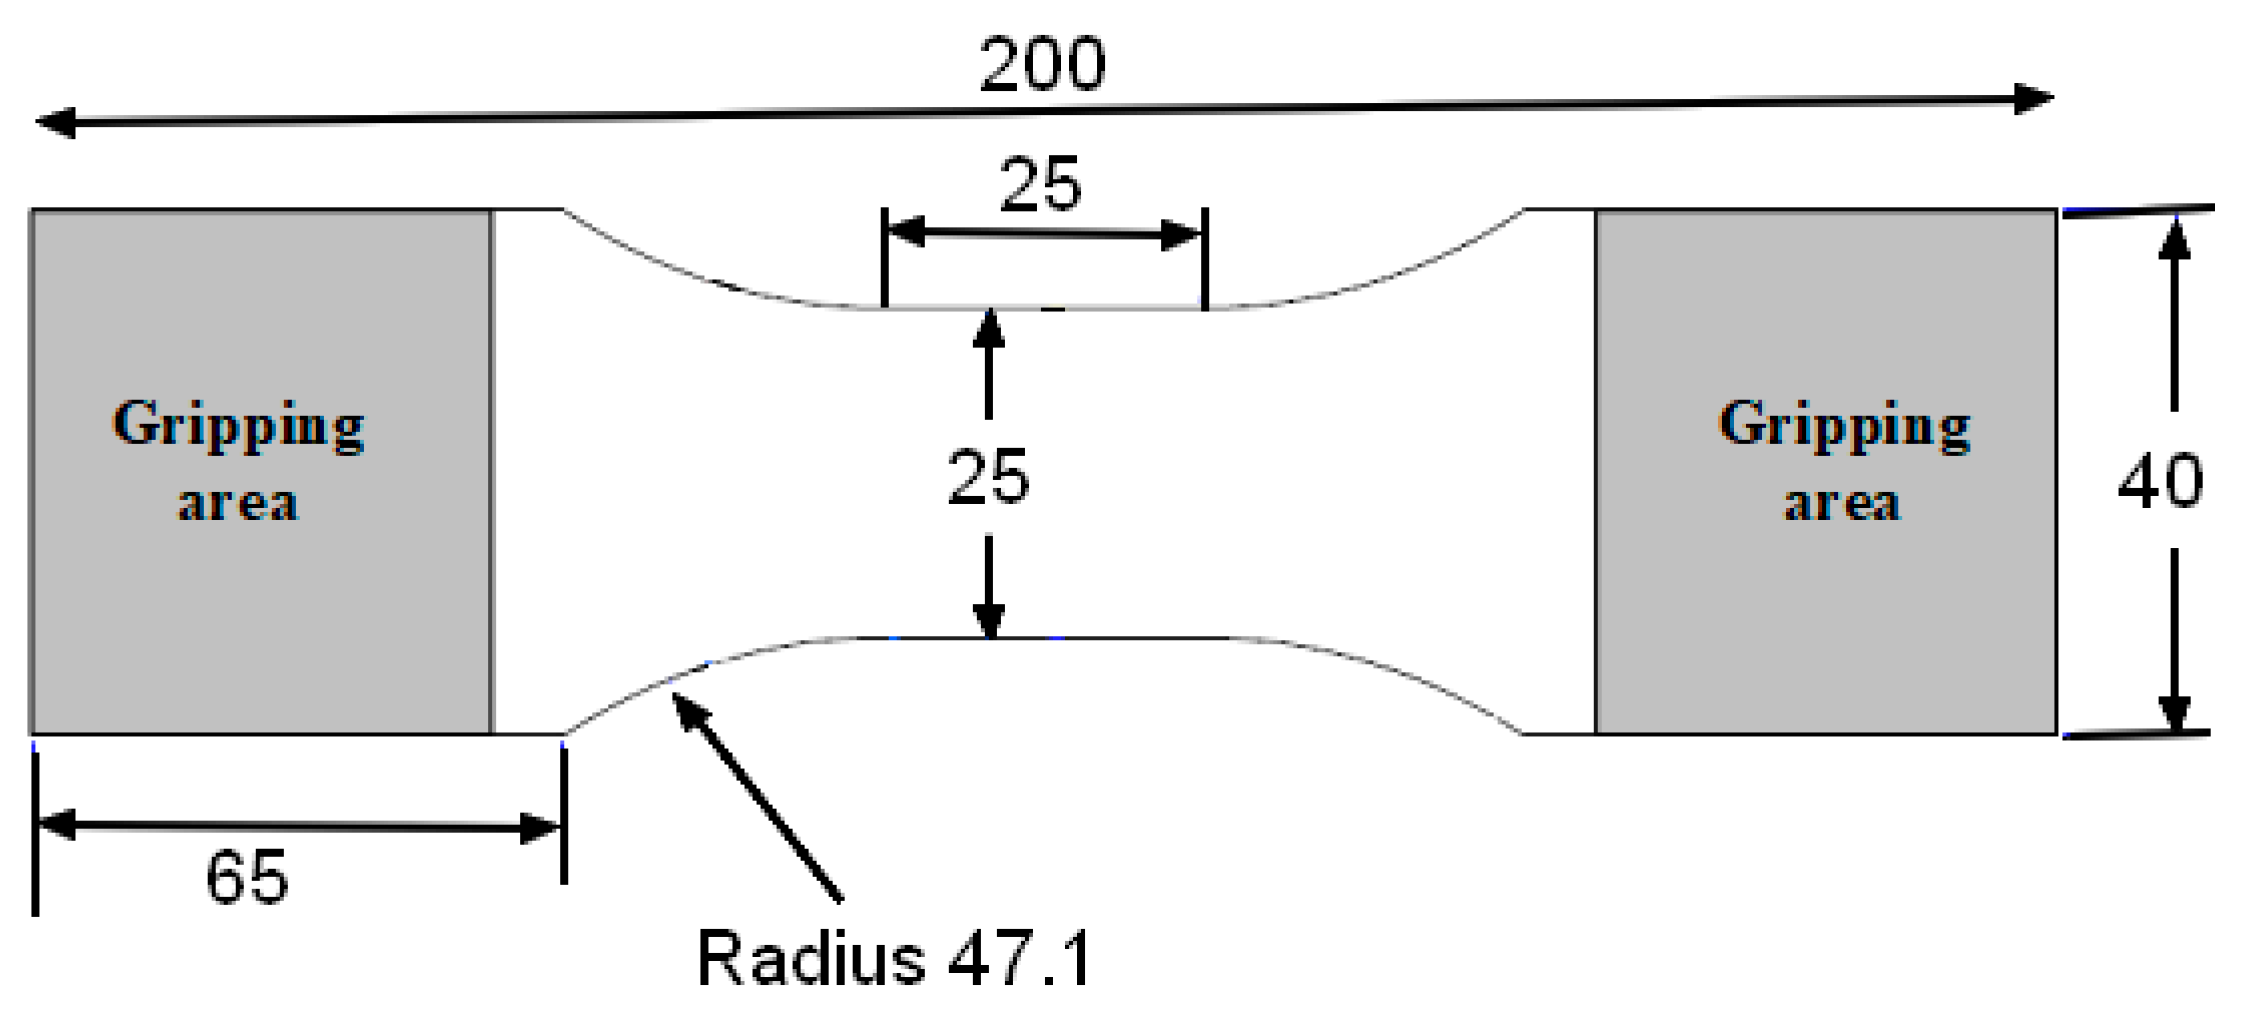
A plan view of the test specimens used by DST in the ASSIST test program [11] is shown in Figure 5. The number of turning points in each of the spectra used in this test study are given in Table 2. The surface of the specimen was etched to promote organic crack nucleation, using a solution of Hydrofluoric acid (1%), Nitric acid (50%), and water (49%). Further details of the test specimen and the spectra are given in [11,12].

Short Cracks in 7075-T7351

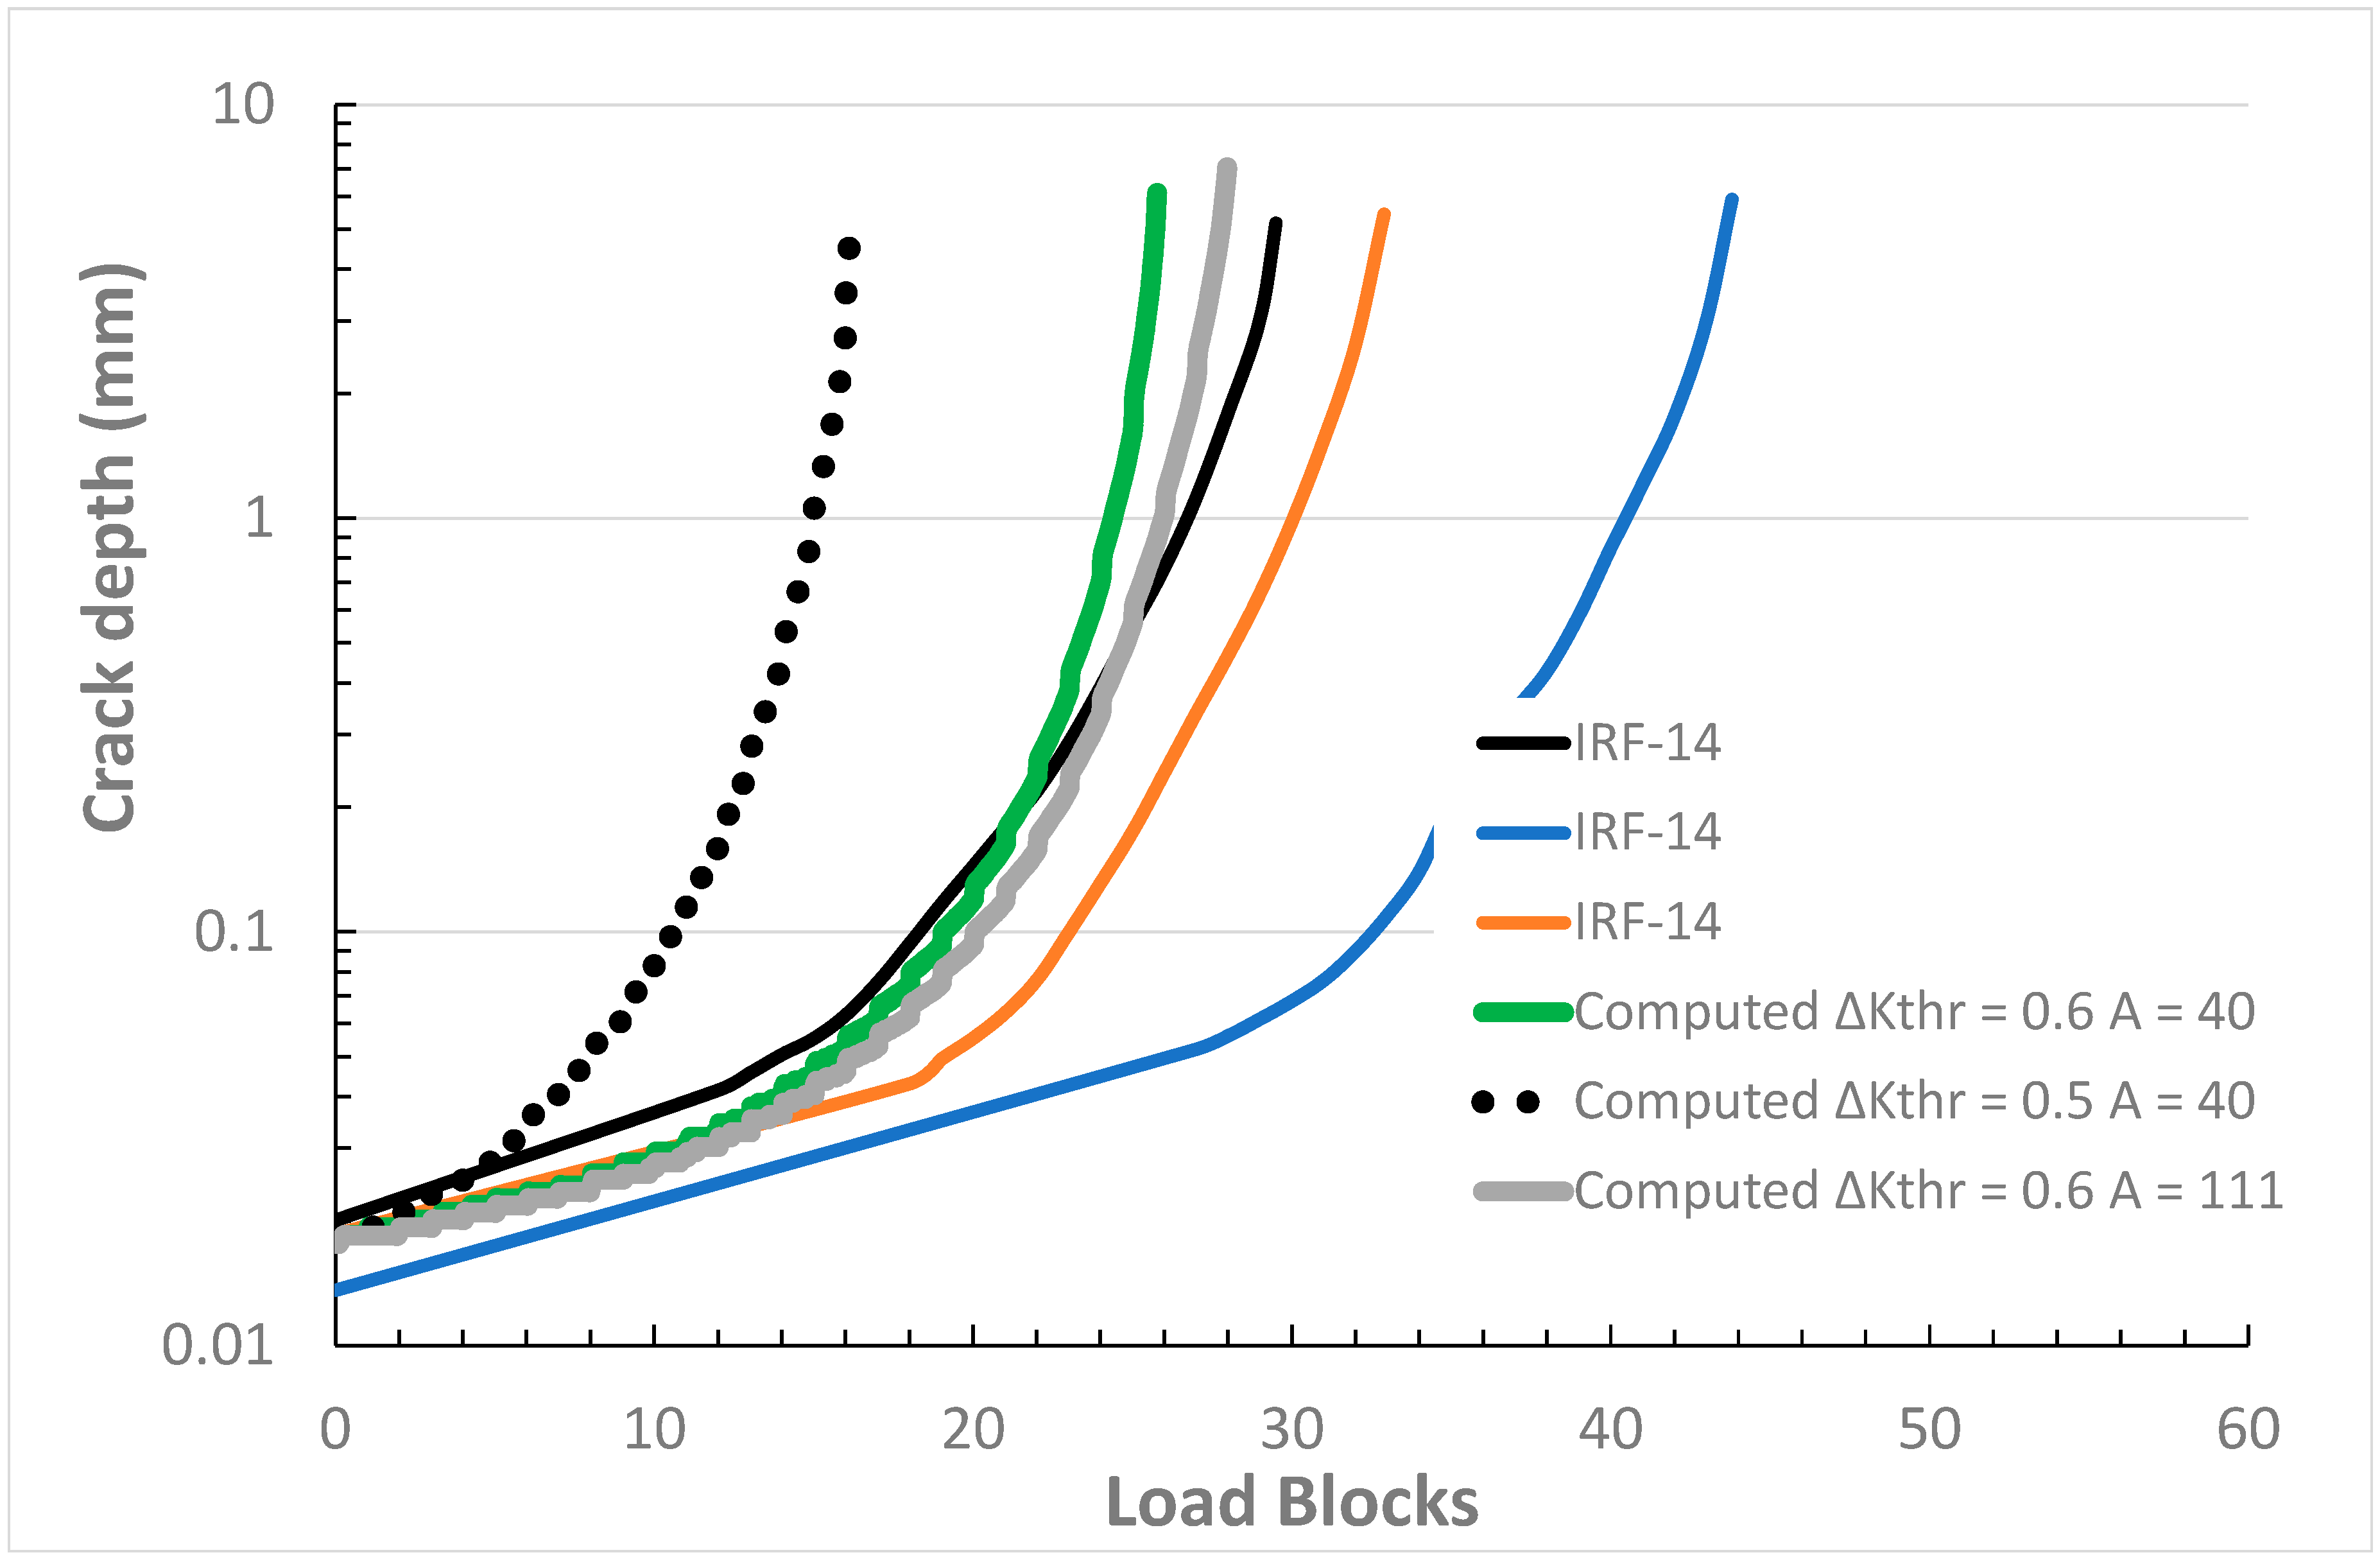
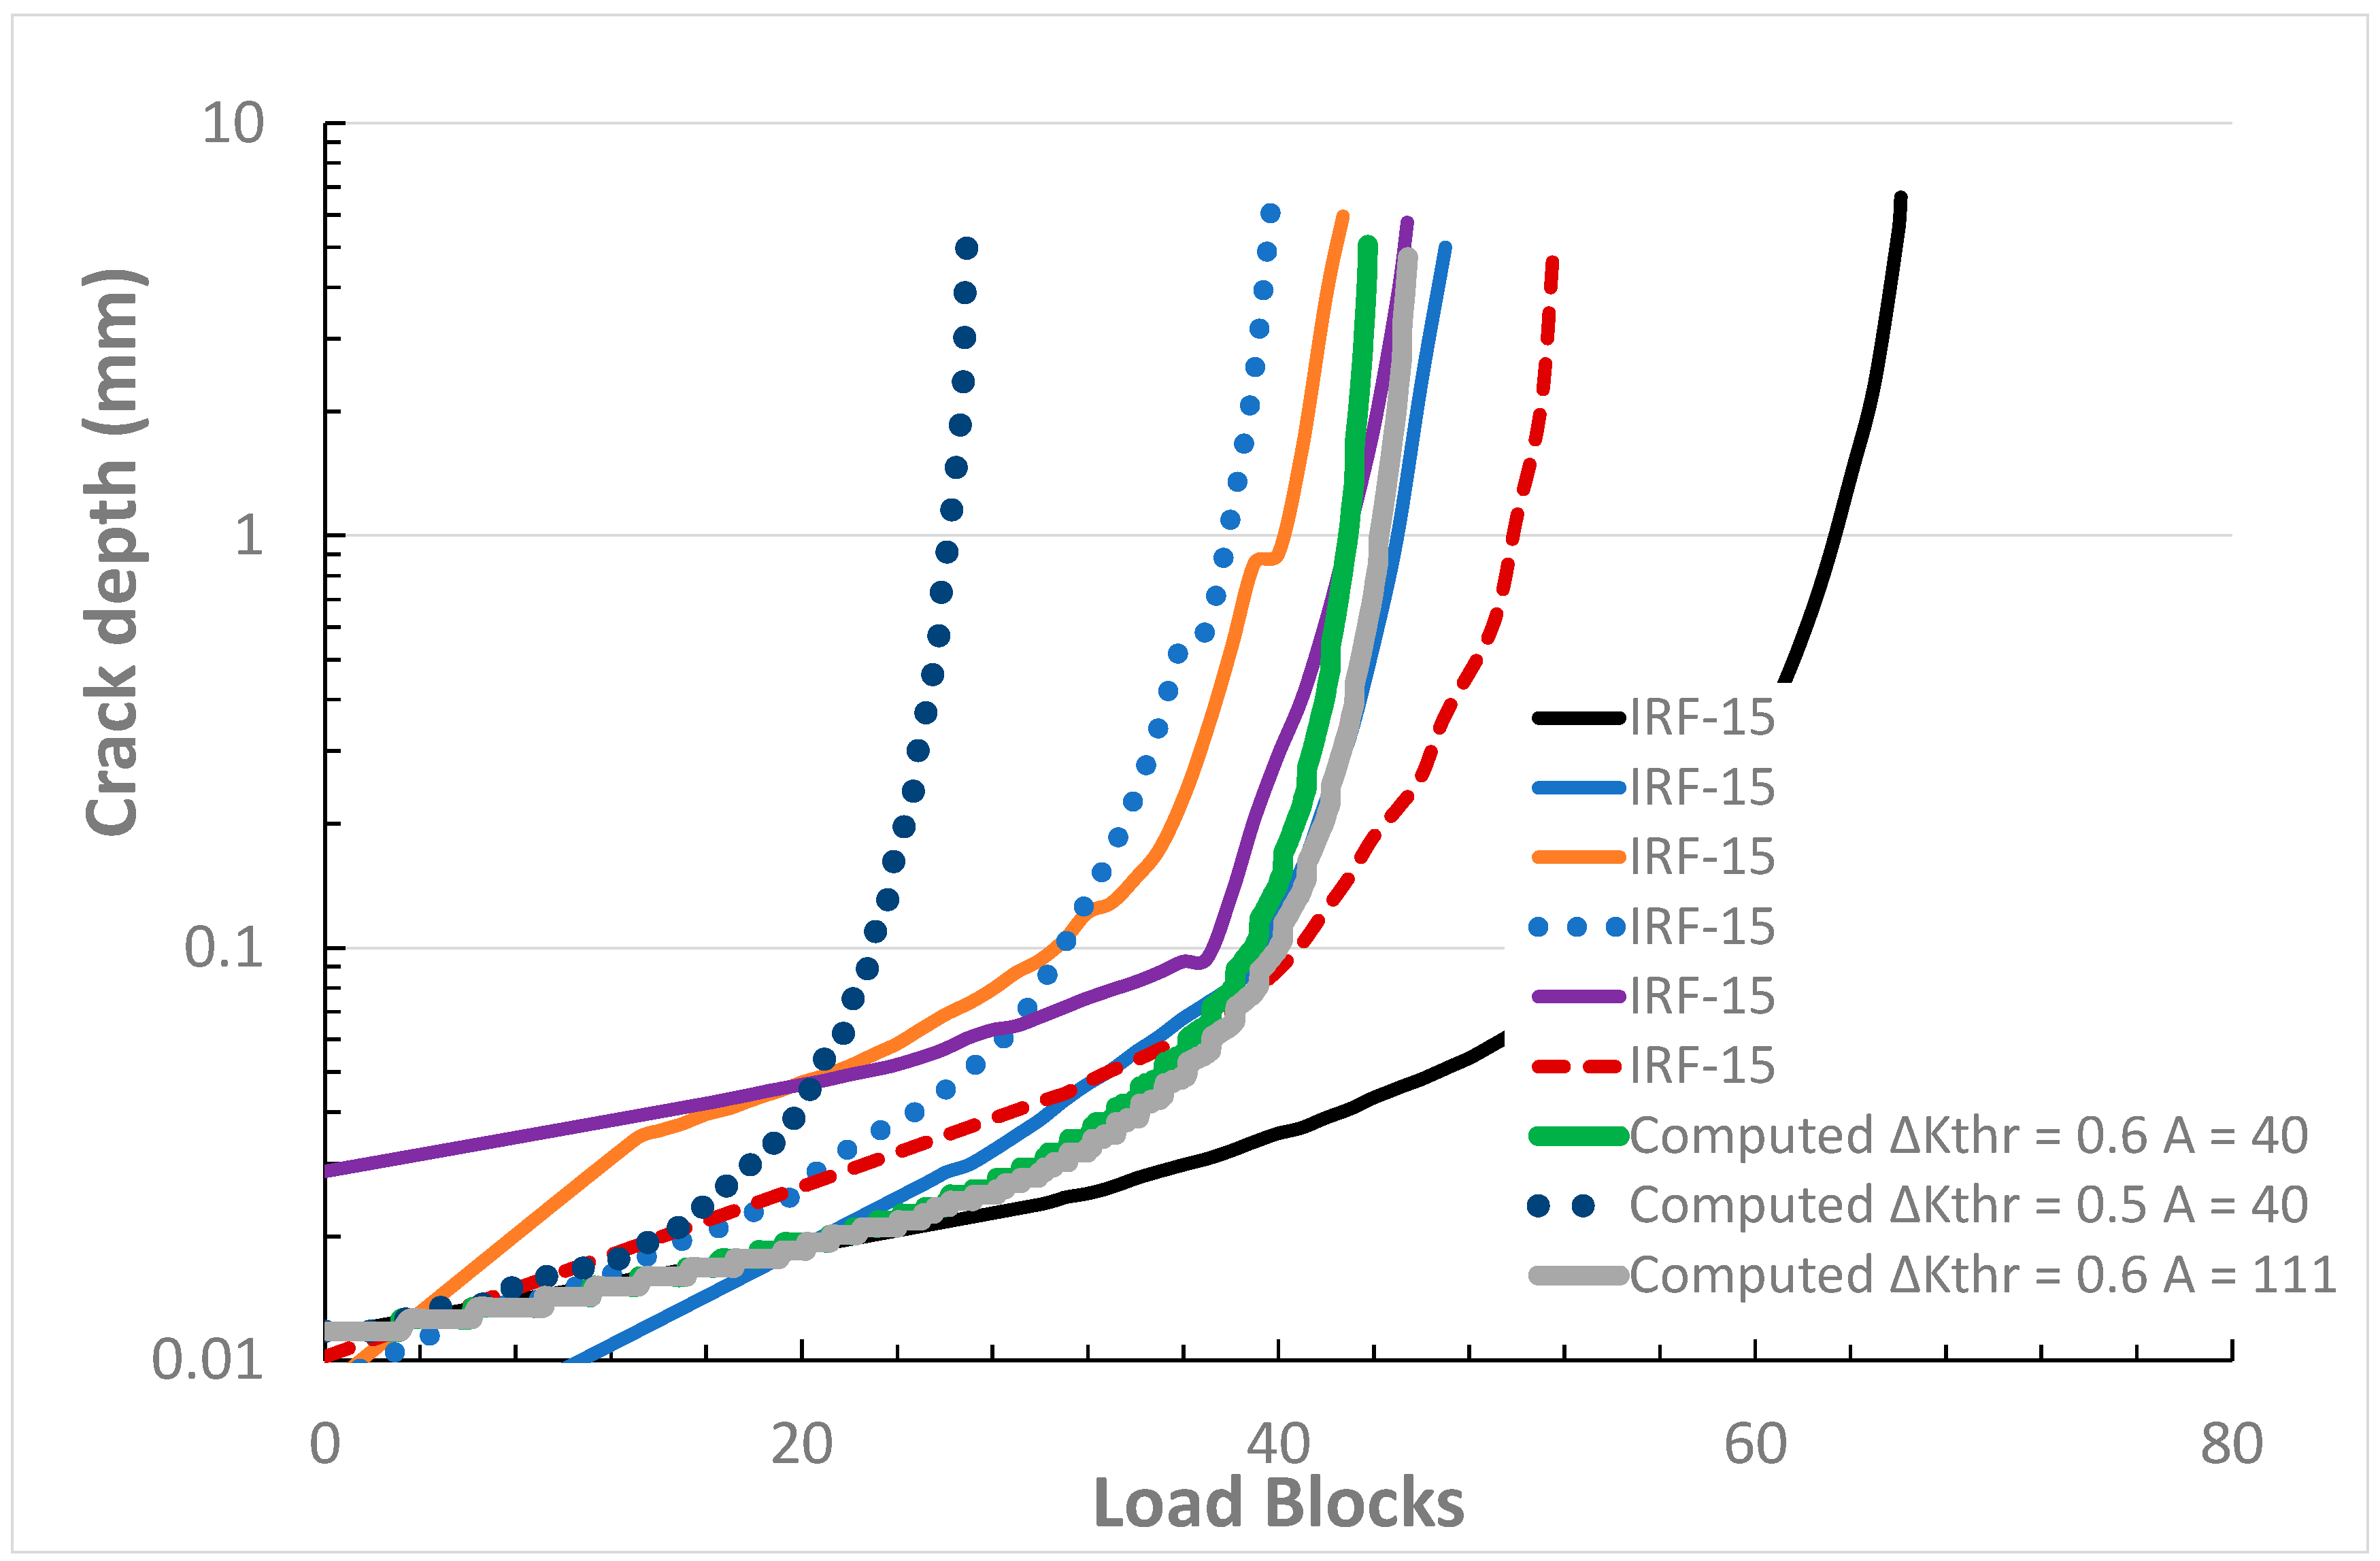
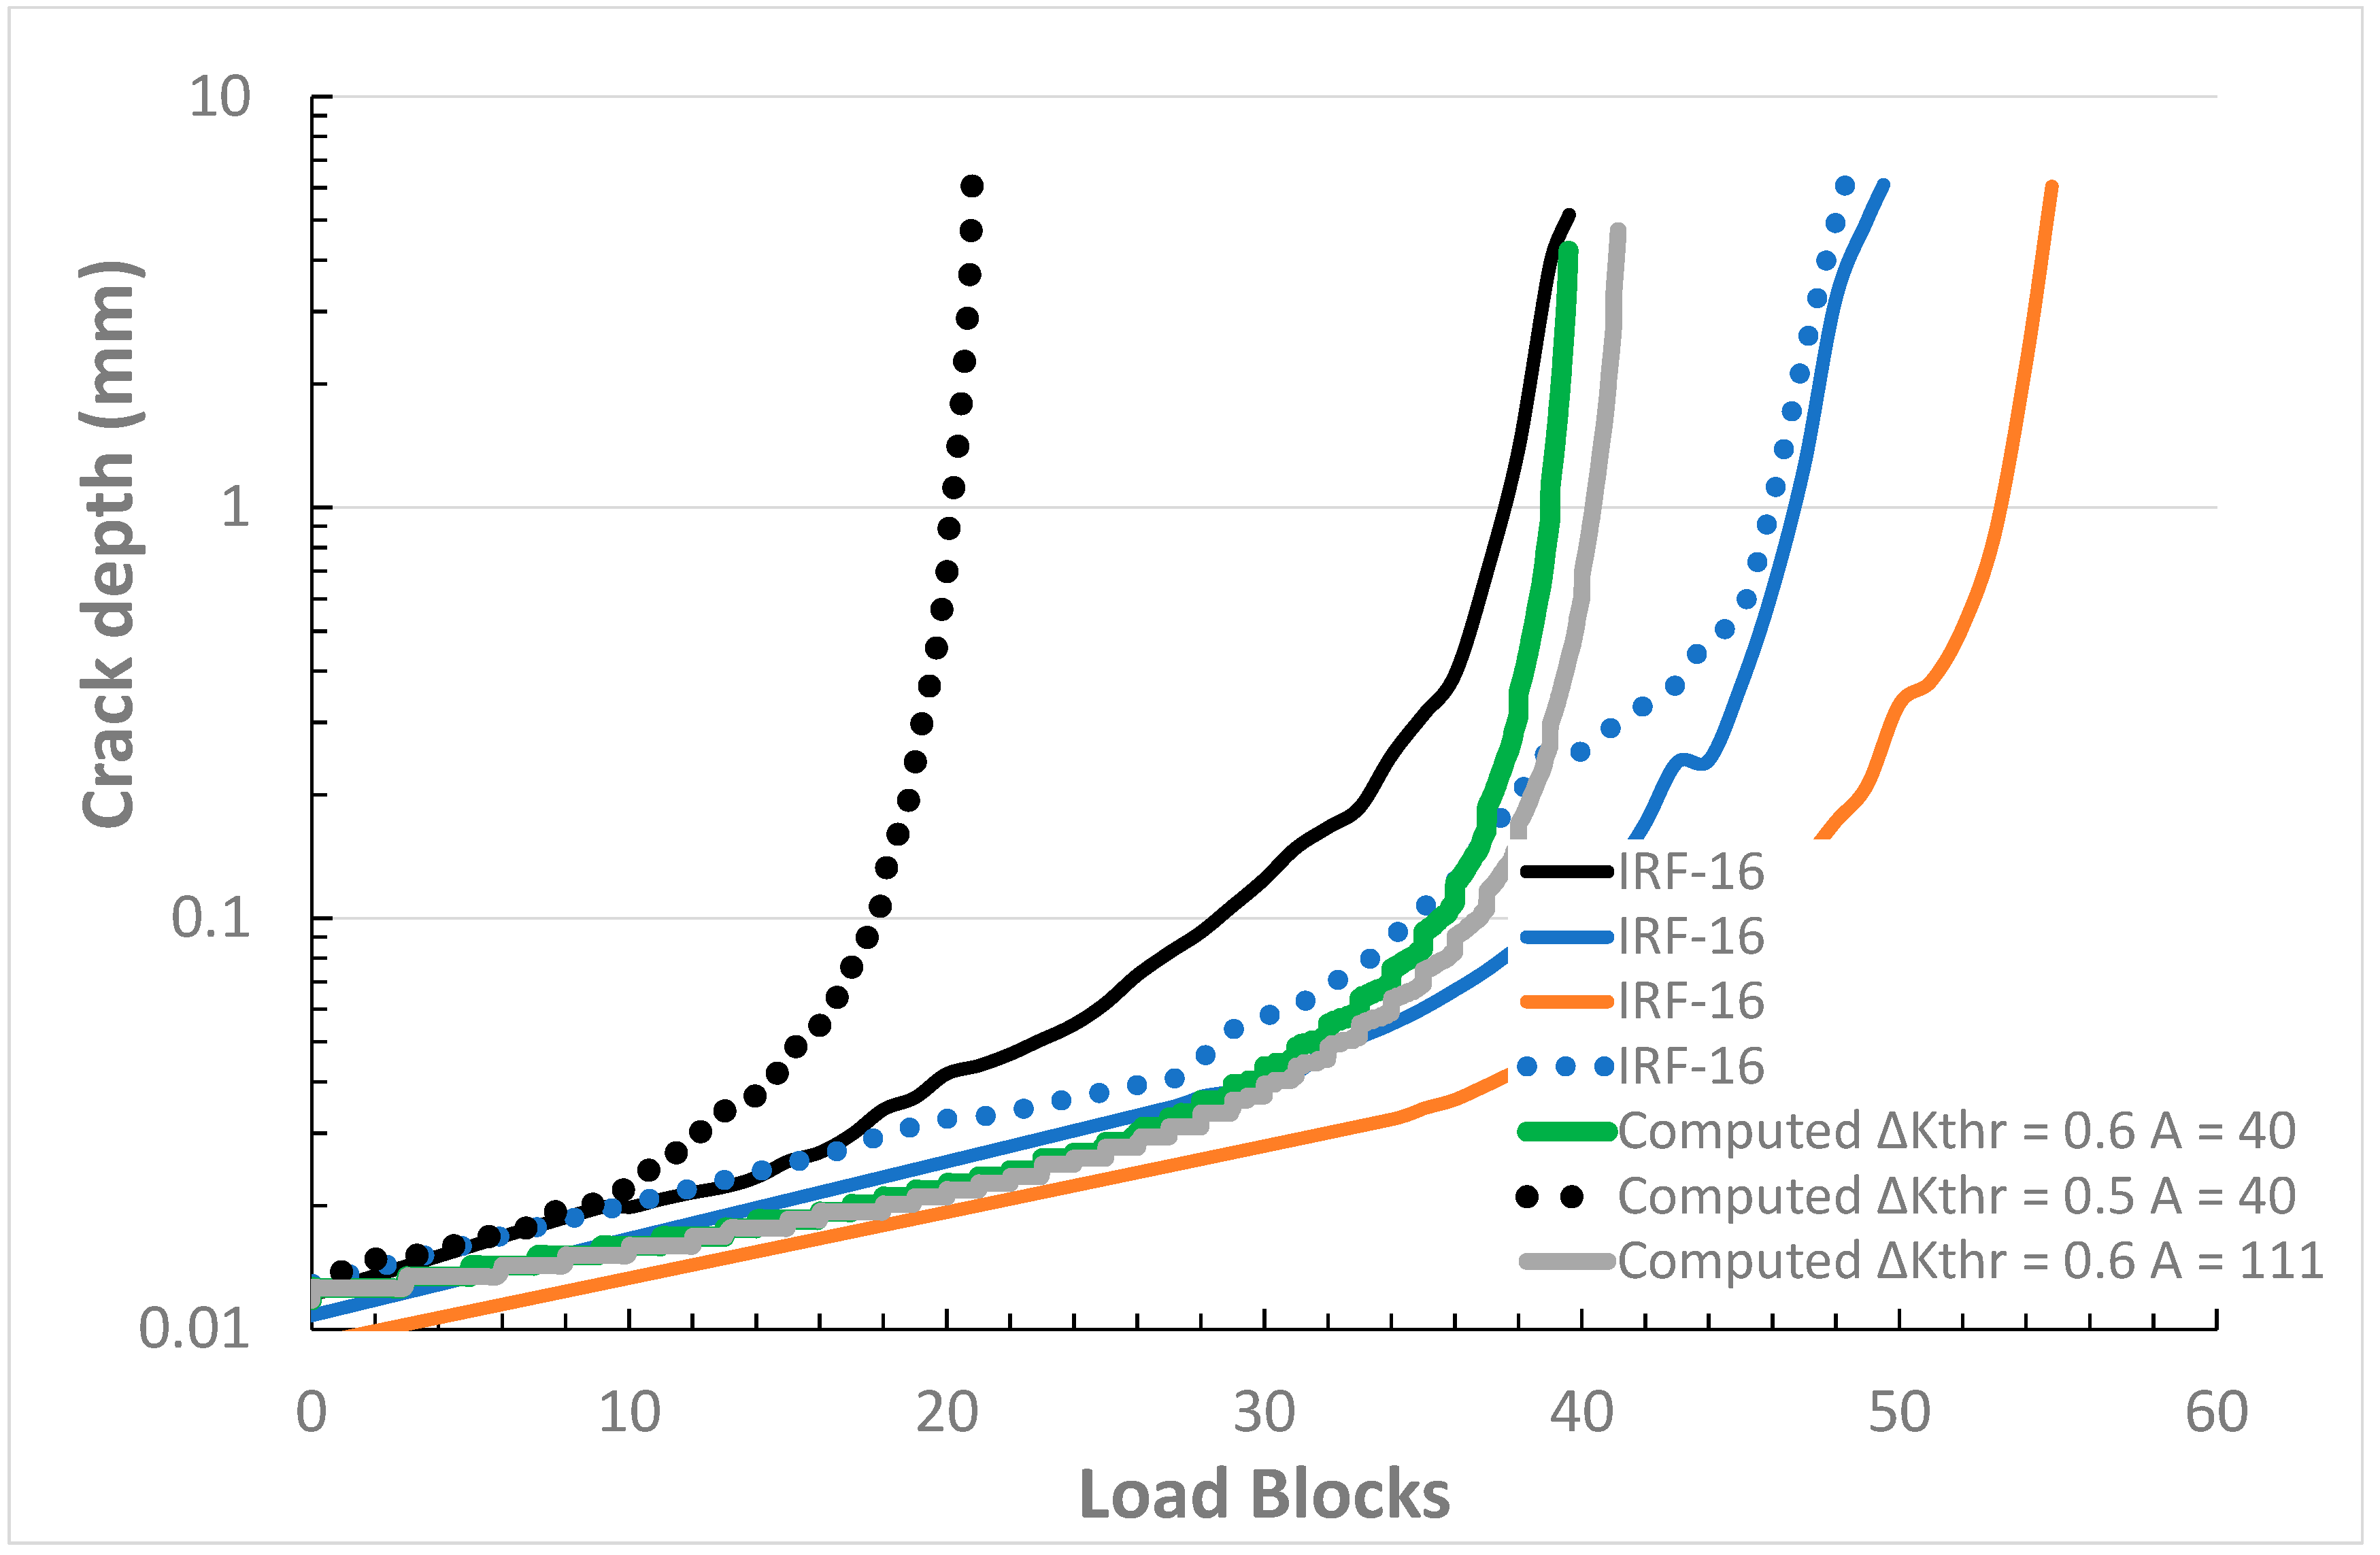
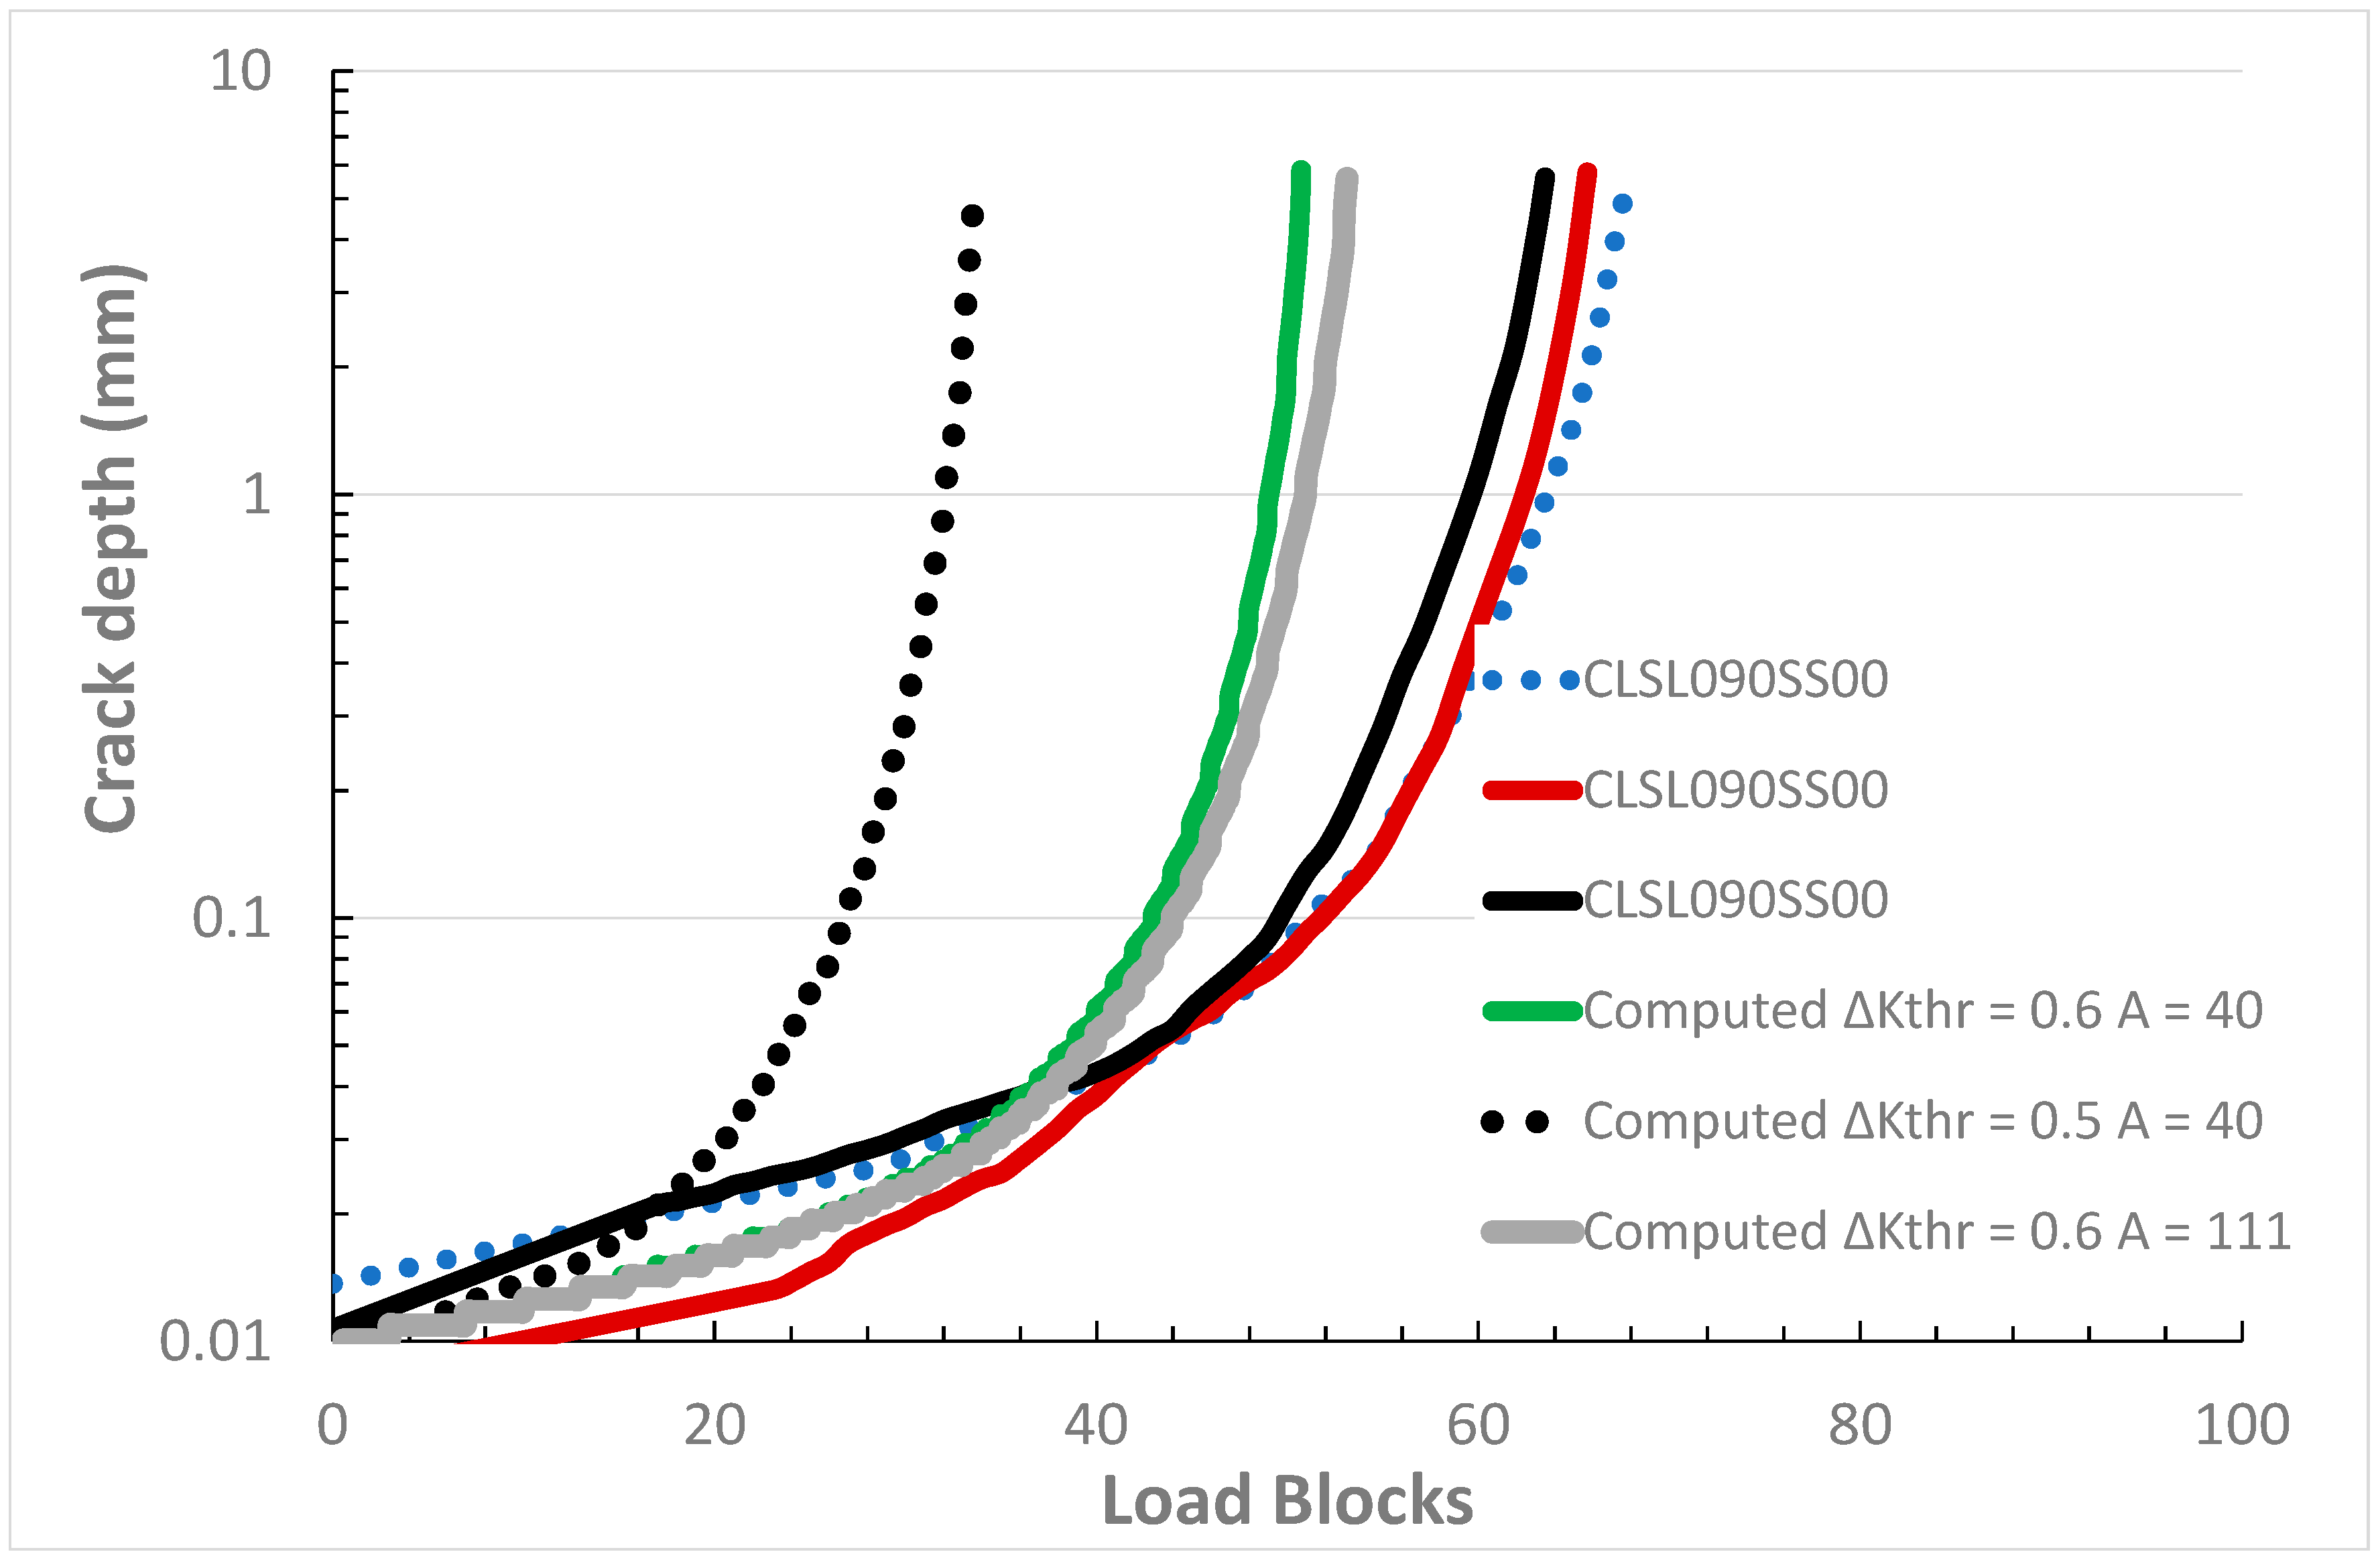
Equation (1), with D = 1.86 × 10⁻⁹, n = 2, and ΔKthr = 0.6 MPa √m, was used to predict the crack growth histories associated with the Round Robin tests subjected to the following spectra: IRF-E14, IRF-E15, IRF-E16, CSL090SS00, CSL090SS05, CSL090SS15, and CSL090SS20. The analysis was performed using both A = 40 MPa √m, and A = 111 MPa √m. The value of A = 40 MPa √m was investigated since prior DST constant amplitude tests [41] had yielded values of A ≈ 32 MPa √m for twenty four mm thick AA7075-T7351 specimens, and A ≈ 40 MPa √m for three mm thick AA7075-T7351 specimens. The value of A = 111 MPa √m was investigated since it is associated with the short crack tests reported in [44]. As per the requirements enunciated in the ASSIST challenge [11], the initial crack size was taken to be a centrally located 0.01 mm semi-circular surface crack. The stress intensity factors were computed using the methodology outlined in [46]. Comparisons between the measured and computed crack growth histories are given in Figure 6, Figure 7, Figure 8, Figure 9, Figure 10, Figure 11 and Figure 12, where the computed crack depth histories are labelled “Computed ΔKthr = 0.6 A = XX”, where XX is either 40 or 111 depending on what value of A was used in the analysis. Here it should be noted that, as shown in Figure 6, Figure 7, Figure 8, Figure 9, Figure 10, Figure 11 and Figure 12, each spectrum test program had a number of repeated tests. Figure 6, Figure 7, Figure 8, Figure 9, Figure 10, Figure 11 and Figure 12 reveal that there is little difference between the crack growth histories computed using A = 40 MPa √m or A = 111 MPa √m. This is because the majority of the life is consumed in growing to a depth of 1 mm. We also see that there is reasonable agreement between the measured and predicted crack growth curves.

5. Material Variability

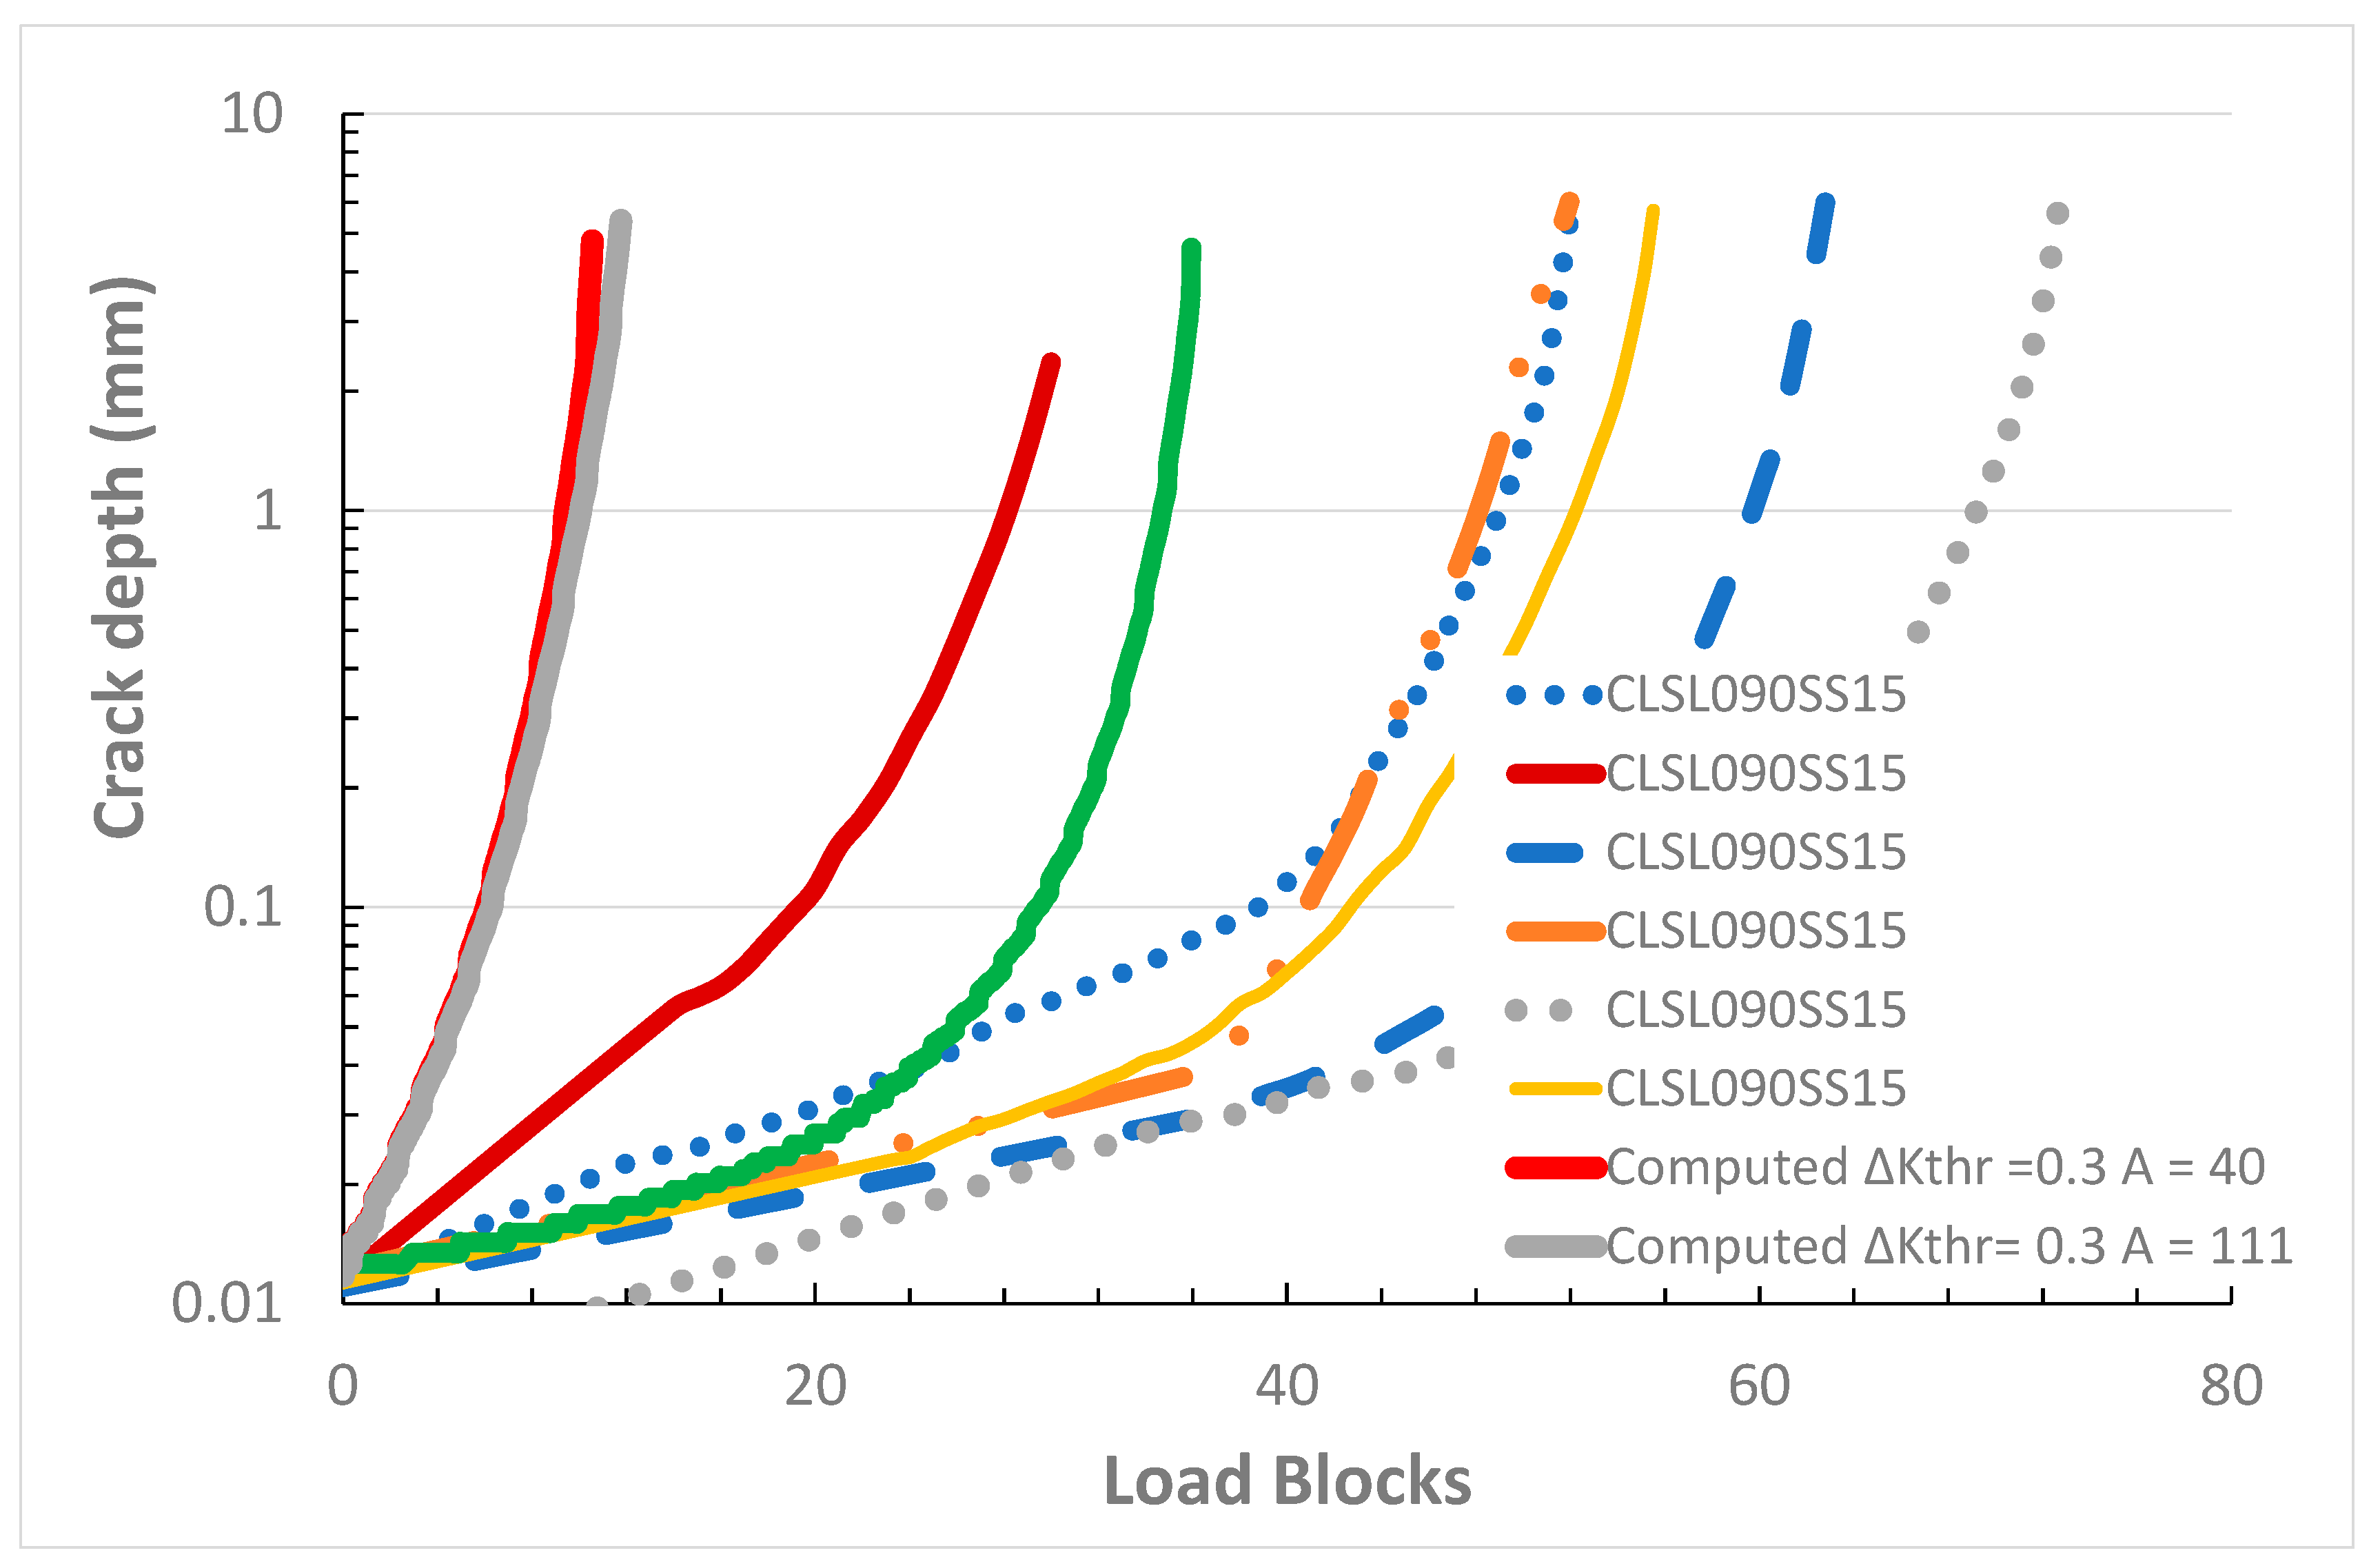
The variability in crack growth that can arise from a fatigue test was first highlighted by a paper by Virkler et al. [47] This study presented the results of more than sixty constant amplitude R = 0.2 tests on identical 2024-T3 panels which had a constant initial half crack length of 9 mm (see Figure 13). Figure 2 illustrates the variability in crack growth seen in tests on long cracks tested under an operational flight load spectra. Unfortunately, for small cracks the variability in the crack depth histories can be significantly greater than that seen in the long crack curves shown in Figure 2 and Figure 13 [16,48,49]. (The effect of (local) material variability on the growth of small cracks is compounded by the fact that the size and shape of the initial material discontinuity is variable, and generally cannot be tightly controlled [49,50,51].) The variability in the crack depth history associated with spectra CSL090SS15 is a good example of this, see Figure 11 that presents the variability in the crack depth histories associated with six different cracks.
This raises the question: How much greater would the variability in the crack growth histories shown in Figure 6, Figure 7, Figure 8, Figure 9, Figure 10, Figure 11 and Figure 12 have been if significantly more tests been performed?
Whilst it is not possible to definitively answer this question, it may be possible to shed some light on the problem space by investigating the effect of small changes in the fatigue threshold on the computed crack growth histories. Given that more than 90% of the Black Hawk flight load spectrum consists of small amplitude loads [45], and that the variability in the growth of small cracks can often be captured by allowing for variability in the term ΔKthr (see Section 3.1 and [2,15,16,18,38,43]) it is anticipated that a small change in ΔKthr should result in a much greater change in the crack growth history. To investigate this hypothesis we reanalysed the various test spectra using ΔKthr = 0.5 MPa √m and A = 111 MPa √m. The resultant crack depth histories are also shown in Figure 6, Figure 7, Figure 8, Figure 9, Figure 10, Figure 11 and Figure 12 where they are labelled “Computed ΔKthr = 0.5 A = 111”. Here we see that, as expected, when values of ΔKthr = 0.5 MPa √m and A = 111 MPa √m are used there is a significant reduction in the computed fatigue lives, when compared to the lives computed using ΔKthr = 0.6 MPa √m and A = 111 MPa √m, and that the computed fatigue lives are now conservative. Bearing in mind that for small cracks growing under combat, maritime, and civil aircraft flight load spectra, it has been shown that the variability in the crack growth histories is captured by allowing for (relatively small) changes in ΔKthr—this appears to suggest that in order to evaluate the effect of simplifying a spectrum, so as to reduce test time, on the fastest possible (lead) crack a statistically significant number of tests should be performed. This requirement is highlighted in Section 3.2.19.1 of the US Joint Services Structural Guidelines [9] that states: “The allowable structural properties shall include all applicable statistical variability”.
To further investigate the variability (scatter) seen in the ASSIST tests let us examine the data associated with test spectra IRF-15 and CSL090SS15, which had information on the largest number of cracks (six). The mean lives, standard deviation (σ), and the projected worst case (mean-3σ) lives are given in Table 3. Here we see that the standard deviation in the test lives is a significant proportion of the mean life. It should be noted that whilst the mean-3σ life and the standard deviation calculations are based on small sample statistics, they nevertheless indicate the need for data on the growth of a greater number of cracks, i.e., additional testing.
It has been suggested [18] that for small cracks in aluminium alloys the threshold term lies in the range 0.1 < ΔKthr < 0.3. Consequently, for spectra IRF-15 and CSL090SS15 the analysis was repeated using ΔKthr = 0.3 MPa √m, and either A = 40 MPa √m, or A = 111 MPa √m. Comparisons between the measured and computed crack depth histories for these spectra are shown in Figure 14 and Figure 15. The (computed) number of cycles to failure obtained using A = 40 MPa √m and A = 111 MPa √m are given in Table 3. Here we see that Table 3 and Figure 14 and Figure 15 reveal that the computed crack depth history is a weak function of the cyclic fracture toughness. We also see that when using ΔKthr = 0.3 MPa √m the resultant computed crack depth histories have a near exponential shape. Furthermore, the computed lives to failure are more conservative than the “Mean-3σ” lives as determined from the “limited” number of tests. It is thus suggested that in the absence of a statistically significant number of small crack tests the crack depth curve calculated using the value ΔKthr = 0.3 MPa √m may be a reasonable first estimate for this “worst case” curve.

On the Shape of the Crack Depth History Curves

In the previous section, we remarked that using ΔKthr = 0.3 MPa √m gave crack depth histories that had a near exponential shape. It was also suggested that, in the absence of a statistically significant number of small crack tests, the crack depth curve computed using ΔKthr = 0.3 MPa √m may be a reasonable first estimate for the worst-case crack depth history. In this context, it should be noted that the USAF Durability Design Handbook [52] explains that the growth of small “lead” cracks, i.e., the fastest growing cracks in an airframe or a component [53,54], in military aircraft is generally exponential. Indeed, this exponential crack growth model is contained within the USAF approach to assessing the risk of failure [55]. This feature, i.e., the exponential growth of lead cracks growing under flight load spectra, was independently validated in [49,56] and is discussed in more detail in [2,49]. However, examining Figure 6, Figure 7, Figure 8, Figure 9, Figure 10, Figure 11 and Figure 12, we see that the crack growth histories are not exponential. This observation raises an additional question, viz:
If significantly more tests had been performed would the “worst-case” crack depth versus load blocks curves have been (approximately) exponential?

6. Conclusions

The assessment of the economic lives of operational metallic helicopter airframes requires a durability analysis in which the EIDS are sub mm, typically 0.254 mm. Unfortunately, whereas several studies into the ability of crack growth models to perform a damage tolerance analysis of helicopter components subjected to a representative flight load spectrum have been performed few, if any, studies can be found on the ability of crack growth models to perform a valid durability assessment of a component subjected to an operational helicopter flight load spectrum. In this context, the present study has found that the HS equation is able to reasonably accurately compute the growth of small naturally occurring cracks in AA7075-T7351 under several simplified/reduced Black Hawk flight load spectra. This suggests that the HS equation may have the potential to address the question of how to simplify measured spectra in order to reduce the time and complexity of full-scale helicopter fatigue tests.
It is also suggested that, given the inherent variability seen in small crack growth, any round robin test on small cracks, and any test program performed to the effect of spectrum truncation on the growth of small cracks should involve a statistically significant number of tests.

Author Contributions

Conceptualization and methodology—R.J.; analysis of the FALSTAFF loading test case—P.H.; development and validation of the computer software and the helicopter test analysis—D.P.; review, editing, and supervision of D.P. at Monash—R.K.S.R. All authors have read and agreed to the published version of the manuscript.

Funding

This research received no external funding.

Acknowledgments

The authors wish to acknowledge Madeline Burchill at DST for the development of the ASSIST Round Robin Helicopter Program, and Beau Krieg at DST for providing the associated crack growth data. The authors would also like to acknowledge the assistance of Weiping HU at DST who provided the data on the growth of cracks in 7075-T7351 under a FALSTAFF spectrum.

Conflicts of Interest

The authors declare no conflict of interest.

References

  1. Lincoln, J.W.; Melliere, R.A. Economic life determination for a military aircraft. J. Aircr. 1999, 36, 737–742. [Google Scholar] [CrossRef]
  2. Jones, R. Fatigue crack growth and damage tolerance. Fatigue Fract. Eng. Mater. Struct. 2014, 37, 463–483. [Google Scholar] [CrossRef]
  3. MIL-STD-1530D, Department of Defense Standard Practice Aircraft Structural Integrity Program (ASIP). 13 October 2016. Available online: http://everyspec.com/MIL-STD/MIL-STD.../download.php?spec=MIL-STD-1530D (accessed on 2 February 2020).
  4. ASTM E647-13a. Measurement of Fatigue Crack Growth Rates; ASTM: West Conshohocken, PA, USA, 2013. [Google Scholar]
  5. Newman, J.C.; Irving, P.; Lin, J.; Le, D. Crack growth in a complex helicopter component under spectrum loading. Fatigue Fract. Eng. Mater. Struct. 2006, 29, 949–958. [Google Scholar] [CrossRef]
  6. Irving, P.; Lin, J.; Bristow, J. Damage tolerance in helicopters—Report on the round-robin challenge. In Proceedings of the American Helicopter Society 59th Annual Forum, Phoenix, AR, USA, 6–8 May 2003; Available online: https://vtol.org/store/product/a-round-robin-exercise-to-assess-capability-topredict-crack-growth-lives-and-inspection-intervals-for-damage-tolerant-design-in-helicopters-4262.cfm (accessed on 29 May 2020).
  7. Peng, D.; Jones, R.; Sinha, A.; Mathews, N.; Singh Raman, R.K.; Phan, N.T.; Nguyen, T. Analysis of fatigue crack growth in a helicopter component. In Proceedings of the Asian/Australian Rotorcraft Forum 2018, Seogwipo City, Jeju Island, Korea, 30 October–1 November 2018; Available online: https://vtol.org/arf2018 (accessed on 29 May 2020).
  8. Cansdale, R.; Perrett, B. The Helicopter Damage Tolerance Round Robin Challenge. In Proceedings of the Workshop on Fatigue Damage of Helicopters, Pisa, Italy, 12–13 September 2002. [Google Scholar]
  9. Department of Defense Joint Service Specification Guide, Aircraft Structures, JSSG-2006. October 1998. Available online: http://everyspec.com/USAF/USAF-General/JSSG-2006_10206/ (accessed on 10 July 2020).
  10. Structures Bulletin EZ-SB-19-01, Durability and Damage Tolerance Certification for Additive Manufacturing of Aircraft Structural Metallic Parts, Wright Patterson Air Force Base, OH, USA. 10 June 2019. Available online: https://daytonaero.com/usaf-structures-bulletins-library/ (accessed on 2 February 2020).
  11. Burchill, M. Advancing Structural Simulation to Drive Innovative Sustainment Technologies: ASSIST Helicopter Crack Growth Prediction Challenge Definition. 18 June 2019. Available online: https://www.researchgate.net/publication/341790926_Approved_for_Public_Release_Advancing_Structural_Simulation_to_drive_Innovative_Sustainment_Technologies_ASSIST_Helicopter_Crack_Growth_Prediction_Challenge_Definition?channel=doi&linkId=5ed4f110458515294527add2&showFulltext=true (accessed on 16 May 2020).
  12. ASSIST Challenge 3. Available online: https://www.researchgate.net/publication/342201234_Spectra (accessed on 16 May 2020).
  13. Hartman, A.; Schijve, J. The effects of environment and load frequency on the crack propagation law for macro fatigue crack growth in aluminium alloys. Eng. Fract. Mech. 1970, 1/4, 615–631. [Google Scholar] [CrossRef]
  14. Lo, M.; Jones, R.; Bowler, A.; Dorman, M.; Edwards, D. Crack growth at fastener holes containing intergranular cracking. Fatigue Fract. Eng. Mater. Struct. 2017, 40, 1664–1675. [Google Scholar] [CrossRef]
  15. Tamboli, D.; Barter, S.; Jones, R. On the growth of cracks from etch pits and the scatter associated with them under a miniTWIST spectrum. Int. J. Fatigue 2018, 109, 10–16. [Google Scholar] [CrossRef]
  16. Jones, R.; Molent, L.; Barter, S. Calculating crack growth from small discontinuities in 7050-T7451 under combat aircraft spectra. Int. J. Fatigue 2013, 55, 178–182. [Google Scholar] [CrossRef]
  17. Main, B.; Evans, R.; Walker, K.; Yu, X.; Molent, L. Lessons from a Fatigue Prediction Challenge for an Aircraft Wing Shear Tie Post. Int. J. Fatigue 2019, 123, 53–65. [Google Scholar] [CrossRef]
  18. Jones, R.; Singh Raman, R.K.; McMillan, A.J. Crack growth: Does microstructure play a role? Eng. Fracture Mech. 2018, 187, 190–210. [Google Scholar] [CrossRef]
  19. Zhang, Y.; Zheng, K.; Heng, J.; Zhu, J. Corrosion-Fatigue Evaluation of Uncoated Weathering Steel Bridges. Appl. Sci. 2019, 9, 3461. [Google Scholar] [CrossRef] [Green Version]
  20. Godefroid, L.B.; Moreira, L.P.; Vilela, T.C.G.; Faria, G.L.; Candido, L.C.; Pinto, E.S. Effect of chemical composition and microstructure on the fatigue crack growth resistance of pearlitic steels for railroad application. Int. J. Fatigue 2019, 120, 241–253. [Google Scholar] [CrossRef]
  21. Cano, A.J.; Salazar, A.; Rodríguez, J. Evaluation of different crack driving forces for describing the fatigue crack growth behaviour of PET-G. Int. J. Fatigue 2018, 107, 27–32. [Google Scholar] [CrossRef]
  22. Jones, R.; Peng, D.; Michopoulos, J.G.; Kinloch, A.J. Requirements and Variability Affecting the Durability of Bonded Joints. Materials 2020, 23, 1468. [Google Scholar] [CrossRef] [Green Version]
  23. Jones, R.; Hu, W.; Kinloch, A.J. A convenient way to represent fatigue crack growth in structural adhesives. Fatigue Fract. Eng. Mater. Struct. 2015, 38, 379–391. [Google Scholar] [CrossRef] [Green Version]
  24. Jones, R.; Kinloch, A.J.; Hu, W. Cyclic-fatigue crack growth in composite and adhesively-bonded structures: The FAA slow crack growth approach to certification and the problem of similitude. Int. J. Fatigue 2016, 88, 10–18. [Google Scholar] [CrossRef] [Green Version]
  25. Rocha, A.V.M.; Akhavan-Safar, A.; Carbas, R.; Marques, E.A.S.; Goyal, R.; El-Zein, M.; da Silva, L.F.M. Paris law relations for an epoxy-based adhesive. Proc. Inst. Mech. Eng. Part L J. Mater. Des. Appl. 2019. [Google Scholar] [CrossRef]
  26. Brunner, A.J.; Stelzer, S.; Pinter, G.; Terrasi, G.P. Cyclic fatigue delamination of carbon fiber-reinforced polymer-matrix composites: Data analysis and design considerations. Int. J. Fatigue 2016, 83, 293–299. [Google Scholar] [CrossRef]
  27. Chocron, T.; Banks-Sills, L. Nearly mode I fracture toughness and fatigue delamination propagation in a multidirectional laminate fabricated by a wet-layup. Phys. Mesomech. 2019, 22, 107–140. [Google Scholar] [CrossRef]
  28. Simon, I.; Banks-Sills, L.; Fourman, V. Mode I delamination propagation and R-ratio effects in woven composite DCB specimens for a multi-directional layup. Int. J. Fatigue 2017, 96, 237–251. [Google Scholar] [CrossRef]
  29. Jones, R.; Kinloch, A.J.; Michopoulos, J.G.; Brunner, A.J.; Phan, N. Delamination growth in polymer-matrix fibre composites and the use of fracture mechanics data for material characterisation and life prediction. Compos. Struct. 2017, 180, 316–333. [Google Scholar] [CrossRef]
  30. Yao, L.; Alderliesten, R.C.; Jones, R.; Kinloch, A.J. Delamination fatigue growth in polymer-matrix fibre composites: A methodology for determining the design and lifing allowables. Compos. Struct. 2018, 196, 8–20. [Google Scholar] [CrossRef] [Green Version]
  31. Jones, R.; Stelzer, S.; Brunner, A.J. Mode I, II and Mixed Mode I/II delamination growth in composites. Compos. Struct. 2014, 110, 317–324. [Google Scholar] [CrossRef]
  32. Simon, I.; Banks-Sills, L.; Fourman, V.; Eliasi, R. Delamination Propagation and Load Ratio Effects in DCB MD Woven Composite Specimens. Procedia Struct. Integr. 2016, 2, 205–212. [Google Scholar] [CrossRef] [Green Version]
  33. Schwalbe, K.H. On the beauty of analytical models for fatigue crack propagation and fracture—A personal historical review. In Fatigue and Fracture Mechanics: 37th Volume; ASTM International: West Conshohocken, PA, USA, 2011; pp. 3–73. [Google Scholar] [CrossRef]
  34. Jones, R.; Michopoulos, J.G.; Iliopoulos, A.P.; Raman, R.S.; Phan, N.; Nguyen, T. Representing crack growth in additively manufactured Ti-6Al-4V. Int. J. Fatigue 2018, 116, 610–622. [Google Scholar] [CrossRef]
  35. Jones, R.; Sing Raman, R.K.; Iliopoulos, A.P.; Michopoulos, J.; Phan, N.; Peng, D. Additively manufactured Ti-6Al-4V replacement parts for military aircraft. Int. J. Fatigue 2019, 124, 227–235. [Google Scholar] [CrossRef]
  36. Iliopoulos, A.P.; Jones, R.; Michopoulos, J.; Phan, N.; Singh Raman, R.K. Crack growth in a range of additively manufactured aerospace structural materials. Aerospace 2018, 5, 118. [Google Scholar] [CrossRef] [Green Version]
  37. Iliopoulos, A.P.; Jones, R.; Michopoulos, J.G.; Phan, N.; Rans, C. Further Studies into Crack Growth in Additively Manufactured Materials. Materials 2020, 13, 2223. [Google Scholar] [CrossRef]
  38. Jones, R.; Molaei, R.; Fatemi, A.; Peng, D.; Phan, N. A note on computing the growth of small cracks in AM Ti-6Al-4V. In Proceedings of the 1st Virtual European Conference on Fracture (VECF1), 29 June 2020; Available online: https://www.youtube.com/watch?v=W8rTAREK7ak&feature=youtu.be (accessed on 31 May 2020).
  39. Kundu, S.; Jones, R.; Peng, D.; Matthews, N.; Alankar, A.; Singh Raman, R.K.; Huang, P. Review of requirements for the durability and damage tolerance certification of additively manufactured aircraft structural parts and AM repairs. Materials 2020, 13, 1341. [Google Scholar] [CrossRef] [Green Version]
  40. Under Secretary, Acquisition and Sustainment, Directive-Type Memorandum (DTM)-19-006-Interim Policy and Guidance for the Use of Additive Manufacturing (AM) in Support of Materiel Sustainment, Pentagon, Washington, DC. 21 March 2019. Available online: https://www.esd.whs.mil/Portals/54/Documents/DD/issuances/dtm/DTM-19-006.pdf?ver=2019-03-21-075332-443 (accessed on 2 February 2020).
  41. Zhuang, W.; Liu, Q.; Hu, W. The effect of specimen thickness on fatigue crack growth rate and threshold behaviour in aluminium alloy 7075-T7351. In Proceedings of the 6th Australasian Congress on Applied Mechanics (ACAM 6), Perth, Australia, 12–15 December 2010. [Google Scholar]
  42. Jones, R.; Lo, M.; Peng, D.; Bowler, A.; Dorman, M.; Janardhana, M.; Iyyer, N.S. A study into the interaction of intergranular cracking and cracking at a fastener hole. Meccanica 2015, 50, 517–532. [Google Scholar] [CrossRef]
  43. Molent, L.; Jones, R. The influence of cyclic stress intensity threshold on fatigue life scatter. Int. J. Fatigue 2016, 82, 748–756. [Google Scholar] [CrossRef]
  44. Liao, M.; Renaud, G.; Bombardier, Y. Short/Small Crack Model Development for Aircraft Structural Life Assessment. In Proceedings of the 13th International Conference on Fracture, Beijing, China, 16–21 June 2013. [Google Scholar]
  45. Krake, L. Helicopter Airframe Fatigue Spectra Generation. Adv. Mater. Res. 2014, 891–892, 720–725. [Google Scholar] [CrossRef]
  46. Peng, D.; Huang, P.; Jones, R. Practical computational fracture mechanics for aircraft structural integrity. In Aircraft Sustainment and Repair; Jones, R., Baker, A., Matthews, N., Champagne, V., Eds.; Elsevier: Oxford, UK, 2017; ISBN 9780081005408. [Google Scholar]
  47. Virkler, D.A.; Hillberry, B.M.; Goel, P.K. The statistical nature of fatigue crack propagation. Trans. ASME 1979, 101, 148–153. [Google Scholar] [CrossRef]
  48. Huynh, J.; Molent, L.; Barter, S. Experimentally derived crack growth models for different stress concentration factors. Int. J. Fatigue 2008, 30, 1766–1786. [Google Scholar] [CrossRef]
  49. Wanhill, R.H.; Barter, S.; Molent, L. Fatigue Crack Growth Failure and Lifing Analyses for Metallic Aircraft Structures and Components; Springer: Dordrecht, The Netherlands, 2019; ISBN 978-94-024-1673-2. [Google Scholar]
  50. Molent, L.; Dixon, B. Airframe metal fatigue revisited. Int. J. Fatigue 2020, 131. [Google Scholar] [CrossRef]
  51. Barter, S.A.; Molent, L.; Wanhill, R.H. Typical fatigue-initiating discontinuities in metallic aircraft structures. Int. J. Fatigue 2012, 41, 1–198. [Google Scholar] [CrossRef]
  52. Manning, S.D.; Yang, Y.N. USAF Durability Design Handbook: Guidelines for the Analysis and Design of Durable Aircraft Structures, AFWAL-TR-83-3027, Flight Dynamics Directorate, Wright Laboratory, Air Force Systems Command, Wright-Patterson Air Force Base. January 1984. Available online: https://apps.dtic.mil/dtic/tr/fulltext/u2/a206286.pdf (accessed on 16 May 2020).
  53. Hover, P.W.; Berens, A.P.; Loomis, J. Update of the Probability of Fracture (PROF) Computer Program for Aging Aircraft Risk Analysis, AFRL-VA-WP-TR-1999-3030, Flight Dynamics Directorate, Wright Laboratory, Air Force Systems Command, Wright-Patterson Air Force Base. November 1998. Available online: https://apps.dtic.mil/dtic/tr/fulltext/u2/a363010.pdf (accessed on 16 May 2020).
  54. Molent, L.; Barter, S.A.; Wanhill, R.J.H. The lead crack fatigue lifing framework. Int. J. Fatigue 2011, 33, 323–331. [Google Scholar] [CrossRef]
  55. Berens, A.P.; Hovey, P.W.; Skinn, D.A. Risk Analysis for Aging Aircraft Fleets—Volume 1: Analysis, WL-TR-91-3066, Flight Dynamics Directorate, Wright Laboratory, Air Force Systems Command, Wright-Patterson Air Force Base. October 1991. Available online: https://apps.dtic.mil/dtic/tr/fulltext/u2/a252000.pdf (accessed on 16 May 2020).
  56. Molent, L.; Barter, S.A. A comparison of crack growth behaviour in several full-scale airframe fatigue tests. Int. J. Fatigue 2007, 9, 1090–1099. [Google Scholar] [CrossRef]
Figure 1. Schematic diagram of the MT specimen used.
Metals 10 00944 g001
Figure 2. Plot showing the cycle-by-cycle analysis of MT specimens under FALSTAFF load spectrum.
Metals 10 00944 g002
Figure 3. The crack growth history plotted using log-linear axes.
Metals 10 00944 g003
Figure 4. Comparison with the small/short crack growth curve given in [44].
Metals 10 00944 g004
Figure 5. Geometry of the 8.4 mm thick test specimen. (units are in mm).
Metals 10 00944 g005
Figure 6. The measured and computed crack depth histories for the helicopter flight load spectrum IRF-E14.
Metals 10 00944 g006
Figure 7. The measured and computed crack depth histories for the helicopter flight load spectrum IRF-E15.
Metals 10 00944 g007
Figure 8. The measured and computed crack depth histories for the helicopter flight load spectrum IRF-E16.
Metals 10 00944 g008
Figure 9. The measured and computed crack depth histories for the helicopter flight load spectrum CLS0900SS00.
Metals 10 00944 g009
Figure 10. The measured and computed crack depth histories for the helicopter flight load spectrum CLS0900SS05.
Metals 10 00944 g010
Figure 11. The measured and computed crack depth histories for the helicopter flight load spectrum CLS0900SS15.
Metals 10 00944 g011
Figure 12. The measured and computed crack depth histories for the helicopter flight load spectrum CLS0900SS20.
Metals 10 00944 g012
Figure 13. The variability in the crack length histories reported in [46].
Metals 10 00944 g013
Figure 14. The effect of different toughness on the measured and computed curves for the helicopter flight load spectra IRF-E15.
Metals 10 00944 g014
Figure 15. The effect of different toughness on the measured and computed curves for the helicopter flight load spectra CSL090SS15.
Metals 10 00944 g015
Table 1. Values of A and ∆Kthr used in Figure 2 when computing the crack growth curves for the various tests.
TestA (MPa √m)Kthr (MPa √m)
G1111.3
K1111.79
L1111.1
N1111.1
U1111.48
V1111.6
X1111.45
Y1111.6
G1111.3
Table 2. The number of turning points in each spectrum.
IRF-E15IRF-E15IRF-E16CSL090SS00CSL090SS05CSL090SS15CSL090SS20
82,839248,255649,66664,95864,95864,95864,958
Table 3. The values of A and ∆Kthr and A used in Figure 14.
Measured/ComputedIRF-E15
Load Blocks to Failure
CSL090SS15
Load Blocks to Failure
Smallest test life38.332.0
Longest test life66.172.7
Mean life46.854.5
Standard deviation (σ)10.413.6
Mean-3σ15.613.8
Computed ΔKthr = 0.3 MPa √m, A = 40 MPa √m8.912.7
Computed ΔKthr = 0.3 MPa √m, A = 111 MPa √m9.713.2