Abstract
Nano-crystalline metals have attracted considerable attention over the past two decades due to their increased mechanical properties as compared to their microcrystalline counterparts. However, the behaviour of nano-crystalline metals is influenced by imperfections introduced during synthesis or heat treatment. These imperfections include pores, which are mostly located in the area of grain boundaries. To study the behaviour of multiphase nano-crystalline materials, a novel fully parametric algorithm was developed. The data required for implementing the developed numerical model were the volume fraction of the alloying elements and their basic properties as well as the density and the size of randomly distributed pores. To validate the developed algorithm, the alloy composition 75 wt% tungsten and 25 wt% copper was examined experimentally under compression tests. For the investigation, two batches of specimens were used; a batch having a coarse-grained microstructure with an average grain diameter of 150 nm and a nanocrystalline batch having a grain diameter of 100 nm, respectively. The porosity of both batches was derived to range between 9% and 10% based on X-ray diffraction analyses. The results of quasi-static compression testing revealed that the nanocrystalline W-Cu material exhibited brittle behaviour which was characterised by an elastic deformation that led to fracture without remarkable plasticity. A compressive strength of about 1100 MPa was derived which was more than double compared to conventional W-Cu samples. Finite element simulations of the behaviour of porous nano-crystalline materials were performed and compared with the respective experimental compression tests. The numerical model and experimental observations were in good agreement.
1. Introduction
Owing to the desirable properties of materials with nanocrystalline (nc) microstructure (grain size d < 100 nm), notable attempts have been invested in recent years to their production and characterisation, e.g., [1,2,3]. Various manufacturing methods have been applied to obtain alloys with ultrafine-grain (UFG, 100 nm < d < 500 nm) or nanocrystalline grain (grain size less than 100 nm) including electrodeposition [2,4], powder metallurgy [3,5], inert gas condensation followed by consolidation of powders [2] and severe plastic deformation (SPD) [6,7]. SPD is a “one-step” manufacturing technique that begins with a bulk workpiece with coarse-grained microstructure and refines its grain size down into the ultrafine or nanocrystalline regime with increased plastic straining. The SPD method is a cost-effective technology with the absence of contaminations for the production of bulk ultrafine grain metals and alloys. With respect to limitations in the manufacturing methods of nano-crystalline materials, their mass production remains up to now difficult and has not been industrialised. For the same reasons, the production of fully dense, bulk forms with ultrafine or nanocrystalline microstructure are hardly achievable.
One of the materials of the nanocrystalline materials class that has attracted considerable attention especially for space applications is tungsten. It is mainly due to its ability to resist the severe irradiation at space environment. Investigations on the influence of grain size reduction on the irradiation resistance and its mechanical behaviour showed promising results [8]. Irradiation damage was found to be decreased with the reduction of grain size [9]. In Reference [8], the authors have noticed the significant irradiation resistance of 35 nm grain size tungsten. Nevertheless, the mechanical properties of this material have not been yet sufficiently investigated. There is a small number of publications in the literature dealing with the properties of conventional coarse-grained tungsten subjected to quasi-static loading [10,11]. It was found that conventional coarse-grained tungsten (cW) exhibits a poor ductility and a high ductile-to-brittle transition temperature [12,13]. It results in cracking effects at many locations in the material prior to the accumulation of the plastic dissipation needed to trigger plastic instabilities. More specifically, the compressive and tensile failure of cW specimens occurring at room temperature without any noticeable ductility at a stress level just exhibiting the flow stress indicates a failure mechanism typical for most brittle ceramics (intergranular fracture). In Reference [14], the authors have observed enhanced ductility in ultrafine (100–500 nm) and nanocrystalline tungsten (100 nm) in compression tests. In this publication, we focus on the investigation of mechanical behaviour of the tungsten-copper material since it is one of the most promising alloys for the aforementioned aerospace applications [15,16]. Porosity in the form of voids, resulting from the limitations of material production techniques, is a typical feature for nanomaterials. Nanovoids may be intensively formed at regions of local stress related to plastic deformation [17]. It is needless to say that the presence of voids has a profound effect on the mechanical properties and can for example severely reduce both ultimate tensile strength and ductility.
The vast majority of the published research papers deal with the simulation of the mechanical behaviour of nano-crystalline materials by implementing atomistic approaches. Atomistic simulation approaches are contributing notably for understanding the microstructural characteristics of nanocrystalline materials. Nevertheless, their use for predicting the corresponding material properties is not straight forward because of fundamental limitations of the approaches. The exploitation of the finite element methodology provides a useful tool for the design-by-analysis of the fundamental nanostructured material morphologic characteristics so as to acquire the desired mechanical response of nanocrystalline materials.
The aim of the paper is to study the influence of the porosity on the mechanical properties of nano-crystalline materials through the development of an innovative finite element model which accounts for the different material phases as well as the presence of voids into the same representative volume element (RVE). The proposed modelling effort relies on the methodology developed in Reference [18]. For assessing the reliability of the developed numerical model, compression tests were carried out for the tungsten-copper material. The results of the experiments were in good agreement with the outcomes of the numerical simulations.
2. Methodology
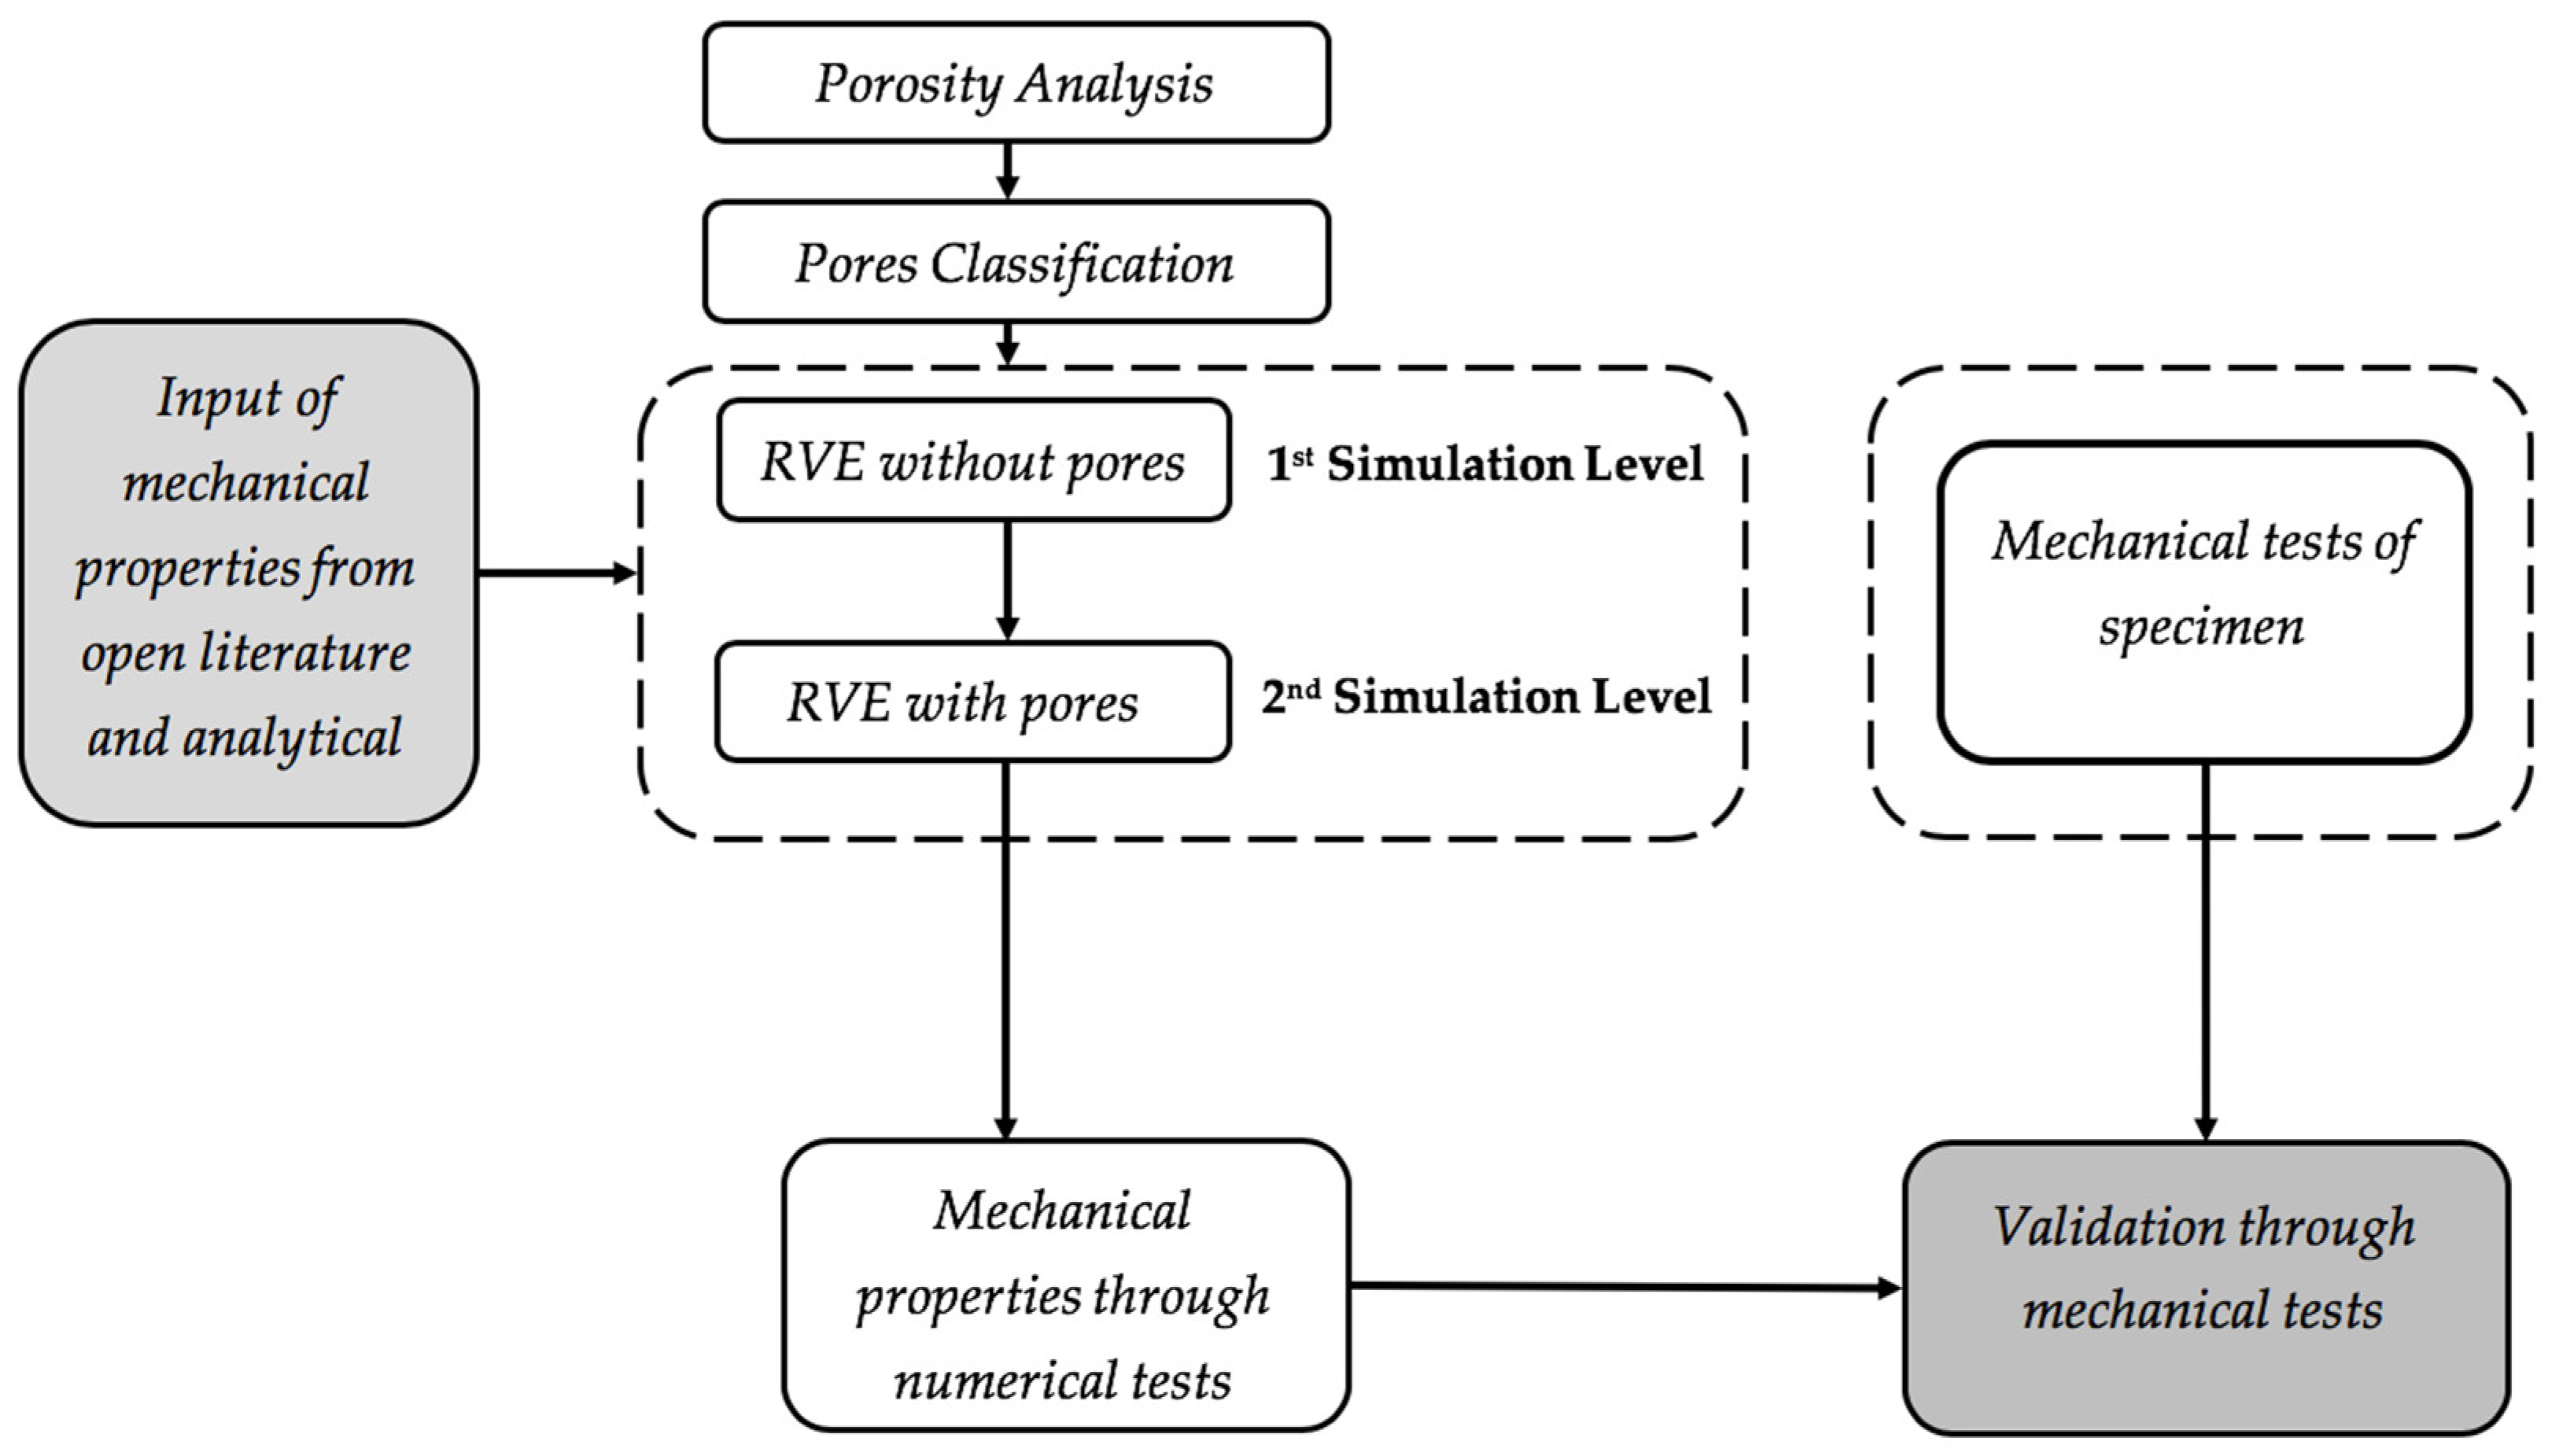
The methodology is displayed in the flowchart shown in Figure 1. The first step of the study has been the characterisation of the samples by involving X-ray diffraction (XRD) imaging procedures. The obtained characterisation of the microstructure and classification of pores were used for the multi-level numerical simulation which accounts for pores characteristics, such as their volume fraction and size. In parallel, compression tests for the validation of the developed numerical model were performed. In the forthcoming sections, the stages of the methodology are described.
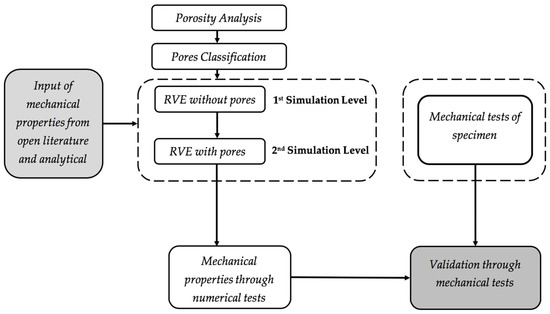
Figure 1.
Flowchart of the methodology.
3. Experimental Procedure
3.1. Materials
To begin with, for the present investigation, the W-Cu alloy system was selected. The alloy consisted of 75% tungsten and 25% copper in weight. For this material, two different types of W-Cu alloy were produced. Both types were manufactured using the same powders originating from the same powder batch. The high energy ball milling method (HEBM) was utilised in order to mill tungsten and copper powders achieving a nanocrystalline morphology. The nanocrystalline W-Cu powders used for the production of the alloy will be referred to in the following as W-Cu. The process was performed by the company MBN Nanomaterialia. For the fabrication of the alloy that in the following will be referred to as cW-Cu, no grain refinement process has been involved for the powders which have been simply mixed. For the production of the tungsten-copper specimens, the well-known manufacturing approach consisting of cold pressing, hot isostatic pressing (HIP) and heat treatment was implemented. These specimens were used for XRD measurements. All of them were manufactured as cylindrical. Table 1 shows the geometrical data of the specimens. The W-Cu and cW-Cu specimens were manufactured at the University of Miskolc. As the manufacturing processes were involved, this type of material is still far from being industrialised with respect to deviations in dimensions, mass and relative density. The observed deviations are summarised in Table 1.

Table 1.
The geometrical data of the manufactured W-Cu and cW-Cu specimens.
XRD tests were carried out to identify the microstructure of the material which is changing with each step of the material’s production process. Table 2 summarises the obtained results for the coarse-grained cW-Cu specimens. Step 1 of Table 2 shows the composition of the as-milled powders, which is considered as the reference composition. The material consists of 74% W and 26% Cu, in weight, with average grain sizes of 1300 nm and 279 nm, respectively. The cold pressing step caused an appreciable reduction of the grain sizes for both materials. Yet, the deviations observed on the grain size for both materials were appreciable (step 2). The following hot isostatic pressing (HIP) stage resulted in a further significant reduction of the grain sizes of both materials and an appreciable reduction of the deviations observed for the grain sizes as well. The said deviation remained higher for Cu (step 3). The final annealing of the specimen resulted, as expected, in a coarsening of the grains which was accompanied by an increase of the grain size deviation for both materials (step 4). It was noticeable that the HIP step, as well as the annealing process, was associated with the creation of some impurities in the form of tungsten oxides. The tungsten percentage measured to be participating in the creation of said oxides has been 0.2% and 0.8% in weight, respectively.

Table 2.
X-ray diffraction (XRD) results of the cW-Cu: cold-pressed sample, hot isostatic pressed specimens, average aged (36 h).
The XRD results obtained for the milled W-Cu specimens are summarised in Table 3. The reference composition was measured to be 73.67% W and 26.33% Cu, both in weight. The initial powders composition consisted of fine Cu powders of 6 nm on average, showing a small deviation of the powder size, and a bigger average size of 30 nm for the W powders expressing a powder size deviation of 15 nm (step 1). The cold pressing stage seems to be sufficient just for creating agglomerates of powders having an average size of 16 nm and 8 nm for W and Cu, respectively and small deviations in the sizes of the agglomerations (step 2). The following hot isostatic pressing step resulted in nanograins being rather uniform for Cu and deviating appreciably in terms of dimensions for W (step 3). The final step of heat treatment exhibited the same trend of grain coarsening which was also observed for the coarse-grained materials (step 4).

Table 3.
XRD results of the W-Cu: milled powder, cold pressed and hot isostatic pressed specimens, average aged (36 h).
It should be noticed that the large scattering in terms of grain size observed for both cW-Cu and W-Cu specimens was due to the involved fabrication method. The hot isostatic pressing led to gradual grain growth. The mentioned growth was due to the large specific interface area of the NC alloys. Since interface energy is typically positive, Gibbs free energy reduces with grain growth. The most stable thermodynamic state coincides with the one that can be ideally obtained at the end of the grain coarsening process.
3.2. Compression Testing of the cW-Cu and W-Cu Samples
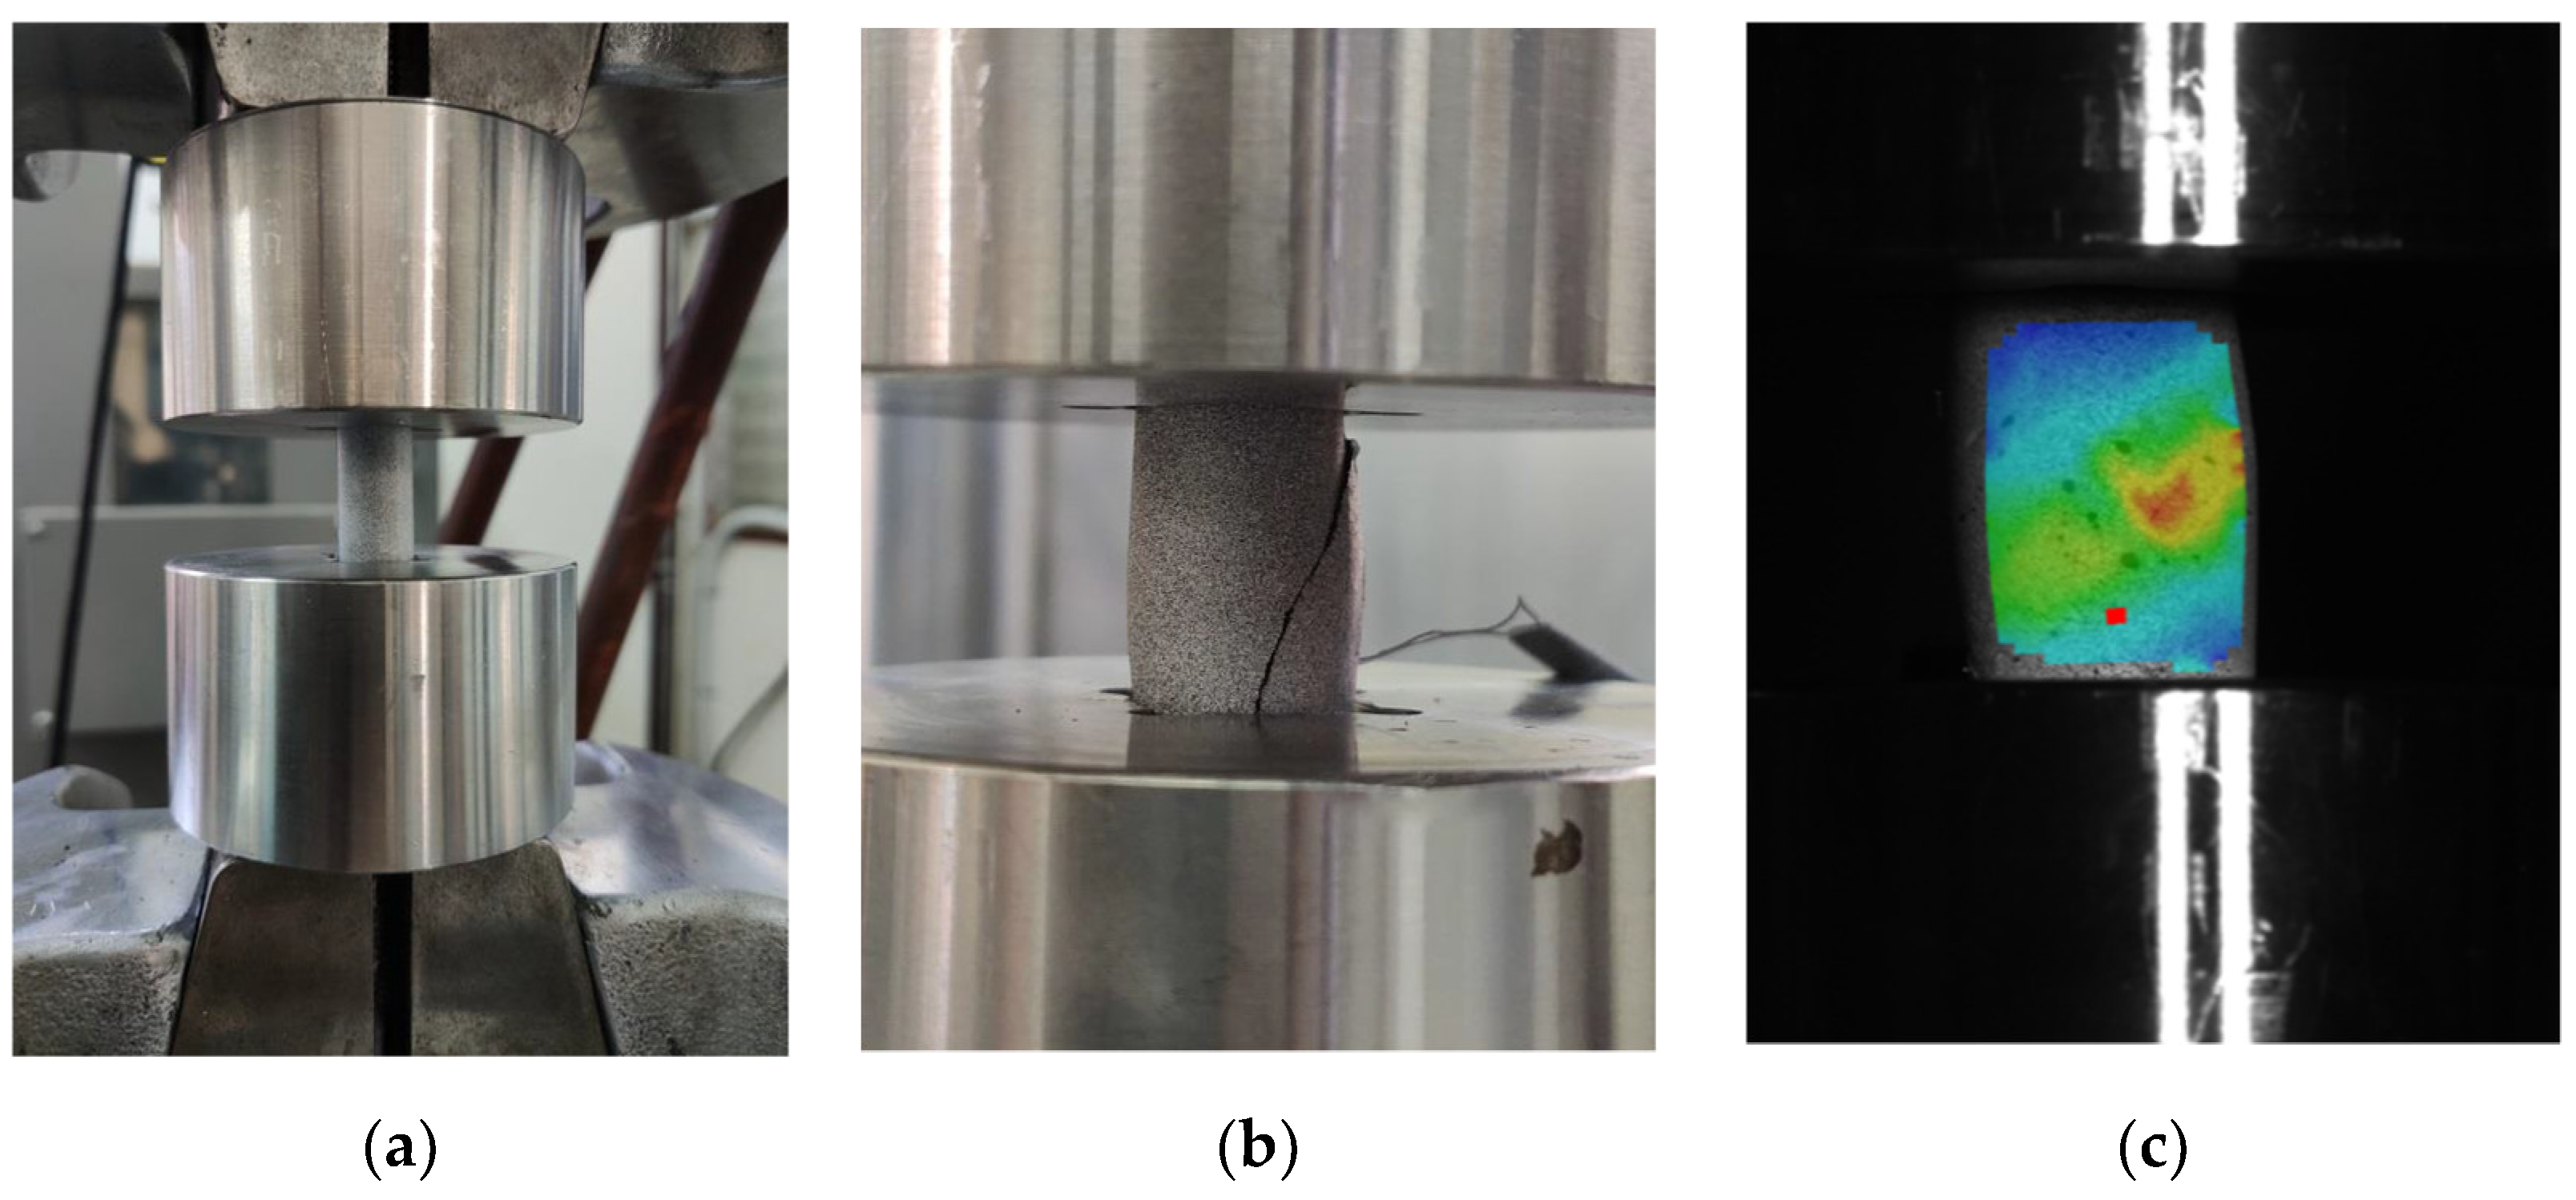
Compression tests were conducted according to ASTM E9 standards. The tests were performed at room temperature under a constant strain rate of 0.005 in./in.*min (m/m*min) using the MTS universal testing machine having a load capacity of 250 kN. The L/D ratio of the specimens was equal to 2. The specimens were subjected to compression force up to fracture. The specimens were carefully aligned in a fixture to ensure concentric loading. Strain gauges were cemented at the middle of specimens’ length using cold-curing adhesive in order to measure the micro-strains. The strain gauges used for the compression tests were unidirectional with grid resistance of 120 Ω and gauge factor of 2.125% ± 0.5%. After curing the adhesive, it is important to ensure that the strain gauge has been installed correctly. Although visual examination should be sufficient, it is recommended to use an ohmmeter to double-check the resistance of the strain gauge. In addition to the use of strain gauges, the critical local strain was measured also using a GOM ARAMIS digital image correlation optical device (DIC) (ARAMIS, GOM GmbH, Brunswick, Germany). The compression force and displacement of the test machine were recorded continuously during the test. The apparatus used for the tests may be seen in Figure 2.
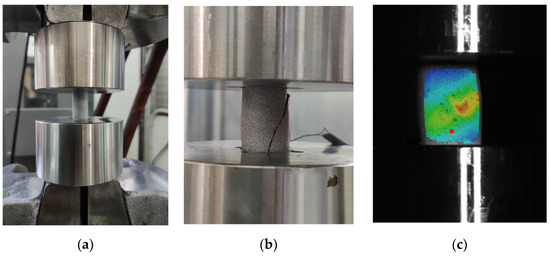
Figure 2.
Specimen in the testing machine. (a) before experiment; (b) after experiment; (c) digital image correlation.
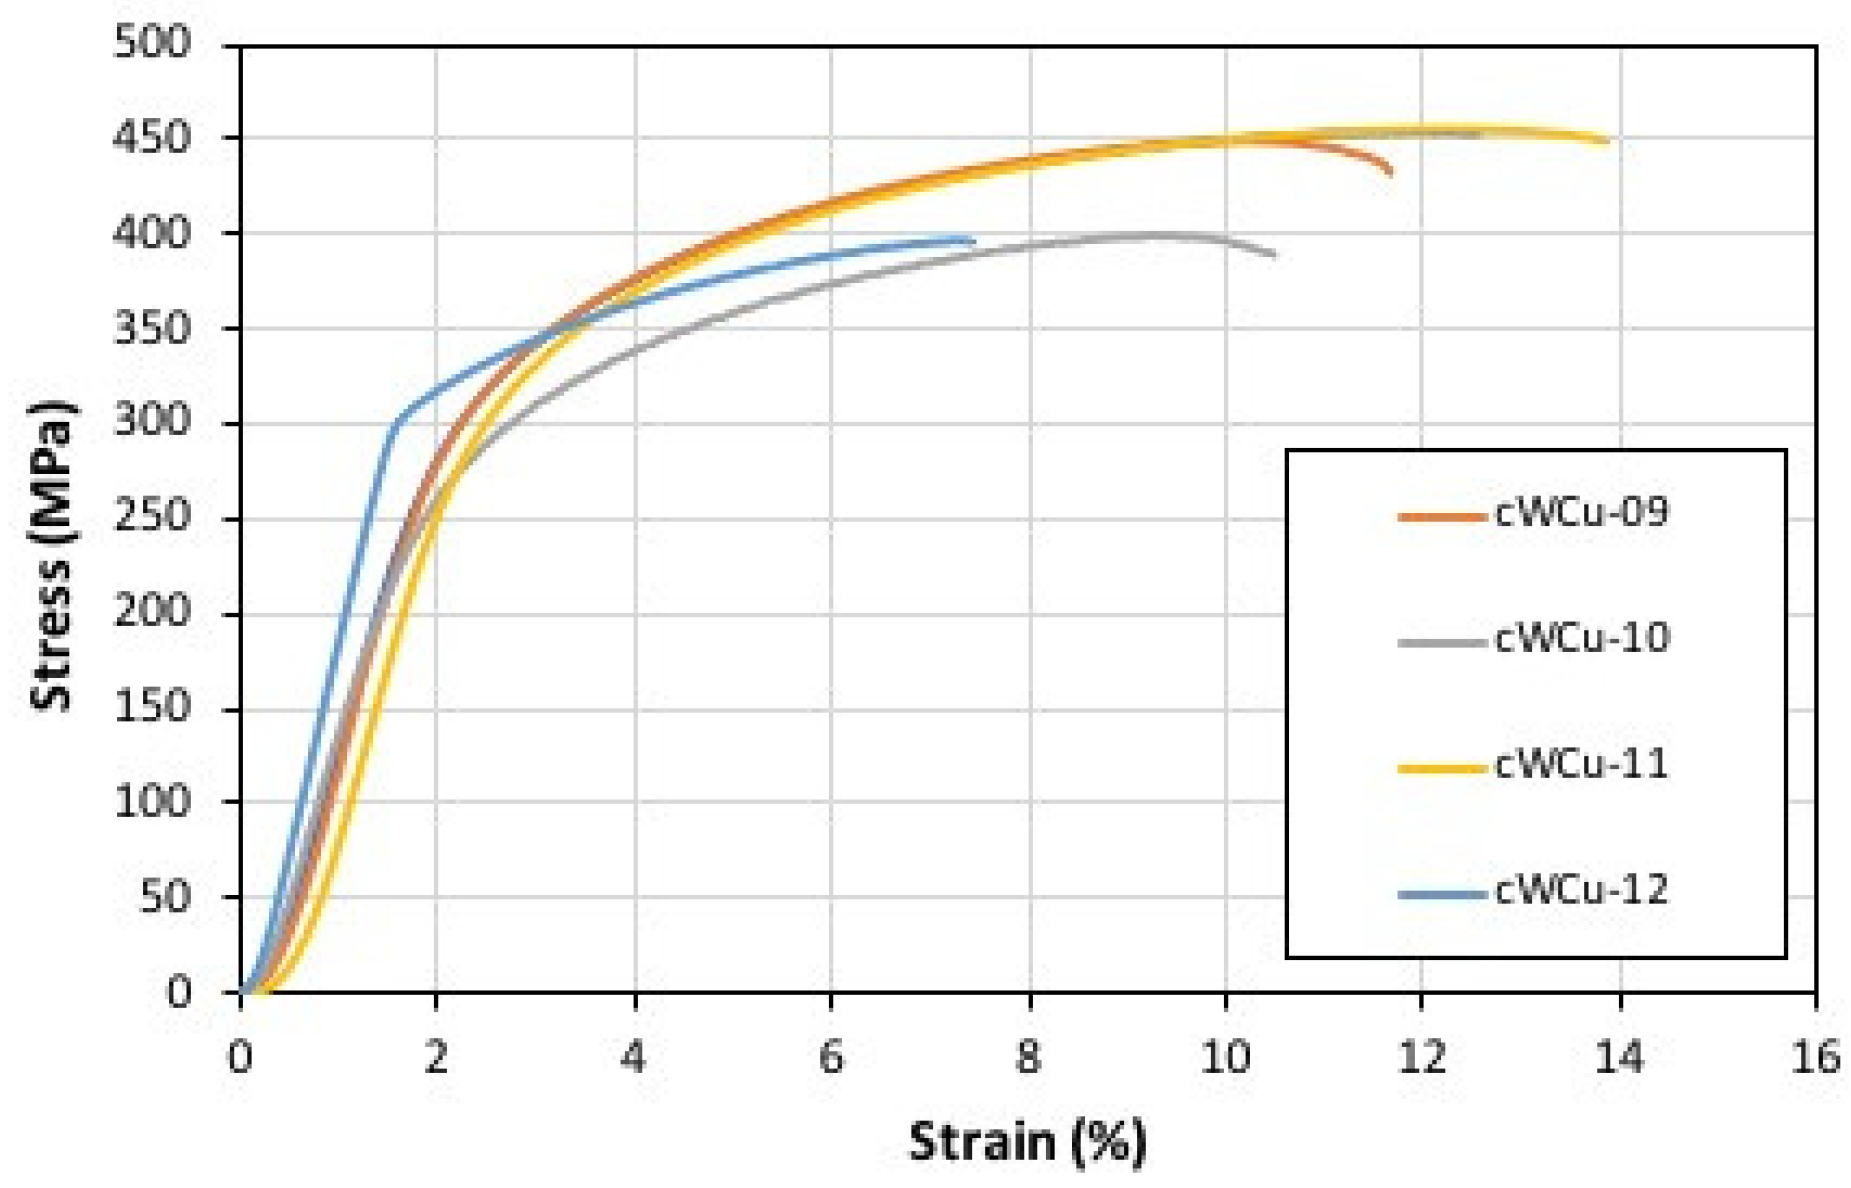
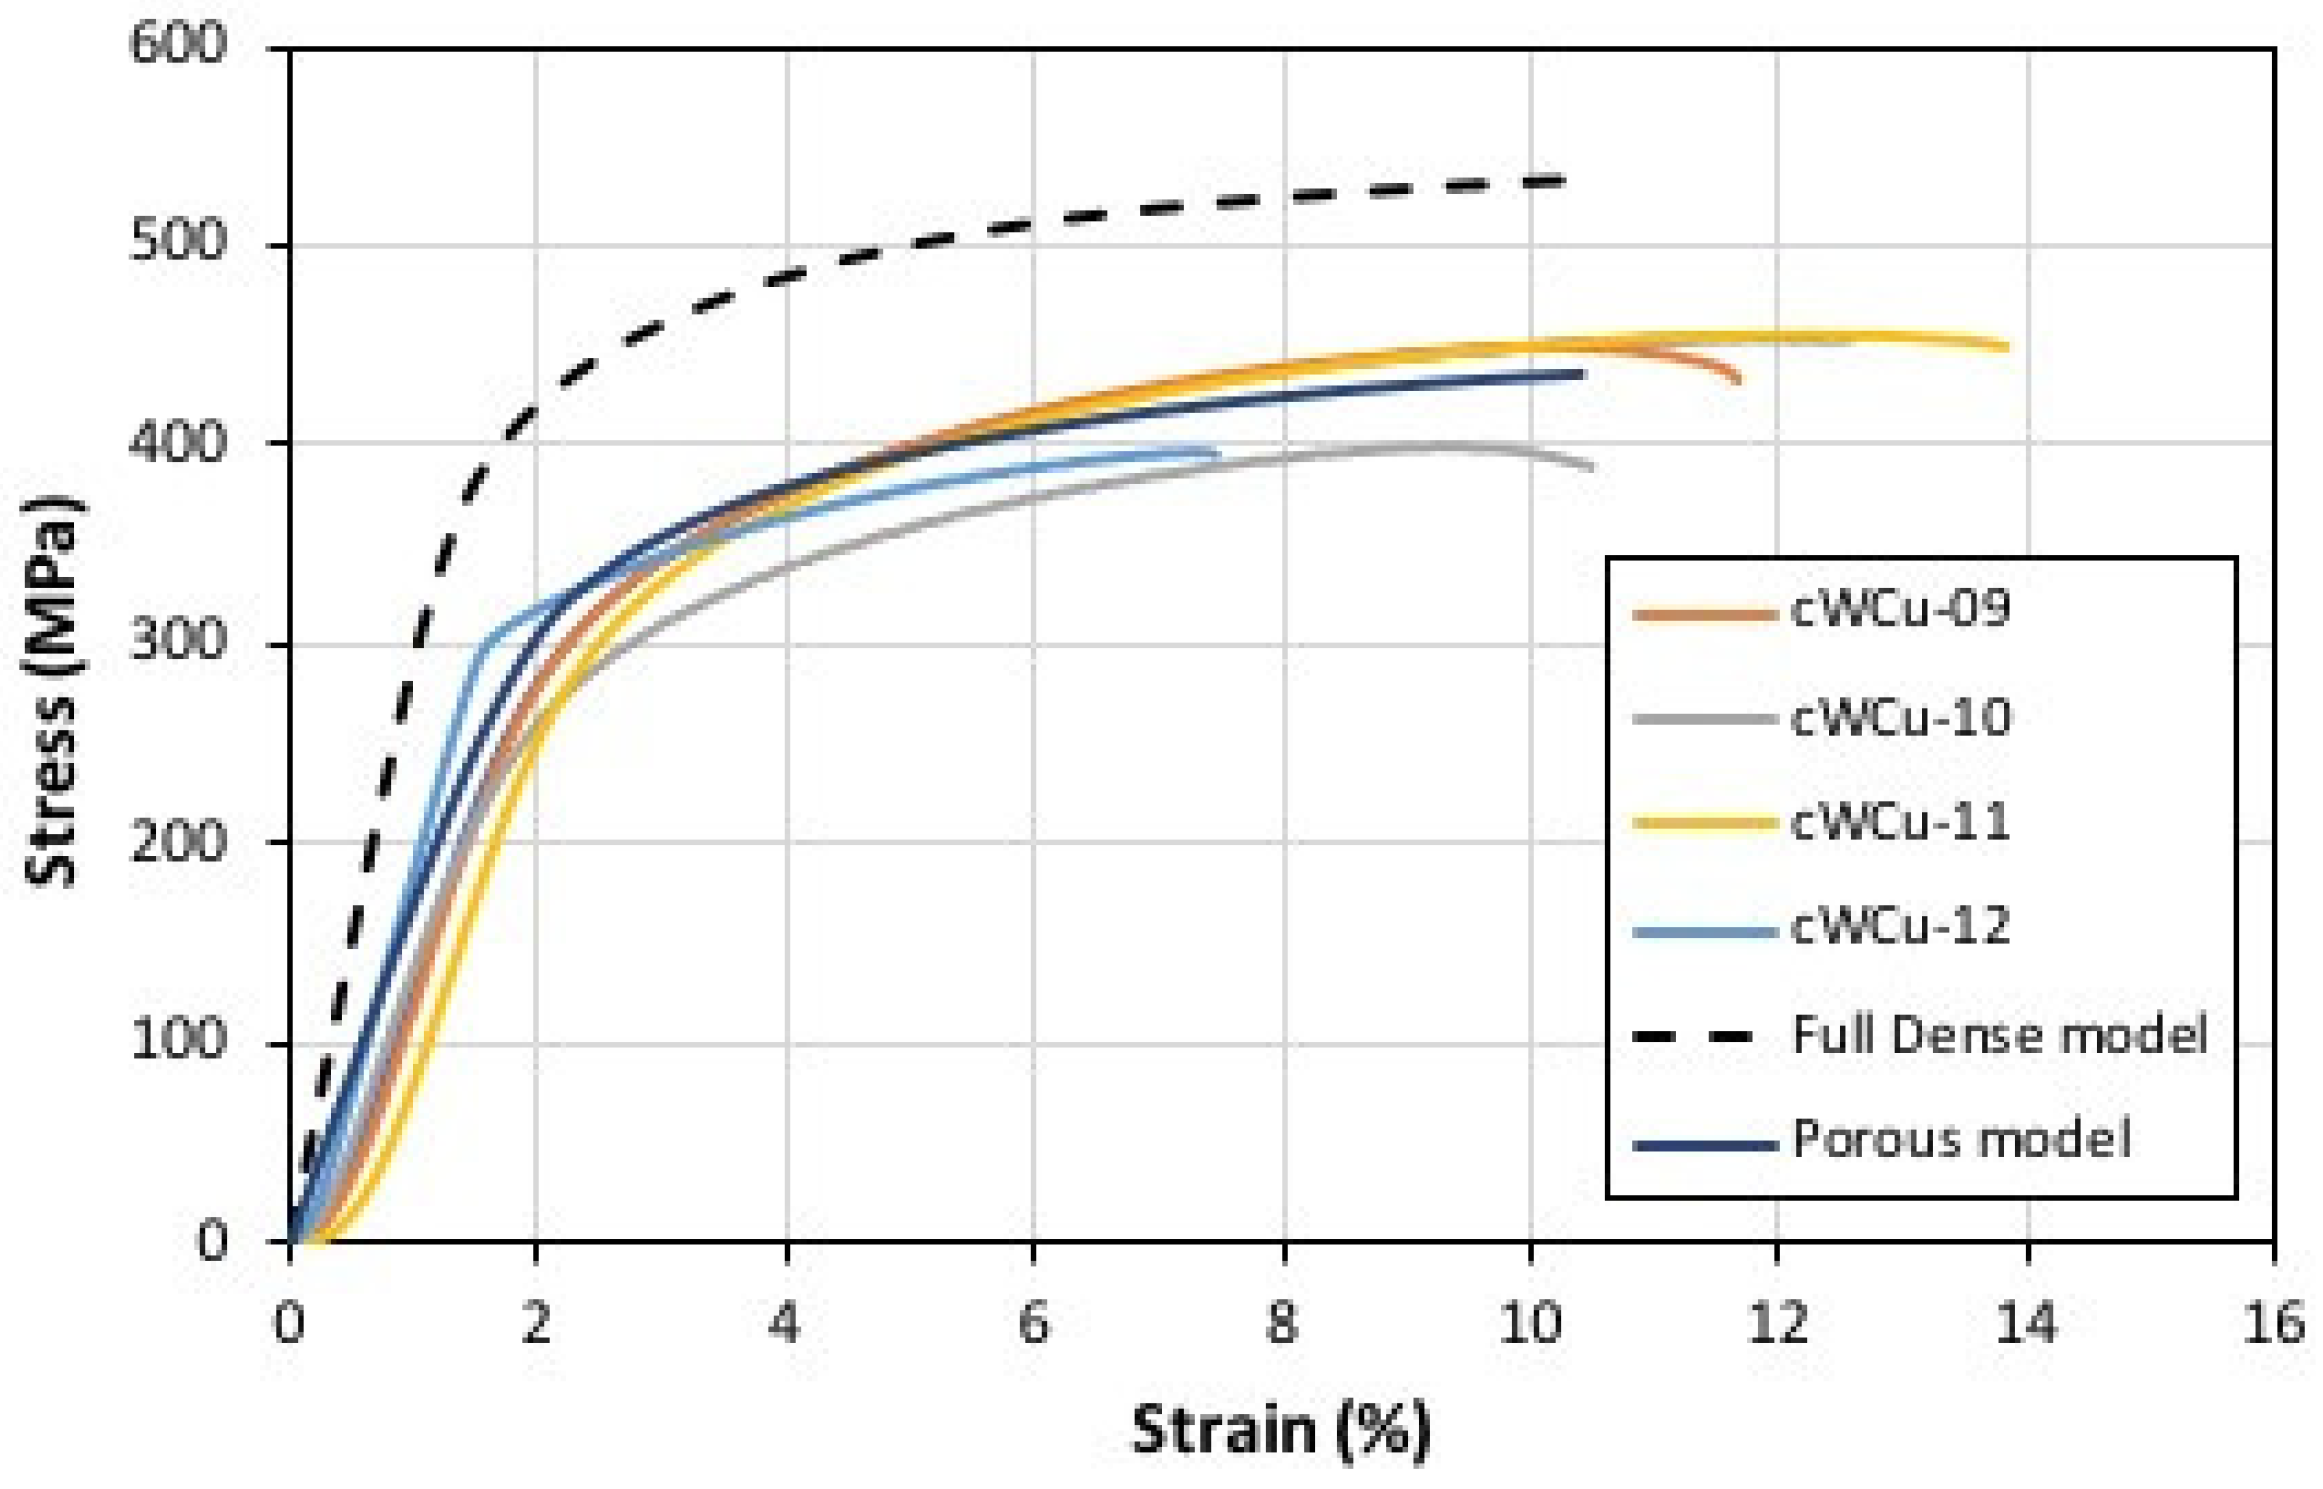
The stress-strain curves obtained for the coarse-grained and the nanocrystalline grain W-Cu type of alloy are presented in Figure 3 and Figure 4, respectively. As shown in Figure 3, the coarse-grained tungsten exhibits a yield stress ranging between 400 and 450 MPa under quasi-static compression conditions at room temperature. The outcomes acquired in this work for the coarse-grained tungsten samples are consistent with results from the literature [19]. In this work, coarse-grained tungsten specimens were found to collapse under tension at a stress level of 450 MPa showing an intergranular fracture and the critical local strain value was found to be equal to 12–14%.
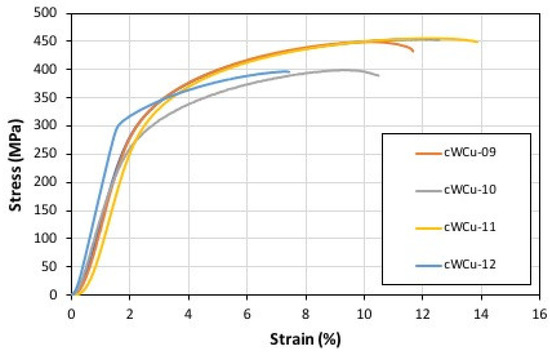
Figure 3.
The experimental results of cW-Cu specimens in accordance with ASTM E9.
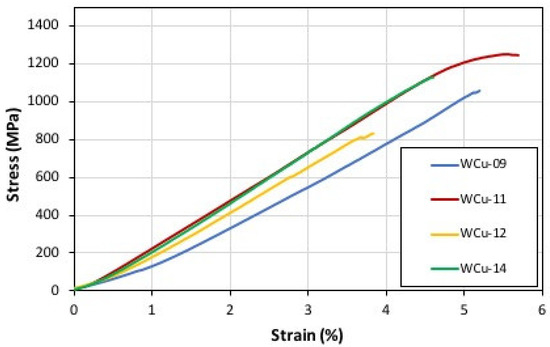
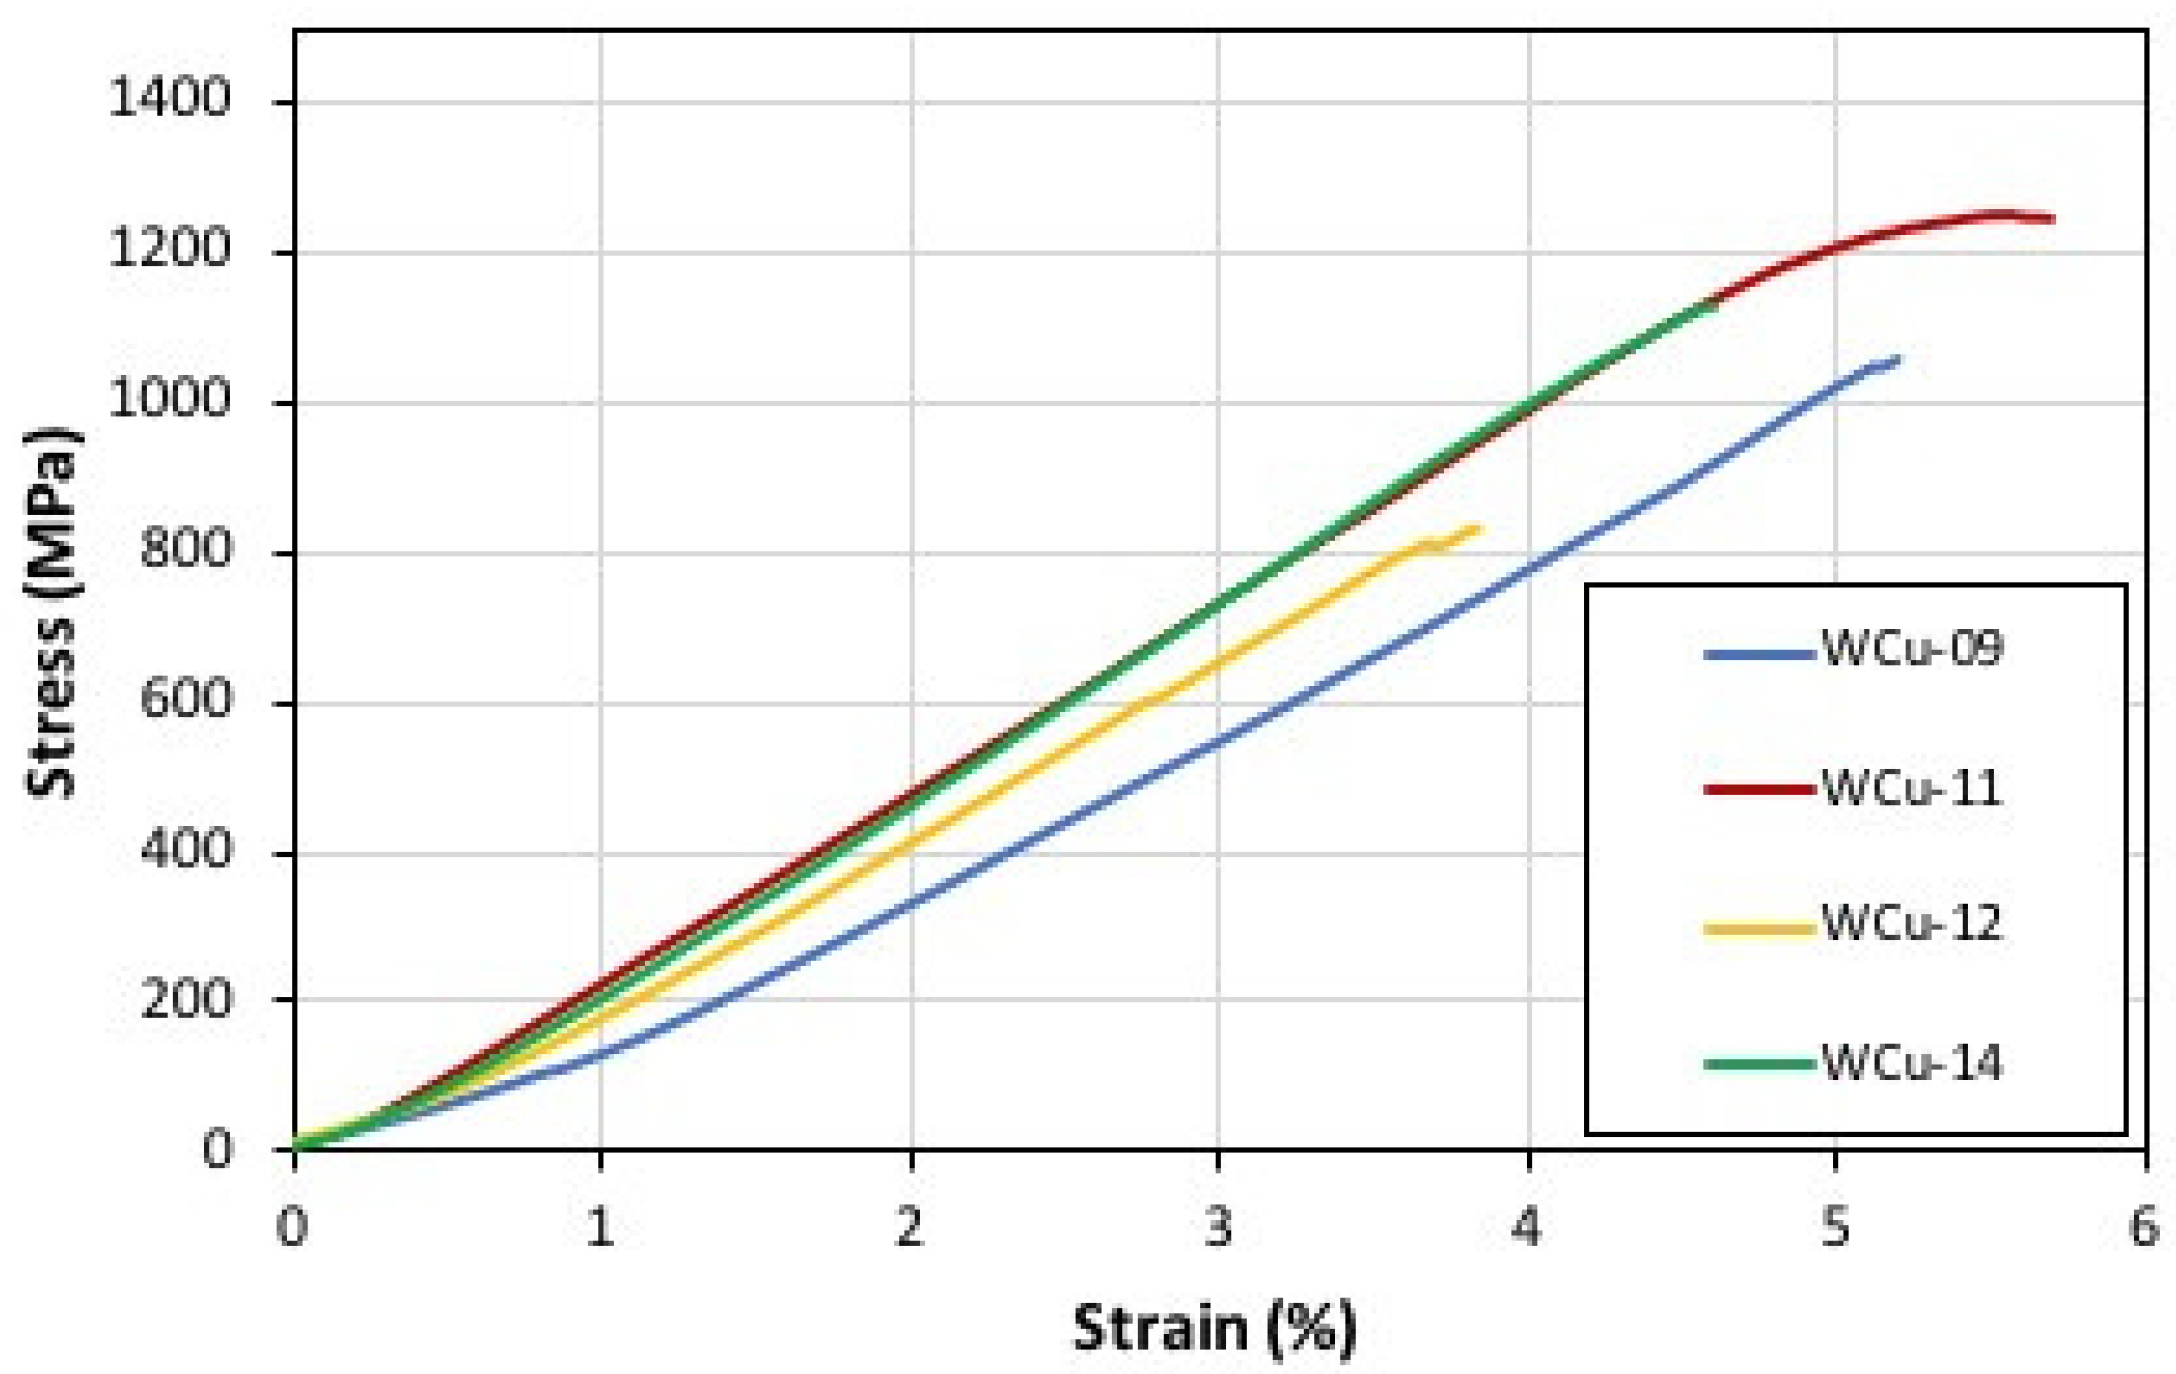
Figure 4.
The experimental results of W-Cu specimens in accordance with ASTM E9.
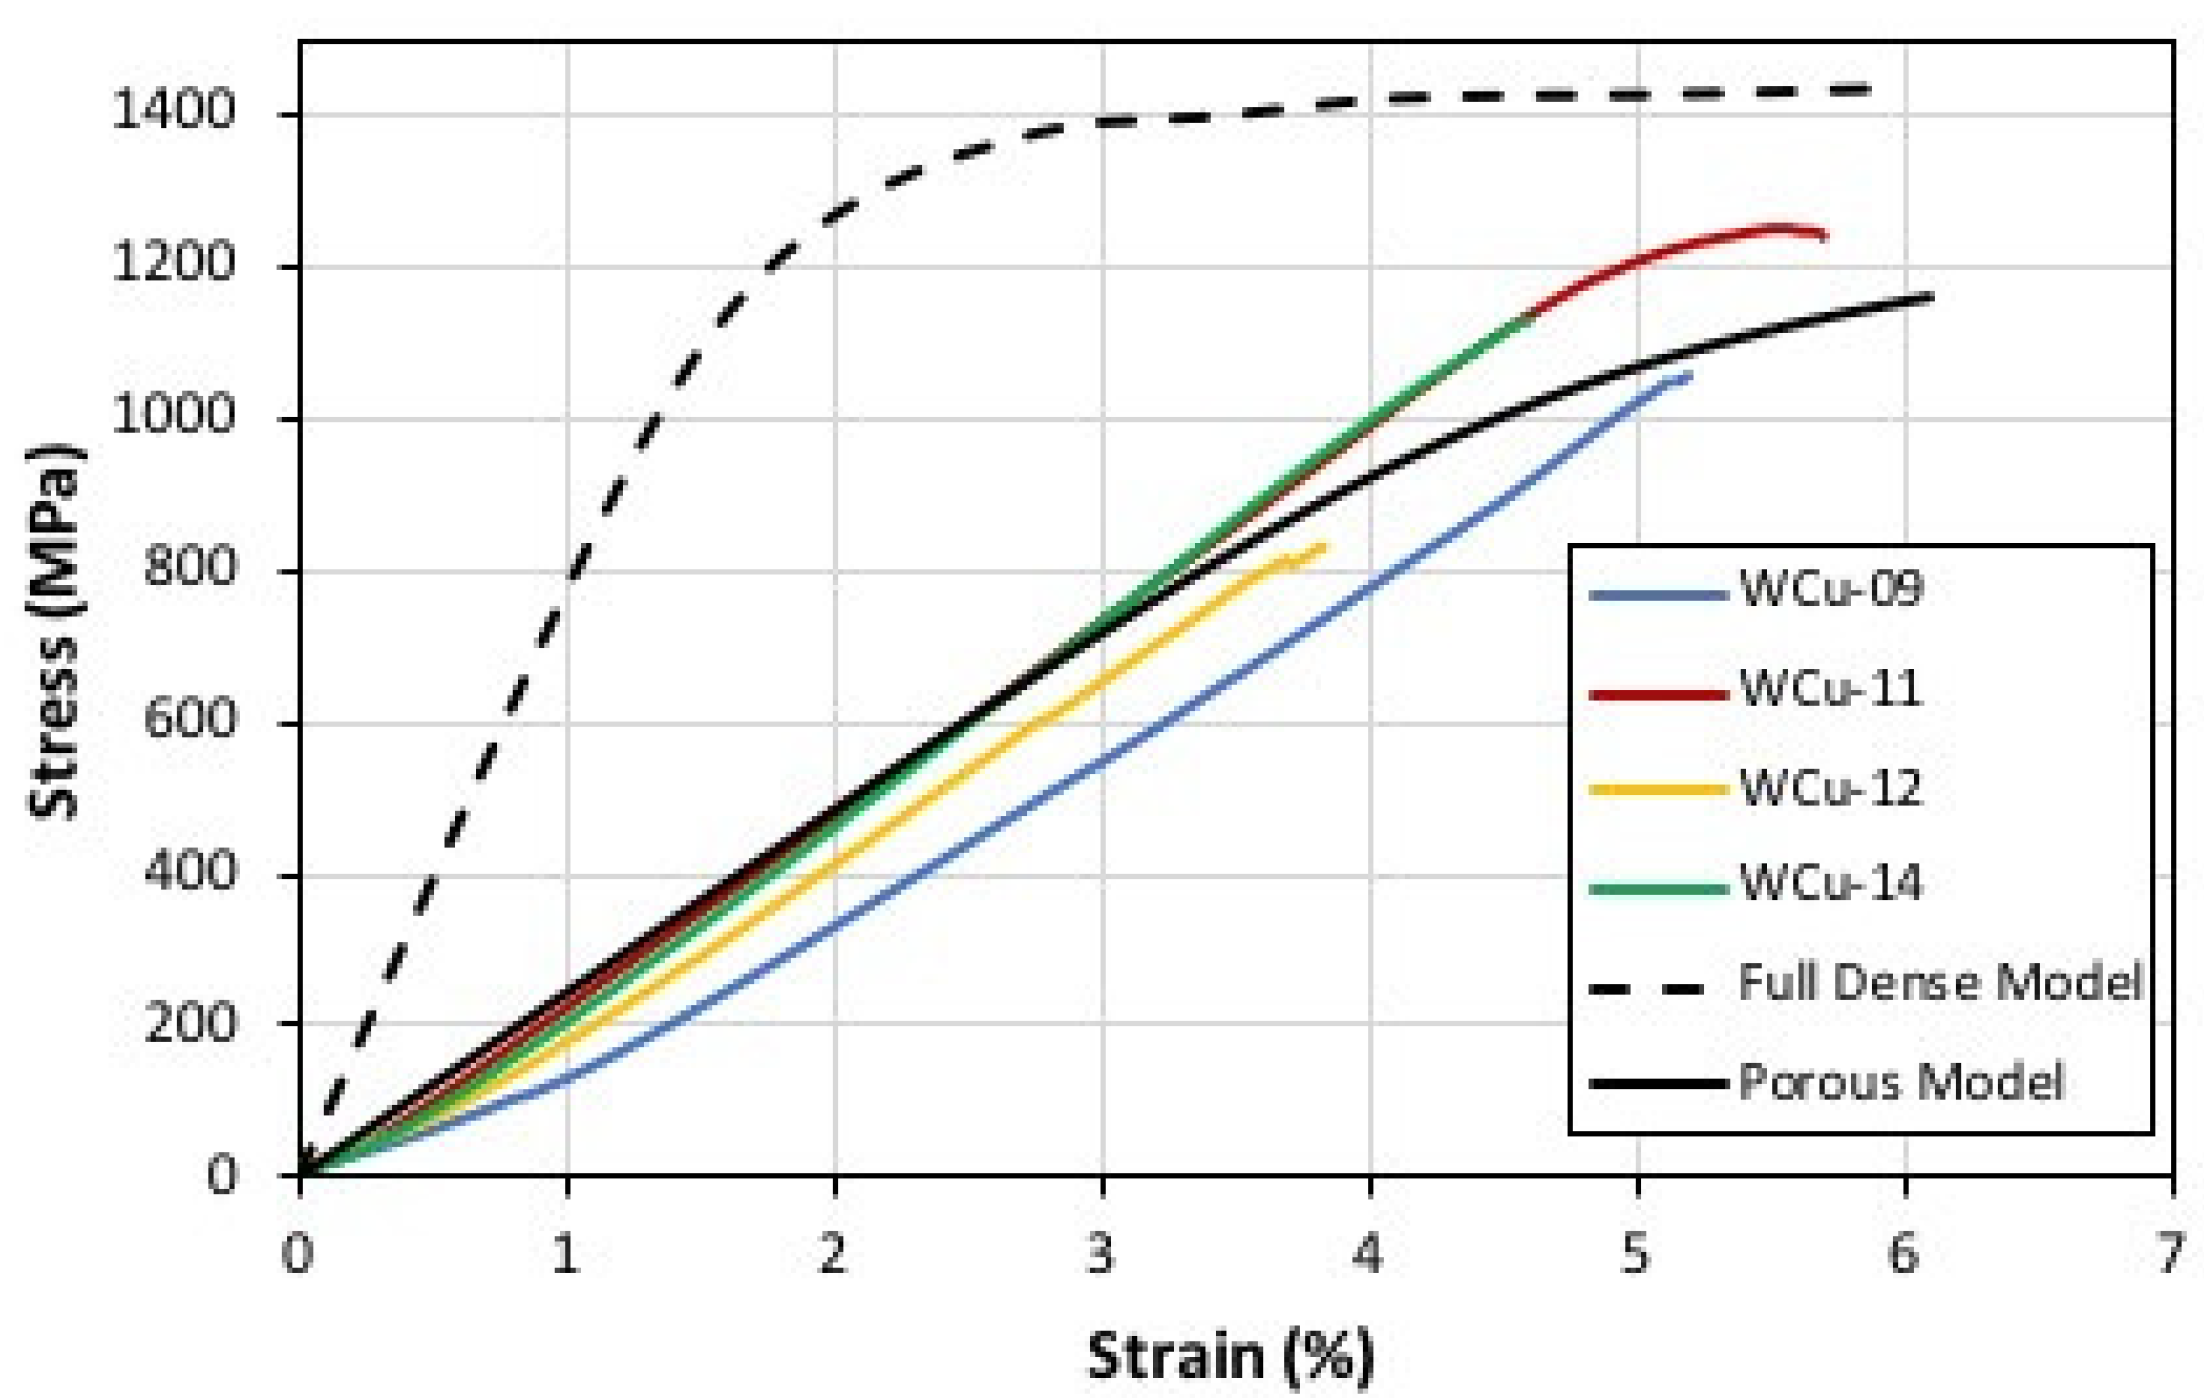
The results of the quasi-static compression tests for the nanocrystalline W-Cu samples are displayed in Figure 4. The results from data acquisition and DIC clearly indicate a brittle behaviour with the strains at fracture reaching values ranging between 4% and 6%. It is noticeable that fracture practically occurs just after the yield point is exceeded. Moreover, the yield stress is approaching 1100 MPa, which is close to twice the value of the coarse-grained cW-Cu samples. The results have shown that nanocrystalline alloys with grain sizes between 20 nm and 100 nm demonstrate a low hardening rate or almost no hardening due to the low number of generated grain boundary dislocations and their annihilation by opposite grain boundaries. This, in turn, generates low ductility and leads to shear localisation at grain boundaries and, as expected, it results to an appreciable increase of the yield strength stress required to continue plastically deforming the material [20,21].
4. Numerical Model
To simulate the behaviour of the nanocrystalline materials under compression loading, an FE-based model was developed. The proposed numerical methodology is based on the use of RVEs of the nanocrystalline materials. As the RVEs lie in the micro-scale, the microstructure of the materials can be modelled.
4.1. Porosity Classification
The analysis of CT and XRD data and results from the literature [22,23] enable us to capture information about the content, size and location of the pores. The evaluated volume contents of the pores were of 10.7% and 9% for the cW-Cu and W-Cu, respectively. According to porosity measurements, as shown in Table 1, by increasing the porosity content, the number of small pores increased and the pores seemed to have a spherical shape.
In the RVEs, it was assumed that the pores had a spherical shape and they were randomly distributed and not agglomerated at the grain boundaries’ phase.
The total volume of pores is derived from
where N is the number of pores and Vi is the individual pore volume. The volume of the RVE is calculated by
where VFpores is the volume fraction of pores. Then, the mean radius of pores was calculated by
where ri is the radius of each pore. Since the pores are considered spherical, the volume of the pores in the equivalent set of the porous model is calculated by:
This procedure was applied at each porosity level.
4.2. The RVE
The basic characteristics and the numerical methodology used in the present work are described detail in Reference [24]. In Reference [24], the numerical model was applied for the simulation of the behaviour of a full dense nanocrystalline material without taking into account the presence of any defect. In the present publication, the numerical methodology was extended so as to account for the presence of pores.
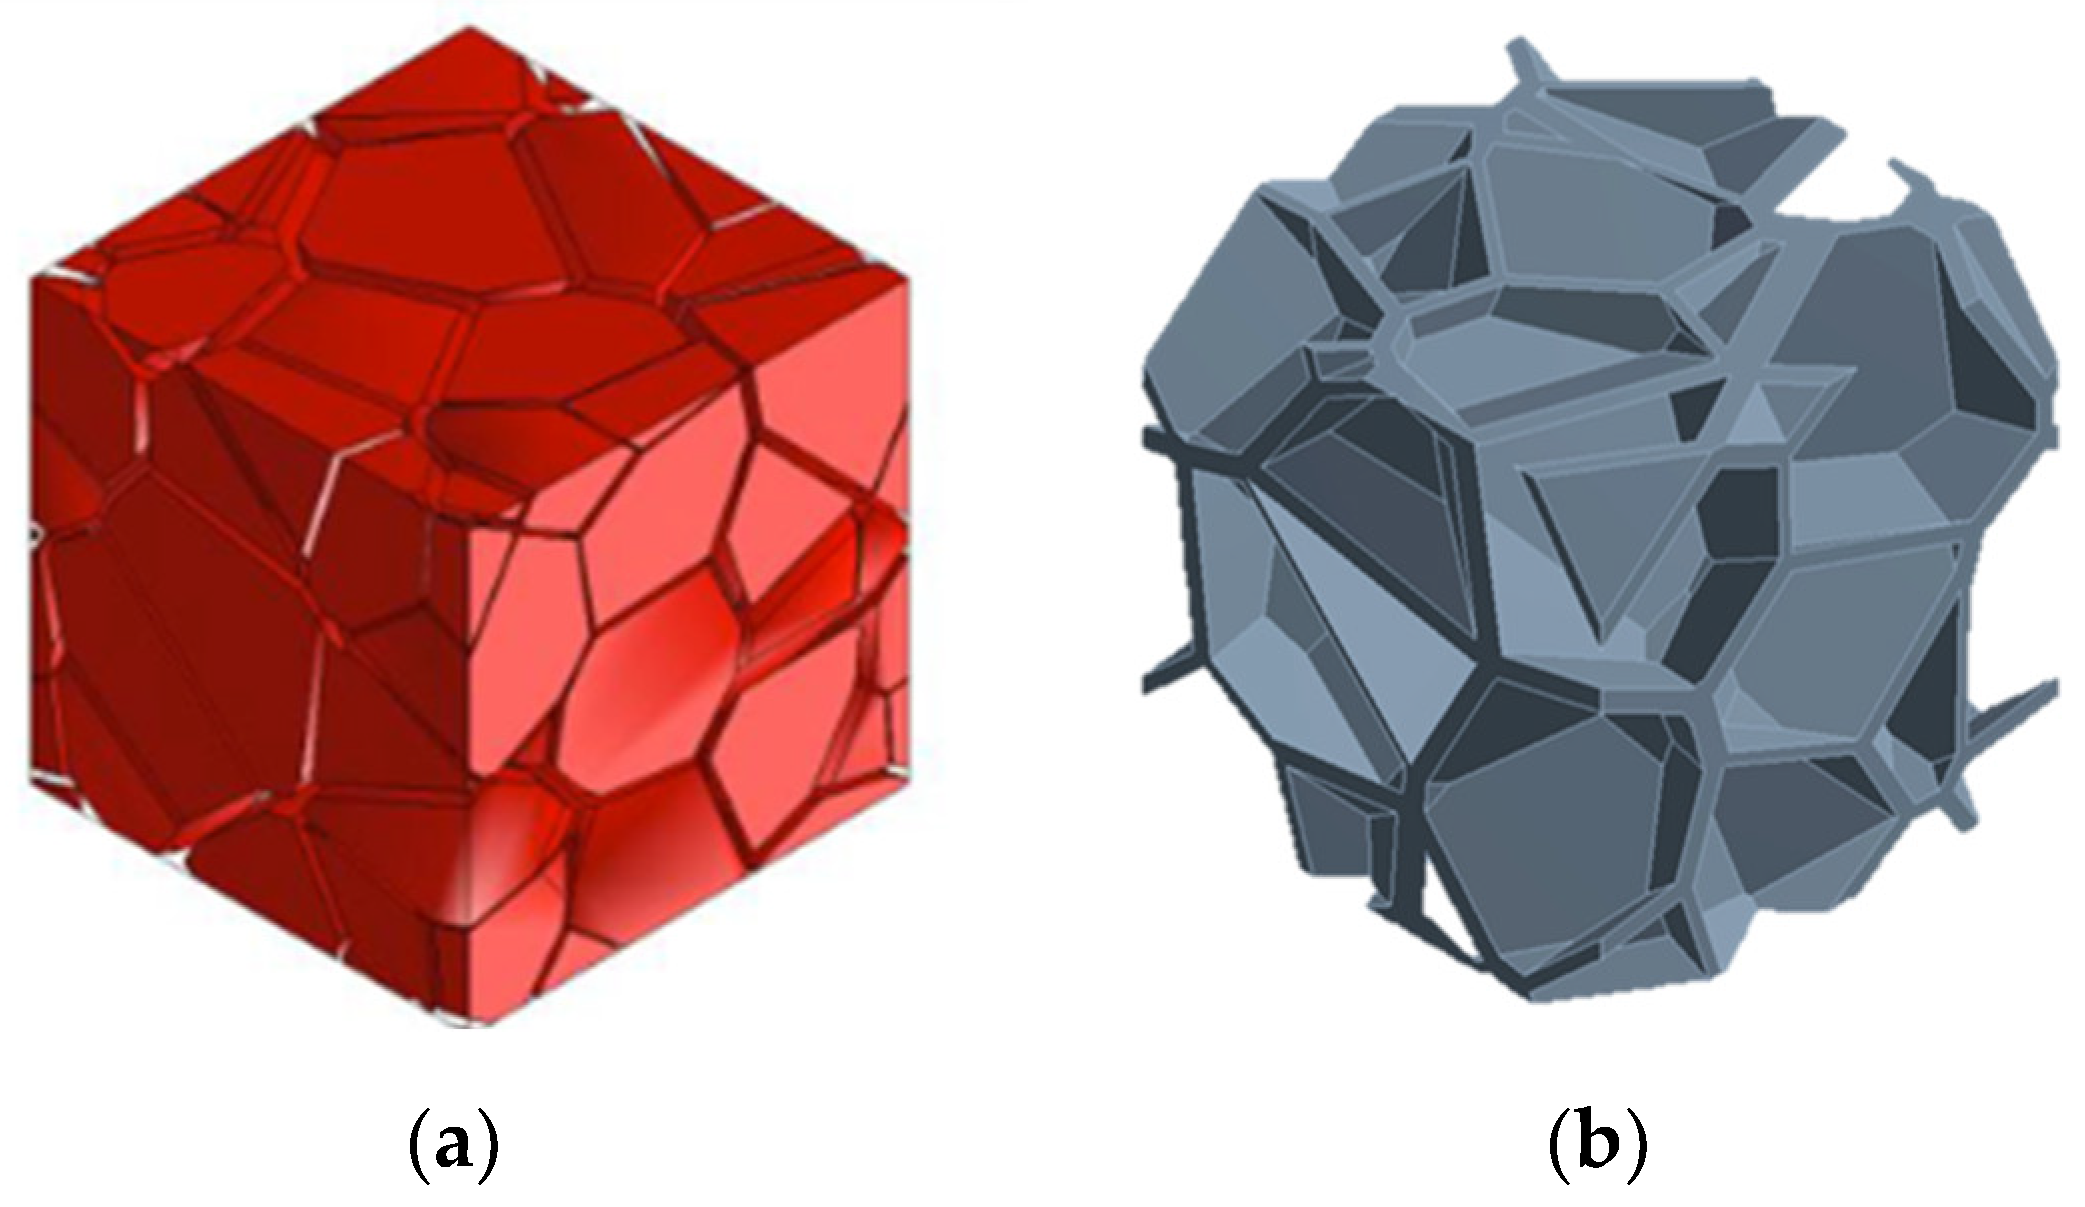
For more realistic modelling of the nanocrystalline material into the RVE, the geometry of the microstructure was developed using the commonly-known Voronoi algorithm, which is a semi-analytical methodology of plane partition to multiple definite regions using the distance between points in an explicit plane subset. For each point, there is a related area made of all points closer to that seed than to any other. These areas are named Voronoi cells. In each RVE, a comprehensive 3D modelling of the grain interiors (GI) and grain boundaries (GB) phases as randomly-distributed sub-volumes has been developed (Figure 5). The volume fraction of grain interiors and grain boundaries phases play a significant role in the simulated mechanical response of the RVE, thus, these volume fractions are parametrically defined in the FE model.
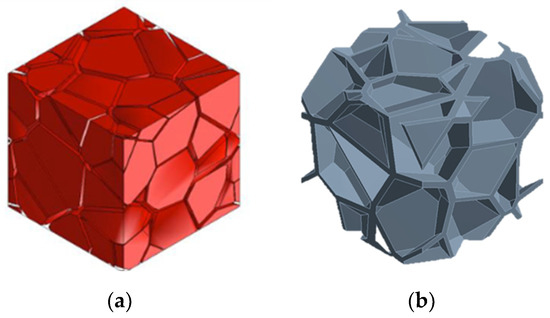
Figure 5.
Voronoi Unit Cell. (a) grains and (b) grain boundaries.
The thickness (t) of GBs is equal to nanocrystalline materials and coarse-grained metals [25] and it was kept at t = 1 nm in the numerical analyses. It should be noted that early studies using XRD analysis on nanocrystalline materials measured the volume fraction of grain interiors to 80–90% [26]. For the simulations, the VF of the grain interior phase was defined using the Equation (5).
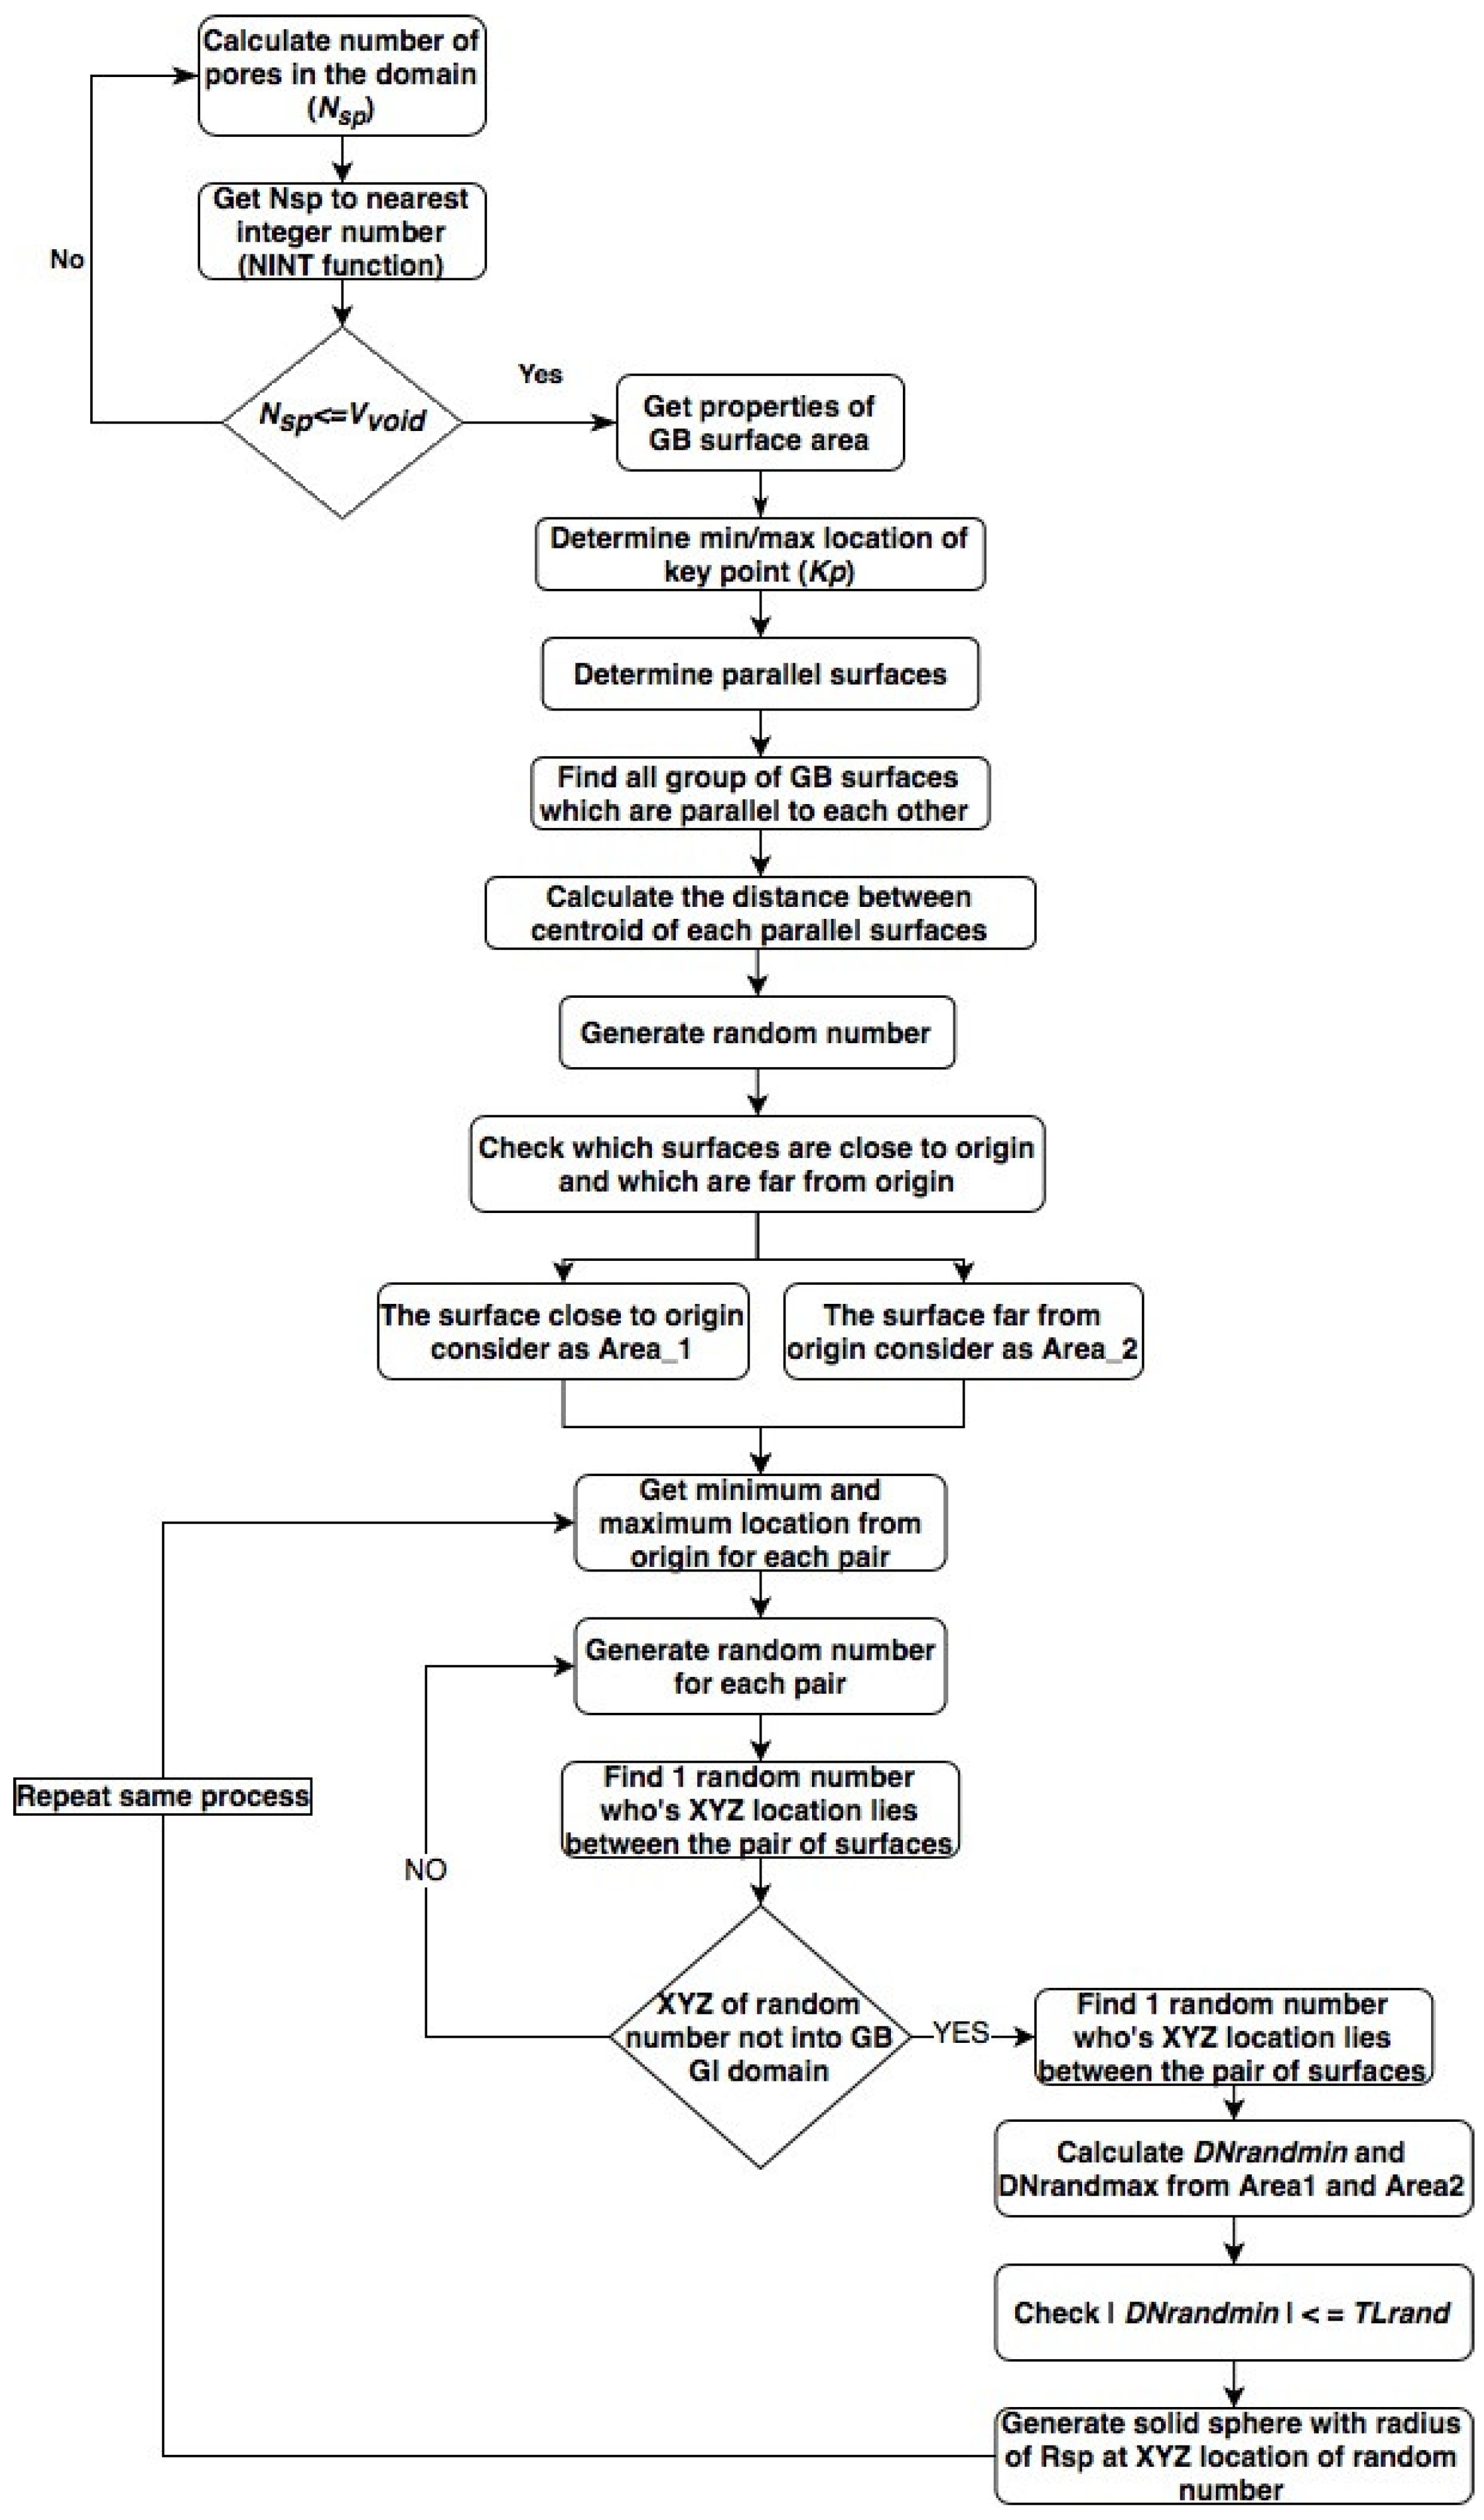
An overview of the algorithm used to define the topology of pores is presented below (Figure 6).
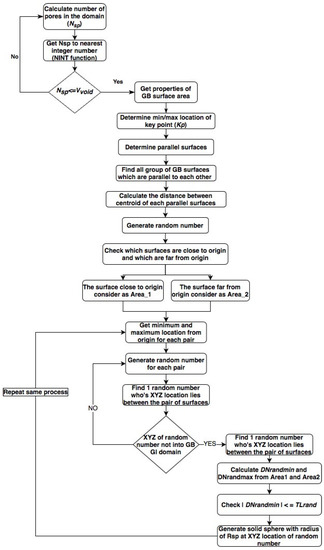
Figure 6.
Flowchart of numerical methodology for the random generation of pores.
- 1.
- Calculate number of pores in the domain bywhere Vtotal is the total volume (volume of all grains + grain boundary), poros is the porosity percentage, Vvoid is the total porous empty volume, Rsp is the radius of the spherical porous hole and Nsp is the number of porous holes in the domain
- 2.
- Get Nsp as the nearest whole integer number (NINT function in ANSYS APDL) (ANSYS Inc., Canonsburg, PA, USA) [27] and then recheck that total volume of all porous is not greater than Vvoid.
- 3.
- Get the properties of the surface area of GB
- Calculate the area of each surface of GB
- Calculate normal of each area
- Determine min/max location of key point (Kp) from the origin and its associated Kp number for each area (GB surface)
- 4.
- Determine parallel Surface
- d.
- Check whether GB surface lies on the boundary of a cube or not from its max/min centroid location
- e.
- Find all groups of GB surfaces (excluding boundary surfaces) who’s normal vectors are parallel to each other.
- f.
- Calculate the distance between the centroid of each parallel surface and find the pair of surfaces which has minimum centroid distance.
- 5.
- Generate a random number
- g.
- For each pair, calculate distance from the origin of global coordinate (0,0,0) to the centroid of both the surfaces. In order to check which surface is close to the origin and which surfaces are far from the origin. The surface close to the origin is considered as Area 1 and the surface far from the origin is considered as Area 2.
- h.
- From the previously calculated min/max kp location, get the minimum and maximum location from the origin for each pair. This will define a small cubical space covered by a pair of surfaces in the GB and GI domain. Size of that cubical space will be xmin-xmax, ymin-ymax and zmin-zmax.
- i.
- Generate 500 (randsize) random numbers within the range of that cubical space for each pair.
- j.
- Find a minimum of one random number who’s XYZ location lies in between the pair of surfaces (Area 1 and Area 2)
- First, check that XYZ location of random number does not lie on the boundary of GB and GI domain
- Calculate the normal distance (DNrandmin) of the random number from Area 1 and similarly the normal distance (DNrandmax) from Area 2
- Recalculate the distance (Dcentmin) between the centroid of Area 1 and Area 2
- Check the XYZ location of the random number is greater than the location of Kp (xcent1, ycent1, zcent1) of Area 1 that is close to the origin (0,0,0) and the XYZ location is less than Kp (xcent2, ycent2, zcent2) of Area 1 that is far from the origin. By doing so, it is decided whether the random number lies inside the cubical space of area pair, not on the boundary of area pair.
- Considering GB as imported solid bodies, it is assumed that normal of all surfaces will be in an outward direction. Hence, the normal direction of both the surfaces of each pair will be in opposition to each other’s direction. Now check the location of the random number with respect to the normal direction of Area 1 and Area 2. If the normal vector from Area 1 to the XYZ location of the random number has the same direction as the normal vector of Area 1, then the previously calculated normal distance DNrandmin will be positive, otherwise, it will be negative. Therefore, check that normal distance DNrandmin of the random number is greater than 0 and DNrandmax is less than 0.
- Further, check that sum of the absolute value of the normal distance of a random number from Area 1 and Area 2 is not greater than the centroidal distance (Dcentmin). This confirms if the random number perfectly comes in between the pair of areas (Area 1 and Area 2)
- In order to make sure that random number does not lie very close to Area 1 or Area 2, check that the absolute value of DNrandmin is greater than tolerance TLdrand. Tolerance is nothing but 5% of Dcentmin. This is the optional condition.
- k.
- Repeat the same process. The total number of random numbers (Nsp) is found.
After the aforementioned numerical workflow, generation of solid spheres with a radius of Rsp, at XYZ location of all random numbers found, can be utilised and performing subtraction of Boolean operation to create the pores in the domain.
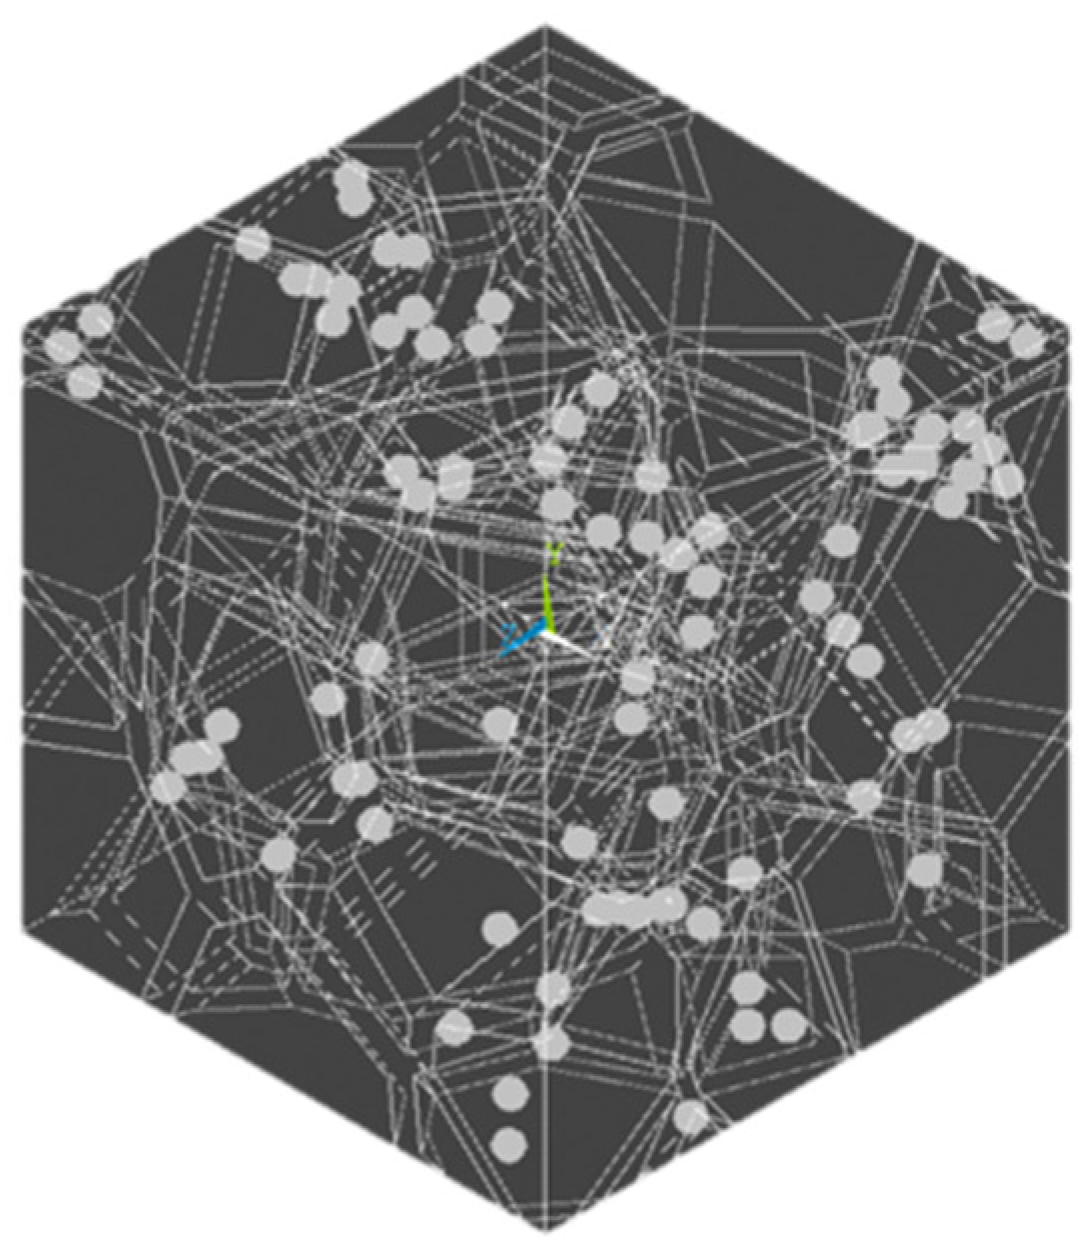
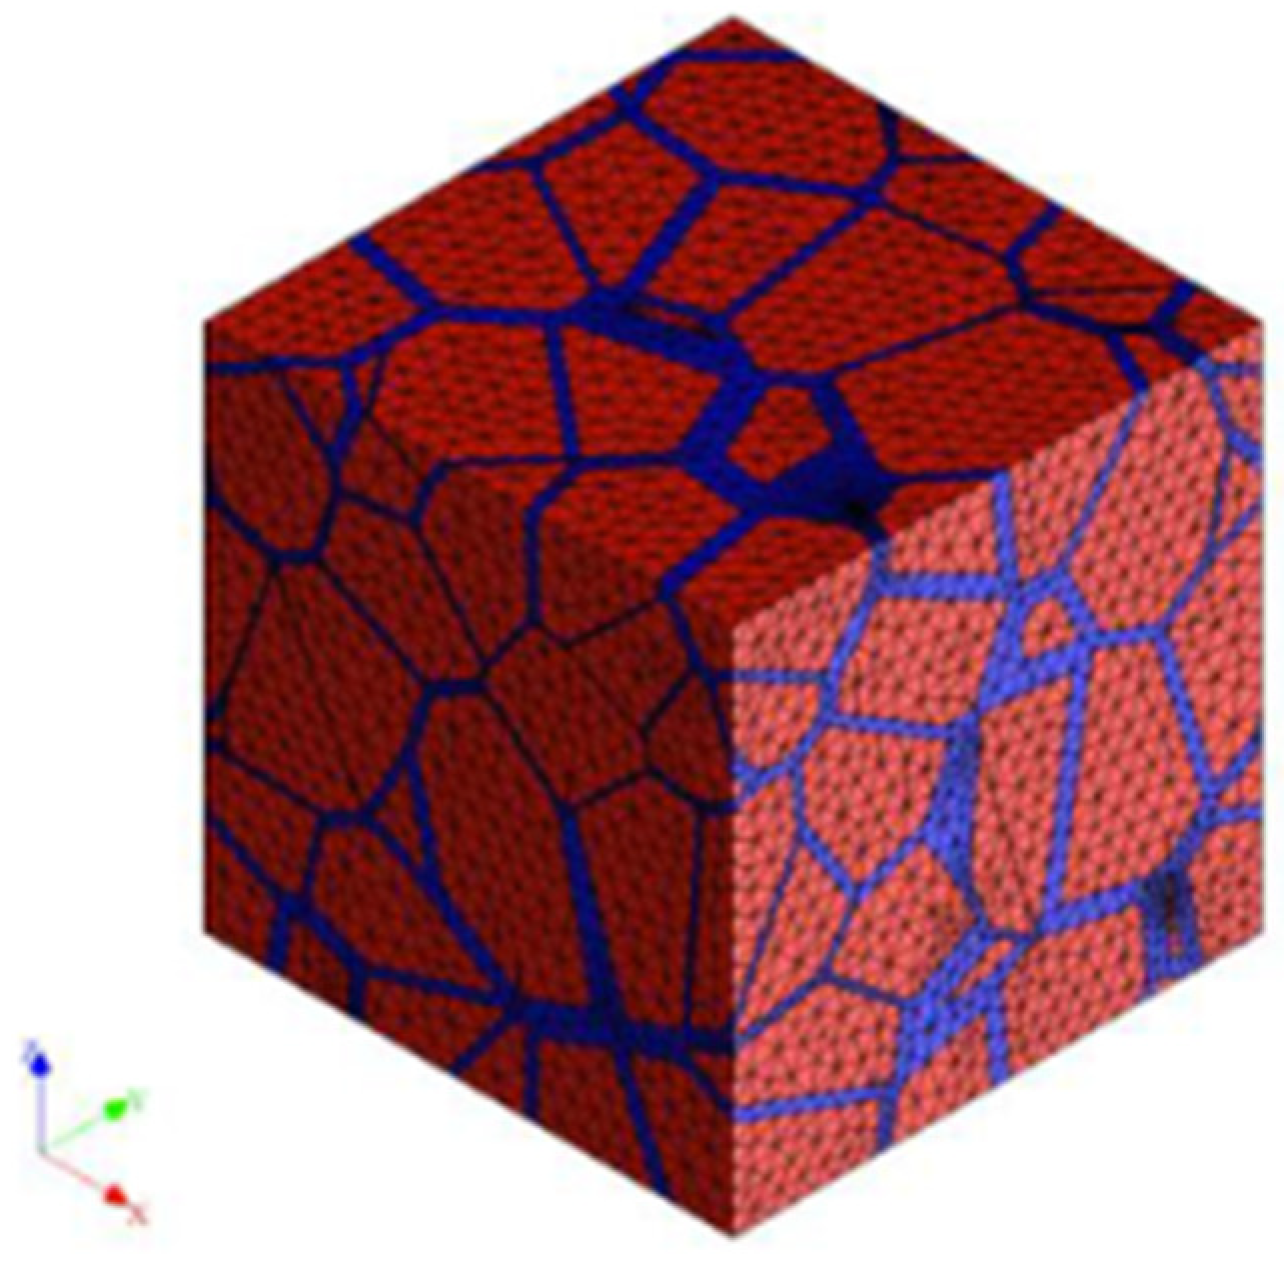
The RVE has a cubic shape. Inside the cube, spherical pores with a diameter of 10 nm were created. The volume fraction of 10.7% was cW-Cu and 9% for W-Cu. The position of pores was random in the grain boundaries’ phase and no overlap between them was allowed. The RVE was meshed with 680.000 elements of ANSYS SOLID 187 element type (ANSYS Inc., Canonsburg, PA, USA) [27] using SMRTSIZE and LESIZE functions so as to guarantee a sufficient mesh size at the grain boundaries. This was a higher-order 3D 10-node element, well suited to model irregular meshes. Such three-dimensional elements provide non-linear elastoplastic, anisotropic features utilizing also large deformations. Each material was defined using the ANSYS multilinear kinematic hardening material model which is suitable for simulating metal plasticity behaviour [27]. The model is fully parametric so as to be easily adapted for each porosity scenario and different compositions of alloying elements. An extensive mesh convergence study, as well as an RVE size effect investigations, was made on the base of the approach proposed in Reference [28,29]. A typical geometry of the porous RVE is shown in Figure 7, while a typical FE mesh is presented in Figure 8.
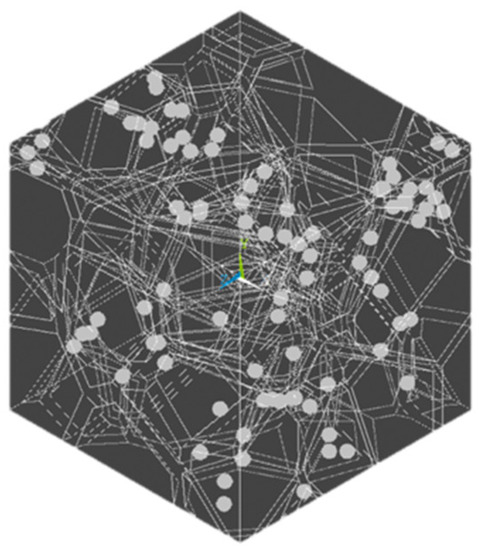
Figure 7.
Porous RVE.
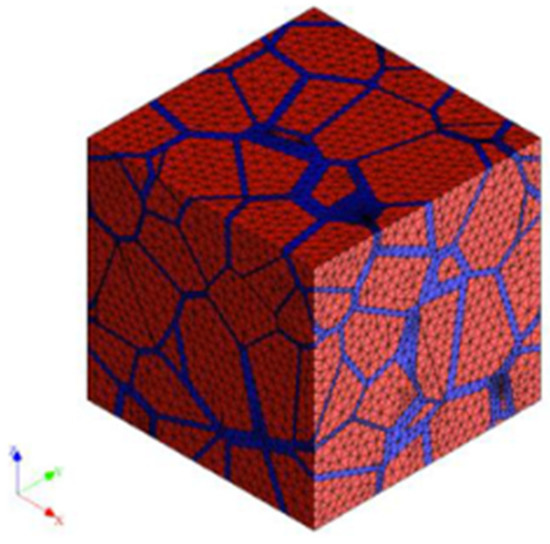
Figure 8.
Meshed RVE.
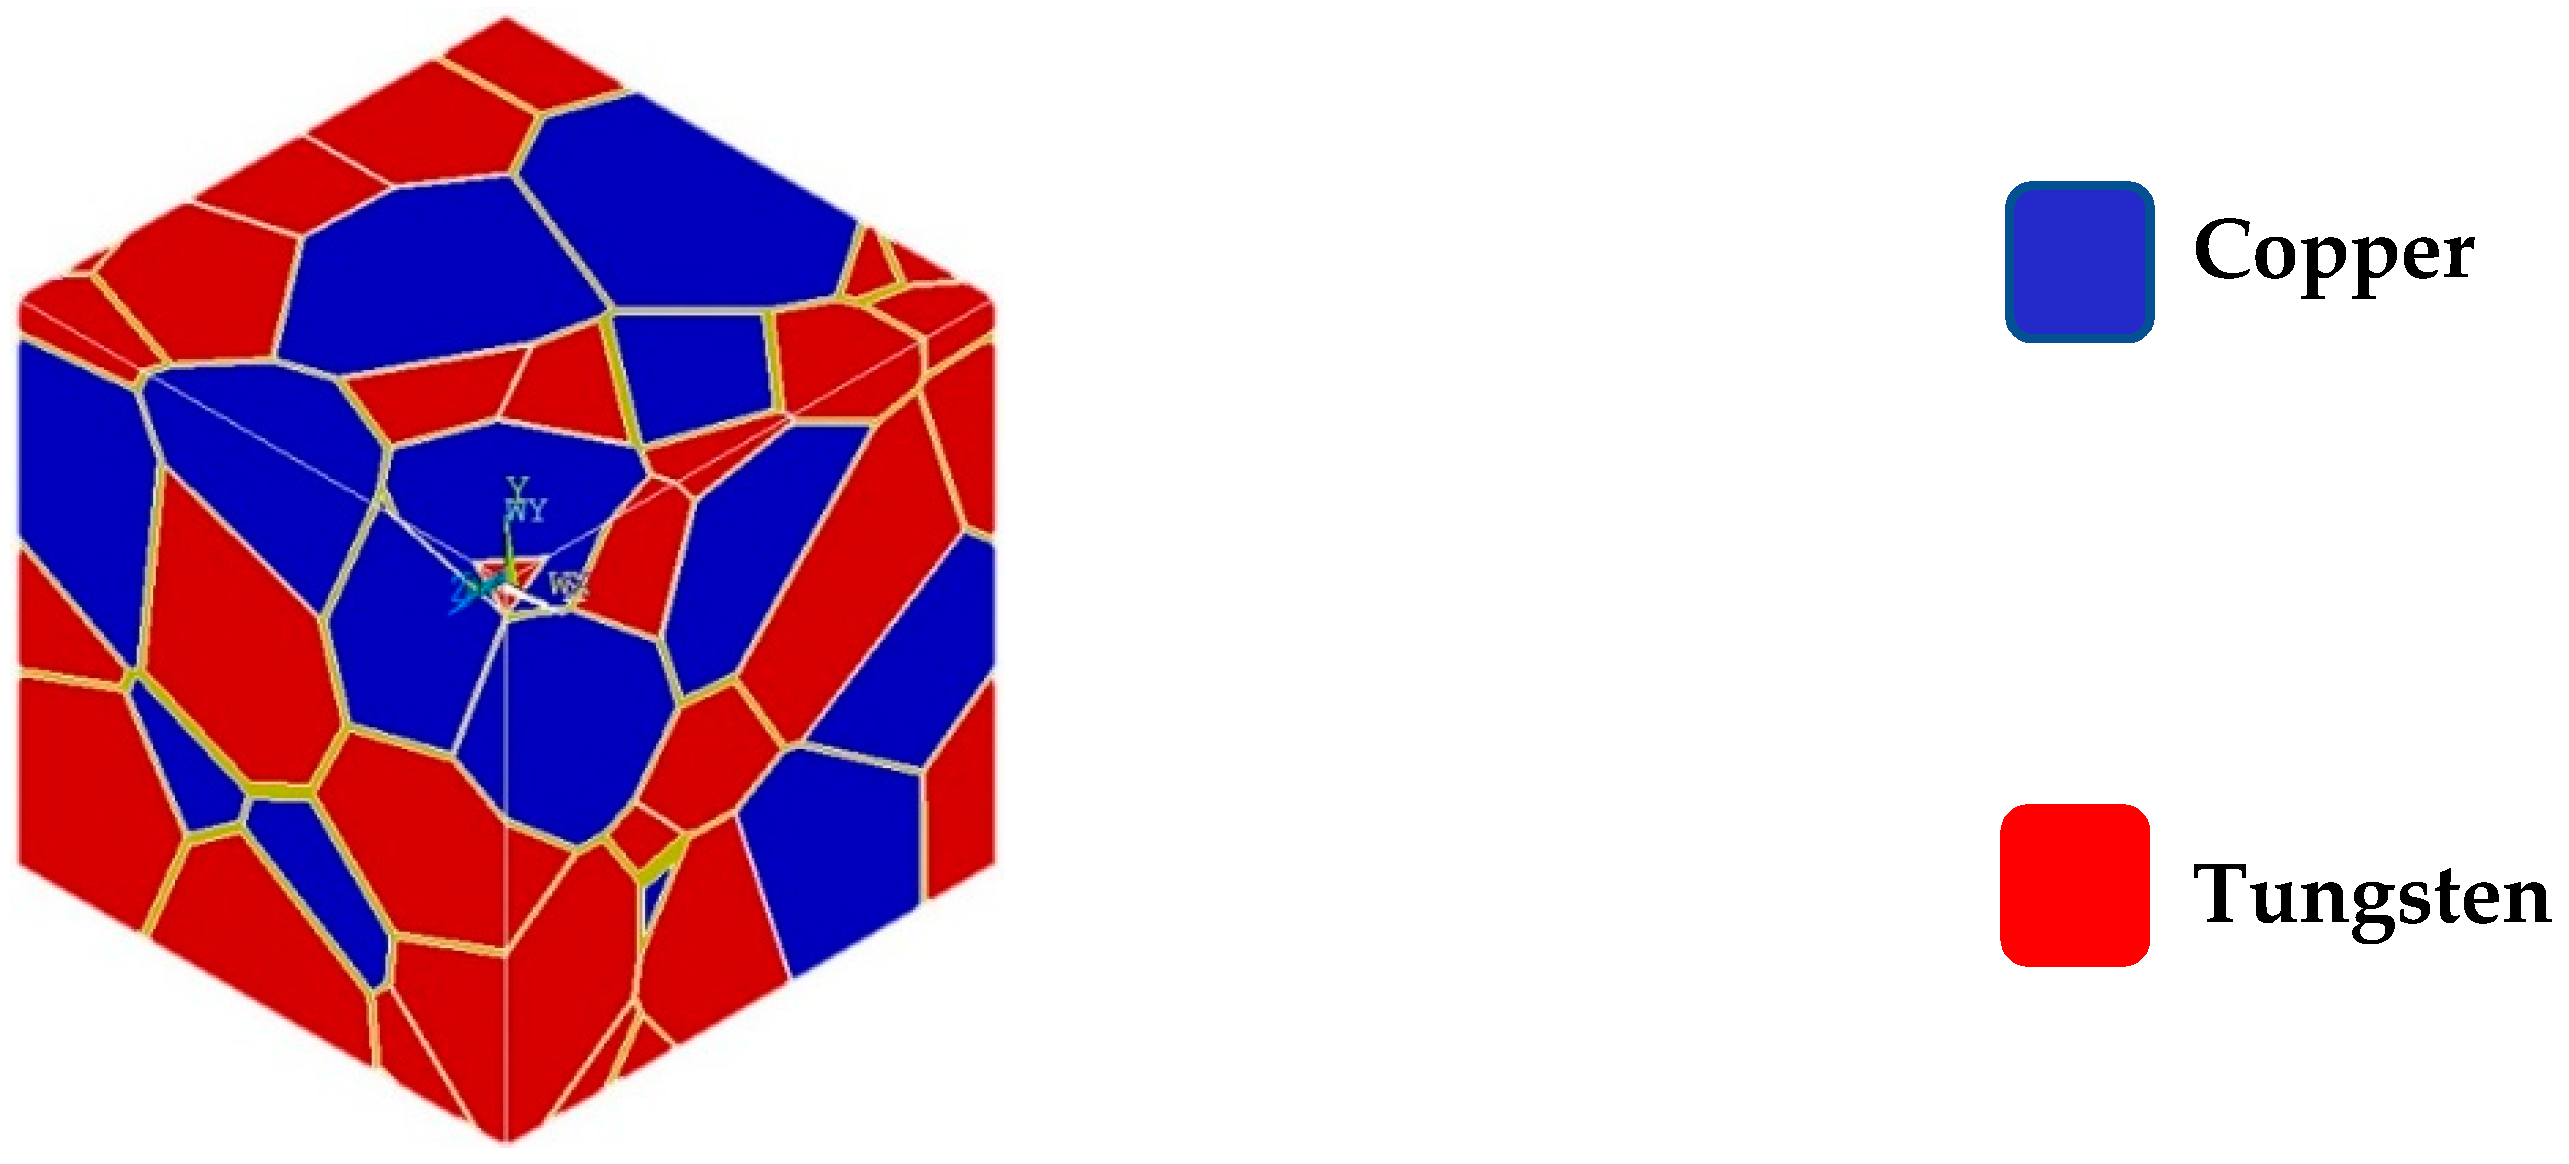
The material properties used in the models of nanocrystalline tungsten-copper system were taken from multilinear stress-strain curves found in the literature [30,31,32,33]. The material properties used in the simulations are presented in Table 4 and they have been assigned to the grain interiors with their nominal composition of 75 wt% tungsten and 25 wt% copper by applying a random distribution. The distribution of tungsten (red-marked) and copper (blue-marked) is shown in Figure 9.

Table 4.
Material properties used in the simulations, data from [30,31,32,33].
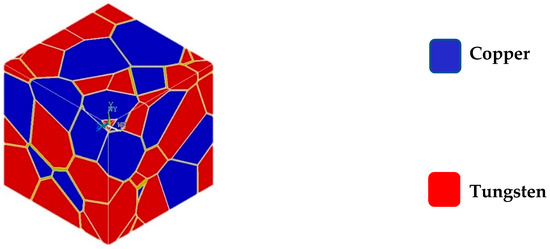
Figure 9.
Random distribution of Tungsten and Copper grains.
The Young’s modulus of the grain boundaries’ phase, Egb, was 20% lower than the one of the grains, EGI. The hypothesis of the reduced value of the GB elastic constant was based on the results of ab initio calculations found in Reference [34] and experimental findings reported in Reference [35]. The yield stress of the GB phase was equal to 861 MPa because of the pile-up breakdown phenomenon. The reason behind this effect is based on the Hall–Petch effect.
As the diameter of the grain diminished, the number of dislocations accumulated contrary to a GB phase reduces since this number is a relationship between the applied stress and the distance to the source. On the contrary, an increasing stress value is needed to come up with an identical number of dislocations at the pile-up. At a critical grain size, we cannot utilise anymore the approach of a pile-up mechanism so as to determine the plastic flow. For even more decreased values of the GB yield stresses, plastic strain is accumulated at the GB phase and these stresses define the comprehensive yield stress of the nanocrystalline aggregate. In Reference [36] it is reported that the critical grain size in several metals at which the H–P phenomenon would collapse by considering that there is a critical value at which crystallite in a nanocrystalline specimen can no longer be adequate to hold more than one dislocation.
where G, b, dcr and v are the shear modulus, the Burger’s vector, the critical grain size and Poisson’s ratio respectively. Ιt was assumed that grain boundaries and grain interiors exhibit the elastic-plastic properties described by the following relationships:
where ε0 is the elastic strain at the yield point, E is Young’s modulus and h is the work-hardening coefficient. The plasticity of grain boundaries was approached based on the Hill criterion [37]. The equivalent stress can be described as:
where [M] is a matrix of yield stress variations with orientation and {L} describes the difference between tension and compression of yield strengths:
where and are tensile and compressive yield strengths in the direction j, j= x, y, z, xy, yz, xz.
In the numerical simulations, it was considered that the FE model was subjected to compressive forces. The force was applied at the surface-boundary of the RVE so as to calculate the macroscopic stress, σm. Additionally, the consequential displacement at the surface of the RVE has been conducted by its length in the vertical direction to acquire the macroscopic deformation, em. The elastic constant (Young’s modulus) and the yield strength of the nanocrystalline alloy can be numerically predicted. The periodic boundary conditions were applied so as to derive the homogenised behaviour of the RVE, employing the maximal plastic strain value as a boundary condition at each loading step. This led us to overpass the commonly known production issue of nanocrystalline materials at sufficient quantities in order to complete a considerable mechanical test campaign. Taking as granted the above-said proposed numerical procedure, a reduced number of specimens for the experimental tests is required for validation purposes.
5. Comparison of Numerical and Experimental Results
Using the numerical model, the homogenised mechanical response of the RVE is calculated for the case of a coarse-grained W-Cu material in Figure 10. In this figure, the computed curves using the full dense as well as the porous model are displayed and compared to the respective experimental curves. For the calculations, the tungsten grain size was taken to be 150 nm and the copper grain size 60 nm. The volume fractions of W and Cu were 74% and 26%, respectively. The proposed numerical model utilises the maximum strain criterion at 10.5% based on the experimental observations. For implementing the full dense model, the material was considered to be fully dense, i.e., the existence of pores is ignored. The full dense FE model predicts a Young’s modulus of 280 GPa, a yield stress of 420 MPa and an ultimate compressive strength of 530 MPa. As it can be seen, the cW-Cu samples show a Young’s modulus of about 200 GPa, a yield stress ranging between 300 and 350 MPa and an ultimate compressive strength ranging between 400 and 450 MPa. It is evident that, when involving the full dense model and ignoring the presence of voids, the deviations from the experimental results are appreciable. Yet, as experimentally observed and discussed above, the produced cW-Cu material exhibits an extensive volume fraction of pores, reaching approximately 10.7%. By involving the developed algorithm and accounting for the mentioned volume fraction of the pores, the same RVE model was simulated and its behaviour was computed. By implementing the FE Porous model, the Young’s modulus results to 210 GPa, the yield stress to 340 MPa and the ultimate compressive strength to 430 MPa. These values, as well as the entire numerical mechanical response, fit well to experimental results.
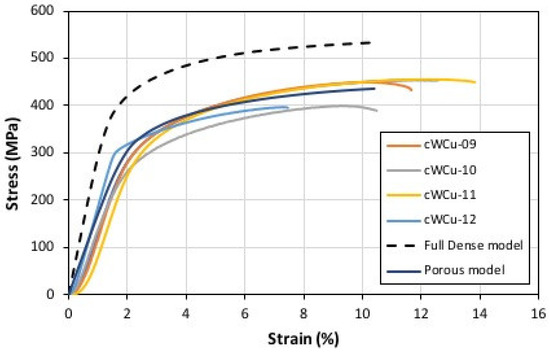
Figure 10.
Comparison of the experimental results of cW-Cu specimens with the full dense and porous numerical results.
For the case of nanocrystalline W-Cu, the numerical model has been utilised for a tungsten grain size of 110 nm, a copper grain size of 35 nm and volume fractions of W and Cu of 73.7% and 26.3%, respectively. For implementing the maximum strain failure criterion, the critical strain is defined to 6% in accordance with the performed mechanical tests. The computed results by implementing the full dense as well as the porous FE model are shown in Figure 11. As it can be seen, the full dense numerical model predicts a Young’s modulus of 760 GPa and an ultimate compressive strength of 1400 MPa. By accounting for 9% porosity, as measured by the performed experiments, the porous model predicts a Young’s modulus of 230 GPa and an ultimate compressive strength of 1150 MPa. The experimental results for the W-Cu samples show a Young’s modulus of 220 GPa and an ultimate compressive strength ranging between 1100 and 1200 MPa. It is noticeable that the values of UCS and elongation are significantly different. The observed brittleness is largely attributed to the weakening effect of the interstitial impurities and pores along the grain boundaries [15]. Therefore, the ductile-to-brittle transition of tungsten is dependent on the purity level of the material, the volume fraction of grain boundaries, etc. [11]. Tungsten of coarse-grained purity usually exhibits ductile-to-brittle transition above 150 °C [38]. This explains the ceramic-like behaviour of such W at room temperature. In the current methodology, the ductile-to-brittle transition was considered through the implementation of the Wadsworth and Nieh mathematical expression [36] in terms of grain boundary strengthening by reducing the grain size so as to prohibit the global deformation of RVE. The results make it evident that the mechanical behaviour, as well as the property values calculated by use of the Porous FE Model, lie close to the observed experimental behaviour which is not the case when involving the Full Dense Model.
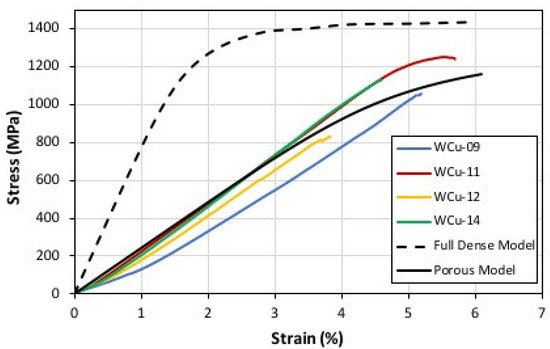
Figure 11.
Comparison of the experimental results of W-Cu specimens with the full dense and porous numerical results.
6. Conclusions
In the present study, a numerical methodology was developed for simulating the behaviour of porous nanocrystalline materials. The model parameters (grains’ and pores’ sizes, volume fractions of grains and pores) were calibrated and validated against experimental measurements. The methodology was applied to simulate the behaviour under compression tests of nanocrystalline materials containing extensive porosity. The final numerical results were validated using two series of compression tests conducted on two types of W-Cu alloys, namely a coarse-grained and a nanocrystalline alloy, respectively. The numerical results, in terms of compression stress–strain curves and mechanical properties (Young’s modulus and yield stress), correlate well with the experimental results. Both the model and tests reveal that the pores degrade the behaviour of the nanocrystalline materials. The proposed methodology represents a robust step towards the development of a numerical model for the investigation of the behaviour of multiphase nano-crystalline materials by varying the volume fraction of alloying elements, the volume fraction of randomly distributed pores and their size and may serve as the basis for the development of macro models to be applied in the quality control of mass production systems of the aforementioned promising materials in the near future.
Author Contributions
S.P. and K.T. planned the project, the main conceptual ideas and proof outline, while P.B. worked out the technical details, and performed the numerical analysis for the suggested material. All authors have read and agreed to the published version of the manuscript.
Funding
This research was funded by ICARUS, grant agreement No. 713514. A European Union’s Horizon 2020 research and innovation programme.
Conflicts of Interest
The authors declare no conflict of interest.
References
- Gleiter, H. Nanocrystalline materials. Prog. Mater. Sci. 1989, 33, 223–315. [Google Scholar] [CrossRef]
- Gleiter, H. Nanostructured materials: Basic concepts and microstructure. Acta Mater. 2000, 48, 1–29. [Google Scholar] [CrossRef]
- Suryanarayana, C. Nanocrystalline materials. Int. Mater. Rev. 1995, 40, 41–64. [Google Scholar] [CrossRef]
- Hibbard, G.; Erb, U.; Aust, K.; Klement, U.; Palumbo, G. Thermal Stability of Nanostructured Electrodeposits. J. Metastable Nanocryst. Mater. 2002, 13, 387–396. [Google Scholar]
- Groza, J. Nanostructured Materials. Mater. Today 2002, 5, 55. [Google Scholar]
- Lowe, T.; Valiev, R. Producing nanoscale microstructures through severe plastic deformation. JOM 2000, 52, 27–28. [Google Scholar] [CrossRef]
- Valiev, R.; Islamgaliev, R.; Alexandrov, I. Bulk nanostructured materials from severe plastic deformation. Progress Mater. Sci. 2000, 45, 103–189. [Google Scholar] [CrossRef]
- El-Atwani, O.; Hinks, J.; Greaves, G.; Allain, J.; Maloy, S. Grain size threshold for enhanced irradiation resistance in nanocrystalline and ultrafine tungsten. Mater. Res. Lett. 2017, 5, 343–349. [Google Scholar] [CrossRef]
- El-Atwani, O.; Esquivel, E.; Aydogan, E.; Martinez, E.; Baldwin, J.; Li, M.; Uberuaga, B.; Maloy, S. Unprecedented irradiation resistance of nanocrystalline tungsten with equiaxed nanocrystalline grains to dislocation loop accumulation. Acta Mater. 2019, 165, 118–128. [Google Scholar] [CrossRef]
- Lennon, A.; Ramesh, K. The thermoviscoplastic response of polycrystalline tungsten in compression. Mater. Sci. Eng. A 2000, 276, 9–21. [Google Scholar] [CrossRef]
- Dümmer, T.; Lasalvia, J.; Ravichandran, G.; Meyers, M. Effect of strain rate on plastic flow and failure in polycrystalline tungsten. Acta Mater. 1998, 46, 6267–6290. [Google Scholar] [CrossRef]
- Lassner, E.; Schubert, W. Tungsten: Properties, Chemistry, Technology of the Element, Alloys, and Chemical Compounds, 1st ed.; Kluwer Academic/Plenum Publishers: New York, NY, USA, 1999. [Google Scholar]
- Gumbsch, P. Controlling Factors for the Brittle-to-Ductile Transition in Tungsten Single Crystals. Science 1998, 282, 1293–1295. [Google Scholar] [CrossRef] [PubMed]
- Wei, Q.; Jiao, T.; Ramesh, K.; Ma, E.; Kecskes, L.; Magness, L.; Dowding, R.; Kazykhanov, V.; Valiev, R. Mechanical behavior and dynamic failure of high-strength ultrafine grained tungsten under uniaxial compression. Acta Mater. 2006, 54, 77–87. [Google Scholar] [CrossRef]
- Raghu, T.; Sundaresan, R.; Ramakrishnan, P.; Rama Mohan, T. Synthesis of nanocrystalline copper–tungsten alloys by mechanical alloying. Mater. Sci. Eng. A 2001, 304–306, 438–441. [Google Scholar] [CrossRef]
- Raghu, T.; Sundaresan, R.; Ramakrishnan, P.; Mohan, T. Synthesis of nanocrystalline copper–tungsten alloys by mechanical alloying. In Proceedings of the International Symposium on Metastable, Mechanically Alloyed and Nanostructured Materials (ISMANAM), Rome, Italy, 20–24 May 1996. [Google Scholar]
- Bachurin, D. Influence of voids distribution on the deformation behavior of nanocrystalline palladium. Solid State Commun. 2018, 275, 43–47. [Google Scholar] [CrossRef]
- Tserpes, K.; Stamopoulos, A.; Pantelakis, S. A numerical methodology for simulating the mechanical behavior of CFRP laminates containing pores using X-ray computed tomography data. Compos. Part B Eng. 2016, 102, 122–133. [Google Scholar] [CrossRef]
- Shen, T.; Dai, Y.; Lee, Y. Microstructure and tensile properties of tungsten at elevated temperatures. J. Nucl. Mater. 2016, 468, 348–354. [Google Scholar] [CrossRef]
- Meyers, M.; Mishra, A.; Benson, D. Mechanical properties of nanocrystalline materials. Prog. Mater. Sci. 2006, 51, 427–556. [Google Scholar] [CrossRef]
- Ma, E.; Zhu, T. Towards strength–ductility synergy through the design of heterogeneous nanostructures in metals. Mater. Today 2017, 20, 323–331. [Google Scholar] [CrossRef]
- Sanders, P.; Eastman, J.; Weertman, J. Pore distributions in nanocrystalline metals from small-angle neutron scattering. Acta Mater. 1998, 46, 4195–4202. [Google Scholar] [CrossRef]
- Agnew, S.; Elliott, B.; Youngdahl, C.; Hemker, K.; Weertman, J. Microstructure and mechanical behavior of nanocrystalline metals. Mater. Sci. Eng. A 2000, 285, 391–396. [Google Scholar] [CrossRef]
- Bazios, P.; Tserpes, K.; Pantelakis, S. Numerical Computation of Material Properties of Nanocrystalline Materials Utilizing Three-Dimensional Voronoi Models. Metals 2019, 9, 202. [Google Scholar] [CrossRef]
- Van Swygenhoven, H.; Farkas, D.; Caro, A. Grain-boundary structures in polycrystalline metals at the nanoscale. Phys. Rev. B 2000, 62, 831–838. [Google Scholar] [CrossRef]
- Birringer, R. Nanocrystalline materials. Mater. Sci. Eng. A 1989, 117, 33–43. [Google Scholar] [CrossRef]
- ANSYS, Inc. Release 11.0 Documentation for ANSYS; ANSYS Inc.: Canonsburg, PA, USA, 2006. [Google Scholar]
- Pierard, O.; LLorca, J.; Segurado, J.; Doghri, I. Micromechanics of particle-reinforced elasto-viscoplastic composites: Finite element simulations versus affine homogenization. Int. J. Plast. 2007, 23, 1041–1060. [Google Scholar] [CrossRef]
- Majewski, M.; Holobut, P.; Kursa, M.; Kowalczyk-Gajewska, K. Packing and size effects in elastic-plastic particulate composites: Micromechanical modelling and numerical verification. Int. J. Eng. Sci. 2020, 151, 103271. [Google Scholar] [CrossRef]
- Dobosz, R.; Lewandowska, M.; Kurzydlowski, K. The effect of grain size diversity on the flow stress of nanocrystalline metals by finite-element modelling. Scr. Mater. 2012, 67, 408–411. [Google Scholar] [CrossRef]
- Online Materials Information Resource—MatWeb. Available online: http://www.matweb.com/ (accessed on 23 October 2018).
- Callister, W.; Rethwisch, D. Materials Science and Engineering; John Wiley and Sons: Hoboken, NJ, USA, 2012. [Google Scholar]
- Cordero, Z.; Knight, B.; Schuh, C. Six decades of the Hall–Petch effect—A survey of grain-size strengthening studies on pure metals. Int. Mater. Rev. 2016, 61, 495–512. [Google Scholar] [CrossRef]
- Volpp, T.; Göring, E.; Kuschke, W.; Arzt, E. Grain size determination and limits to Hall-Petch behavior in nanocrystalline NiAl powders. Nanostruct. Mater. 1997, 8, 855–865. [Google Scholar] [CrossRef]
- Diehl, J. Verfestigungskurven und Oberflächenerscheinungen. Z. Met. 1956, 47, 331–343. [Google Scholar]
- Nieh, T.; Wadsworth, J. Hall-petch relation in nanocrystalline solids. Scr. Metall. Mater. 1991, 25, 955–958. [Google Scholar] [CrossRef]
- Hill, R. A theory of the yielding and plastic flow of anisotropic metals. Proc. R. Soc. London. Ser. A Math. Phys. Sci. 1948, 193, 281–297. [Google Scholar]
- Farrell, K.; Schaffhauser, A.; Stiegler, J. Recrystallization, grain growth and the ductile-brittle transition in tungsten sheet. J. Less Common Met. 1967, 13, 141–155. [Google Scholar] [CrossRef]
© 2020 by the authors. Licensee MDPI, Basel, Switzerland. This article is an open access article distributed under the terms and conditions of the Creative Commons Attribution (CC BY) license (http://creativecommons.org/licenses/by/4.0/).

